department of geological sciences faculty of …
TRANSCRIPT

I
CO-BLENDING OF SEISMIC ATTRIBUTES FOR
INTERPRETATION OF CHANNEL GEOMETRIES AND RESERVOIR
CHARACTERIZATION IN RENCE FIELD OF NIGER DELTA,
NIGERIA
BY
CHINWUKO, IFEANYI AUGUSTINE
(MSc. APPLIED GEOPHYSICS (NAU) & BSc. GEOLOGICAL SCIENCES (NAU))
REG. NO: 2011507001F
DEPARTMENT OF GEOLOGICAL SCIENCES
FACULTY OF PHYSICAL SCIENCES
NNAMDI AZIKIWE UNIVERSITY, AWKA
IN PARTIAL FULFILLMENT
OF THE REQUIREMENTS FOR THE AWARD OF
DOCTOR OF PHILOSOPHY (Ph.D) DEGREE
IN GEOLOGICAL SCIENCES (APPLIED GEOPHYSICS OPTION)
FEBRUARY, 2016

II
APPROVAL PAGE
Chinwuko Augustine Ifeanyi with Registration Number of 2011507001F has
successfully completed the external defence of this Ph.D dissertation. We hereby
approve the acceptance of this Ph.D dissertation to the relevant Board.
---------------------------- -----------------
Prof. A.G. Onwuemesi Date
Supervisor I
---------------------------- -----------------
Dr. E. K. Anakwuba Date
Supervisor II
--------------------------- ----------------
Dr. N. E. Ajaegwu Date
Head of Department
--------------------------- ------------------
Prof. E. U. Ofoedu Date
Faculty PG Sub-Dean
--------------------------- ------------------
Prof. A. O. C. Nwokoye Date
Dean, Faculty of Physical Sciences
--------------------------- ------------------
Prof. H. I. Odumegwu Date
Dean, School of Post Graduate Studies
--------------------------- ------------------
Prof. E. D. Uko Date
External Examiner

III
CERTIFICATION
This is to certify that Chinwuko Augustine Ifeanyi carried out this Ph.D
dissertation and produced this report under our supervision in partial fulfillment of
the requirement for the award of Doctor of Philosophy (Ph.D) in Applied
Geophysics.
---------------------------- -----------------
Chinwuko, Augustine Ifeanyi Date
Candidate
---------------------------- ----------------
Prof. A.G. Onwuemesi Date
Supervisor I
---------------------------- -----------------
Dr. E. K. Anakwuba Date
Supervisor II

IV
DEDICATION
I dedicate this dissertation to the Almighty God for granting me the grace to
complete this Ph.D dissertation and to my lovely wife, Mrs. Ngozi Florence
Chinwuko as well as my darling daughter, Chidera Favour.

V
ACKNOWLEDGEMENT
My foremost gratitude goes to my harmonious project Supervisors, Prof. A. G.
Onwuemesi and Dr. E. K. Anakwuba for their efforts in providing instruction,
direction, support, and knowledge during this study. I especially appreciate their
accessibility and readiness to provide insight anytime I approached them
throughout the execution of this work. I also acknowledge Dr. A. U. Okoro for his
relentless effort and contribution towards this research work. Moreover, I wish to
thank the Head of Department, Dr. N. E. Ajaegwu for his kindness and support.
May I say thank you to all the lecturers in my department for their justifiable critics
and encouragement towards this work.
My gratitude also goes to the Vice Chancellor of Federal University Gusau, Prof.
Ben-Chuks Okeke through whom the Tertiary Education Trust Fund (TETFUND)
grant was extended to me as an academic staff. To the entire Management Board,
Head of Geological Department, Prof. U.A. Danbatta and my fellow staff at
Federal University Gusau (FUGUS), I say thank you for all your support.
My thanks go to the Department of Petroleum Resources, Nigeria, which provided
the approval and permission to use the data set for this study. I appreciate the
management of SunLink Petroleum Limited, Lagos Nigeria for granting me one
year graduate internship in their noble company. I am also grateful to Mr.
Onyekwelu Clement Udenna of SunLink Petroleum Limited Lagos and Dr. Ebere

VI
Benard of Southern Atlantic Petroleum Limited Lagos, Nigeria for their support
throughout the period of my graduate internship in the company. I acknowledge
also the support and assistance of everyone who has given me a whole new
experience in my study.
I am most grateful to my lovely wife whose support, love and care for me proved
overwhelming in the development of this project; baby, you are ‘My Rence’. To
my darling daughter, Chidera Favour may God bless you for your prayer and best
wishes.
I am also grateful for the support of my family both immediate and extended. I
want to specially thank my beloved brothers: Mr. Nnanwuba Chinwuko, Engr.
Nnamdi Chinwuko and Mr. Azuka Chinwuko as well as my darling sisters: Mrs
Chinelo Udo-Anagor, Mrs Ifeyinwa Ifeatu and Miss Obiageli Chinwuko for their
prayers, financial support and encouragement. Also, I appreciate the support and
advice of my cousin, Engr. Dr. Chuka Chinwuko, who is the Head of Industrial
Production Engineering in this University. May I also say thank you to Mr.
Chukwunenye Dike for your brotherly advice.
Finally, I give glory to the Almighty God, the giver of life and to Jesus, the Author
and Finisher of our faith for giving me the wisdom, knowledge and understanding
to attain this height.

VII
ABSTRACT
Co-blending of seismic attributes was used in the interpretation of channel geometries
and reservoir characterization in Rence Field of Niger Delta, Nigeria. The study aims at
defining the geometries of hydrocarbon reservoirs with particular emphasis on channels
in shallow marine (offshore) Niger Delta. The co-blending application enhances both the
ease of detection and continuity of channels, leaving the channel environs unchanged.
The methodology involved the use of three dimensional seismic reflection volume,
checkshot (velocity) and well log data in order to generate all necessary interpretation
and input for geological modelling from seismic and well data interpretations. Eight
single seismic attributes such as average energy, root-mean-square amplitude,
instantaneous frequency, reflection acoustic impedance, iso-frequency, dominant
frequency, signal envelope and coherence attributes were used for interpretation in the
study. Four sets of co-blending were carried out. The execution of these steps was done
with the aid of Schlumberger Petrel. The result of the seismic facies analysis reveals that
the Rence Field can be distinguished into two seismic facies, namely, layered complexes
and chaotic complexes. The channel elements deduced from facies analysis are meander
loop cut-off deposits, lateral accretionary channel deposits, and shore deposits. The result
of well to seismic ties reveals high and low amplitude reflection events for sand and shale
units respectively. Seismic structural interpretation of Rence Field reveals four major
regional faults and twelve minor faults. Seven of the faults are antithetic and the rest are
synthetic faults. One mega-channel feature that trends east - west was identified in the
attribute maps generated. It is characterized by sinuosity of 1.3, with a meandering length
of 22500 m, and a distance of 17500 m. The average depth of the channel is about 170 m
with amplitude of 1670 m, and wavelength as high as 7640 m. A depositional model
generated from the attribute maps indicates a sub-aqueous channel environment of
deposition. The attribute map also shows that there was shifting in location of barrier bars
within the area. The shifting could be attributed to growth faults mechanism. At the
flanks of the sinusoidal channel there are prominent sand point bars sequences. The
petrophysical analysis of the well data shows 90% Net-to-Gross, 28% porosity, 27%
volume of shale, and 24% water saturation. These values indicate that the reservoir is of
pay quality. The oil reservoir has been estimated to be 474.4 million stock tank barrels of
oil initially in place. The oil/water contact was delineated at a depth of 1294m (4180ft)
with the oil bearing sands having low acoustic impedance values ranging from 4600 to
5450 g/cm3.cm/s with highest porosity value of 0.36. The water sand has higher acoustic
impedance values ranging from 5500 to 6150 g/cm3.m/s with the lowest porosity value of
0.12. The validity of this work is in the application of the seismic time slice at 1703ms
from the attribute map generated which shows that, all the existing wells in the study area
are targeting the mega-channel for oil exploitation. Based on the petrophysical analysis,
results, and identification of channel deposits, the study area proves highly promising for
hydrocarbon accumulation and definition of the geometries of channel in study area.

VIII
TABLE OF CONTENTS
Title Page I
Approval Page II
Certification III
Dedication IV
Acknowledgement V
Abstract VII
Table of Contents VIII
List of Figures X
List of Tables XII
Chapter One 1
Introduction 1
1.1 Background Information 1
1.2 Statement of the Problem 3
1.3 Location of the Study Area 5
1.4 Aim and objectives of the study 8
1.5 Justification of study 9
1.6 Scope of the study 10
1.7 Significance of the study 10
Chapter Two 12
Review of Related Literature 12
2.1 Literature Review 12
2.2 Regional Geology of Niger Delta 22

IX
2.3 Tectonic Evolution 26
2.4 Structural Styles 28
2.5 Lithostratigraphy of Niger Delta 28
2.6 Evolution of Depobelts 33
2.7 Evolution of Sequences 34
2.8 Petroleum Geology 36
2.9 Features within Channels 41
2.10 Theory of Well Correlation 44
2.11 Theory of Well Log Sequence 45
2.12 Background to Seismic Attributes 48
Chapter Three 56
Material and Methods 56
3.1 Data Availability and Description 56
3.2 Methodology 61
Chapter Four 75
Results and Discussion 75
4.0 Introduction 75
4.1 Result of Well Interpretation 75
4.2 Result of Seismic Structural Interpretation 88
4.3 Result of Seismic Attributes 100
4.4 Seismic Facies and Stratigraphic Analysis 113
4.5: Channel System and Depositional Elements Distribution 117
4.5 Discussions 120

X
Chapter Five 140
Summary, Conclusions and Recommendation 140
5.1 Contribution to Knowledge 140
5.1 Summary 141
5.2 Conclusions 143
5.3 Recommendations 146
References 147
Appendix 159
XI
LIST OF FIGURES
Fig. Page 1.1:Map of Niger Delta showing the location of the study area 6
1.2: Location map of the study area 7
2.1 Geologic map of Nigeria showing Niger Delta Basin and its relation to
bounding structural feature 24
2.2: Niger Delta Basin and its stages of development 24
2.3: Physiographic sketch of the deep marine sediments in the Gulf of Guinea
off the Niger Delta 35
2.4:Examples of Niger Delta Oil field structures and associated trap type 29
2.5:Stratigraphic section of the Anambra Basin and time equivalent
formations in the Niger Delta 29
2.6: Lithostratigraphic section of Niger Delta 32
2.7: Regional structural elements and depobelts of the Niger Delta 32
2.8: Subsurface depth map of the Niger delta basin 40
2.9:Lithostratigraphic and chronostratigraphic interpretations of two well logs
in a dip-oriented cross section 46
2.10: The direct correlation between facies and a variety of other log shapes
relative to the sedimentological relationship 46
3.1: Base map showing all wells and seismic volume 58
3.2: Research Workflow 62
4.1: Distribution of GR logs in Rence Field before Normalization 76
4.2: Distribution of GR logs in Rence Field after Normalization 77
4.3: Gamma Ray Log Cut off for lithology description in Rence Field 79
4.4: Northwest –Southeast correlation panel across Rence field 81
4.5: Major Reservoir correlation panel across Rence field 83
4.6: Typical Gamma Ray log patterns of the study area 85
4. 7: Rence seismic wavelet profile extracted from Rence-1 well 87
4.8: The synthetic seismogram of the Rence field at well 1 87
4.9: The well ties posted on a seismic section within the Rence Field 88
4.10: Structural Configuration of the Rence Field 90
4.11: Seismic interpreted section on trace 13900 of Rence field 91
4.12: Time-structure map of H top reservoir horizon 93
4.13: Rence Field velocity curve 93
4.14: Depth-structural map of H top reservoir horizon 95
4.15: Multi-graph showing the oil/water contact in the study area
4.16: Petro-Acoustic Analysis showing Oil/Water sand 99
4.17: Amplitude map generation for H-Horizon 101

XII
Fig. Page
4.18: Individual seismic attribute showing mega channel 102
4.19: Morphological Modelling of Geoprobe through various attributes 103
4.20: Co-blending of various seismic attribute 109 4.21: Seismic section showing seismic facies recognized in the study area 114
4.22: Line of section showing Channel morphology and architecture 118
4.23: Visible Channel resulting from Co-blending of Reflection Acoustic
Impedance, Coherency and Instantaneous Frequency 119
4.24: 3D Reservoir modelling within the study area 122
4.25: Line of section showing strata termination, fault pattern and facies
assemblage within the study area 124
4.26: Distinct Strata Patterns within the study area 126
4.27: Multi-well stratigraphic cross-section (Datum: H Reservoir top)
showing the mega channel 127
4.28: Characterization of the depositional features within the study area 128
4.29: Idealized diagram of depositional model within the study area 130 4.30:Co-blended Seismic Time Slice showing mega-channel and fault 133
4.31: Channel reservoir elements within the study area 133
4.32: Amplitude thickness map of H-Reservoir 136

XIII
LIST OF TABLES
Table Page
3.1: List of Available Well Logs and Core Data 60
4.1: Summary of Petrophysical Properties in the study area for H-Reservoir 96
4.2: Characteristics of different facies within the Rence field 115
4.3: Estimated channel geometries within the Rence field 119

1
CHAPTER ONE
INTRODUCTION
1.1 BACKGROUND TO THE STUDY
Nigeria is the largest crude oil producing country in Africa, the sixth petroleum giant
in the Organization of Petroleum Exporting Countries (OPEC) and the eleventh in the
world (Okodudu, 2007). It gained world class fame only in the year 2000 through oil
production in its Niger Delta region. The Niger Delta is situated in the Gulf of Guinea
and extends throughout the Niger Delta Province (Klett et al, 1997). From the Eocene
till Recent, the delta has prograded southwestwardly, forming depobelts that represent
the most active portion of the delta at each stage of its development (Doust et al,
1990). The present day national petroleum reserves asset of about 32 billion barrels of
oil and 170 trillion standard ft3
of gas (Obaje et al, 2004) are derived solely from the
onshore and offshore of Niger Delta Basin.
Consequently, Seismic data are routinely and effectively used to estimate the structure
of reservoir bodies as well as estimating the spatial distribution of rock properties.
Taner et al. (1994) have investigated the possible relations between individual seismic
attributes and rock properties. The simultaneous use of seismic attributes with well log
data leads to better prediction of reservoir or rock properties, compared to estimations
using only well data (Schultz et al., 1994). Furthermore, Chopra and Marfurt (2011)
studied blended data and observed that the seismic attributes need to be visualized in
such a way that they add maximum value to a seismic interpretation. They also
observed that three dimensional (3D) visualization capabilities can be a powerful tool

2
to integrate different types of data. Barnes et al., (2011) revealed that the combination
of structural and stratigraphic attributes through volume blending with illumination
enhanced structural elements in the data such as canyon walls, faults, anticlines,
diapirs, channels, and other features.
Knowing fully that seismic signal features are directly caused by rock physics
phenomena, the links between these two are complex and difficult to derive
theoretically. Seismic response depends on many variables, such as temperature,
volume of clay, overburden, pressure, nature and geometry of the layering, and other
factors which affect elastic and absorption responses. These complex relations can
vary from one layer to another, and even within a single layer or reservoir
compartment, Schultz et al. (1994). Also, Schultz et al. (1994) showed that
simultaneous use of seismic attributes with well log data leads to better prediction of
reservoir or rock properties, compared to estimations using only well data.
Furthermore, hydrocarbon exploration has moved away from traditional prospecting
for structural traps alone. Presently, prospects are more often defined by stratigraphic
subtle traps such as channels, pinch-out, bars, reefs, onlap, valley fills and
permeability barriers. The particular innovation introduced by this project is the
additional value obtained by attributes co-blending. The application of co-blending
attributes shall display superior images of the channels because co-blending improves
imaging of geological structures and strongly defines the depositional environment.

3
The enhanced image of co-blended attributes shall compensate poor visualization by
single attributes only.
Hence, our study aims at identifying seismic geobodies on 3-D with particular
emphasis on channel geometries in shallow marine sands (offshore) Niger Delta. It is
worthy to note that, sinuous channels host significant hydrocarbon reserves on a
variety of continental margins according to Mayall et al., (2006), which appear in our
study area and they can serve as major conduits for transfer of sediments from
continental shelf to deep ocean (Khripounoff et al., 2003). The findings of this work
will be applicable to nearby active areas in the region as well as other areas that
exhibit similar challenges such as the Gulf of Mexico Basin.
1.2 STATEMENT OF THE PROBLEM
The aim of seismic amplitude analysis is to make accurate lithologic prediction from
the wide spread seismic data (or observed data), based on the available well data (or
known data), utilising all prior knowledge, throughout a seismic volume. To minimize
reservoir lithology and structural uncertainty, we need to have high resolution seismic
data. However, due to the inherent limitation of the seismic data (particularly low
bandwidth) having low seismic resolution at deeper section, it is not possible to map
the lithology and other structural features with confidence in far depth within the
Rence field. Some information about the study area that is considered confidential to
the Company is removed due to the nature of oil and gas business.

4
At first sight, the connection between the geology and seismic sections might seem
obvious and relatively uncomplicated. Many modern seismic sections (and some of
the older ones also) bear a striking resemblance to geological cross sections. But how
far can we really go with such a comparison? Is it possible to translate all that we see
in a seismic section into geology? The seismic system sees with a biased eye. It can
only detect lithological boundaries if there is acoustic impedance contrast across the
boundary and this contrast must be above the threshold unit of the seismic system. So,
at best, the seismic system detects only a limited proportion of boundaries, and when
these boundaries are closely spaced, interference affects the seismic response,
complicating or making impossible our perception of the geology.
That the subsurface is viewed not in depth but in terms of two-way time (TWT) is a
further handicap. The distortion introduced by this last factor alone makes a simple
and direct link between geology and seismic sections more problematic since there is
both vertical and lateral change in velocity. Also, the information gap between what
was observed in the seismic section and what the geology most probably is has to be
filled by the interpreter. The interpreter must be able to identify and eliminate all noise
and also the interpreter must employ considerable geological skill, including
knowledge of sedimentology, stratigraphy and structural geological reality.
In addition, the detection of channels and their infill lithology have always posed a
challenge for exploration geologists and geophysicists, and the study area which is
Rence Field in the Niger Delta Basin does not fall outside of this challenge. Hence,

5
channels can be difficult to detect, due to structural complexity, poor resolution and
lack of skills by the interpreter.
There was no biostarigraphic information provided; this would have created good
support to the field’s sequence stratigraphy. However, the information provided was
basic for this work.
1.3 LOCATION OF THE STUDY AREA
The Niger Delta is situated in Southern Nigeria between latitudes 40N and 6
0N and
longitudes 30E and 9
0E (Nwachukwu and Chukwura, 1986, Anakwuba et al., 2008).
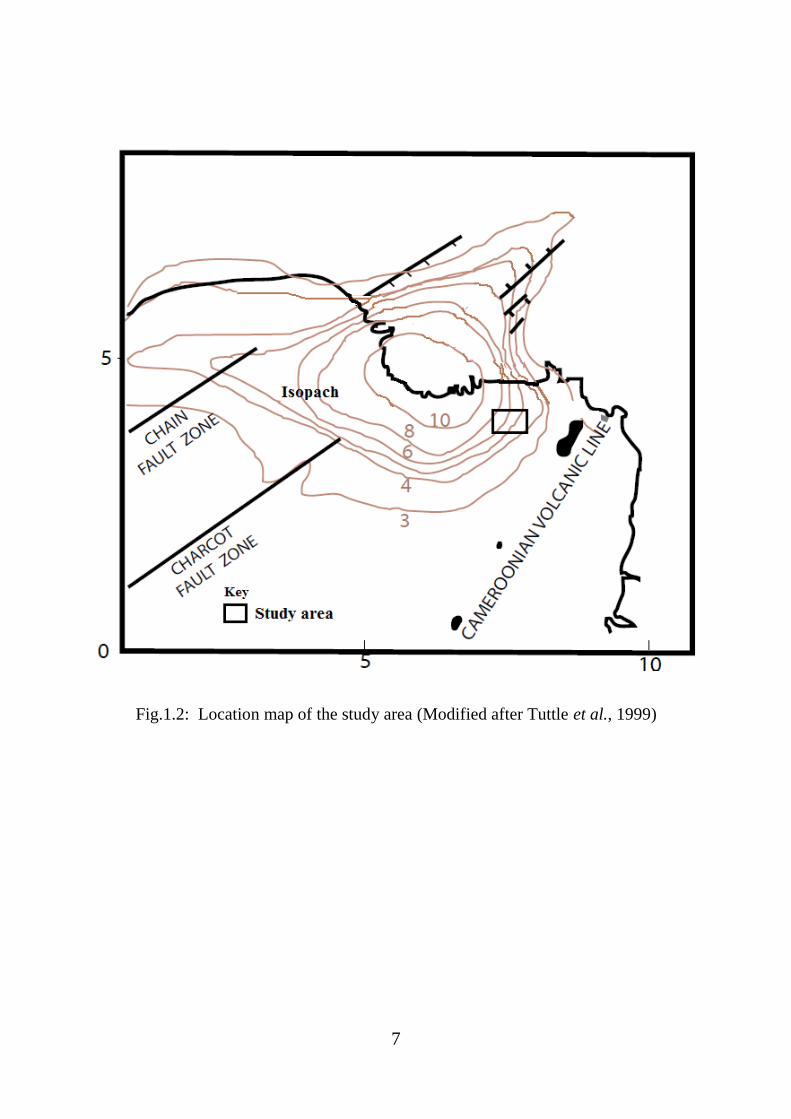
Rence field is situated within the conventional water offshore of the South East Niger
Delta (Figs. 1.1 and 1.2), about 55 km from the Bonny Oil Terminal, in a water depth
ranging from 60 to 100 m. The acreage has been operated from 1970 to date by the
Nigerian National Petroleum Coperation (NNPC), which drilled 4 exploratory wells,
resulting in two oil/gas discoveries in deltaic to off-shelf sandstone of Pliocene age.

6
Fig.1.1: Map of Nigeria showing Niger Delta (Modified after Haack, 1997)
7
Fig.1.2: Location map of the study area (Modified after Tuttle et al., 1999)

8
1.4 AIM AND OBJECTIVES OF THE STUDY
1.4.1 AIM OF THE STUDY
This project is aimed at co-blending of seismic attributes for interpretation of channel
geometries and reservoir characteristics Rence field in the Niger Delta basin.
1.4.2 OBJECTIVES OF THE STUDY
The objectives of the study is:
1. To carry out a detailed well interpretation which includes log normalization,
well correlation and well log responses.
2. To construct and generate the well-to-seismic ties within the study area.
3. To construct structural time and depth contour maps of the identified reservoir
in the study area.
4. To estimate the petrophysical parameters within the study area.
5. To carryout volumetric estimation of potential reservoir in the study area.
6. To map the hydrocarbon bearing zones and hydrocarbon-water contacts.
7. To carry out 3D seismic stratigraphic interpretation, in which the structural
pattern of the area is interpreted.
8. To carry out a detailed seismic facies analysis within the study.
9. To generate various seismic attributes sections and geologic models from the
interpreted seismic data of the study area.

9
10. To generate attribute maps that will reveal stratigraphic structures and
depositional environment.
11. To build reservoir model from the obtained petrophysical values within the
study area.
12. To compute geometrical characteristics of the shallow marine channels identify
in the study area.
13. To analyze shallow marine channel architectural elements in a Niger delta shelf
environment, using architectural characteristics of the deposits filling the
channels to evaluate the possible differences in the associated deposits based
on the channel types.
14. To produce a depositional model for the shallow marine water of Niger delta
shelf.
1.5 JUSTIFICATION OF STUDY
This study is to take a new look at seismic attributes given the considerable well
control that has been acquired during the past decade. By using this well understood
reservoir as a natural laboratory, we calibrate the response of various attributes to
generate attribute maps that will yield visible stratigraphic traps such as channels and
incised valley fills as well as aid delineation of depositional model for the study area.
Furthermore, the drilling bit has encountered many seismically ‘invisible channels’
that are of economic value and the present study will definitely unveil these channels.
This research will also help to bring geology and geophysics together within a

10
workflow that is designed to directly translate geophysical data into geological
understanding.
1.6 SCOPE OF THE STUDY
The scope of this study is limited to continental shelf in shallow marine (offshore)
environment of the Niger Delta, Nigeria. In this study, the co-blending attributes
technique would compensate for poor visualization of the channel by single attributes
only, in order to aid envisage the stratigraphic traps like channel that can
accommodate huge hydrocarbon. Therefore, the focus is shifting to big single
stratigraphic traps such channels and incised valley fills that would yield better value
investment ratio.
1.7 SIGNIFICANCE OF THE STUDY
At the end of this research, a lot of people especially those in the petroleum sector will
find the solution to the lack of identification of stratigraphic traps such as channels
and incised valley fills in seismic data of any given hydrocarbon basin. Those to
benefit in the study includes, the government, oil workers, future researchers and
students.
The knowledge gained from the study will help the government through their agencies
in the oil sector to know the oil reserves and production rate of the hydrocarbon basin
within their territory for a huge economic growth. This is because oil is used for a
wide range of applications, such as powering internal combustion engines, power

11
generation, space heating, bitumen generation, agriculture product, plastics and
synthetics component.
More so, oil workers will find this new interpretational technique useful
because the technique will help them in seismically defining the geometries of
hydrocarbon reservoirs with particular emphasis on channels. The technique
will also revealed to the oil workers how effective it is in enhancing both the
ease of detection and continuity of channels as well as delineation of the
depositional features.
Finally, future researchers and students who intend to undertake related study
on the co-blending of seismic attributes for interpretation of channel
geometries and reservoir characterization will hopefully find the study useful.
Literature reviewed as well as findings from the study will present them with
vital information that will adequately guide their research. More so, the
findings of this work will be applicable to nearby active areas in the region as
well as other areas that exhibit similar challenges such as the Gulf of Mexico
Basin.

12
CHAPTER TWO
REVIEW OF RELATED LITERATURES
2.1 LITERATURE REVIEW
The Niger Delta Basin occupies the Gulf of Guinea continental margin in equatorial
West Africa between Latitudes 40N and 6
0N and longitudes 3
0E and 9
0E. It ranks
among the world’s most prolific petroleum producing Tertiary Deltas (Selley, 1997).
The stratigraphy, sedimentology, structural configuration and paleo environment in
which the reservoir rocks accumulated have been studied by various workers. These
include Short and Stauble, 1967; Weber, 1971; Burke, 1972; Weber and Daukoru,
1975; Evamy et al., 1978; Rider;, 1996; Selley,1997; Anakwuba et al., 2010;
Anakwuba et al., 2013, Anakwuba et al., 2015.
More so, the Niger Delta is a large, arcuate delta of the destructive, wave-dominated
type (Weber and Daukoru, 1975). A sequence of under-compacted marine clays,
overlain by paralic deposits, in turn covered by continental sands, is present
throughout, built-up by the imbricated super-position of numerous offlap cycles.
Basement faulting affected delta development and thus affects sediment thickness
distribution. In the paralic interval, growth fault with associated rollover structures
trapped hydrocarbons. Faults in general play an important role in the hydrocarbon
distribution. Growth faults may even function as hydrocarbon migration paths from
the overpressured marine clays.
Meanwhile, 3D Seismic data are most commonly used in the exploration world to
delineate geological structures evident by continuous lateral reflection events. Brown

13
(2013) defined seismic interpretation as the extraction of subsurface geologic
information from seismic data. He further wrote that reflection seismic data comprises
of continuity of reflections indicating geologic structure; variability of reflections
indicating stratigraphy, fluids and reservoir fabric; the seismic wavelet and noise of
various kinds and data defects. Seismic interpretation is the thoughtful procedure of
separating these effects. The interpreter is not directly interested in the wavelet itself
but rather in the geological information that it carries. Thus, understanding the wavelet
and distinguishing its characteristics from details of the geology is one of the critical
tasks of today’s interpreter. The primary task facing a seismic interpreter is to
recognize and attribute a geologic significance to observable pattern in the seismic
response. The most apparent patterns are found in seismic reflections. In recent years,
the oil industry is using subtle patterns and connecting them to such attributes as
porosity, lithology and fluid content as well as underground structure (Smith and
Starcey, 2011).
More so, Oyanyan et al. (2012) carried out geological analysis of core samples and
qualitative interpretation of wireline log shapes which aid the identification of seven
depositional environments of various sand units in Sam-Bis oil field of Niger Delta
Basin. These include distributary channels, mouth bar, point bar, tidal channel, tidal
flat, middle shoreface and lower shoreface.
The observations reported by Bubb and Hatledid (1977) remain basically unchanged
for 3D seismic data and 3D seismic attributes. Carbonate build-ups buried in shale
will give rise to structural highs and positive curvature along the shallower, more

14
easily picked horizons. Carbonate build-ups buried in salt will appear as structural
lows, giving rise to a negative curvature anomaly. Sheriff (1992) carried out a
research work on amplitude variations of 3D seismic data with specific physical
properties. He stated that amplitude variation of the same reflection is interpreted in
terms of lateral and vertical changes in petrophysical properties and lithologies.
Omoboriowo et al. (2012) wrote that once an accumulation of petroleum has been
discovered, it is better to characterize the reservoir as accurately as possible in order to
calculate the reserves and to determine the most effective way of recovering as much
of the petroleum as possible. Hence, Tinker (1996) defined reservoir characterization
as the quantification, integration, reduction and analysis of geological, petrochemical,
seismic and engineering data.
Adeogba et al., (2005) have interpreted a near surface, 3D seismic data set from the
Niger Delta continental slope, offshore Nigeria and revealed important stratigraphy
and architectural features. Architectural features and sediment deposits interpreted
from seismic character and seismic stratigraphy in the absence of borehole data
include mass transport complexes, distributary channels, submarine fans and hemi
pelagic drape complex. Also, Siddiqui et al., (2013) revealed that depositional
environment of shallow-marine sandstones have been regarded as tide dominated,
wave dominated and storm dominated which reveals the reservoir heterogeneities and
variation in sand body geometry.

15
Pokhriyal (2011) wrote that seismic resolution (or bandwidth) plays an important role
for better visualization or quantification of interesting geological features in
interpretation, which helps in reducing the exploration risk. It is difficult to extract the
embedded geological information in the seismic data having a low seismic bandwidth.
Thus application of seismic attribute generation and analysis will provide a better
result in such type of seismic data (low bandwidth). He further wrote that a new
seismic attribute volume has been generated using a mathematical relation, which
provides an improved mapping of morphological features (for example, pinch outs,
faults, channels etc.) and reflectivity (for example, lithology, reservoir thickness etc.)
components of seismic data with geological objects and also explain the observed
results at a set of wells.
Furthermore, the seismic data is treated as an analytic trace which contains real
components (original input trace) and the complex (imaginary) component, usually
generated from the Hilbert transforms from which various amplitudes, phase and
frequency attributes can be deduced (Ayolabi and Adigun, 2013). This complex trace
allows the amplitude, phase, frequency and reflector polarity attributes of a seismic
data to be calculated in a rigorous mathematical sense. Subrahmanyam (2008) also
wrote that Seismic attributes are the components of the seismic data which are
obtained by measurement, computation, and other methods from the seismic data.
Seismic Attributes were introduced as a part of the seismic interpretation in early
1970’s. Since then many new attributes were derived and computed. Most of these

16
attributes are of commercial interest and the use of many of the attributes, are yet to be
understood by many interpreters and users.
Mehdi and De-Hua (2011) stated that a method for 3D modeling and interpretation of
log properties from complex seismic attributes (obtained from 3D post stack seismic
data) is developed by integrating Principal Component Analysis and Local Linear
Modeling. Complex seismic attributes have non-linear relationships with
petrophysical properties of rocks. These complicated relationships can be
approximated using statistical methods. This method has been tested successfully on
real data sets.
Aizebeokhai and Olayinka (2011) used structural and stratigraphic mapping of Emi
field, offshore Niger Delta to assert that oil and gas are predominantly trapped in
sandstones and unconsolidated sands in the Agbada formation of Niger Delta, ranked
among the world’s major hydrocarbon provinces. In their study, seismic data were
integrated with well logs to define the subsurface geometry, stratigraphy and
hydrocarbon trapping potential of Emi-field, off shore Niger Delta.
Furthermore, Bahorich and Farmer (1995) stated that their coherence methodology
was the first published method of revealing fault surfaces within a 3D volume for
which no fault reflections had been recorded. Their volume of coherence coefficients
computed from the seismic amplitudes on adjacent traces using a crosscorrelation
technique, clearly portrayed faults and other stratigraphic anomalies on time and

17
horizontal slices. The coherence images distinctly revealed buried deltas, river
channels, reefs, and dewatering features.
According to Dan and Robert (1996), attribute analysis of 3-D seismic data in time
slices presents a great opportunity for reservoir characterization. The interpretable
information of the 3-D seismic data can be enhanced with complex seismic trace
attributes. The correlation between various P-wave seismic attributes and lithology
has been used for some time; however, the multi component seismic techniques
promise augmented development.
Marfurt et al. (1998) wrote that seismic coherency is a measure of lateral changes in
the seismic response caused by variation in structure, stratigraphy, lithology, porosity,
and the presence of hydrocarbons. Unlike shaded relief maps that allow 3-D
visualization of faults and channels from horizon picks, seismic coherency operates on
the seismic data itself and is therefore creative by interpreter or automatic picker
biases. They wrote further by saying that the calculation of reflector dip/azimuth
throughout the data volume allows them to generalize the calculation of conventional
complex trace attributes (including envelope, phase, frequency, and bandwidth) to the
calculation of complex reflector attributes generated by slant stacking the input data
along the reflector dip within the coherency analysis window.
Liu and Marfurt (2007) reported that the use of instantaneous spectral attributes which
were derived from using the short-window discrete Fourier transform (SWDFT) are

18
excellent method or tool for mapping channels along interpreted horizons. They wrote
that channels filled with porous rock and encased in a nonporous matrix constitute one
of the more important stratigraphic exploration plays. Although attributes such as
coherence can be used to map channel width, they are relatively insensitive to channel
thickness. In contrast, spectral decomposition can be used to map subtle changes in
channel thickness. Because they are interested in mapping high-reflectivity channels
encased in a lower-reflectivity matrix, they found that a composite plot of the peak
frequency and the average peak amplitude accentuates highly tuned channels. Finally,
by generating a composite volume using peak frequency, peak amplitude, and
coherence, they were able to establish not only the channel thickness, but also its
width.
According to Chopra and Marfurt (2007) coherence is a measure of similarity between
waveforms or traces. Peyton et al. (1998) showed the use of edge detection attribute to
identify channel boundaries in the Red Fork level by comparing the horizon slice with
a modern coherence algorithm. Their result also show additional features and
enhances the channel levee.
In addition, Sigismondi and Soldo (2003) revealed that curvature attribute maps are
powerful tool for visualization and interpretation of structural features. They also
carried out a comparison between common dip attribute and various curvature
attributes has been made in order to highlight the main differences between them. In

19
both cases, a higher contrast in the curvature attribute helps to better identify the fault
system.
Klein et al. (2008) wrote on 3D curvature attributes, a new approach for seismic
interpretation and they disclosed that the proposed new technique was to compute
volumetric curvature attributes in a single step, without requiring any pre-computation
of intermediate volumes such as dip and azimuth. Curvature attributes allow
quantifying and qualifying lateral continuity of the fault and its vertical displacement.
They supported the analysis of structural traps occurring against faults. Hence, the
qualitative and quantitative information extracted from the curvature attributes yielded
a huge result in mapping of fracture density and orientation. As a future perspective, a
post processing of the curvature attributes may be implemented in order to sort out
singular geological lineament orientations. This approach could also be used to
remove non-geological lineaments such as acquisition footprints. The curvature
attributes can augment the coherency attribute in the analysis of the geological
scheme.
Chopra (2008) reveals that seismic attributes extract information from seismic
reflection data which can be used for quantitative and qualitative interpretation. He
said that attributes are used by geologists, geophysicists, and petrophysicists to map
features from basin to reservoir scale. Some attributes, such as seismic amplitude, root
mean square (RMS) amplitude, spectral magnitude, acoustic impedance, elastic
impedance, and average energy are directly sensitive to changes in seismic

20
impedance. Other attributes such as peak-to-trough thickness, peak frequency, and
bandwidth are sensitive to layer thicknesses. Also, he wrote that seismic attributes
such as coherence, Sobel filter-based edge detectors, amplitude gradients, dip-
azimuth, curvature, and gray level co-occurrence matrix measures are directly
sensitive to seismic textures and morphology.
Chopra and Marfurt (2011) studied on blended data and observed that the seismic
attributes need to be visualized in such a way that they add maximum value to a
seismic interpretation. They also observed that 3-D visualization capability can be a
powerful tool to integrate different types of data. Considering the well log curves,
vertical sounding profile (VSP) data or micro seismic data also can be brought
together in 3-D views to provide visual corroboration of data information and to build
higher levels of confidence in interpretations.
Yenugu et al. (2011) wrote on seismic attribute mapping for identification of Cypress
Sands, Illinois Basin, Indiana, USA. They used modern 3D visualization tools of
opacity and Hue-Lightness-Saturation (HLS) color modulation to co-render
complementary seismic attributes along stratal slices at 2ms intervals. Such co-
rendering allows them to interactively cluster mathematically independent attributes
that are coupled through the same geologic features (e.g. low impedance with lower
peak frequency). They present their findings through a suite of multi-attribute displays
and animations loops through the data volume to highlight the subtle lenticular sand
bodies associated with structural faults/ridges characteristic of braided channels.

21
Chopra and Marfurt (2012) reported that Channel features are often identified by their
meandering and dendritic morphology on maps. They said that positive curvature
anomalies over channel features indicate that these channels are filled with a lithology
that is less compactable than the surrounding matrix, indicating the presence of sand.
Negative curvature anomalies over channel features are more problematic. If the
channels are in near-shore environment and have been filled by rising sea level, there
is a very high probability that they are filled with shale, indicating that sand should be
found in the surrounding, less-compacted point bars and levees that often express a
positive curvature anomaly.
Urazimanova et al. (2013) carried out a research work on iterative depositional model
interpretations using seismic attributes. They revealed that channel morphology was
best delineated by the variance attribute which helped better understand and construct
more precise depositional models of the formations in the area. On the other hand,
RMS amplitude and negative energy attributes helped clustering and delineating the
same lithologies within the meandering channels, which in turn separated sands from
mud and shale.
Li et al., 2013 carried out research in order to examine the oil resource potentials,
reservoir characteristics, and oil chemistry/physical properties of Eocene-Oligocene
Shahejie Formation in the Jiyang Super-depression, Bohai Bay Basin of in eastern
China. They revealed several significant differences between the lacustrine and

22
marine shale systems. These include (1) the greater heterogeneities in lacustrine
sediments and more limited connectivity between source and conventional reservoirs
in the distal portions of lacustrine systems; (2) the close proximity to terrestrial source
that creates opportunity for higher plant contribution and more waxy oils from
lacustrine source rocks in oil window; (3) the relatively narrow but generally higher
activation energy range in the kinetics of hydrocarbon generation from type I kerogens
in carbonate-rich lacustrine kinetics that have clear implications for kerogen-oil
interaction behavior, oil flow characteristics, and gas to oil ratio within the lacustrine
system; (4) high temperature thermochemical sulphate reduction that tend to form
significant amounts of hydrogen sulphide, with various undesirable effects.
2.2 REGIONAL GEOLOGY OF THE NIGER DELTA
The Niger Delta region of Nigeria is among the world’s largest petroleum provinces
and its importance lies on its hydrocarbon resources (Amadi et al., 2012). The Niger
Delta region of Nigeria is the most prolific and advantageous sedimentary basin in
Nigeria due to its world class petroleum accumulations.
The Niger delta is one of the world’s largest deltaic systems. The delta covers an
approximate area of about 300,000 km2 (Kulke, 1995), with sediment volume of
500,000 km3 (Hospers, 1965) and sediment thickness ranging between 9,000 and
12,000 m. The delta extends more than 300 km from apex to mouth (Doust and
Omatsola, 1990). Galloway (1975) classified the Niger delta as a wave- dominated
tidal-influenced delta. The Niger delta is bounded to the north by the Anambra Basin,

23
to the west by the Okitipupa High and the Benin Flank, and to the east by the volcanic
rocks of the Cameroon volcanic zone (Fig. 2.1). There was an original paleo-high that
separated the eastern from the western delta, but that has been covered with sediments
over a very long period of time.
The Niger delta is an overall regressive sequence (Fig. 2.2) formed by an interplay
between the rate of deposition or sediment supply and the rate of subsidence or
accommodation space creation. For this delta, the rate of deposition far exceeded the
rate of subsidence, which resulted in an overall progradational delta (Knox and
Omatsola, 1989). Major submarine canyons delivered sediments from the shelf edge
into the deep-water environment. Some of the canyons are: Lagos, Avon and Mahin in
the west, Niger canyon at the center, and Kwa Ibo and Calabar in the east (Fig. 2.3).

24
Fig. 2.1: Geologic map of Nigeria showing Niger Delta basin and its relation to
bounding structural feature (Whiteman, 1982).
Fig. 2.2: Niger delta basin and its stages of development
(After Short and Stauble, 1967).

25
Fig. 2.3: Physiographic sketch of the deep marine sediments in the Gulf of Guinea off
the Niger Delta (After, Burke, 1972 and Reijers et al., 1997)

26
2.3 TECTONIC EVOLUTION
The Niger Delta Basin is situated on the coastal and oceanward part of a much larger and
older tectonic feature, the Benue Trough, which is a NE-SW folded rift basin that runs
diagonally across Nigeria. The tectonic framework of the continental margin along the
west coast of equatorial Africa is controlled by Cretaceous fracture zones expressed as
trenches and ridges in the deep Atlantic (Fig. 2.1). The fracture zone ridges subdivide the
margin into individual basins, and in Nigeria, from the boundary faults of the Cretaceous
Benue – Abakiliki trough that cuts far into the West African shield. The trough represents
a failed arm of a triple junction associated with the opening of the South Atlantic. In this
region, rifting started in the Late Jurassic and persisted into the Middle Cretaceous (Lehner
and De Ruiter, 1977). The subsidence that occurred along fundamental transform faults is
the landward continuation of the Chain and Charcot ocean fracture zones (Doust and
Omatsola, 1990). In the Niger Delta, rifting diminished altogether in the Late Cretaceous.
After rifting ceased, gravity tectonics became the primary deformational process.
Shale mobility induced internal deformation and occurred in response to two
processes (Kulke, 1995). First, shale diapirs formed from loading of poorly
compacted, over-pressured, prodelta and delta-slope clays (Akata Formation.) by the
higher density delta-front sands (Agbada Formation.). Second, slope instability
occurred due to a lack of lateral, basinward, support for the under-compacted delta-
slope clays (Akata Formation).

27
For any given depobelt, gravity tectonics were completed before the deposition of the
Benin Formation and are expressed in complex structures, including Shale diapers, rollover
anticlines, collapsed growth faults crests, back to back features and steeply dipping, closely
spaced flank faults (Evamy et al., 1978; Xiao and Suppe, 1992). These faults mostly offset
different parts of the Agbada Formation and flatten into detachment planes near the top of
the Akata Formation.
2.4 STRUCTURAL STYLES
The influence of basement tectonics on the structural evolution of the Niger Delta was
largely limited to movements along the Equatorial Atlantic Ocean fracture zones,
which extend beneath the delta and determines the initial locus of the proto Niger
Delta in the Benue Trough (Short and Stauble, 1967; Doust and Omatsola, 1990;
Reijers et al., 1997). As the Delta advanced unto thinned continental crust and
possibly later unto actual oceanic crust, continuous subsidence and thinning of the
basement created more space for the thick sedimentary pile of the prograding
Cenozoic Niger Delta (Doust and Omatsola, 1990). On the eastern flank of the Niger
Delta Basin, uplift of the Cameroon volcanic ranges provided the dominant
sedimentary source into the Cross River Delta (Rio Del Rey Basin).
Growth faults, triggered by a pene-contemporaneous deformation of deltaic sediments, are
the dominant structural features in the Niger Delta (Doust and Omatsola, 1990). They are
generated by rapid sedimentation load and the gravitational instability of the Agbada
sediment pile accumulating on the mobile, under-compacted Akata Shales. There is little

28
or no growth faulting extending into the Benin Formation due to its occurrence and
sedimentation. Toe thrusting at the delta front, lateral flow and extrusion of the Akata
prodelta Shales during growth faulting and related extension also account for the diapiric
structures on the continental slope of the Niger Delta in front of the prograding depocentre
with paralic sediments (Doust and Omatsola, 1990).
Growth faults comprise synthetic faults and the major structure building faults (some of
which bound the depobelts) steep, parallel crestal faults which cut the rollover structures
associated with the structure building faults are the rollover anticlinal structures (Doust and
Omatsola, 1990).
The complexity of these structures is dependent on the overall sediment burden; in the
initial phases of growth faulting displacement only occurs along the major bounding faults.
With increased overburden and increased horizontal displacement accommodation becomes
more complex and finally occurs along numerous small faults, which form the typical
collapsed crest structures (Fig 2.4).
2.5 LITHOSTRATIGRAPHY
The Cretaceous section has not been penetrated beneath the Niger Delta, the youngest and
the southernmost sub-basin in the Benue - Abakiliki trough (Reijers et al., 1997).
Lithologies of Cretaceous rocks deposited in what is now the Niger Delta Basin can only be
extrapolated from the exposed Cretaceous section in the next basin to the northeast – the
Anambra Basin (Fig. 2.5).

29
Fig 2.4 Examples of Niger Delta Oil field structures and associated trap types
(After Doust and Omatsola, 1990 and Statcher, 1995).
Fig 2.5: Stratigraphic section of the Anambra Basin and time equivalent formations in
the Niger Delta (Adapted from Reigers et al., 1997)

30
From the Campanian through the Paleocene (Fig 2.5), the shoreline was concave into
the Anambra Basin, resulting in convergent long shore drift cells that produce tide-
dominated deltaic sedimentation during transgressions and river-dominated
sedimentation during regressions. Shallow marine classics were deposited farther
offshore and in the Anambra Basin, are represented by the Albian – Cenomanian ASU
River Group, Cenomanian-Santonian Eze-Aku and Awgu Shales and Campanian -
Maastrichtian Nkporo Shales, among others (Reijers et al., 1997). In the Paleocene, a
major transgression began with the Imo Shale being deposited in the Anambra Basin
to the northeast and the Akata Shale in the Niger Delta area to the southwest. In the
Eocene, the coastline shape became convexly curvilinear, the long shore drift cells
switched to divergent and sedimentation changed to being wave dominated. At this
time, deposition of paralic sediments began in the Niger Delta area proper and as the
sediments prograded south, the coastline became progressively more convex seaward.
Hence, the lithologies of the area experience changes due to several factors. One
factor would be the types of sediment coming through the delta, which could be
influenced by sea level, or maybe volcanic activity in the area. The type of
environment of deposition will also change the sediment type. The early Cretaceous
sediments were thought to be from a tide dominated system that were deposited on a
concave shoreline, and throughout time the shoreline has become convexed and it is
currently a wave dominated system.
The Tertiary section of the Niger Delta is divided into three formations (Fig. 2.6),
representing prograding depositional facies that are distinguished mostly on the basis

31
of sand/shale ratios. The type sections of these formations are described in Short and
Stauble (1967) and summarized in a variety of papers (e.g. Avbobvo, 1978; Doust and
Omatsola, 1990; Kulke, 1995).
2.5.1 Akata Formation
The Akata Formation at the base of the delta is of marine origin and is composed of
thick shale sequences (potential source rock), turbidite sand (potential reservoirs in
deep water) and minor amounts of clay and silt. Beginning in the Paleocene and
through the recent, the Akata Formation formed during lowstands when the terrestrial
organic matter and clays were transported to deep water areas characterized by low
energy conditions and oxygen deficiency (Stacher, 1995).
Though little of the formation has been drilled, it is estimated to be up to 7000 meters thick
(Doust and Omatsola, 1990). The formation underlies the entire delta and is typically
overpressured.
2.5.2 Agbada Formation
The deposition of the overlying Agbada Formation, the major petroleum-bearing unit
began in the Eocene and continues into the Recent. The formation consists of paralic
siliciclastics over 3700m thick (Tuttle et al., 1999) and represents the actual deltaic
portion of the sequence. The classics accumulated in delta front, delta top set and
fluvio-deltaic environment. In the lower Agbada Formation, shale and sandstone beds
were deposited in equal proportions; however, the upper portion is mostly sand with
only minor shale interbeds.

32
Fig 2.6: Lithostratigraphic section of Niger Delta (Adapted from Tuttle et al., 1999)

33
2.5.3 Benin Formation
The Benin Formation, an upper delta – top lithologies, overlies the Agbada Formation. It
consists of predominantly massive, highly porous, fresh water-bearing sandstones with
local thin shale interbeds that are considered to be of braided stream origin. The formation
is up to 2000 m thick and ranges from Late Eocene to Recent in age (Avbobvo, 1978).
Most companies exploring for oil in the Niger Delta arbitrarily define the base of the
formation by the deepest fresh water bearing sandstones that exhibit high resistivity.
However, Short and Stauble (1967) defined the base of Benin Formation by the appearance
of first marine foraminifera within shales, as the formation is non-marine in origin.
2.6 EVOLUTION OF DEPOBELTS
The deposition of the three formations of the Tertiary Niger Delta occurred in each of
the five off-lapping siliciclastic sedimentation cycles that comprise the Niger Delta.
These cycles (depobelts) are 30-60 km wide, prograde southwestward 250 km over the
oceanic crust into the Gulf of Guinea (Stacher, 1995) and are defined by
synsedimentary faulting that occurred in response to variable rates of subsidence and
sediment supply (Doust and Omatsola, 1990). The interplay of subsidence and supply
rates resulted in deposition of discrete depobelts when further crustal subsidence of the
basin could no longer be accommodated, the focus of sediment deposition shifted
seaward, forming a new depobelt. Each depobelt is a separate unit that corresponds to
a break in regional dip of the Delta and is bounded landward by growth faults and
seaward by large counter-regional faults or the growth faults of the next seaward belt

34
(Evamy et al., 1978; Doust and Omatsola, 1990). Generally six major depobelts are
recognized in the Niger Delta (Fig. 2.7). They include Northern Delta, Greater Ugheli,
Central Swamp I and II, Coastal Swamp and Offshore depobelts. Each of these has its
own sedimentation, deformation and petroleum history.
Doust and Omotsola (1990) described three depobelt provinces based on structure.
The Northern Delta province that overlies relatively shallow basement has the oldest
growth faults that are generally rotational, evenly spaced and increased steepness
seaward. The Central Delta province has depobelts with well-defined structures such
as successively deeper rollover crests that shift seaward for any given growth faults.
Lastly, the Distal Delta province is the most structurally complex due to the internal
gravity tectonics on the modern continental slope.
2.7 EVOLUTION OF SEQUENCES
From the Eocene onwards, the long-term eustatic sea level curve reflects global
regression, which caused the Niger Delta to prograde (Fig. 2.7). Periodic eustatic rises
interrupted this trend resulting in transgression with temporary landward shift of the
palaeo-coastline and formation of delta-wide depositional wedges of marine clay that
grade up dip into fluviatile clays. Compaction, clay movement and/or growth faulting
locally triggered autocyclic sedimentation.
As a result, the Cenozoic Niger Delta is a composite of fills with localized depocentres
bounded by macro and mega structures and its evolution driven by autocyclic
processes. The results are characteristic progradational, aggradational and
retrogradational stacking patterns of deltaic parasequences.

35
Fig. 2.7 Regional structural elements and depobelts of the Niger Delta
(After, Doust and Omatsola, 1990)

36
The Niger Delta sediments span a period of 54.6 Ma during which third-order eustatic
sea level rises have been recognized. Correlation with Harland et al (1992) confirms
the presence of nineteen of such named marine flooding surfaces in the Niger Delta.
Eight of these are only locally developed. Eleven define lithological mega-units with
regionally mappable transgressive shale markers traceable across depobelt boundary
faults. These units are the genetic sequences which can be used as a basis for
lithostratigraphy in the Niger Delta (Reijers et al., 1997). Next to the genetic
sequences are other sequences that are bounded and defined by seismically detectable
erosional features (Vail, 1987). The Niger Delta incised valleys or ‘channels’ with
depths up to several hundreds feet and widths of several kilometers are example of
these features. Erosive cutting of the channel took place during a sea level lowstand
and infilling during the initial slow, later rapid rise in sea level. Variable sediment
supply and sea level fluctuations filled these channels with a range of sands,
heteroliths and mudstones. Both Vail (1987) and Galloway (1975) sequences are
recognized elsewhere but the Niger Delta sequence stratigraphic and lithostratigraphic
framework is based on the genetic sequence.
2.8 PETROLEUM GEOLOGY
The Niger Delta holds enormous petroleum reserves, estimated recently at about 34.5
billion barrels of oil and 93.8 trillion cubic feet of gas (Petroconsultants, 1996). The
source rock of hydrocarbon in the basin is certainly shales of the Akata Formation.
The hydrocarbons generated in the Akata Formation definitely migrated up dip

37
through growth faults to accumulate in shallow reservoirs of the Agbada Formation.
The petroleum geology of the Delta is discussed below:
2.8.1 Source Rock
The hydrocarbon source rock in the Niger Delta has been discussed extensively.
Possibilities include variable contributions from marine interbedded shales in the
Agbada Formation, the marine Akata Shales, and Cretaceous Shales (Ekweozor and
Okoye, 1980; Stacher, 1995; Haack et al., 1997). The Cretaceous section has never
been drilled beneath the delta due to its great depth; therefore, no data exist on its
source-rock potential. Also migration of oil from the Cretaceous section into the
reservoirs in the Agbada would have required an intricate faults/fracture network, as
the Akata Shale is very thick. No data exist to support such a network of fracture.
Although, the Agbada Formation has intervals that contain organic carbon contents
sufficient to be considered good source rocks, the intervals, however, rarely reach
thickness sufficient to produce a world class oil province and is immature in various
parts of the Delta (Stacher, 1995). The Akata Shale is present in large volumes
beneath the Agbada Formation and is at least volumetrically sufficient to generate
enough oil for a world-class oil province such as the Niger Delta.
2.8.2 Reservoir Rock
Petroleum in the Niger Delta is produced from sandstones and unconsolidated sands
predominantly in the Agbada Formation. Known reservoir rocks are Eocene to
Pliocene in age, ranging from 15 to 45meters in thickness (Tuttle et al., 1999). The

38
grain size of the reservoir sandstone is highly variable with fluvial sandstones tending
to be coarser than their delta front counterparts, point bars fine upward and barrier bars
do have the best grain sorting. Porosity only slowly decreases with depth because of
the young age of the sediment. In the outer portion of the delta complex, deep-sea
channel sands, low-stand sand bodies and proximal turbidites create potential
reservoirs (Beka and Oti, 1995). Burke (1972), Damuth and many others described
three deep-water fans (namely, Avon fan, Niger fan and Calabar fan) that are likely to
be active through much of the Delta’s history (Fig. 2.3).
2.8.3 Traps and Seal
Most known traps in the Niger Delta are structural, although stratigraphic traps are not
uncommon (Fig. 2.3). The structural traps developed during synsedimentary deformation of
the Agbada parallic sequence (Stacher, 1995). Doust and Omatsola (1990) described a
variety of structural trapping elements including those associated with simple rollover
structures, clay filled channels, structure with multiple growth faults, antithetic faults and
collapsed crest structures. Also stratigraphic traps related to palaeo-channel fills, regional
sand pinchouts and truncation occur. The primary seal rock in the Niger Delta is the
interbedded shale within the Agbada Formation. The shale provides three types of seals;
clay smears along faults, interbedded sealing units against which reservoir sands juxtaposed
due to faulting and vertical seal (Doust and Omatsola, 1990).

39
2.8.4 Petroleum Maturation and Migration
Evamy et al. (1978) set the top of the present-day oil window in the Niger delta at the
2400F (115
0C) isotherm. In the northwestern portion of the delta, the oil window
(active source-rock interval) lies in the upper Akata Formation and the lower Agbada
Formation as shown in Fig. 2.8. To the southeast, the top of the oil window is
stratigraphically lower (Evamy et al., 1978).
Migration from the lower Agbada Formation into the reservoir rocks is through
conduits of deep-seated regional and counter-regional extensional faults. However,
migration from mature, overpressured shales is similar to that described from
overpressured shales in the Gulf of Mexico. Migration in these basins is really occurs
from a structurally low area to a higher area in the subsurface because of the relative
buoyancy of hydrocarbons in comparison to the surrounding rock.
Hunt (1990) related episodic expulsion of petroleum from abnormally pressured,
mature source rocks to fracturing and resealing of the top seal of the overpressured
interval. This type of cyclic expulsion is plausible for the Niger delta basin where the
Akata Formation is overpressured.

40
Fig. 2.8: Subsurface depth map of the Niger Delta Basin (contours are in feet)
(Evamy et al., 1978; Tuttle et al., 1999).

41
2.9 CHANNEL FEATURES
Channel floors are often incised by a relatively narrow ‘inner’ channel called the
thalweg, while coarse-grained channel-fill deposits often generate high-amplitude
reflectors (HARs) on seismic profiles. In hydrological and fluvial landforms, the
thalweg is a line drawn to join the lowest points along the entire length of a stream
bed or valley in its downward slope, defining its deepest channel. Hence, high-
amplitude reflector packages (HARPs) commonly occur at the bases of channel–levee
systems, and represent relatively coarse grained, unconfined deposits that accumulate
in lows between channel–levee systems (Flood et al., 1991); they typically result from
channel wall breaching and switching (avulsion) events. The points where channels
separate (bifurcate) are sometimes called avulsion nodes.
Channel floors are host to a complex interplay of erosional and depositional processes;
consequently, a range of features can be observed, depending on the level of data
resolution available. Large-scale ( 10 to 100 metres) erosional scours and depositional
bed forms, e.g. coarse grained sediment waves (Wynn et al., 2002) are often
widespread, together with smaller-scale (centimetres to metres) features such as
current ripples, dunes and flute marks. A characteristic feature of sinuous channels is
depositional point bars on the inside of sinuous loops, which can amalgamate during
channel lateral migration to form lateral accretion packages/deposits (Abreu et al.,
2003). It is worthy to note that, sinuous channels host significant hydrocarbon
reserves on a variety of continental margins (Mayall et al., 2006); they are major

42
conduits for transfer of sediments from continental shelf to deep ocean (Khripounoff
et al., 2003).
Furthermore, channels have always been essential geologic features in the exploration
for oil and gas. With enhanced 3D seismic data they can be mapped easily on time or
depth slices. In other situations they can be difficult to detect, due to structural
complexity. There are a number of image-processing algorithms that can be used to
enhance linear features such as channels in 3D seismic volumes.
Mathewson and Hale (2004) revealed that sands associated with channels often make
good reservoirs for hydrocarbons. For this reason, the identification of channels is an
important part of seismic interpretation for oil and gas exploration. From 3D seismic
data it is possible, for horizontal layering, to perform detailed mapping of channel
systems directly on time slices. However, in the majority of cases layers are not
horizontal, and horizon flattening needs to be done first.
According to Mathewson and Hale (2004), it is possible to automatically detect
channels whether or not they are horizontal because they have unique characteristics
that differentiate them from other types of features that we encounter in 3D seismic
data. Channels are long, sinuous objects with arbitrary orientation. They are locally
linear in that their extent is much greater in one direction than in any other direction,
at a given point. Other features in a 3D seismic volume are either locally planar (such
as bedding planes, faults) or locally isotropic (like pinnacle reefs, salt bodies). This

43
difference in dimensionality between different features in the input image can be used
to detect and enhance (or attenuate) particular types of features.
Analysis of dimensionality can be done using the co-blending seismic attribute
techniques and knowledgeable skills in interpretation of seismic sections. The co-
blending seismic attribute technique is essentially a multi-scale process which, given
the diversity of shapes and sizes of channels.
An understanding of fan structure and growth is important because many oil and gas
deposits occur in sandy layers in older fan sediments. Some workers like Posamentier
and Allen (1993) have suggested that sandy sediments are not common in muddy fans,
or that they are present only in channels or when the fan first becomes active.
However, Flood et al., 1991 suggested that sandy layers are more common because
they also form as channel patterns evolve.
Flood et al., (1991) and Posamentier and Allen (1993) revealed that Channels, levees
and other facies can be interpreted on seismic records that have high resolution. They
showed that a sequence of channels and levees were active on the fan whenever sea
level was low, and inactive when sea level was high. Sedimentation patterns related to
channel evolution (especially the formation of new channels by branching off of older
channels) created coarse, flat-lying sand deposits that extend into still deeper water.
These sandy deposits are newly described units that may significantly change our
understanding of how and when sandy sediment deposits form on continental margins.

44
Furthermore, Naseer, T.M., et al. (2014) carried out a research on application of
seismic attributes for delineation of channel geometries and analysis of various
aspects in terms of lithological and structural perspectives of Lower Goru Formation,
Pakistan. In their study, they aimed at delineating the channels reservoirs and other
stratigraphic features in such a terrain where there is always a challenge for the
geoscientist to search and exploit the channelled reservoirs. To resolve this issue, they
have utilized attribute analysis on high resolution 3D-seismic data for the detailed
comparative studies for the channels. Also according to Naseer, T.M., et al. (2014),
seismic attributes such as coherency and frequency are sensitive to the channel edges
that are applied for the channel delineation and their geometrical analysis. They also
said that spectral decomposition techniques can be applied for the delineation of
channels and to appropriately select the best band for channels identification. Three
types of channel geometries are recognized in their study: 1) highly sinuous channel;
2) narrow-broad meandering belts; 3) moderate to high sinuous channel. NW-SE, N-
W trending faults can be helpful to compartmentalize the reservoir. Finally, they wrote
that instantaneous and dominant frequency are more beneficial for further field
development based on Gamma Ray logs from nearby drilled wells and dimensional
perspectives analysis of the channel reservoir.
2.10 THEORY OF WELL CORRELATION
The development of geologic pattern displayed by structural and stratigraphic units
that are equivalent in time, age, or stratigraphic position through the use of
geophysical well logs is generally referred to as log correlation (Reed, 1999). Two

45
main types of geological correlation strategies exist; lithostratigraphic and
chronostratigraphic (Van Wagoner et al., 1990). The method applied in this study is
lithostatratigraphic correlation.
A lithostratigraphic correlation would suggest that as a typical delta builds across a
continental shelf, the sandy near shore and shallow-marine sediments build outward
across muddy prodelta deposits (Fig. 2.9). In contrast, the chronostratigraphic model
recognizes that a deltaic depositional system progrades through time and that at any
given time, facies grade laterally from one to another. As a result, minor lateral
changes in depositional environments through time can create abrupt vertical facies
changes, as well as lateral changes in lithology. Chronostratigraphic correlation lines
highlight changes in depositional geometry. Finally, lithostratigraphic correlation
(upper diagram- Fig. 2.9) assumes no dip in sand bodies towards basin, whereas
chronostratigraphic correlation (lower diagram- Fig. 2.9) assumes basinward-dipping
clinoforms.
2.11 THEORY OF WELL LOG SEQUENCE
This involves the recognition of well log responses based on sediment characteristics
(Fig. 2.10). The analysis of the stacking patterns of the gamma-ray log is used in
interpreting the various systems tracts (Mitchum et al, 1991), sedimentary facies and
their depositional environments.
More so, the grain size of terrigenous sediment depends primarily on the energy of the
depositing current. Generally, higher-energy currents produce coarser-grained

46
Fig. 2.9: Lithostratigraphic and chronostratigraphic interpretations of two well along
depositional dip (modified after Ainsworth et al., 1999).
(a) (b) (c) (d) (e)
Fig. 2.10: The direct correlation between facies and gamma ray log responses relative
to the sedimentary environments (Cant, 1992 and Siddiqui et al, 2013.)

47
sediments and lower-energy environments produce finer-grained sediments. Grain
size tends to decrease in the direction of transportation, with the gravel size fraction
displaying this feature more so than sand. Sorting increases along with current energy
and the length of time the current is active.
Sedimentary facies commonly display characteristic vertical profiles in which grain
size fines upward, coarsens upward, or remains constant. The determination of such
vertical variations in grain size can be extremely valuable in the diagnosis of
depositional environment. Fig. 2.10 shows Vertical grain -size profiles of some
common sandstone facies which illustrates characteristic vertical grain-size profiles of
some important clastic sedimentary facies.
Channel sequences usually form by lateral accretion and many channel sands display,
to some degree, profiles that fine upward, generally from a scoured base (Fig. 2.10a).
On the other hand, "bar"-type sands almost always display coarsening-upward
profiles, often capped by an abrupt facies change to fine-grained material (Fig.
2.10b).
Examples include regressive barrier-island sands, shallow marine bars, delta-front
bars, and even aeolian dunes. Some facies - for example, braided-stream sands, tidal
sand ridges, and submarine channels - often display "blocky" profiles whereby grain
size remains relatively constant (Fig. 2.10c). It is important to remember, however,
that vertical variations in grain size can be due to more than one process or
depositional setting; i.e., not all fining-upward sequences are channels, or coarsening-
upward sequences, marine bars. For example, deposition from turbidity currents

48
produces fining-upward sequences in submarine fans. Also, crevasse subdeltas form
coarsening-upward grain-size profiles similar in appearance to marine bars.
Sands originating in different sub-environments commonly coalesce to form a single
vertical grain-size profile. An example is deltaic point-bar channel sand that, as it
builds outward, incises down into underlying delta-front bar sand, forming a deltaic
couplet (Fig. 2.10b). The surface that divides the two facies is sometimes difficult to
determine from well logs, requiring detailed study of well cuttings and cores.
2.12. BACKGROUND TO SEISMIC ATTRIBUTES
Seismic attributes are the fundamental pieces of information contained within a
recorded seismic trace: time, amplitude, frequency, and attenuation (Brown, 2001).
They are also defined as quantitative derivatives of a basic seismic measurement that
may be extracted along a seismic trace, a horizons surface, or summed over a time
window (Brown, 1996). More so, Seismic attributes can be conveniently defined as
“the quantities that are measured, computed or implied from the seismic data”
(Subrahmanyam, 2008).
From the time of their introduction in early 1970’s, seismic attributes have gone a
long way and they have become an aid for geoscientists for reservoir characterization
and also as a tool for quality control. The analysis of seismic attributes allows the
identification of petrophysical and structural aspects of a buried volume of rock that
would typically be beneath the resolution of traditional seismic amplitude data. In the

49
petroleum industry, seismic attributes are used to identify areas of high porosity or
permeability, lateral changes in the aspect or dip direction of a horizon, continuity of
reflectors, stratigraphic pinch-outs, and a multitude of other properties of use in
petroleum exploration and field development (Siguaw et al., 2001). Actually,
development of a wide variety of seismic attributes warrants a systematic
classification. A systematic approach is needed to understand the use of each of these
attributes and also their limitations under different circumstances.
2.12.1 Classification of Seismic Attributes
The Seismic Attributes are classified basically into 2 categories namely; Physical
attributes and Geometric attributes (Brown, 1996; Brown, 2001; Taner, 2001 and
Subrahmanyam, 2008).
Physical Attributes
Physical attributes are defined as those attributes which are directly related to the
wave propagation, lithology, bright spots, gas accumulation, sequence boundaries,
major changes or depositional environments, thin-bed tuning effects, and
unconformities. These physical attributes can be further classified as instantaneous
and wavelet attributes. Instantaneous attributes are computed sample by sample
and indicate continuous change of attributes along the time and space axis. The
Wavelet attributes, on the other hand represent characteristics of wavelet and their
amplitude spectrum.

50
The attribute is a result of the properties derived from the complex seismic signal.
The concept of complex traces was first described by Taner et al. (1979). The
complex trace is defined as:
2.1
Where:
CT(t) = complex trace; T(t) = seismic trace; H(t) = Hilbert’s transform of T(t);
H(t) is a 900 phase shift of T(t).
Below are the physical attributes used in the study area:
a) Signal Envelope (E) or Reflection Strength
The Signal Envelope (E) is calculated from the complex trace by the formula
according to Taner et al. (1979):
2.2
The envelope is the envelope of the seismic signal. It has a low frequency
appearance and only positive amplitudes. This attribute is good for looking at
packages of amplitudes. This attribute represents mainly the acoustic
impedance contrast, hence reflectivity. It is mainly useful in identifying: bright
spots, gas accumulation, sequence boundaries, major changes or depositional
environments, thin-bed tuning effects, unconformities, major changes of
lithology, local changes indicating faulting, spatial correlation to porosity and
other lithologic variations as well as indicates the group, rather than phase
component of seismic wave propagation.

51
b) Instantaneous Phase
Instantaneous phase is the angle of lag or lead of the harmonic components of a
seismic pulse with respect to a reference. For example, a zero-phase wave
would be symmetric whereas a 90° phase wave would be perfectly asymmetric
(Sheriff, 1973). Instantaneous phase is measured in raians (-π, π). Phase along
horizon would not change in principle; changes can arise if there is a picking
problem, or if the layer changes laterally due to “sink-holes” or other
phenomena. This attribute is useful as: best indicator of lateral continuity,
relates to the phase component of the wave propagation, can be used to
compute the phase velocity, has no amplitude information, shows continuous
sequence boundaries, detailed visualization of bedding configurations and used
in computation of instantaneous frequency and acceleration.
c) Instantaneous Frequency
Instantaneous frequency describes the duration of a seismic pulse and it is
commonly sub-equal to the centroid of the power spectrum of the seismic
wavelet (Taner, 2001). The instantaneous frequency is the time derivative of
instantaneous phase, that is, the rate of change of the phase (Taner et al., 1979,
Barnes, 1992; Sheriff and Geldart, 1995; Cohen, 1995):
2.3
Instantaneous frequency attribute is useful in the following aspect: represents
the mean amplitude of the wavelet, indicate bed thickness and also lithology

52
parameters, corresponds to the average frequency (centroid) of the amplitude
spectrum of the seismic wavelet, seismic character correlator, indicates the
edges of low impedance thin beds, hydrocarbon indicator by low frequency
anomaly, unconsolidated sands due to the oil content of the pores, fracture zone
indicator, appear as lower frequency zones, chaotic reflection zone indicator,
bed thickness indicator (higher frequencies indicate sharp interfaces or thin
shale bedding, lower frequencies indicate sand rich bedding) and sand/shale
ratio indicator.
d) Dominant Frequency (Fc)
The reciprocal of any dominant period (Tc) is a measure of the dominant
frequency (Fc) of the signal or wavelet spectrum. Dominant period of any
response corresponds to the time one peak to the next or from one trough to the
next.
2.4
e) Relative Acoustic Impedance
Acoustic impedance is the product of seismic velocity and density which yields
a basic physical rock property. It can yield important information concerning
the nature of the rock and changes in lithology. The seismic traces are first
transformed into pseudoreflection-coefficient time series, then converted into
acoustic impedances according to Becquey et al. (1979):
2.5
Where = the acoustic impedance in the layer

53
= the pressure amplitude reflection coefficient at the interface
This attribute calculates the running sum of the trace to which a low cut filter is
applied. It is an indicator of impedance changes, in a relative sense. The low
cut filter is applied to remove direct current (DC) shift which is typical in
impedance data. (If the value of the low cut filter is zero, then it is not
applied.). The calculated trace is the result of simple integration of the
complex trace. It represents the approximation of the high frequency
component of the relative acoustic impedance.
f) Average Energy
The average energy of a seismic signal is proportional to the sum of the
amplitudes of the signal squared. The average amplitude of the stacked trace
over time window t to t+mΔt is (Sheriff and Geldart, 1995):
2.6
The average energy of a seismic signal is proportional to the sum of the
amplitudes of the signal squared. Referring to equation 3.6, this can be
illustrated for a single trace i as
2.7
Where,
gti is the amplitude of channel i at time t and < E > is average energy.

54
(g) RMS Amplitude
This attribute is a measure of the reflectivity within a time window (Sheriff and
Geldart, 1995). To be more specific, it is the square root of the sum of the
squares of the amplitudes within the window interval (Sheriff and Geldart,
1995):
2.8
Where,
A =RMS amplitude,
= the sum of the squares of the amplitudes within the window interval
It is conventionally used as a direct hydrocarbon indicator in a zone. The first
use of amplitude information as hydrocarbon indicators was in the early 1970s
when it was found that bright-spot amplitude anomalies could be associated
with hydrocarbon traps.
Geometrical Attributes
Geometric attributes relate to the physical properties of the reflected data.
These attributes describe the spatial and temporal relationship of all other
attributes (Taner, 2001). This category includes attributes such as
variance/semblance, dip, azimuth, curvature, discontinuity as well as coherency
and spectral decomposition. Dip, azimuth, and curvature may all relate to
depositional patterns and are commonly used for stratigraphic interpretation.

55
These attributes measure the lateral relations in the data. They are described as
follows:
(a) Variance, or its cousin attribute semblance, measures the continuity of the data
and is good indicator of bedding similarity and potential faults.
(b) The Dip attribute or amplitude of the data corresponds to the dip of the seismic
events. Dip is useful in that it makes faults more discernible.
(c) The amplitude of the data on the Azimuth attribute corresponds to the
azimuth of the maximum dip direction of the seismic feature. Note that azimuth
is a true value in degrees. Azimuth can be calculated with respect to the North
or inline direction. Note also that dip is true for depth volumes only. If input
data is time or time migrated, the dip represents relative values (time dip). The
derivation of the directional attribute is done by considering several traces
together to reveal the geometry (dip and azimuth) of the beds.
(d) Discontinuity is a geometrical attribute, and measures the lateral relations in the
data. It is designed to emphasize the discontinuous events such as faults. High
amplitude values on these attribute corresponds to discontinuities in the data,
while low amplitude values correspond to continuous features. Discontinuity
varies between zero and one, where zero is continuous and one is discontinuous.
This attribute can be used in understanding coherency at maximum coherency
direction, minimum coherency direction, event terminations, picked horizons,
fault detection, zones of parallel bedding, zones of chaotic bedding, non-
reflecting zones, converging and diverging bedding patterns, unconformities
etc.

56
(e) Coherence
Analysis of horizon attributes began with the examination of coherence values
of interpreted horizons. Coherence is the measure of the similarity in
appearance and shape of waveforms from trace to trace. The ratio of stacked
energies of traces over a selected spatial area compared to the sum of the
energies of the individual components is (Sheriff and Geldart, 1995):
2.9
In conclusion, the suitability of blending seismic attributes and seismic interpretation
techniques has been discussed by many authors (Taner, 2001; Adeogba et al., 2005;
Pilcher and Blumstein, 2007; Chopra 2008; Subrahmanyam, 2008; Klein et al. 2008;
Ferguson et al., 2010; Pokhriyal 2011; Chopra and Marfurt 2011; Barnes et al. 2011;
Chopra and Marfurt 2012, Anakwuba et al., 2013, Anakwuba et al., 2015). There are
some seismic attributes that are sensitive to the edges of the stratigraphic events (Such
as channels). They are coherence, frequency, spectral decomposition, acoustic
impedance, average energy, and signal envelop which are the most distinguished
means of mapping the channel boundaries within the study area which is supported by
Bahorich and Farmer (1995), Chopra and Marfurt (2006), Liu and Marfurt (2006),
Partyka et al., (1999); Peyton et al. (1998). Although these attributes when co-blended
will easily detect channel edges, geometries and depositional environment.

57
CHAPTER THREE
MATERIALS AND METHODS
3.1 DATA AVAILABILITY AND DESCRIPTION
The data sets available for this research project include geophysical well logs from nine
wells, 3-D seismic volume and velocity data (precisely check shots). A brief description of
the available data set is presented below:
3.1.1 3-D Seismic Volume
A regional seismic survey around the study area was provided by Department of Petroleum
Resources (DPR), a subsidiary of Nigerian National Petroleum Cooperation (NNPC). The
survey was previously processed in 1987 by Eni Exploration and Production Division using
post stack time migration. This was later reprocessed in 1999 using pre-stack imaging
(PSI). The zero phased PSI migrated data manifests moderate data quality down to 2.5
seconds. Below 2.5 seconds, data quality deteriorates. In 2002, a subset of the seismic
volume (covering the study area) was reprocessed as a pre-stack depth migration (PSDM).
The reprocessed 3-D PSDM seismic was used in this study. The seismic volume is
characterized by a series of parallel reflections offsets and deformed by major listric normal
faults. Also, the seismic volume contains 8 in-lines and 11 cross-lines within the study area
(Fig. 3.1). The character of the seismic record changes with depth. This study focuses on
reflections between 2.7 and 1.5seconds (two way traveltime (TWT)), inferred to be from
Agbada Formation based on regional studies (Short and Stauble, 1967; Doust and
Omatsola, 1990; Morgan, 2004; Anakwuba, 2009). Reflections within this interval have
moderate to good continuity and high amplitude variations (Fig. 3.2).

58
Fig. 3.1: Base map showing all wells and seismic lines
Fig. 3.2: Seismic reflections within the study area

59
3.1.2 Well Log Data
All the wells within the study area were drilled between 1978 and 1982, hence are old
vintage logs. The suite of logs available for the study includes gamma ray, resistivity,
density, sonic and neutron logs (Table 3.1). Basically all the wells have gamma ray and
resistivity. Wells 6 and 8 do not have sonic logs whereas other wells do have sonic logs.
Density logs are present in all the wells except well 9, while neutron logs are present in all
the wells, except wells 1and 2. The quality of the available logs was judged fair to good;
however, there is no availability of core data. The log setting is given as shown below:
gamma ray log(GR) = 0 – 150; sonic log (DT) =40 – 240; density log (DEN) =1.95 – 2.95;
neutron log (NEU) = -0.15 – 45; porosity log (PHIE) = 0 – 0.50 and water saturation (SW)=
0 – 1.00.

60
Table 3.1: List of available well logs and core data (A=available and NA=Not-available)
Name GR DT Density Phie Neutron Hdra RT MD Sw VSH TVDSS OWT
Perm_
Welltest Core_GR Core_Phie Core_DT GR_Sw GR_Res
RENCE 1 A A A A NA NA NA A A A A A NA NA NA NA NA NA
RENCE 2 A A A A A NA NA A A A A A NA NA NA NA A NA
RENCE3 A
A
A A A A A A A A A A A A A A A NA
RENCE 4 A
A
A A A A NA A A A A A A NA NA NA NA A
RENCE 5 A A A A A A NA A A A A A A NA NA NA NA NA
RENCE 6 A
N
A A A A A NA A A A A A A NA NA NA NA NA
RENCE 7 A A A A A NA NA A A A A A A NA NA NA Yes NA
RENCE 8 A
N
A A A A A NA A A A A A NA NA NA NA NA NA
RENCE 9 A A NA A NA NA NA A A A NA A NA NA NA NA NA NA
LENGEND
GR- Gamma ray log; DT- Sonic log; Phie- Porosity log;
Hdra- Hydration data; RT- Real traveltime; MD- Measured depth;
Sw – Water saturation; VSH- Volume of shale; Res-Resistivity log
TVDSS- True vertical depth sub-sea; OWT- Oil water contact;
Perm_welltest- Permeability from well test;
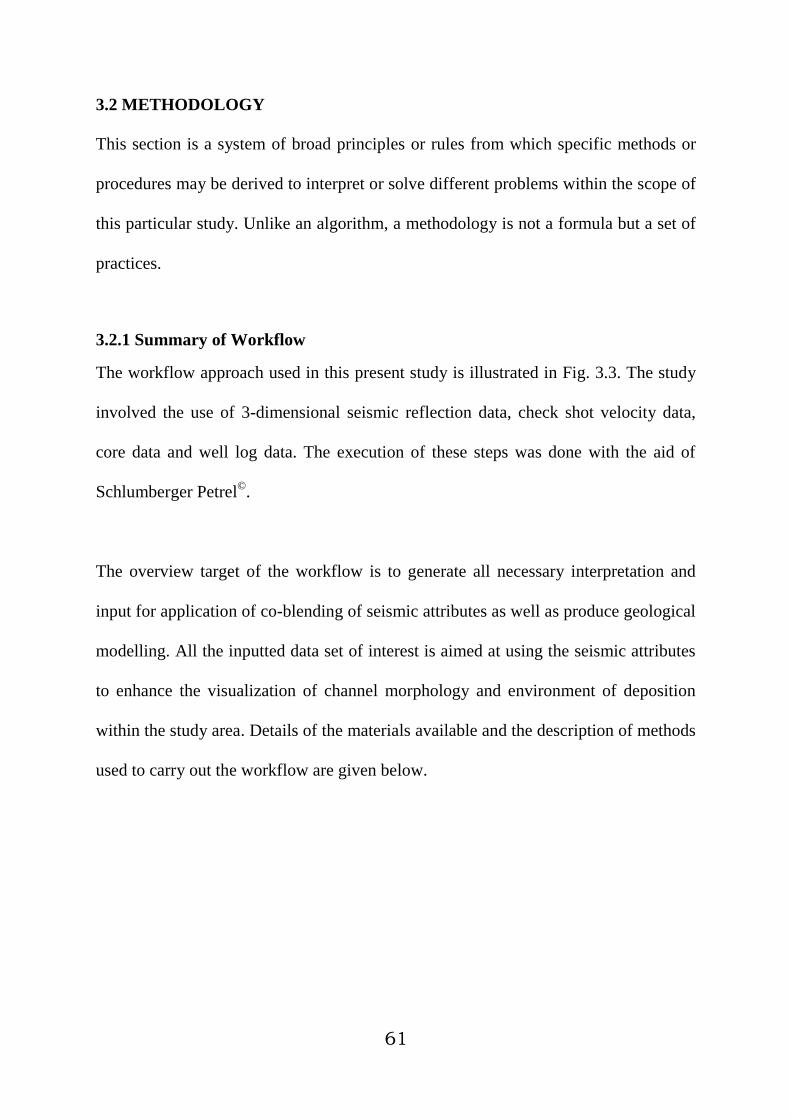
61
3.2 METHODOLOGY
This section is a system of broad principles or rules from which specific methods or
procedures may be derived to interpret or solve different problems within the scope of
this particular study. Unlike an algorithm, a methodology is not a formula but a set of
practices.
3.2.1 Summary of Workflow
The workflow approach used in this present study is illustrated in Fig. 3.3. The study
involved the use of 3-dimensional seismic reflection data, check shot velocity data,
core data and well log data. The execution of these steps was done with the aid of
Schlumberger Petrel©.
The overview target of the workflow is to generate all necessary interpretation and
input for application of co-blending of seismic attributes as well as produce geological
modelling. All the inputted data set of interest is aimed at using the seismic attributes
to enhance the visualization of channel morphology and environment of deposition
within the study area. Details of the materials available and the description of methods
used to carry out the workflow are given below.

62
Fig. 3.3: Research Workflow
Project Set Up in Petrel Software
for Interpretation
Data Quality Check
Well to Seismic Tie
Well Correlation Seismic Volume Well Normalization
Seismic Interpretations
Petrophysical
Analysis
Structural Interpretation Seismic Facies Analysis
Volumetric Analysis
3D Structural Modelling
Application of Single Attributes
Co-blending of
Seismic Attributes
Depositional Modelling
Horizon
Interpretation
Mapping of Stratigraphic
bodies like Channels and IVF
Identification of
Depositional Environment
Reservoir Modelling
and Characterization

63
2.10.2 Application Software (Schlumberger Petrel)
Petrel is a window-based software application which covers a wide range of
workflows from seismic interpretation to reservoir simulation. The basic principle of
Petrel integrated solution is that geophysicists, geologists and reservoir engineers can
move just across domains within one software application, rather than moving
between different software applications. One of the key benefits of integrated
solutions such as Petrel is the elimination of import and export problems and
encouragement of parallel working procedure against a serial workflow approach.
Moreover this type of solutions promotes and encourages collaboration between
different domains.
3.2.3 Well correlation
Well correlation was carried out in the dip direction in order to reveal the structural
features of the Rence field during interpretation. Mapping of various well tops well
data was first taken to subdivide the section of interest into packages made up of
sequences or parasequences. Then, identification of the mega reservoirs and structural
features were done. Also, the mapping of channels within the well logs, precisely at
the mega reservoir was also done. Finally, the biofacies or lithologic units of the area
will be obtained.
3.2.4 Well log responses
Mapping of well log responses on the gamma ray log data across the study area was
carried in other to reveal the depositional features prominent as well as to give a guide

64
during detailed seismic facies analysis. Channel features will be traced and deduced
from the well log responses. At this point, It should be noted that no single
environment has a unique grain-size profile, and similar profiles may be produced by
different environments. Therefore, profiles should be interpreted with as much
supplementary data as possible.
3.2.5 Well to Seismic Tie
The usual way of tying log and seismic data is through the generation of synthetic
seismograms. These "synthetics" are created by using sonic and density logs to
generate acoustic impedance logs, then converting to reflection coefficients. The
reflection coefficients are then convolved with a wavelet that matches the frequency
and phase characteristics of the seismic data. The resultant zero-offset synthetic is
considered to be what the seismic data should look like for a stacked seismic trace that
corresponds to the borehole location.
The tying of log and seismic data was carried out within the study area through the
generation of synthetic seismograms. These "synthetics" are generated by using sonic
and density logs to generate acoustic impedance logs, then converting to reflection
coefficients. The reflection coefficients are then convolved with a wavelet that
matches the frequency and phase characteristics of the seismic data. The resultant
synthetic is considered to be what the seismic data should look like for a seismic trace
that corresponds to the borehole location. The quality of the log data obviously plays a
key role in determining what the synthetic looks like. One of the key needs when tying

65
logs to seismic data is having a means of converting from time to depth units. In this
study, checkshots data were used to generate a velocity model.
3.2.6 Reservoir Petrophysics
The petrophysical analysis was carried out using the well log data. Volume of Shale
was estimated using gamma ray log and corrected to compensate for the
unconsolidated sand of the Tertiary Niger Delta. Porosity was calculated using both
density and sonic logs and then the log porosity values were calibrated using the core
data from wells.
Shale Volume (Vsh)
The Gamma Ray Index option was employed to determine the percentage of shale and
implicitly, the dominant lithology. This was achieved by determining the shale base
line from Gamma Ray logs. Correction was made on the gamma ray index to
compensate for the unconsolidated sand of the Niger Delta (Tertiary). The volume of
shale was calculated using equations 3.1 (Schlumberger, 1974):
3.1
Where,
logGR = GR of formation measured from log; minGR = Least GR in zone of interest.
maxGR = Maximum GR reading in formation of interest, Igr = Gamma Ray Index.

66
For the purpose of this project work, Larionov’s (1969) volume of shale formula for
Tertiary rocks was used below:
0.12083.0 )7.3( IgrshV 3.2
Where,
Igr = Gamma Ray Index; shV = Volume of Shale.
Porosity
The porosity was estimated from both the density and sonic logs. The effective
porosity was deduced by introducing the shale volume percentage into the equation.
The equations below were used for porosity estimation according to (Schlumberger,
1974):
fluidma
bmaD
3.3
log
log
t
ttC
Sma
3.4
Where,
ɸD = Density log porosity; ma = Matrix density; b = Bulk density log reading
f = Fluid density; Δtlog = sonic log reading; Δtma = interval transit time of the
matrix material; C = Empirical correlation factor and matrix density = 2.65(g/cm3)
fluid density = 1.0(g/cm3).

67
Net-to-gross ratio (NTG)
This refers to the proportion of clean sand to shale within a reservoir unit. The gross
sand is the whole thickness of the reservoir; the non-net sand is the shaly sequences
within the whole reservoir thickness; the net sand is thus obtained by subtracting the
non-net sand from the gross sand. The Net-to-gross ratio reflects the quality of the
sands as potential reservoirs. The higher the NTG value, the better the quality of the
sand.
NTG = Net sand / Gross sand 3.5
Net sand = gross sand – shaly intervals 3.6
Water and hydrocarbon saturation
The water and hydrocarbon saturations are much related. In this research work, water
saturation was derived using Archie’s equation (Archie, 1942)for water saturation in
consolidated zone:
3.7
3.8
Where,
Sw = water saturation; Rw = resistivity in the water leg (that is resistivity of formation
water); Rt = true formation resistivity derived from the deep induction resistivity log;
Ø= porosity; n = saturation exponent usually taken as 2.0; m = cementation factor
(2.0); a = consolidation factor/tortuosity (0.62).

68
Bulk volume of water (BVW)
This is the product of water saturation and porosity corrected for shale (Adepelumi et
al., 201; Asquith and Krygowski, 2004):
3.9
Where BVW = bulk volume of water; Sw = water saturation; Фe = effective porosity.
If values for BVW calculated at several depths within a formation are coherent, then
the zone is considered to be homogeneous and at irreducible water saturation. It
follows therefore that hydrocarbon production from such zone should be water free
(Peter and Peter, 2013).
Permeability
This is a measure of the ease with which a fluid (gas, oil or water) flows through
connecting pore spaces of reservoir rock. It is very important in predicting the rate of
production from a reservoir. Permeability was calculated using Timur’s equation
(Timur, 1968) as follows;
3.10
Where, k = permeability (millidarcy); Swirr = irreducible water saturation
3.2.5 Oil-Water Contact (OWC)
Oil-water contact is a bounding surface in a reservoir above which predominantly oil
occurs and below which predominantly water occurs. Although oil and water are
immiscible, the contact between oil and water is commonly a transition zone and there

69
is usually irreducible water adsorbed by the grains in the rock and immovable oil that
cannot be produced. The oil-water contact is not always a flat horizontal surface, but
instead might be tilted or irregular. Measurements of both the areal closure and the
distance from the apex to the lowest closing contour are typically incorporated in
calculations of the estimated hydrocarbon content of a trap. The area of oil closure is
calculated according to Schlumberger (1968) which used grids line with respect to the
scale of the map. However, the oil-water contact was measured in the study area using
the following calibrations:
Areas with low acoustic impedance, low volume of shale, low water saturation
and high porosity will depict oil sand, while
Areas with high acoustic impedance, high volume of shale, high water
saturation and low porosity will depict water sand.
3.2.6 Volumetric Estimation of Oil
The volumetric method entails determining the physical size of the reservoir, the pore
volume within the rock matrix, and the fluid content within the void space. This
provides an estimate of the hydrocarbons-in-place, from which ultimate recovery can
be estimated by using an appropriate recovery factor. The reserve for the H-horizons
mapped within the study area was estimated using oil volumetric calculations initiated
by various petroleum geologists (Dean, 2007; Etris and Stewart, 2003; Obah et al.,
2012 and many more) and they are shown as follows:

70
Rock Volume (VR) (acre feet) = A* h 3.11
OOIP = (7758*VR*Sh* Ø*NTG) 3.12
STOOIP = (OOIP*Boil) 3.13
Where:
OOIP = oil originally in place; STOOIP = stock tank oil originally in place
A = Drainage area, acres; h = Net pay thickness, feet;
7,758 = API Bbl per acre-feet (converts acre-feet to stock tank barrels)
Ø = Porosity, fraction of rock volume available to store fluids
Sw = Volume fraction of porosity filled with interstitial water
Sh = Hydrocarbon saturation
Boil = Formation volume factor for oil = (0.81/ Ø2); 1 acre = 43,560 sq. ft.
3.2.7 Normalization of Gamma Ray Log
GR Log normalization was carried out because each well drilled has different
characteristics that causes well deviation of one well from another. Such
characteristics include variation in sizes of hole due to various sizes of drilling bits,
viscosity of the drilling mud varies as a result of different geologic formations
encountered, drilling gauge are not the same at every well and well log drilled have
different fluid content. Hence, three wells went out of range in the study area namely,
well-2, well-3 and well-4.

71
Certainly, a normalized GR Log should coincide with the reference shale base line of
the GR Log. The reference shale baseline for GR log within the study area is
approximately 75API (American Petroleum Industry).
SBLN GRGR (3.14)
Where, GRN = normalized Gamma Ray Log and GRSBL = Shale base line for Gamma
Ray Log.
Also,
x *W N GRGR (3.15)
Where, GRW = Gamma Ray Log of well to be normalized; x = normalizing factor
Combining equations (3.14) and (3.15) as well as solving for x , we have:
W
GR
SBLGR
x
(3.16)
3.2.8 Seismic Data Interpretation
The seismic sections through the field were interpreted structurally and strigraphically
for hydrocarbon exploration uses. Seismic data interpretation involves horizon and
fault interpretation as well as generation of time-structure maps. Key continuous
horizons and faults were interpreted on 3D seismic data in both in-line (Line) and
cross-line (Trace) directions.
The Seismic data interpretation carried out in the study area entails the identification
of the structural geometry of the reservoir and the geologic boundaries of the field,

72
extracting the structural framework of the reservoirs and creation of velocity model of
the field for the purpose of depth conversion. All these will help in generating all
structural and rock physics input for the static modeling of the reservoir.
3.2.9 Reservoir Characterization
Reservoir characterization was carried out in order to delineate the key horizons and
faults within the study area as well as to identify the major reservoir for an effective
hydrocarbon generation and exploration. Reservoir characterization essentially refers
to all the pertinent information that is required to describe a reservoir in terms of its
ability to store and produce hydrocarbons. This entails knowing the complete reservoir
architecture including the internal and external geometry, its static model with
distribution of reservoir properties (such as porosity, permeability, hererogeneity, net
pay thickness, etc.), and understanding the fluid flow within the reservoir (dynamic
model). This information help improve production rates, rejuvenate oil fields, predict
future reservoir performance, minimize costly expenditure, and help the managements
of oil companies to draw up accurate financial models.
It is worth knowing that reservoir characterization integrates the technical disciplines
of geology, geophysics, reservoir engineering, petrophysics, economics and data
management. The success of the reservoir characterization effort depends on how well
the integration of the above disciplines is carried out, an elusive goal in some cases,
and the success of each project could vary.

73
3.2.10 Generation of Seismic Attributes
Eight single seismic attributes such as average energy, root-mean-square (RMS)
amplitude, instantaneous frequency, reflective acoustic impedance, iso-frequency,
dominant frequency, signal envelope (reflection strength) and coherence attributes
were used for interpretation in the study. Application of these single attributes on the
geoprobe from interpreted 3D seismic data have very low impact in the visualization
of channel and depositional features.
3.2.11 Co-blending of Seismic Attributes
Co-blending of seismic attributes was done for clearer images; in order to aid envisage
the channel outline and structural geometry. The channel morphology is related to an
amalgamation of depositional processes and environment. The enhanced channel
image of co-blended attributes compensates for poor visualization by single attributes
only. Meanwhile, Co-blending of seismic attributes means to blend two or more
seismic attributes into a single and unified data display.
Actually, four sets of co-blending were carried out: (a) co-blending of Signal
Envelope and Dominant Frequency Attributes (b) co-blending of Reflection Acoustic
Impedance and RMS Amplitude Attributes (c) co-blending of Reflection Acoustic
Impedance, Instantaneous Frequency and Average Energy Attributes (d) co-blending
of Reflection Acoustic Impedance, Iso-frequency and Coherency Attributes.

74
3.2.12 Seismic Facies and Stratigraphic Analysis
The seismic sections of the field were interpreted for seismic facies analysis. The
seismic facies units were defined from reflection configuration patterns, continuity,
amplitude and other attributes as well as their boundary conditions. The analysis of
seismic facies along with stratigraphic development from seismic character was also
carried out. These facies were related to the associated well log character. The
interpreted seismic facies sequence concurs with that recognized by previous workers
in other basin.
3.2.13 Depositional Model
A depositional model was created by integrating all the necessary interpretations. It is
good to note that sediments are transported and deposited in a variety of depositional
environments. On land, sedimentary environments include stream flood plains,
swamps, dunes and desert basins. Along the coastal regions sediments accumulate in
river deltas, lagoons, beaches, and barrier islands. Most sediment ultimately come to
rest in the ocean, accumulating in massive deposits that form the continental shelves,
or continuing to the deep basins beyond the continental shelf margin.

75
CHAPTER FOUR
RESULTS AND DISCUSSION
4.0 INTRODUCTION
This chapter presents the results obtained from the log interpretations, seismic
interpretations, co-blending of seismic attributes and the geologic interpretations
within the Rence field. Rence field was characterized using 3D Seismic Volume; well
logs from 9 wells and checkshots. Core permeability data from five wells were also utilized
in the study.
4.1 RESULT OF WELL INTERPRETATION
4.1.1 Result of Log Normalization
Before well interpretation, the wells within the field must be normalized due to human
error during or after data collection and to normalize those shift wells that went out of
range to their natural point. Gamma ray log normalisation was carried out on three (3)
wells within the Rence field namely: Rence 2, 3 and 4 using Rence 7 Gamma ray log
as the calibration log. Fig. 4.1 shows clearly the shifted wells that went out of range.
Using equation (3.15), the three (3) that went out of range were normalized:
At well 3 and 4, putting GRW = 110API and GRSBL =75API into equation (3.16), the
normalizing factor ( x ) obtained is 0.6818.
Also, for well 2, putting GRW = 61API and GRSBL =75API into equation (3.16), the
normalizing factor ( x ) obtained is 1.2295.
The normalizing factors obtained are used to multiply the respective wells that went
out of range. The results of the above equations are shown clearly in Fig. 4.2.

76
Fig. 4.1: Distribution of GR logs in Rence Field before Normalization

77
Fig. 4.2 Distribution of GR logs in Rence Field after Normalization

78
Fig. 4.3 is the GR Ray Log cut for lithology description within the Rence field. The
result was achieved from normalization of the log which yields a bimodal distribution
and estimation of the lithology using the equation below:
Lithology= if(GR<T, 0, 1) 4.1
Where,
GR = Gamma Ray Log value; T = Statistical value; 0 = Shale; 1 = Sand
Estimation of the median (from the nine wells) = (Total Range of the data)/2
= 150/2 = 75 API
Where, API means American Petroleum Institute
Using the equation 4.3 gives:
Lithology= if(GR<75, 0, 1)
Estimation of the mean (from the nine wells) = 69.22 API
Using the equation 4.3 gives
Lithology= if(GR<69.22, 0, 1)
Application of bimodal classification = 66 API
Using the equation 4.3 gives
Lithology= if(GR<66, 0, 1)
The results of all these calculations are shown in Fig. 4.3 and the most acceptable in
this research work is the mean estimation as shown in Fig.4.3. It shows two facies
variation namely shale and sand.

79
Fig. 4.3: Gamma ray log cut off for lithology description in Rence Field
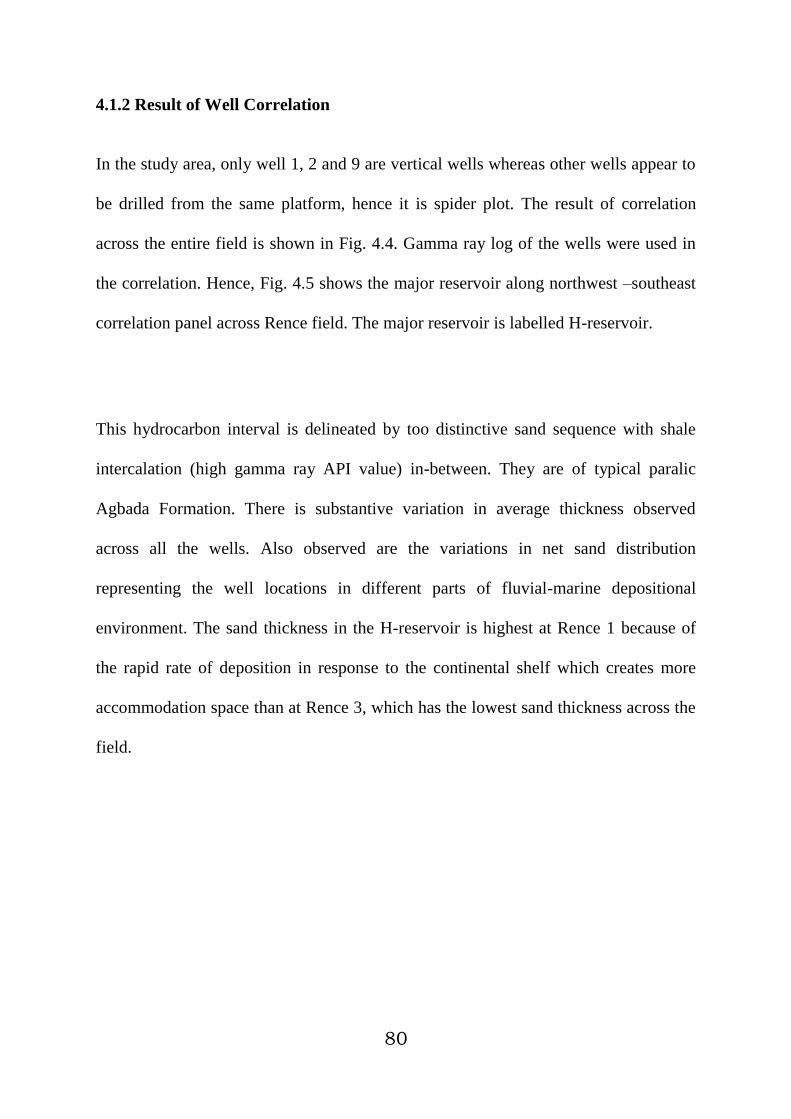
80
4.1.2 Result of Well Correlation
In the study area, only well 1, 2 and 9 are vertical wells whereas other wells appear to
be drilled from the same platform, hence it is spider plot. The result of correlation
across the entire field is shown in Fig. 4.4. Gamma ray log of the wells were used in
the correlation. Hence, Fig. 4.5 shows the major reservoir along northwest –southeast
correlation panel across Rence field. The major reservoir is labelled H-reservoir.
This hydrocarbon interval is delineated by too distinctive sand sequence with shale
intercalation (high gamma ray API value) in-between. They are of typical paralic
Agbada Formation. There is substantive variation in average thickness observed
across all the wells. Also observed are the variations in net sand distribution
representing the well locations in different parts of fluvial-marine depositional
environment. The sand thickness in the H-reservoir is highest at Rence 1 because of
the rapid rate of deposition in response to the continental shelf which creates more
accommodation space than at Rence 3, which has the lowest sand thickness across the
field.

81
Fig. 4.4a: A northwest –southeast correlation panel across Rence field for all the wells

82
Fig. 4.4b: A northwest –southeast correlation panel across Rence field for 8 wells

83
Fig. 4.5: Major reservoir correlation panel across Rence field

84
4.1.3 Result of Well Log Responses
Within the field, five general log signatures (Fig. 4.6) are defined over the stratigraphic
intervals ranging from several tens to hundreds of feet thick as follows:
(a) Bell shape: A gradual upward increase in gamma-ray response. This trend
may reflect upward fining (for example a lithology change from sand to
shale) or upward fining of sand beds in a thinly bedded sand-shale unit. This
trend usually implies a decrease in depositional energy. In a shallow marine
setting, this trend usually reflects an upward deepening and a decrease in
depositional energy (shoreline retreat).
(b) Funnel Shape: A gradual upward decrease in gamma-ray response. In shallow
marine settings, this trend reflects a change from shale-rich into sand-rich
lithology and upward increase in depositional energy with shallowing-upward
and coarsening.
(c) Symmetric patterns defined by initial gradual decrease and then increase in
gamma-ray values interpreted to record a gradual coarsening and then gradual
fining of deposits.
(d) Blocky intervals defined by abrupt decrease in gamma-ray value overlain by
an interval with uniformly low values. This trend has low gamma values and
sharp boundaries with no internal change.
(e) Serrated patterns defined by intervals with high gamma ray values.

85
Fig. 4.6: Typical Gamma Ray log patterns of the study area

86
4.1.4 Result of Well to Seismic Tie
The well to seismic profile indicates zero phase shift and SEG normal polarity wavelet
(Fig. 4.7). The wavelet enveloped spectrum shows a dominant frequency of about 25
Hz. Radial wells seismic were extracted around each well and they were used to
match the synthetic to the seismic data.
Finally, a complete synthetics package for each well was generated as a result of the
seismic modeling process (Figs. 4.8 and 4.9). Fig. 4.8 shows the synthetic seismogram
generated at wells 1 and 2 in the Rence field, with all the inputs to this process while
Fig. 4.9 shows the well to seismic matching (shifting) at some of the wells. Synthetics
seismograms are normally not exact match to the seismic. In order to match the
generated synthetic Seismograms to the seismic trace, minor stretching and squeezing
are required until an acceptable level of match is reached. This was achieved by
manual adjustments to match the conspicuous event in the well (picks and troughs)
with their corresponding seismic events. In Petrel©,
adjustments of the synthetics need
to be done with the help of the formation tops generated from well correlation
(Appendix I).
More so, well to seismic ties in Fig. 4.9 revealed that high amplitude reflection events
(bluish colour) correspond to sand units, whereas, low amplitude reflection events
(yellowish colour) correspond to shale units.

87
Fig. 4.7: Rence seismic wavelet profile extracted from Rence-1 well
Fig.4.8a: The synthetic seismogram of the Rence field at well 1

88
Fig.4.8b: The synthetic seismogram of the Rence field at well 2
Fig. 4.9: The well ties posted on a seismic section within the Rence Field

89
4.2 RESULT OF SEISMIC STRUCTURAL INTERPRETATION
A detailed study of seismic structural interpretation in this project (Fig. 4.10)
includes: the definition of reservoir geometry and the geologic boundaries of the field,
extracting the structural framework of the reservoirs and creation of velocity model of
the field for the purpose of depth conversion. These will help in generating all
structural and rock physics input for the static modeling of the reservoir.
4.2.1 Fault interpretation
Fig. 4.11 shows the result of the structural interpretation of the 3-D seismic data of the
study area. The interpreted seismic sections show the mapped horizons and faults.
Sixteen faults were mapped all through the 8-inlines and 11-crosslines within the
study area. The faults have curved concave-upward fault planes in down dip direction.
Their slope progressively decreases until they became horizontal or flat, which is
synonymous with growth faults.
Four major regional faults and twelve minor faults were interpreted. Seven of the
faults are antithetic and dips landwards to the continent while the rest are synthetic
faults dipping basin ward. Some of the faults were interpreted as back-to-back
counter-regional faults. These fault domains are associated with mud diapirs. They
include shale ridges and massifs shale overhangs as well as vertical mud diapirs that
form mud volcanoes. Sedimentologically, this pattern of faulting exists were the rate
of sediment supply and deposition are more or less equal to the subsidence and
accommodation space.

90
Fig. 4.10: Structural Configuration of the Rence Field
Fig.4.11: Seismic interpreted section on trace 13900 of Rence field

91
Regular spacing and simplicity of the structures are within the structural styles that
characterize the Northern depobelt of the Niger Delta.
In the Niger Delta deltaic system however, this type of faulting are mainly found
within the delta front environment, where the deposition of channel lobes cause the
Akata Formation to buckle up. It is also evidently seen in the aggradational stacking
pattern associated with the gamma ray logs from wells within the Rence Field. The
regional faults form both the northern and southern boundaries of the field while the
major fault at the centre of the field separated the field into two blocks (Fig. 4.11).
4.2.2 Horizon Interpretation
The seismic event (pick) corresponding to the top of the reservoir was identified using
the well tie as a guide to recognizing the event. The H top horizon was mapped across
the study area using a 10 x 10 m grid of in-lines and cross-lines (Fig. 4.11). The
horizon shows continuity of reflection with relatively uniform amplitude and
frequency. Areas that require more detailed examination were mapped using smaller
grids. The benefit of using a composite line section at the start of the horizon tracking
is to guide the later inline and crossline tracking in areas where well controls are
absent. When the composite line tracking is completed, regular in-lines and cross-lines
were tracked with an increment of 10m.
Loop-tying the horizons in the in-line and cross-line directions helped in reducing
mis-ties that could under/over-estimate the unit’s areal extent. After the manual
horizon picking was concluded, the horizons were auto-picked. The auto-pick

92
operation allowed the software to track events along bedding planes across the entire
seismic volume, using the hand-picked horizons as constraint.
4.2.3 Time Map Generation
The interpreted horizon grids were converted to time structural maps using convergent
gridder algorithm in Petrel. The map generated in time for the top of the interval is
shown in Fig. 4.12. The time-structure maps show the geometry of the basin and
changes in topographic relief through time.
4.2.4 Time to Depth Conversion
The first step to converting a time structural surface is by defining the velocity model.
The estimation of realistic velocity model parameters involves a delicate balance of
well and surface data. Interval velocity is the closest equivalent in the raw data of the
instantaneous velocity used in the velocity modeling process. It was therefore useful
to create and view this data before building the velocity model (Fig. 4.13). A
curvilinear equation (equation 4.4) was generated from the velocity modeling using
regression analysis.
y=0.0001x2 + 1.1346x + 46.6442 (4.4)
Where, y is the measured depth which is the dependent variable
x is the two way travel time which is the independent variable
Interval velocity was used to create the velocity model within the H-Reservoir level.

93
Fig.4.12: Time-structure map of H top reservoir horizon (Contour interval is 30 ms)
Fig.4.13: Rence Field velocity curve.

94
The values were estimated using the time depth relationship (TDR) through the zone
for each well and a single velocity constant value was used. Petrel© employs a
minimum depth error method to estimate this value. Corrections were done using the
well tops correlated across the wells. Using the create model algorithm, it was
possible to convert time objects; including structural maps, 3D seismic volume, 3D
geologic model and seismic attributes to depth (Fig. 4.14).
4.2.5 Result of Reservoir Petrophysics
The Table 4.1 below shows the results of the average petrophysical properties of the
hydrocarbon bearing sands encountered in Rence wells. The results obtained from the
estimation works were calibrated using the available log and core data from the wells.
After the petrophysical attributes were estimated, the hydrocarbon reserve for the H-
horizon mapped was estimated. The petrophysical results include net to gross which
ranges from 0.84 to 0.93 with an average of 0.90 while the volume of shale ranges
from 0.21 to 0.36 with an average of 0.28. Also, the porosity of the identified reservoir
ranges from 0.17 to 0.37 with an average of 0.28 whereas the water saturation ranges
from 0.14 to 0.36 with an average of 0.24.

95
Fig. 4.14: Depth-structural map of H top reservoir horizon (Contour interval is 30 m)

96
Table 4.1: Summary of Petrophysical Properties in the study area for H-Reservoir
Well
Identifer Sand
Top (ft)
TVD
Top of
Sand
(ft)
Bottom
of Sand
(ft)
Bottom
(m)
Gross
(ft)
Net
(ft) NTG
Volume
of
Shale Porosity
Water
Saturation
Rence 1 H 1276.63 1285.63 1483.75 1492.75 207.12 187.12 0.90 0.26 0.28 0.32
Rence 2 H 1329.57 1355.48 1486.36 1512.30 156.82 141.82 0.90 0.21 0.17 0.25
Rence 3 H 1265.70 1581.24 1307.19 1648.61 67.37 62.37 0.93 0.19 0.31 0.33
Rence 5 H 1264.55 1324.45 1419.17 1519.06 194.61 174.61 0.90 0.32 0.33 0.14
Rence 6 H 1289.72 1561.42 1484.43 1854.88 293.46 268.46 0.91 0.27 0.37 0.18
Rence 7 H 1269.07 1355.56 1436.42 1540.16 184.60 164.60 0.89 0.29 0.23 0.36
Rence 8 H 1280.50 1543.83 1280.50 1790.85 247.02 217.02 0.88 0.33 0.34 0.14
Rence 9 H 1375.31 1401.22 1536.38 1562.29 161.07 136.07 0.84 0.36 0.23 0.18

97
4.2.6 Result of Volume Estimation
The volume estimation of hydrocarbon in H-reservoir was estimated using the
calculated petrophysical parameters (Table 4.6) and data derived from the depth
structural map (Fig. 14). Thus, the values extracted are:
Area of oil closure (A) = 6088.677 acre
Net pay thickness (h)= 169.0088ft
NTG=0.89375
VSH= 0.27875
Porosity (Ø)= 0.2825
Water saturation (Sw)= 0.2375
Hydrocarbon saturation (Sh)= 0.7625
Formation volume factor for oil (Boil)= 10.14958
Hence, the estimated original oil in place (OOIP) is 47.2 million barrels and estimated
stock tank original oil in place (STOOIP) is 479.4 million barrels.
4.2.7 Result of Oil-Water Contact
Fig.4. 15 shows clearly the oil/water contact which is represented by the blue lines.
Oil bearing sands can be evidently discriminated by the acoustic impedance. High
porosity sands are always characterized by the lowest AI values (Figs. 4.15 and 4.16).
Acoustic differences between Oil Sand clusters are caused by Porosity changes. Wet
lithologies show a common acoustic range. All the Water bearing lithologies

98
Fig.4.15: Multi-graph showing the oil/water contact in the study area

99
Fig.4.16: Petro-Acoustic Analysis showing Oil/Water sand: (a) Histogram of velocity
and frequency (b) Histogram of Density and Frequency (c) Crossplot of AI and
porosity.

100
described in this H-reservoir are characterized by a common Acoustic Impedance
range (AI overlap).
The oil zone have values ranging from 1258m (4063ft) to 1294m (4180ft) at H-
reservoir and the oil/water contact is delineated at the depth of 1294m (4180ft).
Fig.4.16 shows that oil sand have lower acoustic impedance ranging from 4600 to
5450 g/cm3.m/s with the highest porosity of 0.36. But, water sand has higher acoustic
impedance ranging from 5500 to 6150 g/cm3.m/s with the lowest porosity of 0.12.
4.3 RESULT OF SEISMIC ATTRIBUTES
4.3.1 Result of Single Attributes
Eight seismic attributes were particularly used in this study. They include average
energy, RMS amplitude, instantaneous frequency, reflection acoustic impedance, iso-
frequency, dominant frequency, signal envelope/ reflection strength and coherence
attributes. These seismic attributes were generated across the study area and are
shown in Figs. 4.17, 4.18a-d and 4.19a-e. The maps displaying the distribution of the
different facies show depositional morphologies similar to the aerial photography of
modern depositional systems. Application of single seismic attributes on a geoprobe
from interpreted 3D seismic data (Figs. 4.18b-d and 4.19a-e) has very low impact in
the visualization of channel features. Meanwhile, the generation of an amplitude map
(Fig. 4.17) reveals area where there is bright spot which is a good hydrocarbon
indicator.

101
Fig. 4.17: Amplitude map generation for H-Horizon.

102
Fig. 4.18: Individual seismic attribute showing mega channel: (a) Signal Envelope attribute, (b) Instantaneous phase attribute and (c)
Average Energy attribute.

103
Fig. 4.19a: Morphological modelling of geoprobe through coherency attributes
showing mega channel.

104
Fig. 4.19b: Morphological modelling of geoprobe through instantaneous frequency
attributes showing mega channel.

105
Fig. 4.19c: Morphological modelling of geoprobe through reflection acoustic
impedance attributes showing mega channel.

106
Fig. 4.19d: Morphological modelling of geoprobe through iso-frequency attributes
showing mega channel.

107
Fig. 4.19e: Morphological modelling of geoprobe through dominant frequency
attributes showing mega channel.

108
4.3.2 Result of Co-blending Attributes
Co-blending of seismic attributes has proven of particular use in this region. The
results of the Co-blending of various seismic attributes are shown in Fig. 4.20a-d. The
results of the co-blending of seismic attributes reveal the enhancement of visualizing
channel geometry, whereas the surrounding areas are essentially unchanged.
One mega-channel feature is clearly seen in the middle of the attribute maps produced
which runs in east-west direction. This channel exhibits differential compactions, and
the edge of the channel is well defined by co-blending attributes used in this study.

109
Fig. 4.20a: Co-blending of signal envelope and dominant frequency attributes.

110
Fig. 4.20b: Co-blending of reflection acoustic impedance and RMS amplitude
attributes.

111
Fig. 4.20c: Co-blending of reflection acoustic impedance, instantaneous frequency
and average energy attributes.

112
Fig. 4.20d: Co-blending of reflection acoustic impedance, iso-frequency and
coherency attributes.

113
4.4 SEISMIC FACIES AND STRATIGRAPHIC ANALYSIS
The result of the seismic facies and stratigraphic analysis reveals that the study area
can be distinguished into two categories of seismic facies namely layered complexes,
and chaotic complexes (Fig. 4.21a-b). These two categories can be further subdivided
into four distinct seismic facies (see Fig. 4.21 and Table 4.2): (1) mass transport
complexes (MTC), (2) distributary channel and lobe complexes (DCLC), (3)
amalgamated or accretionary channel complexes (ACCs), and (4) drape complexes
(DCs).
4.4.1 Mass Transport Complexes
The mass transport complexes in the study area are mostly reflection-free and consist
of chaotic and transparent, low-amplitude, poor continuity seismic reflections. They
correspond to the ‘Bl’ facies of Prather et al. (1998) and consist of a variable lithology
of mud-rich complexes of slumps, slides and debris-flow deposits. At depth, the
MTCs represent the highest volume of sediment, but their thickness is reduced
drastically up section. The MTCs are very erosive. They eroded part or all of the
underlying drapes, part of the underlying distributary lobe and channel complexes,
and part of the amalgamated channel complexes (Fig. 4.20a-b). As a result, the lower
boundaries of MTCs in this area are truncation surfaces. They form the base of
depositional units and bound each depositional cycle.

114
(a)
(b)
Fig. 4.21: Seismic section showing seismic facies recognized in the study area:
(a) crosslines (10800) (b) crosslines (10550).

115
Table 4.2: Characteristics of different facies within the Rence field
Seismic
Facies Seismic Configuration Interpreted Depositional System
Mass
Transport
Complexes
(MTC)
Mainly reflection-free and
consisting of chaotic and
transparent, low-amplitude, poor
continuity seismic reflections
Consists of a variable lithology
of mud-rich complexes of
slumps, slides and debris-flow
deposits.
Amalgamated
Channel
Complexes
(ACC)
They are distinguished based on
characteristic chaotic,
discontinuous, high-impedance
seismic reflections.
Due to the associated seismic
character, it could be suggested
that ACCs consist of coarser-
grained sands than DLCs, which
are usually deposited further
basinward.
Distributary
Channel and
Lobe
Complexes
(DLC)
DLCs are made up of layered,
continuous, high-impedance
seismic reflections. Coarse-grained sands
Drape
Complexes
They are characterized by high or
low impedance, laterally
continuous seismic reflections that
can be traced for a long distance.
DCs are very mappable seismic
reflections
Mostly of clay-rich shales or
marl (foraminifera-rich
calcareous clay) (DC)

116
4.4.2 Distributary Channel and Lobe Complexes (DLCs)
DLCs are made up of layered, continuous, high-impedance seismic reflections. Well
logs and core data have proved DLCs to be the most sand-prone facies in other basins
(Prather et al., 1998). This conclusion is also plausible for the study area, due to the
high-impedance, layered nature and continuity of seismic reflections associated with
this facies. DLCs correspond to the ‘Cbh’ facies of Prather et al., (1998), and are
mostly restricted to topographic depressions in the study area (Fig. 4.21).
4.4.3 Amalgamated or Accretionary Channel Complexes (ACCs)
Amalgamated or accretionary channel deposits are seismic facies recognized in the
study area. Amalgamated channel or accretionary channel complexes are
distinguished based on characteristic chaotic, discontinuous, high-impedance seismic
reflections. Although MTCs also have chaotic, discontinous seismic reflections, the
high impedance reflectors are absent within MTCs. The ACCs occur in two forms in
the study area: (1) lateral accretionary channel complexes developed as a result of
channels constantly shifting positions, and (2) vertically stacked channel deposits
formed due to stacking of rejuvenated channels over older channel deposits. ACC fills
are often mounded in external geometry (Fig. 4.21a-b), and represent the ‘Bh’ facies
of Prather et al., (1998). Due to the associated seismic character, it could be suggested
that ACCs consist of coarser-grained sands than DLCs, which are usually deposited
further basin ward.
4.4.4 Drape Complexes (DCs)
Drape complexes are characterized by high or low impedance, laterally continuous
seismic reflections that can be traced for a long distance. DCs mostly consist of clay-

117
rich shales or marl (foraminifera-rich calcareous clay). DCs are very mappable
seismic reflections, some of which are interpreted as horizons due to their lateral
continuity (Fig. 4.20a-b). DC is the equivalent of the D/E facies of Prather et al.,
(1998).
4.5 CHANNEL SYSTEM AND DEPOSITIONAL ELEMENTS DISTRIBUTION
Using the available data set and the results of seismic attributes application, one mega-
channel and many minor channels are easily distinguishable within the study section
(Figs. 4.22a-b and 4.17-4.21). From the interpretation of the seismic attributes maps
generated, it was noted that channel pattern and morphology are consistent for up to
40 ms.
The morphology of the channels varies, and so do the architectural elements
associated with the channels. Mega channel was actively filled (that is, channels were
filled with sediments and abandoned as a result of the filling), whereas minor channels
were passively filled (meaning sediments gradually filled the channel while fluid still
flowed in it). This section provides descriptions of the channels (Fig. 4.22a-b). Using
an average velocity of 2260 m/s within the study area, the channel geometries of the
Rence field were estimated (Table 4.3). The channel runs from the east-west beyond
the study area. Seismic character of the meander loop/overbank deposits indicates a
very sandy channel fill (Fig. 4.23).
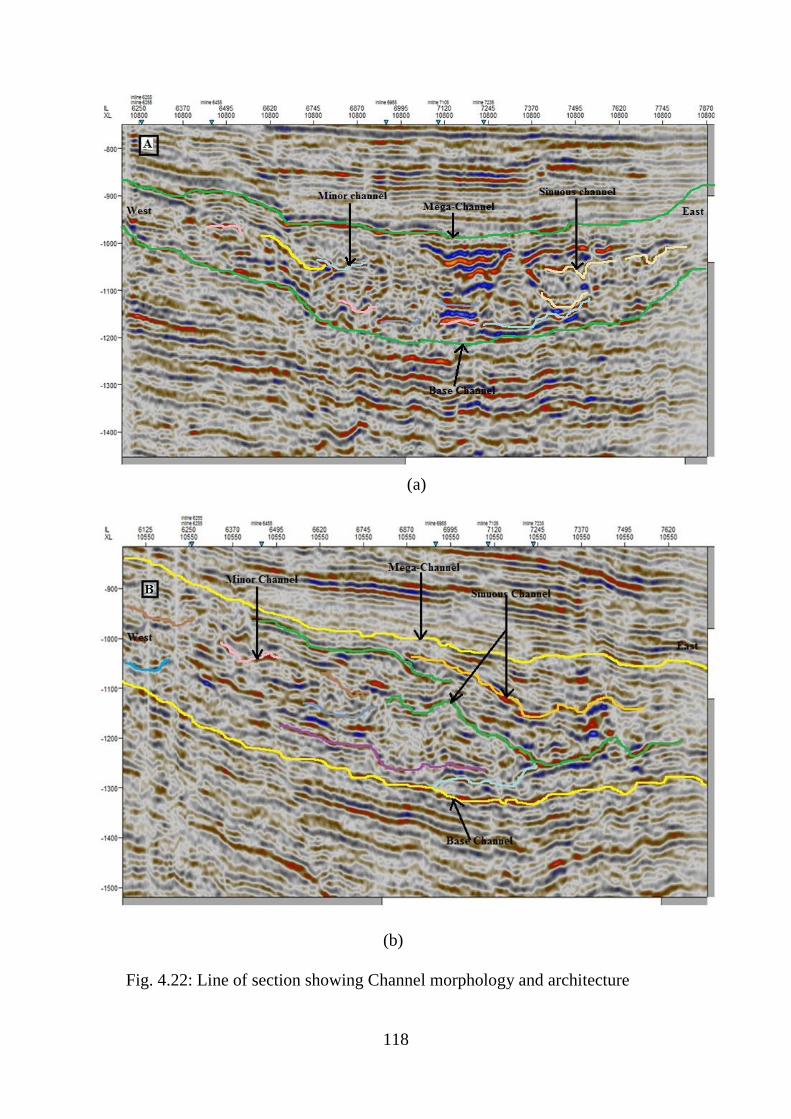
118
(a)
(b)
Fig. 4.22: Line of section showing Channel morphology and architecture

119
Table 4.3: Estimated channel geometries within the Rence field
S/N Channel Parameters Obtained Value
1 Sinuosity 1.3
2 Length 22,500m
3 Distance 17,500m
4 Average Depth 170m
5 Amplitude 1670m
6 Wavelength 7640m
Fig. 4.23: Visible channel resulting from co-blending of reflection acoustic
impedance, coherency and instantaneous frequency

120
4.6 DISCUSSIONS
In this study we are concerned with shallow marine water channels, i.e. those that
occur on the continental shelf of some parts of Niger Delta, Nigeria. Channel sinuosity
is measured as the ratio between the channel axis length and the overall down-channel
distance for a given section of channel. A sinuosity of 1 therefore represents a straight
section of channel, with increasing values representing increasing sinuosity. For the
purposes of this study, a truly sinuous channel is defined as one that displays a
minimum average sinuosity of 1.3. This is comparable to the result obtained by Clark
et al., (1992) and Clark and Pickering (1996). It should be noted that maximum
sinuosities of relatively straight channels may locally exceed 1.3, and also that some
sinuous channels display peak sinuosities well in excess of this value. Different causes
of sinuosity in channels are discussed by Mayall et al., (2006). Hence the channel
sinuosity of 1.3 was obtained in the study area.
Lithologic units were identified on the logs and correlated across the wells. The
stratigraphic cross-sections produced show a general lateral continuity of the
lithologic units across the field. Seismic-to-well ties revealed that, high amplitude
reflection events correspond to sand units, whereas, low amplitude reflection events
correspond to shale units. Closures considered as good hydrocarbon prospects were
identified and delineated. Stratigraphic plays such as pinch-outs, unconformities, sand
lenses and channels are also suspected. The integration of seismic data with well logs
proved to be a useful tool in structural and stratigraphic mapping and in predicting
lateral and vertical variations in the lithologic units.

121
Consequently, the result of petrophysical analysis on the well data showed high
reservoir qualities. The averages for the analyzed parameters are 90% NTG, 28%
porosity, 27% volume of shale, and 24% water saturation; these values by the ranges
of regional petrophysical averages indicate that the reservoir materials are of pay
quality. The stratigraphic correlation of the H level in wells across the field was
integrated with the horizon and fault interpreted on seismic to develop the reservoir
models (Fig. 4.24).
4.6.1 Filling History, Sediment Response and Timing of Structural Growth
Two basic facies assemblages have been interpreted in the study area: (1) partially
confined facies assemblages, and (2) by-pass facies assemblages (Fig. 4.25). The
occurrence of either of the assemblages in the study area depends largely on structural
movement rather than seismic facies association or sediment type. However, some
seismic facies are more common in partially confined facies assemblages than in by-
pass facies assemblages, and vice versa.
Partially confined facies assemblages in the study area consist largely of the lower
mass transport deposits (MTC) that spilled into the basin after a more proximal basin
was filled to spill point. Other facies included in partially confined facies assemblages
are distributary channel and lobe complexes (DLC), amalgamated or accretionary
channel complexes (ACC), remnants of eroded drape complexes (DC), and the lower
part of the overlying MTCs. Generally, a change from partially confined to bypass
facies recorded loss of accommodation space and progradation over captured point
and barrier bars after the basin was filled to equilibrium level. Hence, area with by-
pass facies assemblage should be avoided during oil well drilling.

122
Fig. 4.24a: 3D Reservoir modelling of net to gross (NTG) within the study area
Fig. 4.24a: 3D Reservoir modelling of porosity within the study area

123
Fig. 4.24c: 3D Reservoir modelling of water saturation within the study area
Fig. 4.24d: 3D Reservoir modelling of lithofacies within the study area

124
Fig.4.25: Line of section showing stratal termination, fault pattern and facies
assemblage within the study area.

125
Hence, strata termination patterns methods were used to interpret the filling history,
timing, and the sediment response to structural growth in the study area. This method
is discussed in more detail below.
4.6.2 Stratal Termination Patterns
Stratal termination patterns were interpreted to give an overall idea of the depositional
mechanisms and sedimentation processes prevalent in time and space in the study
area. Strata termination patterns observed in the study area are: (1) onlap, (2) downlap,
(3) toplap, (4) erosional truncation, and (5) internal convergence (Figs. 4.25 and 4.26).
It was observed that baselapping facies are mostly restricted to partially confined
facies assemblages within the study area. Internal convergence is associated with both
partially confined facies assemblages and bypass facies assemblages, whereas toplap
is mainly associated with the transition between partially confined facies assemblages
and bypass facies assemblages.
4.6.3 Depositional Model
Co-blending of seismic attributes has been of significant use in the study area (Figs.
4.27 and 4.28). The maps displaying the distribution of the different facies show
depositional morphologies similar to the sub-aqueous channel depositional
environment. Channel geometries and morphology as well as flood plains can be
inferred from the detailed images, and the sediment nature and its properties can be
predicted based on the depositional model (Adepelumi et al. 2011).

126
Fig. 4.26: Distinct stratal patterns within the study area

127
Fig. 4.27: Multi-well stratigraphic cross-section (Datum: H Reservoir top) showing mega channel within the Rence Field

128
Fig. 4.28: Characterization of the depositional features within the study area

129
Where a well penetrates the fluvial sequence (Fig. 4.27), detailed interpretation of the
petrophysical properties within the borehole and the core data give added calibration
points that significantly increase the reliability of the facies maps.
Using sub-aqueous channel models, the channels were interpreted as being sand-filled
and the sand point bar sequences were interpreted at the flanks of the channels. Fig. 4.28
shows the sand filled point bar lithology, barrier bars and the prominent channel
(indicated by red line) using co-blending of reflection acoustic impedance, instantaneous
frequency and average energy attributes. The red arrow shows a good shoreface which is
prograding upwards (coarsening upward).
Stratal termination patterns on seismic sections, reservoir facies distributions shown by
various seismic attribute maps and reservoir modeling provided information to construct
a depositional and stratigraphic evolution model for the Rence Field, offshore Niger
delta, Nigeria (Fig. 4.29). In this model, the environment of depositions and stratigraphic
structure are shown clearly. They include point bars deposition, abandoned channels,
barrier bars, flood plain and the channel structure. The model indicates that finner
materials are deposited at the bottom while the coarser materials are deposited at the top,
thus the model shows coarsening upward sequence of deposition.

130
Fig.4.29: Idealized diagram of depositional model within the study area

131
4.6.4 Validation – Taking Seismic Time Slice on the attribute Map
A time slice at 1703ms is taking on the best attribute map generated from co-blending of
reflection acoustic impedance, iso-frequency and coherency attributes in order to validate
the efficiency of the method used. The new map produced (Fig. 4.30) indicates that all
the existing wells in the study area are targeting the mega-channel hence confirming that
both structural and stratigraphic traps are necessary for hydrocarbon accumulation.
More so, the result of well correlation showed that delineated H-reservoir
surfaces were not laterally continuous. These truncations were inferred to be
caused by sydepositional faults in the field. These faults also constitute the major
traps for hydrocarbon accumulation.
The Rence structure generally is a well identified culmination controlled to the North by
a major down-to-the-basin growth fault and to the west by a prominent fault (Fig. 4.11).
The azimuth of the identified faults coincides with that of the growth fault which
enhances trapping mechanism for the hydrocarbons (Ologe et al., 2013). Also migration
of oil from the Cretaceous section (Akata Shale) into the reservoirs in the Agbada would
required an intricate faults/fracture network like in the study area.
Gamma Ray Log values and signatures (fining and coar-sening upward signatures) and
the co-blended results helped in determining lithofacies and depositional environments of
the different rock units in the Rence field (Fig. 4.31). The blocky log pattern within the

132
interpreted mega-channel confirms that incised valley fills are common in the study area
based on Allen and Posamentier, (1993) criteria. Also, the serrated nature of the Gamma
Ray Log signature is indicative of tide/wave activity (Emery and Myers, 1996). Bell
shaped log patterns on Gamma Ray Logs indicating increasing clay contents up section
or fining upward trends or an upward increase in gamma ray value is a typical feature of
fluvial channel deposits.

133
Fig. 4.30-: Co-blended Seismic Time Slice showing mega-channel and fault
Fig. 4.31: Integration of Gamma Ray log patterns and seismic facies of the area

134
4.6.4 Hydrocarbon Exploration and Production Significance of Study
The structural features like the extensional growth faults and normal faults determined
the distribution and architecture of reservoir facies in this shallow marine part of the
Niger Delta, Nigeria. There are channels and few sheet reservoir elements identified in
the study area (Figs. 4.17- 4.21, 4.30, 4.31 and 4.32).
4.6.4.1 Channel Elements
The channel elements found within the study area are: (1) meander loop cut-off and over-
bank deposits, (2) lateral accretionary channel deposits and (3) vertical accretionary
channel deposits (Fig. 4.31).
1. Meander loop cut-off and over-bank deposits
Based on seismic character and log sequence, these deposits are interpreted to consist of
relatively coarser-grained sediments. These deposits are found within the meander loop
cut-off that was eventually filled with sand-sized sediments, and the overbank of
channels (Figure 4.31a). In a sandy depositional environment such as the study area, this
facies can form important reservoir targets.
2. Lateral accretionary channel deposits
These deposits formed as a result of channels frequently changing their positions due to
high sediment volume. These sediments were deposited within the channel axes before
they were abandoned for areas of lower elevation. These channel deposits are laterally
amalgamated (Fig. 4.31b) and could form major reservoir targets in a sandy system such

135
as the study area. Using both thickness and lateral extent, lateral accretion deposits are
the second largest of channel reservoir deposits.
3. Vertical accretionary channel deposits
This is similar to lateral accretionary channel deposits but it consists of amalgamated
channel deposits. The difference, however, is that vertical accretionary channel deposits
are made up of individual channels vertically stacked on top of each other (Fig. 4.31c).
Using thickness and lateral extent, the vertically stacked channel deposits are
volumetrically the largest of all channel deposits. When formed in a very sandy system
like the study area, such deposits can form major reservoir.

136
Fig. 4.32: Channel reservoir elements within the study area (a) meander loop cut-off
and over-bank deposits, (b) Lateral accretion deposits, (c) Vertical accretion deposits.

137
4.6.4.2 Hydrocarbon Implication of H-Reservoir Amplitude Thickness Map
The amplitude thickness map computed on H-horizon using acoustic impedance
threshold equal to 5000 units is very conservative and useful in showing the main
thickened areas (Fig. 4.33). The maximum thickness can be found in the southern part of
the study area which pave way for high hydrocarbon accummulation than the north-
eastern area is characterized by very low thickness values.
The petroleum in the study area is produced from sandstones and unconsolidated sands
mainly in the Agbada Formation of Pliocene in age (Tuttle et al., 1999). Then, the
reservoirs identified across the study area occurred within the Pliocene age. They are
often stacked and range in thickness from 15 m to 45 m thick (Evamy et al., 1978). The
thicker reservoirs across the nine wells likely represent composite bodies of stacked
channels within the study area. The targeted reservoir in the wells (Fig. 4.5), which are
stacked channel sands has been confirmed by the attribute maps generated (Fig. 4.20).
Based on reservoir quality and geometry in the Rence Field, the most important reservoir
types are the point bars of distributary channels and barrier bars intermittently cut by
sand-filled channels which host the hydrocarbon accumulation in the area.
Certainly, the hydrocarbons generated in the Akata Formation definitely migrated up dip
through growth faults that were identified in the study area in order to accumulate in
shallow reservoirs of the Agbada Formation within the study area (Rence field).

138
Fig. 4.33: Amplitude thickness map of H-Reservoir

139
The Akata Shale is present in large volumes beneath the Agbada Formation and is
volumetrically sufficient to generate enough oil for a world-class oil province such as the
Niger Delta (Stacher, 1995).
By the application of co-blending techniques, mapping channels and depositional features
becomes possible such that it is easier to delineate the depositional environment and
interpret prospective hydrocarbon potential areas such as channel levees, barrier bars,
point bars, distributary channel fills, and vertical accretionary channel deposits within the
study area. Also by mapping the channel geometries such as sinuosity, length, depth,
amplitude, wavelength and special relation of meandering channels from the attribute
maps generated, it can be concluded that the channel fills within the Rence field are sand
prone which is a major target for hydrocarbon accumulation and it is supported by Liu
and Marfurt (2006) and Naseer, T.M., et al. (2014).

140
CHAPTER FIVE
SUMMARY, CONCLUSION AND RECOMMENDATION
5.1 CONTRIBUTION TO KNOWLEDGE
The major contributions to knowledge in this research work are:
In the past, hydrocarbon exploration had centred on the traditional prospecting for
structural traps alone. Presently, prospects are more often defined by stratigraphic
traps such as channels, incised valley fills, barrier bars and pinch-out. The
particular interpretational advantage emphasized in this study is the additional
value obtained by co-blending of seismic attributes. The multi-attributes seismic
characterization had displayed superior images of the channels because co-
blending improves imaging of geological structures and strongly defines the
depositional environment. The enhanced channel image of co-blended attributes
compensates for poor visualization of the channel by single attributes only.
As far as Niger Delta Basin is concerned, only three distinct seismic facies have
been identified namely mass transport complexes (MTC), distributary
channel/lobe complexes (DLC) and drape complexes. However, the present study
has revealed the extra (fourth) distinct seismic facies named amalgamated or
accretionary channel complexes (ACC). This newly identified seismic facies is
plausible because sand-rich deposits can form major reservoir target.
The study also identified bypassed seismic facies assemblages which are
invariably overpressured zones. These areas are to be avoided during search of
hydrocarbon.

141
The study area is situated within the continental shelf and normally channels are
not supposed to be found on the continental shelf. However, the present study has
been able to identified channel structure within the continental shelf based on their
chaotic pattern, sinusoidal feature and channel geometry. This is an evidence of
major rare processes like storm, tsunami, tidal waves and others.
In the study, a sub-aqueous channel environment have been deduced from the
sinusoidal channel geometry, fining upwards log curves, and other seismic
stratigraphic relationships such as incised valley fills, barrier bars and channels.
Importance of tectonics is also suggested by the mega-channel and incised valley-
fill (IVF) running east to west (E-W), which conforms to the EW-trending graben
and growth fault in Niger Delta.
The findings of this work will be applicable to nearby active areas in the region as
well as other areas that exhibit similar challenges such as the Gulf of Mexico
Basin.
5.2 SUMMARY
This research work is summarized as follows:
The integration of seismic data with well logs is plausible in structural and
stratigraphic mapping and in predicting lateral and vertical variations in the
lithologic units. Lithologic units were identified on the logs and correlated across
the wells in the Rence field.

142
Seismic-to-well ties revealed that, high amplitude reflection events correspond to
sand units, whereas, low amplitude reflection events correspond to shale units.
Closures considered as good hydrocarbon prospects were identified and
delineated.
The Rence structure generally is a well identified culmination controlled to the
North by a major down-to-the-basin growth fault and to the west by a prominent
fault (Fig. 4.11). The azimuth of the identified faults coincides with that of the
growth fault which enhances trapping mechanism for the hydrocarbons.
Stratigraphic and seismic facies analysis for this shallow marine basin revealed
that the study area can be distinguished into two categories of seismic facies
namely layered complexes and chaotic complexes.
Seismic facies analysis reveals that the distributary channel and lobe complexes
(DLC) are banked against a normal fault. Higher reflectivity at this location may
be a function of higher sand content and hydrocarbon presence due to sealing fault
properties.
Co-blending of seismic attributes through time slice maps showed that the
morphology of the continental shelf channels changed through time and space. At
depth, the channels are more sinuous, whereas the shallower channels have
relatively lower sinuosity.
Seismic attributes maps revealed that there were shifting in the locations of
barrier bars, caused mainly by the growth fault in the study area. Recognition of at

143
least three reservoir elements with distinct architectural characteristics in the study
area can be used as analog to study deeper prospective levels.
A depositional model generated for this continental shelf basin shows the
environment of depositions and the stratigraphic structure. Using meandering sub-
aqueous model, the channels can be interpreted as being sand-filled and the sand
point bar sequences as being on the channel inner bends.
5.3 CONCLUSIONS
This study reached the following conclusions:
The result of well to seismic ties revealed that, high amplitude reflection events
(bluish colour) correspond to sand units, whereas, low amplitude reflection events
(yellowish colour) correspond to shale units.
Seismic structural interpretation of Rence Field reveals that the study area has four
(4) major regional faults and twelve (12) minor faults. Seven (7) of the faults are
antithetic and dips landwards to the continent while the rest are synthetic faults
dipping basin ward.
Both time and depth maps for the top of the H-reservoir within the Rence field
were generated and the time-structure map shows the geometry of the basin and
changes in topographic relief through time.
The H Reservoir of Rence Feild within shallow marine environment is
petrophysically characterized with average properties of 90% NTG, 28% porosity,

144
27% volume of shale, and 24% water saturation; these values by the ranges of
regional petrophysical averages indicate that the reservoir materials are of pay
quality.
Estimation of the volumetric parameters was possible within the H-reservoir. They
include oil original in place (OOIP) of 47.2 million barrels with stock tank oil
original in place (STOOIP) to be 474.4 million barrel.
The oil/water contact is delineated at the depth of 1294m (4180ft) in the H-
reservoir. Oil bearing sands have lower acoustic impedance values ranging from
4600 to 5450 g/cm3.m/s with the highest porosity value of 0.36. But, water sands
has higher acoustic impedance values ranging from 5500 to 6150 g/cm3.m/s with
the lowest porosity value of 0.12.
Application of the eight (8) seismic attributes on a time slice from the interpreted
3D seismic data of the Rence field really enhanced the visibility of channels. Thus,
the seismic continuity of channels is improved while surrounding areas are
essentially unchanged.
Co-blending of seismic attributes shows the observed sinusoidal shape patterns of
the channel morphology within the Rence field. One mega-channel feature is
clearly seen in the middle of the time slices. This channel exhibits differential
compactions, and the edge of the channel is well defined by co-blending attributes
used in this study.

145
The channel geometries within the study area are 1.3 for sinuosity; 22500m for
length; 17500m for distance; average depth of channel is about 170 m; amplitude
is about 1670 m, and wavelength is as high as 7640 m. The channel runs from the
NW beyond the study area to the SE.
The result of the seismic facies and stratigraphic analysis reveal that the study area
is distinguished into two categories of seismic facies namely layered complexes
and chaotic complexes.
Channels in the study area vary in both morphology and associated depositional
elements. Channel sinuosity was found to generally reduce with decreasing age of
occurrence. Knowledge of channel architectural variation will give an idea of the
type of deposit to anticipate within each shelf channel.
Three different types of reservoir elements were identified in the study area. Three
reservoir elements associated with the channel axis are: (1) meander loop fill and
overbank deposits, (2) lateral accretionary channel deposits, and (3) vertical
accretionary channel deposits. Each of these varies greatly from the other in its
architectural characteristics. Knowledge of these variations as well as
identification of the different elements is paramount to a successful exploration
and development plan.
The depositional model generated for the study area, and for any similar shallow
marine basins shows a good shoreface which is prograding upwards and the
channels can be interpreted as being sand-filled and the sand point bar sequences
as being on the channel inner bends.

146
5.4 RECOMMENDATIONS
Multi-seismic attributes application in mapping structural and stratigraphics traps
within in deep marine environment of Niger Delta, Nigeria.
Application of seismic attributes for delineation of channel geometries and
analysis of various aspects in terms of lithological and structural perspectives of
Agbada Formation, Niger Delta, Nigeria.
Seismic discontinuity for faults and stratigraphic features using coherence cube.
Interpretational applications of spectral decomposition in reservoir
characterization and channel identification.
Curvature attributes and their application to 3-D interpreted horizons.

147
REFERENCES
Adeogba, A.A., McHargue, T.R. and Graham, S.A.; 2005. Transient fan architecture
and depositional controls from near-surface 3-D seismic data, Niger Delta
continental slope: AAPG Bulletin, vol.89, pp. 627-643.
Adepelumi, A. A., Alao, O. A., and Kutemi, T. F.; 2011. Reservoir characterization
and evaluation of depositional trend of the Gombe sandstone, southern Chad
basin Nigeria. Journal of Petroleum and Gas Engineering Vol. 2, no. 6,
pp. 118-131.
Ainsworth, R.B., Sanlung, M., and Duivenvoorden, S.T.C.; 1999. Correlation
techniques, perforation strategies, and recovery factors: An integrated 3-D
reservoir modeling study, Sirikit Field, Thailand. American Association of
Petroleum Geologists, Bulletin, vol. 83, no. 5, p.1535–1551.
Aizebeokhai, A.P., and Olayinka, I.; 2011. Academic Journals Structural and
stratigraphic mapping of Emi field, offshore Niger Delta. Journal of Geology
and Mining Research, vol. 3, no. 2, pp. 25-38.
Allen, G. P. and Posamentier, H. W. (1993). Sequence Stratigra-phy and Facies Model
of an Incised Valley Fill: The Gi-ronde Estuary, France. Journal of Sedimentary
Petrology, vol. 63, no. 3, 1993, pp. 378-391.
Amadi A. N., Olasehinde P. I., Yisa J., Okosun E. A., Nwankwoala H. O., and Alkali
Y. B.; 2012. Geostatistical Assessment of Groundwater Quality from Coastal
Aquifers of Eastern Niger Delta, Nigeria. Geosciences, vol. 2, no. 3, pp. 51-59.
Anakwuba, E. K., Ajaegwu, N. E., Akpunonu, E. O., Obiadi, I. I. and Onyido, C. P.;
2008. 3-D Seismic Interpretation and Overpressure Prediction of Diok Field,
Niger Delta. Proceedings from the 2008 NAPE Conference, pp. 6-10.
Anakwuba, E. K., Ajaegwu, N. E., Akpunonu, E. O. and Obiadi, I. I.; 2010. High-
Resolution Miocene Sequence Stratigraphy of Diok Field, Eastern Niger Delta.
Journal of Mining and Geology, vol. 46, no. 2, pp. 163-171.
Anakwuba, E. K., Onwuemesi, A. G., Anike, O. L., Onyekwelu, C. U., Chinwuko,
A. I. Akachikelu, N. C., Obiadi, I. I., and Yakubu, H. M. (2013). Application

148
of geostatistical seismic inversion in reservoir characterization of Igloo Field,
Niger Delta, Nigeria. Paper presented at the First Near Surface Geophysics Asia
Pacific Conference (NSGAPC). Beijing, China, p. 454-458.
Anakwuba, E.K., Onyekwelu, C.U., and Chinwuko, A.I.; 2015. Integrated Workflow
Approach to Static Modeling of Igloo R3 Reservoir, Onshore Niger Delta,
Nigeria. Interpretation Vol. 3, no. 3, pp. sz1-sz14.
Asquith, G., and Krygowski, D.; 2004. Basic Well Log Analysis: AAPG Methods in
Exploration Series, pp. 6- 16.
Archie, G.E.; 1942. The electrical resistivity log as an aid in determining some
reservoir characteristics. Trans. Am. Inst. Min. Metal. & Petr. Eng., vol. 146,
pp.54-62.
Armentrout, J. M., S. J. Malecek, P. Braithwaite, and C. R. Beeman,1991, Seismic
facies of slope basin turbidite reservoirs, East Breaks 160-161 field: Pliocene–
Pleistocene, northwestern Gulf of Mexico, in P. Weimer and M. H. Link, eds.,
Seismic facies and sedimentary processes of submarine fans and turbidite
systems: New York, Springer-Verlag, 223–239pp.
Avbovbo, A. A.; 1978. Tertiary lithostratigraphy of Niger Delta. AAPG, vol. 62,
pp. 295-300.
Badalini, G., Kneller, B., and Winker, C. D.; 2000. Architecture and processes in the
late Pleistocene Brazos-Trinity turbidite system, Gulf of Mexico continental
slope, in Weimer, P., Slatt, R. M., Coleman, J., Rosen, N. C., Nelson, H.,
Bouma, A. H., Styzen, M. J., and Lawrence, D. T. (Eds.), Deep-Water
Reservoirs of the World: Gulf Coast Society of Economic Paleontologists and
Mineralogists Foundation, 20th Annual Research Conference, pp. 16-34.
Bahorich, M. and Farmer, S.; 1995. 3D Seismic Discontinuity for Faults and
Stratigraphic Features: The Coherence Cube. The Leading Edge, vol. 14,
pp.1053-1058.
Barnes, A.E.; 1992. Instantaneous spectral bandwidth and dominant frequency with
applications to seismic reflection data. Geophysics, vol. 58, no. 3, pp. 419-428.

149
Barnes, A., Cole, M., Michaels, T., Norlund, P., and Sembroski, C. (2011). Making
seismic data come alive. First Break, vol. 29, pp. 33-38.
Beaubouef, R. T., and Friedmann, S. J.; 2000. High-resolution seismic/sequence
stratigraphic framework for the evolution of Pleistocene intra slope basins,
Western Gulf of Mexico: depositional models and reservoir analogs, in
Weimer, P., Slatt, R. M., Coleman, J., Rosen, N. C., Nelson, H., Bouma, A. H.,
Styzen, M. J., and Lawrence, D. T., (Eds.), Deep-Water Reservoirs of the
World: Gulf Coast Society of Economic Paleontologists and Mineralogists
Foundation, 20th Annual Research Conference, pp. 40-60.
Beka, F.T., and Oti, M.N.; 1995. The distal offshore Niger delta: frontier prospects of
a mature petroleum provice, in Oti, M.N., and Postma, G., (Eds.), Geology of
Deltas: Rotterdam, A.A. Balkema, pp. 237-241.
Bezdek, J.C., Tsao, E.C.K. and Pal, N.R.; 1992. Fuzzy Kohonen clustering networks:
IEEE International Conference on Fuzzy Systems, pp.1035–1043.
Bouma, A. H., and J. M. Coleman, 1986, Intraslope basin deposits and potential
relation to the continental shelf, northern Gulf of Mexico: Gulf CoastAssociation
of Geological Societies Transactions, vol. 36, pp. 419–427.
Brown, A.R.; 1996. Seismic attributes and their classification: The Leading Edge, vol.
15, no.10, pp. 1090-1092.
Brown, A.R.; 2001. Understanding seismic attributes: Geophysics, vol. 66, no. 1,
pp. 47-48.
Brown, A. R.; 2013. What Is Seismic Interpretation?. AAPG Explorer, vol. 5, no. 6,
pp. 14-19.
Bubb, J. N., and Hatledid, W. G.; 1977. Seismic recognition of carbonate builds ups
in seismic stratigraphy, in Payton, C. E. (ed.), Applications to hydrocarbon
exploration: AAPG Memoir, vol. 26, pp. 185–204.
Burke, K.; 1972. Longshore drift, submarine canyons and submarine fans in development
of Niger Delta. AAPG Bulletin, vol. 56, no.4, pp. 1975-1983.

150
Cant, D.J.; 1992. Subsurface Facies Analysis. In: Walker, R.G. and James N.P.
(Eds.), Facies Models: Response to Sea Level Change. Geological Association
of Canada, pp. 405- 409.
Chopra, S. and Marfurt, K. J., 2006. Seismic Attribute Mapping of Structure and
Stratigraphy. Canadian Society of Exploration Geophysicists (CSEG)
Recorder, Special Edition, pp. 110-121.
Chopra, S.; 2008. Emerging and future trends in seismic attributes. The Leading Edge,
vol. 27, no. 3, pp. 298-318.
Chopra, S. and Marfurt, K. J.; 2011. Blended Data Renders Visual Value. AAPG
Explorer, Geophysical Corner, vol. 3, no. 10, pp. 38-40.
Chopra, S. and Michelena, R. J.; 2011. Introduction to this special section: Reservoir
Characterization. The Leading Edge, vol. 30, no.1, pp. 35-37.
Chopra, S. and Marfurt, K. J.; 2012. Seismic attribute expression of differential
compaction; SEG Las Vegas 2012 Annual Meeting, pp.1-5
Clark, J.D., Kenyon, N.H., and Pickering, K.T.; 1992. Quantitative analysis of the
geometry of submarine channels: implications for the classification of
submarine fans. Geology, vol. 20, no. 3, pp. 633–636.
Clark, J.D., and Pickering, K.T.; 1996. Architectural elements and growth patterns of
submarine channels: applications to hydrocarbon exploration. AAPG Bulletin,
vol. 80, no. 6, pp. 194–221.
Cohen, L. (1995). Time Frequency Analysis: Theory and Applications: Prentice-Hall
Signal Processing Series, New York, 320p.
Damuth, J. E.; 1994. Neogene gravity tectonics and depositional processes on the deep
Niger delta continental margin. Marine and Petroleum Geology, vol. 11, no. 3,
pp. 320-346.
Dan G. V. and Robert R.; 1996. Stewart 3-D seismic attributes. CREWES Research
Report, vol. 8, no. 45, pp. 1-30.
Dean, L.; 2007. Reservoir Engineering for Geologists. Canadian Society for
Petroleum Geologist (CSPG) Reservoir Magazine, vol. 34, no. 11, pp. 20-23.

151
Doust, H.J., and Omatsola, O.; 1990. Niger Delta In: Edwards, J.D. and Santoyiossi,
P.A.(Ed.). Divergent and Passive Margin Basin. AAPG Memoir, no. 48,
pp. 201-238.
Ekweozor, C.M. and Okoye, N.V.; 1980. Petroleum source-bed evaluation of Tertiary
Niger Delta: AAPG Bulletin, vol. 64, no. 4, 1251-1259.
Etris, N. and Stewart, B.; 2003. Net-togross ratio. Canadian Society for Petroleum
Geologist (CSPG) Reservoir Magazine, vol. 30, no. 4, pp. 24-25.
Emery, D., and Myers, K. (1996). Sequence Stratigraphy. Black-well Science Ltd.,
Oxford, London, 423pp.
Evarmy, B.D., Haremboure, J., Kamerling, P., Knaap, W.A., Molloy, F.A., and
Rowlands, P.H.; 1978. Hydrocarbon Habitat of Tertiary Niger delta, AAPG
Bulletin, vol. 62, no. 4, pp. 1-39.
Feeley, M.H., Buffler, R.T., and Bryant, W.R.; 1985. Depositional units and growth
of the Mississippi Fan, in Bouma, A. H., Normark, W.R. and Barnes, N.E. (Eds.),
Submarine fans and related turbidite systems, New York, Springer- Verlag,
pp. 253-257.
Ferguson, C.J., Avu, A., Schofield, N. and Patton, G.S. (2010) Seismic analysis
workflow for reservoir characterization in the vicinity of salt. First Break, vol.
28, no. 10, pp. 107–113.
Galloway, W. E.; 1975. Process framework for describing the morphologic and
stratigraphic evolution of deltaic depositional systems, in Broussard, M. L., (Ed.).,
Deltas, Models for Exploration. Houston Geological Society, pp. 87-98.
Haack, R.C., Sundararaman, P., and Dahl, J.; 1997. Niger delta petroleum system:
Presented at the 1997 AAPG/ABGP Hedberg Research symposium, Rio de
Janeiro, Brazil, extended abstracts.
Hampson, D., Schuelke, J.S., and Quirein, J.A.; 1999. Use of multiattribute transforms to
predict log properties from seismic data. Geophysics, vol. 66, no. 4, pp. 220-231.

152
Hospers, J.; 1965. Gravity field and structure of the Niger delta, Nigeria, West
Africa. GSA Bulletin, vol. 74, no.1, pp. 1-12.
Http://www.glossary.oilfield.slb.com
Khripounoff, A., Vangriesheim, A., Babonneau, N., Crassous, P., Dennielou, B.,
Savoye, B.; 2003. Direct observation of intense turbidity current activity in the
Zaire submarine valley at 4000m water depth. Marine Geology, vol. 194, no.1,
pp. 151–158.
Klein, P., Richard, L. and James, H.; 2008. 3D curvature attributes: a new approach
for seismic interpretation. First break, vol. 26, no.1, pp. 105-112.
Klett, T.R.; Ahlbrandt, T.S.; Schmoker, J.W.; and Dolton, J.L.; 1997. Ranking of the
world’s oil and gas provinces by known petroleum volumes. US Geological
Survey Open-file Report, pp.97- 463.
Knox, G. J., and Omatsola, E. M.; 1989. Development of the Cenozoic Niger delta in
terms of the “Escalator Regression” model and impact on hydrocarbon
distribution. Proceedings of the KNGMG Symposium “Coastal Lowlands,
Geology and Geotechnology,” Dordrecht, Kluwer, pp. 181-202.
Kulke, H.; 1995. Nigeria, in Kulke, H. (Ed.), Regional petroleum geology of the world
Part II: Africa, America, Australia and Antarctica. Berlin, Gebruder Borntraeger,
pp.143-172.
Larionov, V.; 1969. Borehole Radiometry. Moscow, U.S.S.R.: Nedra Printing, 227p.
Lehner, P., and De Ruiter, P.A.C.; 1977. Structural history of Atlantic Margin of
Africa. AAPG Bulletin, vol. 61, no. 2, pp. 961-981.
Li, M., Li, Z., Jiang, Q., and Cao, T.; 2013. Reservoir Quality, Hydrocarbon Mobility
and Implications for Lacustrine Shale Oil Productivity in the Paleogene
Sequence, Bohai Bay Basin. Oral presentation presented at American
Association of Petroleum Geologists (AAPG) Annual Convention and
Exhibition, Pittsburgh, Pennsylvania, USA, pp. 1-34.

153
Liu, J.L., and J. S. Watkins, 1992, Seismic facies and depositional processes on the
lower continental slope in the Mississippi Canyon area, Gulf of Mexico (abs.):
AAPG Bulletin, vol. 76, no. 9, pp. 1462.
Liu, J.L. and Marfurt, K.; 2007. Multi-Color Display of Spectral Attributes. The
Leading Edge, vol. 26, pp. 268-271.
Marfurt, K. J., Sharp, J. A., Scheet, R. M.,Ward, J., Cain, G., and Harper, M. G.; 1998.
Suppression of the acquisition footprint for seismic attribute analysis.
Geophysics, vol. 63, no. 4, pp. 1024–1035.
Mayall, M., Jones, E., and Casey, M.; 2006. Turbidite channel reservoirs—key
elements in facies prediction and effective development. Marine and Petroleum
Geology, vol. 23, no. 3, pp. 821–841.
Mehdi E. and De-Hua, H.; 2011. 3D Petrophysical modeling using complex seismic
attributes and limited well log data; Paper presented at the Annual Meeting of
SEG, San Antonio, pp.1887- 1891.
Mitchum, R.M. Jr., Sangree, J.B., Vail, P.R., and Wornardt, W.W.; 1991. Sequence
stratigraphy in the late Cenozoic expanded sections, Gulf of Mexico: in
Armentrout, J. M., and Perkins, B.F.(Eds.), Sequence stratigraphy as an
exploration tool, concepts and practices in the Gulf Coast: Gulf Coast Section,
SEPM Foundation, Eleventh Annual Research Conference, pp. 237-256.
Naseer, T.M., Asim, Shazia, Ahmad, M.N., Hussain, S.F., and Qureshi, S.N.; 2014.
Application of seismic attributes for delineation of channel geometries and
analysis of various aspects in terms of lithological and structural perspectives
of Lower Goru Formation, Pakistan. International Journal of Geosciences, vol. 5,
pp. 1490-1502.
Obah, B., Livinus, A., and Ezugwu, C. M.; 2012. Simplified Models for Forecasting
Oil Production: Niger Delta Oil Rim Reservoirs Case. Petroleum Technology
Development Journal, vol. 2; no. 2, pp. 1-12.
Obaje, N.G., Wehner, H., Scheeder, G., Abubakar, M.B., Jauro, A.; 2004. Hydrocarbon
Prospectivity of Nigeria’s inland basins: From the viewpoint of organic

154
geochemistry and organic petrology. AAPG Bulletin, vol. 88, no. 3, pp. 325-353.
Okodudu, S.; 2007. Niger Delta in the Era of Globalization. MSS Printing, Port-
Harcourt, Nig., 137p.
Omoboriowo, A.O., Chiadikobi, K.C. and Chiaghanam, O.I.; 2012. Depositional
Environment and Petrophysical Characteristics of “LEPA” Reservoir, Amma
Field, Eastern Niger Delta, Nigeria. Int. J. Pure and Appl. Sci. Technol., vol.
10, no. 2, pp. 38-61.
Oyanyan, R. O., Soronnadi-Ononiwu, C. G. and Omoboriowo, A. O.; 2012. Depositional
environments of sam-bis oil field reservoir sands, Niger Delta, Nigeria.
Advances in Applied Science Research, vol. 3, no. 3, pp. 1624-1638.
Partyka, G., Gridley, J. and Lopez, J.; 1999. Interpretational Applications of Spectral
Decomposition in Reservoir Characterization. The Leading Edge, vol. 18,
pp. 353-360.
Peter, O., and Peter, A., 2013. Formation Evaluation and Its Implication on Hydrocarbon
Production in Imoye Field, Niger Delta. Journal of Environment and Earth Science,
vol. 3, no.1, pp. 98-109.
Peyton, L., Bottjer, R. and Partyka, G.; 1998. Interpretation of Incised Valleys Using
New 3-D Seismic Techniques: A Case History Using Spectral Decomposition
and Coherency. The Leading Edge, vol. 17, pp. 1294-1298.
Pilcher, R.S. and Blumstein, R.D. (2007). Brine volume and salt dissolution rates in
Orca basin, northeast Gulf of Mexico. AAPG Bulletin, vol. 91, pp. 823–833.
Pirmez C., Beaubouef, R. T., Friedmann, S. J., and Mohrig, D. C.; 2000. Equilibrium
profile and base level in submarine channels: examples from Late Pleistocene
systems and implications for the architecture of deep-water reservoirs:
in Weimer, P., Slatt, R. M., Coleman, J., Rosen, N. C., Nelson, H., Bouma, A.
H., Styzen, M. J., and Lawrence, D. T., (Eds.), Deep-Water Reservoirs of the
World. Gulf Coast Society of the Society of Economic Paleontologists and
Mineralogists Foundation, 20th Annual Research Conference, pp. 782-805.

155
Pokhriyal, S. K.; 2011. A new seismic attribute aids to map the embedded geological
features from low bandwidth seismic data: The 2nd
South Asian Geoscience
Conference and Exhibition, pp. 1-6.
Posamentier, H. W., and R. D. Erskine, 1991. Seismic expression and recognition
criteria of ancient submarine fans, in P. Weimer and M. H. Link, eds., Seismic
facies and sedimentary processes of submarine fans and turbidite systems: New
York, Springer-Verlag, p. 197–222.
Posamentier, H. W., and Kolla, V.; 2003. Seismic geomorphology and stratigraphy of
depositional elements in deep-water settings. Journal of Sedimentary Research,
vol. 73, no. 3, pp. 367-388.
Prather, B. E., J. R. Booth, G. S. Steffens, and P. A. Craig, 1995. Classification and
stratigraphic succession of seismic facies in intraslope basins, deep-water Gulf
of Mexico, U.S.A. (abs.): AAPG Annual Meeting Program with Abstracts,
pp. 77A.
Prather, B. E., Booth, J. R., Steffens, G. S., and Craig, P. A.; 1998. Classification,
lithologic calibration, and stratigraphic succession of seismic facies of
intraslope basins, deep-water Gulf of Mexico. AAPG Bulletin, vol. 82, no. 1,
pp. 701-728.
Pokhriyal, .S. K.; 2011. A new seismic attribute aids to map the embedded geological
features from low bandwidth seismic data: The 2nd
South Asian Geoscience
Conference and Exhibition, pp. 1-6.
Rider , M.H.; 1996. Well Geological Interpretation of Well Logs. Interprint Ltd., London,
England, 398p.
Reijers, T.J.A., Petters, S.W., and Nwajide, C.S.; 1997. The Niger Delta Basin, in Selley,
R.C. (Ed.), African Basins--Sedimentary Basin of the World 3: Amsterdam,
Elsevier Science, pp. 151-172.
Rijks, E. J. H., and Jauffred, J. E. E. M.; 1991. Attribute extraction: An important
application in any 3-D interpretation study. The Leading Edge, vol. 10, no. 9,
pp. 11–19.

156
Sangree, J.B., Waylett, D.C., Amery, G.B., Fennessy, W.J., and Frazier, D.E.; 1978.
Recognition of continental-slope seismic facies, offshore Texas-Louisiana, in
A. H. Bouma, G.T. Moore, and J.M. Coleman, (Eds)., Beyond the shelf break.
AAPG Short Course 2, pp. 1-54.
Schultz, P. S., Ronen, S., Hattori, M., Corbett, C., and Mantran, P.; 1994. Seismic guided
estimation of log properties, parts 1, 2, and 3. The Leading Edge, vol. 13, no. 1,
pp. 305–310.
Schlumberger. (1968). Log Interpretation /charts:. Schlumberger Well Services, Inc.
Houston, 10-30pp.
Schlumberger, 1974. Log Interpretation Charts. Schlumberger Educational Services,
New York, US, 83p.
Sheriff, R.E.; 1973. Encyclopedic Dictionary of Exploration Geophysics. SEG, Tulsa,
OK, 266p .
Sheriff, R.E. 1992. Reservoir Geophysics: Investigations in Geophysics Series. SEG,
vol. 7, pp. 45-52.
Sheriff, R.E. and Geldart, L.P.; 1995. Exploration Seismology. Cambridge University
Press, New York, USA, 592 p.
Short, K.C. and Stauble, A.J.; 1967. Outline of Geology of Niger Delta. AAPG
Bulletin, vol. 51, no. 1, pp. 761 – 779.
Sigismondi, M. E. and Soldo, J. C.; 2003. Curvature attributes and seismic
interpretation: Case studies from Argentina basins. The Leading Edge, vol. 22,
no. 11, pp. 1122-1126.
Siddiqui, N.A., EL-Ghali, M.A., Abd Rahman, A., Mijinyawa, A., and Ben-Awuah,
J.; 2013. Depositional Environment of Shallow-Marine Sandstones from
Outcrop Gamma-Ray Logs, Belait Formation, Meragang Beach, Brunei
Darussalam. Research Journal of Environmental and Earth Sciences, vol. 5,
no. 6, pp. 305-324.

157
Siguaw, S.G., Estes-Jackson, J.E., Ingraham, S.E., Shewmake, D.W.; 2001. An
integrated 3-D reservoir characterization at Riverton Dome Field, Wyoming.
The Leading Edge, vol. 20, no. 11, pp. 1226-1238.
Smith, T. and Starcey, D.; 2011. Seismic Attribute analysis can benefit from
unsupervised neural network. Geology and Geophysics Offshore, vol. 40, no. 2,
pp. 1-4.
Stacher, .P.; 1995. The Niger delta hydrocarbon habitat. NAPE Bull., vol. 9, no. 1,
pp. 67-75.
Subrahmanyam, D.; 2008. Seismic Attributes- A Review. Paper presented at 7th
International Conference and Exposition on Petroleum Geophysics, pp.398-
404.
Taner, M.T.; 2001. Seismic attributes. CSEG Recorder, vol. 26, no. 7, pp. 48-56.
Taner, M. T., Schuelke, J. S. Doherty, R. O. and Baysal, E.; 1994. Seismic attributes
revisited: 64th
Annual International Meeting of SEG, Expanded Abstracts,
pp.1104–1106.
Taner, M.T., Koehler, F., and Sheriff, R.E.; 1979. Complex seismic trace analysis.
Geophysics, vol. 44, no. 6, pp. 1041-1063.
Timur, A.; 1968. An investigation of permeability, porosity, and residual water
saturation relationship for sandstone reservoirs. The Log Analyst, vol. 9, no. 4,
pp. 8-13.
Tinker, S.W.; 1996. Building the 3-D jigsaw puzzle: Application of sequence
stratigraphy to 3-D reservoir characterization, Permain Basin. AAPG Bulletin,
80: 460-482.
Tuttle, M. L. W., Charpentier, R. R., and Brownfield, M. E.; 1999. The Niger delta
petroleum system: Niger delta province, Nigeria, Cameroon, and Equatorial
Guinea, Africa: USGS Open-file report, pp. 50-99.

158
Urazimanova, A., Patterson, E., Deng, J., Althoff, C., Yalcin, B., and Totten, M.; 2013.
Iterative Depositional Model Interpretations Using Seismic Attributes.
School of Geology and Geophysics, University of Oklahoma, Ok, 131p.
Vail, P.R., and Wornardt, W.; 1991. An integrated approach to exploration and
development in the 90s: Well-log seismic sequence stratigraphy analysis.
Transactions of the Gulf Coast Association of Geological Societies, vol. 41,
pp. 630-650.
Wagner, J.B., Kofron, B.M., Morin, R.W., Ford, D.W., and Marthur, V.R. 1992. An
applied sequence stratigraphic approach to basin analysis. AAPG Annual
Meeting Program, 136p.
Weber, K.J.; 1971. Sedimentological aspects of oil fields in the Niger Delta.
Geologie en Mijnbouw, vol. 50, pp. 559–576.
Weber, K. J. and Daukoru, E.; 1975. Petroleum Geology of the Niger Delta. Paper
presented at 9th
World Petroleum Congress, Tokyo, Japan, pp.1-14.
Whiteman, A. J.; 1982. Nigeria: Its petroleum geology, resources and potential.
Graham and Trotman Publishers, London, England, vol. 2, 241p.
Wynn, R. B.,_Croninb, B. T., and Peakall, J.; 2002. Sinuous deep-water channels:
Genesis, geometry and architecture. Marine and Petroleum Geology, vol. 24,
no. 1, pp. 341–387.
Xiao, H., and Suppe, J.; 1992. Origin of rollover. AAPG Bulletin, vol. 76, no. 3,
pp. 509-229.
Yenugu, M. R., Marfurt, K. J., Wickstrom, C. and Matson, S.; 2011. Seismic
Attribute Mapping for Identification of Cypress Sands, Illinois Basin, Indiana,
USA; Search and Discovery Article (#40808), Adapted from oral presentation
at AAPG Annual Convention and Exhibition, Houston, Texas, USA, pp. 10-13.

159
Appendix I: Result of Well Correlation Table for the Wells in the study area
Well identifier Surface X Y Z MD TWT auto
Rence-1 A Top 546474.3 -9845.39 -562.89 571.89 718.56
Rence-1 A Base 546474.3 -9845.39 -582.89 591.89 726.56
Rence-1 C Top 546474.3 -9845.39 -620.37 629.37 764.95
Rence-1 C Base 546474.3 -9845.39 -742.11 751.11 855.32
Rence-1 D Top 546474.3 -9845.39 -863.25 872.25 972.3
Rence-1 D Base 546474.3 -9845.39 -901.34 910.34 1003.3
Rence-1 E Top 546474.3 -9845.39 -962.89 971.89 1050.27
Rence-1 E Base 546474.3 -9845.39 -1077.77 1086.77 1139.81
Rence-1 F Top 546474.3 -9845.39 -1124.32 1133.32 1184.08
Rence-1 F Base 546474.3 -9845.39 -1140.62 1149.62 1193.92
Rence-1 G Top 546474.3 -9845.39 -1221.56 1230.56 1243.71
Rence-1 G Base 546474.3 -9845.39 -1254.85 1263.85 1265.67
Rence-1 H Top 546474.3 -9845.39 -1276.63 1285.63 1281.52
Rence-1 H Base 546474.3 -9845.39 -1483.75 1492.75 1492.92
Rence-1 I Top 546474.3 -9845.39 -1551.89 1560.89 1545.14
Rence-1 I Base 546474.3 -9845.39 -1573.08 1582.08 1560.98
Rence-1 J Top 546474.3 -9845.39 -1618.87 1627.87 1612.12
Rence-1 J Base 546474.3 -9845.39 -1664.61 1673.61 1648.27
Rence-1 K Top 546474.3 -9845.39 -1681.29 1690.29 1657.55
Rence-1 K Base 546474.3 -9845.39 -1702.49 1711.49 1673.02
Rence-1 L Top 546474.3 -9845.39 -1714.79 1723.79 1686.53
Rence-1 L Base 546474.3 -9845.39 -1894.46 1903.46 1811.46
Rence-1 M Top 546474.3 -9845.39 -1922.33 1931.33 1833.38
Rence-1 M Base 546474.3 -9845.39 -2121.27 2130.27 1973.18
Rence-1 N Top 546474.3 -9845.39 -2143.14 2152.14 1994.46
Rence-1 N Base 546474.3 -9845.39 -2292.33 2301.33 2103.24
Rence-1 O Top 546474.3 -9845.39 -2311.13 2320.13 2116.95
Rence-1 O Base 546474.3 -9845.39 -2366.19 2375.19 2157.1
Rence-1 P Top 546474.3 -9845.39 -2421.18 2430.18 2197.2
Rence-1 P Base 546474.3 -9845.39 -2490.29 2499.29 2247.59
Rence-1 Q Top 546474.3 -9845.39 -2511.55 2520.55 2263.09
Rence-1 Q Base 546474.3 -9845.39 -2548.32 2557.32 2289.9
Rence-1 R Top 546474.3 -9845.39 -2694.87 2703.87 2396.77
Rence-1 R Base 546474.3 -9845.39 -2716.08 2725.08 2412.23
Rence-1 S Top 546474.3 -9845.39 -2745.73 2754.73 2433.85
Rence-2 A Top 546827.2 -8479.02 -485.93 511.84 643.49
Rence-2 A Base 546827.2 -8479.02 -507.26 533.17 673.74
Rence-2 B Top 546827.2 -8479.02 -537.5 563.41 708.65
Rence-2 B Base 546827.2 -8479.02 -558.75 584.66 716.9

160
Rence-2 C Top 546827.2 -8479.02 -595.18 621.09 731.49
Rence-2 C Base 546827.2 -8479.02 -750.52 776.43 860.91
Rence-2 D Top 546827.2 -8479.02 -854.24 880.15 964.47
Rence-2 D Base 546827.2 -8479.02 -897.9 923.81 1001.53
Rence-2 E Top 546827.2 -8479.02 -958.35 984.26 1045.98
Rence-2 E Base 546827.2 -8479.02 -1071.97 1097.88 1137.88
Rence-2 F Top 546827.2 -8479.02 -1119.88 1145.79 1181.39
Rence-2 G Top 546827.2 -8479.02 -1293.2 1319.11 1293.57
Rence-2 G Base 546827.2 -8479.02 -1322.9 1348.81 1369.06
Rence-2 H Top 546827.2 -8479.02 -1329.57 1355.48 1385.9
Rence-2 H Base 546827.2 -8479.02 -1486.39 1512.3 1495.11
Rence-2 I Top 546827.2 -8479.02 -1555.2 1581.11 1547.67
Rence-2 I Base 546827.2 -8479.02 -1586.49 1612.4 1570.97
Rence-2 J Top 546827.2 -8479.02 -1631.1 1657.01 1629.64
Rence-2 J Base 546827.2 -8479.02 -1681.29 1707.2 1657.55
Rence-2 K Top 546827.2 -8479.02 -1688.03 1713.94 1662.47
Rence-2 K Base 546827.2 -8479.02 -1706.93 1732.84 1676.27
Rence-2 L Top 546827.2 -8479.02 -1727.02 1752.93 1702.51
Rence-2 L Base 546827.2 -8479.02 -1906.46 1932.37 1821.8
Rence-2 M Top 546827.2 -8479.02 -1934.28 1960.19 1842.1
Rence-2 M Base 546827.2 -8479.02 -2133.22 2159.13 1987.22
Rence-2 N Top 546827.2 -8479.02 -2156.89 2182.8 2004.48
Rence-3 A Top 545833.7 -10168.1 -546.76 580.01 712.25
Rence-3 A Base 545830.2 -10171.3 -570.19 603.91 721.48
Rence-3 B Top 545823.1 -10178.2 -610.82 645.74 752.62
Rence-3 B Base 545820 -10181.3 -625.51 661.07 769.99
Rence-3 C Top 545812.9 -10189.2 -658.94 696.16 801.33
Rence-3 C Base 545767 -10237 -819.96 870.67 935.75
Rence-3 D Top 545684.1 -10331.8 -956.37 1056.99 1043.74
Rence-3 D Base 545653.3 -10367.2 -992.33 1116.15 1078.09
Rence-3 E Top 545615 -10408.8 -1033.12 1185.9 1105.92
Rence-3 E Base 545560.1 -10464.8 -1089.78 1282.62 1143.8
Rence-3 F Top 545521.4 -10505.1 -1130.96 1352.04 1188.09
Rence-3 F Base 545444.9 -10584.9 -1210.68 1488.39 1236.87
Rence-3 G Top 545408.5 -10622 -1248.47 1552.67 1261.03
Rence-3 G Base 545396.8 -10634 -1261.12 1573.67 1270.23
Rence-3 H Top 545392.5 -10638.3 -1265.7 1581.24 1273.56
Rence-3 H Base 545355.4 -10676.1 -1307.19 1648.61 1331.51
Rence-3 H Levee 545276.9 -10759.3 -1398.74 1795.08 1431.19
Rence-3 I Top 545198.5 -10841.2 -1488.05 1939.46 1496.38
Rence-3 I Base 545186.1 -10853.8 -1501.84 1961.88 1506.91
Rence-3 J Top 545138.6 -10902.5 -1556.77 2049.31 1548.84
Rence-3 J Base 545077.2 -10965.6 -1626.72 2161.81 1623.37

161
Rence-3 K Top 545058.6 -10984.5 -1648.52 2196.13 1639.32
Rence-3 K Base 545045.4 -10997.8 -1664.52 2220.78 1648.22
Rence-3 L Top 545035.9 -11007.4 -1676.29 2238.73 1654.77
Rence-3 L Base 544900.5 -11154 -1838.11 2495.98 1762.92
Rence-3 M Top 544860.9 -11200.4 -1889.12 2575.52 1806.86
Rence-3 M Base 544723.5 -11345.9 -2062.23 2840.22 1921.77
Rence-3 N Top 544704.8 -11364.9 -2087.45 2876.93 1933.43
Rence-3 N Base 544609.7 -11461.9 -2208.77 3059.13 2042.31
Rence-3 O Top 544581.5 -11490.4 -2239.36 3109.58 2064.62
Rence-3 O Base 544543.4 -11529.2 -2279.54 3177.14 2093.86
Rence-3 P Top 544499.3 -11575.5 -2328.61 3257.8 2128.78
Rence-3 P Base 544434 -11640.5 -2401.11 3375.05 2179.54
Rence-3 Q Top 544422.4 -11652.3 -2414.46 3396.28 2188.73
Rence-3 Q Base 544402.5 -11671.7 -2436.77 3431.96 2204.18
Rence-3 R Top 544262.1 -11801.1 -2586.08 3674.38 2309.13
Rence-3 R Base 544247.2 -11814.9 -2602 3700.18 2320.29
Rence-4 J Base 546553.6 -9466.09 -1686.2 2086.27 1661.13
Rence-4 K Top 546570.9 -9451.04 -1711.42 2120.37 1682.13
Rence-4 K Base 546583.6 -9440.23 -1729.71 2145.12 1703.62
Rence-4 L Top 546588.4 -9436.14 -1736.64 2154.5 1706.47
Rence-5 F Base 545743.7 -10097.8 -1200.32 1251.71 1230.35
Rence-5 G Top 545727.2 -10088.2 -1238.19 1294.14 1254.17
Rence-5 G Base 545719.1 -10083.6 -1255.33 1313.63 1266.02
Rence-5 H Top 545714.2 -10080.8 -1264.55 1324.45 1272.73
Rence-5 H Base 545611.6 -10022.7 -1419.17 1519.06 1439.38
Rence-5 H Base 545611.6 -10022.7 -1419.17 1519.06 1439.38
Rence-5 I Top 545564.2 -9995.7 -1487.53 1606.52 1495.98
Rence-5 I Base 545553.1 -9989.54 -1502.9 1626.42 1507.72
Rence-5 J Top 545521.2 -9971.07 -1547.63 1684.39 1541.89
Rence-5 J Base 545469.2 -9939.1 -1622.15 1780.73 1616.83
Rence-5 K Top 545455.5 -9930.4 -1641.5 1805.98 1635.42
Rence-5 K Base 545444.9 -9923.57 -1656.43 1825.54 1643.73
Rence-5 L Top 545436.7 -9918.23 -1667.86 1840.57 1650.08
Rence-5 L Base 545340.3 -9857.82 -1806.25 2019.77 1735.47
Rence-6 F Base 545939.5 -10723.5 -1227.85 1473.28 1247.67
Rence-6 G Top 545941.8 -10746.3 -1250.78 1505.7 1262.71
Rence-6 G Base 545944.6 -10775.1 -1279.43 1546.43 1283.56
Rence-6 H Top 545945.7 -10786 -1289.72 1561.42 1291.04
Rence-6 H Base 545987.9 -11001.3 -1484.43 1854.88 1493.48
Rence-6 I Top 545997.1 -11049.6 -1526.69 1919.7 1525.89
Rence-6 I Base 546002.1 -11074.5 -1548.77 1953.36 1542.76
Rence-6 J Top 546005.4 -11090.6 -1563.63 1975.57 1553.95
Rence-6 J Base 546020.9 -11169.1 -1637.01 2084.11 1632.93

162
Rence-6 K Top 546029.3 -11219.7 -1685.17 2154.47 1660.38
Rence-6 K Base 546030.6 -11229.5 -1694.31 2167.93 1667.05
Rence-6 L Top 546032.5 -11243.7 -1707.45 2187.41 1676.93
Rence-7 F Base 545714.2 -10353.9 -1207.2 1287.08 1234.68
Rence-7 G Top 545705.5 -10365.6 -1238.13 1321.27 1254.14
Rence-7 G Base 545701 -10371.7 -1254.19 1339.04 1265.19
Rence-7 H Top 545696.9 -10377.7 -1269.07 1355.56 1276.02
Rence-7 H Base 545660.6 -10446.5 -1436.42 1540.16 1453.68
Rence-7 I Top 545641.6 -10476.4 -1518.09 1629.22 1519.32
Rence-7 I Base 545636.3 -10483.7 -1539.57 1652.53 1535.73
Rence-7 J Top 545625.1 -10498.4 -1581.94 1698.76 1567.58
Rence-7 J Base 545604.1 -10526.8 -1655.32 1780.21 1643.11
Rence-7 K Top 545594.8 -10540.1 -1686.23 1815.11 1661.15
Rence-7 K Base 545590.9 -10545.4 -1698.8 1829.3 1670.33
Rence-7 L Top 545587.3 -10550.5 -1710.75 1842.77 1681.26
Rence-8 F Base 545945.9 -9696.85 -1195.69 1405.14 1227.44
Rence-8 G Top 545960.5 -9636.2 -1243.73 1483.88 1257.66
Rence-8 G Base 545969.4 -9602.42 -1270.49 1527.9 1277.05
Rence-8 H Top 545972.6 -9590.44 -1280.5 1543.83 1284.33
Rence-8 H Base 546010.8 -9409.39 -1443.93 1790.85 1459.91
Rence-8 I Top 546024.2 -9322.97 -1515.44 1903.83 1517.3
Rence-8 I Base 546028.8 -9295.15 -1539.27 1940.74 1535.5
Rence-8 J Top 546038.2 -9240.84 -1585 2012.37 1569.86
Rence-8 J Base 546055.9 -9149.45 -1661.09 2132.61 1646.32
Rence-8 K Top 546062.6 -9119.04 -1687.45 2173.41 1662.05
Rence-8 K Base 546067.7 -9097.2 -1706.58 2202.88 1676
Rence-8 L Top 546069.4 -9090.19 -1712.74 2212.35 1683.85
Rence-9 A Top 543091.3 -9925.2 -503.95 529.86 669.05
Rence-9 A Base 543091.3 -9925.2 -519.79 545.7 688.81
Rence-9 B Top 543091.3 -9925.2 -559.5 585.41 717.2
Rence-9 B Base 543091.3 -9925.2 -572.18 598.09 722.27
Rence-9 C Top 543091.3 -9925.2 -632.79 658.7 777.11
Rence-9 C Base 543091.3 -9925.2 -772.71 798.62 901.11
Rence-9 D Top 543091.3 -9925.2 -879.42 905.33 986.07
Rence-9 D Base 543091.3 -9925.2 -911.31 937.22 1008.41
Rence-9 E Top 543091.3 -9925.2 -978.88 1004.79 1065.38
Rence-9 E Base 543091.3 -9925.2 -1058.46 1084.37 1120.98
Rence-9 F Top 543091.3 -9925.2 -1141.08 1166.99 1194.2
Rence-9 F Base 543091.3 -9925.2 -1223.27 1249.18 1244.79
Rence-9 G Top 543091.3 -9925.2 -1329.6 1355.51 1385.93
Rence-9 G Base 543091.3 -9925.2 -1364.19 1390.1 1418.15
Rence-9 H Top 543091.3 -9925.2 -1375.31 1401.22 1422.35
Rence-9 H Base 543091.3 -9925.2 -1536.38 1562.29 1533.29

163
Rence-9 H Levee 543091.3 -9925.2 -1536.38 1562.29 1533.29
Rence-9 I Top 543091.3 -9925.2 -1615.53 1641.44 1607.35
Rence-9 I Base 543091.3 -9925.2 -1647.85 1673.76 1638.96
Rence-9 J Top 543091.3 -9925.2 -1688.03 1713.94 1662.47
Rence-9 J Base 543091.3 -9925.2 -1751.56 1777.47 1712.62
Rence-9 K Top 543091.3 -9925.2 -1784.99 1810.9 1726.4
Rence-9 K Base 543091.3 -9925.2 -1806.2 1832.11 1735.43
Rence-9 L Top 543091.3 -9925.2 -1815.17 1841.08 1743.15
Rence-9 L Base 543091.3 -9925.2 -1960.81 1986.72 1853.04
Rence-9 M Top 543091.3 -9925.2 -1985.96 2011.87 1869.43
Rence-9 M Base 543091.3 -9925.2 -2194.25 2220.16 2031.72
Rence-9 N Top 543091.3 -9925.2 -2219.43 2245.34 2050.08
Rence-9 N Base 543091.3 -9925.2 -2352.7 2378.61 2147.26
Rence-9 O Top 543091.3 -9925.2 -2378.07 2403.98 2165.76
Rence-9 O Base 543091.3 -9925.2 -2425.6 2451.51 2200.42