department of finance · to deliver increased value and achieve excellence. the department’s...
TRANSCRIPT

Department of FinanceAnnual Report 2016-17
Statement of Compliance
For the year ended 30 June 2017
HON BEN WYATT MLA
TREASURER; MINISTER FOR FINANCE; ENERGY; ABORIGINAL AFFAIRS
In accordance with section 63 of the Financial Management Act 2006, I hereby submit for your information and presentation to Parliament, the Annual Report of the Department of Finance for the financial year ended 30 June 2017.
The Annual Report has been prepared in accordance with the provisions of the Financial Management Act 2006.
Anne NolanDirector General23 August 2017
About This ReportEvery effort has been made to improve readability and accessibility of this report in print and online.
The Department of Finance supports sustainability and encourages readers to view the report on the Department’s website. Only limited professional printed copies have been produced.
As part of the Department’s focus on continuous improvement, we encourage your feedback about this document.
Email feedback to:[email protected]
Contact details for the Department are listed on the last page of this report.
Department of Finance Annual Report 2016-17© Department of Finance 2017ISSN 2203-594X (Print)ISSN 2203-5958 (Online)
Key LegislationThe Department of Finance complieswith all relevant legislation that governs its functions.
The Department also has responsibility for the administration of 34 Acts and collected taxes, duties and fees, and paid subsidies, grants and rebates during 2016-17 in accordance with legislation.
These are listed in the Appendix on page 116.

CONTENTS
OVERVIEW
Director General’s Foreword 2
What We Do 3
Executive Summary 4
Organisational Structure 6
AGENCY PERFORMANCE
Delivering Value 9
Leading Cross-Government Initiatives 12
Quality Services 15
Building for the Community 18
Our People 21
Significant Issues and Future Outlook 22
Performance Management Framework 24
Summary of Non-Financial Performance Indicators for 2016-17 25
Summary of Financial Performance for 2016-17 26
FINANCIAL STATEMENTS
Certification of Financial Statements 27
Independent Audit Opinion 27
Statement of Comprehensive Income 29
Statement of Financial Position 30
Statement of Changes in Equity 31
Statement of Cash Flows 32
Schedule of Income and Expenses by Service 33
Schedule of Assets and Liabilities by Service 35
Summary of Consolidated Account Appropriations and Income Estimates 36
Notes to the Financial Statements 39
KEY PERFORMANCE INDICATORS
Certification of Key Performance Indicators 94
Performance Assessment 95
State Revenue 96
Government Procurement 98
Corporate Services 100
Building Management and Works 100
Public Utilities Office and Economic Reform 102
DISCLOSURES
Ministerial Directives 104
Other Financial Disclosures 104
Governance Disclosures 106
Other Legal Requirements 109
Government Policy Requirements 113
APPENDIX
Legislation Administered 116
Contacts 117
Department of Finance Annual Report 2016-17 1
CONTENTS OVERVIEWAGENCY
PERFORMANCEFINANCIAL
STATEMENTSKEY PERFORMANCE
INDICATORS DISCLOSURES APPENDIX
2 Department of Finance Annual Report 2016-17
Director General’s Foreword
I am pleased to present the Department of Finance’s Annual Report for 2016-17 which highlights the achievements of the Department over the year.
The Department is committed to making a real difference through its provision of quality advice and services. We provide a breadth of services and expertise and are proud that our culture is focused on collaborating with our customers,and continuously seeking to improve all we do,to deliver increased value and achieve excellence.
The Department’s aspiration to deliver trusted advice and valued services is reflected in our many and varied achievements over the last 12 months. Our achievements demonstrate our commitment to a high performing public sector, which I am proud to showcase in this report.
Our expertise has delivered important community buildings across the State, our advice has playeda role in improving the efficiency of government and our innovative ideas continue to shape the delivery of services to our customers.
I’d like to particularly acknowledge the Department of Finance staff. Our true strength is our people, who have responded quickly to changing circumstances and risen to meet new challenges over the year. I am proud of what we collectively have achieved, which would not be possible without the leadership, innovation, commitment and flexibility of the team.
Looking forward, the Government’s recent machinery of government changes will seetwo of our business units – Economic Reformand the Public Utilities Office – move to the Department of Treasury, where they will nodoubt continue to provide quality adviceto inform Government decisions.
In addition, the Department of Finance will next year welcome Strategic Projects into the agency, which will continue to oversee the construction of unique and complex State building projects like the Perth Stadium and the WA Museum.
This move complements our existingcapability in Building Management and Works.This change in responsibility creates the opportunity to next year consider how we can build synergies across the Department and deliver enhanced value for government.
Over the next year we look forward to supporting the Government’s change agenda by improving efficiency, customer service and workforce capability to deliver even better outcomesfor the Western Australian community.
Anne NolanDirector GeneralDepartment of Finance
CONTENTS OVERVIEWAGENCY
PERFORMANCEFINANCIAL
STATEMENTSKEY PERFORMANCE
INDICATORS DISCLOSURES APPENDIX
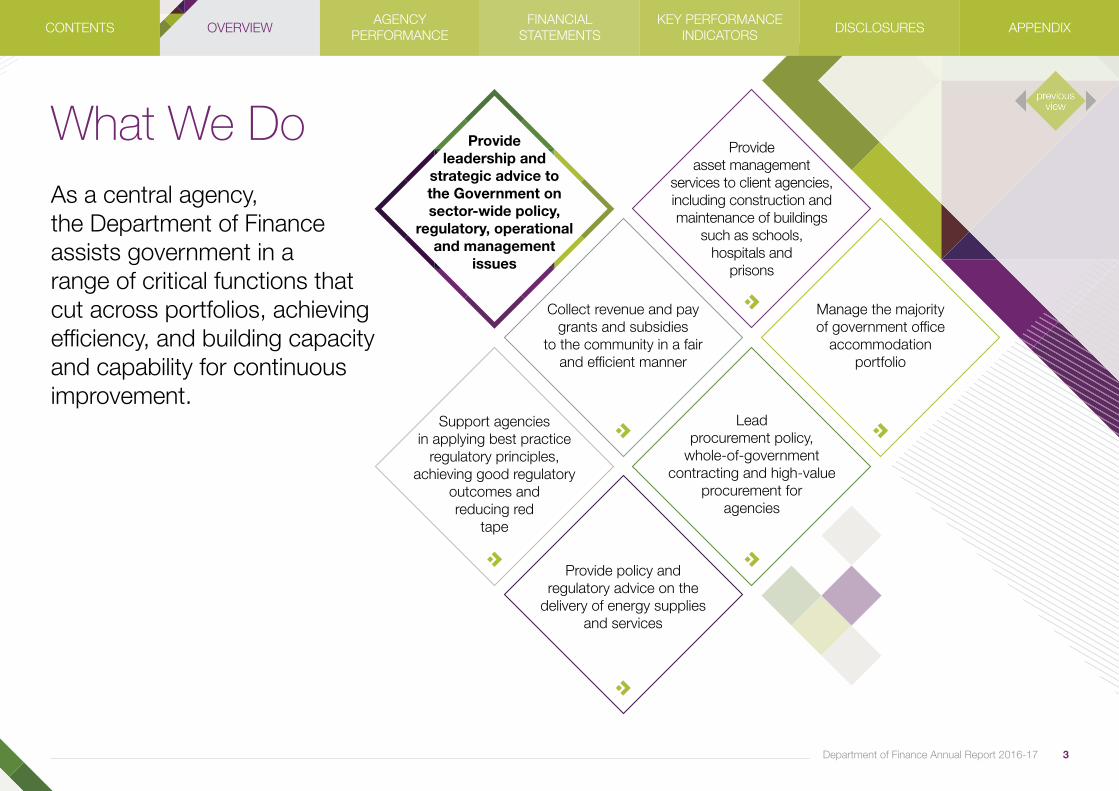
As a central agency,the Department of Finance assists government in a range of critical functions that cut across portfolios, achieving efficiency, and building capacityand capability for continuous improvement.
What We Do Provideleadership and
strategic advice tothe Government on sector-wide policy,
regulatory, operational and management
issues
Provideasset management
services to client agencies, including construction and maintenance of buildings
such as schools,hospitals and
prisons
Leadprocurement policy,
whole-of-government contracting and high-value
procurement foragencies
Collect revenue and pay grants and subsidies
to the community in a fair and efficient manner
Provide policy and regulatory advice on the
delivery of energy supplies and services
Manage the majorityof government office
accommodationportfolio
3
Support agenciesin applying best practice
regulatory principles, achieving good regulatory
outcomes andreducing red
tape
Department of Finance Annual Report 2016-17
CONTENTS OVERVIEWAGENCY
PERFORMANCEFINANCIAL
STATEMENTSKEY PERFORMANCE
INDICATORS DISCLOSURES APPENDIX

4 Department of Finance Annual Report 2016-17
Our strength is in our diversity and in our ability to leverage whole-of-government insights to provide timely, accurate advice that ultimately delivers value-for-money outcomes for Western Australians.
In its commitment to providing the best possiblecustomer service outcomes for its clients,State Revenue continues to expand its online services, reducing the time and effort involved in paying State tax. This year State Revenue has reduced assessment times for duties lodgements by going paperless. Previously, around 70 per centof dutiable transactions were able to be completed online, with the remaining 30 per cent requiring a paper lodgement, due to their complexity.Now over 95 per cent of transactions can be completed digitally, regardless of the transaction’s complexity, in a secure reliable digital environment. All remaining transactions will be moving online in the next financial year.
This year Economic Reform has continued to drive a whole-of-government regulatory reform agenda leading best practice regulatory reform initiatives, and facilitating 90-day regulatory mapping and reform projects with both industry and government stakeholders. These projects seek to identify regulatory and administrative impediments to business activity and thereby stimulate entrepreneurial activity, providing more opportunities for jobs and investment across Western Australia.
• Assisted around 80 State Government entities through the planning, procurement and management of office accommodation including oversight of agreements for lease and the construction of new office space in Joondalup and Fremantle. Find out more on page 12.
• Managed and provided strategic oversight of the Government’s Common Use Arrangement framework, with an estimated annual procurement turnover of $1 billion across government.
• Continued to develop and implement reforms to the electricity market in the South West Interconnected System, to increase the efficiency and effectiveness of institutional arrangements and governance structures.
• Successfully ensured continuity of service to stakeholders throughout the machinery of government transition, farewelling the Public Utilities Office and Economic Reform to the Department of Treasury, and welcoming Strategic Projects to the Department of Finance.
Over the last year, the Department has successfully:
• Collected over $6.8 billion in State taxes and duties and delivered State grants and subsidies worth over $203 million.
• Released a series of 90-day regulatory mapping and reform projects that seek to identify and reduce red tape in a specific sector or industry – making it easier for businesses to open, operate and grow in Western Australia. Find out more on page 14.
• Further enhanced the State’s online revenue systems by extending the number of services available. Duties lodgements can now be completed online via a paperless process, significantly improving assessment times for taxpayers. Find out more on page 17.
• Delivered key elements of the Government’s non-residential capital works program on-time and on-budget, including new high schools, police stations and health facilities across the State. Find out more on page 18.
Executive Summary
CONTENTS OVERVIEWAGENCY
PERFORMANCEFINANCIAL
STATEMENTSKEY PERFORMANCE
INDICATORS DISCLOSURES APPENDIX

This is complemented by a continued focus on identifying and removing red tape within government, highlighted during Repeal Week. This year’s Red Tape Reduction Report Card highlighted 36 of 113 red tape reduction initiatives across all departments, resulting in an estimated saving for the community, industry and government of at least $179 million overfive years.1
The Public Utilities Office continued to provide quality advice and services regarding the State’s energy sector. This year, regulatory changes to transfer the compliance and enforcement functions from the Independent Market Operator to local regulator the Economic Regulation Authority (ERA) took effect on 1 July 2016. This reform has increased the efficiency and effectiveness of institutional arrangements and governance structures, while providing continuity for electricity market participants. Find out more on page 16.
Building upon organisational transformation undertaken within Government Procurement last financial year, the business unit has this yearconsolidated the value of those reforms and enhanced its service delivery to agencies undertaking high value, complex and high risk procurement. This year, there has been a shift in Common Use Arrangement service delivery
through taking a strategic and structured approach, grouping together related goods/services to focus on specific areas of spend. The benefits of the new structure include closer engagement and teamwork with stakeholders and suppliers, depth of category specific knowledge and an emphasis on planning. Find out more on page 13.
In the drive to meet the future needs of the community, Building Management and Works has overseen a works program worth more than $1.6 billion, delivering construction projects in collaboration with other State Government agencies including the Department of Education, Department of Corrective Services, Western Australia Police, the Department of Culture and the Arts, Department of Training and Workforce Development and Department of Health.
In August 2016, the Government introduced measures to improve the security of payment for subcontractors working on government construction contracts. These measuresincluded extending the use of project bank accounts across Building Management and Works projects valued above $1.5 million, tendered after30 September 2016.2 This announcementfollowed a trial conducted by Building Management and Works on seven projects,
which found that the use of these accounts can improve the certainty and timing of payment for subcontractors, enhancing transparency and accountability. Supporting the rollout of this policy initiative, Building Management and Works engaged key stakeholders across the State to outline broad changes to the model, and usedin-house resources to create informative short videos for industry to support policy adoption.
1 Ministerial Media Statement, 10 October 2016 ‘More red tape cut in Repeal Week 2016’2 Ministerial Media Statement, 12 August 2016 ‘Greater protection measures for subcontractors’
5Department of Finance Annual Report 2016-17
CONTENTS OVERVIEWAGENCY
PERFORMANCEFINANCIAL
STATEMENTSKEY PERFORMANCE
INDICATORS DISCLOSURES APPENDIX

Department of Finance Annual Report 2016-17
Director GeneralAnne Nolan
Organisational Structure
Minister for FinanceMinister for
Energy
Internal Audit
Department of Finance
Nicki SucheniaCommissioner
State Revenue
Stephanie BlackExecutive Director
Government Procurement
Bill SullivanDeputy Director General
Building Management
and Works
Andrew DollingDirector
Economic Reform
Shaun WhitmarshExecutive Director
Strategy and Coordination
Andy WoodExecutive Director
CorporateServices
Ray ChallenDeputy Director General
Public Utilities Office
6
CONTENTS OVERVIEWAGENCY
PERFORMANCEFINANCIAL
STATEMENTSKEY PERFORMANCE
INDICATORS DISCLOSURES APPENDIX
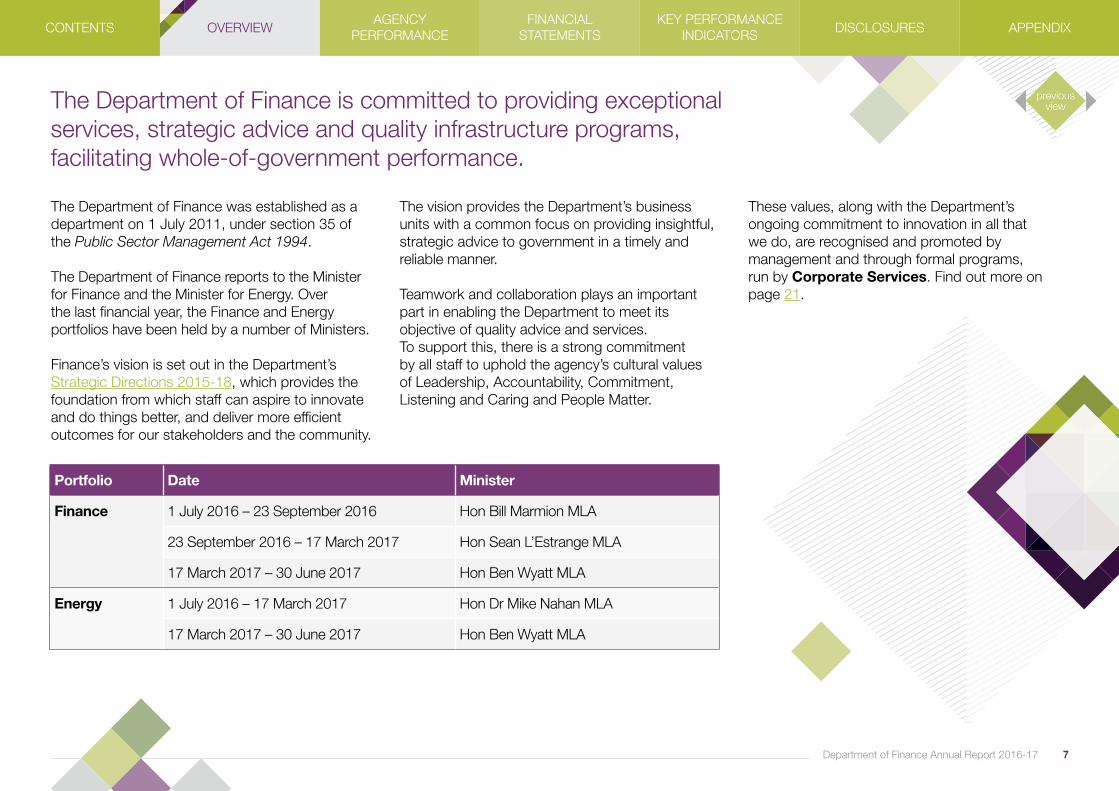
The Department of Finance is committed to providing exceptionalservices, strategic advice and quality infrastructure programs,facilitating whole-of-government performance.
The Department of Finance was established as a department on 1 July 2011, under section 35 of the Public Sector Management Act 1994.
The Department of Finance reports to the Minister for Finance and the Minister for Energy. Over the last financial year, the Finance and Energy portfolios have been held by a number of Ministers.
Finance’s vision is set out in the Department’s Strategic Directions 2015-18, which provides the foundation from which staff can aspire to innovate and do things better, and deliver more efficient outcomes for our stakeholders and the community.
Portfolio Date Minister
Finance 1 July 2016 – 23 September 2016 Hon Bill Marmion MLA
23 September 2016 – 17 March 2017 Hon Sean L’Estrange MLA
17 March 2017 – 30 June 2017 Hon Ben Wyatt MLA
Energy 1 July 2016 – 17 March 2017 Hon Dr Mike Nahan MLA
17 March 2017 – 30 June 2017 Hon Ben Wyatt MLA
7Department of Finance Annual Report 2016-17
These values, along with the Department’songoing commitment to innovation in all thatwe do, are recognised and promoted by management and through formal programs,run by Corporate Services. Find out more on page 21.
The vision provides the Department’s business units with a common focus on providing insightful, strategic advice to government in a timely and reliable manner.
Teamwork and collaboration plays an important part in enabling the Department to meet its objective of quality advice and services.To support this, there is a strong commitmentby all staff to uphold the agency’s cultural valuesof Leadership, Accountability, Commitment, Listening and Caring and People Matter.
CONTENTS OVERVIEWAGENCY
PERFORMANCEFINANCIAL
STATEMENTSKEY PERFORMANCE
INDICATORS DISCLOSURES APPENDIX

We providetrusted advice
and quality servicesto Government and
its agencies
Our Value Proposition
Collaborative,Customer Focused
and Pragmatic
Providerof sector-wide
perspectives and insights
Buildingfor the
Community
DiverseServices, Skills and
Capabilities
LeadingCross-Government
Initiatives
Forward-Thinking,Flexible and
Reform Leading
QualityServices
DeliveringValue
Our AgencyPerformance
Department of Finance Annual Report 2016-178
CONTENTS OVERVIEWAGENCY
PERFORMANCEFINANCIAL
STATEMENTSKEY PERFORMANCE
INDICATORS DISCLOSURES APPENDIX

The Department of Finance continually reforms the way it delivers its programs and servicesto realise significant financial benefits for government and the community.
Delivering Value
This year, Building Management and Workshas introduced significant reforms to improvethe delivery of maintenance services to client agencies occupying non-residential buildings,such as schools, police stations and prisons.
On 1 July 2016, an innovative framework was introduced, appointing a single service provider to deliver maintenance services for seven government agencies within the Perth and Peel regions. This new framework has delivered improved outcomes for government by placing an increased focus on quality and contractor performance, along with collecting information on building assets to enable better decision-making.
Valuable data is now also being collected on the condition of public buildings via the use of drone technology and a specially created app, gathering information on building assets not previously possible. This information, along with insights gathered from the data is then shared with the relevant agency, enabling more strategic, timely and cost-effective maintenance decisions to be made regarding public buildings.
Building Management and Works has also demonstrated its commitment to employing Aboriginal businesses by directly engaging Ngaanyatjarra Repairs and Maintenance to coordinate and deliver breakdown maintenance services for regional public buildings. This includes repairs and unscheduled maintenance workssuch as broken windows, plumbing problems, graffiti and other repair works for 12 communities across the Ngaanyatjarra Lands region.The aggregated value of the work is estimatedto be between $750,000 and $1 million per year, and is part of delivering low-value maintenance services under the regional service alliance.The shift to a single supplier to deliver servicesin the western desert region is expected to realise significant savings, as well as support a regionally based indigenous business employing locals and apprentices.
Government Procurement, through the State Supply Commission’s Open and Effective Competition policy enables government agencies to engage a registered Aboriginal business directly, without undertaking a competitive process for contracts under $250,000. The Department of Finance has taken advantage of this policy to directly engage several suppliers listed under the Aboriginal Business Directory WA to purchase stationery and office furniture. The success of these purchases in meeting operational business requirements while still achieving value-for-money places the Department in a strong position to promote the benefits of this policy across government.
9Department of Finance Annual Report 2016-17
CONTENTS OVERVIEWAGENCY
PERFORMANCEFINANCIAL
STATEMENTSKEY PERFORMANCE
INDICATORS DISCLOSURES APPENDIX

Following the launch of the State’s Information Communication Technology (ICT) strategy,Digital WA, the Department of Finance hasbeen an early mover to strategically align its ICT services to this new vision. Corporate Serviceshas commenced the transition, which will ensure the Department of Finance can realise enhanced value through better service delivery outcomesand lower cost.
This realignment of the Department’s ICT services will empower our business through a secure, reliable and scalable on-demand consumption based ICT service model, enabling Finance to achieve its strategic objectives while delivering ongoing efficiencies and savings.
As a central department servicing other agencies, the Department of Finance is well placed to demonstrate the savings that can be realised by adopting the Digital WA strategy, as well as showcase what is possible by transforming the way public services are designed, supported and delivered to the community.
Ensuring all taxpayers meet their taxation obligations is vital to an efficient and effective tax system. State Revenue continues its efforts to identify taxpayers who do not meet their taxation obligations, including an increased focus on high risk areas within the labour hire and building and construction industries.
Recent enhancements to business intelligence functionality has provided improved capabilityfor identifying tax avoidance and evasion.This system uses data obtained through collaboration with other Commonwealth andState agencies, including interjurisdictionalState revenue offices and the Australian Taxation Office. State Revenue also continues toengage with the Federal Phoenix and Black Economy Taskforces to help improve compliance with existing laws and develop strategies to address deliberate tax evasion.
State Revenue has this year continued to deliver progressive system enhancements via the ongoing Revenue Systems Consolidation and Enhancement Program. This investment will realise timely process improvements and enhanced analytics to State Revenue’s systems, and in 2016-17 delivered improvements to assist in debt recovery case management and records management. The enhancements are expected to cost $32 million over five years to 2018-19.
These and other initiatives enable approximately $4.86 billion in taxes to be collected digitally viathe Revenue Online portal – a fully integrated secure online system, allowing taxpayers and agents to self-assess and pay duty or tax electronically. State Revenue will continue to identify opportunities to streamline processes, and save time for taxpayers and agents. You can find out more about duties lodgements going paperless on page 17.
Collected over $6.8 billionin State taxes and delivered
over $203 million State grants and subsidies
Department of Finance Annual Report 2016-1710
CONTENTS OVERVIEWAGENCY
PERFORMANCEFINANCIAL
STATEMENTSKEY PERFORMANCE
INDICATORS DISCLOSURES APPENDIX
Gateway reviews enhance value and reduce risk in the procurement and delivery of major government projects. Government Procurement facilitates independent experts to undertake assurance reviews of projects at critical decision points through Gateway reviews.
These reviews provide an independent perspective, and challenge the robustness of plans and processes adopted by project teams. Gateway reviews also seek to identify potential issues and intervention strategies to avoid emergent risks, improving overall project governance and management. These outcomes increase the likelihood projects will realise their expected targets and value.
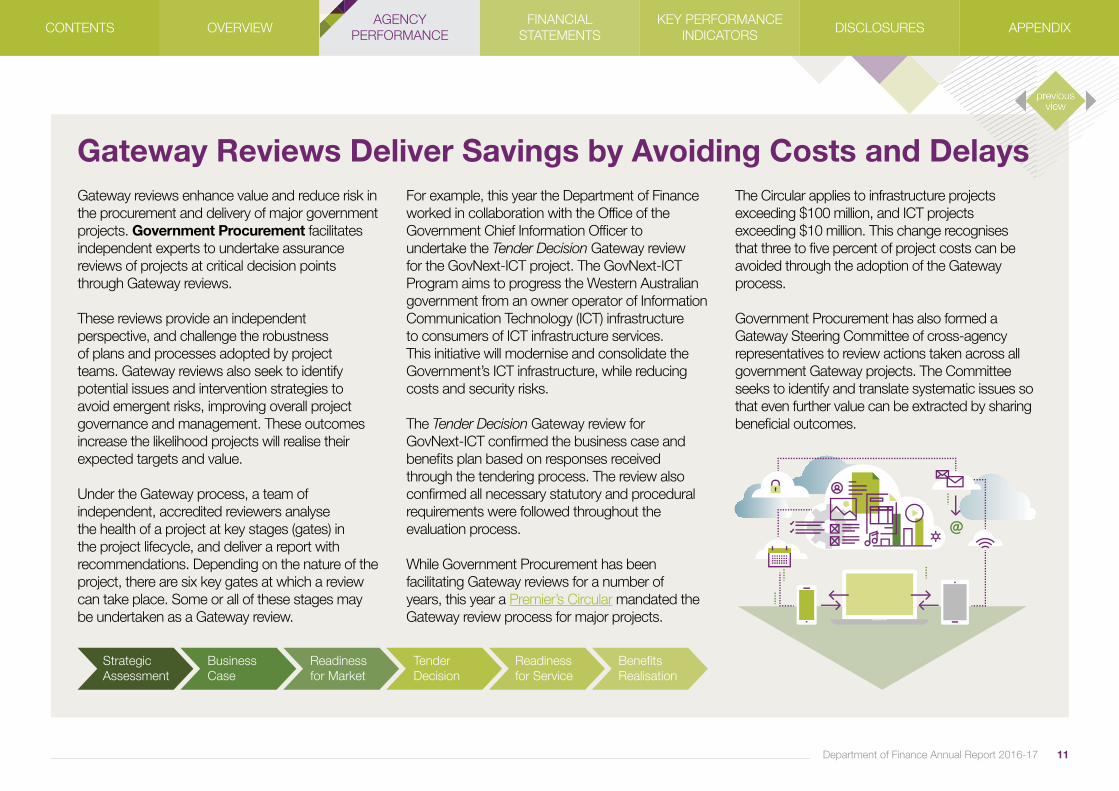
Under the Gateway process, a team of independent, accredited reviewers analyse the health of a project at key stages (gates) in the project lifecycle, and deliver a report with recommendations. Depending on the nature of the project, there are six key gates at which a review can take place. Some or all of these stages may be undertaken as a Gateway review.
For example, this year the Department of Financeworked in collaboration with the Office of theGovernment Chief Information Officer to undertake the Tender Decision Gateway review for the GovNext-ICT project. The GovNext-ICT Program aims to progress the Western Australian government from an owner operator of Information Communication Technology (ICT) infrastructure to consumers of ICT infrastructure services. This initiative will modernise and consolidate the Government’s ICT infrastructure, while reducing costs and security risks.
The Tender Decision Gateway review forGovNext-ICT confirmed the business case and benefits plan based on responses received through the tendering process. The review also confirmed all necessary statutory and procedural requirements were followed throughout the evaluation process.
While Government Procurement has been facilitating Gateway reviews for a number ofyears, this year a Premier’s Circular mandated the Gateway review process for major projects.
Gateway Reviews Deliver Savings by Avoiding Costs and DelaysThe Circular applies to infrastructure projects exceeding $100 million, and ICT projects exceeding $10 million. This change recognises that three to five percent of project costs can be avoided through the adoption of the Gateway process.
Government Procurement has also formed a Gateway Steering Committee of cross-agency representatives to review actions taken across all government Gateway projects. The Committee seeks to identify and translate systematic issues so that even further value can be extracted by sharing beneficial outcomes.
11Department of Finance Annual Report 2016-17
Strategic Assessment
BusinessCase
Readinessfor Market
TenderDecision
Readinessfor Service
BenefitsRealisation
CONTENTS OVERVIEWAGENCY
PERFORMANCEFINANCIAL
STATEMENTSKEY PERFORMANCE
INDICATORS DISCLOSURES APPENDIX

The Department of Finance leads significant cross-government initiatives to deliver enhanced benefits to government, industry and the community.
Leading Cross-Government Initiatives
In December 2016, Western Australia signed the Intergovernmental Agreement on Competition and Productivity-enhancing Reforms. As a Party to this Agreement, Western Australia has an opportunity to support competition and innovation across the State, to improve outcomes for businesses, communities and overall economic growth. In its role of supporting whole-of-government regulatory and microeconomic initiatives, Economic Reform has been collaborating with the Department of Treasury to coordinate initial regulatory reform work under the Agreement, and has reached out to agencies for their input.
This process of reviewing regulation for its impact on competition also creates an opportunity to examine regulatory frameworks more broadly,to reduce red tape and to ensure they are ableto accommodate the introduction of new innovations and industry disruptions. Work onthis whole-of-government legislative review program will continue into the next financial year.
Economic Reform continues to champion red tapereduction initiatives across the public sector, andlead the Government’s regulatory reform agenda.
As part of Repeal Week in October 2016,the Government released its second Red Tape Reduction Report Card, highlighting 36 examplesof action to cut red tape that save time, money and make life easier for industry. In total, the identified initiatives are expected to deliver approximately $179 million in savings over five years3, highlighting regulatory and process improvements across priority areas such as transport and business licensing. In addition tothe release of the Report Card, two red tape reduction Bills were introduced to Parliament.On 28 November 2016, the Statutes (Repeals)Bill 2016 received Royal Assent and on1 December 2016, the Licensing Provisions Amendment Bill 2015 also received Royal Assent after being introduced into Parliament inNovember 2015.
Building Management and Works takesa strategic portfolio approach to coordinatewhole-of-government office accommodationand fitouts for general government agencies. Taking this portfolio approach has realised significant savings through the co-location of agencies within buildings, reducing government’s overall requirement for office space. This initiative has the added benefit of enhancing agency collaboration and reducing duplication throughthe sharing of building facilities. These initiatives, along with the effective negotiation of government office accommodation lease terms all contributeto realising significant savings for government.
Consistent with the Planning Commission’s Directions 2031 and Beyond framework,Building Management and Works has pursuedthe development of metropolitan activity centres on rail routes through its decentralisation strategy. In July 2016, the Government announced an
Department of Finance Annual Report 2016-1712
3 Ministerial Media Statement, 10 October 2016 ‘More red tape cut in Repeal Week 2016’
CONTENTS OVERVIEWAGENCY
PERFORMANCEFINANCIAL
STATEMENTSKEY PERFORMANCE
INDICATORS DISCLOSURES APPENDIX
agreement for lease and construction of new office space in Joondalup, located within walking distance of rail and bus facilities.4 More than800 public servants from the Department of Water, Department of Environment Regulation and the Office of the Environmental Protection Authorityare scheduled to relocate by early 2019.
In addition, the Department facilitated the negotiation and signing of an agreement forlease and construction of new office space inFremantle, as part of the Kings Square Precinct.5 Building construction is expected to get underway in the next financial year, where eventually 1,500 public servants from the Housing Authority, Department of Corrective Services and Department of Transport are expected to relocate in the second quarter of 2020.
Other government office accommodation initiatives completed include:
• The Karratha Quarter project, which has seen the co-location of 11 agencies into a newly constructed, state-of-the art building in November 2016.
• The successful relocation and consolidation of elements of corporate services for Western Australia Police into vacant space at Westralia Square during October 2016.
• The relocation of the Department of Commerce into existing tenancies at the Mason Bird Building in Cannington, and Gordon Stephenson House in Perth.
• The successful negotiation of favourable lease terms for QBE House (200 St Georges Terrace, Perth) which, in conjunction with space rationalisation, is anticipated to result in a 20 per cent reduction in the leased area to be occupied by State Revenue, and over $19 million in avoided costs to the Government over the term of the lease.
Government Procurement continues to offer extensive advice and support to the Department of Finance’s sub-department, the Office of the Government Chief Information Officer, regarding the GovNext-ICT Program. In January 2017, government awarded contracts to supply information and communication technology (ICT) infrastructure as a service across government,for the next five years. It is estimated this Common Use Arrangement will generate annual savings of $65 to $80 million6 as government transitions to a regime where agencies pay for what they use.
Under the new arrangement, government agencies will purchase through one contract from three vendors which will continuously compete to sell their ICT infrastructure services,
reducing procurement costs and delays for both government and suppliers.
Government Procurement’s advice was instrumental in ensuring the contract could operate effectively within government’s existing procurement framework, while supporting agencies as they transition to the new contract arrangements.
In parallel, Government Procurement continues to enable agencies across the public sector to realise value through its ongoing management of 39 Common Use Arrangements. These arrangements streamline the easy purchase of goods and services commonly used within government agencies, streamlining public sector purchasing of items like fuel, courier services, computers and stationery.
This year, there has been a shift in Common Use Arrangements service delivery with the implementation of category management,a strategic and structured approach that groups together related goods/services to focus on specific areas of spend. Consequently, Government Procurement has structured its service model into seven new categories. The benefits of the new structure include closer engagement and teamwork with stakeholders and suppliers, and an enhanced depth of category specific knowledge and expertise, with an emphasis on planning and ongoing use of analytical tools.
4 Ministerial Media Statement, 14 July 2016 ‘New public sector offices for Joondalup’5 Ministerial Media Statement, 10 November 2016 ‘New public sector offices for Fremantle’6 Ministerial Media Statement, 20 January 2017 ‘Government ICT contracts to deliver savings’
13Department of Finance Annual Report 2016-17
CONTENTS OVERVIEWAGENCY
PERFORMANCEFINANCIAL
STATEMENTSKEY PERFORMANCE
INDICATORS DISCLOSURES APPENDIX
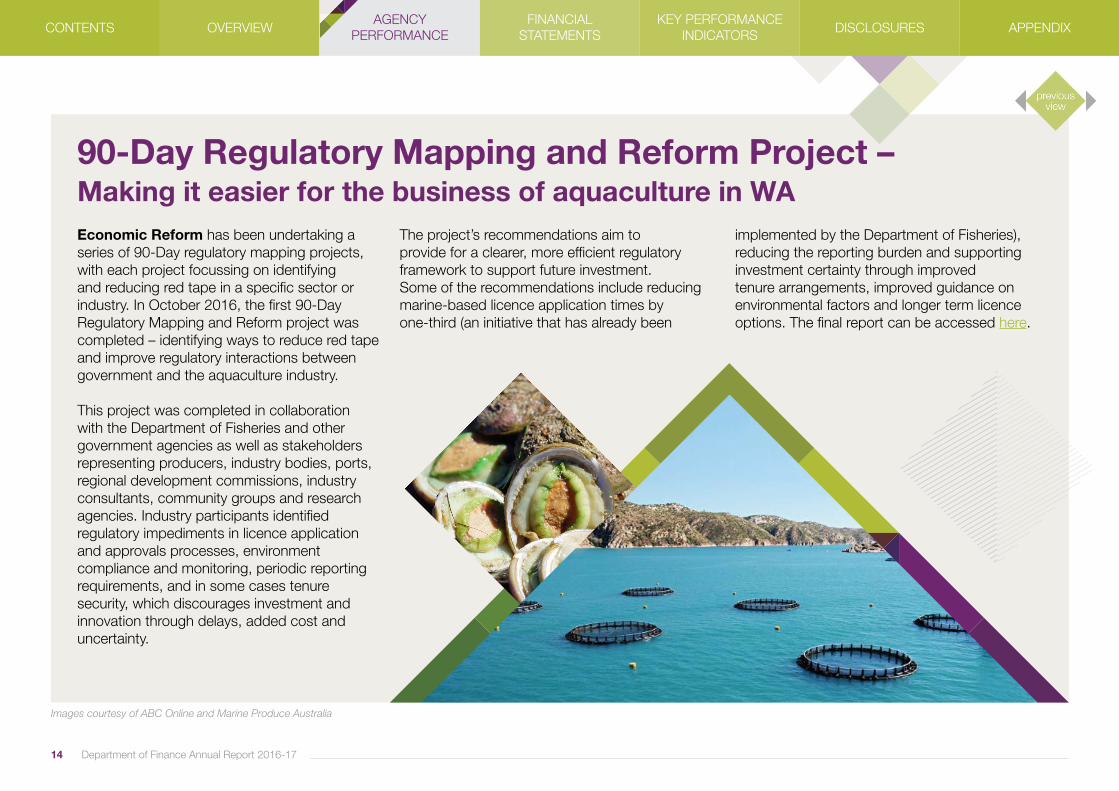
Economic Reform has been undertaking a series of 90-Day regulatory mapping projects, with each project focussing on identifying and reducing red tape in a specific sector or industry. In October 2016, the first 90-Day Regulatory Mapping and Reform project was completed – identifying ways to reduce red tape and improve regulatory interactions between government and the aquaculture industry.
This project was completed in collaborationwith the Department of Fisheries and other government agencies as well as stakeholders representing producers, industry bodies, ports, regional development commissions, industry consultants, community groups and research agencies. Industry participants identifiedregulatory impediments in licence applicationand approvals processes, environmentcompliance and monitoring, periodic reporting requirements, and in some cases tenure security, which discourages investment and innovation through delays, added cost and uncertainty.
The project’s recommendations aim toprovide for a clearer, more efficient regulatory framework to support future investment.Some of the recommendations include reducing marine-based licence application times by one-third (an initiative that has already been
90-Day Regulatory Mapping and Reform Project –Making it easier for the business of aquaculture in WA
implemented by the Department of Fisheries), reducing the reporting burden and supporting investment certainty through improved tenure arrangements, improved guidance on environmental factors and longer term licence options. The final report can be accessed here.
Images courtesy of ABC Online and Marine Produce Australia
Department of Finance Annual Report 2016-1714
CONTENTS OVERVIEWAGENCY
PERFORMANCEFINANCIAL
STATEMENTSKEY PERFORMANCE
INDICATORS DISCLOSURES APPENDIX
The Department of Finance is committed to providing exceptional services to deliver enhanced stakeholder value.
Quality Services
Government Procurement continues to focus its services to assist client agencies in the procurement of major contracts. In addition to the ongoing collaboration with the Office of the Government Chief Information Officer on the GovNext-ICT Common Use Arrangement, the team has worked with the Department of Corrective Services regarding the Court Security and Custodial Services Contract, valued at$720 million. As part of the Delivering Community Services in Partnership Policy, Government Procurement also supported the Department of Local Government and Communities to procure State-wide parenting centres, offering a range of community services for families.
Government Procurement has also collaborated with the Department of Health to develop a contract for the provision of Community Based Renal Dialysis Services. The contract comprises the services of five satellite dialysis units in the Perth metropolitan area and a State-wide ‘home therapies program’, valued at $269 million.
The team has also supported Health during theprocurement process for a Transition Care Program, providing older people in our community more time and care after their hospital stay, while enabling families to make longer term support arrangements. This step-up, step-down program provides care in a non-hospital environment and reduces pressure on the State’s hospitals.
With regard to managing the Government’s fleet of vehicles, the challenge has been to realise efficiencies without compromising day-to-day agency operations. With this in mind, Government Procurement has engaged agencies to better understand their fleet requirements, and offer tailored solutions in order to rationalise vehicle numbers and reduce related debt.
To better reflect the effort that goes into delivering new government buildings for agencies, as of1 July 2016 Building Management and Works initiated a change to the way it charges client agencies for managing capital works projects. The new arrangements are designed to reflect actual costs incurred, and are consistent with best practice, enhancing transparency and flexibility.
Over the year, these new arrangements have seen a reduction in fees charged to agencies for most capital works projects, with agencies able toinfluence charges by working in collaboration with Building Management and Works. A similar approach has been taken in the development of a funding model to be applied to Building Management and Works maintenance services as of 1 July 2017.
Quickly implementing policies of the Government in a way that enhances clarity for stakeholders is an example of the way the Department of Finance is committed to providing quality services.In relation to changes to the first home owner grant policy that have been made over thelast year, State Revenue supported prospective first home buyers by providing a comprehensive first home owner grant information guide online. With the first home owner grant policy changes seeing an 84 per cent increase in website activity and a 21 per cent increase in telephone contact to the call centre, this information has been valuable in supporting those impacted by the policy changes.
15Department of Finance Annual Report 2016-17
CONTENTS OVERVIEWAGENCY
PERFORMANCEFINANCIAL
STATEMENTSKEY PERFORMANCE
INDICATORS DISCLOSURES APPENDIX
The Public Utilities Office continued to provide quality advice and services regarding the State’s energy sector. In order to provide continuity for electricity market participants, regulatory changes to transfer the compliance and enforcement functions from the Independent Market Operator to local regulator the Economic Regulation Authority (ERA), took effect on 1 July 2016. This move has increased the efficiency and effectiveness of institutional arrangements and governance structures of the electricity market in the South-West of the State. In this new role, the ERA monitors participant compliance under the Wholesale Electricity Market Rules and also the Gas Services Information Rules, investigates potential breaches of the rules, and takes enforcement action where appropriate.
Legislative and regulatory changes to transfer electricity system management responsibilities from Western Power to the Australian Energy Market Operator also took effect on 1 July 2016. These changes enhance the coordination of electricity system management functions with the day-to-day operations and commercial outcomes of the Wholesale Electricity Market.
As a result of further regulatory changes,the Public Utilities Office has facilitated the establishment of an independent Rule Change Panel, to undertake the administration and decision-making functions for changes to the Wholesale Electricity Market Rules and theGas Services Information Rules. Appointments to the Rule Change Panel were announced on 1 January 2017, and rule-making functions commenced on 3 April 2017.
The Public Utilities Office is also focussed on cutting red tape for the State’s growing solar industry, and this year facilitated access to a new licence exemption to make it easier for solar companies to provide energy solutions to consumers. The benefits of this initiative include greater choice and access for consumers to solar energy technology. Previously, the cost to business of obtaining a licence and complying with its requirements had proven prohibitive for companies intending to sell energy fromroof-top solar systems through power purchase agreements, acting as a barrier to entry into the emerging market. By cutting red tape through implementing the exemption, the emerging
Distributed over $78 million to eligible WA First Home Owner
Grant recipients
market has the opportunity to develop,enhancing consumer choice to access innovative renewable sources of electricity at an affordable price. To date, 14 companies have been provided with this form of licence exemption.
Department of Finance Annual Report 2016-1716
CONTENTS OVERVIEWAGENCY
PERFORMANCEFINANCIAL
STATEMENTSKEY PERFORMANCE
INDICATORS DISCLOSURES APPENDIX

State Revenue continued to reduce manual processes and improve efficiency for industry members by allowing more types of dutiable transactions to be lodged online for assessment. This further streamlining to the State’s online revenue collection application Revenue Online enables industry members to complete a greater range of duties transactions digitally, overcoming the need to lodge paper records for assessment, saving time and money.
Previously, around 70 per cent of dutiable transactions were able to be completed online, with the remaining 30 per cent still requiring a paper lodgement, due to their complexity. Now over 95 per cent of transactions can be completed digitally, regardless of the transaction’s complexity, with the remaining transactions moving online in 2017-18.
The Duties Online Lodgment portal allows for the lodgement, assessment and payment of transactions not approved for self-assessment to be completed using Revenue Online, rather
than a paper lodgement, reducing assessment times by around 15 days. This initiative is another example of State Revenue’s commitment to deliver innovative online solutions to cut red tape and meet industry requirements via a secure and reliable digital platform.
State Revenue Continuesto Enhance its Digital Services
STA
TE
RE
VE
NU
E AG
EN
T
Electricdocument
reviewed by OSR
Correspondece issued via portal
in real time
Documents and correspondence sent
via agent through portal in real time
Transactionlodged by agent
through Revenue Online
Documents retainedby agent
Paymentmade electronically
Certificate of duty printed by agent
from portal
Assessment notice issued through portal
17Department of Finance Annual Report 2016-17
CONTENTS OVERVIEWAGENCY
PERFORMANCEFINANCIAL
STATEMENTSKEY PERFORMANCE
INDICATORS DISCLOSURES APPENDIX

Delivered a construction program valued over $1.6 billion
in collaboration with State Government agencies
The Department of Finance continues to deliver facilities and services across Western Australia through the provision of physical, social and economic infrastructure.
Building for the Community
This year, Building Management and Works has overseen the on-time, on-budget delivery of many significant projects including:
• Three high schools, on behalf of the Department of Education:
- Harrisdale Secondary College ($51 million)
- Willetton Senior High Stage 2 ($14 million)
- Joseph Banks Secondary College Stage 2 ($19 million);
• Three police stations on behalf of Western Australia Police:
- Cockburn ($20 million)
- Ballajura ($8 million)
- Mundijong ($9 million);
• Western Australian Museum Collection Resource Centre ($17.4 million);
• Women’s Remand Centre ($24.3 million); and
• Additional core library facilities for the Department of Mines and Petroleum ($8 million).
These along with a range of other projects covering some 15 government agencies have contributed to the delivery of improved services to the Western Australian community.
In collaboration with the Western Australian Country Health Service, Building Management and Works continues to deliver a $330 million capital works program across regional areas. The Southern Inland Health Initiative will improve hospital infrastructure in 36 towns across the Wheatbelt, Great Southern, Mid West and South West. The project includes upgrades to 26 small hospitals and nursing posts across inland towns, as well as the development of a brand new hospital in Manjimup.
In addition, five district hospitals in Collie, Katanning, Merredin, Narrogin, and Northam are being redeveloped. The redevelopments will include new integrated primary health centre facilities, expanded and refurbished emergency departments, as well as upgraded treatment, surgical, waiting and administrative areas.
New health centres in Pingelly, Cunderdin and Mullewa are progressing and also form part of the program. Work on the Southern Inland Health Initiative will continue into next year.
Department of Finance Annual Report 2016-1718
CONTENTS OVERVIEWAGENCY
PERFORMANCEFINANCIAL
STATEMENTSKEY PERFORMANCE
INDICATORS DISCLOSURES APPENDIX
19Department of Finance Annual Report 2016-17
In acknowledging concerns raised by industry regarding security of payment for subcontractors working on government construction projects, the Department implemented a package of measures across its construction projects valued above $1.5 million.7 The measures included the implementation of project bank accounts, and followed a trial conducted by Building Management and Works to streamline the payment process along the supply chain, improving transparency and accountability. Western Australia became the first jurisdiction in Australia to roll out this initiative in support of subcontractors, by applying it to all applicable construction projects tendered from30 September 2016 by Building Managementand Works.
The first contract to be awarded under thenew project bank account arrangement was Rapid’s Landing Primary School in Margaret River, and as of 30 June 2017, more than 20 projects have been awarded using this mechanism. Building Management and Works is committedto continuing to collaborate with industry andother stakeholders to further simplify the model with an aim to streamline administration ofthe policy.
Facilitated by the Public Utilities Office,the State Underground Power Program isone of the State’s most successful energy policy initiatives, which has delivered underground power to over 86,000 properties since its commencement in 1996. The program is a partnership between the Western Australian Government, Western Power and local governments to replace overhead power lines in established areas with undergroundpower infrastructure.
This year, the Public Utilities Office ran anupdated selection process for Round Six of the program. The new selection criteria allowed local governments to offer to pay a larger share of project costs to increase the competitivenessof their proposals. This enabled a greaternumber of underground projects to be delivered within the State Government’s program budget.On 27 January 2017, the Government announced the 17 successful residential projects selectedto receive funding8, a record number for this initiative.
7 Ministerial Media Statement, 12 August 2016 ‘Greater protection measures for subcontractors’8 Ministerial Media Statement, 27 January 2017 ‘Underground power for record 17 Perth projects’
CONTENTS OVERVIEWAGENCY
PERFORMANCEFINANCIAL
STATEMENTSKEY PERFORMANCE
INDICATORS DISCLOSURES APPENDIX

The Sunset Heritage Precinct was opened to the community for the first time in its 112-year history on 27 November 2016. The former Sunset Hospital site has been revitalised by the Department of Finance after successfully completing Phase 1 of the Sunset Transformation Strategy, which will ultimately see the Precinct become a hub for arts, cultural and community purposes.
Enhancements to the site completed byBuilding Management and Works includes extensive landscaping across the precinct, enabling the public access to the parklands forthe first time in 20 years. Other upgrades include new public toilet facilities, barbeque and picnic facilities, and a new nature playground,donated by Sultan Ibrahim Ismail of Johor.
These works complement significant services infrastructure upgrades made by the Department across the site, including water, sewerage, power and fire services.
Most of the original heritage buildings remain fenced off for safety reasons. Their future use and conservation will form an important part of the next phase in the revitalisation of the Precinct.
While it will take a number of years tofully transform the site for arts, cultural,community and ancillary commercialpurposes, these works to datedemonstrate a commitmenttowards the conservationof this unique heritageasset for the futureuse and benefitof the widercommunity.
A New Era for theSunset Heritage Precinct
Department of Finance Annual Report 2016-1720
CONTENTS OVERVIEWAGENCY
PERFORMANCEFINANCIAL
STATEMENTSKEY PERFORMANCE
INDICATORS DISCLOSURES APPENDIX

Our true strength is our people who demonstrate leadership, innovation, commitment and flexibility in all they do
Our People
The Department of Finance’s value proposition is the foundation from which staff can aspire to innovate and do things better. Supporting this is a strong commitment by all staff to uphold the agency’s cultural values of Leadership, Accountability, Commitment, Listening and Caring and People Matter.
These values, along with the Department’songoing commitment to innovation in all that we do,are recognised and promoted by managementand through formal programs, run by Corporate Services.
Staff from across the Department lead Finance’s Innovation Champion’s Group to encourage, actively promote, support the implementation of, and recognise innovative ideas and projects across the agency. The Group also actively leads and promotes an innovative culture across the Department by facilitating annual FINnovation Awards, recognising staff for demonstrating behaviours that exemplify our values.
This year the Group sponsored a trial to optimise parking bay utilisation through the use of an app. If successful, this initiative could have wider application across government.
The Department of Finance continues to lead and support an interagency mentoring program. Six agencies across the public sector participate, where mentors and mentees are paired from different agencies, providing opportunities to grow employee networks and facilitate future collaboration. In addition to facilitating the program, this year 29 Department of Finance staff participated in the program, 13 as mentors and 16 as mentees.
The Department of Finance continues to raise awareness of, and encourage staff to contribute to our reconciliation journey. This year, National Islanders Day Observance Committee (NAIDOC) week was celebrated with staff located in the Optima Centre building in Osborne Park, in collaboration with the Department of Training and Workforce Development. Action taken by the committee to promote opportunities and support staff engagement has realised meaningful outcomes through the employment of Aboriginal businesses to provide stationary products for the agency, as well as maintenance contracts in regional Western Australia. Find out more on page 9.
The Department of Finance Graduate Program has been recognised as one of the best in the public sector, with many graduates pursuing successful careers within the Department following completion of the program.
A unique approach in recruiting and selecting candidates has been a key success factor, where applicants are asked to submit a short video as part of the recruitment process. Applicants from diverse backgrounds, not just those with business qualifications, are encouraged to apply.
This approach to selecting candidates helps to ensure applicants with a broad range of skills are selected, complementing the diverse skill sets required to work across Finance’s varied business units. Over the year long program, candidates complete three rotations across Finance’s diverse business units, grounding participants in key transferable skills.
21Department of Finance Annual Report 2016-17
CONTENTS OVERVIEWAGENCY
PERFORMANCEFINANCIAL
STATEMENTSKEY PERFORMANCE
INDICATORS DISCLOSURES APPENDIX

Department of Finance Annual Report 2016-17
Significant Issues and Future OutlookEfficiencies and Opportunities in ChangeThe Government’s Public Sector Renewal9 program represents a period of significant change and opportunity for the public sector and the Department.
A key component of the program is theService Priority Review. As a central agency,the Department will collaborate with theService Priority Review on measures that canbe implemented to bring about cultural change and efficiency within the public sector.
In addition, the Department intends to contribute to the Public Sector Renewal program through leadership of a Directors General Working Group on Public Sector Efficiency. The Working Group will focus on reducing internal red tape which adds to costs, restricts innovation and limits performance in the public sector. The Working Group will recommend improvements that increase efficiency, such as the simplification of processes and approvals, as well as the removal of duplicated reporting requirements.
As part of Public Sector Renewal, the Department has also implemented machinery of government changes welcoming Strategic Projects to the Department of Finance on 1 July 2017. The initial focus of this move will be on ensuring continuity in the delivery of key projects such as the Perth Stadium and the new Western Australian Museum, as well as understanding the business.
Looking further ahead, attention will shift to exploring synergies and leveraging opportunities across the Department to deliver enhanced value for government and better outcomes.
Reforms to Support Government ObjectivesIn response to the changing landscape of the sector, demand for the Department’s expertise is growing across the breadth of services it provides, reflecting the needs of government, agencies, business and communities.
An example is the work of State Revenue, looking for ways to enhance the efficiency of its existing taxation, grant and subsidy settings that will assist with budget repair. State Revenue will seek to ensure taxation related changes are implemented promptly in order to improve revenue collection outcomes.
An increased investigation presence is also being applied in areas such as labour hire industries. State Revenue will continue assisting other agencies by providing revenue collection expertise to influence the design of new policy initiatives.
This work, coupled with the ongoing expansion and enhancements of online services for duty assessment, continues to sharpen State Revenue’s focus on the efficient and effective administration of revenue collection.
22
9 Ministerial Media Statement, 28 April 2017 ‘Major changes introduced to create a more efficient public sector’
CONTENTS OVERVIEWAGENCY
PERFORMANCEFINANCIAL
STATEMENTSKEY PERFORMANCE
INDICATORS DISCLOSURES APPENDIX
Building Management and Works is also thinking differently about how government approaches asset management, by building its capability to achieve industry best practice. With office accommodation the second largest expense for most government agencies, the Department will be applying a portfolio approach across the public sector to extract maximum value, and prepare the way for a more agile public service. This approach aims to enhance value-for-money outcomes for agencies, and provide more efficient, effective and sustainable workplaces that enhance community access.
Another area where the Department can drive positive change across the sector is through the advice Government Procurement provides to agencies. This advice includes ensuring that, where possible, goods and services are purchased from local businesses to maximise employment opportunities within the State. Finance will seek new ways to empower agencies to support the economic participation of not only local business, but Aboriginal businesses, disability enterprises and the not-for-profit sector.
Extending the Department’s current data analytics capability will be another area of focus that will lead to more informed decisions and better value-for-money outcomes for government.
Enhancing Organisational Performance to Deliver ValueThe delivery of these reforms will need to be supported by the ongoing development of the Department’s capability.
A key development initiative is the Digital Finance Transition Program, which will enhance the Department’s ability to consider alternativeservice delivery models and implement technology solutions that automate business processesand improve service efficiency and effectiveness.
Complementing this, the Department will seekto embrace more flexible workplace design,initially at the Optima Centre Building located in Osborne Park.
The flexible workplace design will aim to create a more collaborative, productive and efficient workplace by providing employees with greater mobility and a choice of workplace settings that best suit different tasks. This builds on an 18-month trial using the flexible workplace methodology within one of Finance’s business units. Key learnings from this trial, along with best practice activity-based working concepts will inform the future planning of that office space, in collaboration with staff.
Our commitment to lead a mobile,agile workforce is also supported by ournew organisational performance framework,which better connects individual capabilitywith achievement of the Department’s objectives. The framework will assist in developing theskills needed to sustain high performance,and reinforces behaviours that demonstratethe Department’s values. Through leading by example in these initiatives,the Department seeks to demonstrate whatis possible across government. This will create opportunities to enhance public sector efficiency and improve the responsiveness of government services delivered across the State.
23Department of Finance Annual Report 2016-17
CONTENTS OVERVIEWAGENCY
PERFORMANCEFINANCIAL
STATEMENTSKEY PERFORMANCE
INDICATORS DISCLOSURES APPENDIX
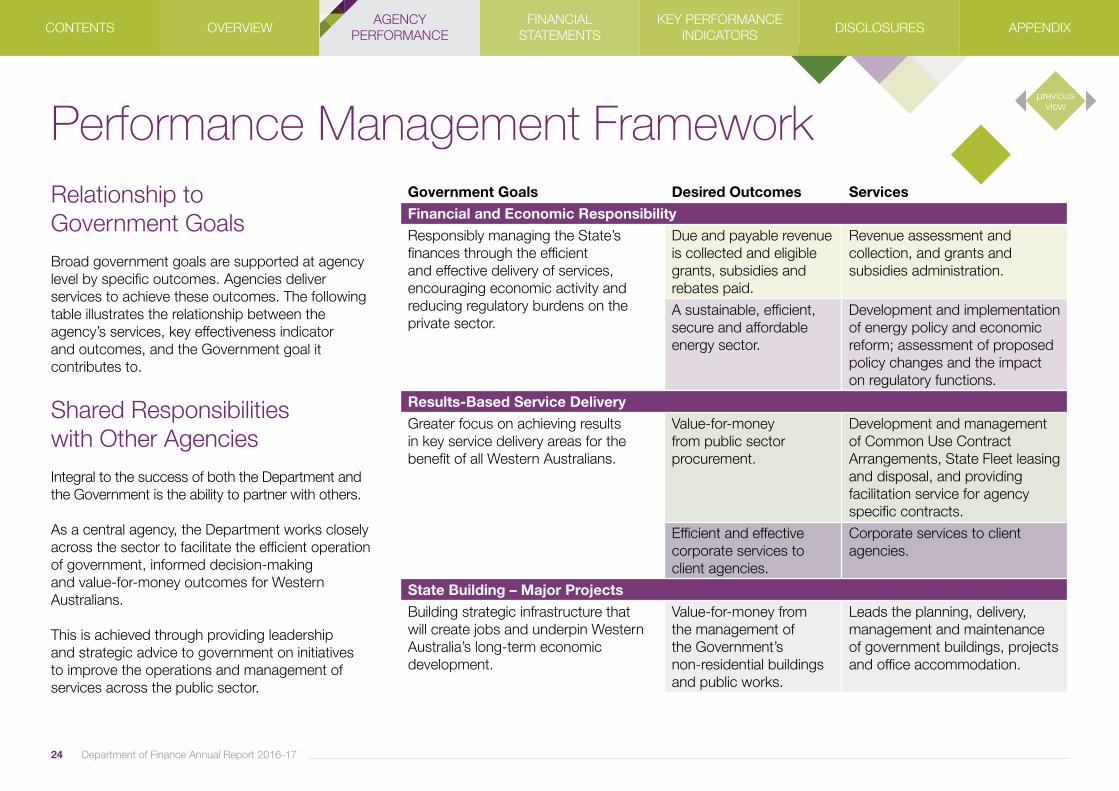
Performance Management FrameworkRelationship toGovernment GoalsBroad government goals are supported at agency level by specific outcomes. Agencies deliver services to achieve these outcomes. The following table illustrates the relationship between the agency’s services, key effectiveness indicatorand outcomes, and the Government goal it contributes to.
Shared Responsibilities with Other AgenciesIntegral to the success of both the Department andthe Government is the ability to partner with others.
As a central agency, the Department works closely across the sector to facilitate the efficient operation of government, informed decision-making and value-for-money outcomes for Western Australians.
This is achieved through providing leadership and strategic advice to government on initiatives to improve the operations and management of services across the public sector.
Government Goals Desired Outcomes ServicesFinancial and Economic ResponsibilityResponsibly managing the State’s finances through the efficient and effective delivery of services, encouraging economic activity and reducing regulatory burdens on the private sector.
Due and payable revenue is collected and eligible grants, subsidies and rebates paid.
Revenue assessment and collection, and grants and subsidies administration.
A sustainable, efficient, secure and affordable energy sector.
Development and implementation of energy policy and economic reform; assessment of proposed policy changes and the impact on regulatory functions.
Results-Based Service DeliveryGreater focus on achieving results in key service delivery areas for the benefit of all Western Australians.
Value-for-money from public sector procurement.
Development and management of Common Use Contract Arrangements, State Fleet leasing and disposal, and providing facilitation service for agency specific contracts.
Efficient and effective corporate services to client agencies.
Corporate services to client agencies.
State Building – Major ProjectsBuilding strategic infrastructure that will create jobs and underpin Western Australia’s long-term economic development.
Value-for-money fromthe management ofthe Government’snon-residential buildings and public works.
Leads the planning, delivery, management and maintenance of government buildings, projects and office accommodation.
24 Department of Finance Annual Report 2016-17
CONTENTS OVERVIEWAGENCY
PERFORMANCEFINANCIAL
STATEMENTSKEY PERFORMANCE
INDICATORS DISCLOSURES APPENDIX

25Department of Finance Annual Report 2016-17
Outcome
Key Effectiveness Indicator Unit Target Actual Stats Page
Extent to which due revenue is collected % 87 88 96
Extent to which correct grants, subsidies and rebates are paid % 100 99.9 (a) 96
Profitability of the State’s light vehicle fleet $000 13,457 16,671 98
Extent to which client agencies agree that their agency contracts and Common Use Contract Arrangements achieved value-for-money % 90 93 98
An effectiveness indicator is not reported for this outcome N/A N/A N/A -
Percentage of significant projects in the New Buildings Program delivered within 10% of approved budget % 100 100 100
The extent to which policy and program development objectives for the year are achieved % 100 83 (b) 102
Service
Key Efficiency Indicator Unit Target Actual Stats Page
Cost per $100 of revenue raised $ 0.71 0.76 (c) 97
Average cost per application/claim processed $ 11.41 10.52 97
Average administrative cost per vehicle for financing and managing the State Fleet service $ 102 104 (d) 99
Cost of developing and managing whole-of-government Common Use Contract Arrangements as a percentage of the total annual value of purchases through the arrangements
% 1.5 1.5 99
Cost of facilitating the development and management of agency specific contracts as a percentage of the contract award value % 2.0 2.0 99
An efficiency indicator is not reported for this service N/A N/A N/A -
Average office accommodation floor space per work point m2 15.0 15.0 101
Percentage of maintenance services delivered within 10% of approved timeframe % 80 78.1 (e) 101
Percentage of significant projects in the New Buildings Program delivered within three months of approved timeframe % 90 100 101
Average cost of policy/project development $ 22,687 20,831 103
Percentage of Regulatory Impact Statements assessed within agreed timeframes % 90 95.8 103
(a) Two of 467,292 applications were incorrectly paid during 2016-17.(b) A number of policies were realigned during 2016-17 impacting on achieved outcomes. Further information available on page 102.
(c) Revenue collections are significantly below initial estimates. Further information is shown on page 97.(d) Overall government vehicle numbers have dropped during 2016-17. Further information is available on page 99.(e) This indicator has continued to improve towards the targeted efficiency level. Further information is available on page 101.
Summary of Non-Financial Performance for 2016-17
CONTENTS OVERVIEWAGENCY
PERFORMANCEFINANCIAL
STATEMENTSKEY PERFORMANCE
INDICATORS DISCLOSURES APPENDIX

Actual results versus estimate
Estimate(a) $000
Actual$000
Variance$000
Reason for significant variation between actual and estimate
Total cost of services (expense limit)
1,359,762 1,242,978 (116,784) Actual expenditure was below estimate primarily due to a reduction in the whole-of-government capital works program delivered by Building Management and Works on behalf of government agencies.
Net cost of services (188,321) (169,737) 18,584 Net cost of services was lower than initial estimates largely due to savings achieved through the acceleration of the Agency Expenditure Review savings program and improved outcomes achieved in State Fleet profitability.
Total equity 1,224,383 1,115,061 (109,322) Total equity has been impacted by the downward revaluation of government accommodation assets.
Net increase/(decrease) in cash held
20,619 (24,043) (44,662) Cash balances decreased primarily due to a reduction in payables.
Approved salary expense level
135,536 102,092 (33,444) The Department accelerated the Agency Expenditure Review program during 2016-17 resulting in staff savings in advance of the original budget timeframes. In addition, Government Procurement devolved staff to agencies to support procurement activity under $250,000.
Agreed borrowing limit 111,624 101,816 (9,808) Borrowings repayment schedules were accelerated due to the increased sale of vehicles associated with the exit of Water Corporation from State Fleet arrangements.
Working cash limit 61,573 60,119 (1,454) The total cash balance was $74,187,000 of which $3,569,000 was restricted cash and $10,499,000 was capital funding – subject to project requirements and carryover approval by government.
The Department of Finance 2016-17 gross expense allocation was approximately $1.24 billion, funded largely through the charging of other government departments for building works, maintenance and leasing ($0.99 billion). The other key funding sources are appropriations of $0.17 billion and other revenue sources of $0.08 billion.
The $1.24 billion in expenses primarily relates to building works across the whole of government ($1.00 billion), employee expenses ($0.11 billion) anddepreciation ($0.07 billion).
(a) Approved as part of the 2016-17 State Budget process.
Further explanations are contained in Note 44 of the financial statements.
26 Department of Finance Annual Report 2016-17
Summary of Financial Performance for 2016-17
CONTENTS OVERVIEWAGENCY
PERFORMANCEFINANCIAL
STATEMENTSKEY PERFORMANCE
INDICATORS DISCLOSURES APPENDIX
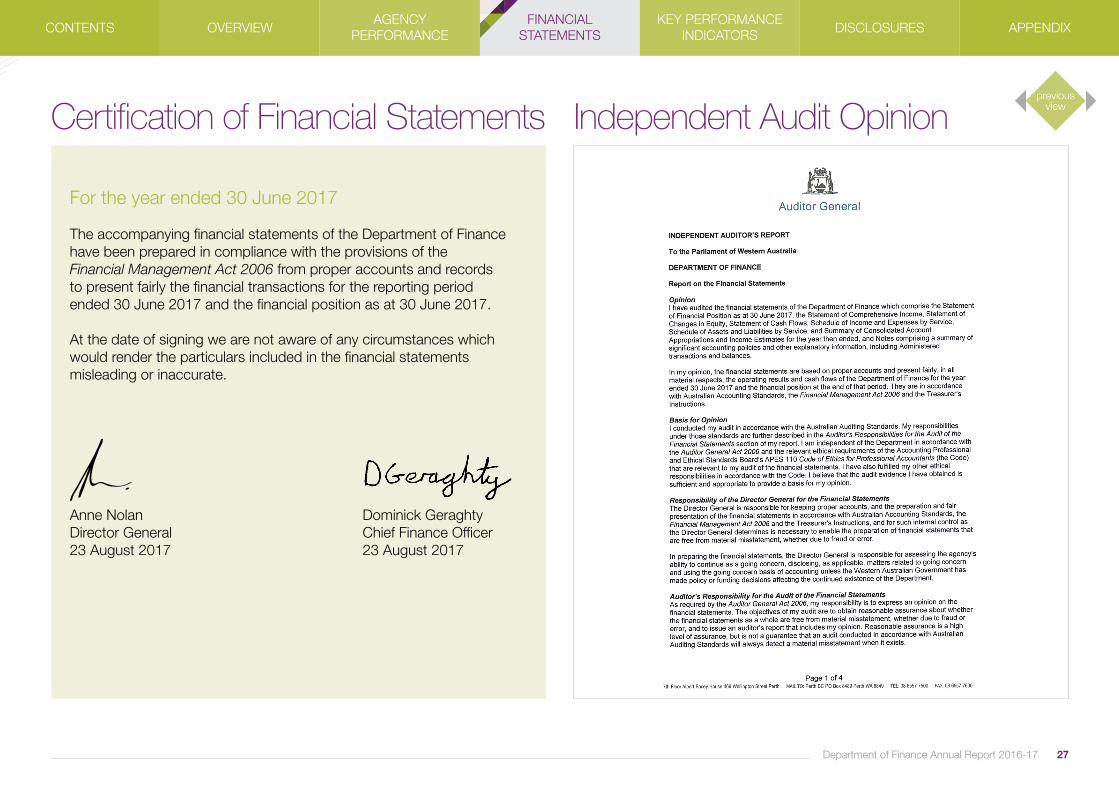
Certification of Financial Statements
For the year ended 30 June 2017
The accompanying financial statements of the Department of Finance have been prepared in compliance with the provisions of theFinancial Management Act 2006 from proper accounts and recordsto present fairly the financial transactions for the reporting periodended 30 June 2017 and the financial position as at 30 June 2017.
At the date of signing we are not aware of any circumstances which would render the particulars included in the financial statements misleading or inaccurate.
Anne Nolan Dominick GeraghtyDirector General Chief Finance Officer23 August 2017 23 August 2017
Independent Audit Opinion
27Department of Finance Annual Report 2016-17
CONTENTS OVERVIEWAGENCY
PERFORMANCEFINANCIAL
STATEMENTSKEY PERFORMANCE
INDICATORS DISCLOSURES APPENDIX

28 Department of Finance Annual Report 2016-17
Independent Audit Opinion (continued)
CONTENTS OVERVIEWAGENCY
PERFORMANCEFINANCIAL
STATEMENTSKEY PERFORMANCE
INDICATORS DISCLOSURES APPENDIX
Note 2017$000
2016 $000
COST OF SERVICES
Expenses
Employee benefits expenses 7 114,499 129,453
Supplies and services 8 971,330 870,487
Depreciation and amortisation expense 9 71,513 79,031
Finance costs 10 8,615 9,003
Accommodation expenses 11 42,236 38,894
Grants and subsidies 12 754 3,761
Loss on disposal of non-current assets 15 10 1
Other expenses 13 34,021 51,783
Total cost of services 1,242,978 1,182,413
Income
Revenue 14
User charges and fees 1,058,030 947,333
Commonwealth grants and contributions 3,492 1,684
Interest revenue 473 219
Other revenue 10,615 8,443
Total revenue 1,072,610 957,679
Gains
Gain on disposal of non-current assets 15 631 666
Total gains 631 666
Total income other than income from State Government
1,073,241 958,345
NET COST OF SERVICES (169,737) (224,068)
Note 2017$000
2016 $000
Income from State Government 17
Service appropriations 167,150 188,932
Services received free of charge 13,303 14,518
Royalties for Regions Fund 125 127
Total income from State Government 180,578 203,577
SURPLUS/(DEFICIT) FOR THE PERIOD 10,841 (20,491)
OTHER COMPREHENSIVE INCOME
Items not reclassified subsequently to profit or loss
Changes in asset revaluation surplus 33 - (18,665)
Total other comprehensive income - (18,665)
TOTAL COMPREHENSIVE INCOME FOR THE PERIOD
10,841 (39,156)
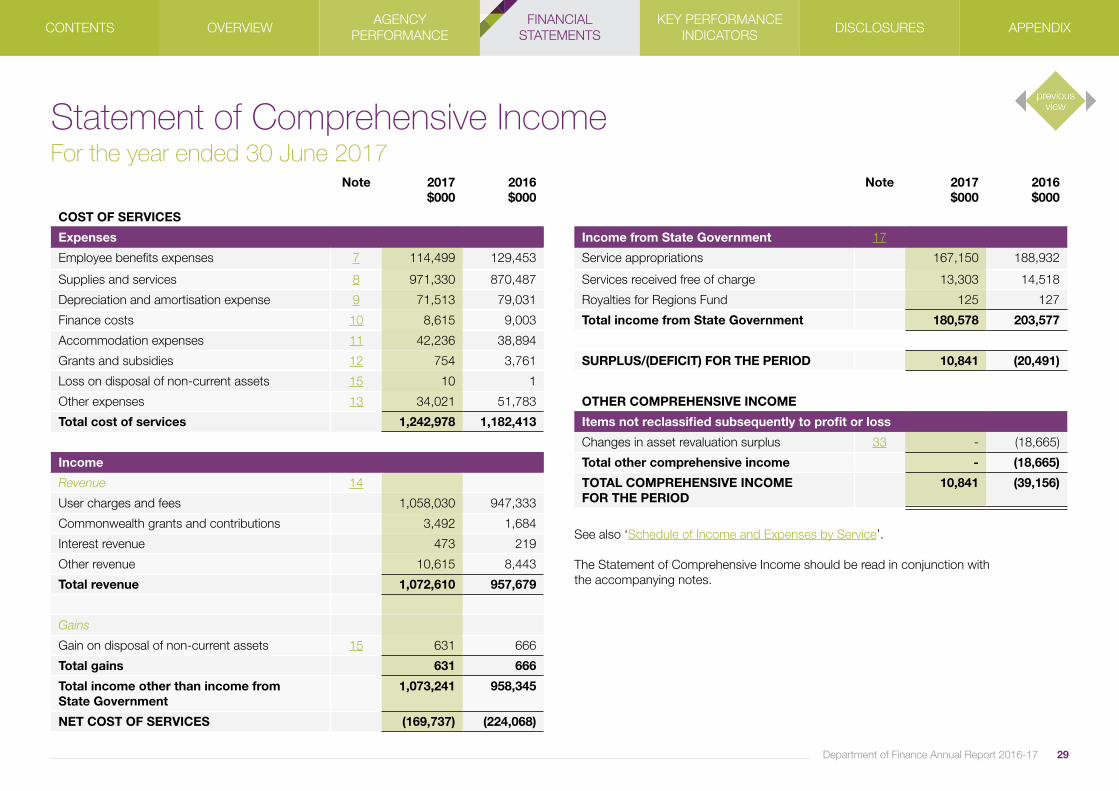
See also ‘Schedule of Income and Expenses by Service’.
The Statement of Comprehensive Income should be read in conjunction with the accompanying notes.
29Department of Finance Annual Report 2016-17
Statement of Comprehensive IncomeFor the year ended 30 June 2017
CONTENTS OVERVIEWAGENCY
PERFORMANCEFINANCIAL
STATEMENTSKEY PERFORMANCE
INDICATORS DISCLOSURES APPENDIX

Note 2017$000
2016 $000
Assets
Current assets
Cash and cash equivalents 18 70,618 85,247
Restricted cash and cash equivalents 19 3,171 12,983
Receivables 20 176,431 294,710
Finance lease receivables 21 494 583
Amounts receivable for services 22 2,250 1,531
Other current assets 23 29,254 28,852
Total current assets 282,218 423,906
Non-current assets
Restricted cash and cash equivalents 19 398 -
Receivables 20 1,948 -
Finance lease receivables 21 597 1,214
Amounts receivable for services 22 461,896 410,183
Property, plant, equipment and vehicles 24 720,374 768,737
Intangible assets 26 31,805 29,516
Other non-current assets 23 6,440 2,129
Total non-current assets 1,223,458 1,211,779
TOTAL ASSETS 1,505,676 1,635,685
Note 2017$000
2016 $000
Liabilities
Current liabilities
Payables 28 115,613 275,418
Borrowings 29 24,040 30,302
Provisions 30 27,916 27,889
Lease incentives 31 13,604 9,612
Other current liabilities 32 24,055 26,996
Total current liabilities 205,228 370,217
Non-current liabilities
Borrowings 29 77,776 98,014
Provisions 30 6,360 6,869
Lease incentives 31 101,251 85,349
Total non-current liabilities 185,387 190,232
TOTAL LIABILITIES 390,615 560,449
NET ASSETS 1,115,061 1,075,236
Equity 33
Contributed equity 1,055,928 1,026,944
Accumulated surplus 59,133 48,292
TOTAL EQUITY 1,115,061 1,075,236
See also ‘Schedule of Assets and Liabilities by Service’.
The Statement of Financial Position should be read in conjunction with the accompanying notes.
30 Department of Finance Annual Report 2016-17
Statement of Financial PositionAs at 30 June 2017
CONTENTS OVERVIEWAGENCY
PERFORMANCEFINANCIAL
STATEMENTSKEY PERFORMANCE
INDICATORS DISCLOSURES APPENDIX

Note Contributed Equity $000
Reserves $000
Accumulated surplus/(deficit) $000
Total Equity $000
33
Balance at 1 July 2015 996,594 18,665 68,783 1,084,042
Deficit - - (20,491) (20,491)
Other comprehensive income - (18,665) - (18,665)
Total comprehensive income for the period - (18,665) (20,491) (39,156)
Transactions with owners in their capacity as owners:
Capital appropriations 84,268 - - 84,268
Contributions by owners 5,250 - - 5,250
Distributions to owners (59,169) - - (59,169)
Total 30,349 - - 30,349
Balance at 30 June 2016 1,026,943 - 48,292 1,075,236
Balance at 1 July 2016 1,026,944 - 48,292 1,075,236
Deficit
Other comprehensive income - - 10,841 10,841
Total comprehensive income for the period - - 10,841 10,841
Transactions with owners in their capacity as owners:
Capital appropriations 28,763 - - 28,763
Contributions by owners 245 - - 245
Distributions to owners (24) - - (24)
Total 28,984 - - 28,984
Balance at 30 June 2017 1,055,928 - 59,133 1,115,061
The Statement of Changes in Equity should be read in conjunction with the accompanying notes.
31Department of Finance Annual Report 2016-17
Statement of Changes in EquityFor the year ended 30 June 2017
CONTENTS OVERVIEWAGENCY
PERFORMANCEFINANCIAL
STATEMENTSKEY PERFORMANCE
INDICATORS DISCLOSURES APPENDIX
Note 2017$000
2016 $000
Cash Flows from State GovernmentService appropriations 113,948 151,719
Capital appropriations 28,763 84,268
Holding account drawdowns 770 1,469
Royalties for Regions Fund 125 127
Regional Infrastructure and Headworks Fund 245 5,250
Non-retained revenue distributed to owner (24) (96)
Net cash provided by State Government 143,827 242,738
Utilised as follows:
Cash Flows from Operating ActivitiesPayments
Employee benefits (113,736) (135,221)
Supplies and services (a) (944,694) (859,722)
Finance costs (7,359) (7,743)
Accommodation (40,804) (21,959)
Grants and subsidies (754) (3,763)
GST payments on purchases (112,146) (107,281)
GST payments to taxation authority (6,136) (3,972)
Other payments (4,945) (3,730)
Receipts
User charges and fees 1,011,354 938,279
Commonwealth grants and contributions 3,337 1,665
Interest received 382 214
GST receipts on sales 109,127 103,120
GST receipts from taxation authority 7,491 8,688
Other receipts 6,859 8,676
Net cash used in operating activities 34 (92,024) (82,750)
Note 2017$000
2016 $000
Cash Flows from Investing Activities
Payments
Purchase of non-current physical assets (a) (148,153) (199,917)
Receipts
Proceeds from sale of non-current physical assets
71,559 40,212
Receipts from lease incentives 27,762 39,638
Net cash used in investing activities (48,832) (120,067)Cash Flows from Financing ActivitiesPayments
Repayment of borrowings (30,689) (20,487)
Receipts
Proceeds from borrowings 2,923 4,408
Finance leases receipts 753 598
Net cash used in financing activities (27,014) (15,481)
Net increase/(decrease) in cash and cash equivalents
(24,043) 24,439
Cash and cash equivalents at the beginning of the period
98,230 73,792
CASH AND CASH EQUIVALENTS AT THE END OF THE PERIOD
34 74,187 98,230
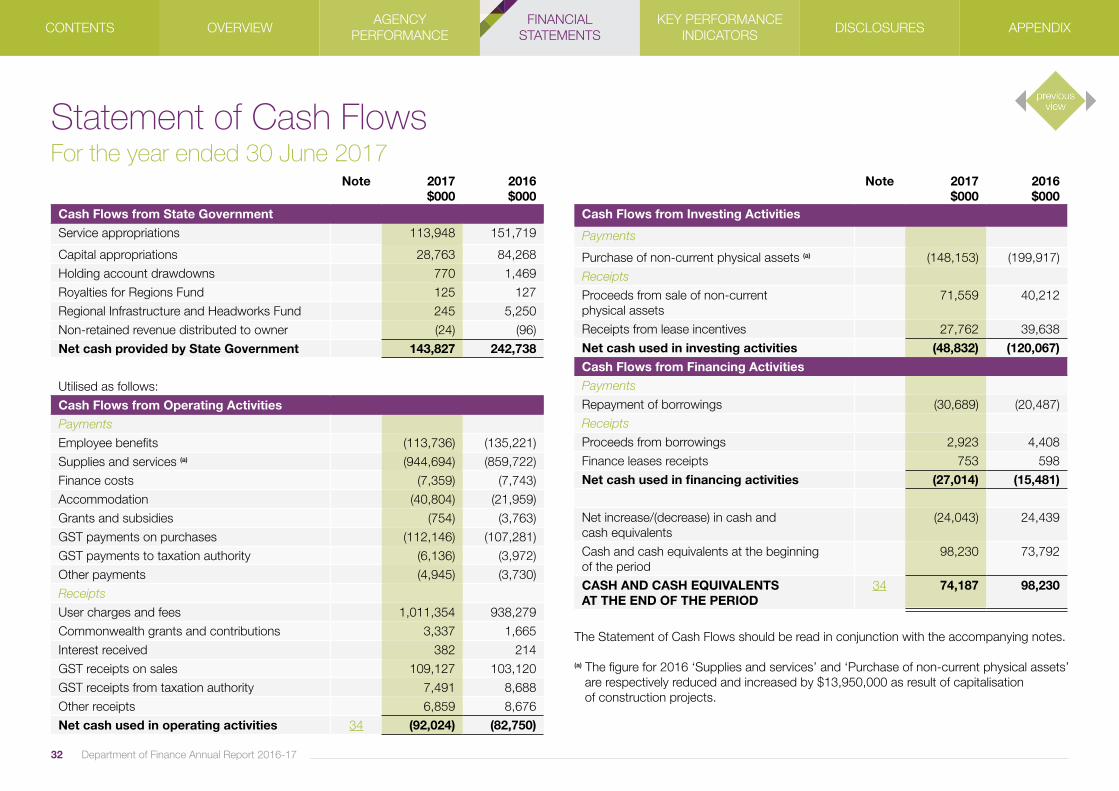
The Statement of Cash Flows should be read in conjunction with the accompanying notes.
(a) The figure for 2016 ‘Supplies and services’ and ‘Purchase of non-current physical assets’ are respectively reduced and increased by $13,950,000 as result of capitalisation of construction projects.
32 Department of Finance Annual Report 2016-17
Statement of Cash FlowsFor the year ended 30 June 2017
CONTENTS OVERVIEWAGENCY
PERFORMANCEFINANCIAL
STATEMENTSKEY PERFORMANCE
INDICATORS DISCLOSURES APPENDIX
Service 1 Service 2 Service 3 Service 4 Service 5 Total
2017 $000
2016 $000
2017 $000
2016 $000
2017 $000
2016 $000
2017 $000
2016 $000
2017 $000
2016 $000
2017 $000
2016 $000
COST OF SERVICES
Expenses
Employee benefits expense 31,335 30,412 21,439 30,922 3,937 3,858 47,914 53,831 9,874 10,430 114,499 129,453
Supplies and services 17,621 18,126 8,970 11,822 2,309 1,598 937,751 829,950 4,679 8,991 971,330 870,487
Depreciation and amortisation expense
2,984 3,363 42,866 47,507 453 1,027 25,085 26,884 125 250 71,513 79,031
Finance costs - - 1,928 2,477 - - 6,687 6,526 - - 8,615 9,003
Accommodation expenses 4,641 4,386 2,060 2,222 405 355 34,276 31,124 854 807 42,236 38,894
Grants and subsidies - - 363 8 - - 5 - 386 3,753 754 3,761
Loss on disposal ofnon-current assets
- - - - - - 10 1 - - 10 1
Other expenses 404 241 368 891 250 181 32,913 50,305 86 165 34,021 51,783
Total cost of services 56,985 56,528 77,994 95,849 7,354 7,019 1,084,641 998,621 16,004 24,396 1,242,978 1,182,413
Income
User charges and fees 2,719 2,895 68,398 73,912 - - 986,913 870,525 - - 1,058,030 947,333
Commonwealth grants and contributions
62 73 - - - - 3,430 1,611 - - 3,492 1,684
Interest revenue - - 473 219 - - - - - - 473 219
Other revenue 210 198 2,257 5,543 596 334 7,453 2,325 100 43 10,615 8,443
Gain on disposal of non-current assets
- - 631 666 - - - - - - 631 666
Total income other than income from State Government
2,991 3,166 71,759 80,339 596 334 997,796 874,461 100 43 1,073,241 958,345
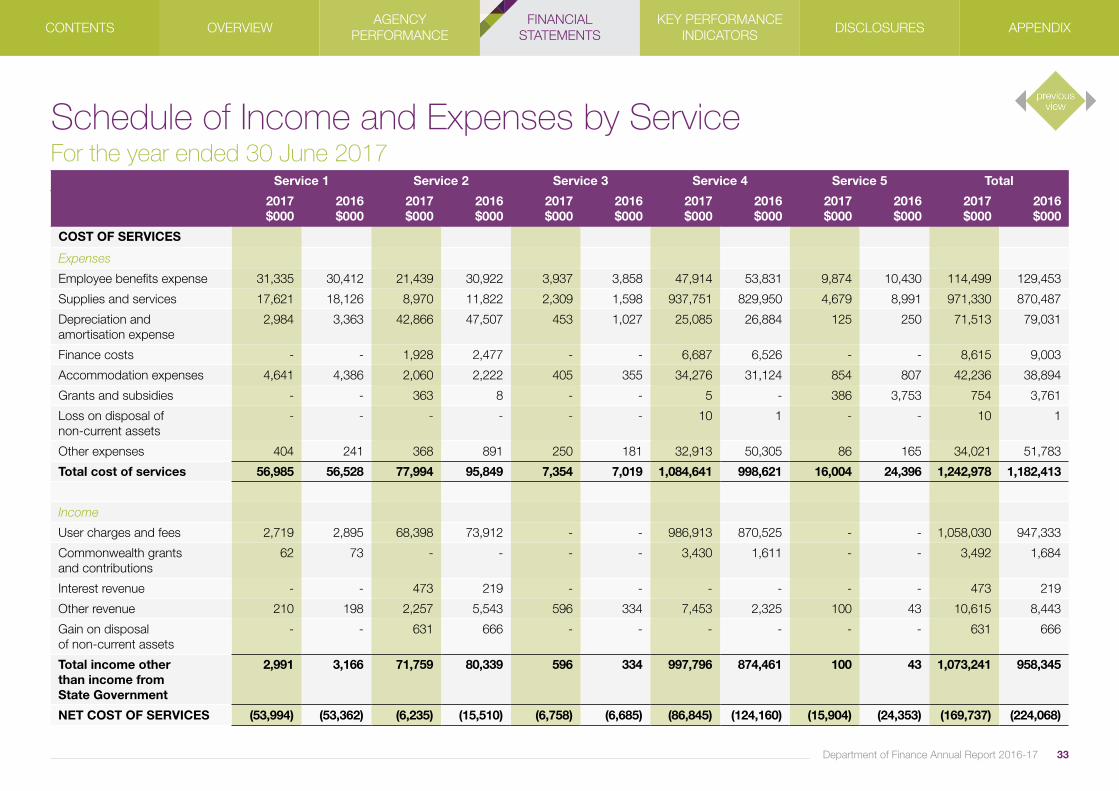
NET COST OF SERVICES (53,994) (53,362) (6,235) (15,510) (6,758) (6,685) (86,845) (124,160) (15,904) (24,353) (169,737) (224,068)
33Department of Finance Annual Report 2016-17
Schedule of Income and Expenses by ServiceFor the year ended 30 June 2017
CONTENTS OVERVIEWAGENCY
PERFORMANCEFINANCIAL
STATEMENTSKEY PERFORMANCE
INDICATORS DISCLOSURES APPENDIX

Service 1 Service 2 Service 3 Service 4 Service 5 Total
2017 $000
2016 $000
2017 $000
2016 $000
2017 $000
2016 $000
2017 $000
2016 $000
2017 $000
2016 $000
2017 $000
2016 $000
INCOME FROM STATE GOVERNMENT
Service appropriations 42,372 53,680 30,781 19,812 6,150 6,685 69,129 78,930 18,718 29,826 167,150 188,932
Resources received free of charge
12,321 12,884 21 73 20 - 616 903 326 656 13,303 14,518
Royalties for Regions Fund - - - - - - 125 127 - - 125 127
Total income from State Government
54,693 66,564 30,802 19,885 6,169 6,685 69,870 79,960 19,044 30,482 180,578 203,577
SURPLUS/DEFICIT FOR THE PERIOD
700 13,202 24,568 4,375 (589) - (16,976) (44,200) 3,140 6,129 10,841 (20,491)
The Schedule of Income and Expenses by Service should be read in conjunction with the accompanying notes.
Service 1: Revenue assessment and collection, and grants and subsidies administrationService 2: Development and management of Common Use Contract Arrangements, State Fleet leasing and disposal, and providing facilitation service for agency specific contractsService 3: Corporate services to client agenciesService 4: Leads the planning, delivery, management and maintenance of government buildings, projects and office accommodationService 5: Development and implementation of energy policy and economic reform, assessment of proposed policy changes and the impact on regulatory functions
34 Department of Finance Annual Report 2016-17
Schedule of Income and Expenses by ServiceFor the year ended 30 June 2017
CONTENTS OVERVIEWAGENCY
PERFORMANCEFINANCIAL
STATEMENTSKEY PERFORMANCE
INDICATORS DISCLOSURES APPENDIX
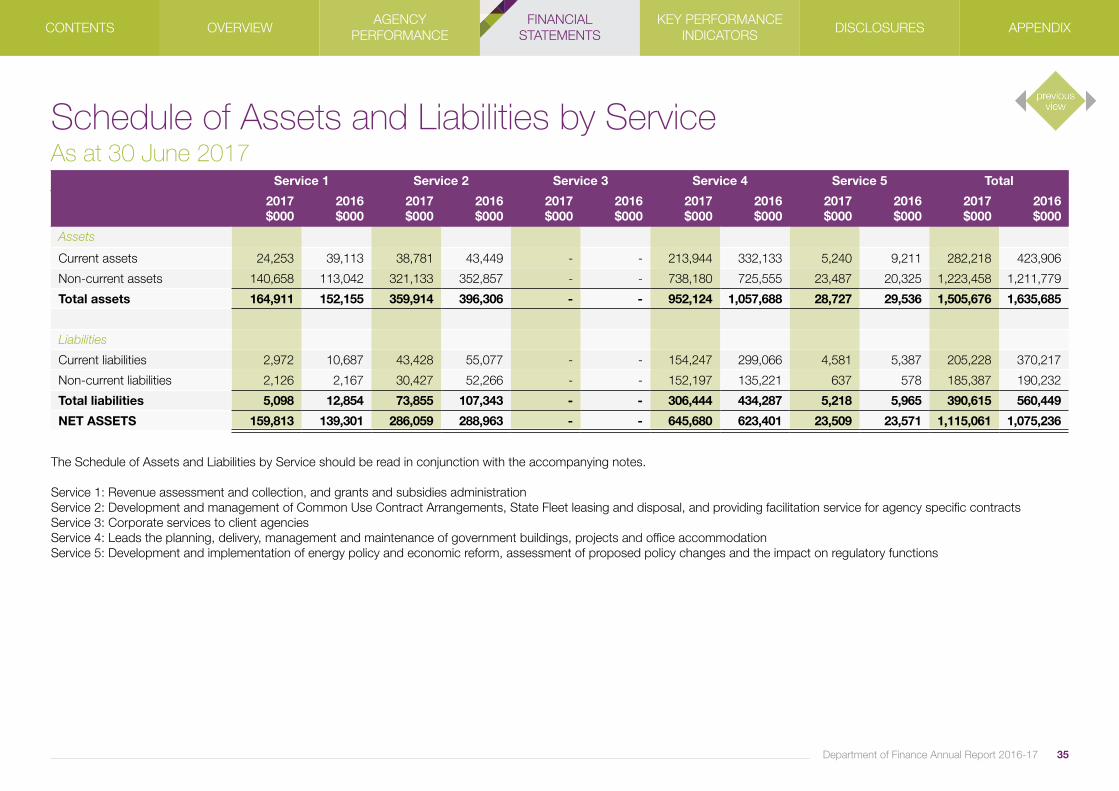
The Schedule of Assets and Liabilities by Service should be read in conjunction with the accompanying notes.
Service 1: Revenue assessment and collection, and grants and subsidies administrationService 2: Development and management of Common Use Contract Arrangements, State Fleet leasing and disposal, and providing facilitation service for agency specific contractsService 3: Corporate services to client agenciesService 4: Leads the planning, delivery, management and maintenance of government buildings, projects and office accommodationService 5: Development and implementation of energy policy and economic reform, assessment of proposed policy changes and the impact on regulatory functions
Service 1 Service 2 Service 3 Service 4 Service 5 Total
2017 $000
2016 $000
2017 $000
2016 $000
2017 $000
2016 $000
2017 $000
2016 $000
2017 $000
2016 $000
2017 $000
2016 $000
Assets
Current assets 24,253 39,113 38,781 43,449 - - 213,944 332,133 5,240 9,211 282,218 423,906
Non-current assets 140,658 113,042 321,133 352,857 - - 738,180 725,555 23,487 20,325 1,223,458 1,211,779
Total assets 164,911 152,155 359,914 396,306 - - 952,124 1,057,688 28,727 29,536 1,505,676 1,635,685
Liabilities
Current liabilities 2,972 10,687 43,428 55,077 - - 154,247 299,066 4,581 5,387 205,228 370,217
Non-current liabilities 2,126 2,167 30,427 52,266 - - 152,197 135,221 637 578 185,387 190,232
Total liabilities 5,098 12,854 73,855 107,343 - - 306,444 434,287 5,218 5,965 390,615 560,449
NET ASSETS 159,813 139,301 286,059 288,963 - - 645,680 623,401 23,509 23,571 1,115,061 1,075,236
35Department of Finance Annual Report 2016-17
Schedule of Assets and Liabilities by ServiceAs at 30 June 2017
CONTENTS OVERVIEWAGENCY
PERFORMANCEFINANCIAL
STATEMENTSKEY PERFORMANCE
INDICATORS DISCLOSURES APPENDIX

2017 Estimate
$000
2017 Actual
$000
Variance
$000
2017 Actual
$000
2016 Actual
$000
Variance
$000
Delivery of services
Item 69 net amount appropriated to deliver services 176,158 165,525 (10,633) 165,525 187,307 (21,782)
Amount authorised by other statutes:
- Salaries and Allowances Act 1975 1,625 1,625 - 1,625 1,625 -
Total appropriations provided to deliver services 177,783 167,150 (10,633) 167,150 188,932 (21,782)
Capital
Item 149 capital appropriations 29,109 28,763 (346) 28,763 84,268 (55,505)
Total capital appropriations provided to deliver services 29,109 28,763 (346) 28,763 84,268 (55,505)
Administered Transactions
Community service obligation payments
Item 70 Amount provided for Administered Grants, Subsidies and Other Transfer Payments 204,210 164,281 (39,929) 164,281 148,881 15,400
Amount authorised by other statutes
First Home Owner Grant Act 2000 73,678 72,765 (913) 72,765 98,582 (25,817)
Total administered transactions 277,888 237,046 (40,842) 237,046 247,463 (10,417)
GRAND TOTAL 484,780 432,959 (51,821) 432,959 520,663 (87,704)
Details of expenses by service
Revenue assessment and collection, and grants and subsidies administration 61,053 56,985 (4,068) 56,985 56,528 457
Development and management of Common Use Contract Arrangements, State Fleet leasing and disposal, and providing facilitation service for agency specific contracts
108,573 77,994 (30,579) 77,994 95,849 (17,855)
Corporate services to client agencies 6,809 7,354 545 7,354 7,019 335
Leads the planning, delivery, management and maintenance of government buildings, projects and office accommodation
1,153,898 1,084,641 (69,257) 1,084,641 998,621 86,020
Development and implementation of energy policy and economic reform, assessment of proposed policy changes and the impact on regulatory functions
29,429 16,004 (13,425) 16,004 24,396 (8,392)
Total details of expenses by service 1,359,762 1,242,978 (116,784) 1,242,978 1,182,413 60,565
Less total income (1,171,441) (1,073,241) 98,200 (1,073,241) (958,345) (114,896)36 Department of Finance Annual Report 2016-17
Summary of Consolidated Account Appropriations and Income EstimatesFor the year ended 30 June 2017
CONTENTS OVERVIEWAGENCY
PERFORMANCEFINANCIAL
STATEMENTSKEY PERFORMANCE
INDICATORS DISCLOSURES APPENDIX
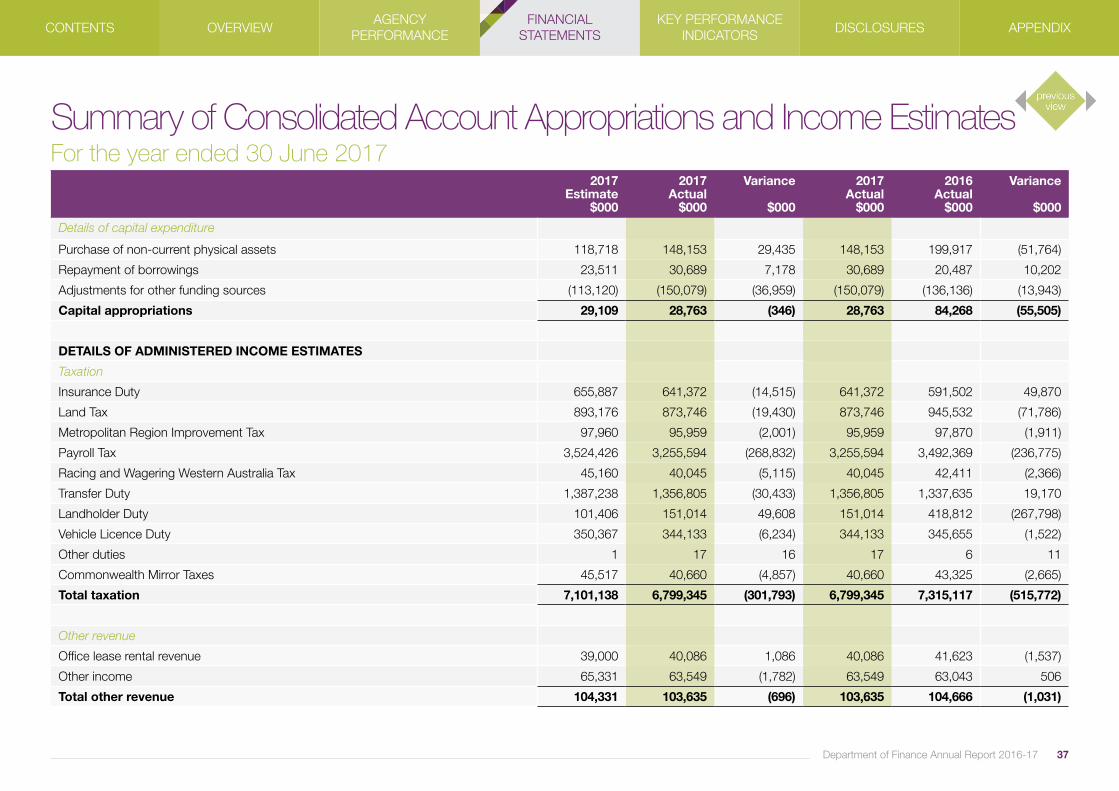
2017 Estimate
$000
2017 Actual
$000
Variance
$000
2017 Actual
$000
2016 Actual
$000
Variance
$000
Details of capital expenditure
Purchase of non-current physical assets 118,718 148,153 29,435 148,153 199,917 (51,764)
Repayment of borrowings 23,511 30,689 7,178 30,689 20,487 10,202
Adjustments for other funding sources (113,120) (150,079) (36,959) (150,079) (136,136) (13,943)
Capital appropriations 29,109 28,763 (346) 28,763 84,268 (55,505)
DETAILS OF ADMINISTERED INCOME ESTIMATES
Taxation
Insurance Duty 655,887 641,372 (14,515) 641,372 591,502 49,870
Land Tax 893,176 873,746 (19,430) 873,746 945,532 (71,786)
Metropolitan Region Improvement Tax 97,960 95,959 (2,001) 95,959 97,870 (1,911)
Payroll Tax 3,524,426 3,255,594 (268,832) 3,255,594 3,492,369 (236,775)
Racing and Wagering Western Australia Tax 45,160 40,045 (5,115) 40,045 42,411 (2,366)
Transfer Duty 1,387,238 1,356,805 (30,433) 1,356,805 1,337,635 19,170
Landholder Duty 101,406 151,014 49,608 151,014 418,812 (267,798)
Vehicle Licence Duty 350,367 344,133 (6,234) 344,133 345,655 (1,522)
Other duties 1 17 16 17 6 11
Commonwealth Mirror Taxes 45,517 40,660 (4,857) 40,660 43,325 (2,665)
Total taxation 7,101,138 6,799,345 (301,793) 6,799,345 7,315,117 (515,772)
Other revenue
Office lease rental revenue 39,000 40,086 1,086 40,086 41,623 (1,537)
Other income 65,331 63,549 (1,782) 63,549 63,043 506
Total other revenue 104,331 103,635 (696) 103,635 104,666 (1,031)
37Department of Finance Annual Report 2016-17
Summary of Consolidated Account Appropriations and Income EstimatesFor the year ended 30 June 2017
CONTENTS OVERVIEWAGENCY
PERFORMANCEFINANCIAL
STATEMENTSKEY PERFORMANCE
INDICATORS DISCLOSURES APPENDIX

2017 Estimate
$000
2017 Actual
$000
Variance
$000
2017 Actual
$000
2016 Actual
$000
Variance
$000
Appropriations
First Home Owner Grant Act 2000 73,678 72,765 (913) 72,765 98,582 (25,817)
Administered grants and transfer payments 204,210 164,281 (39,929) 164,281 148,881 15,400
277,888 237,046 (40,842) 237,046 247,463 (10,417)
TOTAL INCOME ESTIMATES 7,483,357 7,140,026 (343,331) 7,140,026 7,667,246 (527,220)
Adjustments comprise movements in cash balances and other accrual items such as receivables, payables and superannuation.
Note 44 ‘Explanatory statement’ and Note 46 ‘Explanatory statement for Administered Items’ provide details of any significant variations between estimates and actual results for 2017 and between the actual results for 2017 and 2016.
38 Department of Finance Annual Report 2016-17
Summary of Consolidated Account Appropriations and Income EstimatesFor the year ended 30 June 2017
CONTENTS OVERVIEWAGENCY
PERFORMANCEFINANCIAL
STATEMENTSKEY PERFORMANCE
INDICATORS DISCLOSURES APPENDIX

Note 1. Australian Accounting Standards
GeneralThe Department’s financial statements for the year ended 30 June 2017 have been prepared in accordance with Australian Accounting Standards. The term ‘Australian Accounting Standards’ includes Standards and Interpretations issued by the Australian Accounting Standards Board (AASB).
The Department has adopted any applicable new and revised Australian Accounting Standards from their operative dates.
Early adoption of standardsThe Department cannot early adopt an Australian Accounting Standard unless specifically permitted by TI 1101 Application of Australian Accounting Standards and Other Pronouncements. There has been no early adoption of any other Australian Accounting Standards that have been issued or amended (but not operative) by the Department for the annual reporting period ended 30 June 2017.
Note 2. Summary of significant accounting policies
(a) General statementThe Department is a not-for-profit reporting entity that prepares general purpose financial statements in accordance with Australian Accounting Standards, the Framework, Statements of Accounting Concepts and other authoritative pronouncements of the AASB as applied by the Treasurer’s Instructions. Several of these are modified by the Treasurer’s Instructions to vary application, disclosure, format and wording.
The Financial Management Act 2006 and the Treasurer’s Instructions impose legislative provisions that govern the preparation of financial statements and take precedence over Australian Accounting Standards, the Framework, Statements of Accounting Concepts and other authoritative pronouncements of the AASB.
Where modification is required and has had a material or significant financial effect upon the reported results, details of that modification and the resulting financial effect are disclosed in the notes to the financial statements.
(b) Basis of preparationThe financial statements have been prepared on the accrual basis of accounting using the historical cost convention, except for land and buildings which have been measured at fair value.
The accounting policies adopted in the preparation of the financial statements have been consistently applied throughout all periods presented unless otherwise stated.
The financial statements are presented in Australian dollars and all values are rounded to the nearest thousand dollars ($000).
Note 4 ‘Judgements made by management in applying accounting policies’ discloses judgements that have been made in the process of applying the Department’s accounting policies resulting in the most significant effect on amounts recognised in the financial statements.
Note 5 ‘Key sources of estimation uncertainty’ discloses key assumptions made concerning the future, and other key sources of estimation uncertainty at the end of the reporting period, that have a significant risk of causing a material adjustment to the carrying amounts of assets and liabilities within the next reporting period.
Notes to the Financial StatementsFor the year ended 30 June 2017
39Department of Finance Annual Report 2016-17
CONTENTS OVERVIEWAGENCY
PERFORMANCEFINANCIAL
STATEMENTSKEY PERFORMANCE
INDICATORS DISCLOSURES APPENDIX

(c) Reporting entityThe reporting entity is the Department of Finance.
MissionThe Department’s mission is to facilitate the efficient operation of government, informed decision making and value-for-money outcomes for Western Australians.
ServicesThe Department provides the following services:
Service 1: Revenue assessment and collection, and grants and subsidies administration
Service 2: Development and management of Common Use Contract Arrangements, State Fleet leasing and disposal, and providing facilitation service for agency specific contracts
Service 3: Corporate services to client agencies
Service 4: Leads the planning, delivery, management and maintenance of government buildings, projects and office accommodation
Service 5: Development and implementation of energy policy and economic reform, assessment of proposed policy changes and the impact on regulatory functions
The Department administers assets, liabilities, income and expenses on behalf of the Government which are not controlled by, nor integral to the function of the Department. These administered balances and transactions are not recognised in the principal financial statements of the Department but schedules are prepared using the same basis as the financial statements and are presented at Note 51 ‘Disclosure of administered income and expenses by service’ and Note 52 ‘Administered assets and liabilities’.
(d) Contributed equityAASB Interpretation 1038 Contributions by Owners Made to Wholly-Owned Public Sector Entities requires transfers in the nature of equity contributions, other than as a result of a restructure of administrative arrangements, to be designated by the Government (the owner) as contributions by owners (at the time of, or prior to transfer) before such transfers can be recognised as equity contributions. Capital appropriations have been designated as contributions by owners by TI 955 Contributions by Owners made to Wholly-Owned Public Sector Entities and have been credited directly to Contributed Equity.
The transfer of net assets to/from other agencies, other than as a result of a restructure of administrative arrangements, is designated as contributions by owners where the transfers are non-discretionary and non-reciprocal.
(e) Income
Revenue recognitionRevenue is recognised and measured at the fair value of consideration received or receivable. Revenue is recognised for the major business activities as follows:
Sale of goodsRevenue is recognised from the sale of goods and disposal of other assets when the significant risks and rewards of ownership transfer to the purchaser and can be measured reliably.
Provision of servicesRevenue is recognised by reference to the stage of completion of the transaction.
Vehicle fleet lease rentalsRental revenue is recognised in accordance with lease agreements entered into with State Government agencies, Statutory Authorities and other State Government entities.
40 Department of Finance Annual Report 2016-17
Notes to the Financial StatementsFor the year ended 30 June 2017
CONTENTS OVERVIEWAGENCY
PERFORMANCEFINANCIAL
STATEMENTSKEY PERFORMANCE
INDICATORS DISCLOSURES APPENDIX

Vehicle bailment revenuesRevenue is recognised on receipt of sale proceeds of vehicles held under bailment rights.
InterestRevenue is recognised as the interest accrues.
Revenue recognition - administeredRevenues resulting from taxation, territorial revenue, regulatory fees and fines, sale of goods and services, rent and interest are, where possible, recognised when the transaction or event giving rise to the revenue occurs. In some instances however, the revenue is not measurable until the cash is received.
Service appropriationsService appropriations are recognised as revenues at fair value in the period in which the Department gains control of the appropriated funds. The Department gains control of appropriated funds at the time those funds are deposited to the Department’s bank account or credited to the ‘Amounts receivable for services’ (holding account) held at Treasury.
Net appropriation determinationThe Treasurer may make a determinationproviding for prescribed receipts to be retained
for services under the control of the Department. In accordance with the most recent determination, as quantified in the 2016-17 Budget Statements, the Department retained $1,073 million in 2017 ($958 million in 2016) from the following:
• proceeds from fees and charges;• sale of goods;• Commonwealth specific purpose grants and contributions; • rental revenue recognised in accordance with lease agreements entered into with State Government agencies, statutory authorities and other State Government entities and vehicle bailment revenue held under bailment rights;• provision of contract services and rental income sufficient to cover outgoings paid for government owned buildings; and• other departmental revenue.
Grants, donations, gifts and other non-reciprocal contributionsRevenue is recognised at fair value when the Department obtains control over the assets comprising the contributions, usually when cash is received.
Other non-reciprocal contributions that are not contributions by owners are recognised at their
fair value. Contributions of services are only recognised when a fair value can be reliably determined and the services would be purchased if not donated.
Royalties for Regions funds are recognised as revenue at fair value in the period in which the Department obtains control over the funds. The Department obtains control of the funds at the time the funds are deposited into the Department’s bank account.
GainsRealised and unrealised gains are usually recognised on a net basis. These include gains arising on the disposal of non-current assets and some revaluations of non-current assets.
(f) Borrowing costsBorrowing costs are expensed when incurred.
(g) Property, plant and equipment Capitalisation/expensing of assetsItems of property, plant and equipment costing $5,000 or more are recognised as assets and the cost of utilising assets is expensed (depreciated) over their useful lives. Items of property, plant and equipment costing less than $5,000 are immediately expensed direct to the Statement of
41Department of Finance Annual Report 2016-17
Notes to the Financial StatementsFor the year ended 30 June 2017
CONTENTS OVERVIEWAGENCY
PERFORMANCEFINANCIAL
STATEMENTSKEY PERFORMANCE
INDICATORS DISCLOSURES APPENDIX

Comprehensive Income (other than where they form part of a group of similar items which are significant in total).
Initial recognition and measurementProperty, plant and equipment are initially recognised at cost.
For items of property, plant and equipment acquired at no cost or for nominal cost, the cost is the fair value at the date of acquisition.
Subsequent measurementSubsequent to initial recognition of an asset, the revaluation model is used for the measurement of land and buildings and historical cost for all other property, plant and equipment. Land and buildings are carried at fair value less accumulated depreciation (buildings only) and accumulated impairment losses. All other items of property, plant and equipment are stated at historical cost less accumulated depreciation and accumulated impairment losses.
Where market-based evidence is available, the fair value of land and buildings is determined on the basis of current market values determined by reference to recent market transactions. When buildings are revalued by reference to
recent market transactions, the accumulated depreciation is eliminated against the gross carrying amount of the asset and the net amount restated to the revalued amount.
In the absence of market-based evidence, fair value of land and buildings is determined on the basis of existing use. This normally applies where buildings are specialised or where land use is restricted. Fair value for existing use buildings is determined by reference to the cost of replacing the remaining future economic benefits embodied in the asset, that is, the depreciated replacement cost. Where the fair value of buildings is determined on the depreciated replacement cost basis, the gross carrying amount and the accumulated depreciation is restated proportionately with the change in the gross carrying amount of the asset. Fair value for restricted use land is determined by comparison with market evidence for land with similar approximate utility (high restricted use land) or market value of comparable unrestricted land (low restricted use land).
Land and buildings are independently valued annually by the Western Australian Land Information Authority (Valuation Services) and recognised annually to ensure that the carrying amount does not differ materially from the asset’s fair value at the end of the reporting period.
The most significant assumptions and judgements in estimating fair value are made in assessing whether to apply the existing use basis to assets and in determining estimated economic life. Professional judgement by the valuer is required where the evidence does not provide a clear distinction between market type assets and existing use assets.
See also Note 24 ‘Property, plant, equipment and vehicles’ for further information on revaluations.
De-recognitionUpon disposal or de-recognition of an item of property, plant and equipment, any revaluation surplus relating to that asset is retained in the asset revaluation surplus.
Asset revaluation surplusThe asset revaluation surplus is used to record increments and decrements on the revaluation of non-current assets on a class of assets basis.
DepreciationAll non-current assets having a limited useful life are systematically depreciated over their estimated useful lives in a manner that reflects the consumption of their future economic benefits.
42 Department of Finance Annual Report 2016-17
Notes to the Financial StatementsFor the year ended 30 June 2017
CONTENTS OVERVIEWAGENCY
PERFORMANCEFINANCIAL
STATEMENTSKEY PERFORMANCE
INDICATORS DISCLOSURES APPENDIX
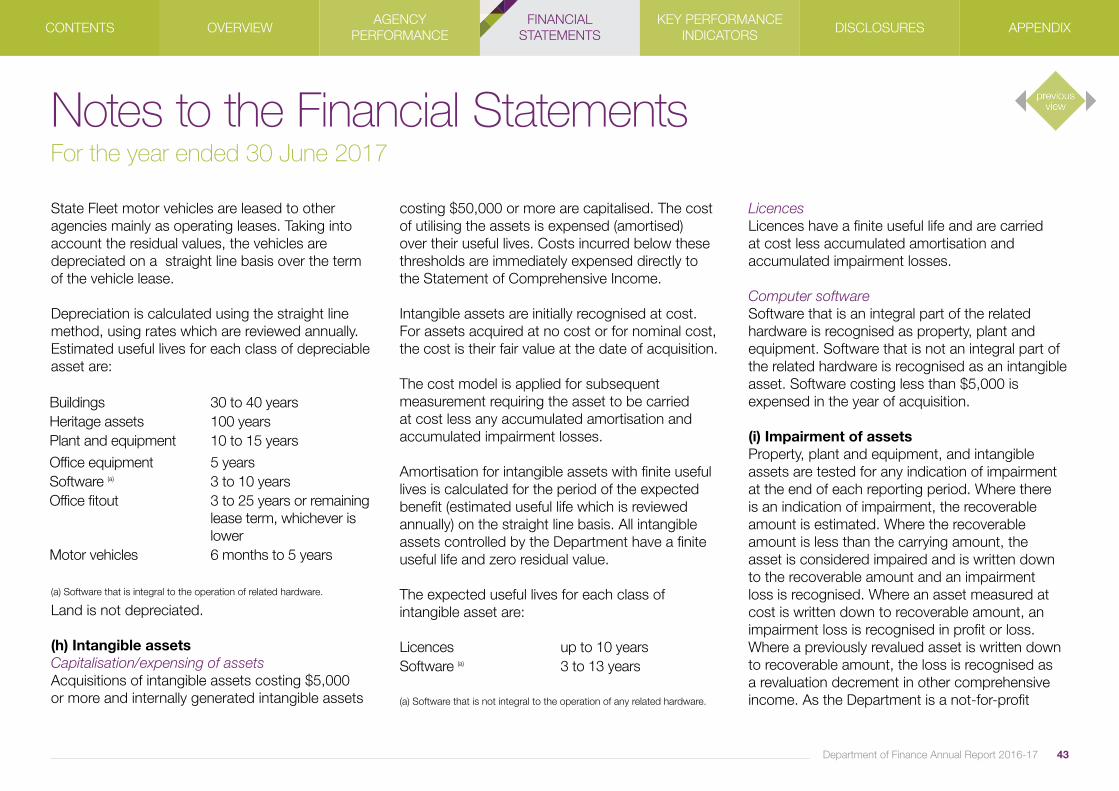
State Fleet motor vehicles are leased to other agencies mainly as operating leases. Taking into account the residual values, the vehicles are depreciated on a straight line basis over the term of the vehicle lease.
Depreciation is calculated using the straight line method, using rates which are reviewed annually. Estimated useful lives for each class of depreciable asset are:
(a) Software that is integral to the operation of related hardware.
Land is not depreciated.
(h) Intangible assetsCapitalisation/expensing of assetsAcquisitions of intangible assets costing $5,000 or more and internally generated intangible assets
costing $50,000 or more are capitalised. The cost of utilising the assets is expensed (amortised) over their useful lives. Costs incurred below these thresholds are immediately expensed directly to the Statement of Comprehensive Income.
Intangible assets are initially recognised at cost. For assets acquired at no cost or for nominal cost, the cost is their fair value at the date of acquisition.
The cost model is applied for subsequent measurement requiring the asset to be carried at cost less any accumulated amortisation and accumulated impairment losses.
Amortisation for intangible assets with finite useful lives is calculated for the period of the expected benefit (estimated useful life which is reviewed annually) on the straight line basis. All intangible assets controlled by the Department have a finite useful life and zero residual value.
The expected useful lives for each class of intangible asset are:
(a) Software that is not integral to the operation of any related hardware.
LicencesLicences have a finite useful life and are carried at cost less accumulated amortisation and accumulated impairment losses.
Computer softwareSoftware that is an integral part of the related hardware is recognised as property, plant and equipment. Software that is not an integral part of the related hardware is recognised as an intangible asset. Software costing less than $5,000 is expensed in the year of acquisition.
(i) Impairment of assetsProperty, plant and equipment, and intangible assets are tested for any indication of impairment at the end of each reporting period. Where there is an indication of impairment, the recoverable amount is estimated. Where the recoverable amount is less than the carrying amount, the asset is considered impaired and is written down to the recoverable amount and an impairment loss is recognised. Where an asset measured at cost is written down to recoverable amount, an impairment loss is recognised in profit or loss. Where a previously revalued asset is written down to recoverable amount, the loss is recognised as a revaluation decrement in other comprehensive income. As the Department is a not-for-profit
Buildings 30 to 40 yearsHeritage assets 100 yearsPlant and equipment 10 to 15 years
Office equipment 5 yearsSoftware (a) 3 to 10 yearsOffice fitout 3 to 25 years or remaining
lease term, whichever is lower
Motor vehicles 6 months to 5 years
Licences up to 10 yearsSoftware (a) 3 to 13 years
43Department of Finance Annual Report 2016-17
Notes to the Financial StatementsFor the year ended 30 June 2017
CONTENTS OVERVIEWAGENCY
PERFORMANCEFINANCIAL
STATEMENTSKEY PERFORMANCE
INDICATORS DISCLOSURES APPENDIX
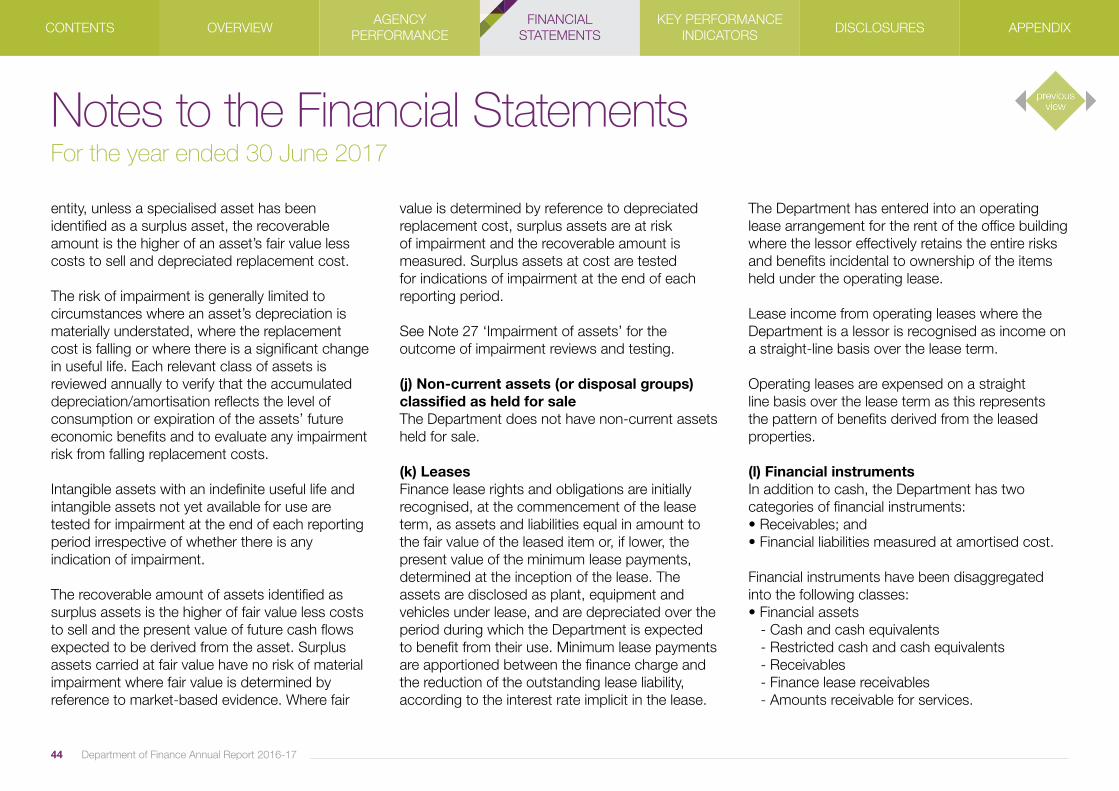
entity, unless a specialised asset has been identified as a surplus asset, the recoverable amount is the higher of an asset’s fair value less costs to sell and depreciated replacement cost.
The risk of impairment is generally limited to circumstances where an asset’s depreciation is materially understated, where the replacement cost is falling or where there is a significant change in useful life. Each relevant class of assets is reviewed annually to verify that the accumulated depreciation/amortisation reflects the level of consumption or expiration of the assets’ future economic benefits and to evaluate any impairment risk from falling replacement costs.
Intangible assets with an indefinite useful life and intangible assets not yet available for use are tested for impairment at the end of each reporting period irrespective of whether there is any indication of impairment.
The recoverable amount of assets identified as surplus assets is the higher of fair value less costs to sell and the present value of future cash flows expected to be derived from the asset. Surplus assets carried at fair value have no risk of material impairment where fair value is determined by reference to market-based evidence. Where fair
value is determined by reference to depreciated replacement cost, surplus assets are at risk of impairment and the recoverable amount is measured. Surplus assets at cost are tested for indications of impairment at the end of each reporting period.
See Note 27 ‘Impairment of assets’ for the outcome of impairment reviews and testing.
(j) Non-current assets (or disposal groups) classified as held for saleThe Department does not have non-current assets held for sale.
(k) LeasesFinance lease rights and obligations are initially recognised, at the commencement of the lease term, as assets and liabilities equal in amount to the fair value of the leased item or, if lower, the present value of the minimum lease payments, determined at the inception of the lease. The assets are disclosed as plant, equipment and vehicles under lease, and are depreciated over the period during which the Department is expected to benefit from their use. Minimum lease payments are apportioned between the finance charge and the reduction of the outstanding lease liability, according to the interest rate implicit in the lease.
The Department has entered into an operating lease arrangement for the rent of the office building where the lessor effectively retains the entire risks and benefits incidental to ownership of the items held under the operating lease.
Lease income from operating leases where the Department is a lessor is recognised as income on a straight-line basis over the lease term.
Operating leases are expensed on a straight line basis over the lease term as this represents the pattern of benefits derived from the leased properties.
(l) Financial instrumentsIn addition to cash, the Department has two categories of financial instruments:• Receivables; and• Financial liabilities measured at amortised cost.
Financial instruments have been disaggregated into the following classes:• Financial assets - Cash and cash equivalents - Restricted cash and cash equivalents - Receivables - Finance lease receivables - Amounts receivable for services.
44 Department of Finance Annual Report 2016-17
Notes to the Financial StatementsFor the year ended 30 June 2017
CONTENTS OVERVIEWAGENCY
PERFORMANCEFINANCIAL
STATEMENTSKEY PERFORMANCE
INDICATORS DISCLOSURES APPENDIX

• Financial liabilities - Payables - Western Australian Treasury Corporation (WATC) borrowings - Heritage Maintenance borrowings - Amounts due to the Treasurer.
Initial recognition and measurement of financial instruments is at fair value which normally equates to the transaction cost or the face value. Subsequent measurement is at amortised cost using the effective interest method.
The fair value of short-term receivables and payables is the transaction cost or the face value because there is no interest rate applicable and subsequent measurement is not required as the effect of discounting is not material.
(m) Cash and cash equivalentsFor the purpose of the Statement of Cash Flows, cash and cash equivalent (and restricted cash and cash equivalent) assets comprise cash on hand and short-term deposits with original maturities of three months or less that are readily convertible to a known amount of cash and which are subject to insignificant risk of changes in value.
(n) Accrued salariesAccrued salaries (see Note 28 ‘Payables’) represent the amount due to staff but unpaid at the end of the financial year. Accrued salaries are settled within a fortnight of the financial year end. The Department considers the carrying amount of accrued salaries to be equivalent to its fair value.
The accrued salaries suspense account (see Note 19 ‘Restricted cash and cash equivalents’) consists of amounts paid annually, from Departmental appropriations for salaries expense, into a suspense account to meet the additional cash outflow for employee salary payments in reporting periods with 27 pay days instead of the normal 26. No interest is received on this account.
(o) Amounts receivable for services(holding account)The Department receives funding on an accrual basis. The appropriations are paid partly in cash and partly as an asset (holding account receivable).The accrued amount receivable is accessible on the emergence of the cash funding requirement to cover leave entitlements and asset replacement.
(p) ReceivablesReceivables are recognised at original invoice amount less an allowance for any uncollectible amounts (that is, impairment). The collectability of receivables is reviewed on an ongoing basis and any receivables identified as uncollectibleare written-off against the allowance account. The allowance for uncollectible amounts (doubtful debts) is raised when there is objective evidence that the Department will not be able to collect the debts. The carrying amount is equivalent to fair value as it is due for settlement within 30 days.
(q) PayablesPayables are recognised at the amounts payable when the Department becomes obliged to make future payments as a result of a purchase of assets or services. The carrying amount is equivalent to fair value, as settlement is generally within 30 days.
(r) BorrowingsAll loans payable are initially recognised at fair value, being the net proceeds received. Subsequent measurement is at amortised cost using the effective interest rate method (see also Note 2(I) ‘Financial instruments’ and Note 29 ‘Borrowings’).
45Department of Finance Annual Report 2016-17
Notes to the Financial StatementsFor the year ended 30 June 2017
CONTENTS OVERVIEWAGENCY
PERFORMANCEFINANCIAL
STATEMENTSKEY PERFORMANCE
INDICATORS DISCLOSURES APPENDIX

(s) Amounts due to the TreasurerThe amount due to the Treasurer is in respect of a Treasurer’s advance. Initial recognition and measurement, and subsequent measurement are at the amount repayable. Although there is no interest charged, the amount repayable is equivalent to fair value as the period of the borrowing is for less than 12 months with the effect of discounting not being material.
(t) ProvisionsProvisions are liabilities of uncertain timing or amount and are recognised where there is a present legal or constructive obligation as a result of a past event and when the outflow of resources embodying economic benefits is probable and a reliable estimate can be made of the amount of the obligation. Provisions are reviewed at the end of each reporting period (see also Note 30 ‘Provisions’).
Provisions - employee benefitsAll annual leave and long service leave provisions are in respect of employees’ services up to the end of the reporting period.
Annual leaveAnnual leave is not expected to be settled wholly within 12 months after the end of the reporting
period and is therefore considered to be ‘other long-term employee benefits’. The annual leave liability is recognised and measured at the present value of amounts expected to be paid when the liabilities are settled using the remuneration rate expected to apply at the time of settlement.
When assessing expected future payments consideration is given to expected future wage and salary levels including non-salary components such as employer superannuation contributions, as well as the experience of employee departures and periods of service. The expected future payments are discounted using market yields at the end of the reporting period on national government bonds with terms to maturity that match, as closely as possible, the estimated future cash outflows.
The provision for annual leave is classified as a current liability as the Department does not have an unconditional right to defer settlement of the liability for at least 12 months after the end of the reporting period.
Long service leaveLong service leave is not expected to be settled wholly within 12 months after the end of the reporting period and is therefore recognised and measured at the present value of amounts
expected to be paid when the liabilities are settled using the remuneration rate expected to apply at the time of settlement.
When assessing expected future payments consideration is given to expected future wage and salary levels including non-salary components such as employer superannuation contributions, as well as the experience of employee departures and periods of service. The expected future payments are discounted using market yields at the end of the reporting period on national government bonds with terms to maturity that match, as closely as possible, the estimated future cash outflows.
Unconditional long service leave provisions are classified as current liabilities as the Department does not have an unconditional right to defer settlement of the liability for at least 12 months after the end of the reporting period. Pre-conditional and conditional long service leave provisions are classified as non-current liabilities because the Department has an unconditional right to defer the settlement of the liability until the employee has completed the requisite years of service.
46 Department of Finance Annual Report 2016-17
Notes to the Financial StatementsFor the year ended 30 June 2017
CONTENTS OVERVIEWAGENCY
PERFORMANCEFINANCIAL
STATEMENTSKEY PERFORMANCE
INDICATORS DISCLOSURES APPENDIX

Deferred leaveThe provision for deferred leave relates to Public Service employees who have entered into an agreement to self-fund an additional 12 months leave in the fifth year of the agreement. The provision recognises the value of salary set aside for employees to be used in the fifth year. This liability is measured on the same basis as annual leave. Deferred leave is reported as a current provision as employees can leave the scheme at their discretion at any time.
Purchased leaveThe provision for purchased leave relates to Public Service employees who have entered into an agreement to self-fund up to an additional 10 weeks leave per calendar year. The provision recognises the value of salary set aside for employees and is measured at the undiscounted amounts expected to be paid when the liabilities are settled.
SuperannuationThe Government Employees Superannuation Board (GESB) and other fund providers administer public sector superannuation arrangements in Western Australia in accordance with legislative requirements. Eligibility criteria for membership in
particular schemes for public sector employees vary according to commencement and implementation dates.
Eligible employees contribute to the Pension Scheme, a defined benefit pension scheme closed to new members since 1987, or the Gold State Superannuation Scheme (GSS), a defined benefit lump sum scheme closed to new members since 1995.
Employees commencing employment prior to 16 April 2007 who were not members of either the Pension Scheme or the GSS became non-contributory members of the West State Superannuation Scheme (WSS). Employees commencing employment on or after 16 April 2007 became members of the GESB Super Scheme (GESBS). From 30 March 2012, existing members of the WSS or GESBS and new employees have been able to choose their preferred superannuation fund provider. The Department makes contributions to GESB or other fund providers on behalf of employees in compliance with the Commonwealth Government’s Superannuation Guarantee (Administration) Act 1992. Contributions to these accumulation schemes extinguish the Department’s liability for
superannuation charges in respect of employees who are not members of the Pension Scheme or GSS.
The GSS is a defined benefit scheme for the purposes of employees and whole-of-government reporting. However, it is a defined contribution plan for agency purposes because the concurrent contributions (defined contributions) made by the Department to GESB extinguishes the agency’s obligations to the related superannuation liability.
The Department has no liabilities under the Pension Scheme or the GSS. The liabilities for the unfunded Pension Scheme and the unfunded GSS transfer benefits attributable to members who transferred from the Pension Scheme, are assumed by the Treasurer. All other GSS obligations are funded by concurrent contributions made by the Department to the GESB.
The GESB makes all benefit payments in respect of the Pension Scheme and GSS, and is recouped from the Treasurer for the employer’s share.
See also Note 2(u) ‘Superannuation expense’.
47Department of Finance Annual Report 2016-17
Notes to the Financial StatementsFor the year ended 30 June 2017
CONTENTS OVERVIEWAGENCY
PERFORMANCEFINANCIAL
STATEMENTSKEY PERFORMANCE
INDICATORS DISCLOSURES APPENDIX
Provisions - otherEmployment on-costsEmployment on-costs, including workers’ compensation insurance, are not employeebenefits and are recognised separately as liabilities and expenses when the employment to whichthey relate has occurred. Employment on-costsare included as part of ‘Other expenses’ andare not included as part of the Department’s ‘Employee benefits expense’. The related liabilityis included in ‘Employment on-costs provision’.
Remediation costsA provision is recognised where the Department has a legal or constructive obligation to undertake remediation work. Estimates are based on the present value of expected future cash outflows.
(u) Superannuation expenseSuperannuation expense is recognised in the profit or loss of the Statement of Comprehensive Income and comprises employer contributions paid to the GSS (concurrent contributions), the WSS, the GESB, or other superannuation funds. The employer contribution paid to the GESB in respect of the GSS is paid back into the Consolidated Account by the GESB.
(v) Assets and services received free of charge or for nominal costAssets or services received free of charge or for nominal cost that the Department would otherwise purchase if not donated, are recognised as income at the fair value of the assets or services where they can be reliably measured. A corresponding expense is recognised for services received. Receipts of assets are recognised in the Statement of Financial Position.
Assets or services received from other State Government agencies are separately disclosed under Income from State Government in the Statement of Comprehensive Income.
(w) Construction work in progressConstruction work in progress is stated at the aggregate of contract costs incurred to date plus recognised profits less recognised losses and progress billings. If there are contracts where progress billing exceeds the aggregate costs incurred plus profits less losses, the net amounts are presented under other payables. Contract costs include all costs directly related to specific contracts, costs that are specifically chargeable to the customer under the terms of the contract and an allocation of overhead expenses incurred in connection with the Department’s construction activities in general.
(x) Lease incentivesIn instances where the lessor has provided incentives for the Department to enter into an operating lease, the Department has recognised the aggregate benefit of incentives as a reduction of rental expense over the lease term, on a straight line basis. Examples of lease incentives include up-front cash payments or the reimbursement or assumption by the lessor of costs of the lease such as leasehold improvements.
Note 3. Comparative figures
Comparative figures are, where appropriate, reclassified to be comparable with the figures presented in the current reporting period.
Note 4. Judgements made by management in applying accounting policies
The preparation of financial statements requires management to make judgements about the application of accounting policies that have a significant effect on the amounts recognised in the financial statements. The Department evaluates these judgements regularly.
48 Department of Finance Annual Report 2016-17
Notes to the Financial StatementsFor the year ended 30 June 2017
CONTENTS OVERVIEWAGENCY
PERFORMANCEFINANCIAL
STATEMENTSKEY PERFORMANCE
INDICATORS DISCLOSURES APPENDIX
Operating lease commitmentsThe Department has entered into a number of leases for buildings for branch office accommodation. Some of these leases relate to buildings of a temporary nature and it has been determined that the lessor retains substantially all the risks and rewards incidental to ownership. Accordingly, these leases have been classified as operating leases.
Note 5. Key sources of estimation uncertainty
Key estimates and assumptions concerning the future are based on historical experience and various other factors that have a significant risk of causing a material adjustment to the carrying amount of assets and liabilities within the next reporting period.
Waste disposal siteAn environmental analysis to provide a quantifiable estimate of the amount required to rehabilitate the Mt Walton East intractable waste disposal site was obtained for the 2016-17 financial year.
Calculations performed in assessing the restoration costs provision incorporate a number of key estimates. Calculation of the provision will be conducted annually and adjusted using the most up-to-date information available.
Long service leaveSeveral estimations and assumptions used in calculating the Department’s long service leave provision include expected future salary rates, discount rates, employee retention rates and expected future payments. Changes in these estimations and assumptions may impact on the carrying amounts of the long service leave provision.
Note 6. Disclosure of changes in accounting policy and estimates
Initial application of an Australian Accounting StandardThe Department has applied the following Australian Accounting Standards effective, or adopted, for annual reporting periods beginning on or after 1 January 2016 that impacted on the Department.
AASB 1057Application of Australian Accounting StandardsThis Standard lists the application paragraphs for each other Standard (and Interpretation), grouped where they are the same. There is no financial impact.
AASB 2014-3Amendments to Australian Accounting Standards Accounting for Acquisitions of Interests in Joint Operations [AASB 1 & 11]The Authority establishes Joint Operations in pursuit of its objectives and does not routinely acquire interests in Joint Operations. Therefore, there is no financial impact on application of the Standard.
AASB 2014-4Amendments to Australian Accounting StandardsClarification of Acceptable Methods of Depreciation and Amortisation [AASB 116 & 138]The adoption of this Standard has no financial impact for the Department as depreciation and amortisation is not determined by reference to revenue generation, but by reference to consumption of future economic benefits.
49Department of Finance Annual Report 2016-17
Notes to the Financial StatementsFor the year ended 30 June 2017
CONTENTS OVERVIEWAGENCY
PERFORMANCEFINANCIAL
STATEMENTSKEY PERFORMANCE
INDICATORS DISCLOSURES APPENDIX
AASB 2014-9Amendments to Australian Accounting Standards Equity Method in Separate Financial Statements [AASB 1, 127 & 128]This Standard amends AASB 127, and consequentially amends AASB 1 and AASB 128,to allow entities to use the equity method of accounting for investments in subsidiaries,joint ventures and associates in their separate financial statements. As the Department has no joint ventures and associates, the application of the Standard has no financial impact.
AASB 2015-1Amendments to Australian Accounting Standards Annual Improvements to Australian Accounting Standards 2012-2014 Cycle[AASB 1, 2, 3, 5, 7, 11, 110, 119, 121, 133, 134, 137 & 140]These amendments arise from the issuance of International Financial Reporting Standard Annual Improvements to IFRSs 2012-2014 Cycle in September 2014, and editorial corrections. The Department has determined that the application of the Standard has no financial impact.
AASB 2015-2Amendments to Australian Accounting Standards Disclosure Initiative: Amendments to AASB 101 [AASB 7, 101, 134 & 1049]This Standard amends AASB 101 to provide clarification regarding the disclosure requirements in AASB 101. Specifically, the Standard proposes narrow-focus amendments to address some of the concerns expressed about existing presentation and disclosure requirements and to ensure entities are able to use judgement when applying a Standard in determining what information to disclose in their financial statements. There is no financial impact.
AASB 2015-6Amendments to Australian Accounting StandardsExtending Related Party Disclosures toNot-for-Profit Public Sector Entities[AASB 10,124 & 1049]The amendments extend the scope of AASB 124 to include application by not-for-profit public sector entities. Implementation guidance is included to assist application of the Standard by not-for-profit public sector entities. There is no financial impact.
AASB 2015-10Amendments to Australian Accounting StandardsEffective Date of Amendments to AASB 10 & 128This Standard defers the mandatory effective date (application date) of amendments to AASB 10 and 128 that were originally made in AASB 2014-10 so that the amendments are required to be applied for annual reporting periods beginning on or after1 January 2018 instead of 1 January 2016.There is no financial impact.
Voluntary changes in accounting policyThere are no voluntary changes in accounting policies during the reporting period.
Future impact of Australian Accounting Standards not yet operativeThe Department cannot early adopt an Australian Accounting Standard unless specifically permitted by TI 1101 Application of Australian Accounting Standards and Other Pronouncements or by an exemption from TI 1101. By virtue of a limited exemption, the Department has early adoptedAASB 2015-7 Amendments to Australian Accounting Standards-Fair Value Disclosuresof Not-for-Profit Public sector Entities.Where applicable, the Department plans toapply these Australian Accounting Standardsfrom their application date.
50 Department of Finance Annual Report 2016-17
Notes to the Financial StatementsFor the year ended 30 June 2017
CONTENTS OVERVIEWAGENCY
PERFORMANCEFINANCIAL
STATEMENTSKEY PERFORMANCE
INDICATORS DISCLOSURES APPENDIX
Operative for reporting periods beginning on/after 1 Jan 2017
AASB 2016-2 Amendments to Australian Accounting Standards Disclosure Initiative: Amendments to AASB 107 This Standard amends AASB 107 Statement of Cash Flows (August 2015) to require disclosures that enable users of financial statements to evaluate changes in liabilities arising from financing activities, including both changes arising from cash flows and non-cash changes. There is no financial impact.
AASB 2016-4Amendments to Australian Accounting Standards Recoverable Amount of Non-Cash-Generating Specialised Assets of Not-for-Profit EntitiesThis Standard clarifies that the recoverable amount of primarily non-cash-generating assets of not-for-profit entities, which are typically specialised in nature and held for continuing use of their service capacity, is expected to be materially the same as fair value determined under AASB 13 Fair Value Measurement. The Department has not yet determined the application or the potential impact.
AASB 2016-7Amendments to Australian Accounting Standards Deferral of AASB 15 for Not-for-Profit EntitiesThis Standard amends the mandatory effective date (application date) of AASB 15 and defers the consequential amendments that were originally set out in AASB 2014-5 Amendments to Australian Accounting Standards arising from AASB 15 for not-for-profit entities to annual reporting periods beginning on or after 1 January 2019 instead of 1 January 2018. There is no financial impact.
AASB 2017-2Amendments to Australian Accounting Standards Further Annual Improvements 2014-2016 CycleThis Standard clarifies the scope of AASB 12 by specifying that the disclosure requirements apply to an entity’s interests in other entities that are classified as held for sale, held for distribution to owners in their capacity as owners or discontinued operations in accordance with AASB 5. There is no financial impact.
Operative for reporting periods beginning on/after 1 Jan 2018
AASB 9Financial InstrumentsThis Standard supersedes AASB 139 Financial Instruments: Recognition and Measurement, introducing a number of changes to accounting treatments.
The mandatory application date of this Standard is currently 1 January 2018 after being amended by AASB 2012-6, AASB 2013-9 and AASB 2014-1 Amendments to Australian Accounting Standards. The Department has not yet determined the application or the potential impact of the Standard.
AASB 2010-7 Amendments to Australian Accounting Standards arising from AASB 9 (December 2010) [AASB 1, 3, 4, 5, 7, 101, 102, 108, 112, 118, 120, 121, 127, 128, 131, 132, 136, 137, 139, 1023 & 1038 and Int 2, 5, 10, 12, 19 & 127] This Standard makes consequential amendments to other Australian Accounting Standards and Interpretations as a result of issuing AASB 9 in December 2010.
51Department of Finance Annual Report 2016-17
Notes to the Financial StatementsFor the year ended 30 June 2017
CONTENTS OVERVIEWAGENCY
PERFORMANCEFINANCIAL
STATEMENTSKEY PERFORMANCE
INDICATORS DISCLOSURES APPENDIX

The mandatory application date of this Standard has been amended by AASB 2012-6 and AASB 2014-1 to 1 January 2018. The Department has not yet determined the application or the potential impact of the Standard.
AASB 2014-1 Amendments to Australian Accounting Standards Part E of this Standard makes amendments toAASB 9 and consequential amendments to otherStandards. It has not yet been assessed to determine the application or potential impact of the Standard.
AASB 2014-5Amendments to Australian Accounting Standards arising from AASB 15 This Standard gives effect to the consequential amendments to Australian Accounting Standards (including Interpretations) arising from the issuance of AASB 15. The mandatory application dateof this Standard has been amended byAASB 2015-8 to 1 January 2018. The Department has not yet determined the application or the potential impact of the Standard.
AASB 2014-7 Amendments to Australian Accounting Standards arising from AASB 9 (December 2014) This Standard gives effect to the consequential amendments to Australian Accounting Standards (including Interpretations) arising from the issuance of AASB 9 (December 2014). The Department has not yet determined the application or the potential impact of the Standard.
AASB 2014-10 Amendments to Australian Accounting Standards Sale or Contribution of Assets between an Investor and its Associate or Joint Venture [AASB 10 & 128] This Standard amends AASB 10 and AASB 128to address an inconsistency between the requirements in AASB 10 and those in AASB 128(August 2011), in dealing with the sale or contribution of assets between an investor and its associate or joint venture. The mandatory effective date (application date) for the Standard has been deferred to 1 January 2018 by AASB 2015-10. The Department has determined that the Standard has no financial impact.
AASB 2016-3Amendments to Australian Accounting Standards Clarifications to AASB 15This Standard clarifies identifying performance obligations, principal versus agent considerations, timing of recognising revenue from granting a licence, and provides further transitional provisions to AASB 15. The Department has not yet determined the application or the potential impact.
Operative for reporting periods beginning on/after 1 Jan 2019
AASB 15Revenue from Contracts with Customers This Standard establishes the principles that the Department shall apply to report useful information to users of financial statements about the nature, amount, timing and uncertainty of revenue and cash flows arising from a contract with a customer. The Department’s income is principally derived from appropriations which will be measured under AASB 1058 Income of not-for-profit Entities and will be unaffected by this change. However, the Department has not yet determined the potential impact of the Standard on ‘User charges and fees’
52 Department of Finance Annual Report 2016-17
Notes to the Financial StatementsFor the year ended 30 June 2017
CONTENTS OVERVIEWAGENCY
PERFORMANCEFINANCIAL
STATEMENTSKEY PERFORMANCE
INDICATORS DISCLOSURES APPENDIX
and ‘Sales’ revenues. In broad terms, it is anticipated that the terms and conditionsattached to these revenues will defer revenue recognition until the Department has discharged its performance obligations.
AASB 16 Leases This Standard introduces a single lessee accounting model and requires a lessee to recognise assets and liabilities for all leases with a term of more than 12 months, unless the underlying asset is of low value. Whilst the impact of AASB 16 has not yet been quantified, the Department currently has operating lease commitments for $73,739,000. The Department anticipates most of this amount will be brought onto the statement of financial position,excepting amounts pertinent to short-termor low-value leases. Interest and amortisation expense will increase and rental expense will decrease.
AASB 1058 Income of Not-for-Profit EntitiesThis Standard clarifies and simplifies theincome recognition requirements that apply tonot-for-profit (NFP) entities, more closelyreflecting the economic reality of NFP entity transactions that are not contracts withcustomers. Timing of income recognition is dependent on whether such a transaction gives rise to a liability, a performance obligation(a promise to transfer a good or service),or, an obligation to acquire an asset.The Department has not yet determined the application or the potential impact of thisrecently issued Standard.
AASB 2015-8Amendments to Australian Accounting Standards Effective Date of AASB 15
The Standard amends the mandatory effective date (application date) of AASB 15 Revenue from Contracts with Customers so that AASB 15 is required to be applied for annual reporting periods beginning on or after 1 January 2018 insteadof 1 January 2017.
For not-for-profit entities, the mandatoryeffective date has subsequently been amended to 1 January 2019 by AASB 2016-7. The Department has not yet determined the application or the potential impact of AASB 15.
AASB 2016-8Amendments to Australian Accounting Standards Australian Implementation Guidance forNot-for-Profit EntitiesThis Standard inserts Australian requirements and authoritative implementation guidance fornot-for-profit entities into AASB 9 and AASB 15. This guidance assists not-for-profit entities in applying those Standards to particular transactions and other events. There is no financial impact.
Changes in accounting estimatesThere have been no changes in accounting estimates during the year.
53Department of Finance Annual Report 2016-17
Notes to the Financial StatementsFor the year ended 30 June 2017
CONTENTS OVERVIEWAGENCY
PERFORMANCEFINANCIAL
STATEMENTSKEY PERFORMANCE
INDICATORS DISCLOSURES APPENDIX
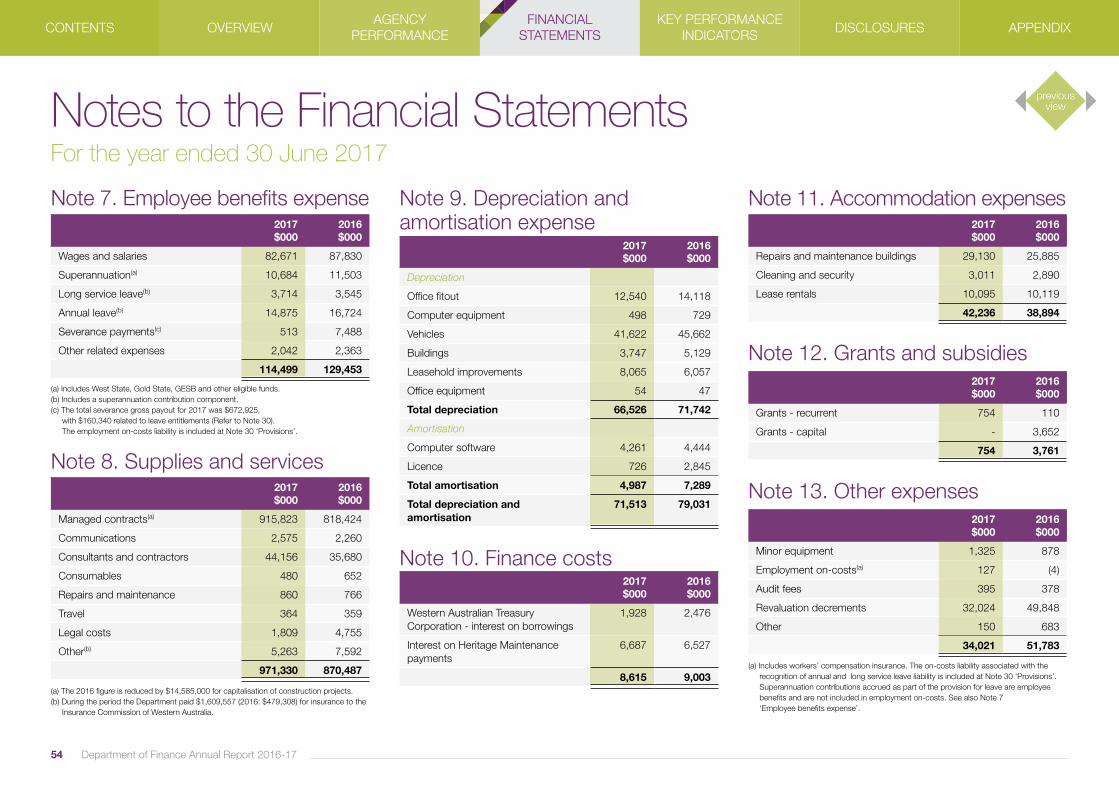
Note 7. Employee benefits expense
(a) Includes West State, Gold State, GESB and other eligible funds.(b) Includes a superannuation contribution component. (c) The total severance gross payout for 2017 was $672,925, with $160,340 related to leave entitlements (Refer to Note 30). The employment on-costs liability is included at Note 30 ‘Provisions’.
Note 8. Supplies and services
Note 9. Depreciation and amortisation expense
Note 11. Accommodation expenses
Note 12. Grants and subsidies
Note 13. Other expenses
Note 10. Finance costs
2017 $000
2016 $000
Wages and salaries 82,671 87,830
Superannuation(a) 10,684 11,503
Long service leave(b) 3,714 3,545
Annual leave(b) 14,875 16,724
Severance payments(c) 513 7,488
Other related expenses 2,042 2,363
114,499 129,453
2017 $000
2016 $000
Repairs and maintenance buildings 29,130 25,885
Cleaning and security 3,011 2,890
Lease rentals 10,095 10,119
42,236 38,894
2017 $000
2016 $000
Grants - recurrent 754 110
Grants - capital - 3,652
754 3,761
2017 $000
2016 $000
Depreciation
Office fitout 12,540 14,118
Computer equipment 498 729
Vehicles 41,622 45,662
Buildings 3,747 5,129
Leasehold improvements 8,065 6,057
Office equipment 54 47
Total depreciation 66,526 71,742
Amortisation
Computer software 4,261 4,444
Licence 726 2,845
Total amortisation 4,987 7,289
Total depreciation and amortisation
71,513 79,031
2017 $000
2016 $000
Western Australian Treasury Corporation - interest on borrowings
1,928 2,476
Interest on Heritage Maintenance payments
6,687 6,527
8,615 9,003
2017 $000
2016 $000
Managed contracts(a) 915,823 818,424
Communications 2,575 2,260
Consultants and contractors 44,156 35,680
Consumables 480 652
Repairs and maintenance 860 766
Travel 364 359
Legal costs 1,809 4,755
Other(b) 5,263 7,592
971,330 870,487
(a) The 2016 figure is reduced by $14,585,000 for capitalisation of construction projects.(b) During the period the Department paid $1,609,557 (2016: $479,308) for insurance to the Insurance Commission of Western Australia.
(a) Includes workers’ compensation insurance. The on-costs liability associated with the recognition of annual and long service leave liability is included at Note 30 ‘Provisions’. Superannuation contributions accrued as part of the provision for leave are employee benefits and are not included in employment on-costs. See also Note 7 ‘Employee benefits expense’.
54 Department of Finance Annual Report 2016-17
2017 $000
2016 $000
Minor equipment 1,325 878
Employment on-costs(a) 127 (4)
Audit fees 395 378
Revaluation decrements 32,024 49,848
Other 150 683
34,021 51,783
Notes to the Financial StatementsFor the year ended 30 June 2017
CONTENTS OVERVIEWAGENCY
PERFORMANCEFINANCIAL
STATEMENTSKEY PERFORMANCE
INDICATORS DISCLOSURES APPENDIX
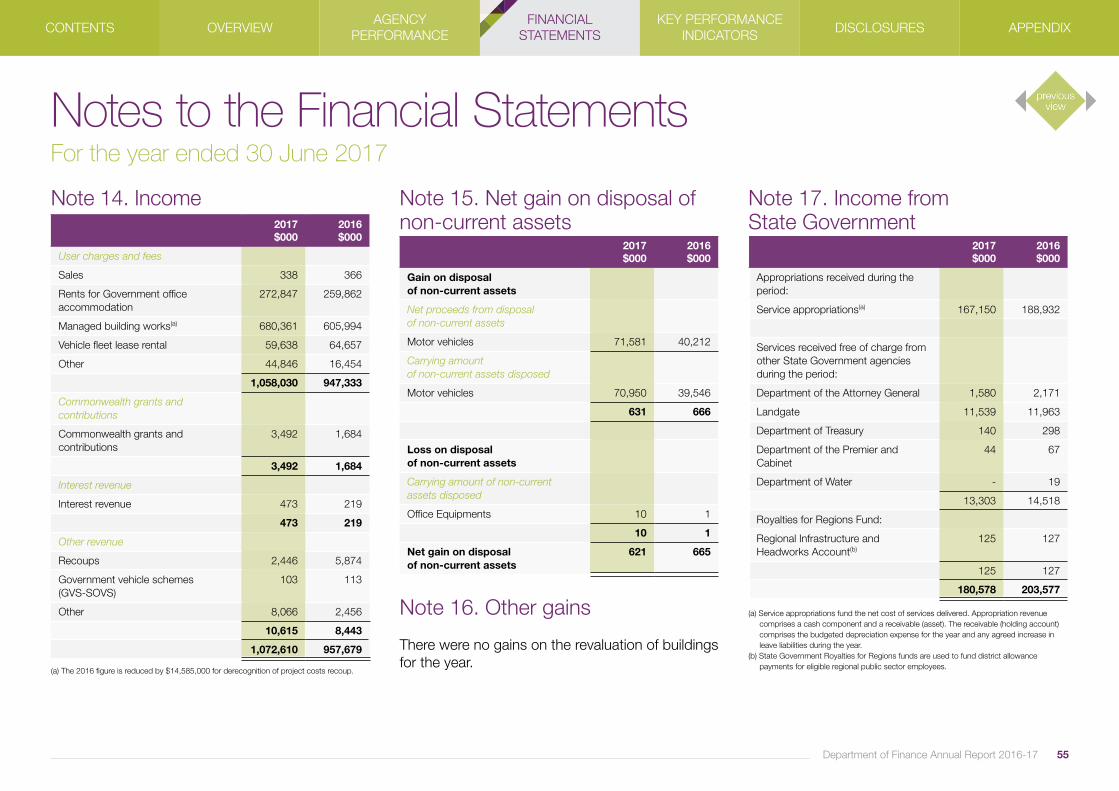
Note 16. Other gains
There were no gains on the revaluation of buildings for the year.
55Department of Finance Annual Report 2016-17
2017 $000
2016 $000
User charges and fees
Sales 338 366
Rents for Government office accommodation
272,847 259,862
Managed building works(a) 680,361 605,994
Vehicle fleet lease rental 59,638 64,657
Other 44,846 16,454
1,058,030 947,333
Commonwealth grants and contributions
Commonwealth grants and contributions
3,492 1,684
3,492 1,684
Interest revenue
Interest revenue 473 219
473 219
Other revenue
Recoups 2,446 5,874
Government vehicle schemes (GVS-SOVS)
103 113
Other 8,066 2,456
10,615 8,443
1,072,610 957,679
Note 14. Income Note 15. Net gain on disposal of non-current assets
Note 17. Income from State Government
(a) The 2016 figure is reduced by $14,585,000 for derecognition of project costs recoup.
2017 $000
2016 $000
Gain on disposal of non-current assets
Net proceeds from disposal of non-current assets
Motor vehicles 71,581 40,212
Carrying amount of non-current assets disposed
Motor vehicles 70,950 39,546
631 666
Loss on disposal of non-current assets
Carrying amount of non-current assets disposed
Office Equipments 10 1
10 1
Net gain on disposal of non-current assets
621 665
2017 $000
2016 $000
Appropriations received during the period:
Service appropriations(a) 167,150 188,932
Services received free of charge from other State Government agencies during the period:
Department of the Attorney General 1,580 2,171
Landgate 11,539 11,963
Department of Treasury 140 298
Department of the Premier and Cabinet
44 67
Department of Water - 19
13,303 14,518
Royalties for Regions Fund:
Regional Infrastructure and Headworks Account(b)
125 127
125 127
180,578 203,577
(a) Service appropriations fund the net cost of services delivered. Appropriation revenue comprises a cash component and a receivable (asset). The receivable (holding account) comprises the budgeted depreciation expense for the year and any agreed increase in leave liabilities during the year. (b) State Government Royalties for Regions funds are used to fund district allowance payments for eligible regional public sector employees.
Notes to the Financial StatementsFor the year ended 30 June 2017
CONTENTS OVERVIEWAGENCY
PERFORMANCEFINANCIAL
STATEMENTSKEY PERFORMANCE
INDICATORS DISCLOSURES APPENDIX
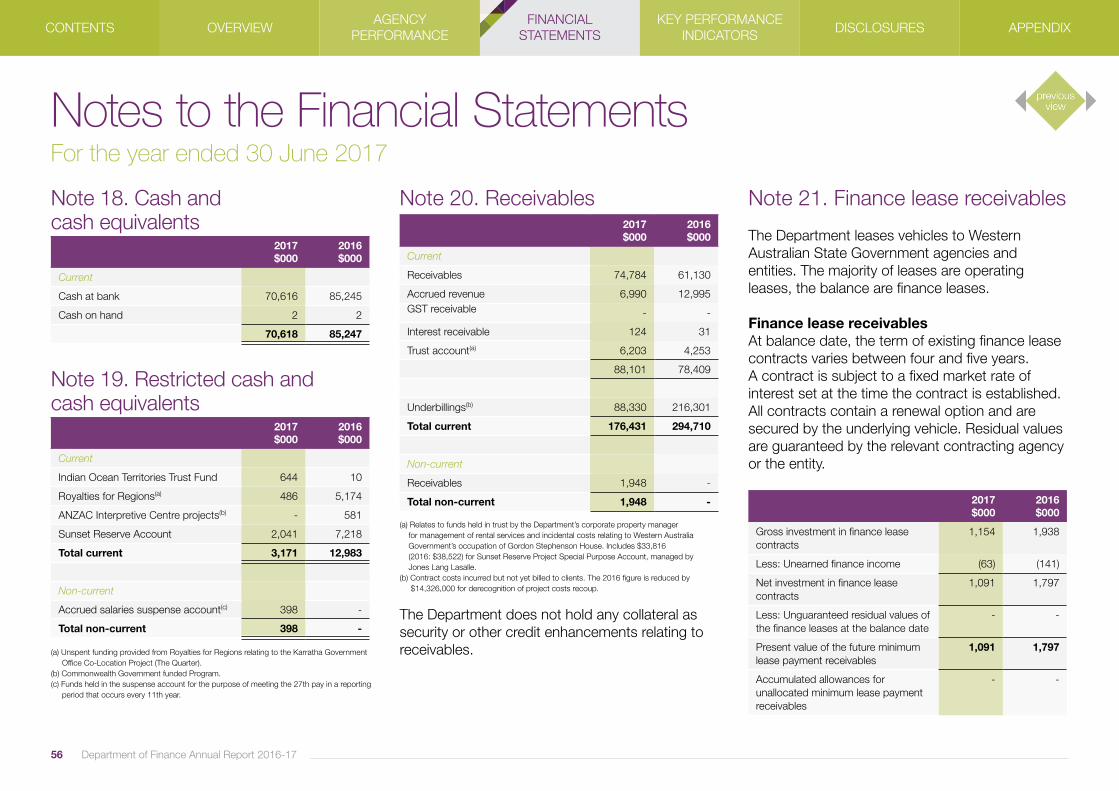
56 Department of Finance Annual Report 2016-17
2017 $000
2016 $000
Current
Cash at bank 70,616 85,245
Cash on hand 2 2
70,618 85,247
2017 $000
2016 $000
Current
Indian Ocean Territories Trust Fund 644 10
Royalties for Regions(a) 486 5,174
ANZAC Interpretive Centre projects(b) - 581
Sunset Reserve Account 2,041 7,218
Total current 3,171 12,983
Non-current
Accrued salaries suspense account(c) 398 -
Total non-current 398 -
Note 18. Cash and cash equivalents
Note 19. Restricted cash and cash equivalents
Note 20. Receivables Note 21. Finance lease receivables
The Department leases vehicles to Western Australian State Government agencies and entities. The majority of leases are operating leases, the balance are finance leases.
Finance lease receivablesAt balance date, the term of existing finance lease contracts varies between four and five years.A contract is subject to a fixed market rate of interest set at the time the contract is established. All contracts contain a renewal option and are secured by the underlying vehicle. Residual values are guaranteed by the relevant contracting agency or the entity.
(a) Unspent funding provided from Royalties for Regions relating to the Karratha Government Office Co-Location Project (The Quarter).(b) Commonwealth Government funded Program.(c) Funds held in the suspense account for the purpose of meeting the 27th pay in a reporting period that occurs every 11th year.
(a) Relates to funds held in trust by the Department’s corporate property manager for management of rental services and incidental costs relating to Western Australia Government’s occupation of Gordon Stephenson House. Includes $33,816 (2016: $38,522) for Sunset Reserve Project Special Purpose Account, managed by Jones Lang Lasalle.(b) Contract costs incurred but not yet billed to clients. The 2016 figure is reduced by $14,326,000 for derecognition of project costs recoup.
The Department does not hold any collateral as security or other credit enhancements relating to receivables.
2017 $000
2016 $000
Current
Receivables 74,784 61,130
Accrued revenue 6,990 12,995 GST receivable - -
Interest receivable 124 31
Trust account(a) 6,203 4,253
88,101 78,409
Underbillings(b) 88,330 216,301
Total current 176,431 294,710
Non-current
Receivables 1,948 -
Total non-current 1,948 - 2017 $000
2016 $000
Gross investment in finance lease contracts
1,154 1,938
Less: Unearned finance income (63) (141)
Net investment in finance lease contracts
1,091 1,797
Less: Unguaranteed residual values of the finance leases at the balance date
- -
Present value of the future minimum lease payment receivables
1,091 1,797
Accumulated allowances for unallocated minimum lease payment receivables
- -
Notes to the Financial StatementsFor the year ended 30 June 2017
CONTENTS OVERVIEWAGENCY
PERFORMANCEFINANCIAL
STATEMENTSKEY PERFORMANCE
INDICATORS DISCLOSURES APPENDIX
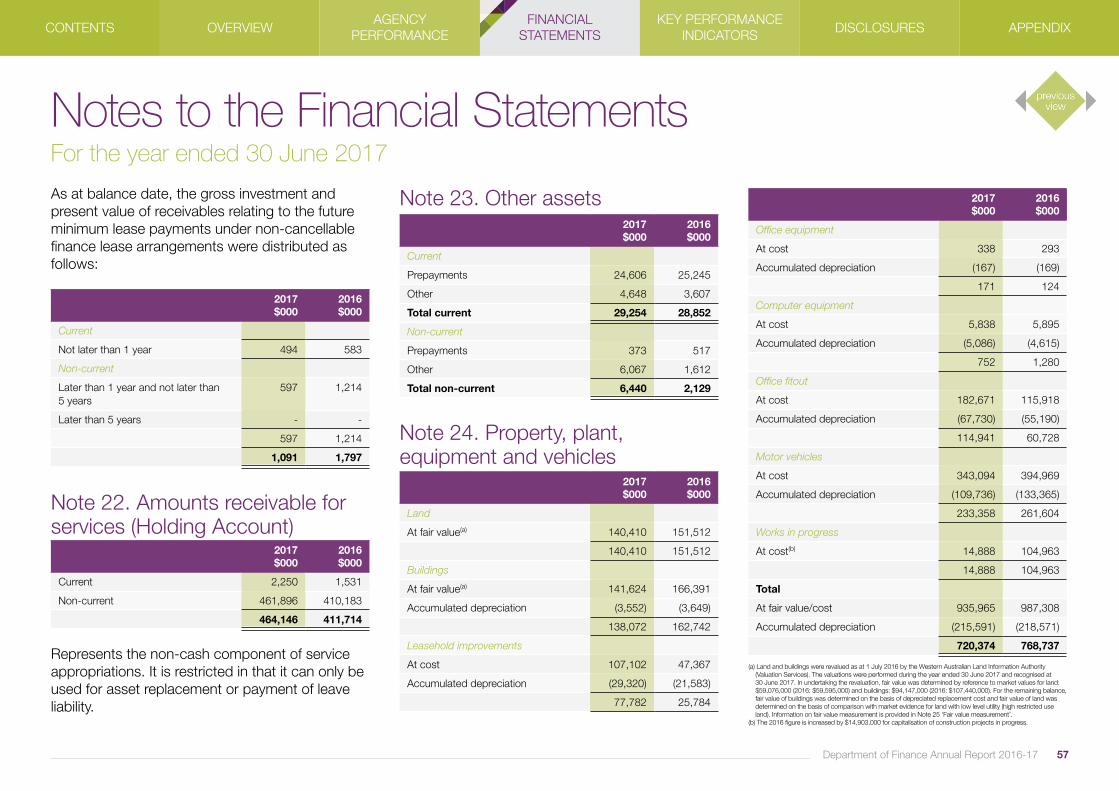
As at balance date, the gross investment and present value of receivables relating to the future minimum lease payments under non-cancellable finance lease arrangements were distributed as follows:
Represents the non-cash component of service appropriations. It is restricted in that it can only be used for asset replacement or payment of leave liability.
(a) Land and buildings were revalued as at 1 July 2016 by the Western Australian Land Information Authority (Valuation Services). The valuations were performed during the year ended 30 June 2017 and recognised at 30 June 2017. In undertaking the revaluation, fair value was determined by reference to market values for land: $59,076,000 (2016: $59,595,000) and buildings: $94,147,000 (2016: $107,440,000). For the remaining balance, fair value of buildings was determined on the basis of depreciated replacement cost and fair value of land was determined on the basis of comparison with market evidence for land with low level utility (high restricted use land). Information on fair value measurement is provided in Note 25 ‘Fair value measurement’.(b) The 2016 figure is increased by $14,903,000 for capitalisation of construction projects in progress.
57Department of Finance Annual Report 2016-17
2017 $000
2016 $000
Current
Not later than 1 year 494 583
Non-current
Later than 1 year and not later than 5 years
597 1,214
Later than 5 years - -
597 1,214
1,091 1,797
2017 $000
2016 $000
Current 2,250 1,531
Non-current 461,896 410,183
464,146 411,714
Note 22. Amounts receivable for services (Holding Account)
Note 23. Other assets
Note 24. Property, plant, equipment and vehicles
2017 $000
2016 $000
Current
Prepayments 24,606 25,245
Other 4,648 3,607
Total current 29,254 28,852
Non-current
Prepayments 373 517
Other 6,067 1,612
Total non-current 6,440 2,129
2017 $000
2016 $000
Land
At fair value(a) 140,410 151,512
140,410 151,512
Buildings
At fair value(a) 141,624 166,391
Accumulated depreciation (3,552) (3,649)
138,072 162,742
Leasehold improvements
At cost 107,102 47,367
Accumulated depreciation (29,320) (21,583)
77,782 25,784
2017 $000
2016 $000
Office equipment
At cost 338 293
Accumulated depreciation (167) (169)
171 124
Computer equipment
At cost 5,838 5,895
Accumulated depreciation (5,086) (4,615)
752 1,280
Office fitout
At cost 182,671 115,918
Accumulated depreciation (67,730) (55,190)
114,941 60,728
Motor vehicles
At cost 343,094 394,969
Accumulated depreciation (109,736) (133,365)
233,358 261,604
Works in progress
At cost(b) 14,888 104,963
14,888 104,963
Total
At fair value/cost 935,965 987,308
Accumulated depreciation (215,591) (218,571)
720,374 768,737
Notes to the Financial StatementsFor the year ended 30 June 2017
CONTENTS OVERVIEWAGENCY
PERFORMANCEFINANCIAL
STATEMENTSKEY PERFORMANCE
INDICATORS DISCLOSURES APPENDIX

Reconciliations of the carrying amounts of property, plant and equipment and vehicles at the beginning and end of the reporting period are set outin the table below.
(a) Work in progress was transferred to Leasehold Improvements for $60,063,525 and to office fitout for $66,751,752. During the year one vehicle was transferred to a finance lease for Department of Education ($44,000).(b) Fremantle Prison land and buildings were transferred to the State Heritage Office for $265,000 and $29,301,600 respectively. Work in progress was transferred to Leasehold Improvements for $4,247,783 and to office fitout for $23,449,221. Four office fitout were transferred to Western Australia Police for $1,312,215. One office fitout was transferred to Department of Attorney General for $21,917,221. During the financial year 7 vehicles were transferred to finance leases; made up of four vehicles for Water Corporation ($140,000), two vehicles for the Department of Education ($84,000) and one vehicle for the Department of Agriculture and Food ($37,000).
2017 Land
$000
Buildings
$000
Leasehold Improvements
$000
Office Equipment
$000
Computer Equipment
$000
Office fitout $000
Motor vehicles
$000
Work in progress
$000
Total
$000
Carrying amount at start of period 151,512 162,742 25,784 124 1,280 60,728 261,604 104,963 768,737
Additions - - - - 80 - 84,370 36,741 121,191
Transfers(a) - - 60,064 111 (111) 66,753 (44) (126,816) (44)
Other disposals - - - (10) - - (70,950) - (70,960)
Revaluations (11,102) (20,922) - - - - - - (32,024)
Depreciation (3,747) (8,066) (54) (497) (12,540) (41,622) (66,526)
Carrying amount at end of period 140,410 138,072 77,782 171 752 114,941 233,358 14,888 720,374
2016 $000 $000 $000 $000 $000 $000 $000 $000
Carrying amount at start of period 174,665 242,798 27,593 129 1,384 74,764 258,114 25,254 804,702
Additions - - - 48 626 - 88,959 107,406 197,038
Transfers(b) (265) (29,302) 4,248 (5) - 82 (261) (27,697) (53,201)
Other disposals - - - (1) - - (39,546) - (39,548)
Revaluations (22,888) (45,625) - - - - - - (68,513)
Depreciation - (5,129) (6,057) (47) (728) (14,118) (45,662) - (71,740)
Carrying amount at end of period 151,512 162,742 25,784 124 1,280 60,728 261,604 104,963 768,737
58 Department of Finance Annual Report 2016-17
Notes to the Financial StatementsFor the year ended 30 June 2017
CONTENTS OVERVIEWAGENCY
PERFORMANCEFINANCIAL
STATEMENTSKEY PERFORMANCE
INDICATORS DISCLOSURES APPENDIX
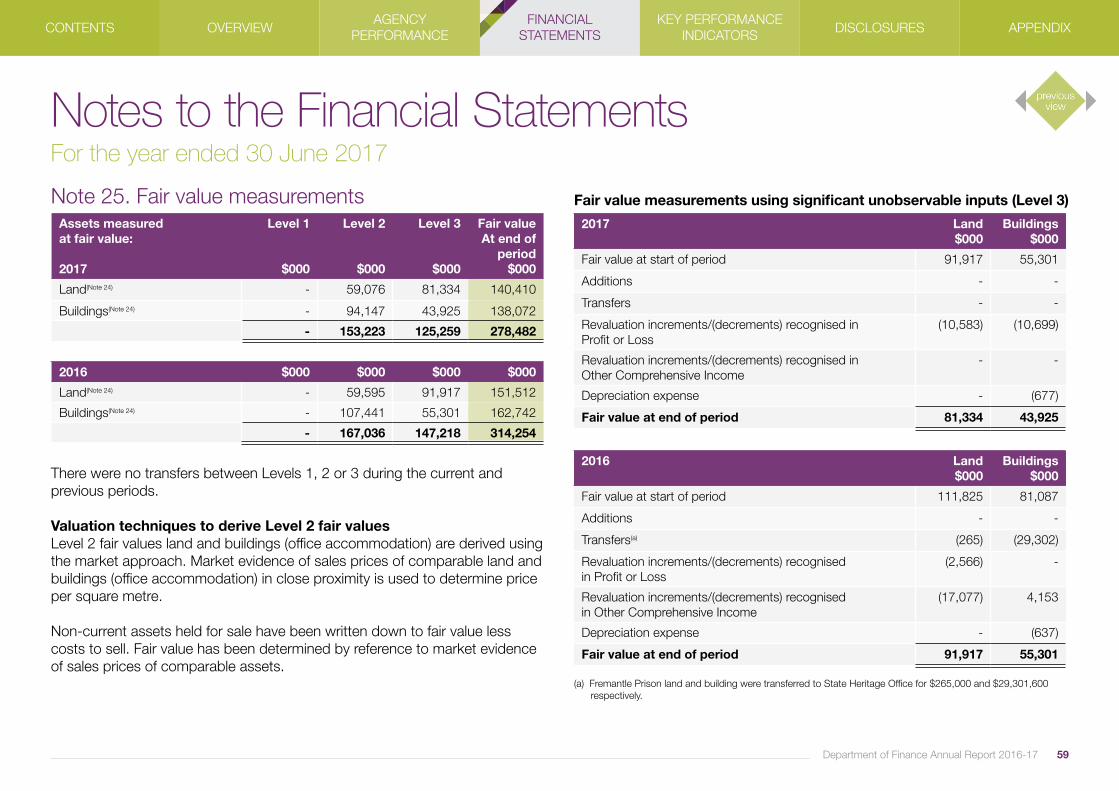
Note 25. Fair value measurements Fair value measurements using significant unobservable inputs (Level 3)
(a) Fremantle Prison land and building were transferred to State Heritage Office for $265,000 and $29,301,600 respectively.
There were no transfers between Levels 1, 2 or 3 during the current and previous periods. Valuation techniques to derive Level 2 fair values Level 2 fair values land and buildings (office accommodation) are derived using the market approach. Market evidence of sales prices of comparable land and buildings (office accommodation) in close proximity is used to determine price per square metre. Non-current assets held for sale have been written down to fair value less costs to sell. Fair value has been determined by reference to market evidence of sales prices of comparable assets.
Assets measured at fair value: 2017
Level 1
$000
Level 2
$000
Level 3
$000
Fair value At end of
period $000
Land(Note 24) - 59,076 81,334 140,410
Buildings(Note 24) - 94,147 43,925 138,072
- 153,223 125,259 278,482
2016 $000 $000 $000 $000
Land(Note 24) - 59,595 91,917 151,512
Buildings(Note 24) - 107,441 55,301 162,742
- 167,036 147,218 314,254
2017 Land $000
Buildings $000
Fair value at start of period 91,917 55,301
Additions - -
Transfers - -
Revaluation increments/(decrements) recognised in Profit or Loss
(10,583) (10,699)
Revaluation increments/(decrements) recognised in Other Comprehensive Income
- -
Depreciation expense - (677)
Fair value at end of period 81,334 43,925
2016 Land $000
Buildings $000
Fair value at start of period 111,825 81,087
Additions - -
Transfers(a) (265) (29,302)
Revaluation increments/(decrements) recognised in Profit or Loss
(2,566) -
Revaluation increments/(decrements) recognised in Other Comprehensive Income
(17,077) 4,153
Depreciation expense - (637)
Fair value at end of period 91,917 55,301
59Department of Finance Annual Report 2016-17
Notes to the Financial StatementsFor the year ended 30 June 2017
CONTENTS OVERVIEWAGENCY
PERFORMANCEFINANCIAL
STATEMENTSKEY PERFORMANCE
INDICATORS DISCLOSURES APPENDIX
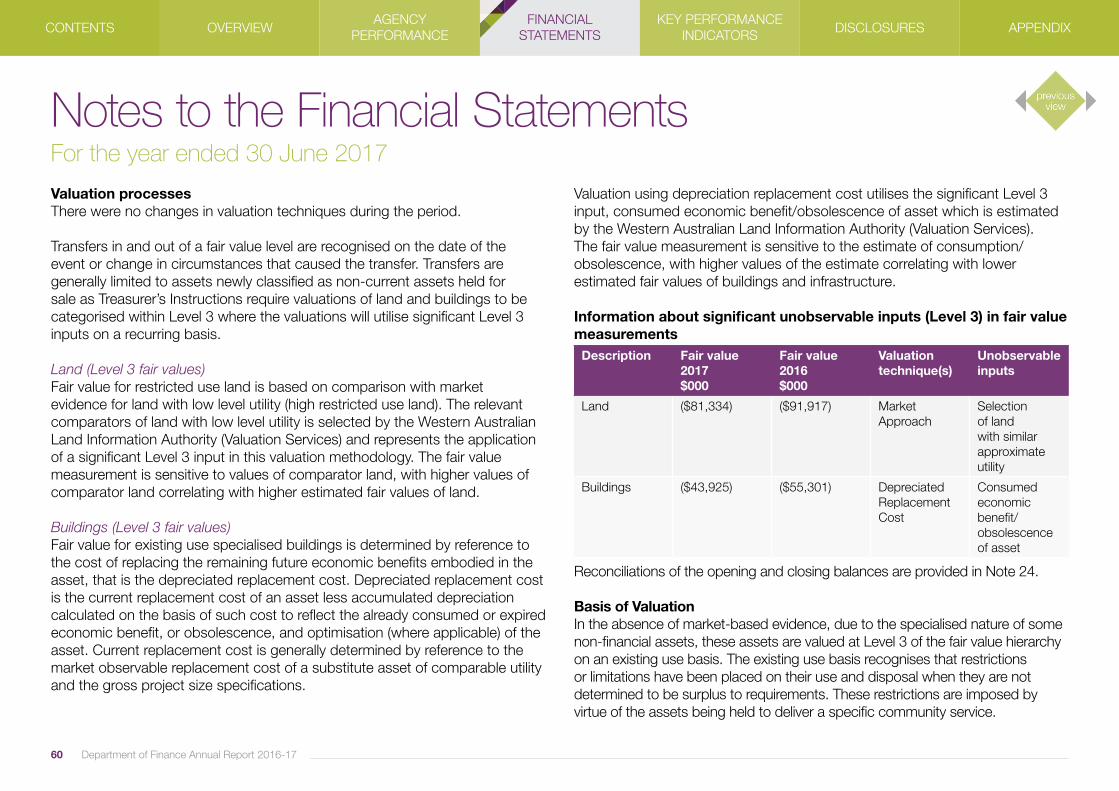
Valuation processesThere were no changes in valuation techniques during the period.
Transfers in and out of a fair value level are recognised on the date of the event or change in circumstances that caused the transfer. Transfers are generally limited to assets newly classified as non-current assets held for sale as Treasurer’s Instructions require valuations of land and buildings to be categorised within Level 3 where the valuations will utilise significant Level 3 inputs on a recurring basis.
Land (Level 3 fair values)Fair value for restricted use land is based on comparison with market evidence for land with low level utility (high restricted use land). The relevant comparators of land with low level utility is selected by the Western Australian Land Information Authority (Valuation Services) and represents the application of a significant Level 3 input in this valuation methodology. The fair value measurement is sensitive to values of comparator land, with higher values of comparator land correlating with higher estimated fair values of land. Buildings (Level 3 fair values)Fair value for existing use specialised buildings is determined by reference to the cost of replacing the remaining future economic benefits embodied in the asset, that is the depreciated replacement cost. Depreciated replacement cost is the current replacement cost of an asset less accumulated depreciation calculated on the basis of such cost to reflect the already consumed or expired economic benefit, or obsolescence, and optimisation (where applicable) of the asset. Current replacement cost is generally determined by reference to the market observable replacement cost of a substitute asset of comparable utility and the gross project size specifications.
Valuation using depreciation replacement cost utilises the significant Level 3 input, consumed economic benefit/obsolescence of asset which is estimated by the Western Australian Land Information Authority (Valuation Services). The fair value measurement is sensitive to the estimate of consumption/obsolescence, with higher values of the estimate correlating with lower estimated fair values of buildings and infrastructure. Information about significant unobservable inputs (Level 3) in fair value measurements
Reconciliations of the opening and closing balances are provided in Note 24.
Basis of Valuation In the absence of market-based evidence, due to the specialised nature of some non-financial assets, these assets are valued at Level 3 of the fair value hierarchy on an existing use basis. The existing use basis recognises that restrictions or limitations have been placed on their use and disposal when they are not determined to be surplus to requirements. These restrictions are imposed by virtue of the assets being held to deliver a specific community service.
Description Fair value 2017 $000
Fair value 2016 $000
Valuation technique(s)
Unobservable inputs
Land ($81,334) ($91,917) Market Approach
Selection of land with similar approximate utility
Buildings ($43,925) ($55,301) Depreciated Replacement Cost
Consumed economic benefit/obsolescence of asset
60 Department of Finance Annual Report 2016-17
Notes to the Financial StatementsFor the year ended 30 June 2017
CONTENTS OVERVIEWAGENCY
PERFORMANCEFINANCIAL
STATEMENTSKEY PERFORMANCE
INDICATORS DISCLOSURES APPENDIX
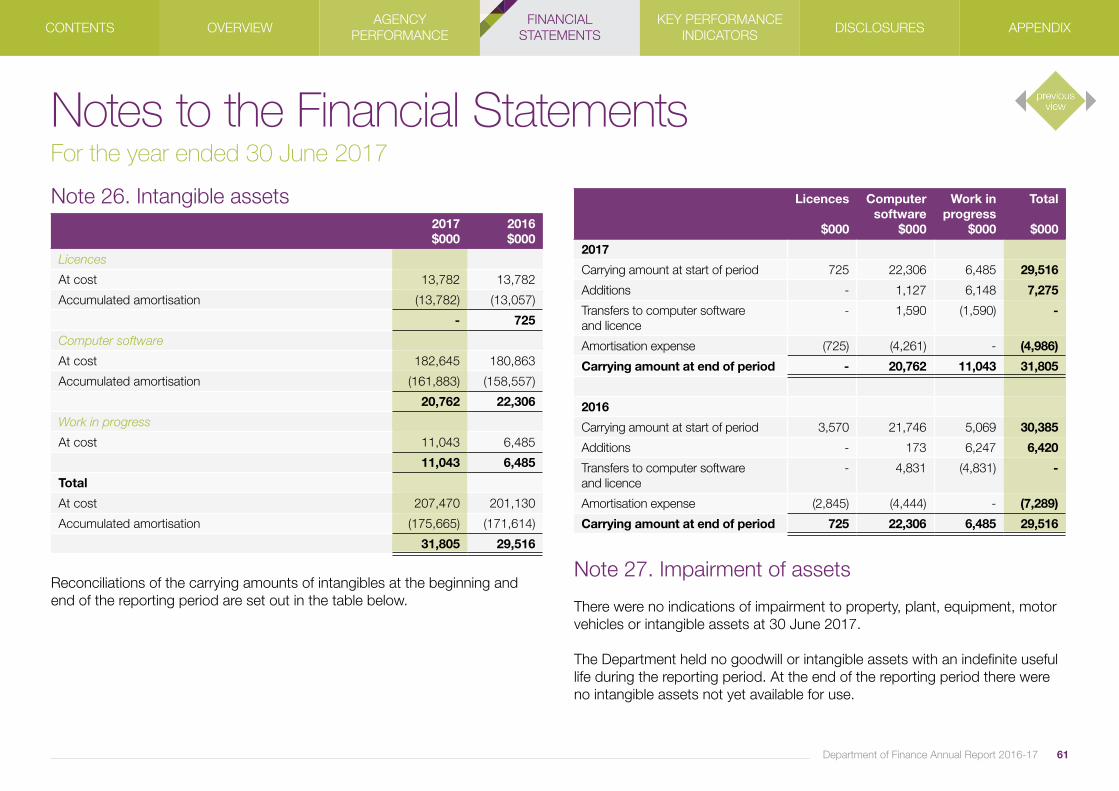
Note 27. Impairment of assets
There were no indications of impairment to property, plant, equipment, motor vehicles or intangible assets at 30 June 2017.
The Department held no goodwill or intangible assets with an indefinite useful life during the reporting period. At the end of the reporting period there were no intangible assets not yet available for use.
Reconciliations of the carrying amounts of intangibles at the beginning and end of the reporting period are set out in the table below.
Note 26. Intangible assets2017 $000
2016 $000
Licences
At cost 13,782 13,782
Accumulated amortisation (13,782) (13,057)
- 725
Computer software
At cost 182,645 180,863
Accumulated amortisation (161,883) (158,557)
20,762 22,306
Work in progress
At cost 11,043 6,485
11,043 6,485
Total
At cost 207,470 201,130
Accumulated amortisation (175,665) (171,614)
31,805 29,516
Licences
$000
Computer software
$000
Work in progress
$000
Total
$000
2017
Carrying amount at start of period 725 22,306 6,485 29,516
Additions - 1,127 6,148 7,275
Transfers to computer software and licence
- 1,590 (1,590) -
Amortisation expense (725) (4,261) - (4,986)
Carrying amount at end of period - 20,762 11,043 31,805
2016
Carrying amount at start of period 3,570 21,746 5,069 30,385
Additions - 173 6,247 6,420
Transfers to computer software and licence
- 4,831 (4,831) -
Amortisation expense (2,845) (4,444) - (7,289)
Carrying amount at end of period 725 22,306 6,485 29,516
61Department of Finance Annual Report 2016-17
Notes to the Financial StatementsFor the year ended 30 June 2017
CONTENTS OVERVIEWAGENCY
PERFORMANCEFINANCIAL
STATEMENTSKEY PERFORMANCE
INDICATORS DISCLOSURES APPENDIX
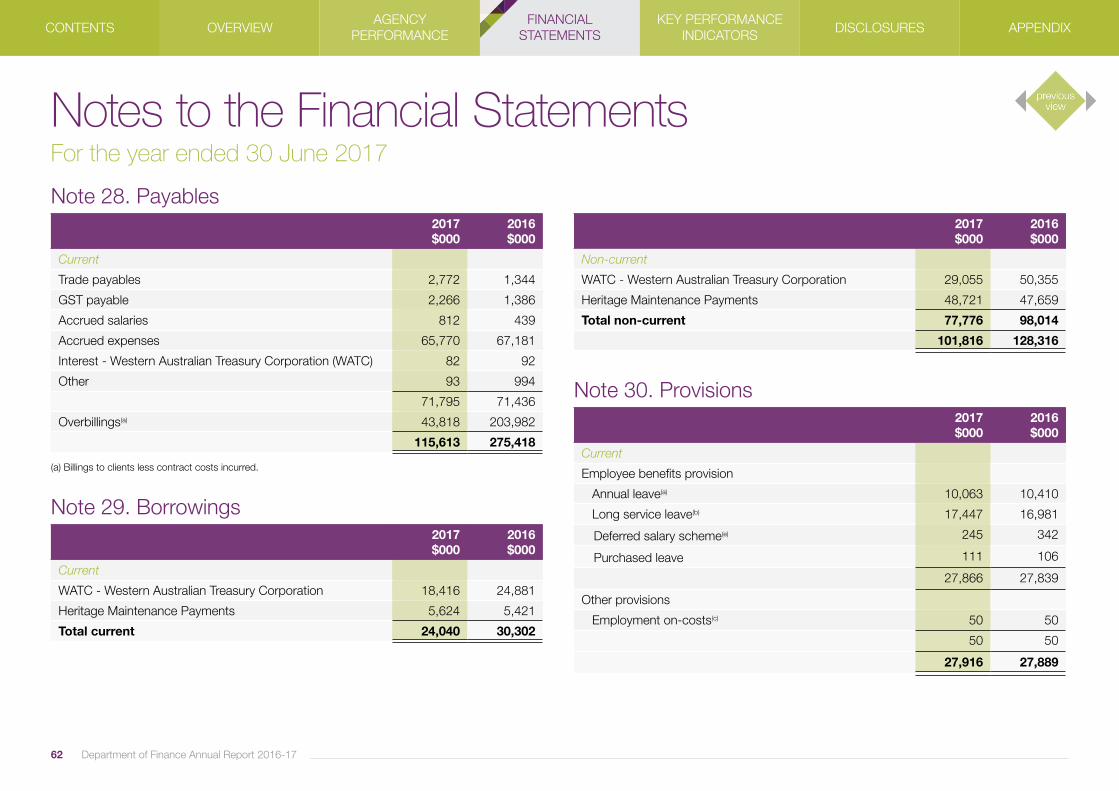
2017 $000
2016 $000
Current
Trade payables 2,772 1,344
GST payable 2,266 1,386
Accrued salaries 812 439
Accrued expenses 65,770 67,181
Interest - Western Australian Treasury Corporation (WATC) 82 92
Other 93 994
71,795 71,436
Overbillings(a) 43,818 203,982
115,613 275,418
2017 $000
2016 $000
Current
WATC - Western Australian Treasury Corporation 18,416 24,881
Heritage Maintenance Payments 5,624 5,421
Total current 24,040 30,302
2017 $000
2016 $000
Non-current
WATC - Western Australian Treasury Corporation 29,055 50,355
Heritage Maintenance Payments 48,721 47,659
Total non-current 77,776 98,014
101,816 128,316
Note 28. Payables
Note 29. Borrowings
2017 $000
2016 $000
Current
Employee benefits provision
Annual leave(a) 10,063 10,410
Long service leave(b) 17,447 16,981
Deferred salary scheme(e) 245 342
Purchased leave 111 106
27,866 27,839
Other provisions
Employment on-costs(c) 50 50
50 50
27,916 27,889
Note 30. Provisions
(a) Billings to clients less contract costs incurred.
62 Department of Finance Annual Report 2016-17
Notes to the Financial StatementsFor the year ended 30 June 2017
CONTENTS OVERVIEWAGENCY
PERFORMANCEFINANCIAL
STATEMENTSKEY PERFORMANCE
INDICATORS DISCLOSURES APPENDIX
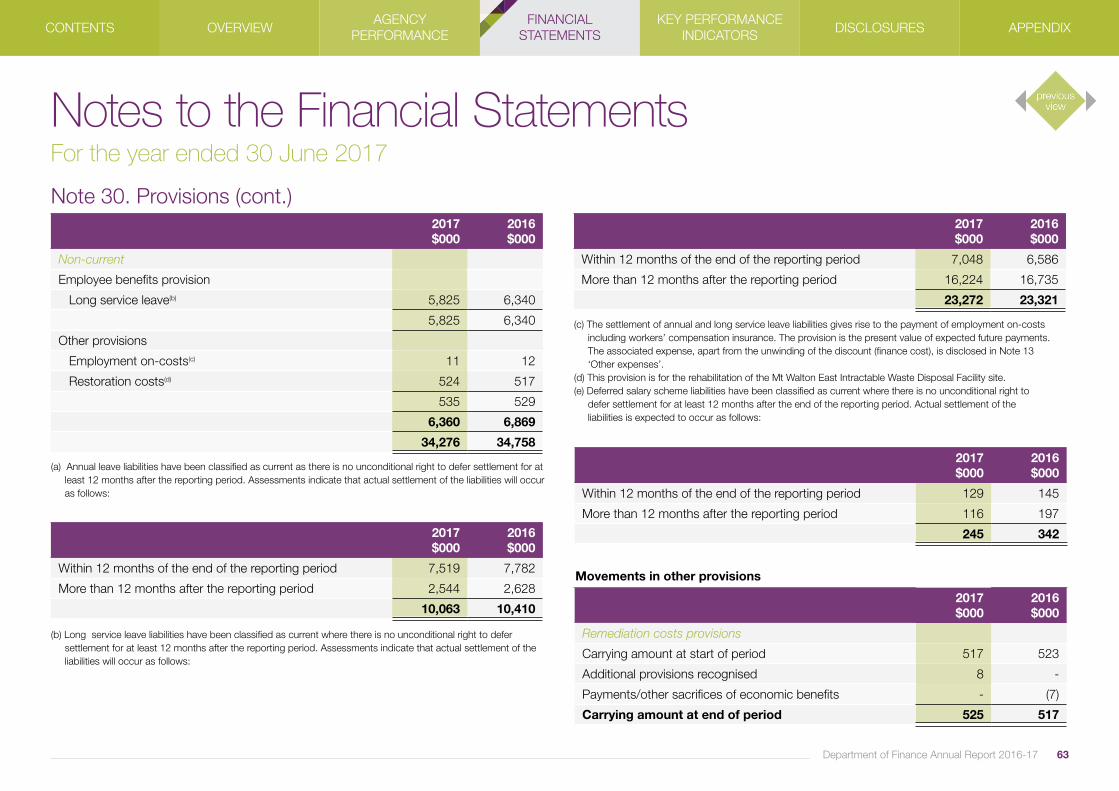
2017 $000
2016 $000
Non-current
Employee benefits provision
Long service leave(b) 5,825 6,340
5,825 6,340
Other provisions
Employment on-costs(c) 11 12
Restoration costs(d) 524 517
535 529
6,360 6,869
34,276 34,758
2017 $000
2016 $000
Within 12 months of the end of the reporting period 7,519 7,782
More than 12 months after the reporting period 2,544 2,628
10,063 10,410
(a) Annual leave liabilities have been classified as current as there is no unconditional right to defer settlement for at least 12 months after the reporting period. Assessments indicate that actual settlement of the liabilities will occur as follows:
(b) Long service leave liabilities have been classified as current where there is no unconditional right to defer settlement for at least 12 months after the reporting period. Assessments indicate that actual settlement of the liabilities will occur as follows:
2017 $000
2016 $000
Within 12 months of the end of the reporting period 7,048 6,586
More than 12 months after the reporting period 16,224 16,735
23,272 23,321
2017 $000
2016 $000
Within 12 months of the end of the reporting period 129 145
More than 12 months after the reporting period 116 197
245 342
Movements in other provisions
2017 $000
2016 $000
Remediation costs provisions
Carrying amount at start of period 517 523
Additional provisions recognised 8 -
Payments/other sacrifices of economic benefits - (7)
Carrying amount at end of period 525 517
(c) The settlement of annual and long service leave liabilities gives rise to the payment of employment on-costs including workers’ compensation insurance. The provision is the present value of expected future payments. The associated expense, apart from the unwinding of the discount (finance cost), is disclosed in Note 13 ‘Other expenses’.(d) This provision is for the rehabilitation of the Mt Walton East Intractable Waste Disposal Facility site.(e) Deferred salary scheme liabilities have been classified as current where there is no unconditional right to defer settlement for at least 12 months after the end of the reporting period. Actual settlement of the liabilities is expected to occur as follows:
63Department of Finance Annual Report 2016-17
Note 30. Provisions (cont.)
Notes to the Financial StatementsFor the year ended 30 June 2017
CONTENTS OVERVIEWAGENCY
PERFORMANCEFINANCIAL
STATEMENTSKEY PERFORMANCE
INDICATORS DISCLOSURES APPENDIX

2017 $000
2016 $000
Employment on-cost provision
Carrying amount at start of period 62 66
Additional provisions recognised 25 19
Payments/other sacrifices of economic benefits (26) (24)
Carrying amount at end of period 61 62
586 579
2017 $000
2016 $000
Current 13,604 9,612
Non-current 101,251 85,349
114,855 94,961
2017 $000
2016 $000
Current - -
Unearned revenue 24,055 26,996
24,055 26,996
Note 31. Lease incentives
Note 32. Other liabilities
Contributed equity
2017 $000
2016 $000
Balance at start of period 1,026,944 996,594
Contributions by owners
Capital appropriations 28,763 84,268
Other contributions by owners
Regional Infrastructure and Headworks Fund 245 5,250
Total contributions by owners 245 5,250
Distributions to owners
Transfer of net assets to other agencies:
Transfer of Fremantle Prison to State Heritage Office (24) (29,758)
Transfer of office fit-out and fixed assets appropriation to Western Australia Police
- (7,493)
Transfer of office fit-out to the Department of the Attorney General
- (21,918)
Total distributions to owners (24) (59,169)
Balance at end of period 1,055,928 1,026,944
Note 33. Equity
The Western Australian Government holds the equity interest in the Department on behalf of the community. Equity represents the residual interest in the net assets of the Department. The asset revaluation surplus represents that portion of equity resulting from the revaluation of non-current assets.
64 Department of Finance Annual Report 2016-17
Note 30. Provisions (cont.)
Notes to the Financial StatementsFor the year ended 30 June 2017
CONTENTS OVERVIEWAGENCY
PERFORMANCEFINANCIAL
STATEMENTSKEY PERFORMANCE
INDICATORS DISCLOSURES APPENDIX

Reserves
2017 $000
2016 $000
Asset revaluation reserve
Balance at start of period - 18,665
Net revaluation increments/(decrements):
Land - (17,077)
Buildings - (1,588)
Balance at end of period - -
Accumulated surplus
2017 $000
2016 $000
Balance at start of period 48,292 68,783
Result for the period 10,841 (20,491)
Balance at end of period 59,133 48,292
Total equity at end of period 1,115,061 1,075,236
2017 $000
2016 $000
Cash and cash equivalents(a) 70,618 85,247
Restricted cash and cash equivalents(b) 3,569 12,983
Balance at end of period 74,187 98,230
2017 $000
2016 $000
Net cost of services (169,737) (224,068)
Non-cash items
Depreciation and amortisation expense (Note 9) 71,513 79,031
Doubtful debts expense - 3
Services received free of charge (Note 17) 13,303 14,518
Gain on revaluation increment (Note 16) - -
Loss on revaluation decrement (Note 13) 32,024 49,848
Gain on disposal of property, plant and equipment (Note 15) (622) (665)
Note 34. Notes to the Statement of Cash Flows
Reconciliation of cashCash at the end of the financial year as shown in the Statement of Cash Flows is reconciled to the related items in the Statement of Financial Position as follows:
Reconciliation of net cost of services to net cash flows provided by/(used in) operating activities
(a) See also Note 18 ‘Cash and cash equivalents’.(b) See also Note 19 ‘Restricted cash and cash equivalents’.
65Department of Finance Annual Report 2016-17
Notes to the Financial StatementsFor the year ended 30 June 2017
CONTENTS OVERVIEWAGENCY
PERFORMANCEFINANCIAL
STATEMENTSKEY PERFORMANCE
INDICATORS DISCLOSURES APPENDIX
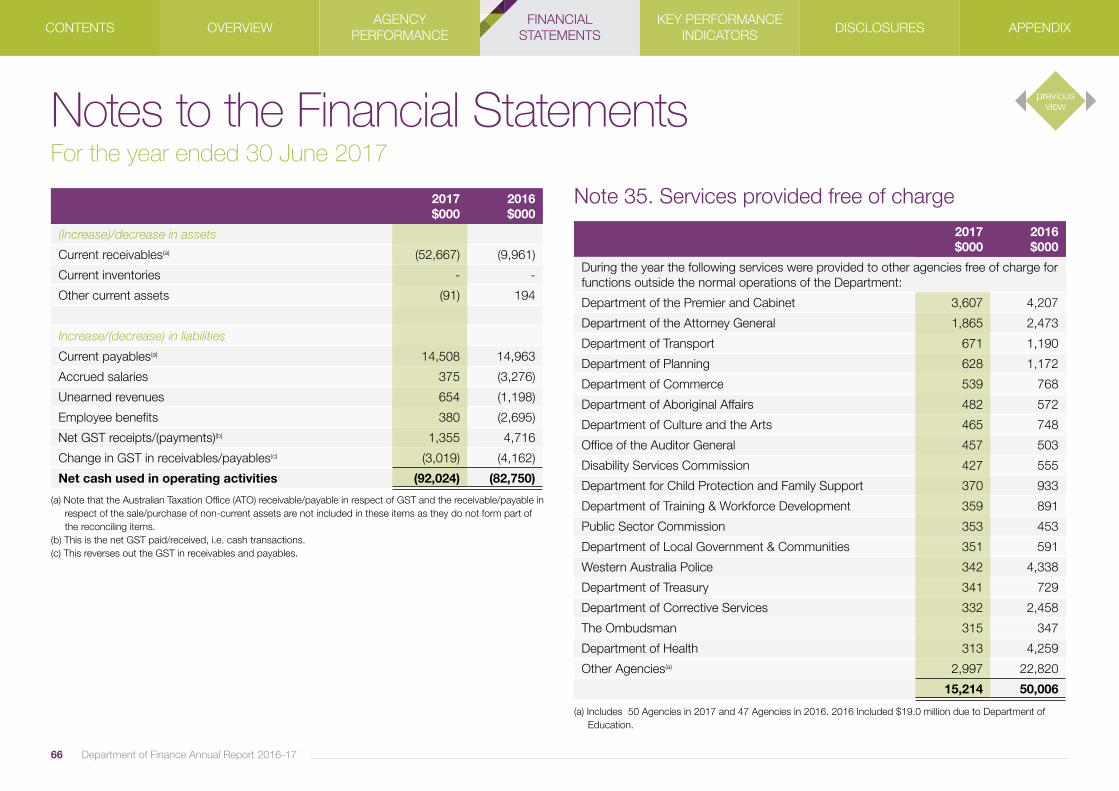
2017 $000
2016 $000
(Increase)/decrease in assets
Current receivables(a) (52,667) (9,961)
Current inventories - -
Other current assets (91) 194
Increase/(decrease) in liabilities
Current payables(a) 14,508 14,963
Accrued salaries 375 (3,276)
Unearned revenues 654 (1,198)
Employee benefits 380 (2,695)
Net GST receipts/(payments)(b) 1,355 4,716
Change in GST in receivables/payables(c) (3,019) (4,162)
Net cash used in operating activities (92,024) (82,750)
(a) Note that the Australian Taxation Office (ATO) receivable/payable in respect of GST and the receivable/payable in respect of the sale/purchase of non-current assets are not included in these items as they do not form part of the reconciling items.(b) This is the net GST paid/received, i.e. cash transactions.(c) This reverses out the GST in receivables and payables.
(a) Includes 50 Agencies in 2017 and 47 Agencies in 2016. 2016 Included $19.0 million due to Department of Education.
2017 $000
2016 $000
During the year the following services were provided to other agencies free of charge for functions outside the normal operations of the Department:
Department of the Premier and Cabinet 3,607 4,207
Department of the Attorney General 1,865 2,473
Department of Transport 671 1,190
Department of Planning 628 1,172
Department of Commerce 539 768
Department of Aboriginal Affairs 482 572
Department of Culture and the Arts 465 748
Office of the Auditor General 457 503
Disability Services Commission 427 555
Department for Child Protection and Family Support 370 933
Department of Training & Workforce Development 359 891
Public Sector Commission 353 453
Department of Local Government & Communities 351 591
Western Australia Police 342 4,338
Department of Treasury 341 729
Department of Corrective Services 332 2,458
The Ombudsman 315 347
Department of Health 313 4,259
Other Agencies(a) 2,997 22,820
15,214 50,006
Note 35. Services provided free of charge
66 Department of Finance Annual Report 2016-17
Notes to the Financial StatementsFor the year ended 30 June 2017
CONTENTS OVERVIEWAGENCY
PERFORMANCEFINANCIAL
STATEMENTSKEY PERFORMANCE
INDICATORS DISCLOSURES APPENDIX

Non-cancellable operating lease commitments
2017 $000
2016 $000
Commitments for minimum lease payments are payable as follows:
Within 1 year 9,367 10,979
Later than 1 year and not later than 5 years 34,464 42,395
Later than 5 years 29,908 39,951
73,739 93,325
2017 $000
2016 $000
Within 1 year 41,511 48,406
Later than 1 year and not later than 5 years 589 -
42,100 48,406
Note 36. Commitments
The property leases are non-cancellable and have terms ranging from 1 year to 15 years, with rent generally payable monthly in advance. Depending on the terms and conditions of the lease concerned, rent review provisions exist which generally result in rental increases throughout the lease terms. Options exist in most leases which permit leases to be extended under the prevailing lease terms and conditions, resulting in leases being extended beyond their original lease term.
Capital expenditure commitmentsCapital expenditure commitments, being contracted capital expenditure additional to the amounts reported in the financial statements, are payable as follows:
2017 $000
2016 $000
Within 1 year 10,054 6,727
Later than 1 year and not later than 5 years - -
10,054 6,727
2017 $000
2016 $000
Current
Within 1 year 40,980 47,239
Non-current
Later than 1 year and not later than 5 years 54,407 55,709
Later than 5 years 581 450
54,988 56,159
95,968 103,398
Other expenditure commitments Other expenditure commitments contracted for at the end of the reporting period but not recognised as liabilities, are payable as follows:
Other operating lease receivables Reflects State Fleet operating lease receivables for vehicles owned by the Department. As at balance date, the future minimum lease payments under non-cancellable operating lease arrangements were distributed as follows:
67Department of Finance Annual Report 2016-17
Notes to the Financial StatementsFor the year ended 30 June 2017
CONTENTS OVERVIEWAGENCY
PERFORMANCEFINANCIAL
STATEMENTSKEY PERFORMANCE
INDICATORS DISCLOSURES APPENDIX

68 Department of Finance Annual Report 2016-17
Note 37. Contingent liabilities andcontingent assets
2017 $000
2016 $000
Contract Claims in Dispute - 4,124
The contingent liabilities relate to construction works.
Energy reform function 4,100 -
This contingent liability relates to an indemnity claim in relation to the energy reform function.
2017 $000
2016 $000
Litigation in progress - 21,267
Contingent liabilitiesThe following contingent liabilities are additional to the liabilities included in the financial statements:
Contingent assetsThe following contingent assets are additional to the assets included in the financial statements.
Contaminated Sites Act 2003Under the Contaminated Sites Act 2003, the Department of Finance is required to report known and suspected contaminated sites to the Department of Environment Regulation (DER). In accordance with the Act, DER classifies these sites on the basis of the risk to human health, the environment and environmental values. Where sites are classified as contaminated – remediation required, contaminated – restricted use or possibly contaminated – investigation required, the Department may have a liability in respect of investigation or remediation expenses.
The Department has reported two suspected contaminated sites to DER.The first site has been classified as possibly contaminated-investigation required. The Department is unable to assess the likely outcome of the classification process and accordingly it is not practicable to estimate the potential financial effect or to identify the uncertainties relating to the amount or timing of any outflows. Whilst there is no possibility of reimbursement of any future expenses that may be incurred in the remediation of these sites,the Department may apply for funding from the Contaminated Sites Management Account to undertake further investigative work or to meet remediation costs that may be required.
The second site has been classified as contaminated – restricted use. For this site, a restoration cost provision has been recognised to rehabilitate it to a standard suitable for future land use.
Contingent assets are mainly attributable to disputes concerning the Construction Contract Act 2004.
Notes to the Financial StatementsFor the year ended 30 June 2017
CONTENTS OVERVIEWAGENCY
PERFORMANCEFINANCIAL
STATEMENTSKEY PERFORMANCE
INDICATORS DISCLOSURES APPENDIX
Note 38. Related bodies and affiliated bodies
The Department has no related bodies or affiliated bodies.
Note 39. Events occurring after the end of the reporting period
From 1 July 2017 the Strategic Project function (excluding Assets Sales) will form part of the Department of Finance and from the same date the Public Utilities Office and Economic Reform businesss units have been transferred to the Department of Treasury.
Note 40. Financial instruments
(a) Financial risk management objectives and policies Financial instruments held by the Department are cash and cash equivalents, restricted cash and cash equivalents, borrowings, finance leases, Treasurer’s advances, loans and receivables and payables. The Department has limited exposure to financial risks. The Department’s overall risk management program focuses on managing the following risks.
Credit riskCredit risk arises when there is the possibility of the Department’s receivables defaulting on their contractual obligations resulting in financial loss to the Department.
The maximum exposure to credit risk at the end of the reporting period in relation to each class of recognised financial assets is the gross carrying amount of those assets inclusive of any allowance for impairment as shown in the table at Note 40(c) ‘Financial instrument disclosures’ and Note 20 ‘Receivables’.
Credit risk associated with the Department’s financial assets is minimal because the main receivable is the amount receivable for services (holding account). For receivables other than government, the Department trades only with recognised, creditworthy third parties. The Department has policies in place to ensure that sales of products and services are made to customers with an appropriate credit history. In addition, receivable balances are monitored on an ongoing basis with the result that the Department’s exposure to bad debts is minimal. At the end of the reporting period there were no significant concentrations of credit risk.
Liquidity riskLiquidity risk arises when the Department is unable to meet its financial obligations as they fall due.
The Department is exposed to liquidity risk through its trading in the normal course of business.
The Department has appropriate procedures to manage cash flows including drawdowns of appropriations by monitoring forecast cash flows to ensure that sufficient funds are available to meet its commitments.
69Department of Finance Annual Report 2016-17
Notes to the Financial StatementsFor the year ended 30 June 2017
CONTENTS OVERVIEWAGENCY
PERFORMANCEFINANCIAL
STATEMENTSKEY PERFORMANCE
INDICATORS DISCLOSURES APPENDIX

70 Department of Finance Annual Report 2016-17
The Department has a facility agreement in place with the Western Australian Treasury Corporation (WATC) to borrow up to $250,000,000 to meet State Fleet contractual requirements, purchase vehicles and provide working capital. As at 30 June 2017 $47,471,000 was drawn against the facility.
Market riskMarket risk is the risk that changes in market prices such as foreign exchange rates and interest rates will affect the Department’s income or the value of its holdings of financial instruments. The Department does not trade in foreign currency and is not materially exposed to other price risks (for example, equity securities or commodity prices changes). The Department’s exposure to market risk for changes in interest rates relates primarily to the long-term debt obligations.
All borrowings are due to the WATC and are repayable at fixed rates with varying maturities. Other than as detailed in the interest rate sensitivity analysis table at Note 40(c), the Department is not exposed to interest rate risk because the majority of cash and cash equivalents and restricted cash are non-interest bearing and it has no borrowings other than the Treasurer’s advance (non-interest bearing), WATC borrowings and finance leases(fixed interest rate).
(b) Categories of financial instrumentsIn addition to cash and bank overdraft, the carrying amounts of each of the following categories of financial assets and financial liabilities at the end of the reporting period are as follows:
(a) The amount of receivables excludes GST recoverable from the ATO (statutory receivable).(b) The amount of payables excludes GST payable to the ATO (statutory payable).
2017 $000
2016 $000
Financial Assets
Cash and cash equivalents 70,618 85,247
Restricted cash and cash equivalents 3,569 12,983
Receivables(a) 178,379 294,710
Finance lease receivables 1,091 1,797
Amounts receivable for services 464,146 411,714
717,803 806,451
Financial Liabilities
Payables(b) 113,347 274,032
WATC borrowings 47,471 75,236
Heritage Maintenance Payments 54,345 53,080
215,163 402,348
Notes to the Financial StatementsFor the year ended 30 June 2017
CONTENTS OVERVIEWAGENCY
PERFORMANCEFINANCIAL
STATEMENTSKEY PERFORMANCE
INDICATORS DISCLOSURES APPENDIX
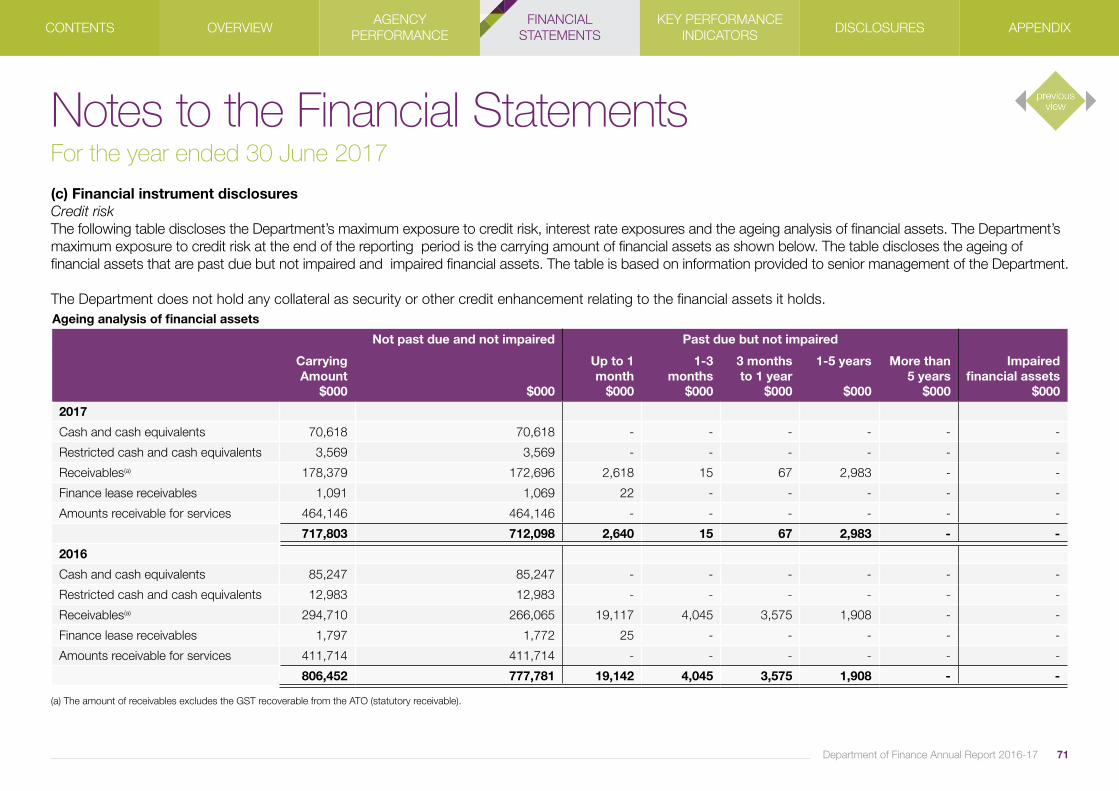
(c) Financial instrument disclosures Credit riskThe following table discloses the Department’s maximum exposure to credit risk, interest rate exposures and the ageing analysis of financial assets. The Department’s maximum exposure to credit risk at the end of the reporting period is the carrying amount of financial assets as shown below. The table discloses the ageing of financial assets that are past due but not impaired and impaired financial assets. The table is based on information provided to senior management of the Department.
The Department does not hold any collateral as security or other credit enhancement relating to the financial assets it holds.Ageing analysis of financial assets
Not past due and not impaired Past due but not impaired
Carrying Amount
$000
$000
Up to 1 month
$000
1-3 months
$000
3 months to 1 year
$000
1-5 years
$000
More than 5 years
$000
Impaired financial assets
$000
2017
Cash and cash equivalents 70,618 70,618 - - - - - -
Restricted cash and cash equivalents 3,569 3,569 - - - - - -
Receivables(a) 178,379 172,696 2,618 15 67 2,983 - -
Finance lease receivables 1,091 1,069 22 - - - - -
Amounts receivable for services 464,146 464,146 - - - - - -
717,803 712,098 2,640 15 67 2,983 - -
2016
Cash and cash equivalents 85,247 85,247 - - - - - -
Restricted cash and cash equivalents 12,983 12,983 - - - - - -
Receivables(a) 294,710 266,065 19,117 4,045 3,575 1,908 - -
Finance lease receivables 1,797 1,772 25 - - - - -
Amounts receivable for services 411,714 411,714 - - - - - -
806,452 777,781 19,142 4,045 3,575 1,908 - -
(a) The amount of receivables excludes the GST recoverable from the ATO (statutory receivable).
71Department of Finance Annual Report 2016-17
Notes to the Financial StatementsFor the year ended 30 June 2017
CONTENTS OVERVIEWAGENCY
PERFORMANCEFINANCIAL
STATEMENTSKEY PERFORMANCE
INDICATORS DISCLOSURES APPENDIX

72 Department of Finance Annual Report 2016-17
Liquidity risk and interest rate exposure The following table details the Department’s interest rate exposure and the contractual maturity analysis of financial assets and financial liabilities. The maturity analysis section includes interest and principal cash flows. The interest rate exposure section analyses only the carrying amounts of each item.
Interest rate exposure and maturity analysis of financial assets and financials liabilities
Weighted Average Effective Interest
Rate %
Interest rate exposure Maturity dates
Carrying Amount
$000
Fixed Interest
Rate
$000
Variable Interest
Rate
$000
Non-Interest Bearing
$000
Nominal Amount
$000
Up to 1 month
$000
1-3 months
$000
3 months
to 1 year
$000
1-5 years
$000
More than 5 years
$000
2017
Financial Assets
Cash and cash equivalents 1.98 70,618 - 21,678 48,940 70,618 70,618 - - - -
Restricted cash and cash equivalents - 3,569 - - 3,569 3,569 - - - 3,171 398
Receivables(a) - 178,379 - - 178,379 178,379 175,018 - 1,413 1,948 -
Finance lease receivables 4.52 1,091 1,091 - - 1,091 22 110 362 597 -
Amounts receivable for services - 464,146 - - 464,146 464,146 - - 2,250 4,699 457,197
717,803 1,091 21,678 695,034 717,803 245,658 110 4,025 10,415 457,595
Financial Liabilities
Payables(b) - 113,347 - - 113,347 113,347 113,293 17 37 - -
WATC borrowings 2.52 47,471 47,471 - - 47,471 1,922 1,916 14,578 29,055 -
Heritage Maintenance Payments 12.46 54,345 54,345 - - 54,345 464 929 4,231 24,686 24,035
215,163 101,816 - 113,347 215,163 115,679 2,862 18,846 53,741 24,035
(a) The amount of receivables excludes GST recoverable from the ATO (statutory receivable).(b) The amount of payables excludes GST payable to the ATO (statutory payable).
Notes to the Financial StatementsFor the year ended 30 June 2017
CONTENTS OVERVIEWAGENCY
PERFORMANCEFINANCIAL
STATEMENTSKEY PERFORMANCE
INDICATORS DISCLOSURES APPENDIX

73Department of Finance Annual Report 2016-17
(a) The amount of receivables excludes GST recoverable from the ATO (statutory receivable). (b) The amount of payables excludes GST payable to the ATO (statutory payable).
Interest rate exposure and maturity analysis of financial assets and financials liabilities
Weighted Average Effective Interest
Rate %
Interest rate exposure Maturity dates
Carrying Amount
$000
Fixed Interest
Rate
$000
Variable Interest
Rate
$000
Non-Interest Bearing
$000
Nominal Amount
$000
Up to 1 month
$000
1-3 months
$000
3 months
to 1 year
$000
1-5 years
$000
More than 5 years
$000
2016
Financial Assets
Cash and cash equivalents 2.26 85,247 - 7,393 77,854 85,247 85,247 - - - -
Restricted cash and cash equivalents - 12,983 - - 12,983 12,983 - - - 12,983 -
Receivables(a) - 294,710 - - 294,710 294,710 294,710 - - - -
Finance lease receivables 4.93 1,797 1,797 - - 1,797 24 124 435 1,214 -
Amounts receivable for services - 411,714 - - 411,714 411,714 200 200 1,131 - 410,183
806,451 1,797 7,393 797,261 806,451 380,181 324 1,566 14,197 410,183
Financial Liabilities
Payables(b) - 274,032 - - 274,032 274,032 273,713 316 - 3 -
WATC borrowings 2.79 75,236 75,236 - - 75,236 1,694 3,838 19,349 50,356 -
Heritage Maintenance Payments 12.46 53,080 53,080 - - 53,080 448 895 4,077 23,794 23,866
402,348 128,316 - 274,032 402,348 275,855 5,049 23,426 74,153 23,866
Notes to the Financial StatementsFor the year ended 30 June 2017
CONTENTS OVERVIEWAGENCY
PERFORMANCEFINANCIAL
STATEMENTSKEY PERFORMANCE
INDICATORS DISCLOSURES APPENDIX

74 Department of Finance Annual Report 2016-17
Interest rate sensitivity analysisThe following table represents a summary of the interest rate sensitivity of the Department’s financial assets and liabilities at the end of the reporting period on the surplus for the period and equity for a one per cent change in interest rates. It is assumed that the change in interest rates is held constant throughout the reporting period.
Carrying amount
$000
-100 basis points +100 basis points
2017
Surplus $000
Equity $000
Surplus $000
Equity $000
Financial Assets
Cash and cash equivalents 21,678 (217) (217) 217 217
Total increase/(decrease) 21,678 (217) (217) 217 217
Carrying amount
$000
-100 basis points +100 basis points
2016
Surplus $000
Equity $000
Surplus $000
Equity $000
Financial Assets
Cash and cash equivalents 7,393 (74) (74) (74) (74)
Total increase/(decrease) 7,393 (74) (74) (74) (74)
Fair valuesAll financial assets and liabilities recognised in the Statement of Financial Position, whether they are carried at cost or fair value, are recognised at amounts that represent a reasonable approximation of fair value unless otherwise stated in the applicable notes.
Note 41. Remuneration of auditorRemuneration paid or payable to the Auditor General in respect of the audit for the current financial year is as follows:
2017 $000
2016 $000
Auditing the accounts, controls, financial statements and key performance indicators
376 370
376 370
Notes to the Financial StatementsFor the year ended 30 June 2017
CONTENTS OVERVIEWAGENCY
PERFORMANCEFINANCIAL
STATEMENTSKEY PERFORMANCE
INDICATORS DISCLOSURES APPENDIX
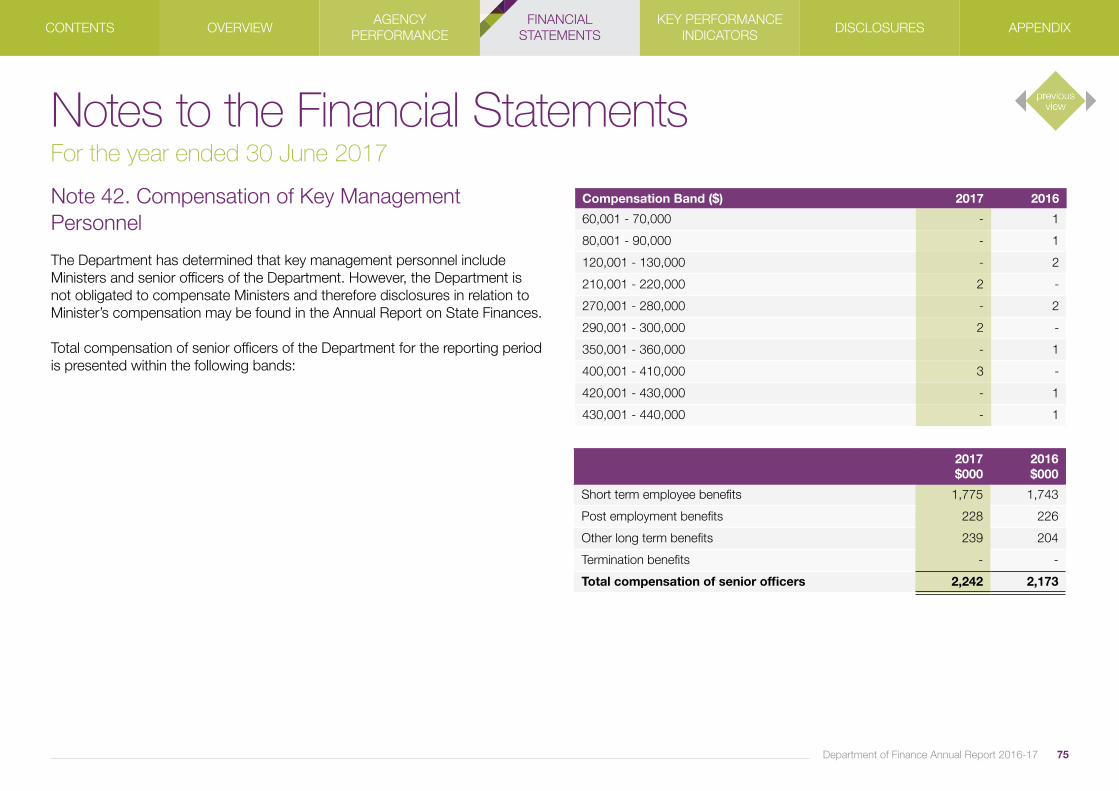
Note 42. Compensation of Key Management Personnel
The Department has determined that key management personnel include Ministers and senior officers of the Department. However, the Department is not obligated to compensate Ministers and therefore disclosures in relation to Minister’s compensation may be found in the Annual Report on State Finances.
Total compensation of senior officers of the Department for the reporting period is presented within the following bands:
Compensation Band ($) 2017 2016
60,001 - 70,000 - 1
80,001 - 90,000 - 1
120,001 - 130,000 - 2
210,001 - 220,000 2 -
270,001 - 280,000 - 2
290,001 - 300,000 2 -
350,001 - 360,000 - 1
400,001 - 410,000 3 -
420,001 - 430,000 - 1
430,001 - 440,000 - 1
2017 $000
2016 $000
Short term employee benefits 1,775 1,743
Post employment benefits 228 226
Other long term benefits 239 204
Termination benefits - -
Total compensation of senior officers 2,242 2,173
75Department of Finance Annual Report 2016-17
Notes to the Financial StatementsFor the year ended 30 June 2017
CONTENTS OVERVIEWAGENCY
PERFORMANCEFINANCIAL
STATEMENTSKEY PERFORMANCE
INDICATORS DISCLOSURES APPENDIX

76 Department of Finance Annual Report 2016-17
Note 43. Related Party Transactions
The Department is a wholly-owned public sector entity that is controlled by the State of Western Australia. Related parties of the Department include:• all Ministers and their close family members, and their controlled or jointly controlled entities;• all senior officers and their close family members, and their controlled or jointly controlled entities;• other departments and statutory authorities, including their related bodies, that are included in the whole-of-government consolidated financial statements;• associates and joint ventures of an entity that are included in the whole-of-government consolidated financial statements; and• the Government Employees Superannuation Board (GESB). Significant transactions with Government related entitiesSignificant transactions include:• Managed building works revenue for the planning, delivery, management and maintenance of government buildings (Note 14)• Vehicle fleet lease rental revenue from vehicle leasing arrangements (Note 14)• Rental income for government office accommodation (Note 14)
• Provide vehicle finance leases (Note 21)• Remuneration for services provided by the Auditor General (Note 41)• Provide accommodation leasing services and fitouts free of charge (Note 35)• Loan facility from the Western Australian Treasury Corporation (Note 29)• Services received free of charge from the Department of the Attorney General, Landgate, Department of Treasury, Department of the Premier and Cabinet and the Department of Water (Note 17)• Service appropriations (Note 17) • Insurance payments to the Insurance Commission of Western Australia (Note 8)• Capital appropriations (Note 33)
Material transactions with other related parties:During the year, the Department paid $9,659,669 in employee superannuation contributions to the Government Employees Superannuation Board.
The Department of Finance had no material related party transaction with Ministers/senior officers or their close family members or their controlled (or jointly controlled) entities for disclosure.
Notes to the Financial StatementsFor the year ended 30 June 2017
CONTENTS OVERVIEWAGENCY
PERFORMANCEFINANCIAL
STATEMENTSKEY PERFORMANCE
INDICATORS DISCLOSURES APPENDIX
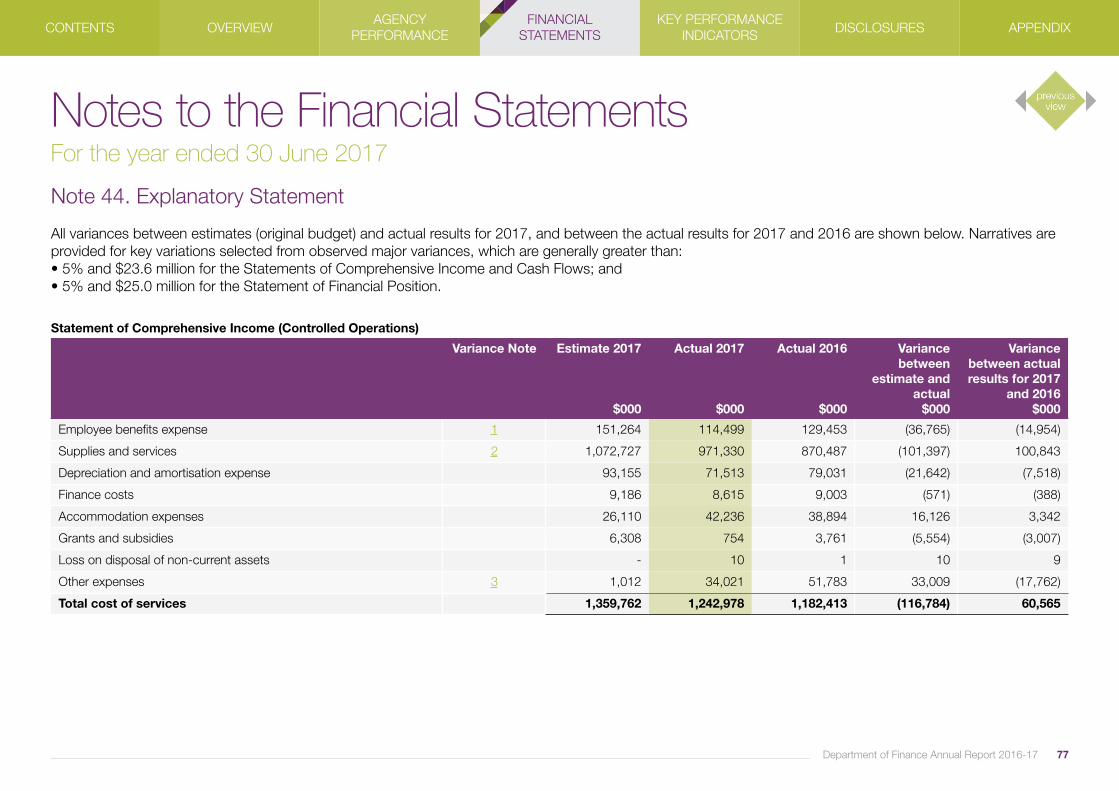
Note 44. Explanatory Statement
All variances between estimates (original budget) and actual results for 2017, and between the actual results for 2017 and 2016 are shown below. Narratives are provided for key variations selected from observed major variances, which are generally greater than:• 5% and $23.6 million for the Statements of Comprehensive Income and Cash Flows; and • 5% and $25.0 million for the Statement of Financial Position.
Statement of Comprehensive Income (Controlled Operations)
Variance Note Estimate 2017
$000
Actual 2017
$000
Actual 2016
$000
Variance between
estimate and actual
$000
Variance between actual results for 2017
and 2016 $000
Employee benefits expense 1 151,264 114,499 129,453 (36,765) (14,954)
Supplies and services 2 1,072,727 971,330 870,487 (101,397) 100,843
Depreciation and amortisation expense 93,155 71,513 79,031 (21,642) (7,518)
Finance costs 9,186 8,615 9,003 (571) (388)
Accommodation expenses 26,110 42,236 38,894 16,126 3,342
Grants and subsidies 6,308 754 3,761 (5,554) (3,007)
Loss on disposal of non-current assets - 10 1 10 9
Other expenses 3 1,012 34,021 51,783 33,009 (17,762)
Total cost of services 1,359,762 1,242,978 1,182,413 (116,784) 60,565
77Department of Finance Annual Report 2016-17
Notes to the Financial StatementsFor the year ended 30 June 2017
CONTENTS OVERVIEWAGENCY
PERFORMANCEFINANCIAL
STATEMENTSKEY PERFORMANCE
INDICATORS DISCLOSURES APPENDIX
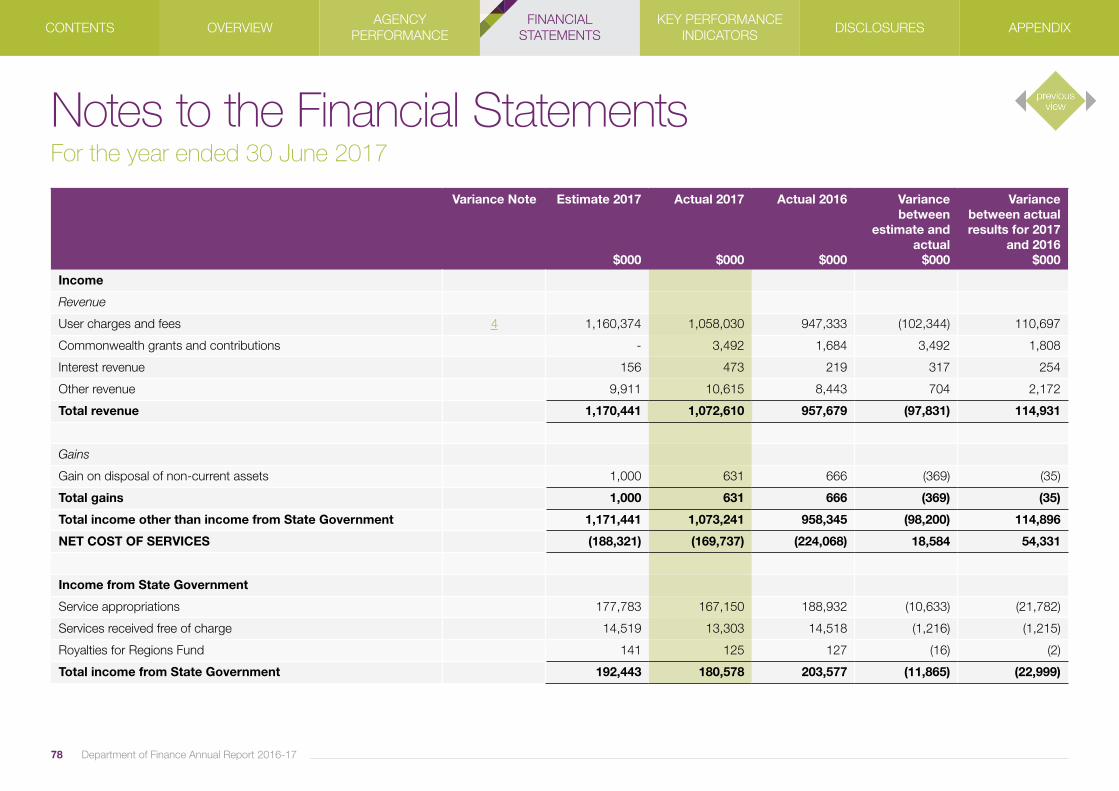
78 Department of Finance Annual Report 2016-17
Variance Note Estimate 2017
$000
Actual 2017
$000
Actual 2016
$000
Variance between
estimate and actual
$000
Variance between actual results for 2017
and 2016 $000
Income
Revenue
User charges and fees 4 1,160,374 1,058,030 947,333 (102,344) 110,697
Commonwealth grants and contributions - 3,492 1,684 3,492 1,808
Interest revenue 156 473 219 317 254
Other revenue 9,911 10,615 8,443 704 2,172
Total revenue 1,170,441 1,072,610 957,679 (97,831) 114,931
Gains
Gain on disposal of non-current assets 1,000 631 666 (369) (35)
Total gains 1,000 631 666 (369) (35)
Total income other than income from State Government 1,171,441 1,073,241 958,345 (98,200) 114,896
NET COST OF SERVICES (188,321) (169,737) (224,068) 18,584 54,331
Income from State Government
Service appropriations 177,783 167,150 188,932 (10,633) (21,782)
Services received free of charge 14,519 13,303 14,518 (1,216) (1,215)
Royalties for Regions Fund 141 125 127 (16) (2)
Total income from State Government 192,443 180,578 203,577 (11,865) (22,999)
Notes to the Financial StatementsFor the year ended 30 June 2017
CONTENTS OVERVIEWAGENCY
PERFORMANCEFINANCIAL
STATEMENTSKEY PERFORMANCE
INDICATORS DISCLOSURES APPENDIX
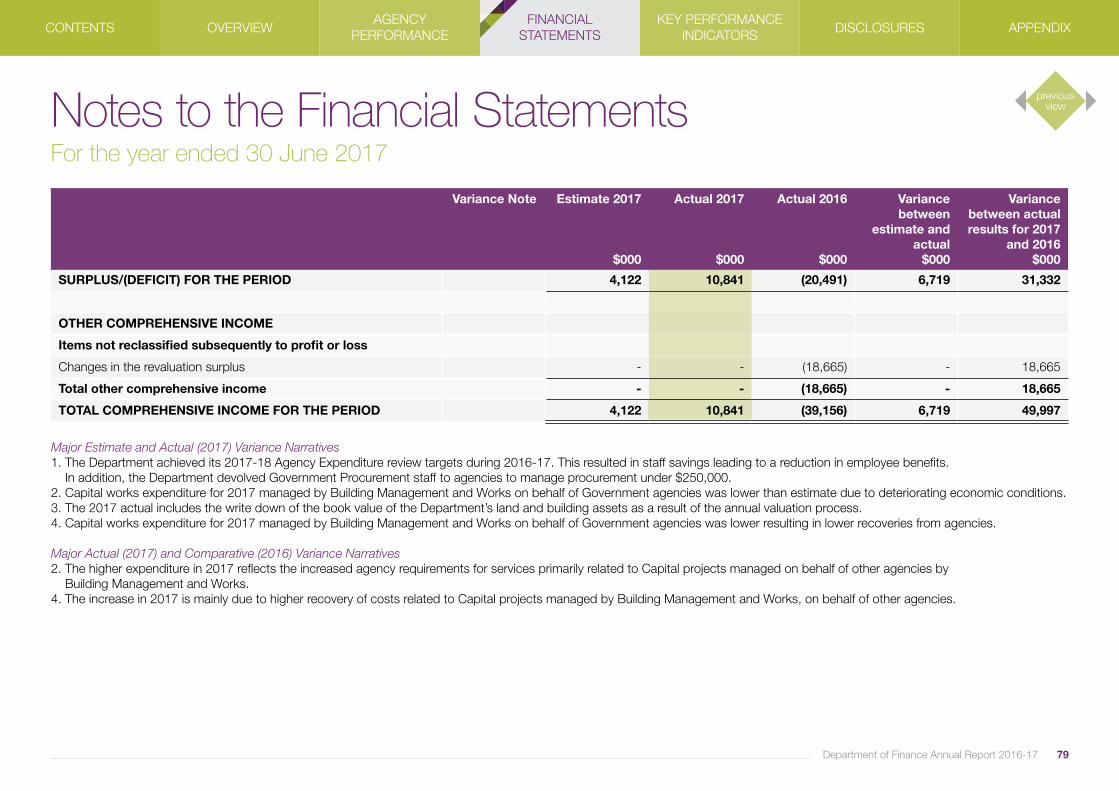
Variance Note Estimate 2017
$000
Actual 2017
$000
Actual 2016
$000
Variance between
estimate and actual
$000
Variance between actual results for 2017
and 2016 $000
SURPLUS/(DEFICIT) FOR THE PERIOD 4,122 10,841 (20,491) 6,719 31,332
OTHER COMPREHENSIVE INCOME
Items not reclassified subsequently to profit or loss
Changes in the revaluation surplus - - (18,665) - 18,665
Total other comprehensive income - - (18,665) - 18,665
TOTAL COMPREHENSIVE INCOME FOR THE PERIOD 4,122 10,841 (39,156) 6,719 49,997
Major Estimate and Actual (2017) Variance Narratives 1. The Department achieved its 2017-18 Agency Expenditure review targets during 2016-17. This resulted in staff savings leading to a reduction in employee benefits. In addition, the Department devolved Government Procurement staff to agencies to manage procurement under $250,000.2. Capital works expenditure for 2017 managed by Building Management and Works on behalf of Government agencies was lower than estimate due to deteriorating economic conditions. 3. The 2017 actual includes the write down of the book value of the Department’s land and building assets as a result of the annual valuation process.4. Capital works expenditure for 2017 managed by Building Management and Works on behalf of Government agencies was lower resulting in lower recoveries from agencies.
Major Actual (2017) and Comparative (2016) Variance Narratives2. The higher expenditure in 2017 reflects the increased agency requirements for services primarily related to Capital projects managed on behalf of other agencies by Building Management and Works.4. The increase in 2017 is mainly due to higher recovery of costs related to Capital projects managed by Building Management and Works, on behalf of other agencies.
79Department of Finance Annual Report 2016-17
Notes to the Financial StatementsFor the year ended 30 June 2017
CONTENTS OVERVIEWAGENCY
PERFORMANCEFINANCIAL
STATEMENTSKEY PERFORMANCE
INDICATORS DISCLOSURES APPENDIX
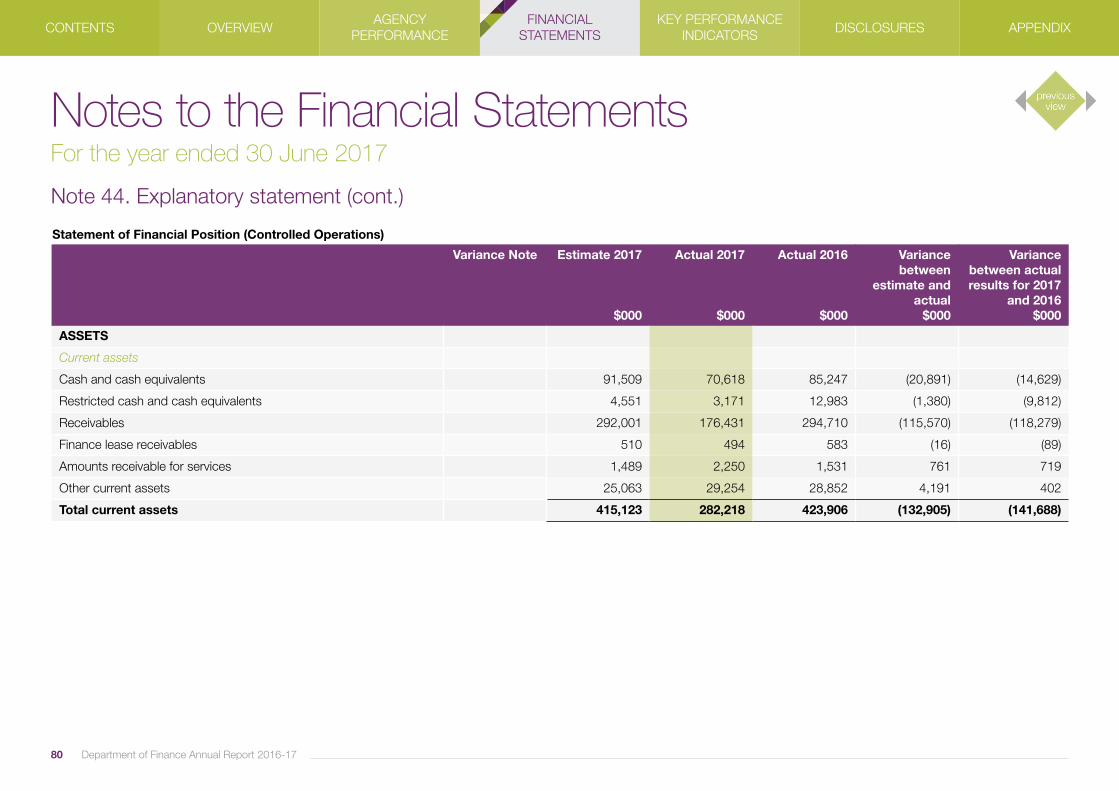
80 Department of Finance Annual Report 2016-17
Note 44. Explanatory statement (cont.)
Statement of Financial Position (Controlled Operations)
Variance Note Estimate 2017
$000
Actual 2017
$000
Actual 2016
$000
Variance between
estimate and actual
$000
Variance between actual results for 2017
and 2016 $000
ASSETS
Current assets
Cash and cash equivalents 91,509 70,618 85,247 (20,891) (14,629)
Restricted cash and cash equivalents 4,551 3,171 12,983 (1,380) (9,812)
Receivables 292,001 176,431 294,710 (115,570) (118,279)
Finance lease receivables 510 494 583 (16) (89)
Amounts receivable for services 1,489 2,250 1,531 761 719
Other current assets 25,063 29,254 28,852 4,191 402
Total current assets 415,123 282,218 423,906 (132,905) (141,688)
Notes to the Financial StatementsFor the year ended 30 June 2017
CONTENTS OVERVIEWAGENCY
PERFORMANCEFINANCIAL
STATEMENTSKEY PERFORMANCE
INDICATORS DISCLOSURES APPENDIX

Variance Note Estimate 2017
$000
Actual 2017
$000
Actual 2016
$000
Variance between
estimate and actual
$000
Variance between actual results for 2017
and 2016 $000
Non-current assets
Restricted cash and cash equivalents 285 398 - 113 398
Receivables - 1,948 - 1,948 1,948
Finance lease receivables 2,882 597 1,214 (2,285) (617)
Amounts receivable for services 1 463,190 461,896 410,183 (1,294) 51,713
Property, plant, equipment and vehicles 2 813,649 720,374 768,737 (93,275) (48,363)
Intangible assets 18,496 31,805 29,516 13,309 2,289
Other non-current assets 1,170 6,440 2,129 5,270 4,311
Total non-current assets 1,299,672 1,223,458 1,211,779 (76,214) 11,679
TOTAL ASSETS 1,714,795 1,505,676 1,635,685 (209,119) (130,009)
LIABILITIES
Current liabilities
Payables 271,914 115,613 275,418 (156,301) (159,805)
Borrowings 22,324 24,040 30,302 1,716 (6,262)
Lease incentives 6,020 27,916 27,889 21,896 27
Provisions 28,010 13,604 9,612 (14,406) 3,992
Other current liabilities 24,055 24,055 26,996 - (2,941)
352,323 205,228 370,217 (147,095) (164,989)
81Department of Finance Annual Report 2016-17
Notes to the Financial StatementsFor the year ended 30 June 2017
CONTENTS OVERVIEWAGENCY
PERFORMANCEFINANCIAL
STATEMENTSKEY PERFORMANCE
INDICATORS DISCLOSURES APPENDIX

Variance Note Estimate 2017
$000
Actual 2017
$000
Actual 2016
$000
Variance between
estimate and actual
$000
Variance between actual results for 2017
and 2016 $000
Non-current liabilities
Borrowings 89,300 77,776 98,014 (11,524) (20,238)
Provisions 7,265 6,360 6,869 (905) (509)
Lease incentives 3 41,524 101,251 85,349 59,727 15,902
Total non-current liabilities 138,089 185,387 190,232 47,298 (4,845)
Total liabilities 490,412 390,615 560,449 (99,797) (169,834)
NET ASSETS 1,224,383 1,115,061 1,075,236 (109,322) 39,825
EQUITY
Contributed equity 1,128,219 1,055,928 1,026,944 (72,291) 28,984
Reserves 18,665 - - (18,665) -
Accumulated surplus 77,499 59,133 48,292 (18,366) 10,841
TOTAL EQUITY 1,224,383 1,115,061 1,075,236 (109,322) 39,825
Major Estimate and Actual (2017) Variance Narratives 2. The variance to the estimate is due to a decrease in the value of land and buildings as a result of the annual revaluation, and the sale of vehicles to the Water Corporation as part of their exit from State Fleet during 2016-17. 3. The growth in lease incentives negotiated for Government office accommodation has increased due to market conditions. The increase for 2017 includes a significant incentive for the St George’s Cathedral Heritage Precinct. Major Actual (2017) and Comparative (2016) Variance Narratives1. Growth in amounts receivable for services relates to increasing depreciating provisions for additional state owned assets related to the capital works program undertaken by the Department. 2. The variance compared to 2016 reflects a decrease in the value of land and buildings as a result of the annual revaluation, and the sale of vehicles to the Water Corporation as part of their exit from State Fleet during 2016-17.
82 Department of Finance Annual Report 2016-17
Notes to the Financial StatementsFor the year ended 30 June 2017
CONTENTS OVERVIEWAGENCY
PERFORMANCEFINANCIAL
STATEMENTSKEY PERFORMANCE
INDICATORS DISCLOSURES APPENDIX

Note 44. Explanatory statement (cont.)
Statement of Cash Flows (Controlled Operations)
Variance Note Estimate 2017
$000
Actual 2017
$000
Actual 2016
$000
Variance between
estimate and actual
$000
Variance between actual results for 2017
and 2016 $000
CASH FLOWS FROM STATE GOVERNMENT
Service appropriations 1 123,037 113,948 151,719 (9,089) (37,771)
Capital appropriations 2 29,109 28,763 84,268 (346) (55,505)
Holding account drawdowns 1,531 770 1,469 (761) (699)
Royalties for Regions Fund 141 125 127 (16) (2)
Regional Infrastructure and Headworks Fund 250 245 5,250 (5) (5,005)
Non-retained revenue distributed to owner - (24) (96) (24) 72
Net cash provided by State Government 154,068 143,827 242,738 (10,241) (98,910)
83Department of Finance Annual Report 2016-17
Notes to the Financial StatementsFor the year ended 30 June 2017
CONTENTS OVERVIEWAGENCY
PERFORMANCEFINANCIAL
STATEMENTSKEY PERFORMANCE
INDICATORS DISCLOSURES APPENDIX

Variance Note Estimate 2017
$000
Actual 2017
$000
Actual 2016
$000
Variance between
estimate and actual
$000
Variance between actual results for 2017
and 2016 $000
CASH FLOWS FROM OPERATING ACTIVITIES
Payments
Employee benefits 3 (151,187) (113,736) (135,221) 37,451 21,485
Supplies and services 4 (1,038,667) (944,694) (859,722) 93,973 (84,972)
Finance costs (9,186) (7,359) (7,743) 1,827 384
Accommodation (26,110) (40,804) (21,959) (14,694) (18,845)
Grants and subsidies (6,308) (754) (3,763) 5,554 3,009
GST payments on purchases (129,962) (112,146) (107,281) 17,816 (4,864)
GST payments to taxation authority (3,106) (6,136) (3,972) (3,030) (2,164)
Other payments - (4,945) (3,730) (4,945) (1,215)
Receipts
User charges and fees 5 1,160,462 1,011,354 938,279 (149,108) 73,076
Commonwealth grants and contributions - 3,337 1,665 3,337 1,673
Interest received 154 382 214 228 167
GST receipts on sales 121,943 109,127 103,120 (12,816) 6,007
GST receipts from taxation authority 12,305 7,491 8,688 (4,814) (1,197)
Other receipts 17,679 6,859 8,676 (10,820) (1,818)
Net cash used in operating activities (51,983) (92,024) (82,750) (40,041) (9,274)
84 Department of Finance Annual Report 2016-17
Notes to the Financial StatementsFor the year ended 30 June 2017
CONTENTS OVERVIEWAGENCY
PERFORMANCEFINANCIAL
STATEMENTSKEY PERFORMANCE
INDICATORS DISCLOSURES APPENDIX

Variance Note Estimate 2017
$000
Actual 2017
$000
Actual 2016
$000
Variance between
estimate and actual
$000
Variance between actual results for 2017
and 2016 $000
CASH FLOWS FROM INVESTING ACTIVITIES
Payments
Purchase of non-current physical assets 6 (118,718) (148,153) (199,917) (29,435) 51,764
Receipts
Proceeds from sale of non-current physical assets 7 45,000 71,559 40,212 26,559 31,347
Receipts from lease incentives 4,444 27,762 39,638 23,318 (11,876)
Net cash used in investing activities (69,274) (48,832) (120,067) 20,442 71,235
CASH FLOWS FROM FINANCING ACTIVITIES
Payments
Repayment of borrowings (23,511) (30,689) (20,487) (7,178) (10,202)
Receipts
Proceeds from borrowings 7,530 2,923 4,408 (4,607) (1,485)
Finance leases receipts 3,789 753 598 (3,036) 155
Net cash used in financing activities (12,192) (27,014) (15,481) (14,822) (11,532)
Net increase/(decrease) in cash and cash equivalents 20,619 (24,043) 24,439 (44,662) (48,481)
Cash and cash equivalents at the beginning of period 75,726 98,230 73,792 22,504 24,438
CASH AND CASH EQUIVALENTS AT THE END OF PERIOD 96,345 74,187 98,230 (22,158) (24,043)
85Department of Finance Annual Report 2016-17
Notes to the Financial StatementsFor the year ended 30 June 2017
CONTENTS OVERVIEWAGENCY
PERFORMANCEFINANCIAL
STATEMENTSKEY PERFORMANCE
INDICATORS DISCLOSURES APPENDIX
Major Estimate and Actual (2017) Variance Narratives 3. The Department achieved its 2017-18 Agency Expenditure review targets during 2016-17. This resulted in staff savings leading to a reduction in employee benefits. In addition, the Department devolved Government Procurement staff to agencies to manage procurement under $250,000. 4. Capital works expenditure for 2017 managed by Building Management and Works on behalf of Government agencies was lower than estimate due to deteriorating economic conditions. 5. Capital works for 2017 managed by Building Management and Works on behalf of Government agencies was lower resulting in lower recoveries of costs from agencies. 6. The estimate reflects a reduction in capital projects mainly due to the completion of the David Malcolm Justice Centre which moved from the build phase in 2015-16 to occupancy in 2016-17. 7. The increase in 2017 reflects the sale of vehicles to the Water Corporation as a result of its exit from the State Fleet leasing arrangements.
Major Actual (2017) and Comparative (2016) Variance Narratives1. Appropriations from Government have reduced primarily due to funding variations for the Electricity Market Review, devolution of Government Procurement staff and building maintenance funding to agencies. 2. The reduction in capital appropriations reflects the movement in capital projects with the majority of the impact being the David Malcolm Justice Centre which moved from the build phase in 2015-16 to occupancy in 2016-17. 4. The higher expenditure in 2017 reflects the increased agency requirements for services primarily related to Capital projects managed on behalf of other agencies by Building Management and Works. 5. The increase in 2017 is mainly due to higher recovery of costs related to Capital projects managed by Building Management and Works, on behalf of other agencies. 6. The variance reflects a reduction in payments on capital projects primarily due to the completion of the construction phase of the David Malcolm Justice Centre in 2016. 7. The increase in 2017 reflects the sale of vehicles to the Water Corporation as a result of its exit from the State Fleet leasing arrangements.
86 Department of Finance Annual Report 2016-17
Notes to the Financial StatementsFor the year ended 30 June 2017
CONTENTS OVERVIEWAGENCY
PERFORMANCEFINANCIAL
STATEMENTSKEY PERFORMANCE
INDICATORS DISCLOSURES APPENDIX

Note 45. Special purpose accounts - controlled
Refer also to Note 19 ‘Restricted cash’ and Note 20 ‘Receivables’.
2017 $000
2016 $000
Sunset Reserve Account The purpose of the account is to record receipts in respect of leasings, proceeds from the disposal of the excised land, amounts appropriated by Parliament, and payments incurred in the conservation and management of Sunset Reserve.
Balance at the start of period 7,270 8,551
Receipts 274 532
Payments (5,468) (1,813)
Balance at the end of period 2,076 7,270
87Department of Finance Annual Report 2016-17
Notes to the Financial StatementsFor the year ended 30 June 2017
CONTENTS OVERVIEWAGENCY
PERFORMANCEFINANCIAL
STATEMENTSKEY PERFORMANCE
INDICATORS DISCLOSURES APPENDIX
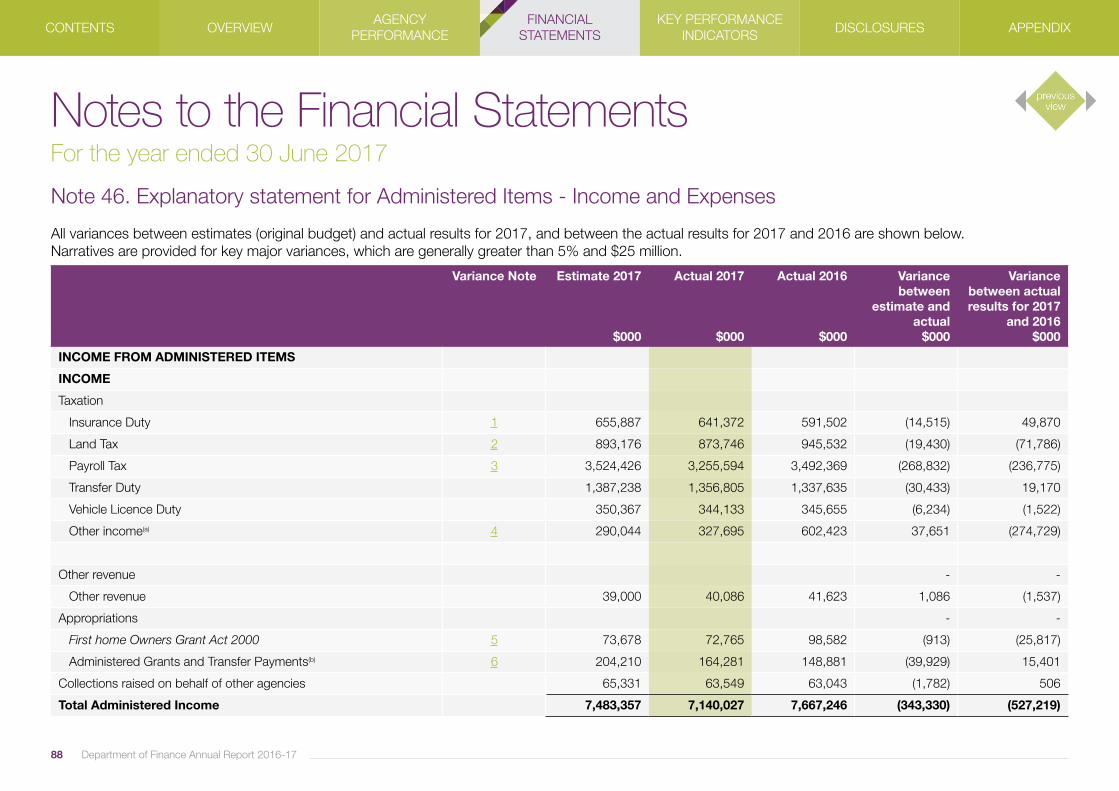
Note 46. Explanatory statement for Administered Items - Income and Expenses
All variances between estimates (original budget) and actual results for 2017, and between the actual results for 2017 and 2016 are shown below. Narratives are provided for key major variances, which are generally greater than 5% and $25 million.
Variance Note Estimate 2017
$000
Actual 2017
$000
Actual 2016
$000
Variance between
estimate and actual
$000
Variance between actual results for 2017
and 2016 $000
INCOME FROM ADMINISTERED ITEMS
INCOME
Taxation
Insurance Duty 1 655,887 641,372 591,502 (14,515) 49,870
Land Tax 2 893,176 873,746 945,532 (19,430) (71,786)
Payroll Tax 3 3,524,426 3,255,594 3,492,369 (268,832) (236,775)
Transfer Duty 1,387,238 1,356,805 1,337,635 (30,433) 19,170
Vehicle Licence Duty 350,367 344,133 345,655 (6,234) (1,522)
Other income(a) 4 290,044 327,695 602,423 37,651 (274,729)
Other revenue - -
Other revenue 39,000 40,086 41,623 1,086 (1,537)
Appropriations - -
First home Owners Grant Act 2000 5 73,678 72,765 98,582 (913) (25,817)
Administered Grants and Transfer Payments(b) 6 204,210 164,281 148,881 (39,929) 15,401
Collections raised on behalf of other agencies 65,331 63,549 63,043 (1,782) 506
Total Administered Income 7,483,357 7,140,027 7,667,246 (343,330) (527,219)
88 Department of Finance Annual Report 2016-17
Notes to the Financial StatementsFor the year ended 30 June 2017
CONTENTS OVERVIEWAGENCY
PERFORMANCEFINANCIAL
STATEMENTSKEY PERFORMANCE
INDICATORS DISCLOSURES APPENDIX
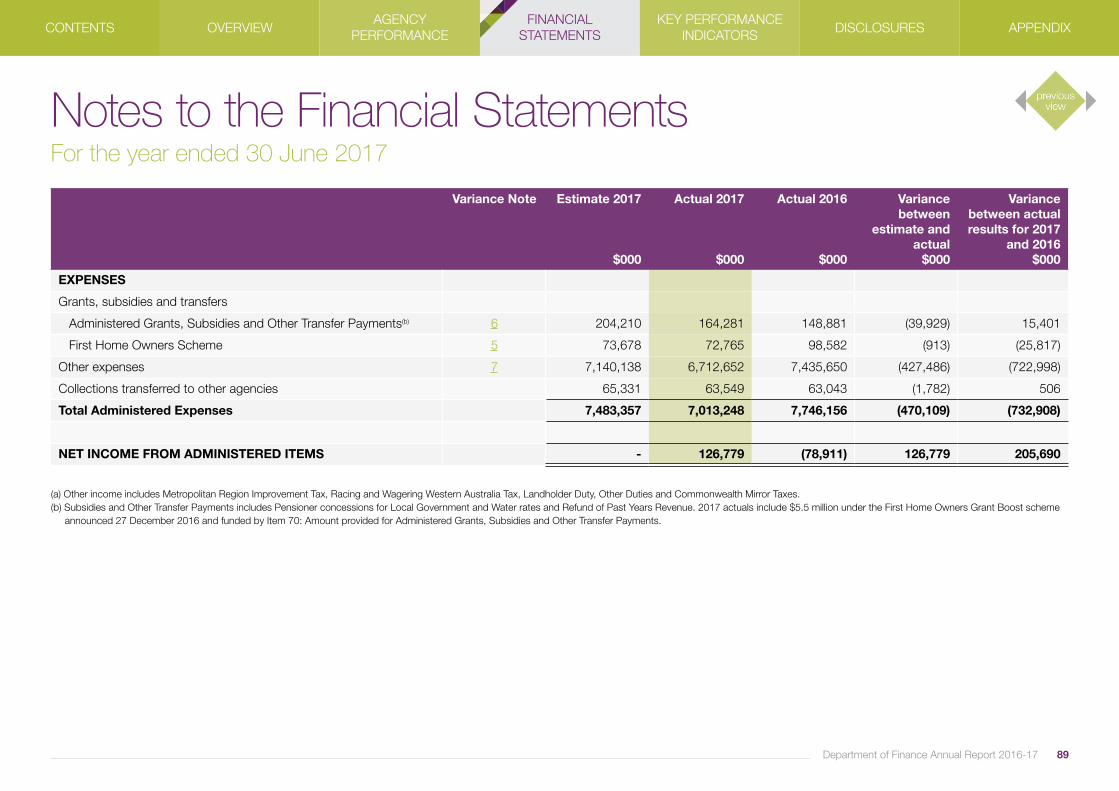
Variance Note Estimate 2017
$000
Actual 2017
$000
Actual 2016
$000
Variance between
estimate and actual
$000
Variance between actual results for 2017
and 2016 $000
EXPENSES
Grants, subsidies and transfers
Administered Grants, Subsidies and Other Transfer Payments(b) 6 204,210 164,281 148,881 (39,929) 15,401
First Home Owners Scheme 5 73,678 72,765 98,582 (913) (25,817)
Other expenses 7 7,140,138 6,712,652 7,435,650 (427,486) (722,998)
Collections transferred to other agencies 65,331 63,549 63,043 (1,782) 506
Total Administered Expenses 7,483,357 7,013,248 7,746,156 (470,109) (732,908)
NET INCOME FROM ADMINISTERED ITEMS - 126,779 (78,911) 126,779 205,690
(a) Other income includes Metropolitan Region Improvement Tax, Racing and Wagering Western Australia Tax, Landholder Duty, Other Duties and Commonwealth Mirror Taxes. (b) Subsidies and Other Transfer Payments includes Pensioner concessions for Local Government and Water rates and Refund of Past Years Revenue. 2017 actuals include $5.5 million under the First Home Owners Grant Boost scheme announced 27 December 2016 and funded by Item 70: Amount provided for Administered Grants, Subsidies and Other Transfer Payments.
89Department of Finance Annual Report 2016-17
Notes to the Financial StatementsFor the year ended 30 June 2017
CONTENTS OVERVIEWAGENCY
PERFORMANCEFINANCIAL
STATEMENTSKEY PERFORMANCE
INDICATORS DISCLOSURES APPENDIX

90 Department of Finance Annual Report 2016-17
Major Estimate and Actual (2017) Variance Narratives 3. Payroll tax collections were $268.8 million lower in 2017 following weaker than expected growth in employment and wages, particularly in the mining and construction sectors.4. Revenue from ‘other taxes’ was $37.7 million higher in 2017 primarily due to higher landholder duty collections from a number of large commercial transactions (large commercial transactions are often infrequent, large in magnitude and volatile within and between years).6. Administered grants, subsidies and other transfer payments were $39.9 million lower than estimated at the time of the 2016-17 Budget, mainly reflecting lower than expected refunds of past years’ revenue and local government rates rebates for pensioners and seniors. Lower refunds from past years’ revenue (down $36.9 million) was primarily in the area of transfer duty refunds.7. Other expenses largely relate to taxation revenue collected by the Department and then paid on to the Consolidated Account. Transfers to the Consolidated Account were $427.5 million lower than the 2017 estimate, mainly reflecting lower than estimated taxation revenue (attributable to soft economic conditions in Western Australia in 2017).
Major Actual (2017) and Comparative (2016) Variance Narratives1. Collections increased by $49.9 million mainly due to the introduction of the Compulsory Third Party insurance scheme to cover all people catastrophically injured in a motor vehicle crash and targeted compliance by the Office of State Revenue.2. Land tax collections decreased due to a decline in the value of taxable land, consistent with broader weakness in the housing market.3. Payroll tax collections were $236.8 million lower in line with lower employment, and total private sector wages. This was compounded by compositional movements in the labour market, with lower employment in the mining and construction sectors.4. Other tax income was lower than 2016 by $274.7 million, largely due to lower landholder duty collections (down $267.8 million), reflecting lower duty from large commercial transactions in 2017 following very strong collections in 2016.5. First Home Owner Grants were $25.8 million lower in 2017 following the abolition of the grant for established home purchases. In 2016, 4,511 grants were paid for established homes, while in 2017 there were only 56 such grants. New home grants were lower during the same period, which is consistent with available data on demographic factors and softer economic conditions in 2017.7. Other expenses largely relate to taxation revenue collected by the Department and then paid on to the Consolidated Account which were lower in 2017. This reflects the decline in taxation collections, mainly due to soft economic conditions, together with timing differences between the recognition of revenue and the receipt of the associated tax payments.
Notes to the Financial StatementsFor the year ended 30 June 2017
CONTENTS OVERVIEWAGENCY
PERFORMANCEFINANCIAL
STATEMENTSKEY PERFORMANCE
INDICATORS DISCLOSURES APPENDIX

91Department of Finance Annual Report 2016-17
Note 47. Supplementary financial information
(a) Write-offs During the financial year $19.5 million was written off by the Department under the authority of:
(b) Write-offs by category
(c) Act of grace payments
2017 $000
2016 $000
The accountable authority 7,135 8,460
The Minister 4,500 4,687
Executive Council 7,904 11,911
19,539 25,058
2017 $000
2016 $000
Public assets 1,504 1,465
Debts due to the State 18,035 23,593
19,539 25,058
2017 $000
2016 $000
Act of grace payments - 10
- 10
Note 48. Service delivery arrangementsIndian Ocean Territories
2017 $000
2016 $000
Revenue 3,337 1,665
Commonwealth receipts 3,337 1,665
Expenditure
Consultants and contractors 969 969
Administration and other costs 1,689 945
Payroll Tax and business franchise 30 34
Duties 1 1
Land Tax 2 3
Compliance 12 47
2,703 1,999
Surplus/(deficit) for the period 634 (334)
Balance brought forward 10 344
Prior year adjustment - -
Balance carried forward 644 10
Notes to the Financial StatementsFor the year ended 30 June 2017
CONTENTS OVERVIEWAGENCY
PERFORMANCEFINANCIAL
STATEMENTSKEY PERFORMANCE
INDICATORS DISCLOSURES APPENDIX
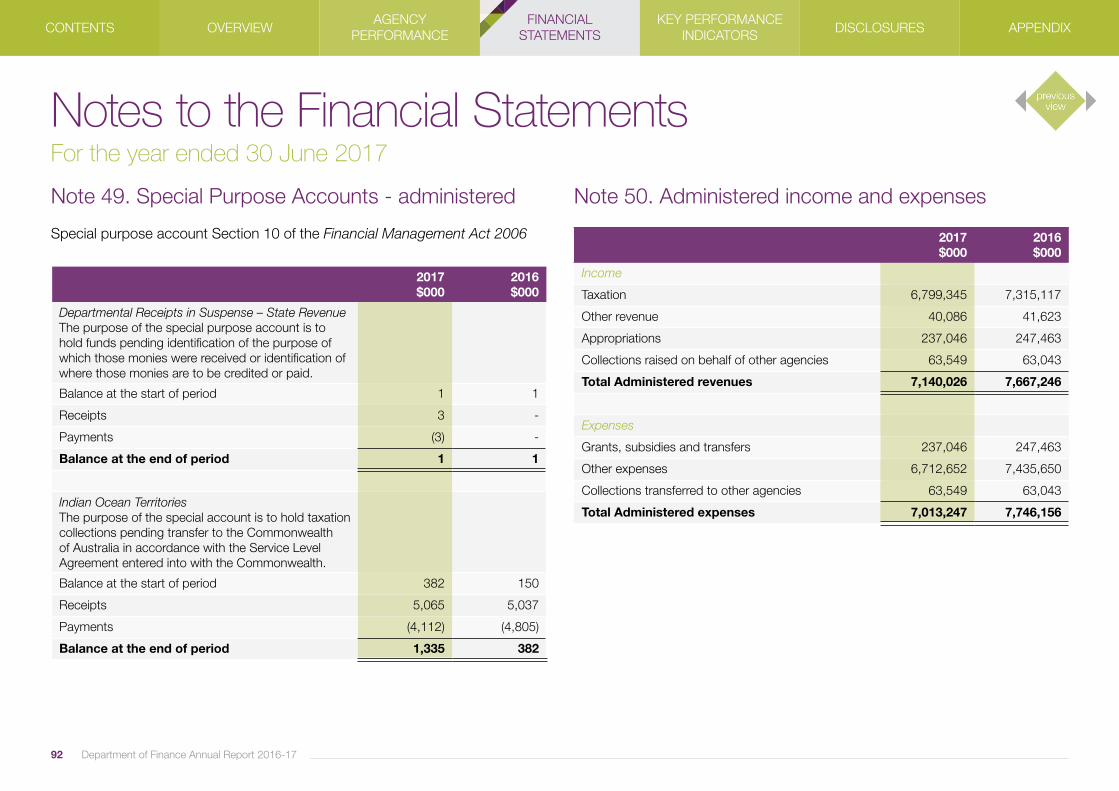
92 Department of Finance Annual Report 2016-17
Note 49. Special Purpose Accounts - administered
Special purpose account Section 10 of the Financial Management Act 2006
2017 $000
2016 $000
Departmental Receipts in Suspense – State Revenue The purpose of the special purpose account is to hold funds pending identification of the purpose of which those monies were received or identification of where those monies are to be credited or paid.
Balance at the start of period 1 1
Receipts 3 -
Payments (3) -
Balance at the end of period 1 1
Indian Ocean Territories The purpose of the special account is to hold taxation collections pending transfer to the Commonwealth of Australia in accordance with the Service Level Agreement entered into with the Commonwealth.
Balance at the start of period 382 150
Receipts 5,065 5,037
Payments (4,112) (4,805)
Balance at the end of period 1,335 382
Note 50. Administered income and expenses
2017 $000
2016 $000
Income
Taxation 6,799,345 7,315,117
Other revenue 40,086 41,623
Appropriations 237,046 247,463
Collections raised on behalf of other agencies 63,549 63,043
Total Administered revenues 7,140,026 7,667,246
Expenses
Grants, subsidies and transfers 237,046 247,463
Other expenses 6,712,652 7,435,650
Collections transferred to other agencies 63,549 63,043
Total Administered expenses 7,013,247 7,746,156
Notes to the Financial StatementsFor the year ended 30 June 2017
CONTENTS OVERVIEWAGENCY
PERFORMANCEFINANCIAL
STATEMENTSKEY PERFORMANCE
INDICATORS DISCLOSURES APPENDIX

93Department of Finance Annual Report 2016-17
Note 51. Disclosure of administered income and expenses by service
Revenue Assessment and Collection, and Grants and Subsidies Administration
2017 $000
2016 $000
COST OF SERVICES
Income
Taxation 6,799,345 7,315,117
Other revenue 40,086 41,623
Appropriations 237,046 247,463
Collections raised on behalf of other agencies 63,549 63,043
Total Administered Income 7,140,026 7,667,246
Expenses
Grants, subsidies and transfers 237,046 247,463
Other expenses 6,712,652 7,435,650
Collections transferred to other agencies 63,549 63,043
Total Administered Expenses 7,013,247 7,746,156
Note 52. Administered assets and liabilities
2017 $000
2016 $000
Current Assets
Taxation Receivable 667,048 540,566
Other Debtors 39,847 37,181
Other Current Assets 19,536 20,778
Total Administered Current Assets 726,431 598,525
Non-Current Assets
Other Receivables 51,300 51,300
Total Administered Non-Current Assets 51,300 51,300
Total Administered Assets 777,731 649,825
Current Liabilities
Other Payables 59,384 57,960
Total Administered Current Liabilities 59,384 57,960
Non-Current Liabilities
- -
Total Administered Non-Current Liabilities - -
Total Administered Liabilities 59,384 57,960
Notes to the Financial StatementsFor the year ended 30 June 2017
CONTENTS OVERVIEWAGENCY
PERFORMANCEFINANCIAL
STATEMENTSKEY PERFORMANCE
INDICATORS DISCLOSURES APPENDIX

94 Department of Finance Annual Report 2016-17
For the year ended 30 June 2017
I hereby certify that the key performance indicators are based on proper records, are relevant and appropriate for assisting users to assess the Department of Finance’s performance, and fairly represent the performance of the Department for the financial year ended 30 June 2017.
Anne Nolan Director General 23 August 2017
Certification of Key Performance Indicators
CONTENTS OVERVIEWAGENCY
PERFORMANCEFINANCIAL
STATEMENTS KEY PERFORMANCE
INDICATORS DISCLOSURES APPENDIX
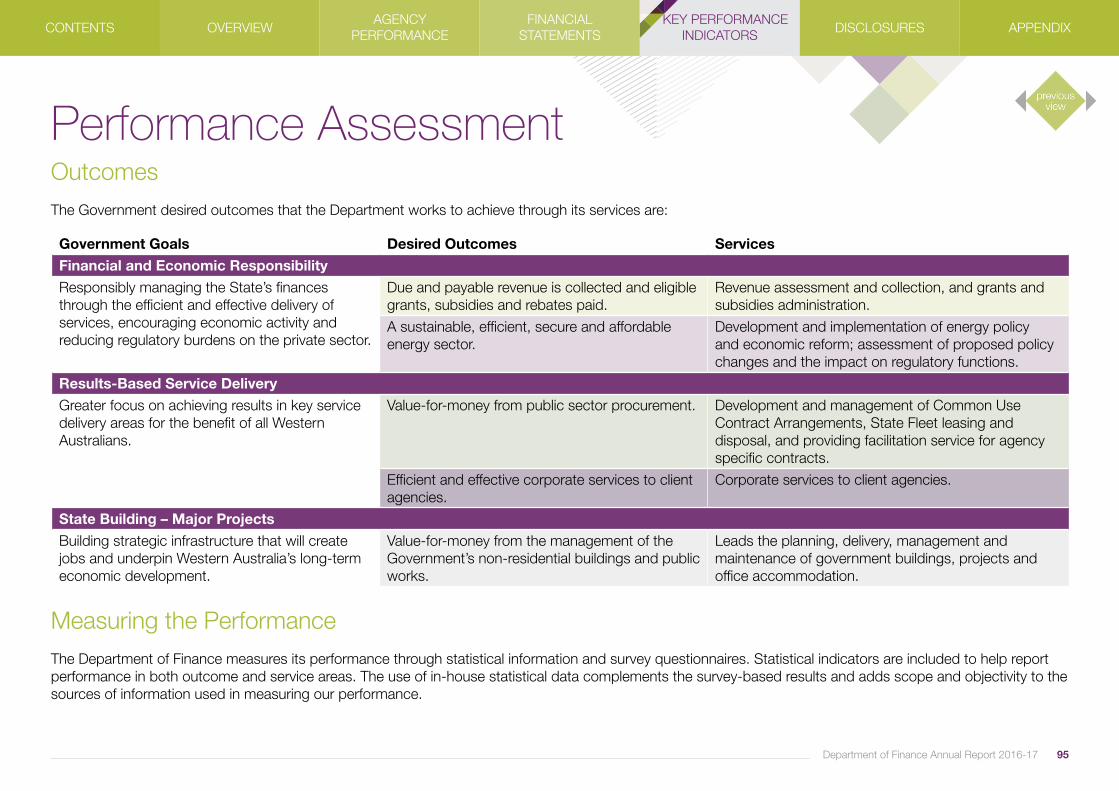
95Department of Finance Annual Report 2016-17
Measuring the PerformanceThe Department of Finance measures its performance through statistical information and survey questionnaires. Statistical indicators are included to help report performance in both outcome and service areas. The use of in-house statistical data complements the survey-based results and adds scope and objectivity to the sources of information used in measuring our performance.
Government Goals Desired Outcomes ServicesFinancial and Economic ResponsibilityResponsibly managing the State’s finances through the efficient and effective delivery of services, encouraging economic activity and reducing regulatory burdens on the private sector.
Due and payable revenue is collected and eligible grants, subsidies and rebates paid.
Revenue assessment and collection, and grants and subsidies administration.
A sustainable, efficient, secure and affordable energy sector.
Development and implementation of energy policy and economic reform; assessment of proposed policy changes and the impact on regulatory functions.
Results-Based Service DeliveryGreater focus on achieving results in key service delivery areas for the benefit of all Western Australians.
Value-for-money from public sector procurement. Development and management of Common Use Contract Arrangements, State Fleet leasing and disposal, and providing facilitation service for agency specific contracts.
Efficient and effective corporate services to client agencies.
Corporate services to client agencies.
State Building – Major ProjectsBuilding strategic infrastructure that will create jobs and underpin Western Australia’s long-term economic development.
Value-for-money from the management of the Government’s non-residential buildings and public works.
Leads the planning, delivery, management and maintenance of government buildings, projects and office accommodation.
Performance AssessmentOutcomesThe Government desired outcomes that the Department works to achieve through its services are:
CONTENTS OVERVIEWAGENCY
PERFORMANCEFINANCIAL
STATEMENTS KEY PERFORMANCE
INDICATORS DISCLOSURES APPENDIX

96 Department of Finance Annual Report 2016-17
Extent to which due revenue is collected (%) (a)
(a) This key performance indicator (KPI) is calculated as an average for land tax, payroll tax and duties assessments. The amounts are calculated by subtracting the number of penalties from the total number of assessments (or returns for return-based taxes) and dividing the result by the total number of assessments. The methodology for this calculation has been updated, to ensure the most accurate representation of performance. Revised actuals for 2013-14, 2014-15 and 2015-16 and target for 2016-17 are shown above.
Extent to which correct grants, subsidies and rebates are paid (%)
(b)
(b) The measurement of the extent to which grants, subsidies and rebates are paid correctly is calculated by totalling the number of claims paid, and subtracting the total number of claims paid incorrectly. This is expressed as a percentage of the total number of claims paid. The payments are for First Home Owner Grant, Pensioners and Seniors Rebates, the Life Support Equipment Electricity Subsidy, the Thermoregulatory Dysfunction Energy Subsidy and the Energy Concession Extension Scheme.
Key Effectiveness IndicatorsState RevenueOutcome 1: Due and payable revenue is collected and eligible grants, subsidies and rebates paid
The Department, through State Revenue, administers a range of revenue laws on behalf of the Government. This involves the collection of revenue raised and payment of grants and subsidies under relevant legislation, as well as a number of administrative-based schemes.
The key effectiveness indicator for revenue collection provides a measure of the accuracy of the revenue assessment process, the level of compliance by taxpayers and the timeliness of processing assessments. These are considered the key elements in the effective collection of revenue.
The key effectiveness indicator for grant, subsidy and rebate payments provides an indicator of the accuracy of these government payments to eligible applicants.
ACTUAL ACTUAL ACTUAL TARGET ACTUAL ACTUAL ACTUAL ACTUAL TARGET
2013/14 2014/15 2015/16 2016/17 2016/17 2013/14 2014/15 2015/16 2016/17
89 88 8787 88
100 99.9 100 100 99.9
ACTUAL
2016/17
CONTENTS OVERVIEWAGENCY
PERFORMANCEFINANCIAL
STATEMENTS KEY PERFORMANCE
INDICATORS DISCLOSURES APPENDIX

Department of Finance Annual Report 2016-17 97
Cost per $100 of revenue raised ($) (a)
(a) Calculated as the total of State Revenue costs divided by total revenue raised and multiplied by 100. A cost allocation model is used to apportion the costs of taxation administration based on full-time equivalent numbers and resource usage.
Average cost per application/ claim processed ($)
(b)
(b) Calculated as the total of State Revenue costs divided by the number of first home owner grant applications, pensioner concession claims and minor energy subsidy scheme applications. A cost allocation model is used to apportion the costs of processing of applications and claims based on full-time equivalent numbers and resource usage.
Key Efficiency IndicatorsState RevenueService 1: Revenue assessment and collection, and grants and subsidies administration
This service involves the assessment and collection of a range of statutory based revenue, including duties, land tax and payroll tax, and those that are collected on behalf of other agencies (e.g. Perth Parking Licence fees on behalf of Department of Transport) or other jurisdictions (e.g. collection of a range of taxes for the Commonwealth in the Indian Ocean Territories). State Revenue is also involved in the assessment and payment of a range of grants and subsidies under both statutory and administrative schemes. The major payments relate to the First Home Owner Grant Scheme, as well as concessions on water rates, local government rates and the Emergency Services Levy for pensioners and seniors.
The indicators represent the costs per unit of taxation raised and grant/subsidy processed in a given year. Taken into account with the notes explaining any variances, it provides a measureof efficiency.
ACTUAL ACTUAL ACTUAL TARGET ACTUAL ACTUAL ACTUAL ACTUAL TARGET ACTUAL
2013/14 2014/15 2015/16 2016/17 2016/17 2013/14 2014/15 2015/16 2016/17 2016/17
1. Revenue collections have reduced in comparison to prior year and budget estimates, due to a decline in economic activity, and with minimal movement in actual administrative costs between 2015-16 and 2016-17, the average cost per $100 collected has increased.2. Increased numbers of applications/claims, due to a higher number of pensioners and seniors applying for concessions in 2016-17, while costs have remained stable, has resulted in a lower average cost.
0.660.71 0.70 0.71
0.76 (1)11.86 11.85 11.58 11.41
10.52 (2)
CONTENTS OVERVIEWAGENCY
PERFORMANCEFINANCIAL
STATEMENTS KEY PERFORMANCE
INDICATORS DISCLOSURES APPENDIX
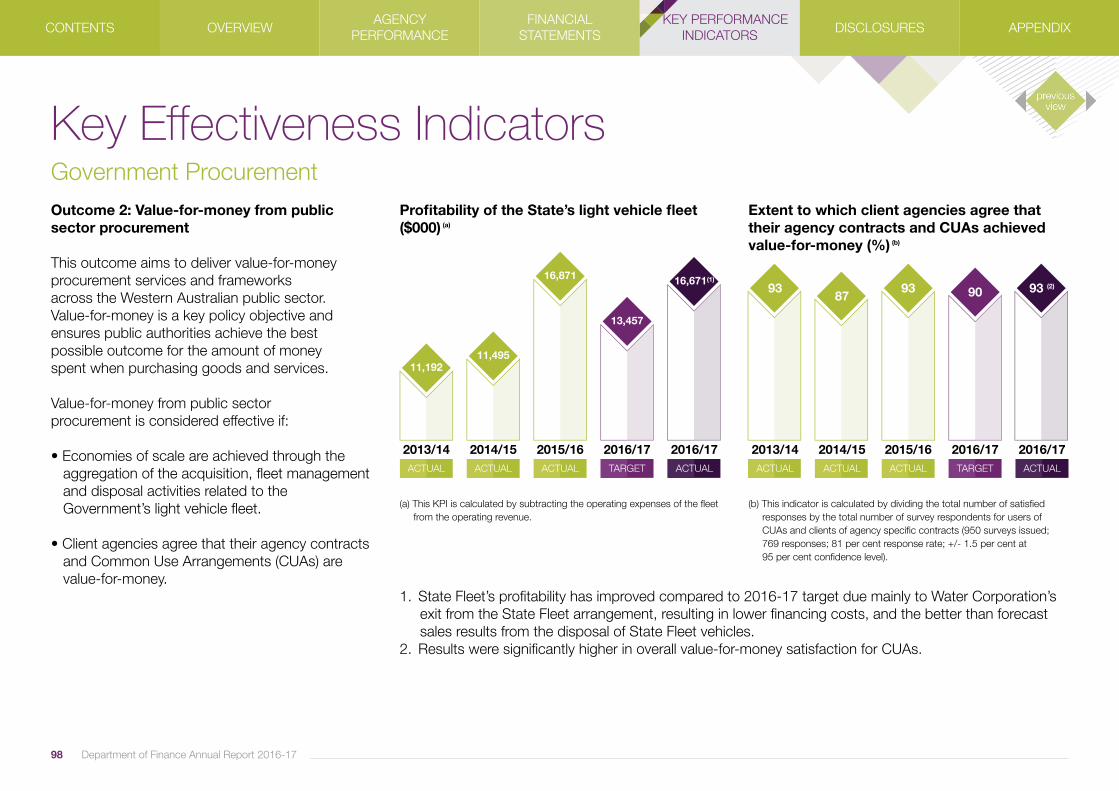
98 Department of Finance Annual Report 2016-17
Extent to which client agencies agree that their agency contracts and CUAs achieved value-for-money (%)
(b)
(b) This indicator is calculated by dividing the total number of satisfied responses by the total number of survey respondents for users of CUAs and clients of agency specific contracts (950 surveys issued; 769 responses; 81 per cent response rate; +/- 1.5 per cent at 95 per cent confidence level).
Profitability of the State’s light vehicle fleet ($000)
(a)
(a) This KPI is calculated by subtracting the operating expenses of the fleet from the operating revenue.
Key Effectiveness IndicatorsGovernment ProcurementOutcome 2: Value-for-money from public sector procurement
This outcome aims to deliver value-for-money procurement services and frameworksacross the Western Australian public sector.Value-for-money is a key policy objective and ensures public authorities achieve the best possible outcome for the amount of moneyspent when purchasing goods and services.
Value-for-money from public sectorprocurement is considered effective if:
• Economies of scale are achieved through the aggregation of the acquisition, fleet management and disposal activities related to the Government’s light vehicle fleet.
• Client agencies agree that their agency contracts and Common Use Arrangements (CUAs) are value-for-money.
1. State Fleet’s profitability has improved compared to 2016-17 target due mainly to Water Corporation’s exit from the State Fleet arrangement, resulting in lower financing costs, and the better than forecast sales results from the disposal of State Fleet vehicles.2. Results were significantly higher in overall value-for-money satisfaction for CUAs.
ACTUAL ACTUAL ACTUAL TARGET ACTUAL ACTUAL ACTUAL
2013/14 2014/15 2015/16 2016/17 2016/17 2013/14 2014/15
11,19211,495
13,457
16,671(1)
9387
16,871
ACTUAL TARGET ACTUAL
2015/16 2016/17 2016/17
93 90 93 (2)
CONTENTS OVERVIEWAGENCY
PERFORMANCEFINANCIAL
STATEMENTS KEY PERFORMANCE
INDICATORS DISCLOSURES APPENDIX
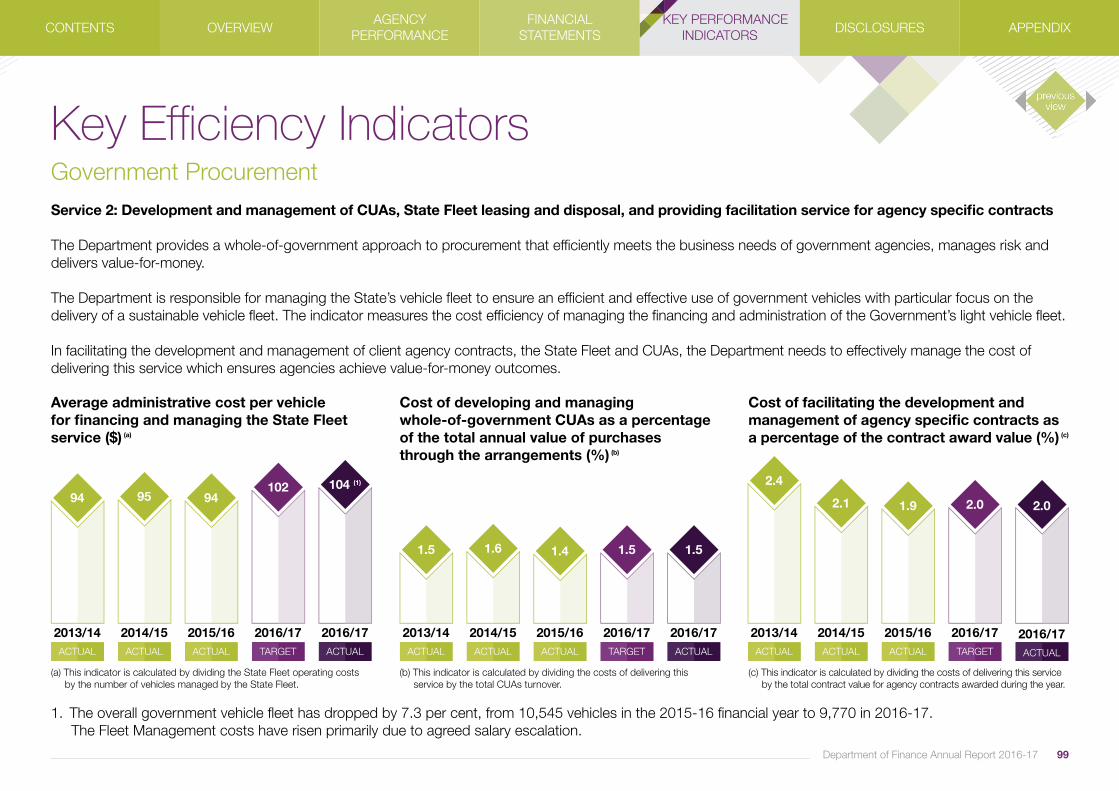
Key Efficiency IndicatorsGovernment ProcurementService 2: Development and management of CUAs, State Fleet leasing and disposal, and providing facilitation service for agency specific contracts
The Department provides a whole-of-government approach to procurement that efficiently meets the business needs of government agencies, manages risk and delivers value-for-money.
The Department is responsible for managing the State’s vehicle fleet to ensure an efficient and effective use of government vehicles with particular focus on the delivery of a sustainable vehicle fleet. The indicator measures the cost efficiency of managing the financing and administration of the Government’s light vehicle fleet.
In facilitating the development and management of client agency contracts, the State Fleet and CUAs, the Department needs to effectively manage the cost of delivering this service which ensures agencies achieve value-for-money outcomes.
1. The overall government vehicle fleet has dropped by 7.3 per cent, from 10,545 vehicles in the 2015-16 financial year to 9,770 in 2016-17. The Fleet Management costs have risen primarily due to agreed salary escalation.
ACTUAL ACTUAL ACTUAL TARGET ACTUAL
2013/14 2014/15 2015/16 2016/17 2016/17ACTUAL ACTUAL ACTUAL TARGET ACTUAL
2013/14 2014/15 2015/16 2016/17 2016/17ACTUAL ACTUAL ACTUAL TARGET ACTUAL
2013/14 2014/15 2015/16 2016/17 2016/17
2.4
1.9 2.0 2.0
1.5 1.6 1.4 1.5 1.5
102 104 (1)
94 95 94 2.1
Average administrative cost per vehicle for financing and managing the State Fleet service ($)
(a)
(a) This indicator is calculated by dividing the State Fleet operating costs by the number of vehicles managed by the State Fleet.
Cost of developing and managing whole-of-government CUAs as a percentage of the total annual value of purchases through the arrangements (%)
(b)
(b) This indicator is calculated by dividing the costs of delivering this service by the total CUAs turnover.
Cost of facilitating the development and management of agency specific contracts as a percentage of the contract award value (%)
(c)
(c) This indicator is calculated by dividing the costs of delivering this service by the total contract value for agency contracts awarded during the year.
Department of Finance Annual Report 2016-17 99
CONTENTS OVERVIEWAGENCY
PERFORMANCEFINANCIAL
STATEMENTS KEY PERFORMANCE
INDICATORS DISCLOSURES APPENDIX
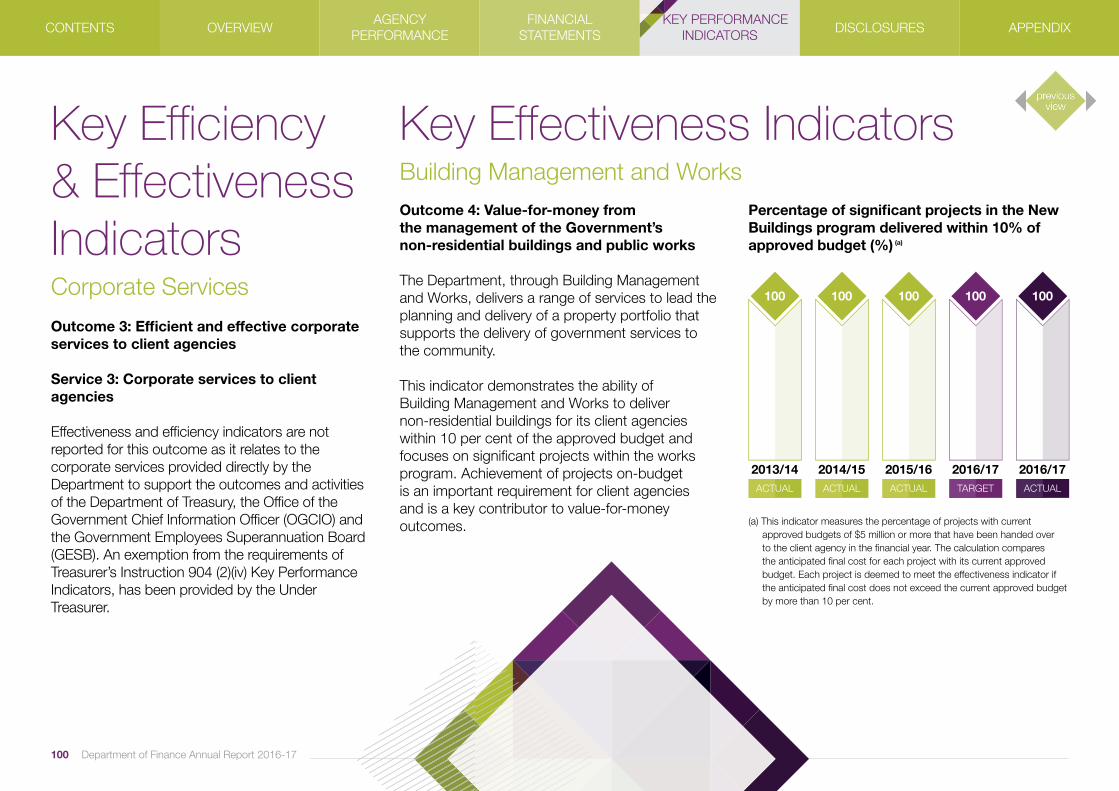
100 Department of Finance Annual Report 2016-17
Key Efficiency & Effectiveness IndicatorsCorporate Services
Key Effectiveness IndicatorsBuilding Management and WorksOutcome 4: Value-for-money from the management of the Government’s non-residential buildings and public works
The Department, through Building Management and Works, delivers a range of services to lead the planning and delivery of a property portfolio that supports the delivery of government services to the community.
This indicator demonstrates the ability ofBuilding Management and Works to delivernon-residential buildings for its client agencies within 10 per cent of the approved budget and focuses on significant projects within the works program. Achievement of projects on-budgetis an important requirement for client agenciesand is a key contributor to value-for-money outcomes.
Percentage of significant projects in the New Buildings program delivered within 10% of approved budget (%)
(a)
(a) This indicator measures the percentage of projects with current approved budgets of $5 million or more that have been handed over to the client agency in the financial year. The calculation compares the anticipated final cost for each project with its current approved budget. Each project is deemed to meet the effectiveness indicator if the anticipated final cost does not exceed the current approved budget by more than 10 per cent.
ACTUAL ACTUAL ACTUAL TARGET ACTUAL
2013/14
100
2014/15
100
2015/16
100
2016/17
100
2016/17
100
Outcome 3: Efficient and effective corporate services to client agencies
Service 3: Corporate services to client agencies
Effectiveness and efficiency indicators are not reported for this outcome as it relates to the corporate services provided directly by the Department to support the outcomes and activities of the Department of Treasury, the Office of the Government Chief Information Officer (OGCIO) and the Government Employees Superannuation Board (GESB). An exemption from the requirements of Treasurer’s Instruction 904 (2)(iv) Key Performance Indicators, has been provided by the Under Treasurer.
CONTENTS OVERVIEWAGENCY
PERFORMANCEFINANCIAL
STATEMENTS KEY PERFORMANCE
INDICATORS DISCLOSURES APPENDIX
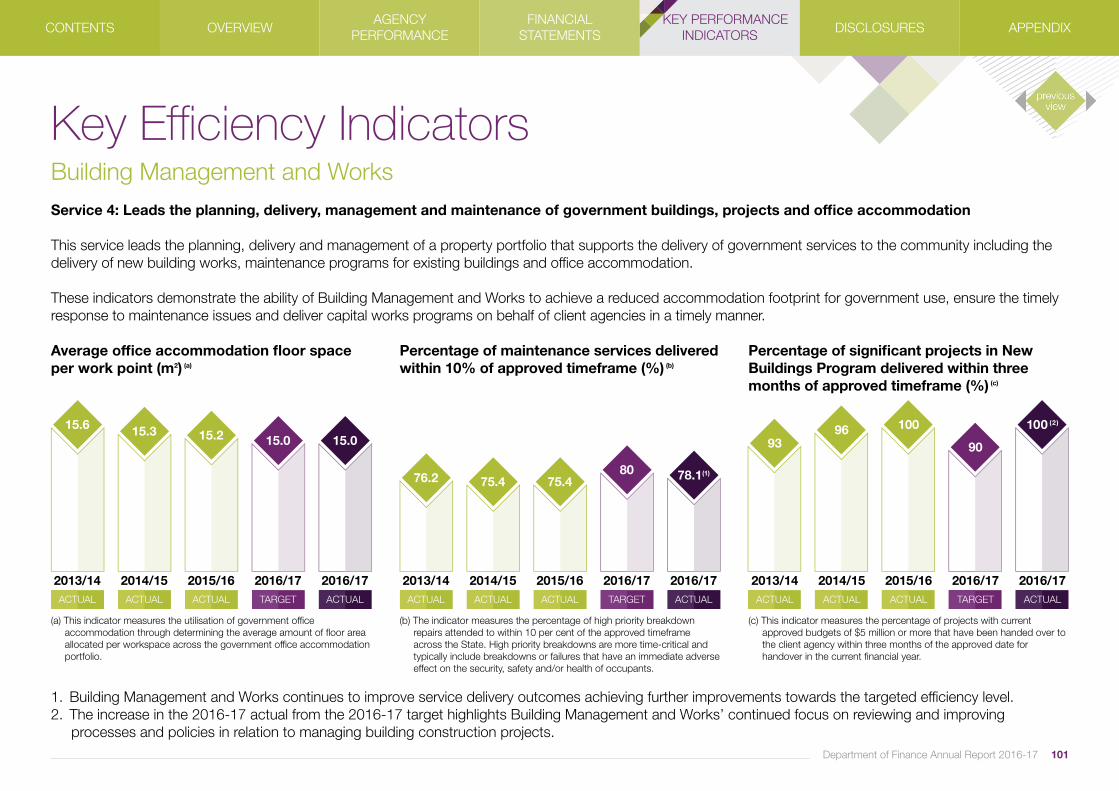
Percentage of maintenance services delivered within 10% of approved timeframe (%)
(b)
(b) The indicator measures the percentage of high priority breakdown repairs attended to within 10 per cent of the approved timeframe across the State. High priority breakdowns are more time-critical and typically include breakdowns or failures that have an immediate adverse effect on the security, safety and/or health of occupants.
Percentage of significant projects in New Buildings Program delivered within three months of approved timeframe (%)
(c)
(c) This indicator measures the percentage of projects with current approved budgets of $5 million or more that have been handed over to the client agency within three months of the approved date for handover in the current financial year.
Key Efficiency IndicatorsBuilding Management and WorksService 4: Leads the planning, delivery, management and maintenance of government buildings, projects and office accommodation
This service leads the planning, delivery and management of a property portfolio that supports the delivery of government services to the community including the delivery of new building works, maintenance programs for existing buildings and office accommodation.
These indicators demonstrate the ability of Building Management and Works to achieve a reduced accommodation footprint for government use, ensure the timely response to maintenance issues and deliver capital works programs on behalf of client agencies in a timely manner.
1. Building Management and Works continues to improve service delivery outcomes achieving further improvements towards the targeted efficiency level. 2. The increase in the 2016-17 actual from the 2016-17 target highlights Building Management and Works’ continued focus on reviewing and improving processes and policies in relation to managing building construction projects.
ACTUAL ACTUAL ACTUAL TARGET ACTUAL
2013/14 2014/15 2015/16 2016/17 2016/17ACTUAL ACTUAL ACTUAL TARGET ACTUAL
2013/14 2014/15 2015/16 2016/17 2016/17ACTUAL ACTUAL ACTUAL TARGET ACTUAL
2013/14 2014/15 2015/16 2016/17 2016/17
9396 100
90
100 (2)
76.2 75.4 75.480 78.1(1)
15.6 15.3 15.2 15.0 15.0
Average office accommodation floor space per work point (m2)
(a)
(a) This indicator measures the utilisation of government office accommodation through determining the average amount of floor area allocated per workspace across the government office accommodation portfolio.
Department of Finance Annual Report 2016-17 101
CONTENTS OVERVIEWAGENCY
PERFORMANCEFINANCIAL
STATEMENTS KEY PERFORMANCE
INDICATORS DISCLOSURES APPENDIX

Outcome 5: A sustainable, efficient, secure and affordable energy sector
The delivery of impartial, high-quality advice on matters in the energy portfolio assists government to make well-informed decisions that contribute to a sustainable, efficient, secure and affordable energy sector. This indicator demonstrates the capability of the Public Utilities Office in meeting the Government’s agenda for policy and program delivery.
The extent to which policy and program development objectives for the year are achieved (%) (a)
(a) The results are calculated by monitoring the priorities set for a year. If the Government’s priorities change, for example there is a ministerial request to undertake a new policy project or cease working on an existing priority, this is taken into account in determining the number of items completed as planned. The results are presented as a percentage of planned priorities completed.
1. The Network Regulation Reform Bills did not pass the parliament in November 2016. The network reform package passed to the new State Government in March 2017. This has resulted in a number of policy objectives being realigned as a result of the government transition, impacting on the extent to which these have been achieved.
102 Department of Finance Annual Report 2016-17
Key Effectiveness IndicatorsPublic Utilities Office and Economic Reform
ACTUAL ACTUAL ACTUAL TARGET ACTUAL
2013/14 2014/15 2015/16 2016/17 2016/17
8995
92
100
83 (1)
CONTENTS OVERVIEWAGENCY
PERFORMANCEFINANCIAL
STATEMENTS KEY PERFORMANCE
INDICATORS DISCLOSURES APPENDIX
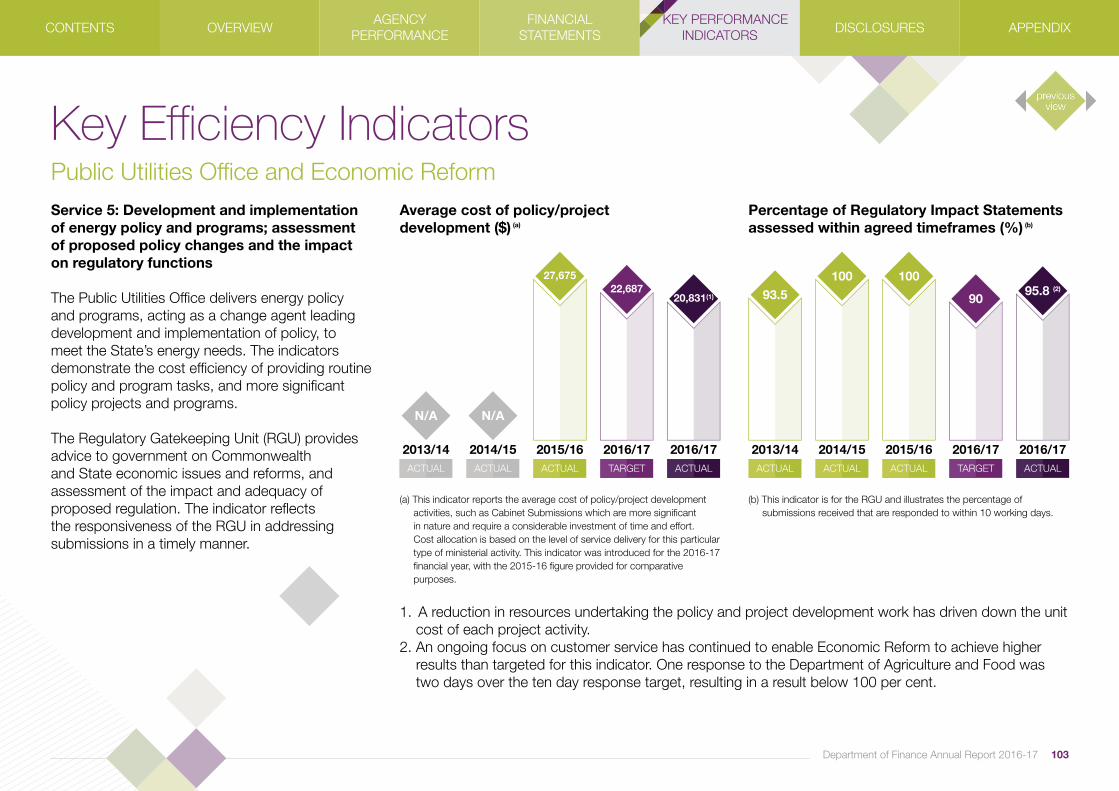
Key Efficiency IndicatorsPublic Utilities Office and Economic ReformService 5: Development and implementation of energy policy and programs; assessment of proposed policy changes and the impact on regulatory functions
The Public Utilities Office delivers energy policy and programs, acting as a change agent leading development and implementation of policy, to meet the State’s energy needs. The indicators demonstrate the cost efficiency of providing routine policy and program tasks, and more significant policy projects and programs.
The Regulatory Gatekeeping Unit (RGU) provides advice to government on Commonwealth and State economic issues and reforms, and assessment of the impact and adequacy of proposed regulation. The indicator reflects the responsiveness of the RGU in addressing submissions in a timely manner.
Average cost of policy/projectdevelopment ($)
(a)
(a) This indicator reports the average cost of policy/project development activities, such as Cabinet Submissions which are more significant in nature and require a considerable investment of time and effort. Cost allocation is based on the level of service delivery for this particular type of ministerial activity. This indicator was introduced for the 2016-17 financial year, with the 2015-16 figure provided for comparative purposes.
1. A reduction in resources undertaking the policy and project development work has driven down the unit cost of each project activity. 2. An ongoing focus on customer service has continued to enable Economic Reform to achieve higher results than targeted for this indicator. One response to the Department of Agriculture and Food was two days over the ten day response target, resulting in a result below 100 per cent.
Percentage of Regulatory Impact Statements assessed within agreed timeframes (%)
(b)
(b) This indicator is for the RGU and illustrates the percentage of submissions received that are responded to within 10 working days.
ACTUAL ACTUAL ACTUAL TARGET ACTUAL
2013/14 2014/15 2015/16 2016/17 2016/17ACTUAL ACTUAL ACTUAL TARGET ACTUAL
2013/14
N/A
2014/15
N/A
2015/16 2016/17 2016/17
93.5100 100
9095.8 (2)
27,67522,687
20,831(1)
Department of Finance Annual Report 2016-17 103
CONTENTS OVERVIEWAGENCY
PERFORMANCEFINANCIAL
STATEMENTS KEY PERFORMANCE
INDICATORS DISCLOSURES APPENDIX
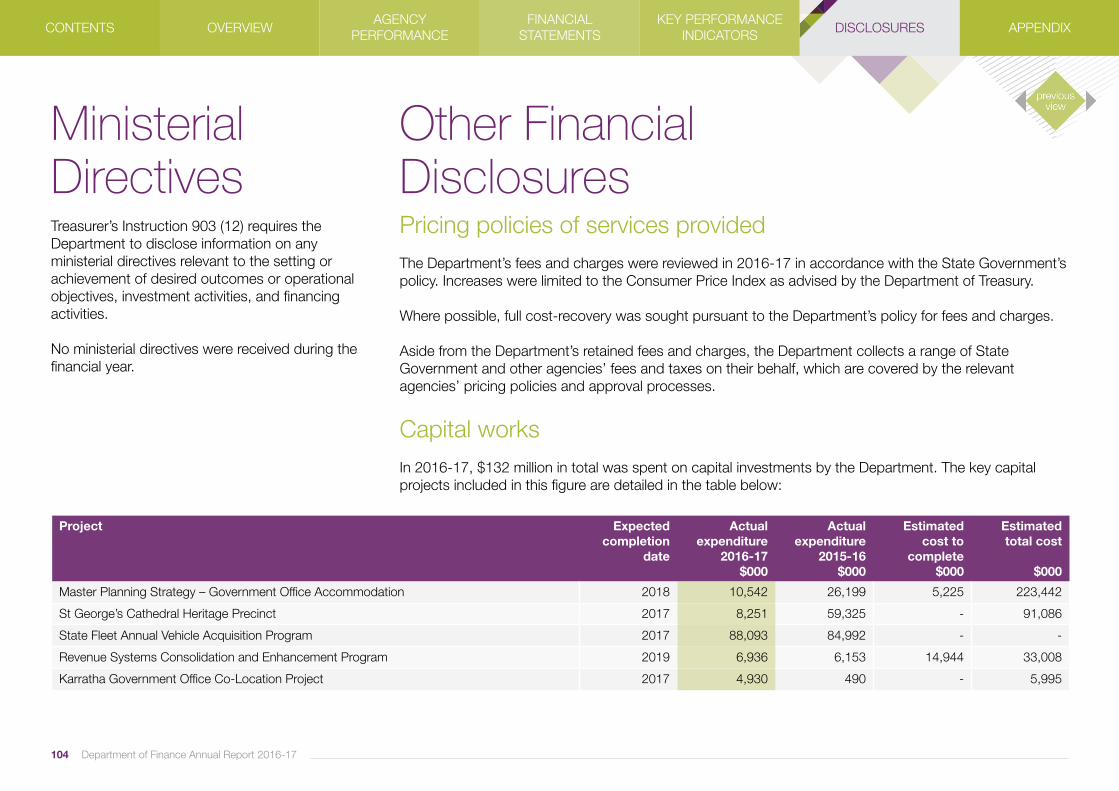
104 Department of Finance Annual Report 2016-17
MinisterialDirectives
Other FinancialDisclosuresPricing policies of services providedThe Department’s fees and charges were reviewed in 2016-17 in accordance with the State Government’s policy. Increases were limited to the Consumer Price Index as advised by the Department of Treasury.
Where possible, full cost-recovery was sought pursuant to the Department’s policy for fees and charges.
Aside from the Department’s retained fees and charges, the Department collects a range of State Government and other agencies’ fees and taxes on their behalf, which are covered by the relevant agencies’ pricing policies and approval processes.
Capital worksIn 2016-17, $132 million in total was spent on capital investments by the Department. The key capital projects included in this figure are detailed in the table below:
Treasurer’s Instruction 903 (12) requires the Department to disclose information on any ministerial directives relevant to the setting or achievement of desired outcomes or operational objectives, investment activities, and financing activities.
No ministerial directives were received during the financial year.
Project Expected completion
date
Actual expenditure
2016-17$000
Actual expenditure
2015-16 $000
Estimated cost to
complete$000
Estimated total cost
$000
Master Planning Strategy – Government Office Accommodation 2018 10,542 26,199 5,225 223,442
St George’s Cathedral Heritage Precinct 2017 8,251 59,325 - 91,086
State Fleet Annual Vehicle Acquisition Program 2017 88,093 84,992 - -
Revenue Systems Consolidation and Enhancement Program 2019 6,936 6,153 14,944 33,008
Karratha Government Office Co-Location Project 2017 4,930 490 - 5,995
CONTENTS OVERVIEWAGENCY
PERFORMANCEFINANCIAL
STATEMENTSKEY PERFORMANCE
INDICATORS DISCLOSURES APPENDIX
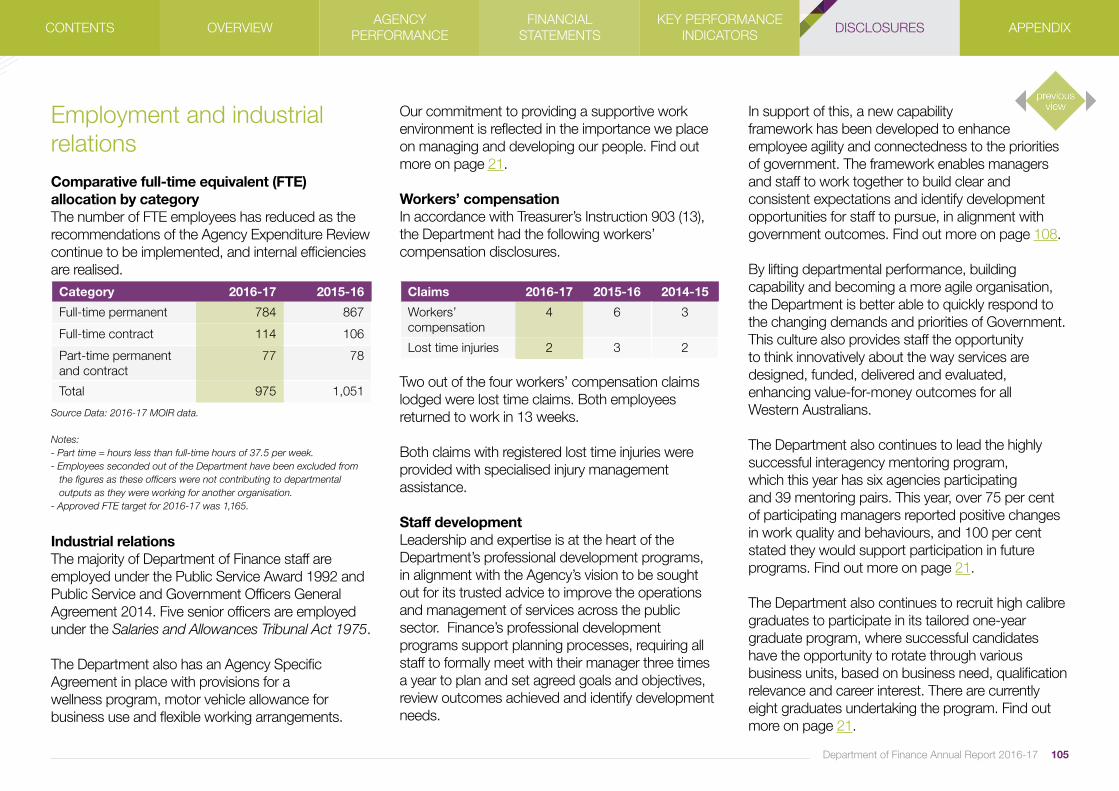
105Department of Finance Annual Report 2016-17
Employment and industrial relationsComparative full-time equivalent (FTE) allocation by category The number of FTE employees has reduced as the recommendations of the Agency Expenditure Review continue to be implemented, and internal efficiencies are realised.
Industrial relations The majority of Department of Finance staff are employed under the Public Service Award 1992 and Public Service and Government Officers General Agreement 2014. Five senior officers are employed under the Salaries and Allowances Tribunal Act 1975.
The Department also has an Agency Specific Agreement in place with provisions for awellness program, motor vehicle allowance for business use and flexible working arrangements.
Source Data: 2016-17 MOIR data.
Notes:- Part time = hours less than full-time hours of 37.5 per week.- Employees seconded out of the Department have been excluded from the figures as these officers were not contributing to departmental outputs as they were working for another organisation.- Approved FTE target for 2016-17 was 1,165.
Category 2016-17 2015-16
Full-time permanent 784 867
Full-time contract 114 106
Part-time permanent and contract
77 78
Total 975 1,051
Our commitment to providing a supportive work environment is reflected in the importance we place on managing and developing our people. Find out more on page 21.
Workers’ compensationIn accordance with Treasurer’s Instruction 903 (13), the Department had the following workers’ compensation disclosures.
Two out of the four workers’ compensation claims lodged were lost time claims. Both employees returned to work in 13 weeks.
Both claims with registered lost time injuries were provided with specialised injury management assistance.
Staff development Leadership and expertise is at the heart of the Department’s professional development programs, in alignment with the Agency’s vision to be sought out for its trusted advice to improve the operations and management of services across the public sector. Finance’s professional development programs support planning processes, requiring all staff to formally meet with their manager three times a year to plan and set agreed goals and objectives, review outcomes achieved and identify development needs.
Claims 2016-17 2015-16 2014-15
Workers’ compensation
4 6 3
Lost time injuries 2 3 2
In support of this, a new capability framework has been developed to enhanceemployee agility and connectedness to the prioritiesof government. The framework enables managers and staff to work together to build clear and consistent expectations and identify development opportunities for staff to pursue, in alignment with government outcomes. Find out more on page 108.
By lifting departmental performance, building capability and becoming a more agile organisation, the Department is better able to quickly respond to the changing demands and priorities of Government. This culture also provides staff the opportunity to think innovatively about the way services are designed, funded, delivered and evaluated, enhancing value-for-money outcomes for all Western Australians.
The Department also continues to lead the highly successful interagency mentoring program, which this year has six agencies participating and 39 mentoring pairs. This year, over 75 per cent of participating managers reported positive changes in work quality and behaviours, and 100 per cent stated they would support participation in future programs. Find out more on page 21.
The Department also continues to recruit high calibre graduates to participate in its tailored one-year graduate program, where successful candidates have the opportunity to rotate through various business units, based on business need, qualification relevance and career interest. There are currently eight graduates undertaking the program. Find out more on page 21.
CONTENTS OVERVIEWAGENCY
PERFORMANCEFINANCIAL
STATEMENTSKEY PERFORMANCE
INDICATORS DISCLOSURES APPENDIX

Department of Finance Annual Report 2016-17106
Governance DisclosuresSenior officersIn 2016-17, no senior officers disclosed that they held any shares that are required to be disclosed in accordance with Treasurer’s Instruction 903 (14). No senior officers, firms of which senior officers are members, or entities in which senior officers have substantial interests, had any interests in existing or proposed contracts with the Department other than normal contracts of employment of service.
Board and committeeremunerationIn 2016-17, the Department of Finance paid no board or committee renumeration.
Governance committeesGood governance is the cornerstone for efficient and effective organisational performance and is underpinned by a number of accountability requirements. As per existing legislative requirements and industry standards, the Department of Finance continues to convene several governance committees regularly to enhance accountability, probity and transparency in procurement, technology and governance, people and communications, and audit and risk management.
In addition, this year the Department has assessed its governance mechanisms against the nine governance principles contained in the Public Sector Commission’s ‘Good governance guide for public sector agencies’. The Review highlighted that the Department’s governance is effective, has strong leadership and is an appropriate governance structure, with clear accountability mechanisms and sound systems.
Finance and Procurement CommitteeThe Finance and Procurement Committee provides direction and leadership in the management of the Department’s financial responsibilities, as well as making recommendations on Finance’s own procurement activities. This year the Committee implemented a periodic review process that seeks to achieve better value-for-money outcomes for the Department and government as a whole.
The Department also improved its focus on contract oversight through the development of a register of contracts, in line with Treasurer’s Instruction 820. In addition, the Committee has improved corporate purchasing card analytics, to facilitate the timelier processing of credit card activity across the Department.
CONTENTS OVERVIEWAGENCY
PERFORMANCEFINANCIAL
STATEMENTSKEY PERFORMANCE
INDICATORS DISCLOSURES APPENDIX
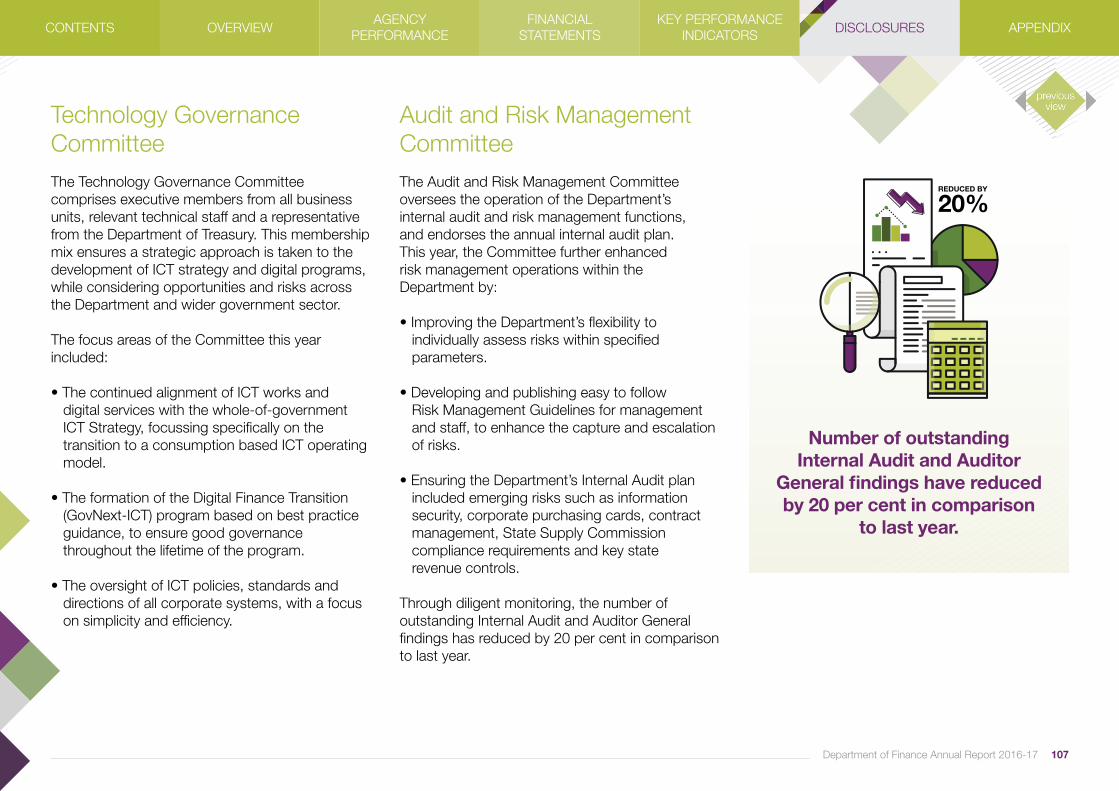
Department of Finance Annual Report 2016-17 107
Technology Governance CommitteeThe Technology Governance Committee comprises executive members from all business units, relevant technical staff and a representative from the Department of Treasury. This membership mix ensures a strategic approach is taken to the development of ICT strategy and digital programs, while considering opportunities and risks across the Department and wider government sector.
The focus areas of the Committee this year included:
• The continued alignment of ICT works and digital services with the whole-of-government ICT Strategy, focussing specifically on the transition to a consumption based ICT operating model.
• The formation of the Digital Finance Transition (GovNext-ICT) program based on best practice guidance, to ensure good governance throughout the lifetime of the program.
• The oversight of ICT policies, standards and directions of all corporate systems, with a focus on simplicity and efficiency.
Audit and Risk Management CommitteeThe Audit and Risk Management Committee oversees the operation of the Department’s internal audit and risk management functions,and endorses the annual internal audit plan.This year, the Committee further enhancedrisk management operations within the Department by:
• Improving the Department’s flexibility to individually assess risks within specified parameters.
• Developing and publishing easy to follow Risk Management Guidelines for management and staff, to enhance the capture and escalation of risks.
• Ensuring the Department’s Internal Audit plan included emerging risks such as information security, corporate purchasing cards, contract management, State Supply Commission compliance requirements and key state revenue controls.
Through diligent monitoring, the number of outstanding Internal Audit and Auditor General findings has reduced by 20 per cent in comparison to last year.
Number of outstandingInternal Audit and Auditor
General findings have reduced by 20 per cent in comparison
to last year.
CONTENTS OVERVIEWAGENCY
PERFORMANCEFINANCIAL
STATEMENTSKEY PERFORMANCE
INDICATORS DISCLOSURES APPENDIX

Department of Finance Annual Report 2016-17108
People and Communications CommitteeThis year, the focus of the Committee has beenon supporting the development and adoptionof the Department’s new capability framework.This framework seeks to support staff in liftingthe quality, responsiveness and reliability of thework delivered across the Department.The framework provides an objective basisfor managers to provide feedback during performance conversations with their staff, aligning individual capability with theachievement of the Department’s objectives.
In support of the capability framework,the Department has also launched a Management of Underperformance Policy, which outlines practical processes for managing performance, and supports both managers and employees in the early identification and analysis of factors that may cause poor performance. The policy also provides a pathway to address identified underperformance, creating a line of sight for all involved in the process.
In addition, the Committee provided oversight of the development and launch of a number of online learning modules to educate staff on topics such as Disability Awareness, Accountability and Ethical Decision-Making.
The online professional developmentmodules are a demonstrated cost-efficientway to improve information accessibility tostaff, while complementing existingface-to-face training programs.
The Department’s new Capability Framework was launched this year with the support of the People and Communications Committee
CONTENTS OVERVIEWAGENCY
PERFORMANCEFINANCIAL
STATEMENTSKEY PERFORMANCE
INDICATORS DISCLOSURES APPENDIX
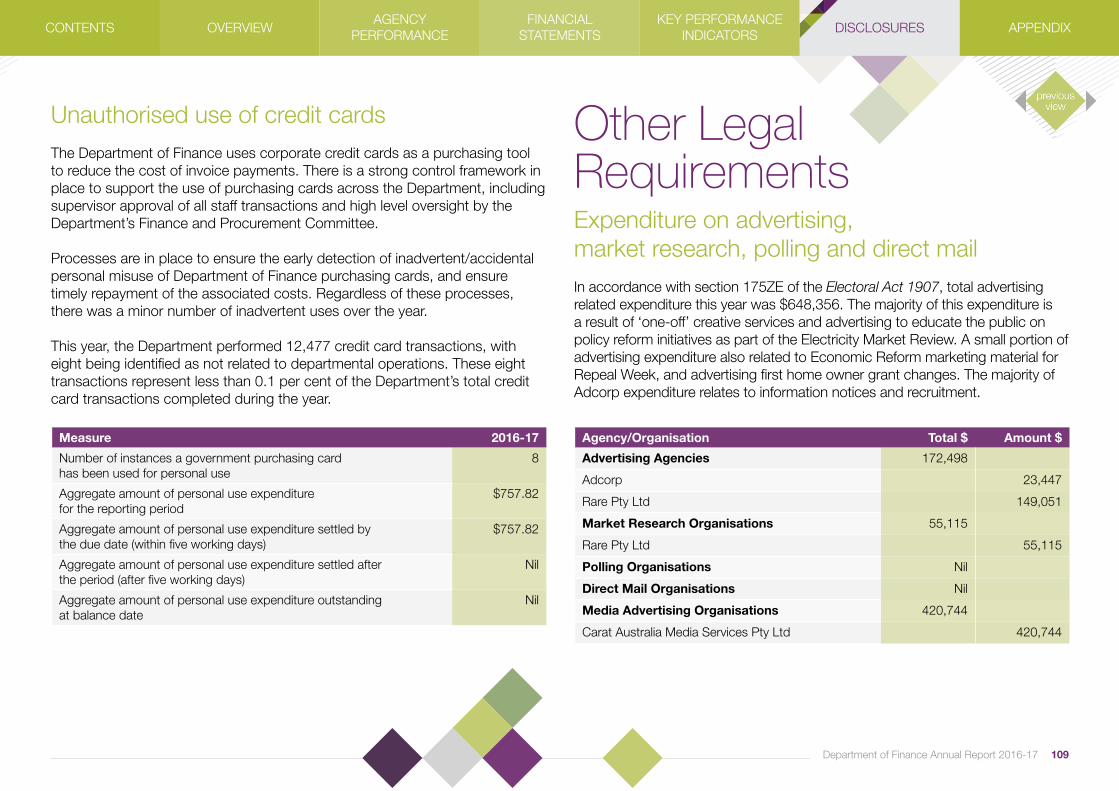
Measure 2016-17
Number of instances a government purchasing card has been used for personal use
8
Aggregate amount of personal use expenditure for the reporting period
$757.82
Aggregate amount of personal use expenditure settled by the due date (within five working days)
$757.82
Aggregate amount of personal use expenditure settled after the period (after five working days)
Nil
Aggregate amount of personal use expenditure outstanding at balance date
Nil
Unauthorised use of credit cardsThe Department of Finance uses corporate credit cards as a purchasing tool to reduce the cost of invoice payments. There is a strong control framework in place to support the use of purchasing cards across the Department, including supervisor approval of all staff transactions and high level oversight by the Department’s Finance and Procurement Committee.
Processes are in place to ensure the early detection of inadvertent/accidental personal misuse of Department of Finance purchasing cards, and ensure timely repayment of the associated costs. Regardless of these processes, there was a minor number of inadvertent uses over the year.
This year, the Department performed 12,477 credit card transactions, with eight being identified as not related to departmental operations. These eight transactions represent less than 0.1 per cent of the Department’s total credit card transactions completed during the year.
Other LegalRequirementsExpenditure on advertising,market research, polling and direct mailIn accordance with section 175ZE of the Electoral Act 1907, total advertising related expenditure this year was $648,356. The majority of this expenditure isa result of ‘one-off’ creative services and advertising to educate the public on policy reform initiatives as part of the Electricity Market Review. A small portion of advertising expenditure also related to Economic Reform marketing material for Repeal Week, and advertising first home owner grant changes. The majority of Adcorp expenditure relates to information notices and recruitment.
Agency/Organisation Total $ Amount $
Advertising Agencies 172,498
Adcorp 23,447
Rare Pty Ltd 149,051
Market Research Organisations 55,115
Rare Pty Ltd 55,115
Polling Organisations Nil
Direct Mail Organisations Nil
Media Advertising Organisations 420,744
Carat Australia Media Services Pty Ltd 420,744
109Department of Finance Annual Report 2016-17
CONTENTS OVERVIEWAGENCY
PERFORMANCEFINANCIAL
STATEMENTSKEY PERFORMANCE
INDICATORS DISCLOSURES APPENDIX

Department of Finance Annual Report 2016-17110
Disability Access and Inclusion Plan outcomesThrough its Disability Access and Inclusion Plan, the Department of Finance seeks to ensure that people with a disability have an equal level of inclusion and access to services and employment.
The Plan has this year achieved:
• The recruitment of four employees under the public sector disability traineeship program who are in the process of or have completed their Certificate III in Government qualification.
• The launch of the ‘Disability Awareness’ eLearning online module to assist staff in understanding issues around disability in the workplace and the wider community. To date, 845 staff have completed this eLearning module.
The Department is also proud to continue to lead whole-of-government access and inclusion related programs including the Australian Disability Enterprises initiative through Government Procurement, assisting agencies to understand the capabilities and offerings of disability enterprises, and the benefits of working with them.
A new Workforce Diversity Plan has also been launched which includes tangible strategies for the Department to achieve a workforce diversity that reflects the broader community in Western Australia.
Reconciliation Action Plan CommitteeThe Department is committed to the sustainable employment of and positive economic outcomes for Aboriginal and Torres Strait Islander people and communities.
This year, the Reconciliation Committee has been active with volunteering, including:
• Participating in the Sorry Day 2017 event at Wellington Square;
• Engaging staff in the collection of musical instruments for the Desert Feet Program; • Participating in the Run for Reconciliation; and
• Coordinating the joint National Aborigines and Islanders Day Observance Committee (NAIDOC) celebration at the Optima Centre in Osborne Park, where two Department of Finance business units are located. This celebration focussed on the theme of ‘Songlines: The living narrative of our nation’.
Finance staff and friends answer the music call for the
Desert Feet Program.
CONTENTS OVERVIEWAGENCY
PERFORMANCEFINANCIAL
STATEMENTSKEY PERFORMANCE
INDICATORS DISCLOSURES APPENDIX
Recordkeeping plansThe Department’s Recordkeeping Plan provides the framework to capture and store the work of the Agency, in accordance with legislative requirements of the State Records Act 2000.
This year, the Department released a new eLearning module educating staff on appropriate record management procedures, and progressed the disposal of records, in accordance with the General Disposal Authority for State Government Information. This initiative has resulted in a significant reduction in the volume of paper records held by the agency, realising savings of approximately $140,000. This approach to managing the Department’s records directly improves the security, accessibility and preservation of holdings, which grew in excessof half a million electronic records last year.
Compliance with publicsector standards andethical codesThe Department has maintained its good record in complying with public sector standards and the public sector code of ethics, delivering its training programs via online and face-to-face sessions, tailored for new and existing employees.
Over the year, the Department continued to provide proactive guidance to managers and staff to ensure that recruitment processes complied with public sector standards. The Department successfully completed 90 recruitment processes this year from which 2,569 applications were received.
Two breach of standard claims were lodged against a selection process of the Employment Standard, and were subsequently withdrawn. One case of non-compliance with the Code of Conduct was finalised. Two formal grievance cases were completed, and one case of substandard performance management was completed.
Departmental policies, procedures and guidelines are maintained to satisfy legislative requirements.
No disclosures were received in 2016-17 under the Public Interest Disclosure Act 2003.
Department of Finance Annual Report 2016-17 111
CONTENTS OVERVIEWAGENCY
PERFORMANCEFINANCIAL
STATEMENTSKEY PERFORMANCE
INDICATORS DISCLOSURES APPENDIX
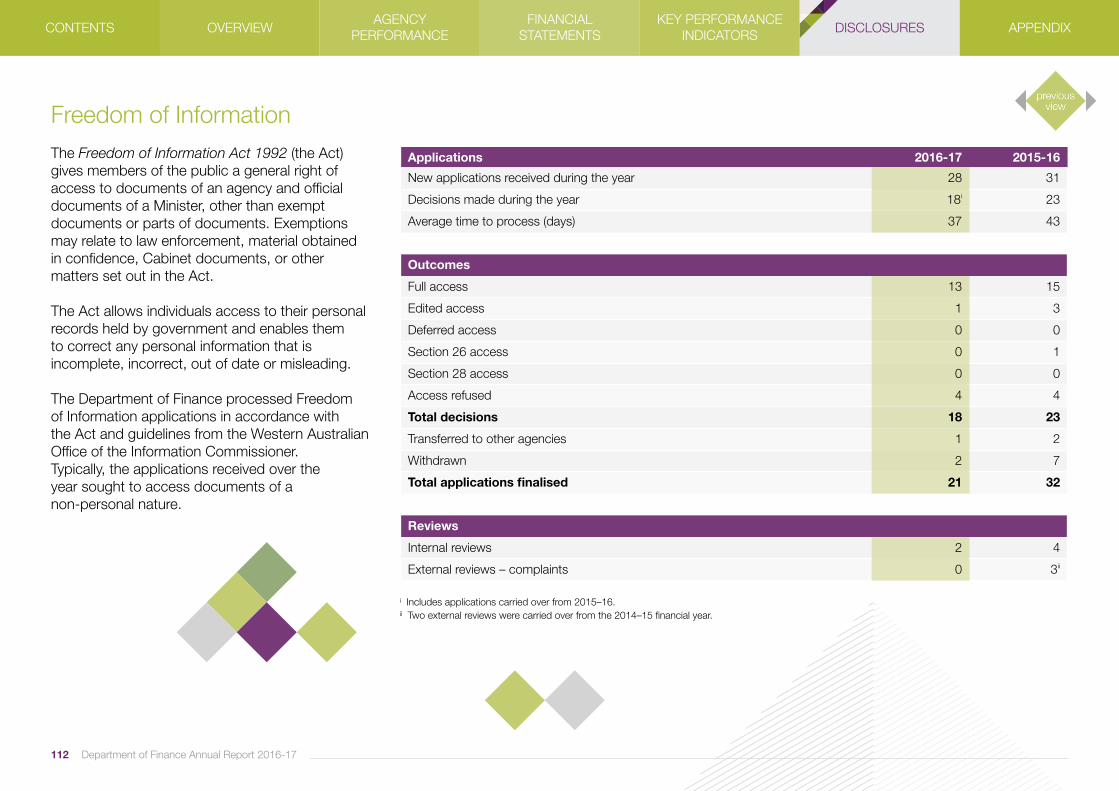
Department of Finance Annual Report 2016-17112
Freedom of InformationThe Freedom of Information Act 1992 (the Act) gives members of the public a general right of access to documents of an agency and official documents of a Minister, other than exempt documents or parts of documents. Exemptions may relate to law enforcement, material obtainedin confidence, Cabinet documents, or other matters set out in the Act.
The Act allows individuals access to their personal records held by government and enables them to correct any personal information that is incomplete, incorrect, out of date or misleading.
The Department of Finance processed Freedomof Information applications in accordance withthe Act and guidelines from the Western Australian Office of the Information Commissioner.Typically, the applications received over theyear sought to access documents of anon-personal nature.
i Includes applications carried over from 2015–16.ii Two external reviews were carried over from the 2014–15 financial year.
Applications 2016-17 2015-16
New applications received during the year 28 31
Decisions made during the year 18i 23
Average time to process (days) 37 43
Outcomes
Full access 13 15
Edited access 1 3
Deferred access 0 0
Section 26 access 0 1
Section 28 access 0 0
Access refused 4 4
Total decisions 18 23
Transferred to other agencies 1 2
Withdrawn 2 7
Total applications finalised 21 32
Reviews
Internal reviews 2 4
External reviews – complaints 0 3ii
CONTENTS OVERVIEWAGENCY
PERFORMANCEFINANCIAL
STATEMENTSKEY PERFORMANCE
INDICATORS DISCLOSURES APPENDIX
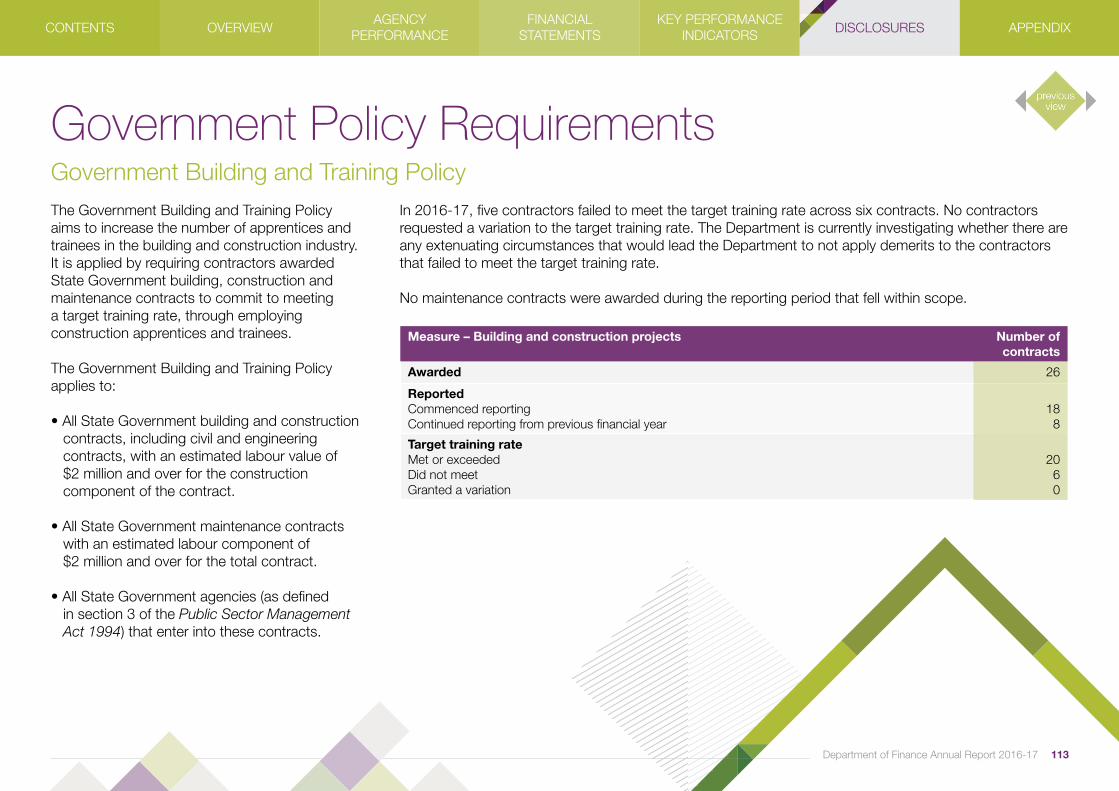
113Department of Finance Annual Report 2016-17
Government Policy Requirements
The Government Building and Training Policyaims to increase the number of apprentices and trainees in the building and construction industry. It is applied by requiring contractors awarded State Government building, construction and maintenance contracts to commit to meeting a target training rate, through employing construction apprentices and trainees.
The Government Building and Training Policy applies to:
• All State Government building and construction contracts, including civil and engineering contracts, with an estimated labour value of $2 million and over for the construction component of the contract.
• All State Government maintenance contracts with an estimated labour component of $2 million and over for the total contract.
• All State Government agencies (as defined in section 3 of the Public Sector Management Act 1994) that enter into these contracts.
In 2016-17, five contractors failed to meet the target training rate across six contracts. No contractors requested a variation to the target training rate. The Department is currently investigating whether there are any extenuating circumstances that would lead the Department to not apply demerits to the contractors that failed to meet the target training rate.
No maintenance contracts were awarded during the reporting period that fell within scope.
Government Building and Training Policy
Measure – Building and construction projects Number of contracts
Awarded 26
ReportedCommenced reportingContinued reporting from previous financial year
188
Target training rateMet or exceededDid not meetGranted a variation
2060
CONTENTS OVERVIEWAGENCY
PERFORMANCEFINANCIAL
STATEMENTSKEY PERFORMANCE
INDICATORS DISCLOSURES APPENDIX

Department of Finance Annual Report 2016-17114
Substantive equalityThe Department of Finance supports theprovision of services that address the different needs of Western Australia’s diverse community and supports the Equal Opportunity Commission to eliminate systemic racism by creating a community based on equality for everyone. In achieving this objective our policies and services consider access, participation and equity needs of all people.
For example, State Revenue continues to make available 10 publications regarding land tax and duties in Malay and Chinese. These documentsare available in both hard copy and online.
Occupational safetyand healthFinance is committed to integrating safety into all facets of the Department, providing a safe and healthy work environment for employees, contractors and visitors to our workplace locations.
Consultation and communication with staff and contractors has been key in building a safety culture across the Department of Finance. In order tofacilitate and drive this culture, the Occupational Safety and Health (OSH) Committee meets quarterly, to review key safety and health
performance indicators, discuss opportunities to lead OSH awareness amongst staff, and consider information about all reported hazards and incidents to ensure the timely implementation of adequate control measures.
The Department has clear safety targets,with the ultimate aim of no injuries, harm or damage. All OSH programs are delivered in accordance with requirements outlined in the Public Sector Commissioner Circular 2012-05: Code of Practice: Occupational Safety and Health in the Western Australian Public Sector, and support the Government’s commitment to align with the Australian Work Health and Safety Strategy 2012-2022.
The Department’s Corporate Executive leadsthe Department’s safety culture through:
• Active consultation regarding OSH matters with managers and employees.
• Support of all staff completing relevant training, both online and face-to-face, and are provided with course completion rates to aid in compliance.
• Monitoring of OSH performance through quarterly and annual OSH reporting.
• Active support for OSH and wellbeing initiatives.
The Department of Finance runs employee wellbeing programs that aim to increaseawareness of healthy practices and choices that support a balanced lifestyle. Initiatives that Department of Finance staff have had the chance to engage in this year include the Australia’s Biggest Mental Health Check initiative, nutritional seminars, tai chi, yoga, meditation and exercise classes, bicycle maintenance classes, men’s health seminars and access to online mental health modules.
Raising awareness of and supporting thosenot as fortunate is another element of Finance’s wellness program, with fundraisers and collections run semi-regularly in aid of local charities.
CONTENTS OVERVIEWAGENCY
PERFORMANCEFINANCIAL
STATEMENTSKEY PERFORMANCE
INDICATORS DISCLOSURES APPENDIX
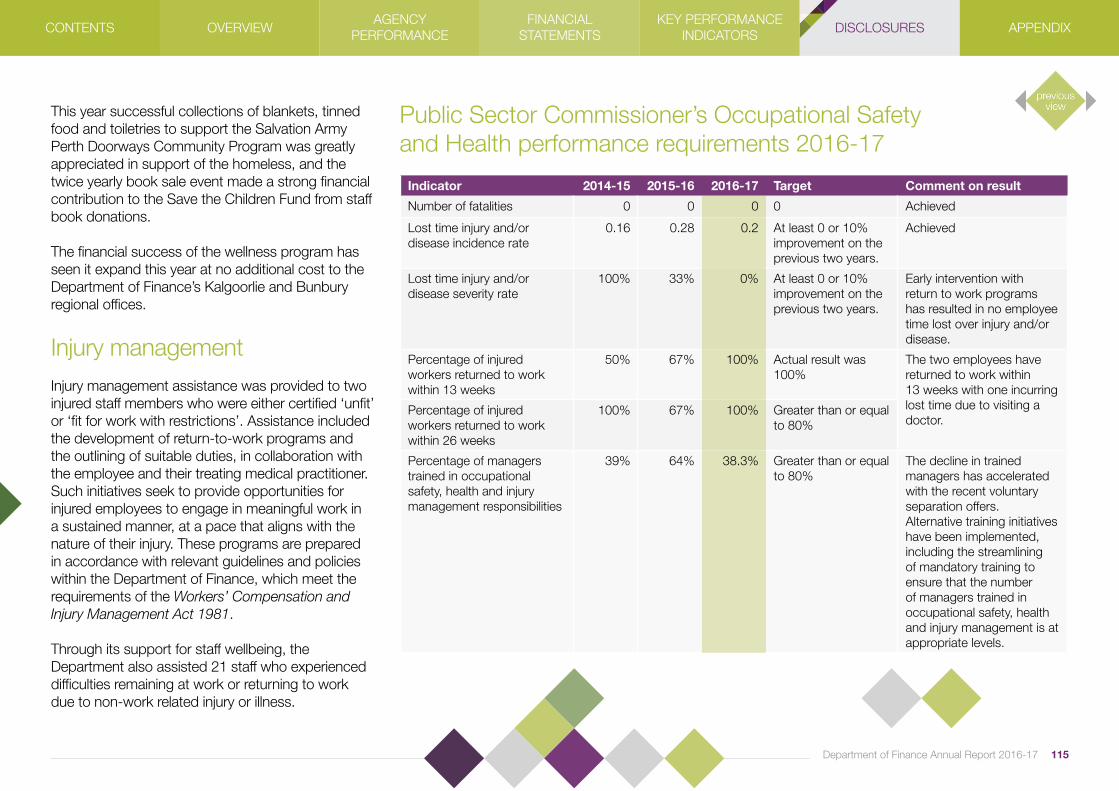
115Department of Finance Annual Report 2016-17
This year successful collections of blankets, tinned food and toiletries to support the Salvation Army Perth Doorways Community Program was greatly appreciated in support of the homeless, and the twice yearly book sale event made a strong financial contribution to the Save the Children Fund from staff book donations.
The financial success of the wellness program has seen it expand this year at no additional cost to the Department of Finance’s Kalgoorlie and Bunbury regional offices.
Injury managementInjury management assistance was provided to two injured staff members who were either certified ‘unfit’ or ‘fit for work with restrictions’. Assistance included the development of return-to-work programs and the outlining of suitable duties, in collaboration with the employee and their treating medical practitioner. Such initiatives seek to provide opportunities for injured employees to engage in meaningful work in a sustained manner, at a pace that aligns with the nature of their injury. These programs are prepared in accordance with relevant guidelines and policies within the Department of Finance, which meet the requirements of the Workers’ Compensation and Injury Management Act 1981.
Through its support for staff wellbeing, the Department also assisted 21 staff who experienced difficulties remaining at work or returning to work due to non-work related injury or illness.
Public Sector Commissioner’s Occupational Safety and Health performance requirements 2016-17
Indicator 2014-15 2015-16 2016-17 Target Comment on result
Number of fatalities 0 0 0 0 Achieved
Lost time injury and/or disease incidence rate
0.16 0.28 0.2 At least 0 or 10% improvement on the previous two years.
Achieved
Lost time injury and/or disease severity rate
100% 33% 0% At least 0 or 10% improvement on the previous two years.
Early intervention with return to work programs has resulted in no employee time lost over injury and/or disease.
Percentage of injured workers returned to work within 13 weeks
50% 67% 100% Actual result was 100%
The two employees have returned to work within 13 weeks with one incurring lost time due to visiting a doctor.
Percentage of injured workers returned to work within 26 weeks
100% 67% 100% Greater than or equal to 80%
Percentage of managers trained in occupational safety, health and injury management responsibilities
39% 64% 38.3% Greater than or equal to 80%
The decline in trained managers has accelerated with the recent voluntary separation offers. Alternative training initiatives have been implemented, including the streamlining of mandatory training to ensure that the number of managers trained in occupational safety, health and injury management is at appropriate levels.
CONTENTS OVERVIEWAGENCY
PERFORMANCEFINANCIAL
STATEMENTSKEY PERFORMANCE
INDICATORS DISCLOSURES APPENDIX
Department of Finance Annual Report 2016-17116
MINISTER FOR FINANCE
State RevenueCommonwealth Places (Mirror Taxes Administration) Act 1999Duties Act 2008First Home Owner Grant Act 2000First Home Owner Grant Amendment Act 2003Land Tax Act 2002Land Tax Assessment Act 2002Pay-roll Tax Act 2002Pay-roll Tax Assessment Act 2002Pay-roll Tax Rebate Act 2010Pay-roll Tax (Indigenous Wages) Rebate Act 2012Pay-roll Tax Rebate Act 2012Rates and Charges (Rebates and Deferments) Act 1992Stamp Act 1921Stamp Amendment (Assessment) Act 2005Stamp Amendment (Budget) Act 2002Taxation Administration (Consequential Provisions) Act 2002Taxation Administration Act 2003
Government ProcurementState Supply Commission Act 1991
Building Management and WorksPublic Works Act 1902Sunset Reserve Transformation Act 2014
MINISTER FOR ENERGY
Public Utilities OfficeDampier to Bunbury Pipeline Act 1997Electricity Corporations Act 2005Electricity Industry Act 2004 (except Part 9A)Electricity Transmission and Distribution Systems (Access) Act 1994Energy Arbitration and Review Act 1998Energy Coordination Act 1994 (except Parts 2 and 3)Energy Corporations (Transitional and Consequential Provisions) Act 1994Energy Operators (Powers) Act 1979Fuel, Energy and Power Resources Act 1972Gas Corporation (Business Disposal) Act 1999Gas Services Information Act 2012Gas Supply (Gas Quality Specifications) Act 2009 (except Part 5, Division 2)National Gas Access (WA) Act 2009State Energy Commission (Validation) Act 1978
Legislation Administered
CONTENTS OVERVIEWAGENCY
PERFORMANCEFINANCIAL
STATEMENTSKEY PERFORMANCE
INDICATORS DISCLOSURES APPENDIX

117Department of Finance Annual Report 2016-17
Postal address:Locked Bag 11Cloisters Square WA 6850
Building Management and Works
Optima Centre 16 Parkland Road Osborne Park WA 6017
Postal address:Locked Bag 44 Cloisters Square WA 6850
Phone: 08 6551 1600
Government Procurement
Optima Centre 16 Parkland RoadOsborne Park WA 6017
Postal address:Locked Bag 11Cloisters Square WA 6850
Phone: 08 6551 1555
Main switchboard: 08 6551 1000Main fax: 08 6551 1111Internet: www.finance.wa.gov.au
Economic Reform
Albert Facey House 469 Wellington StreetPerth WA 6000
Postal address:Locked Bag 11Cloisters Square WA 6850
Phone: 08 6551 1000
State Revenue
QBE House 200 St Georges Terrace Perth WA 6000
Postal address: GPO Box T1600 Perth WA 6845
Switch: 08 9262 1400
WA Country Callers: 1300 368 364
Public Utilities Office
Albert Facey House 469 Wellington StreetPerth WA 6000
Postal address:Locked Bag 11Cloisters Square WA 6850
Phone: 08 6551 1000
Fax: 08 6551 4765
General Contacts
Business Units
CONTENTS OVERVIEWAGENCY
PERFORMANCEFINANCIAL
STATEMENTSKEY PERFORMANCE
INDICATORS DISCLOSURES APPENDIX