department of employment services annual report … · wioa and local training by demographics (age...
TRANSCRIPT
DEPARTMENT OF EMPLOYMENT SERVICES ANNUAL REPORTFiscal Year 2017
The Department of Employment Services is an Equal Opportunity Employer/Provider. Auxiliary aids and services are available upon request to persons with disabilities.
DEPARTMENT OF EMPLOYMENT SERVICES ANNUAL REPORT
1
TABLE OF CONTENTSI. Letter from the Director 2II. Executive Summary and Highlights 3III. Economic Situation in the District and the Greater Washington Region 6 1. Employment Data 7 a. Average Unemployment Rate for D.C., by Ward and for the Greater Washington Region 7 b. Total Number of Private Sector Jobs for D.C., and for the Greater Washington Region 8 2. Quarterly Census of Employment and Wages (QCEW) 12 a. Annual Establishments, Annual Average Employment, and Annual Weekly Wage 12 b. Private Sector by Establishments, Size and Class 13IV. Labor Market Demand in the District and the Greater Washington Region 15 1. Total Number of Job Postings by Occupation 16 2. Total Number of Job Postings by Sector 18 3. D.C., Hot Jobs 20V. Income and Poverty by Demographics 21 1. Income Inequality in D.C. 22 2. Gender Gap in D.C. 23VI. DOES Services 24 1. DOES Employment Outcomes (Quarterly Number of Employed, Total Quarterly Wages and Average and Median Quarterly Wages) 25 2. WIOA and Local Participants by Demographics (Age, Gender, Education, Disability, Ward, Veteran Status, etc.) 25 3. WIOA and Local Training by Demographics (Age, Gender, Education, Disability, Ward, Veteran Status, etc.) 28VII. DOES Services Expenditures 32VIII. Conclusion and Findings 36IX. Programming & Rewarding Reactions 38
DC Infrastructure Academy (DCIA) 39Apprenticeship D.C. 39MBSYEP - Mayor’s Opportunity Scholarship (MOS) 40MBSYEP Disability 40Aspire to Entrepreneurship 40
Transitional Residential Program (TRP) 40Security Cameras 41On-the-Job (OJT) Training 41Quick Path to Energy (QPE) 42Quick Path to Transportation (QPT) 42Project Empowerment 42Project Empowerment Rewarding Reactions 43Back to Work 50+ 45Back to Work 50+ Rewarding Reactions 45Learn, Earn, Advance, Prosper (LEAP) Academy 46Mayor Marion S. Barry Summer Youth Employment Program (MBSYEP) 47Mayor Marion S. Barry Summer Youth Employment Program (MBSYEP) Rewarding Reactions 47
FISCAL YEAR 2017
2
TABLE OF CONTENTSI. Letter from the Director 2II. Executive Summary and Highlights 3III. Economic Situation in the District and the Greater Washington Region 6 1. Employment Data 7 a. Average Unemployment Rate for D.C., by Ward and for the Greater Washington Region 7 b. Total Number of Private Sector Jobs for D.C., and for the Greater Washington Region 8 2. Quarterly Census of Employment and Wages (QCEW) 12 a. Annual Establishments, Annual Average Employment, and Annual Weekly Wage 12 b. Private Sector by Establishments, Size and Class 13IV. Labor Market Demand in the District and the Greater Washington Region 15 1. Total Number of Job Postings by Occupation 16 2. Total Number of Job Postings by Sector 18 3. D.C., Hot Jobs 20V. Income and Poverty by Demographics 21 1. Income Inequality in D.C. 22 2. Gender Gap in D.C. 23VI. DOES Services 24 1. DOES Employment Outcomes (Quarterly Number of Employed, Total Quarterly Wages and Average and Median Quarterly Wages) 25 2. WIOA and Local Participants by Demographics (Age, Gender, Education, Disability, Ward, Veteran Status, etc.) 25 3. WIOA and Local Training by Demographics (Age, Gender, Education, Disability, Ward, Veteran Status, etc.) 28VII. DOES Services Expenditures 32VIII. Conclusion and Findings 36IX. Programming & Rewarding Reactions 38
DC Infrastructure Academy (DCIA) 39Apprenticeship D.C. 39MBSYEP - Mayor’s Opportunity Scholarship (MOS) 40MBSYEP Disability 40Aspire to Entrepreneurship 40
Transitional Residential Program (TRP) 40Security Cameras 41On-the-Job (OJT) Training 41Quick Path to Energy (QPE) 42Quick Path to Transportation (QPT) 42Project Empowerment 42Project Empowerment Rewarding Reactions 43Back to Work 50+ 45Back to Work 50+ Rewarding Reactions 45Learn, Earn, Advance, Prosper (LEAP) Academy 46Mayor Marion S. Barry Summer Youth Employment Program (MBSYEP) 47Mayor Marion S. Barry Summer Youth Employment Program (MBSYEP) Rewarding Reactions 47
LETTER FROM THE DIRECTOR
Dear Washingtonians:
As the Director of the Department of Employment Services (DOES) I have the honor of carrying out the vision of the Honorable Mayor Muriel Bowser, to ensure that District residents have a clear pathway to the middle class.
This annual report was designed to analyze the efforts and impact of the agency in FY17, hone in on future customer needs, and highlight the impact of strategic workforce investments on the overall economy. The Bowser Administration’s focus on continuous quality improvement, key feedback from businesses and residents, along with the infusion of new programming has had quality results.
We are proud to have the opportunity to empower job seekers, motivate young adults, and create opportunities for businesses to easily source talent from the nation’s most skilled workforce. The improved service delivery exemplified during the Bowser Administration has renewed business confidence in our workforce, and encouraged residents to access the training and employment services necessary to benefit from our growing economy. While we are excited about the progress made to date, we are committed to the continued improvement and innovative service delivery necessary to create a better Department of Employment Services and a better Washington, D.C.
In Service,
Odie Donald IIDirector
DEPARTMENT OF EMPLOYMENT SERVICES ANNUAL REPORT
3
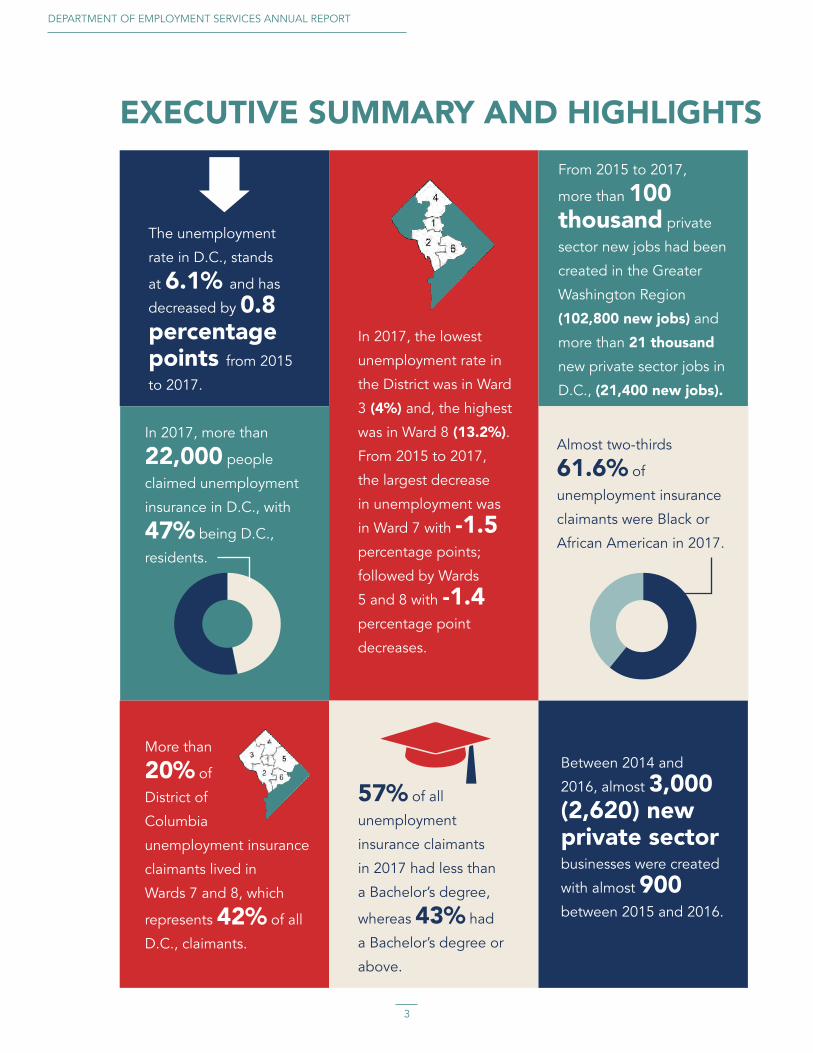
EXECUTIVE SUMMARY AND HIGHLIGHTS
In 2017, the lowest
unemployment rate in
the District was in Ward
3 (4%) and, the highest
was in Ward 8 (13.2%). From 2015 to 2017,
the largest decrease
in unemployment was
in Ward 7 with -1.5 percentage points; followed by Wards
5 and 8 with -1.4 percentage point decreases.
The unemployment
rate in D.C., stands
at 6.1% and has
decreased by 0.8 percentage points from 2015
to 2017.
From 2015 to 2017,
more than 100 thousand private
sector new jobs had been
created in the Greater
Washington Region
(102,800 new jobs) and
more than 21 thousand
new private sector jobs in
D.C., (21,400 new jobs).
In 2017, more than
22,000 people
claimed unemployment
insurance in D.C., with
47% being D.C.,
residents.
More than
20% of
District of
Columbia
unemployment insurance
claimants lived in
Wards 7 and 8, which
represents 42% of all
D.C., claimants.
Between 2014 and
2016, almost 3,000 (2,620) new private sector
businesses were created
with almost 900
between 2015 and 2016.
Almost two-thirds
61.6% of
unemployment insurance
claimants were Black or
African American in 2017.
57% of all
unemployment
insurance claimants
in 2017 had less than
a Bachelor’s degree,
whereas 43% had
a Bachelor’s degree or
above.
FISCAL YEAR 2017
4
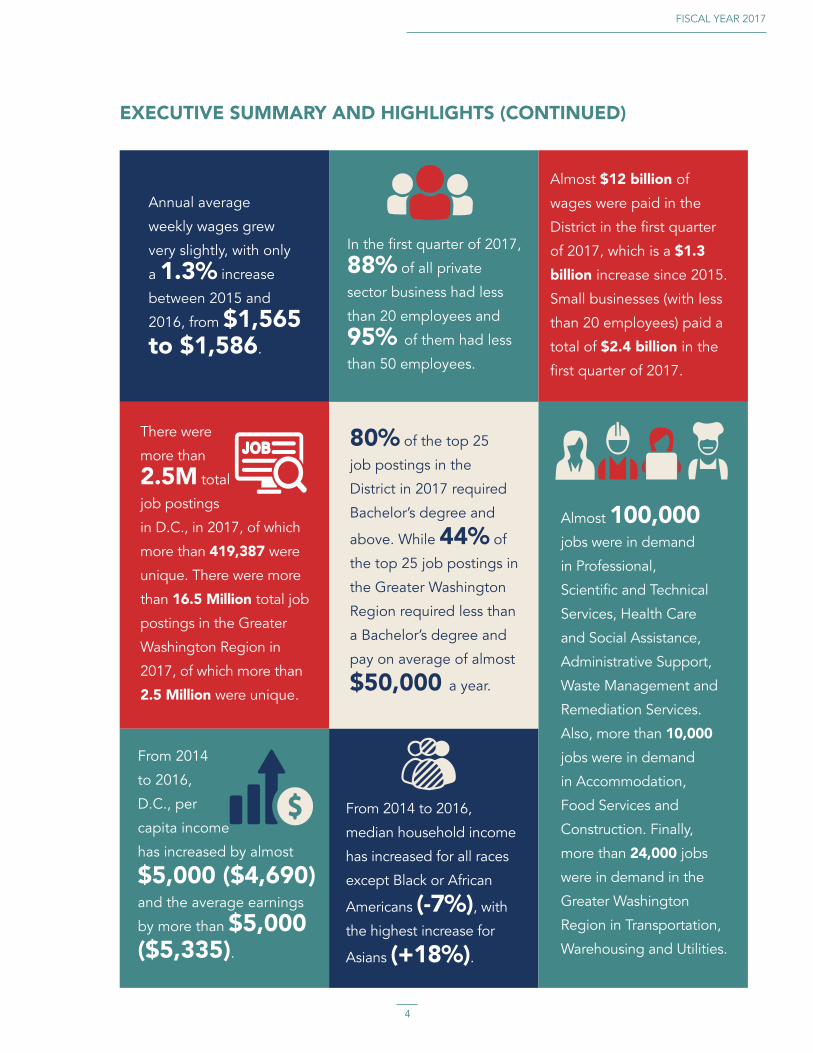
Annual average
weekly wages grew
very slightly, with only
a 1.3% increase
between 2015 and
2016, from $1,565 to $1,586.
In the first quarter of 2017,
88% of all private
sector business had less
than 20 employees and
95% of them had less
than 50 employees.
Almost $12 billion of
wages were paid in the
District in the first quarter
of 2017, which is a $1.3 billion increase since 2015.
Small businesses (with less
than 20 employees) paid a
total of $2.4 billion in the
first quarter of 2017.
There were
more than
2.5M total
job postings
in D.C., in 2017, of which
more than 419,387 were
unique. There were more
than 16.5 Million total job
postings in the Greater
Washington Region in
2017, of which more than
2.5 Million were unique.
80% of the top 25
job postings in the
District in 2017 required
Bachelor’s degree and
above. While 44% of
the top 25 job postings in
the Greater Washington
Region required less than
a Bachelor’s degree and
pay on average of almost
$50,000 a year.
Almost 100,000 jobs were in demand
in Professional,
Scientific and Technical
Services, Health Care
and Social Assistance,
Administrative Support,
Waste Management and
Remediation Services.
Also, more than 10,000 jobs were in demand
in Accommodation,
Food Services and
Construction. Finally,
more than 24,000 jobs
were in demand in the
Greater Washington
Region in Transportation,
Warehousing and Utilities.
From 2014
to 2016,
D.C., per
capita income
has increased by almost
$5,000 ($4,690) and the average earnings
by more than $5,000 ($5,335).
From 2014 to 2016,
median household income
has increased for all races
except Black or African
Americans (-7%), with
the highest increase for
Asians (+18%).
EXECUTIVE SUMMARY AND HIGHLIGHTS (CONTINUED)

DEPARTMENT OF EMPLOYMENT SERVICES ANNUAL REPORT
5
In 2016, median household
income for Whites was
3.3 times higher than
median household income
for Black or African
Americans ($125,747 vs. $37,891).
Median income for both males and
females has been increasing for
the last three years with a 9%
and 6% increase respectively.
Meanwhile, the female/male ratio
was constant for the same period
of time, meaning female income is
90% of male income. Therefore, the wage gap in D.C., is very low.
Average quarterly wages
paid for the last three fiscal
years to DOES participants
has increased by more
than $800 or 14%.
Total wages paid for the
last three fiscal years to
DOES participants is
$1,086,487,991
with an average quarterly
wage of $6,125.
For the last three fiscal
years, DOES provided
more than 317,000
services to more than
103,000 people.
For the same period of
time, the total number of
people served decreased
by 4%, whereas the
total number of services
increased by 30%.
Overall, more than
122,000 District
residents lived below
poverty in 2016 with
8% being White, 28%
Black and 18% Hispanic.
Finally, 14,190 more women than men
lived in poverty in 2016.
EXECUTIVE SUMMARY AND HIGHLIGHTS (CONTINUED)
FISCAL YEAR 2017
6
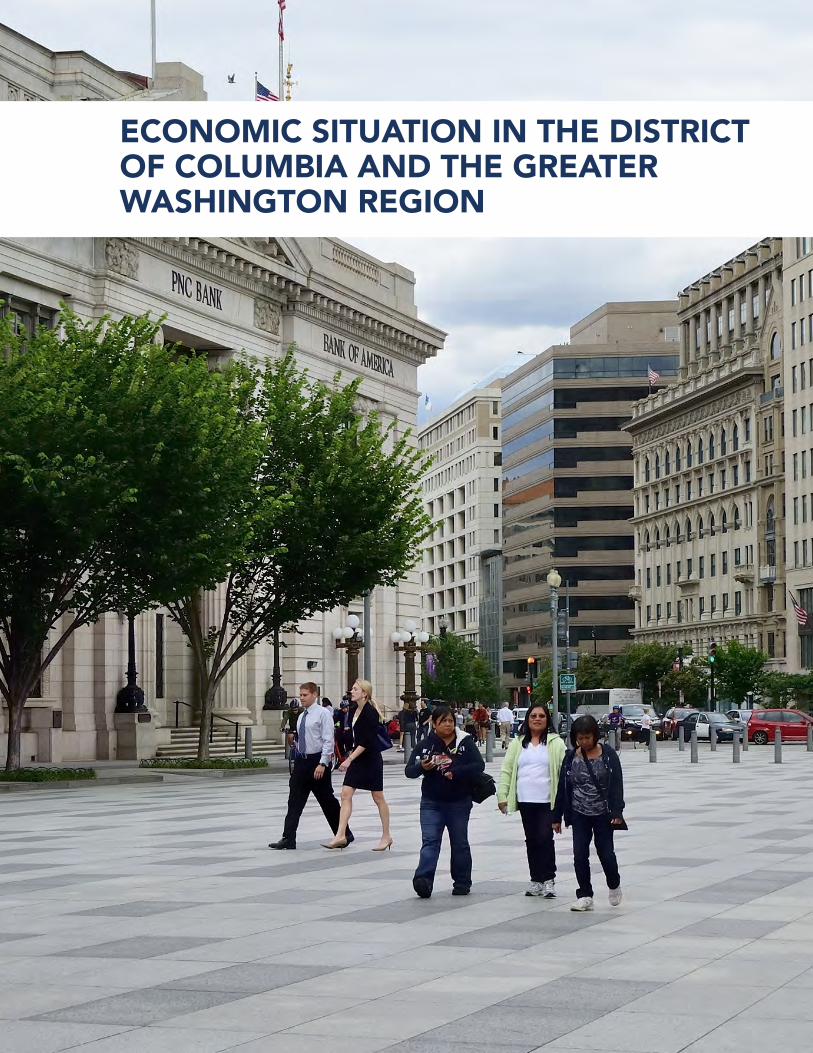
ECONOMIC SITUATION IN THE DISTRICT OF COLUMBIA AND THE GREATER WASHINGTON REGION
DEPARTMENT OF EMPLOYMENT SERVICES ANNUAL REPORT
7
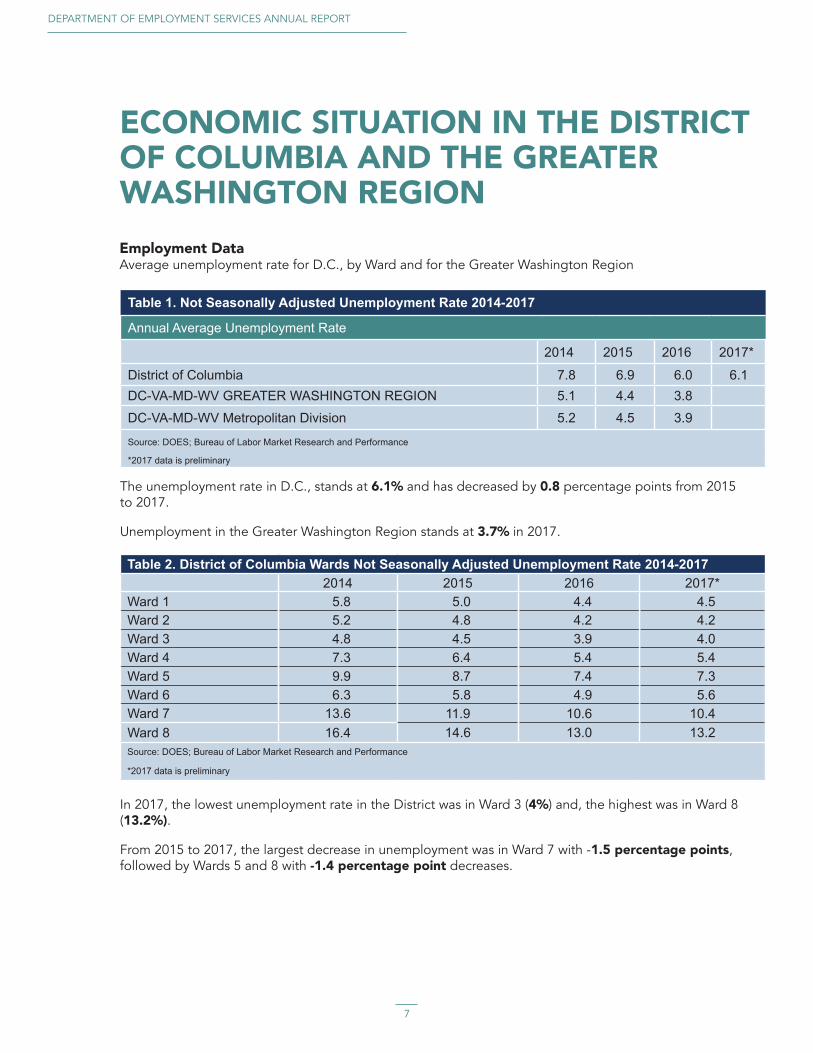
ECONOMIC SITUATION IN THE DISTRICT OF COLUMBIA AND THE GREATER WASHINGTON REGIONEmployment DataAverage unemployment rate for D.C., by Ward and for the Greater Washington Region
The unemployment rate in D.C., stands at 6.1% and has decreased by 0.8 percentage points from 2015 to 2017.
Unemployment in the Greater Washington Region stands at 3.7% in 2017.
Table 1. Not Seasonally Adjusted Unemployment Rate 2014-2017
Annual Average Unemployment Rate
2014 2015 2016 2017*
District of Columbia 7.8 6.9 6.0 6.1DC-VA-MD-WV GREATER WASHINGTON REGION 5.1 4.4 3.8 DC-VA-MD-WV Metropolitan Division 5.2 4.5 3.9
Source: DOES; Bureau of Labor Market Research and Performance
*2017 data is preliminary
Table 2. District of Columbia Wards Not Seasonally Adjusted Unemployment Rate 2014-2017 2014 2015 2016 2017*Ward 1 5.8 5.0 4.4 4.5Ward 2 5.2 4.8 4.2 4.2Ward 3 4.8 4.5 3.9 4.0Ward 4 7.3 6.4 5.4 5.4Ward 5 9.9 8.7 7.4 7.3Ward 6 6.3 5.8 4.9 5.6Ward 7 13.6 11.9 10.6 10.4Ward 8 16.4 14.6 13.0 13.2Source: DOES; Bureau of Labor Market Research and Performance
*2017 data is preliminary
In 2017, the lowest unemployment rate in the District was in Ward 3 (4%) and, the highest was in Ward 8 (13.2%).
From 2015 to 2017, the largest decrease in unemployment was in Ward 7 with -1.5 percentage points, followed by Wards 5 and 8 with -1.4 percentage point decreases.

FISCAL YEAR 2017
8
Table 3. Current Employment Statistics (CES) Not Seasonally Adjusted Private Sector Employment 2014-2017
Annual Average Employment (In Thousands)
2014 2015 2016 2017*District of Columbia 518.1 531.3 542.8 552.7DC-VA-MD-WV GREATER WASHINGTON REGION 2,427.9 2,482.3 2,533.8 2,585.1DC-VA-MD-WV Metropolitan Division 1,955.0 2,003.3 2,050.5 2,093.2Source: DOES; Bureau of Labor Market Research and Performance using BLS/Current Employment Statistics
*2017 data is preliminary
Total number of private sector jobs for D.C., and for the Greater Washington Region
From 2015 to 2017, more than 100,000 private sector new jobs had been created in the Greater Washington Region (102,800 new jobs).
More than 21,000 new private sector jobs had been created in D.C., during the same period of time (21,400 new jobs).
Total number of UI Claimants in D.C., by demographics (Age, gender, Education, Disability, Ward, Veteran status, etc.)
Table 4. Fiscal Year 2015-2017 UI Claimants by Age Group
Number % of Total
Age Group 2015 2016 2017 2015 2016 2017
16-19 72 68 75 0.3% 0.4% 0.3%
20-24 1,717 1,177 1,544 8.2% 7.5% 6.9%
25-34 6,143 4,330 6,599 29.2% 27.5% 29.6%
35-44 4,629 3,540 5,171 22.0% 22.5% 23.2%
45-54 4,607 3,442 4,577 21.9% 21.9% 20.5%
55-64 3,238 2,612 3,552 15.4% 16.6% 15.9%
65 and Over 651 564 806 3.1% 3.6% 3.6%
Total 21,057 15,733 22,324 100.0% 100.0% 100.0%
Source: DOES; Bureau of Labor Market Research and Performance
DEPARTMENT OF EMPLOYMENT SERVICES ANNUAL REPORT
9
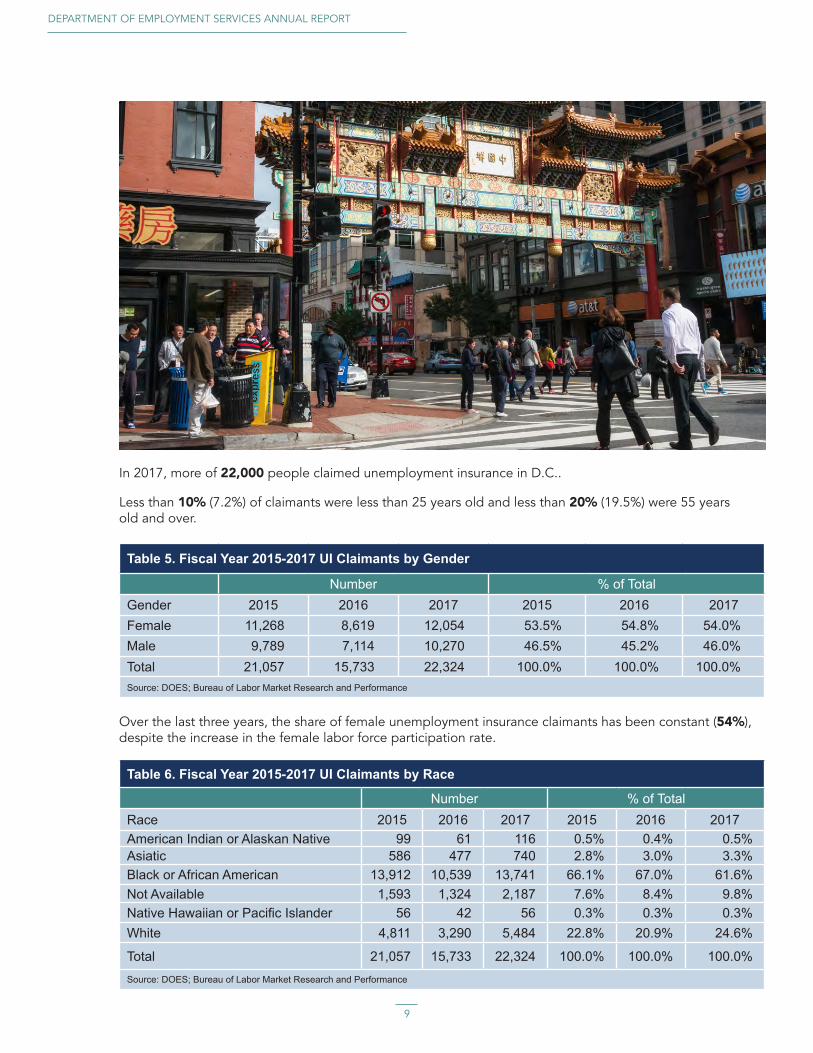
In 2017, more of 22,000 people claimed unemployment insurance in D.C..
Less than 10% (7.2%) of claimants were less than 25 years old and less than 20% (19.5%) were 55 years old and over.
Table 5. Fiscal Year 2015-2017 UI Claimants by Gender
Number % of TotalGender 2015 2016 2017 2015 2016 2017Female 11,268 8,619 12,054 53.5% 54.8% 54.0%Male 9,789 7,114 10,270 46.5% 45.2% 46.0%Total 21,057 15,733 22,324 100.0% 100.0% 100.0%Source: DOES; Bureau of Labor Market Research and Performance
Table 6. Fiscal Year 2015-2017 UI Claimants by Race
Number % of TotalRace 2015 2016 2017 2015 2016 2017American Indian or Alaskan Native 99 61 116 0.5% 0.4% 0.5%Asiatic 586 477 740 2.8% 3.0% 3.3%Black or African American 13,912 10,539 13,741 66.1% 67.0% 61.6%Not Available 1,593 1,324 2,187 7.6% 8.4% 9.8%Native Hawaiian or Pacific Islander 56 42 56 0.3% 0.3% 0.3%White 4,811 3,290 5,484 22.8% 20.9% 24.6%
Total 21,057 15,733 22,324 100.0% 100.0% 100.0%Source: DOES; Bureau of Labor Market Research and Performance
Over the last three years, the share of female unemployment insurance claimants has been constant (54%), despite the increase in the female labor force participation rate.
FISCAL YEAR 2017
10
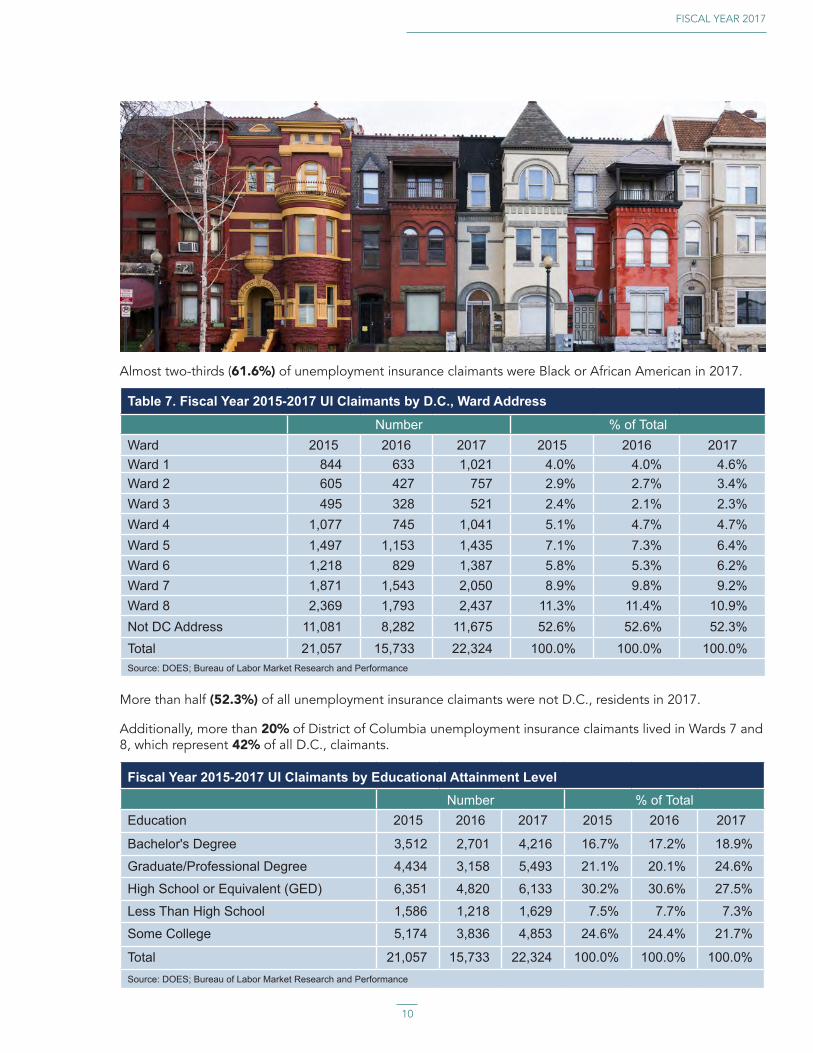
Table 7. Fiscal Year 2015-2017 UI Claimants by D.C., Ward Address
Number % of TotalWard 2015 2016 2017 2015 2016 2017Ward 1 844 633 1,021 4.0% 4.0% 4.6%Ward 2 605 427 757 2.9% 2.7% 3.4%Ward 3 495 328 521 2.4% 2.1% 2.3%Ward 4 1,077 745 1,041 5.1% 4.7% 4.7%Ward 5 1,497 1,153 1,435 7.1% 7.3% 6.4%Ward 6 1,218 829 1,387 5.8% 5.3% 6.2%Ward 7 1,871 1,543 2,050 8.9% 9.8% 9.2%Ward 8 2,369 1,793 2,437 11.3% 11.4% 10.9%Not DC Address 11,081 8,282 11,675 52.6% 52.6% 52.3%Total 21,057 15,733 22,324 100.0% 100.0% 100.0%Source: DOES; Bureau of Labor Market Research and Performance
Almost two-thirds (61.6%) of unemployment insurance claimants were Black or African American in 2017.
Fiscal Year 2015-2017 UI Claimants by Educational Attainment Level Number % of TotalEducation 2015 2016 2017 2015 2016 2017
Bachelor's Degree 3,512 2,701 4,216 16.7% 17.2% 18.9%
Graduate/Professional Degree 4,434 3,158 5,493 21.1% 20.1% 24.6%
High School or Equivalent (GED) 6,351 4,820 6,133 30.2% 30.6% 27.5%
Less Than High School 1,586 1,218 1,629 7.5% 7.7% 7.3%
Some College 5,174 3,836 4,853 24.6% 24.4% 21.7%
Total 21,057 15,733 22,324 100.0% 100.0% 100.0%Source: DOES; Bureau of Labor Market Research and Performance
More than half (52.3%) of all unemployment insurance claimants were not D.C., residents in 2017.
Additionally, more than 20% of District of Columbia unemployment insurance claimants lived in Wards 7 and 8, which represent 42% of all D.C., claimants.
DEPARTMENT OF EMPLOYMENT SERVICES ANNUAL REPORT
11
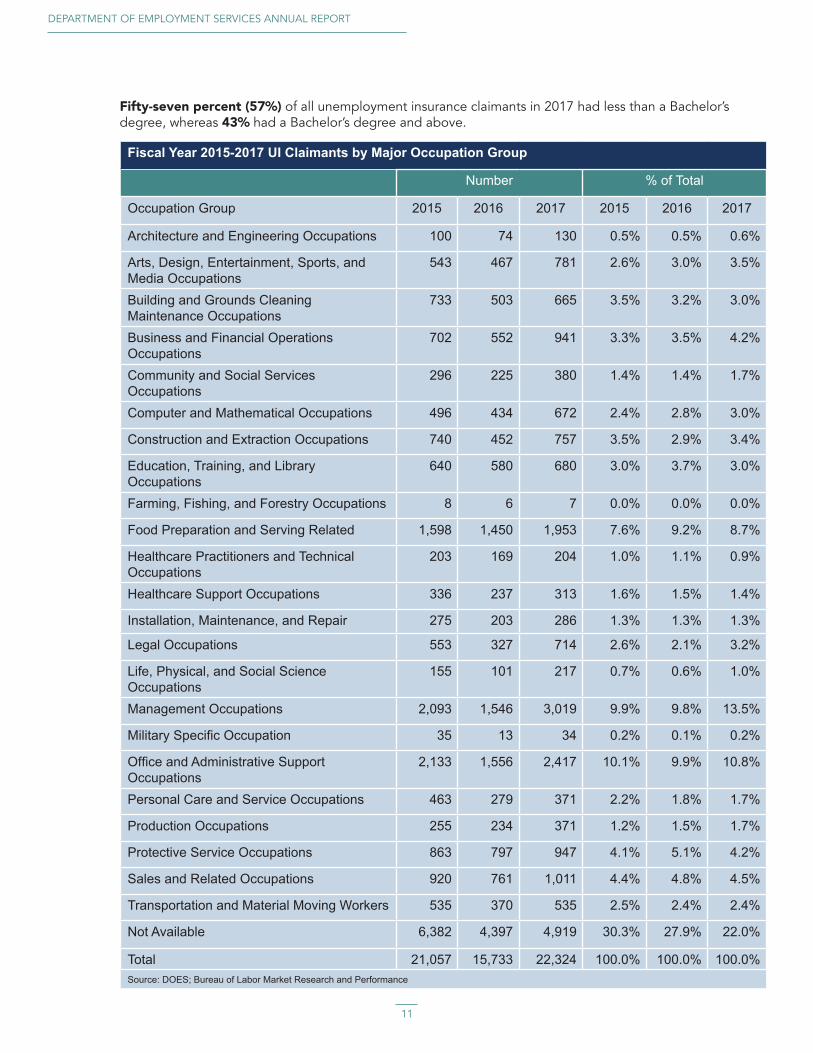
Fiscal Year 2015-2017 UI Claimants by Major Occupation Group
Number % of Total
Occupation Group 2015 2016 2017 2015 2016 2017
Architecture and Engineering Occupations 100 74 130 0.5% 0.5% 0.6%
Arts, Design, Entertainment, Sports, and Media Occupations
543 467 781 2.6% 3.0% 3.5%
Building and Grounds Cleaning Maintenance Occupations
733 503 665 3.5% 3.2% 3.0%
Business and Financial Operations Occupations
702 552 941 3.3% 3.5% 4.2%
Community and Social Services Occupations
296 225 380 1.4% 1.4% 1.7%
Computer and Mathematical Occupations 496 434 672 2.4% 2.8% 3.0%
Construction and Extraction Occupations 740 452 757 3.5% 2.9% 3.4%
Education, Training, and Library Occupations
640 580 680 3.0% 3.7% 3.0%
Farming, Fishing, and Forestry Occupations 8 6 7 0.0% 0.0% 0.0%
Food Preparation and Serving Related 1,598 1,450 1,953 7.6% 9.2% 8.7%
Healthcare Practitioners and Technical Occupations
203 169 204 1.0% 1.1% 0.9%
Healthcare Support Occupations 336 237 313 1.6% 1.5% 1.4%
Installation, Maintenance, and Repair 275 203 286 1.3% 1.3% 1.3%
Legal Occupations 553 327 714 2.6% 2.1% 3.2%
Life, Physical, and Social Science Occupations
155 101 217 0.7% 0.6% 1.0%
Management Occupations 2,093 1,546 3,019 9.9% 9.8% 13.5%
Military Specific Occupation 35 13 34 0.2% 0.1% 0.2%
Office and Administrative Support Occupations
2,133 1,556 2,417 10.1% 9.9% 10.8%
Personal Care and Service Occupations 463 279 371 2.2% 1.8% 1.7%
Production Occupations 255 234 371 1.2% 1.5% 1.7%
Protective Service Occupations 863 797 947 4.1% 5.1% 4.2%
Sales and Related Occupations 920 761 1,011 4.4% 4.8% 4.5%
Transportation and Material Moving Workers 535 370 535 2.5% 2.4% 2.4%
Not Available 6,382 4,397 4,919 30.3% 27.9% 22.0%
Total 21,057 15,733 22,324 100.0% 100.0% 100.0%Source: DOES; Bureau of Labor Market Research and Performance
Fifty-seven percent (57%) of all unemployment insurance claimants in 2017 had less than a Bachelor’s degree, whereas 43% had a Bachelor’s degree and above.
FISCAL YEAR 2017
12
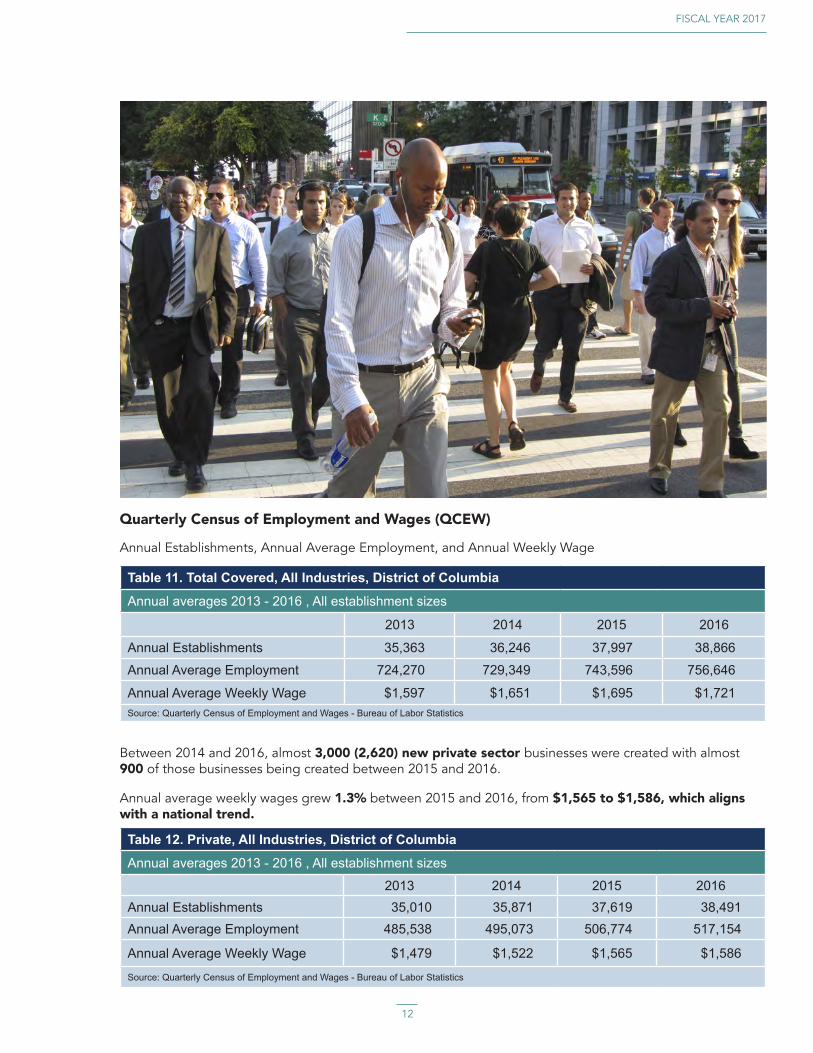
Table 11. Total Covered, All Industries, District of Columbia
Annual averages 2013 - 2016 , All establishment sizes
2013 2014 2015 2016
Annual Establishments 35,363 36,246 37,997 38,866
Annual Average Employment 724,270 729,349 743,596 756,646
Annual Average Weekly Wage $1,597 $1,651 $1,695 $1,721Source: Quarterly Census of Employment and Wages - Bureau of Labor Statistics
Table 12. Private, All Industries, District of Columbia
Annual averages 2013 - 2016 , All establishment sizes
2013 2014 2015 2016Annual Establishments 35,010 35,871 37,619 38,491Annual Average Employment 485,538 495,073 506,774 517,154
Annual Average Weekly Wage $1,479 $1,522 $1,565 $1,586
Source: Quarterly Census of Employment and Wages - Bureau of Labor Statistics
Quarterly Census of Employment and Wages (QCEW)
Annual Establishments, Annual Average Employment, and Annual Weekly Wage
Between 2014 and 2016, almost 3,000 (2,620) new private sector businesses were created with almost 900 of those businesses being created between 2015 and 2016.
Annual average weekly wages grew 1.3% between 2015 and 2016, from $1,565 to $1,586, which aligns with a national trend.

DEPARTMENT OF EMPLOYMENT SERVICES ANNUAL REPORT
13
Table 13. Private Sector, District of Columbia
2015-2017 First Quarter, By Establishment Size Class
Quarterly Establishments
Industry Size Class 2015 Q1 2016 Q1 2017 Q1
All industries All sizes 36,681 38,027 38,994
All industries Fewer than 5 25,314 26,379 27,172
All industries 5 to 9 4,163 4,252 4,287
All industries 10 to 19 3,012 3,094 3,161All industries 20 to 49 2,416 2,470 2,536All industries 50 to 99 946 973 959All industries 100 to 249 564 583 598
All industries 250 to 499 182 187 194
All industries 500 to 999 51 59 56
All industries 1000 or more 33 30 31Source: Quarterly Census of Employment and Wages - Bureau of Labor Statistics
Private Sector by Establishment Size Class
FISCAL YEAR 2017
14
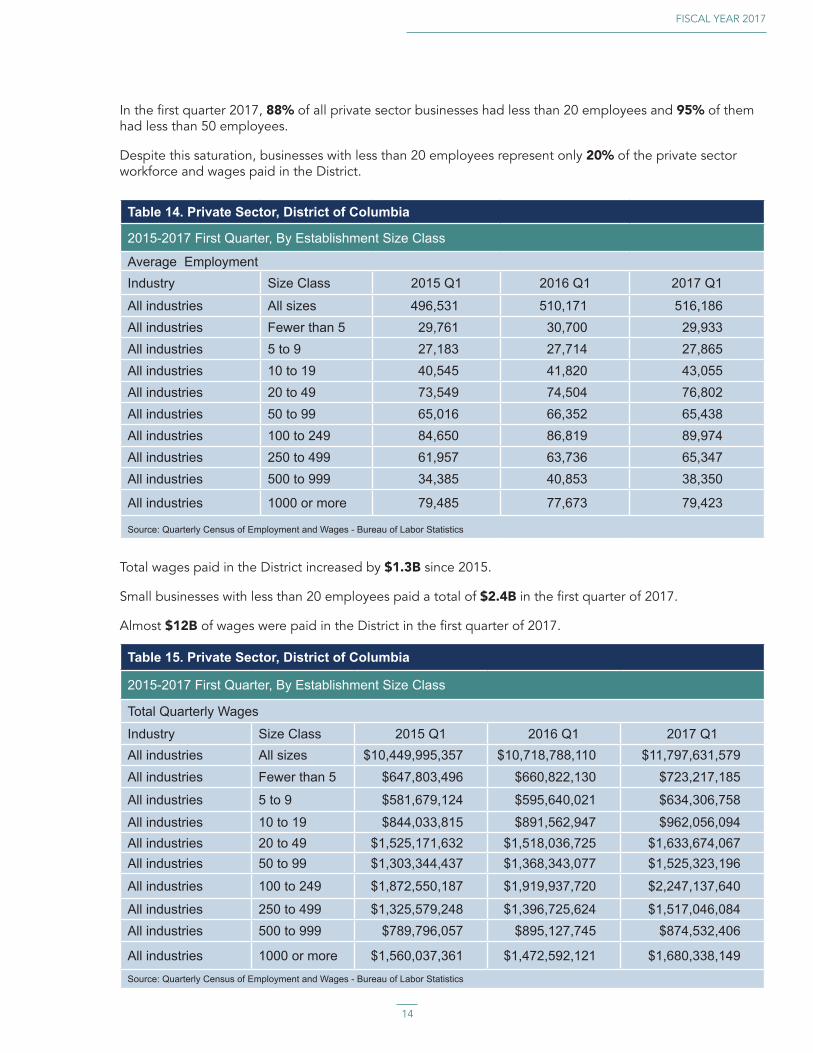
In the first quarter 2017, 88% of all private sector businesses had less than 20 employees and 95% of them had less than 50 employees.
Despite this saturation, businesses with less than 20 employees represent only 20% of the private sector workforce and wages paid in the District.
Table 14. Private Sector, District of Columbia
2015-2017 First Quarter, By Establishment Size Class
Average EmploymentIndustry Size Class 2015 Q1 2016 Q1 2017 Q1
All industries All sizes 496,531 510,171 516,186All industries Fewer than 5 29,761 30,700 29,933All industries 5 to 9 27,183 27,714 27,865All industries 10 to 19 40,545 41,820 43,055All industries 20 to 49 73,549 74,504 76,802All industries 50 to 99 65,016 66,352 65,438All industries 100 to 249 84,650 86,819 89,974All industries 250 to 499 61,957 63,736 65,347All industries 500 to 999 34,385 40,853 38,350
All industries 1000 or more 79,485 77,673 79,423
Source: Quarterly Census of Employment and Wages - Bureau of Labor Statistics
Total wages paid in the District increased by $1.3B since 2015.
Small businesses with less than 20 employees paid a total of $2.4B in the first quarter of 2017.
Almost $12B of wages were paid in the District in the first quarter of 2017.
Table 15. Private Sector, District of Columbia
2015-2017 First Quarter, By Establishment Size Class
Total Quarterly Wages
Industry Size Class 2015 Q1 2016 Q1 2017 Q1All industries All sizes $10,449,995,357 $10,718,788,110 $11,797,631,579All industries Fewer than 5 $647,803,496 $660,822,130 $723,217,185
All industries 5 to 9 $581,679,124 $595,640,021 $634,306,758
All industries 10 to 19 $844,033,815 $891,562,947 $962,056,094All industries 20 to 49 $1,525,171,632 $1,518,036,725 $1,633,674,067All industries 50 to 99 $1,303,344,437 $1,368,343,077 $1,525,323,196
All industries 100 to 249 $1,872,550,187 $1,919,937,720 $2,247,137,640
All industries 250 to 499 $1,325,579,248 $1,396,725,624 $1,517,046,084All industries 500 to 999 $789,796,057 $895,127,745 $874,532,406
All industries 1000 or more $1,560,037,361 $1,472,592,121 $1,680,338,149Source: Quarterly Census of Employment and Wages - Bureau of Labor Statistics

DEPARTMENT OF EMPLOYMENT SERVICES ANNUAL REPORT
15
LABOR MARKET DEMAND IN THE DISTRICT AND THE GREATER WASHINGTON REGION

FISCAL YEAR 2017
16
LABOR MARKET DEMAND IN THE DISTRICT AND THE GREATER WASHINGTON REGIONTotal Number of Job Postings by Occupation
2017 Top 25 D.C., Job Postings
Rank Title Average *Education **Wages1 Computer occupations, all other 12,763 Bachelor's degree $116,1502 Registered nurses 11,153 Bachelor's degree $80,0103 Software developers, applications 9,007 Bachelor's degree $112,8304 Management analysts 8,476 Bachelor's degree $98,2605 Information security analysts 7,712 Bachelor's degree $119,560
6Network and computer systems administrators 7,463 Bachelor's degree $93,320
7 Managers, all other 6,793 Bachelor's degree $130,6908 Computer user support specialists 6,538 Some college, no degree $60,4809 Computer systems analysts 5,462 Bachelor's degree $99,030
10 Accountants and auditors 5,135 Bachelor's degree $86,460
11Business operations specialists, all other 4,521 Bachelor's degree $92,980
12Executive secretaries and executive administrative assistants 4,135 High school diploma or equivalent $66,080
13 Sales managers 3,680 Bachelor's degree $116,13014 Lawyers 3,673 Doctoral or professional degree $160,29015 Web developers 3,645 Associate's degree $85,300
16First-line supervisors of office and administrative support workers 3,232 High school diploma or equivalent $73,280
17 Marketing managers 3,192 Bachelor's degree $150,760
18Market research analysts and marketing specialists 3,095 Bachelor's degree $64,690
19 Public relations specialists 2,978 Bachelor's degree $78,17020 Computer programmers 2,865 Bachelor's degree $93,44021 Financial managers 2,812 Bachelor's degree $141,560
22Public relations and fundraising managers 2,769 Bachelor's degree $148,140
23
Secretaries and administrative assistants, except legal, medical, and executive 2,669 High school diploma or equivalent $46,760
24 Human resources specialists 2,240 Bachelor's degree $91,940
25 Database administrators 2,195 Bachelor's degree $102,890Source: Labor Market Research; EMSI; D.C., Networks; Burning Glass; *Source: BLS **Source: OES May 2016
DEPARTMENT OF EMPLOYMENT SERVICES ANNUAL REPORT
17
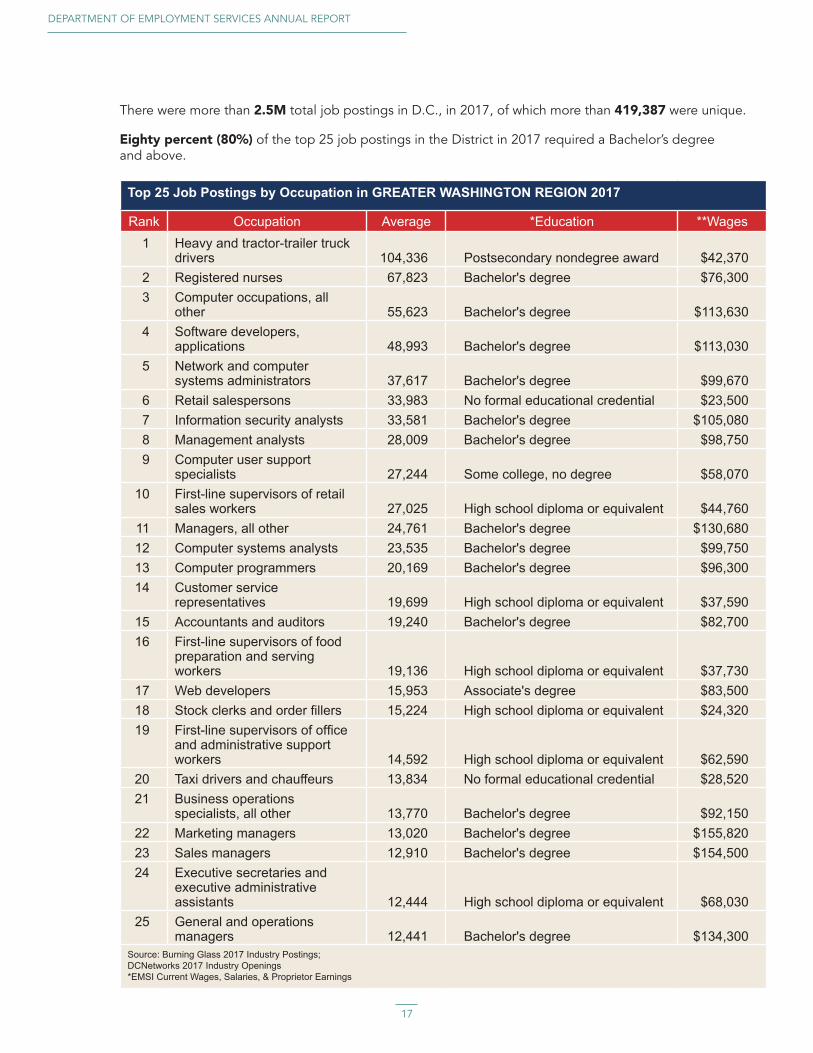
There were more than 2.5M total job postings in D.C., in 2017, of which more than 419,387 were unique.
Eighty percent (80%) of the top 25 job postings in the District in 2017 required a Bachelor’s degree and above.
Top 25 Job Postings by Occupation in GREATER WASHINGTON REGION 2017
Rank Occupation Average *Education **Wages1 Heavy and tractor-trailer truck
drivers 104,336 Postsecondary nondegree award $42,3702 Registered nurses 67,823 Bachelor's degree $76,3003 Computer occupations, all
other 55,623 Bachelor's degree $113,6304 Software developers,
applications 48,993 Bachelor's degree $113,0305 Network and computer
systems administrators 37,617 Bachelor's degree $99,6706 Retail salespersons 33,983 No formal educational credential $23,5007 Information security analysts 33,581 Bachelor's degree $105,0808 Management analysts 28,009 Bachelor's degree $98,7509 Computer user support
specialists 27,244 Some college, no degree $58,07010 First-line supervisors of retail
sales workers 27,025 High school diploma or equivalent $44,76011 Managers, all other 24,761 Bachelor's degree $130,68012 Computer systems analysts 23,535 Bachelor's degree $99,75013 Computer programmers 20,169 Bachelor's degree $96,30014 Customer service
representatives 19,699 High school diploma or equivalent $37,59015 Accountants and auditors 19,240 Bachelor's degree $82,70016 First-line supervisors of food
preparation and serving workers 19,136 High school diploma or equivalent $37,730
17 Web developers 15,953 Associate's degree $83,50018 Stock clerks and order fillers 15,224 High school diploma or equivalent $24,32019 First-line supervisors of office
and administrative support workers 14,592 High school diploma or equivalent $62,590
20 Taxi drivers and chauffeurs 13,834 No formal educational credential $28,52021 Business operations
specialists, all other 13,770 Bachelor's degree $92,15022 Marketing managers 13,020 Bachelor's degree $155,82023 Sales managers 12,910 Bachelor's degree $154,50024 Executive secretaries and
executive administrative assistants 12,444 High school diploma or equivalent $68,030
25 General and operations managers 12,441 Bachelor's degree $134,300
Source: Burning Glass 2017 Industry Postings; DCNetworks 2017 Industry Openings *EMSI Current Wages, Salaries, & Proprietor Earnings

FISCAL YEAR 2017
18
There were more than 16.5M total job postings in the Greater Washington Region in 2017, of which more than 2.5M were unique.
Forty-four percent (44%) of the top 25 job postings in the Greater Washington Region required less than a Bachelor’s degree and paid on average almost $50,000 a year.
Total Number of Job Postings by Sector
Top 20 Job Openings by Industry in D.C., 2017
Industry Average Wages
Professional, Scientific, and Technical Services 61,444 $134,727
Health Care and Social Assistance 21,356 $63,737
Administrative and Support and Waste Management and Remediation Services 15,435 $51,901
Other Services (except Public Administration) 10,703 $85,233
Finance and Insurance 9,794 $176,871
Accommodation and Food Services 8,298 $33,421
Information 7,475 $129,343
Public Administration 7,422 N/A
Educational Services 6,872 $52,230
Manufacturing 5,365 $93,242
Real Estate and Rental and Leasing 4,561 $96,305
Retail Trade 4,251 $36,535
Transportation and Warehousing 3,280 $64,934
Construction 2,239 $66,278
Arts, Entertainment, and Recreation 1,483 $76,922
Wholesale Trade 1,002 $120,741
Utilities 903 $110,632
Management of Companies and Enterprises 779 $226,992
Mining, Quarrying, and Oil and Gas Extraction 311 $0
Agriculture, Forestry, Fishing and Hunting 97 $0
*Source: Burning Glass 2017 Industry Postings**Source: D.C., Networks 2017 Industry Openings***EMSI Current Wages, Salaries, & Proprietor Earnings
DEPARTMENT OF EMPLOYMENT SERVICES ANNUAL REPORT
19
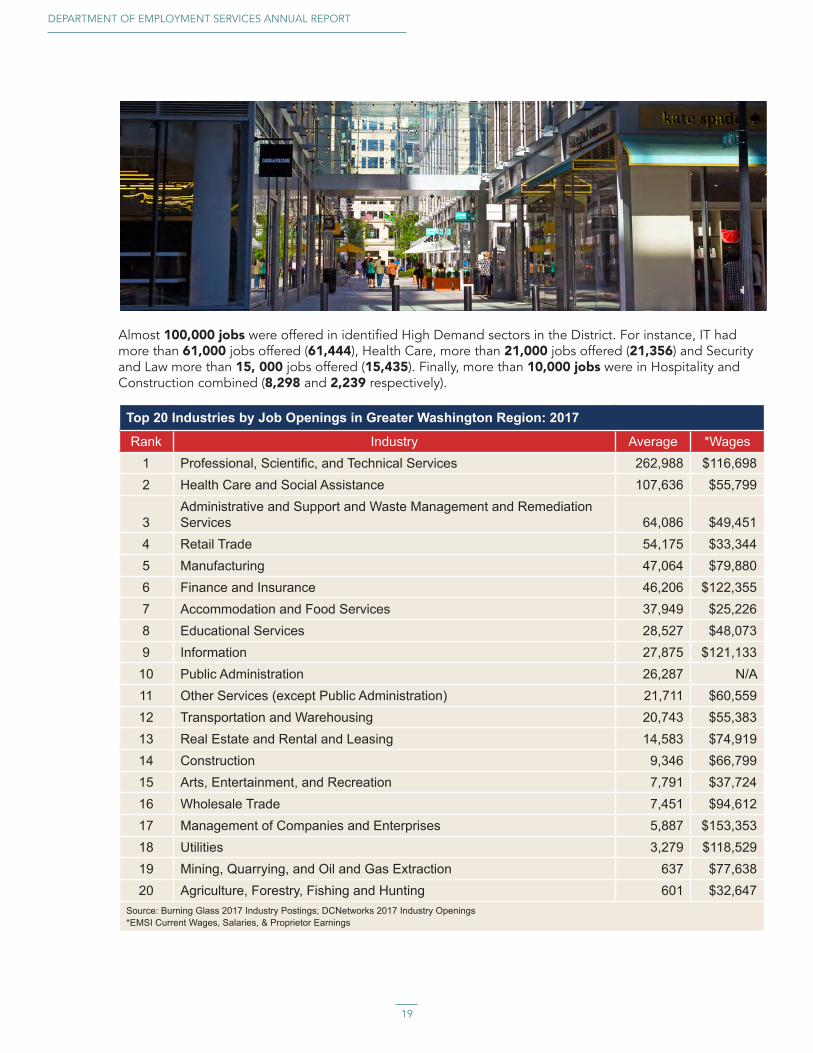
Almost 100,000 jobs were offered in identified High Demand sectors in the District. For instance, IT had more than 61,000 jobs offered (61,444), Health Care, more than 21,000 jobs offered (21,356) and Security and Law more than 15, 000 jobs offered (15,435). Finally, more than 10,000 jobs were in Hospitality and Construction combined (8,298 and 2,239 respectively).
Top 20 Industries by Job Openings in Greater Washington Region: 2017
Rank Industry Average *Wages1 Professional, Scientific, and Technical Services 262,988 $116,6982 Health Care and Social Assistance 107,636 $55,799
3Administrative and Support and Waste Management and Remediation Services 64,086 $49,451
4 Retail Trade 54,175 $33,3445 Manufacturing 47,064 $79,8806 Finance and Insurance 46,206 $122,3557 Accommodation and Food Services 37,949 $25,2268 Educational Services 28,527 $48,0739 Information 27,875 $121,13310 Public Administration 26,287 N/A11 Other Services (except Public Administration) 21,711 $60,55912 Transportation and Warehousing 20,743 $55,38313 Real Estate and Rental and Leasing 14,583 $74,91914 Construction 9,346 $66,79915 Arts, Entertainment, and Recreation 7,791 $37,72416 Wholesale Trade 7,451 $94,61217 Management of Companies and Enterprises 5,887 $153,35318 Utilities 3,279 $118,52919 Mining, Quarrying, and Oil and Gas Extraction 637 $77,63820 Agriculture, Forestry, Fishing and Hunting 601 $32,647
Source: Burning Glass 2017 Industry Postings; DCNetworks 2017 Industry Openings *EMSI Current Wages, Salaries, & Proprietor Earnings
FISCAL YEAR 2017
20
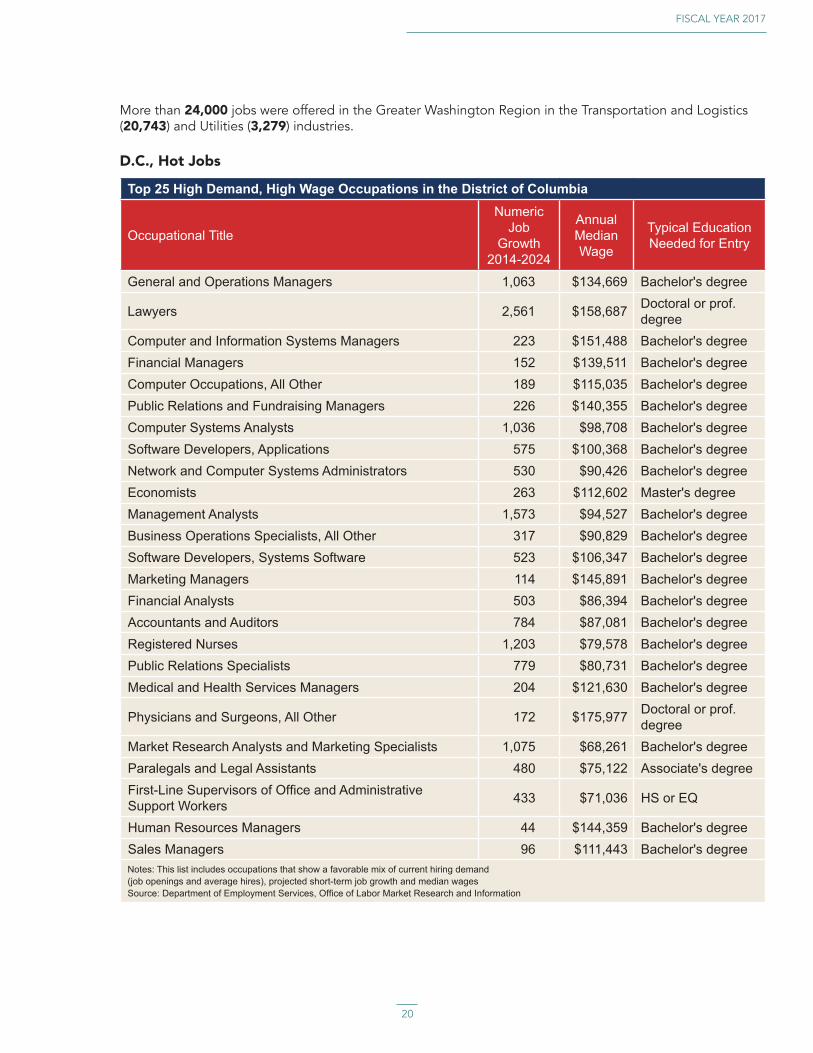
More than 24,000 jobs were offered in the Greater Washington Region in the Transportation and Logistics (20,743) and Utilities (3,279) industries.
D.C., Hot Jobs
Top 25 High Demand, High Wage Occupations in the District of Columbia
Occupational Title
Numeric Job
Growth 2014-2024
Annual Median Wage
Typical Education Needed for Entry
General and Operations Managers 1,063 $134,669 Bachelor's degree
Lawyers 2,561 $158,687 Doctoral or prof. degree
Computer and Information Systems Managers 223 $151,488 Bachelor's degreeFinancial Managers 152 $139,511 Bachelor's degreeComputer Occupations, All Other 189 $115,035 Bachelor's degreePublic Relations and Fundraising Managers 226 $140,355 Bachelor's degreeComputer Systems Analysts 1,036 $98,708 Bachelor's degreeSoftware Developers, Applications 575 $100,368 Bachelor's degreeNetwork and Computer Systems Administrators 530 $90,426 Bachelor's degreeEconomists 263 $112,602 Master's degreeManagement Analysts 1,573 $94,527 Bachelor's degreeBusiness Operations Specialists, All Other 317 $90,829 Bachelor's degreeSoftware Developers, Systems Software 523 $106,347 Bachelor's degreeMarketing Managers 114 $145,891 Bachelor's degreeFinancial Analysts 503 $86,394 Bachelor's degreeAccountants and Auditors 784 $87,081 Bachelor's degreeRegistered Nurses 1,203 $79,578 Bachelor's degreePublic Relations Specialists 779 $80,731 Bachelor's degreeMedical and Health Services Managers 204 $121,630 Bachelor's degree
Physicians and Surgeons, All Other 172 $175,977 Doctoral or prof. degree
Market Research Analysts and Marketing Specialists 1,075 $68,261 Bachelor's degreeParalegals and Legal Assistants 480 $75,122 Associate's degreeFirst-Line Supervisors of Office and Administrative Support Workers 433 $71,036 HS or EQ
Human Resources Managers 44 $144,359 Bachelor's degreeSales Managers 96 $111,443 Bachelor's degreeNotes: This list includes occupations that show a favorable mix of current hiring demand (job openings and average hires), projected short-term job growth and median wagesSource: Department of Employment Services, Office of Labor Market Research and Information

DEPARTMENT OF EMPLOYMENT SERVICES ANNUAL REPORT
21
INCOME AND POVERTY BY DEMOGRAPHICS
FISCAL YEAR 2017
22
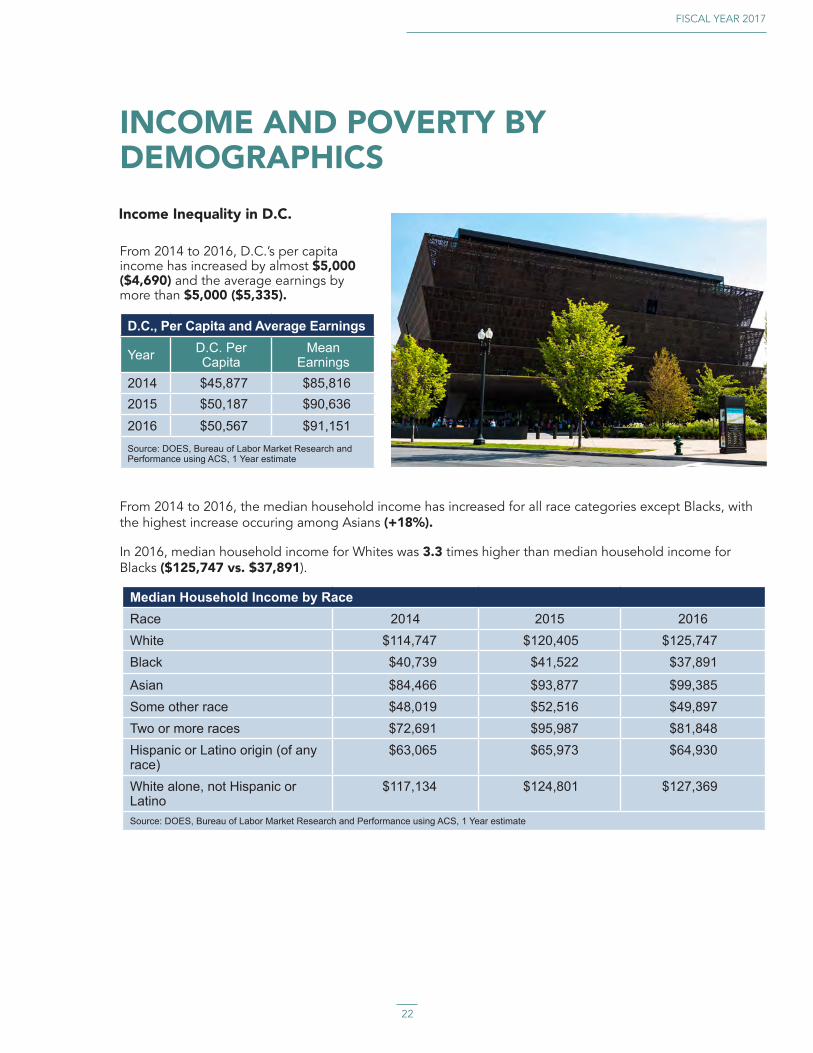
INCOME AND POVERTY BY DEMOGRAPHICSIncome Inequality in D.C.
D.C., Per Capita and Average Earnings
Year D.C. Per Capita
Mean Earnings
2014 $45,877 $85,8162015 $50,187 $90,6362016 $50,567 $91,151Source: DOES, Bureau of Labor Market Research and Performance using ACS, 1 Year estimate
From 2014 to 2016, D.C.’s per capita income has increased by almost $5,000 ($4,690) and the average earnings by more than $5,000 ($5,335).
Median Household Income by RaceRace 2014 2015 2016White $114,747 $120,405 $125,747Black $40,739 $41,522 $37,891
Asian $84,466 $93,877 $99,385Some other race $48,019 $52,516 $49,897Two or more races $72,691 $95,987 $81,848Hispanic or Latino origin (of any race)
$63,065 $65,973 $64,930
White alone, not Hispanic or Latino
$117,134 $124,801 $127,369
Source: DOES, Bureau of Labor Market Research and Performance using ACS, 1 Year estimate
From 2014 to 2016, the median household income has increased for all race categories except Blacks, with the highest increase occuring among Asians (+18%).
In 2016, median household income for Whites was 3.3 times higher than median household income for Blacks ($125,747 vs. $37,891).
DEPARTMENT OF EMPLOYMENT SERVICES ANNUAL REPORT
23
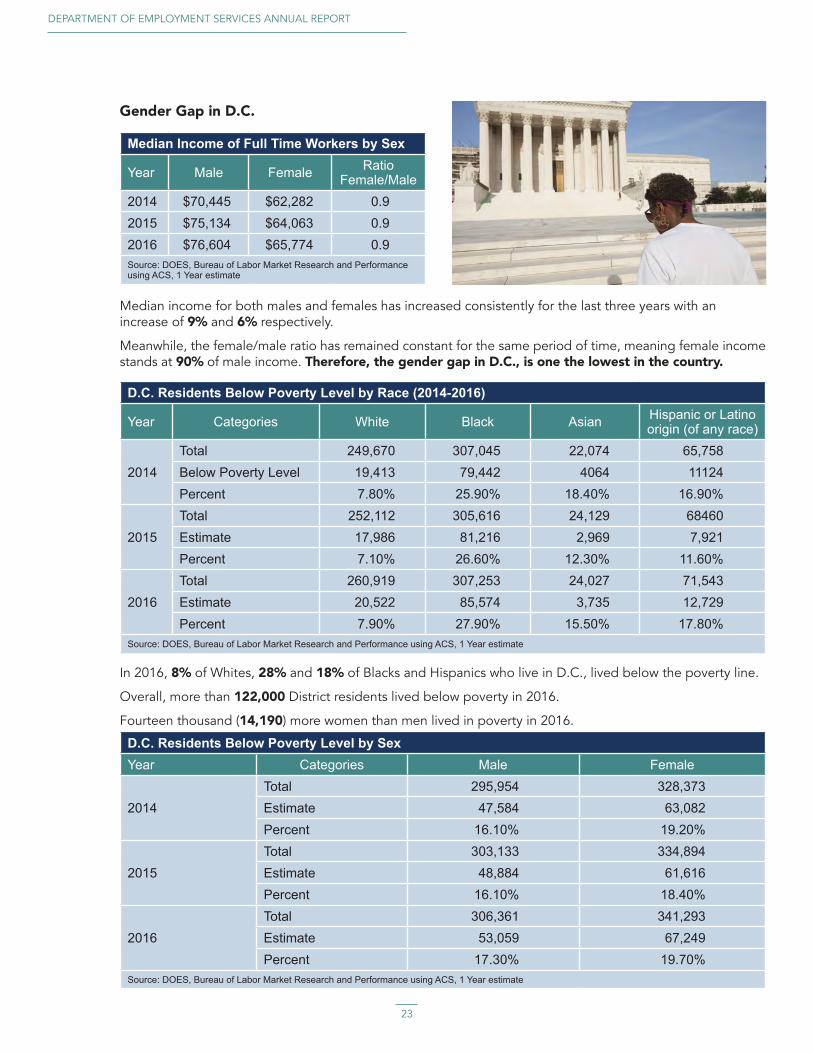
Gender Gap in D.C.
Median Income of Full Time Workers by Sex
Year Male Female Ratio Female/Male
2014 $70,445 $62,282 0.92015 $75,134 $64,063 0.92016 $76,604 $65,774 0.9Source: DOES, Bureau of Labor Market Research and Performance using ACS, 1 Year estimate
Median income for both males and females has increased consistently for the last three years with an increase of 9% and 6% respectively.
Meanwhile, the female/male ratio has remained constant for the same period of time, meaning female income stands at 90% of male income. Therefore, the gender gap in D.C., is one the lowest in the country.
D.C. Residents Below Poverty Level by Race (2014-2016)
Year Categories White Black Asian Hispanic or Latino origin (of any race)
2014Total 249,670 307,045 22,074 65,758Below Poverty Level 19,413 79,442 4064 11124Percent 7.80% 25.90% 18.40% 16.90%
2015Total 252,112 305,616 24,129 68460Estimate 17,986 81,216 2,969 7,921Percent 7.10% 26.60% 12.30% 11.60%
2016Total 260,919 307,253 24,027 71,543Estimate 20,522 85,574 3,735 12,729Percent 7.90% 27.90% 15.50% 17.80%
Source: DOES, Bureau of Labor Market Research and Performance using ACS, 1 Year estimate
In 2016, 8% of Whites, 28% and 18% of Blacks and Hispanics who live in D.C., lived below the poverty line.
Overall, more than 122,000 District residents lived below poverty in 2016.
Fourteen thousand (14,190) more women than men lived in poverty in 2016.
D.C. Residents Below Poverty Level by SexYear Categories Male Female
2014Total 295,954 328,373Estimate 47,584 63,082Percent 16.10% 19.20%
2015Total 303,133 334,894Estimate 48,884 61,616Percent 16.10% 18.40%
2016Total 306,361 341,293Estimate 53,059 67,249Percent 17.30% 19.70%
Source: DOES, Bureau of Labor Market Research and Performance using ACS, 1 Year estimate

FISCAL YEAR 2017
24
DOES SERVICES
DEPARTMENT OF EMPLOYMENT SERVICES ANNUAL REPORT
25
DOES SERVICES
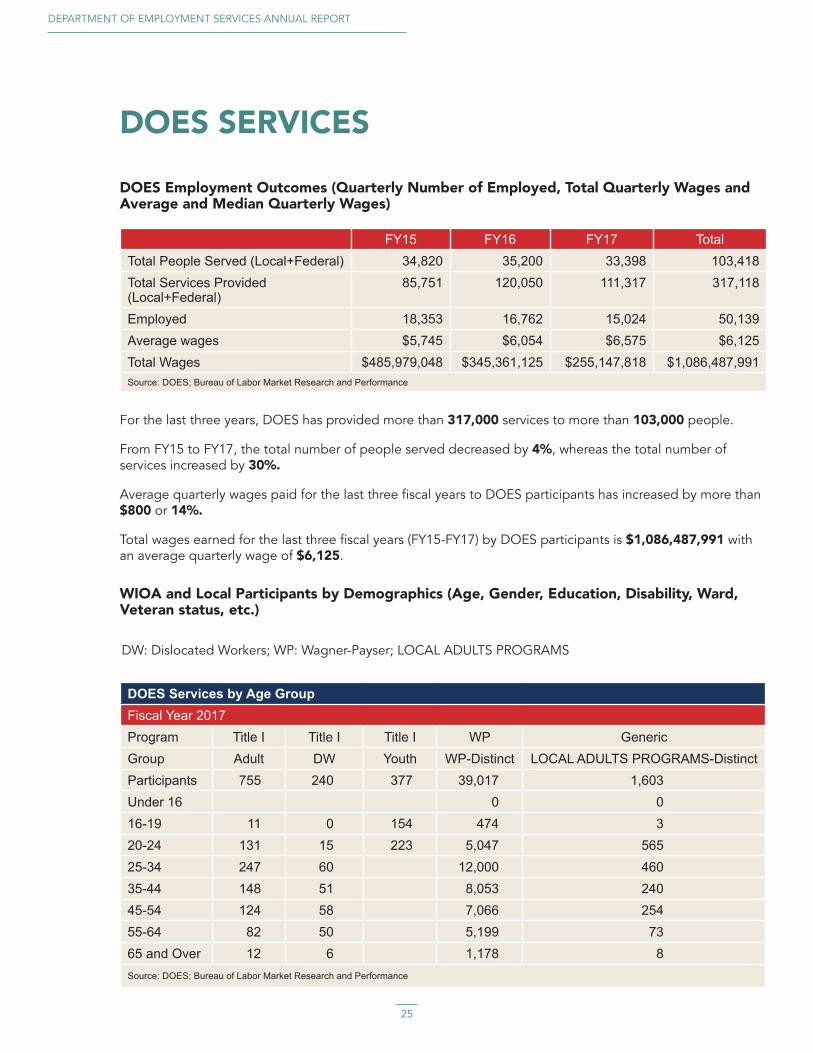
DOES Employment Outcomes (Quarterly Number of Employed, Total Quarterly Wages and Average and Median Quarterly Wages)
FY15 FY16 FY17 TotalTotal People Served (Local+Federal) 34,820 35,200 33,398 103,418Total Services Provided (Local+Federal)
85,751 120,050 111,317 317,118
Employed 18,353 16,762 15,024 50,139Average wages $5,745 $6,054 $6,575 $6,125Total Wages $485,979,048 $345,361,125 $255,147,818 $1,086,487,991Source: DOES; Bureau of Labor Market Research and Performance
For the last three years, DOES has provided more than 317,000 services to more than 103,000 people.
From FY15 to FY17, the total number of people served decreased by 4%, whereas the total number of services increased by 30%.
Average quarterly wages paid for the last three fiscal years to DOES participants has increased by more than $800 or 14%.
Total wages earned for the last three fiscal years (FY15-FY17) by DOES participants is $1,086,487,991 with an average quarterly wage of $6,125.
WIOA and Local Participants by Demographics (Age, Gender, Education, Disability, Ward, Veteran status, etc.)
DW: Dislocated Workers; WP: Wagner-Payser; LOCAL ADULTS PROGRAMS
DOES Services by Age GroupFiscal Year 2017Program Title I Title I Title I WP GenericGroup Adult DW Youth WP-Distinct LOCAL ADULTS PROGRAMS-DistinctParticipants 755 240 377 39,017 1,603Under 16 0 016-19 11 0 154 474 320-24 131 15 223 5,047 56525-34 247 60 12,000 46035-44 148 51 8,053 24045-54 124 58 7,066 25455-64 82 50 5,199 7365 and Over 12 6 1,178 8Source: DOES; Bureau of Labor Market Research and Performance

FISCAL YEAR 2017
26
Fifty-one percent (51%) of people served at DOES were between the ages of 25 and 44 years old, while 16% were 55 years old and over.
The vast majority of people served at DOES in FY17 were through Wagner-Payser (93%).
More than half (52%) of people served by the agency were female and 54% of those served were Black.
DOES Services by GenderFiscal Year 2017Program Group Participants Male Female NSTitle I Adult 755 341 412 2Title I DW 240 91 149 Title I Youth 377 180 197 WP WP-Distinct 39,017 18,770 20,207 40Generic LOCAL ADULTS PROGRAMS-Distinct 1,603 935 667 1Source: DOES; Bureau of Labor Market Research and Performance
DOES Services by RaceFiscal Year 2017Program Title I Title I Title I WP Generic
Group Adult DW Youth WP-Distinct LOCAL ADULTS PROGRAMS-Distinct
Participants 755 240 377 39,017 1,603White 21 9 1 2,426 15
Black/Black 615 175 356 20,257 1,463American Indian/Alaskan Native 13 5 4 318 15Asian 7 0 1 372 1Hawaiian/Other Pacific Islander 1 0 1 69 5Not Available 98 51 14 15,575 104Source: DOES; Bureau of Labor Market Research and Performance

DEPARTMENT OF EMPLOYMENT SERVICES ANNUAL REPORT
27
More than two-thirds (68%) of people served at DOES in fiscal year 2017 had less than a Bachelor’s degree, which is consistent with the share of unemployed District residents with less than a Bachelor’s degree.
DOES Services by Educational Attainment LevelFiscal Year 2017Program Title I Title I Title I WP Generic
Group Adult DW Youth WP-Distinct LOCAL ADULTS PROGRAMS-Distinct
Participants 755 240 377 39,017 1,603Less Than High School 59 5 149 3,215 309High School or Equivalent (GED) 232 54 199 13,192 861
Some College 248 62 26 9,462 343Bachelor's Degree 141 75 3 7,275 68Graduate/Professional Degree 75 44 0 5,873 22
Notes: Education Level was based on Highest Grade Completed based on the Profile data and not at the time of Application/Participation Source: DOES; Bureau of Labor Market Research and Performance
Forty-four percent (44%) of people served at DOES lived in underserved Wards in the District (Wards 5, 7 and 8).
DOES Services by WardFiscal Year 2017Program Title I Title I Title I WP Generic
Group Adult DW Youth WP-Distinct LOCAL ADULTS PROGRAMS-Distinct
Participants 755 240 377 39,017 1,603Ward 1 62 26 13 2,221 66Ward 2 22 7 3 1,036 21Ward 3 12 5 1 748 9Ward 4 92 29 20 2,340 92Ward 5 145 37 44 3,911 233Ward 6 62 22 35 2,999 173Ward 7 191 69 112 6,004 436Ward 8 165 42 146 6,558 566Ward N/A 4 3 3 13,200 7Source: DOES; Bureau of Labor Market Research and Performance
FISCAL YEAR 2017
28
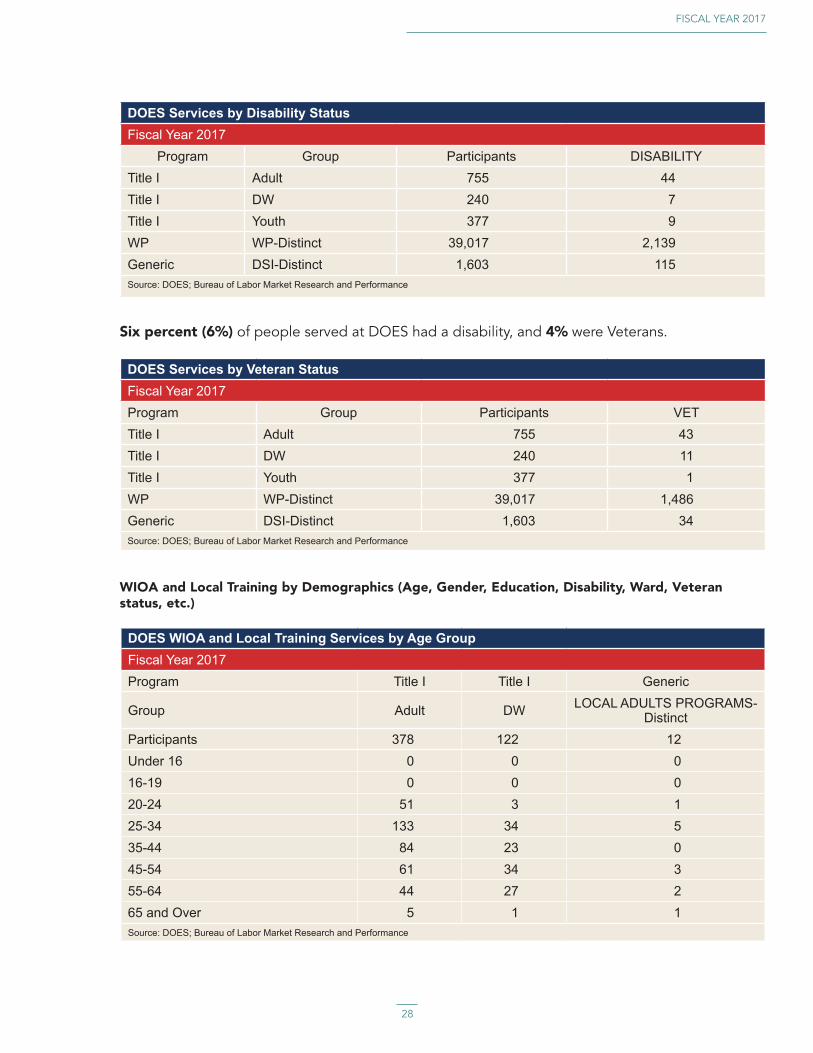
DOES Services by Disability StatusFiscal Year 2017
Program Group Participants DISABILITYTitle I Adult 755 44Title I DW 240 7Title I Youth 377 9WP WP-Distinct 39,017 2,139Generic DSI-Distinct 1,603 115Source: DOES; Bureau of Labor Market Research and Performance
Six percent (6%) of people served at DOES had a disability, and 4% were Veterans.
DOES Services by Veteran StatusFiscal Year 2017Program Group Participants VETTitle I Adult 755 43Title I DW 240 11Title I Youth 377 1WP WP-Distinct 39,017 1,486Generic DSI-Distinct 1,603 34Source: DOES; Bureau of Labor Market Research and Performance
WIOA and Local Training by Demographics (Age, Gender, Education, Disability, Ward, Veteran status, etc.)
DOES WIOA and Local Training Services by Age GroupFiscal Year 2017Program Title I Title I Generic
Group Adult DW LOCAL ADULTS PROGRAMS-Distinct
Participants 378 122 12Under 16 0 0 016-19 0 0 020-24 51 3 125-34 133 34 535-44 84 23 045-54 61 34 355-64 44 27 265 and Over 5 1 1Source: DOES; Bureau of Labor Market Research and Performance
DEPARTMENT OF EMPLOYMENT SERVICES ANNUAL REPORT
29
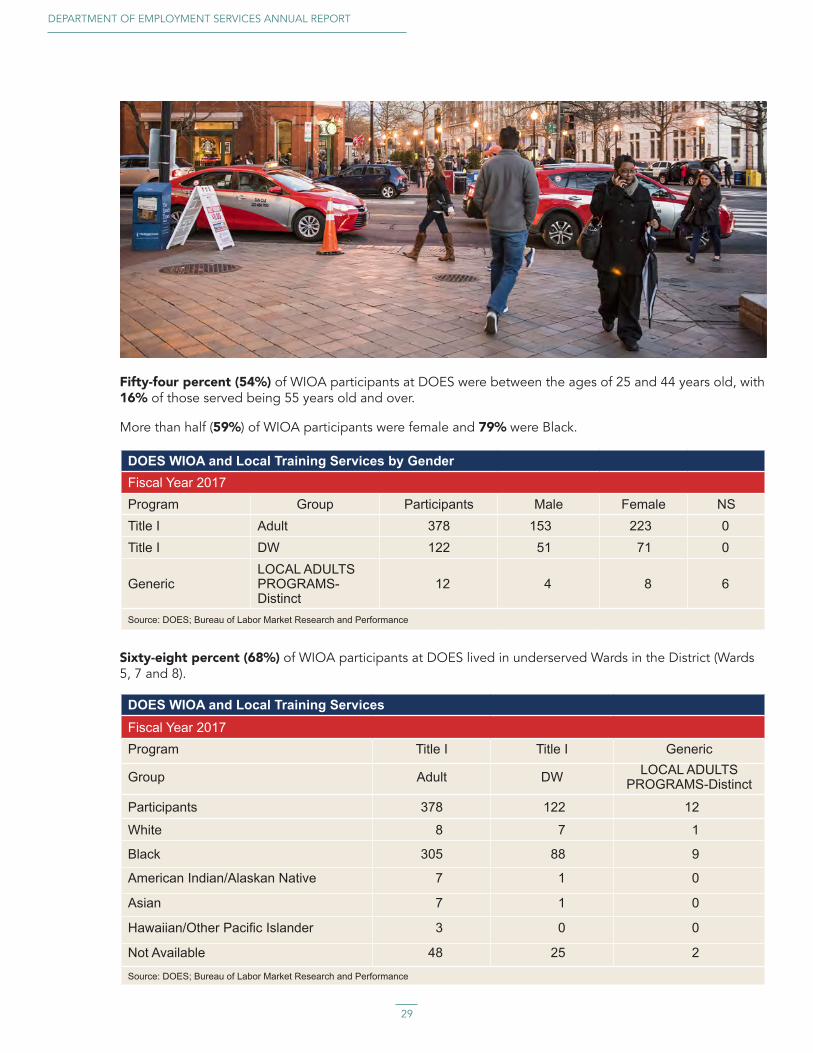
Fifty-four percent (54%) of WIOA participants at DOES were between the ages of 25 and 44 years old, with 16% of those served being 55 years old and over.
More than half (59%) of WIOA participants were female and 79% were Black.
DOES WIOA and Local Training Services by GenderFiscal Year 2017Program Group Participants Male Female NSTitle I Adult 378 153 223 0Title I DW 122 51 71 0
GenericLOCAL ADULTS PROGRAMS-Distinct
12 4 8 6
Source: DOES; Bureau of Labor Market Research and Performance
Sixty-eight percent (68%) of WIOA participants at DOES lived in underserved Wards in the District (Wards 5, 7 and 8).
DOES WIOA and Local Training ServicesFiscal Year 2017Program Title I Title I Generic
Group Adult DW LOCAL ADULTS PROGRAMS-Distinct
Participants 378 122 12
White 8 7 1
Black 305 88 9
American Indian/Alaskan Native 7 1 0
Asian 7 1 0
Hawaiian/Other Pacific Islander 3 0 0
Not Available 48 25 2
Source: DOES; Bureau of Labor Market Research and Performance

FISCAL YEAR 2017
30
More than two-thirds (70%) of WIOA participants at DOES in fiscal year 2017 had less than a Bachelor’s degree.
DOES WIOA and Local Training ServicesFiscal Year 2017Program Title I Title I Generic
Group Adult DW LOCAL ADULTS PROGRAMS-Distinct
Participants 378 122 12Less Than High School 16 1 1
High School or Equivalent (GED) 131 28 4
Some College 138 35 3Bachelor's Degree 67 43 3
Graduate/Professional Degree 26 15 1Source: DOES; Bureau of Labor Market Research and Performance
DOES WIOA and Local Training ServicesFiscal Year 2017Program Title I Title I Generic
Group Adult DW LOCAL ADULTS PROGRAMS-Distinct
Participants 378 122 12Ward 1 33 12 1Ward 2 6 3 2Ward 3 5 4 0Ward 4 29 15 2Ward 5 70 22 2Ward 6 31 13 0Ward 7 101 32 1Ward 8 98 20 4
Ward Not Available 5 1 0
Source: DOES; Bureau of Labor Market Research and Performance
DEPARTMENT OF EMPLOYMENT SERVICES ANNUAL REPORT
31
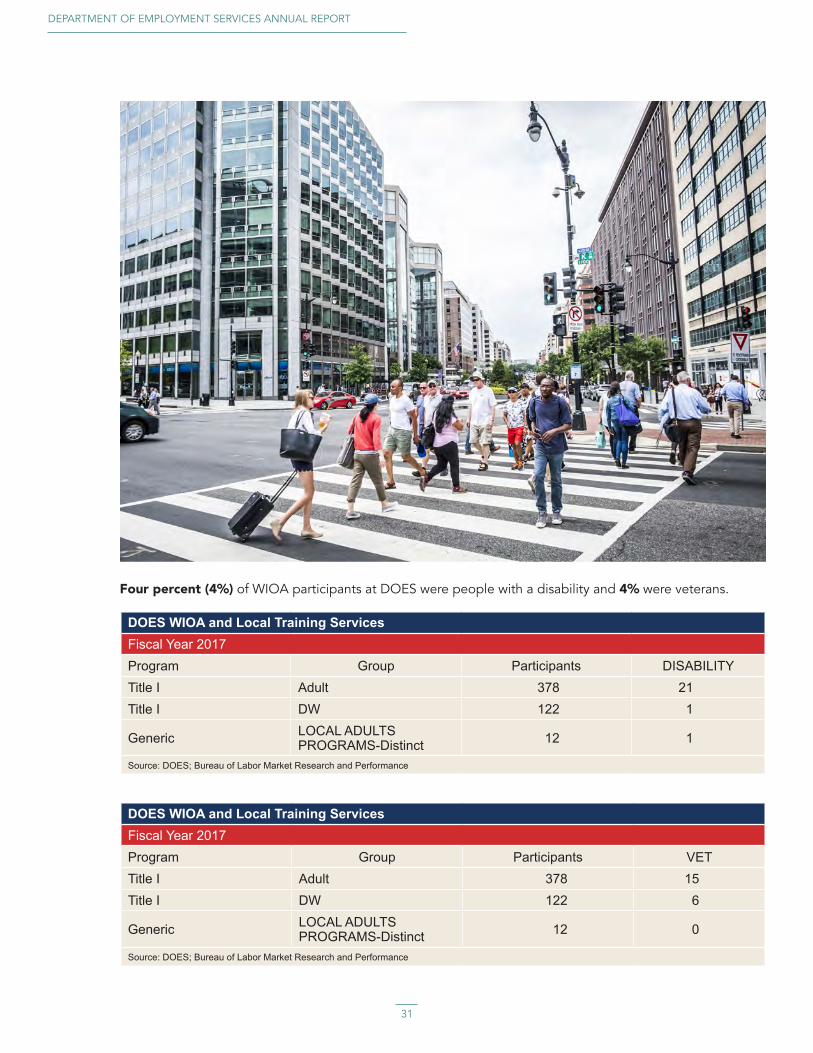
DOES WIOA and Local Training ServicesFiscal Year 2017Program Group Participants DISABILITYTitle I Adult 378 21Title I DW 122 1
Generic LOCAL ADULTS PROGRAMS-Distinct 12 1
Source: DOES; Bureau of Labor Market Research and Performance
Four percent (4%) of WIOA participants at DOES were people with a disability and 4% were veterans.
DOES WIOA and Local Training ServicesFiscal Year 2017Program Group Participants VETTitle I Adult 378 15Title I DW 122 6
Generic LOCAL ADULTS PROGRAMS-Distinct 12 0
Source: DOES; Bureau of Labor Market Research and Performance

FISCAL YEAR 2017
32
DOES SERVICES EXPENDITURES AND WIA/WIOA PERFORMANCE
DEPARTMENT OF EMPLOYMENT SERVICES ANNUAL REPORT
33
DOES SERVICES EXPENDITURES AND WIA/WIOA PERFORMANCE
DOES Expenditures Per ProgramPrograms FY15 FY16 FY17SENIOR SERVICES $583,576 $585,112 $637,245.73LOCAL ADULT TRAINING $3,872,375 $7,689,894 $5,943,054.46TRANSITIONAL EMPLOYMENT $8,779,217 $9,897,653 $10,005,482.39YEAR ROUND YOUTH PROGRAM $6,794,230 $10,966,144 $12,722,135.96SUMMER YOUTH EMPLOYMENT PROGRAM $17,963,920 $17,274,577 $20,401,673.53MAYORS YOUTH LEADERSHIP PROGRAM $929,768 $913,905 $1,187,089.32Source: DOES; Bureau of Labor Market Research and Performance using OCFO Data
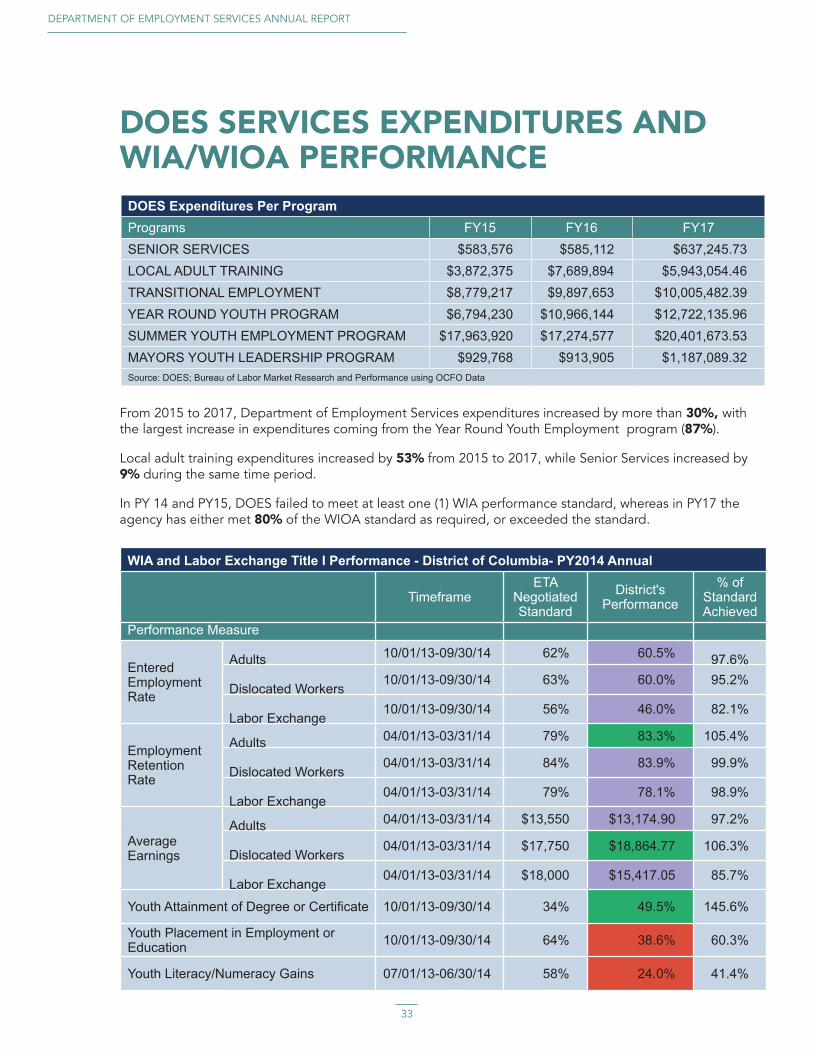
From 2015 to 2017, Department of Employment Services expenditures increased by more than 30% , with the largest increase in expenditures coming from the Year Round Youth Employment program (87%).
Local adult training expenditures increased by 53% from 2015 to 2017, while Senior Services increased by 9% during the same time period.
In PY 14 and PY15, DOES failed to meet at least one (1) WIA performance standard, whereas in PY17 the agency has either met 80% of the WIOA standard as required, or exceeded the standard.
WIA and Labor Exchange Title I Performance - District of Columbia- PY2014 Annual
Timeframe
ETA Negotiated Standard
District's Performance
% of Standard Achieved
Performance Measure
Entered Employment Rate
Adults 10/01/13-09/30/14 62% 60.5% 97.6%
Dislocated Workers10/01/13-09/30/14 63% 60.0% 95.2%
Labor Exchange10/01/13-09/30/14 56% 46.0% 82.1%
Employment Retention Rate
Adults 04/01/13-03/31/14 79% 83.3% 105.4%
Dislocated Workers04/01/13-03/31/14 84% 83.9% 99.9%
Labor Exchange04/01/13-03/31/14 79% 78.1% 98.9%
Average Earnings
Adults 04/01/13-03/31/14 $13,550 $13,174.90 97.2%
Dislocated Workers04/01/13-03/31/14 $17,750 $18,864.77 106.3%
Labor Exchange04/01/13-03/31/14 $18,000 $15,417.05 85.7%
Youth Attainment of Degree or Certificate 10/01/13-09/30/14 34% 49.5% 145.6%
Youth Placement in Employment or Education 10/01/13-09/30/14 64% 38.6% 60.3%
Youth Literacy/Numeracy Gains 07/01/13-06/30/14 58% 24.0% 41.4%
FISCAL YEAR 2017
34
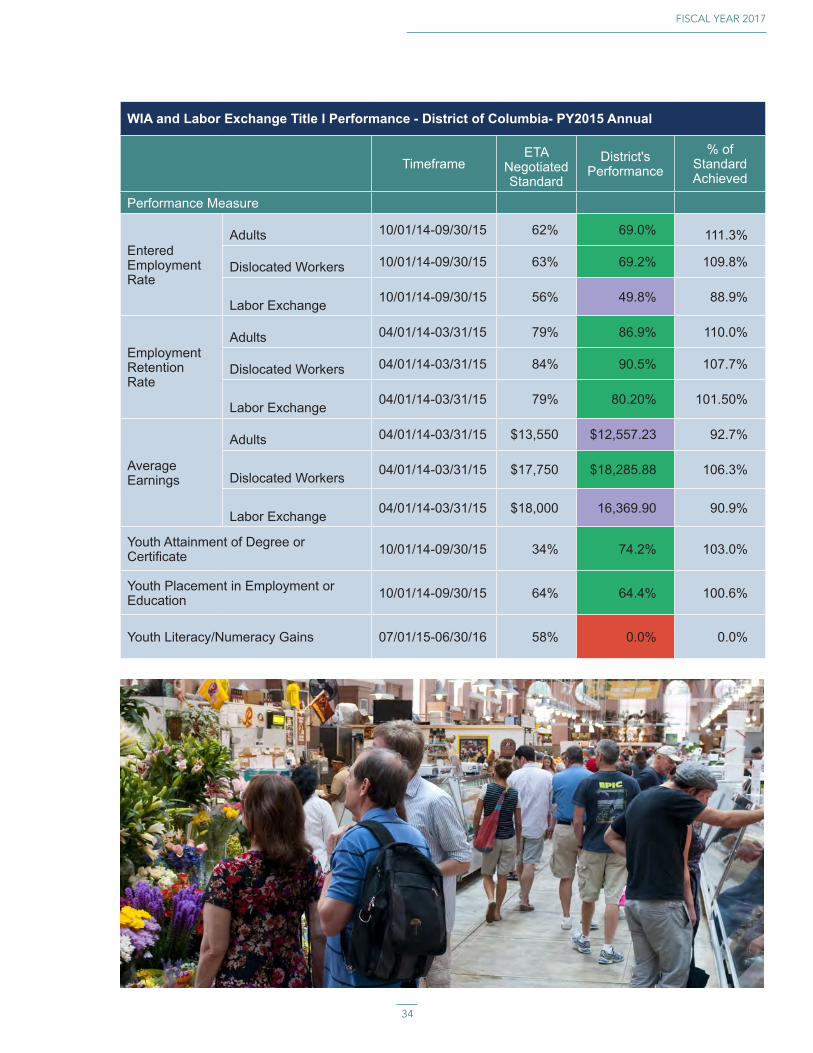
WIA and Labor Exchange Title I Performance - District of Columbia- PY2015 Annual
Timeframe
ETA Negotiated Standard
District's Performance
% of Standard Achieved
Performance Measure
Entered Employment Rate
Adults 10/01/14-09/30/15 62% 69.0% 111.3%
Dislocated Workers 10/01/14-09/30/15 63% 69.2% 109.8%
Labor Exchange 10/01/14-09/30/15 56% 49.8% 88.9%
Employment Retention Rate
Adults 04/01/14-03/31/15 79% 86.9% 110.0%
Dislocated Workers 04/01/14-03/31/15 84% 90.5% 107.7%
Labor Exchange 04/01/14-03/31/15 79% 80.20% 101.50%
Average Earnings
Adults 04/01/14-03/31/15 $13,550 $12,557.23 92.7%
Dislocated Workers 04/01/14-03/31/15 $17,750 $18,285.88 106.3%
Labor Exchange 04/01/14-03/31/15 $18,000 16,369.90 90.9%
Youth Attainment of Degree or Certificate 10/01/14-09/30/15 34% 74.2% 103.0%
Youth Placement in Employment or Education 10/01/14-09/30/15 64% 64.4% 100.6%
Youth Literacy/Numeracy Gains 07/01/15-06/30/16 58% 0.0% 0.0%
DEPARTMENT OF EMPLOYMENT SERVICES ANNUAL REPORT
35
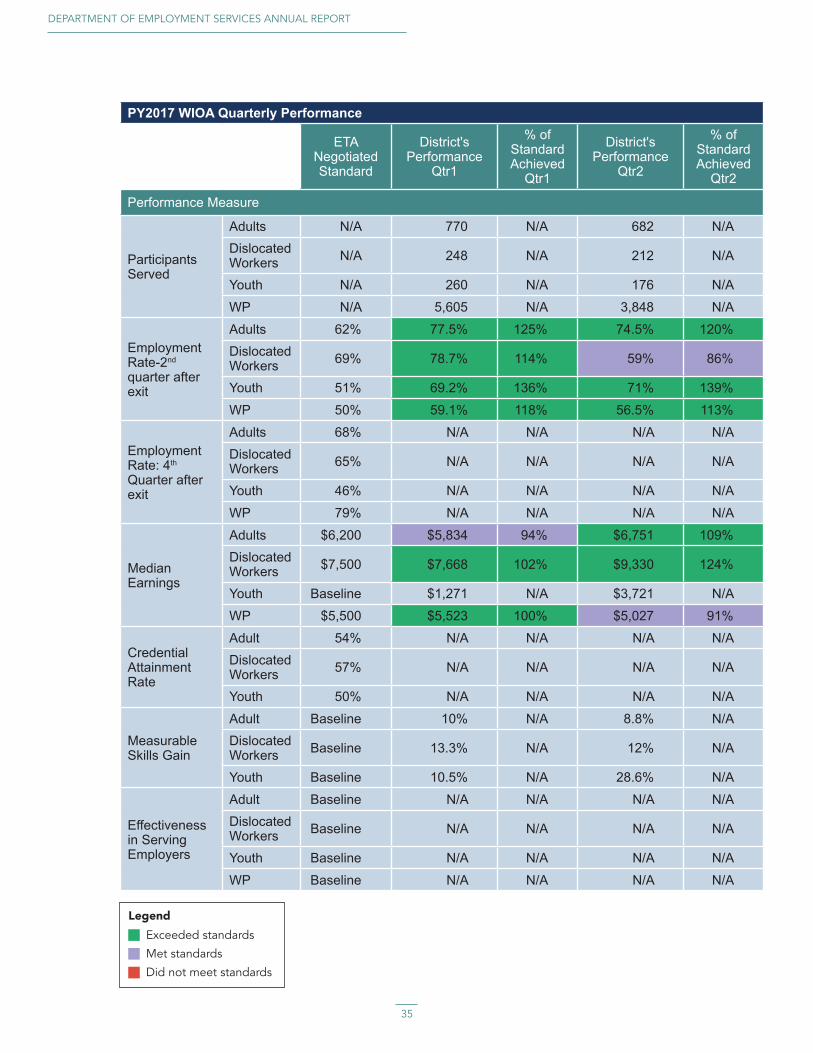
PY2017 WIOA Quarterly Performance
ETA Negotiated Standard
District's Performance
Qtr1
% of Standard Achieved
Qtr1
District's Performance
Qtr2
% of Standard Achieved
Qtr2
Performance Measure
Participants Served
Adults N/A 770 N/A 682 N/ADislocated Workers N/A 248 N/A 212 N/A
Youth N/A 260 N/A 176 N/A
WP N/A 5,605 N/A 3,848 N/A
Employment Rate-2nd quarter after exit
Adults 62% 77.5% 125% 74.5% 120%Dislocated Workers 69% 78.7% 114% 59% 86%
Youth 51% 69.2% 136% 71% 139%
WP 50% 59.1% 118% 56.5% 113%
Employment Rate: 4th Quarter after exit
Adults 68% N/A N/A N/A N/ADislocated Workers 65% N/A N/A N/A N/A
Youth 46% N/A N/A N/A N/A
WP 79% N/A N/A N/A N/A
Median Earnings
Adults $6,200 $5,834 94% $6,751 109%Dislocated Workers $7,500 $7,668 102% $9,330 124%
Youth Baseline $1,271 N/A $3,721 N/A
WP $5,500 $5,523 100% $5,027 91%
Credential Attainment Rate
Adult 54% N/A N/A N/A N/ADislocated Workers 57% N/A N/A N/A N/A
Youth 50% N/A N/A N/A N/A
Measurable Skills Gain
Adult Baseline 10% N/A 8.8% N/ADislocated Workers Baseline 13.3% N/A 12% N/A
Youth Baseline 10.5% N/A 28.6% N/A
Effectiveness in Serving Employers
Adult Baseline N/A N/A N/A N/ADislocated Workers Baseline N/A N/A N/A N/A
Youth Baseline N/A N/A N/A N/A
WP Baseline N/A N/A N/A N/A
Exceeded standards
Met standards
Did not meet standards
Legend
FISCAL YEAR 2017
36
CONCLUSIONS & FINDINGS

DEPARTMENT OF EMPLOYMENT SERVICES ANNUAL REPORT
37
CONCLUSIONS & FINDINGSThe Bowser Administration inherited a challenging workforce system, and pockets of economic inequity. The administration’s concerted effort to connect local resources to key federal programs targeting the District’s most vulnerable residents has helped to bolster the region’s economy. A focus on connecting strategic initiatives and investments to the needs of the District has assisted in the overall administration of programs, evidenced by the removal of the District’s longstanding high-risk and at-risk designation on federally funded workforce and unemployment insurance programs by the US Department of Labor. In addition to the removal of these negative federal designations, DOES has improved in every measurable statistical category.
From 2015 to 2017, DOES expenditures increased by more than 30%, with the largest increase for the Year Round Youth Employment program (87%). From FY15 to FY17, the total number of Youth enrolled in DOES administered Federal programs increased by more than 600%, while the total number of services provided for Youth in our Federal programs increased by more than 700% (176 vs. 1,475). These increases coincide with increased federal and local program performance outcomes. In PY14 and PY15, DOES failed to meet at least one (1) performance standard, whereas in PY17 the agency has either met 80% of the standard as required, or exceeded the standard.
The unemployment rate in D.C., decreased by 1.5 percentage points, with the unemployment rate in Ward 7 and Ward 8 having decreased by 3.3 percentage points and 3.7 percentage points respectively. The total number of unemployed D.C., residents decreased by 4,500 people, leading to the unemployment rate for Blacks having a similar decrease of 2.5 percentage points. The average weekly median duration of unemployment for Blacks has also decreased by 22 weeks.
Washingtonians are receiving more services, more effectively, and acquiring the skills necessary to thrive in the District’s economy. As a result, private sector companies are hiring and investing in the District at impressive rates. The total number of D.C., residents that are employed has increased by 21,700, while the total number of jobs in D.C., increased by 41,900. The total number of unemployed D.C., residents has decreased by 4,500 people, and more than 50,000 Washingtonians served through DOES have earned $1,086,487,991.

FISCAL YEAR 2017
38
PROGRAMMING & REWARDING REACTIONS
DEPARTMENT OF EMPLOYMENT SERVICES ANNUAL REPORT
39
PROGRAMMING & REWARDING REACTIONS
DC Infrastructure Academy (DCIA)
In Quarter 1 of 2018, DOES is launching a District of Columbia Infrastructure Academy (“Infrastructure Academy”), a partnership between D.C., Government and public and private sector partners that will create a pipeline to in-demand infrastructure jobs for District residents. The Infrastructure Academy will be launched in Ward 8, the ward with historically the highest unemployment rate (14%) of the eight wards in the District of Columbia. As part of the Infrastructure Academy, DOES’s vision is to implement IT infrastructure related programming, including utility, energy efficiency, automotive, transportation and logistics and other infrastructure related training in one location.
Apprenticeship D.C.
Apprenticeship D.C., launched in September to promote both pre- and registered apprenticeship and better connect employers, government resources and D.C., residents. Apprenticeship D.C., serves as the Statewide Apprenticeship Partner to business, industry and District job seekers. Apprenticeship D.C., is the District’s vehicle through which employers and organizations can customize apprenticeship offerings that meet industry specific hiring and training needs, including the establishment and operation of youth apprenticeship programs. The initiative expands the apprenticeship model from traditional (construction) industries into non-traditional industries such as healthcare, IT, security, energy, transportation, and infrastructure. To date, Apprenticeship D.C., has funded three new apprenticeship and pre-apprenticeship programs, providing grants to organizations that target three of the District’s high demand industries, expanding into Information Technology and Infrastructure. DOES partnered in National Apprenticeship Week and highlighted work to create the first registered apprenticeship program within D.C., government. In addition, the Workforce Bureau hosted an Apprenticeship symposium and Youth Apprenticeship Fair, which connected over 300 youth attendees to several registered and pre-apprenticeship programs.
FISCAL YEAR 2017
40
MBSYEP - Mayor’s Opportunity Scholarship (MOS)
The Executive Office of the Mayor has partnered with the Department of Employment Services, Office of Youth Programs (DOES) to pilot the Mayor’s Opportunity Scholarship. Through the Mayor’s Opportunity Scholarship, DOES seeks to support the post-secondary endeavors of participants in the Marion S. Barry Summer Youth Employment Program (MBSYEP). The Mayor’s Opportunity Scholarship will provide a minimum of 25 scholarships in the amount of $2,000 each for young adults ages 18-24, who have successfully attained a high school diploma or equivalent and participated in 2017 MBSYEP and enrolled in post-secondary education or occupational skills training or the military.
Aspire to Entrepreneurship
The Aspire to Entrepreneurship Program was established to promote the pursuit of entrepreneurship among the District’s returning citizen popula-tion. Aspire provides work readiness and entrepreneurship training, mentor-ship, financial management counseling, business development support, and financial backing to returning citizens who wish to pursue entrepreneurship as a means of reentry into the workforce. The various components of Aspire work in conjunction with the multitude of supportive services available through each partnering agency to provide a solid foundation for program participants to grow and thrive.
Transitional Residential Program (TRP)
The Transitional Residential Program was created to provide transitional housing opportunities to District residents who have participated in DOES’ DC Career Connections, Project Empowerment or Aspire to Entrepreneurship programs, and are employed in full-time unsubsidized jobs or earning a sustainable wage through a small business venture.

DEPARTMENT OF EMPLOYMENT SERVICES ANNUAL REPORT
41
Security Cameras
Office of Victim Services and Justice Grants – Private Security Camera Voucher Program
The Office of Victim Services and Justice Grants’ (OVSJG) Private Security Camera Voucher Program identifies D.C., residents that are eligible to receive a private security camera system free of charge. These residents are either owners or tenants of a property that is used as a residence (the Applicant) and are receiving public assistance under the District of Columbia Public Assistance Act of 1982, effective April 6, 1982. This program is intended to help deter crime and assist law enforcement with investigations. The Office of Victim Services and Justice Grants partnered with DOES to identify small, local businesses launched through the Aspire to Entrepreneurship program to conduct security camera installations. “DOES”, on behalf of OVSJG, issued two grants through a competitive award process.
DC Office on Aging – Safe at Home Private Security Camera Program for seniors
The District of Columbia Office on Aging (DCOA) Safe at Home Program provides safety adaptations in and around the homes of qualifying seniors and adults with disabilities. Safe at Home’s Private Security Camera Program enables eligible D.C., seniors and residents with disabilities to receive a private security camera system without cost. This program is intended to help deter crime and assist law enforcement with investigations. The DC Office on Aging partnered with DOES to identify small, local businesses launched through the Aspire to Entrepreneurship program to conduct security camera installations. “DOES”, on behalf of DCOA, issued two grants through a competitive award process.
On-the-Job (OJT) Training
On-the-Job training (OJT) is a program in which employers have an opportunity to train, mentor and hire candidates who are not fully proficient in a particular skillset or job function. Through the OJT model, candidates receive the hands-on training necessary to increase their skills, knowledge and capacity to perform the designated job function. OJT ensures unemployed and underemployed jobseekers have a chance to enter/re-enter the workforce through an “Earn While You Learn” model. This streamlined approach allows employers to be reimbursed up to 75% of an established wage rate in exchange for the training provided to participating candidates for up to six (6) months.

FISCAL YEAR 2017
42
Quick Path to Energy (QPE)
QPE launched as a six-week, pre-vocational training program to prepare District residents for careers in the utility industry with PepCo and other employers. To date, Pepco has confirmed that 12 Quick Path to Energy participants have been hired for various positions within the company, with one participant being hired for an office position immediately following the training program. Another QPE participant is currently in the hiring process, and the number of participants to be employed with PepCo or other utility companies is expected to increase as several participants are testing and re-testing for the Construction and Skilled Trades (CAST) exam over the next months.
Quick Path to Transportation (QPT)
DOES administered training program that connects District residents to employment in the transportation industry.
Project Empowerment
Project Empowerment provides job readiness and life skills training, work experience, job search assistance and a variety of supportive services to District residents who face multiple barriers to employment. Participants attend an intensive three-week training course and, upon completion, have the opportunity to be placed in subsidized employment for up to six months. Participants must be District residents between the ages of 22 to 54 who are unemployed and are not recipients of government assistance, such as TANF or unemployment benefits. In addition, participants must demonstrate a substantial need for intensive employment assistance by exhibiting at least three of the six barriers recognized by Project Empowerment.

DEPARTMENT OF EMPLOYMENT SERVICES ANNUAL REPORT
43
Project EmpowermentReturning to Work with Mr. Robinson
Mr. Anthony Robinson became a Project Empowerment participant in December of 2016 after serving nearly 17 years in the federal prison system. After being released early, he set his sights on achieving the personal, educational, and employment goals he’d established for himself while incarcerated. When he learned about Project Empowerment from a friend and former participant, he knew it was just what he needed to move forward.
Mr. Robinson was a focused and engaged Project Empowerment participant with a clear vision for where he wanted to go. He knew employment was crucial but also recognized that an advanced education had to be priority. After successfully completing the program’s job readiness/life skills training component, he was placed in positions with the Mayor’s Office of Returning Citizens Affairs and United Planning Organization. When offered the opportunity to further his education as part of the job preparation process, he began taking technology classes with the CC Preparatory Academy/Hope Project. In August of 2017, Mr. Robinson completed training, successfully achieving CompTIA A+ certification.
Mr. Robinson was hired by Promantus Inc. in January of this year as a full time IT Help Desk Technician. In this role he is the initial point of contact for troubleshooting all information technology related issues. Mr. Robinson attributes his success to strong personal motivation and the support given by the whole Project Empowerment team---and the network of service providers bringing valuable resources to the table.
Mr. Robinson’s sees this as only the beginning. He plans to continue his education and to be proactive in growing professionally--and obtaining other IT certifications.
Creating Stronger Connections
Jaylon Mitchell is a graduate of DC Career Connections Safer Stronger Cohort. This cohort was comprised of at-risk young adults from Wards 7 and 8 that possessed the drive, desire and potential to become influencers of positive change in their community. Jaylon a graduate of Ballou High School was one of the first participants who entered the program in October of 2016 and began his placement with Contemporary Families Services (CFS). It was here Jaylon did a combination of extended Job Readiness training as well as professional development. Jaylon completed his placement with CFS and transitioned to a subsidized position with the Safer Stronger DC Office as a

FISCAL YEAR 2017
44
Community Outreach Worker. Through a partnership with the Department of Behavioral Health, Jaylon and 12 other Safer Stronger participants were offered the chance to earn a Youth Peer Specialist certification that was held at DOES. Over six weeks he successfully demonstrated his commitment which led to his completion of the certification program. Subsequently he applied for several community outreach positions and was presented with five job offers from various organizations throughout the District. Jaylon has since landed with the Department of Parks and Recreation (DPR) as a Staff Assistant where he can utilize his experiences, certifications and training he earned during his tenure with DC Career Connections.
Connecting to Create a Dream Career
PreAnn Walker, a native Washingtonian of Ward 5 and a graduate of DC Career Connection’s
(DCCC) Program is no stranger to hard work. PreAnn attended Friendship Collegiate High School and later went on to earn her Bachelor’s degree from Spelman College. Upon completion PreAnn found that it was extremely difficult to obtain employment. Although formally educated she continued to get denied for local jobs in the District. It was then during her job search she learned of DCCC. In September of 2016, PreAnn attended DCCC orien-tation at DOES Headquarters and enrolled in Job Readiness Training. Once PreAnn graduated she was placed in a subsidized opportunity working with the Child Support Services Division, Office of the Attorney General; however PreAnn was not permanently selected for the job. While feeling discouraged PreAnn continued to work the DCCC team in looking for an unsubsidized job opportunities. This included updating her resume, practicing her interview skills, completing countless applications and staying engaged with the DCCC team to follow up on job leads and training opportunities. Then it happened, PreAnn was selected for a position with the school she had once attended Friendship Collegiate High School. Who knew the community from hence where she came would be her new place of employment. Through her hire, PreAnn was eligible for the retention program in DCCC where she could earn up to $1150 in bonuses. Unfortunately, it didn’t stop there. PreAnn became homeless even after earning employment. She was not able to provide housing for herself. During this same time DCCC was participating in a pilot initiative, Transitional Residential Program within the Division of State Initia-tives that offered free temporary housing (six months) to Career Connections and Project Empowerment Participants. PreAnn met the qualifications and was selected for housing. PreAnn is now working on saving funds towards pur-chasing her first place while continuing to work at Friendship Collegiate High School as a paraprofessional.

DEPARTMENT OF EMPLOYMENT SERVICES ANNUAL REPORT
45
Back to Work 50+
Back to Work 50+ promotes the full reintegration of talented job seekers, ages fifty (50) to sixty-four (64), into the workforce. The program was created in partnership with the AARP Foundation in an effort to enhance opportunities for mature job seekers by broadening access to critical employment resources and to connect senior job seekers from all Wards of the city with services supporting their reentry into the workforce.
The Passionate Professional
Robert Washington was referred to BACK TO WORK 50+ at DC DOES by a workforce development specialist at the Bertie Backus AJC Campus. Prior to enrolling in Wave 3 of the program in August 2017, Mr. Washington had been out of work for approximately 2 months and actively searching for employment that would allow him to return to his passion – working with youth. Through the supportive and familial environment of BTW, Mr. Washington was able to identify areas of improvement that would be integral to his long-term employment success. The skills Mr. Washington sharpened related to interviewing and networking helped him to obtain multiple job interviews, and ultimately led to his permanent employment with Potomac Job Corps where he serves as a Career Preparation Period Instructor. In that role he is a personal support to students newly entering Potomac Job Corps. He assists them with adjusting to the culture and counsels them through any challenges they may be facing.
Breaking Down Barriers
Mr. Rudolph Barnes was incarcerated and was referred to DSI by CSOSA. Mr. Barnes’ barriers were job recycling, drug addiction, and homelessness when he signed up at the AJC (MLK) location. Upon completion of the PE empow-erment program, Mr. Barnes became gainfully employed with Carver Terrace Apartments as a General Maintenance worker. Mr. Barnes has gained various skills while on the job such as reading water meters, resetting thermostats, and plumbing skills. He has moved into a supervisory position in which he manag-es three PE co-workers as well as two other employees. Mr. Barnes has been privy to a financial promotion, has gained a bank account, credit cards and a vehicle as a result in participating in the CAAB Program. Mr. Barnes future plans include becoming a home owner and he would like to explore becom-ing an entrepreneur by starting his own limousine company. Mr. Barnes has been clean for two years and shows nothing short of gratitude towards PE.
FISCAL YEAR 2017
46
Learn, Earn, Advance, Prosper (LEAP) Academy
The LEAP Academy is a network of interconnected District partners working together to refer, train, support, and employ residents in District jobs. Through extensive coordination of efforts, DC government agencies, educational organizations, community partners, and employers leverage their resources to provide LEAP participants with paid on-the job work experience at District agencies for up to one (1) year. Individuals in the program earn wages, accumulate work experience, and obtain stackable credentials toward an obtainable career pathway.
Mayor Marion S. Barry Summer Youth Employment Program (MBSYEP)
The Summer Youth Employment Program (SYEP) is a locally funded initiative sponsored by the Department of Employment Services (DOES) that provides District youth ages 14 to 24 with enriching and constructive summer work experiences through subsidized placements in the private and government sectors.
Through SYEP, we strive to provide young people with the opportunity to:• Earn money and gain meaningful work experience;• Learn and develop the skills, attitudes, and commitment necessary to succeed in today’s world of work;• Gain exposure to various exciting career industries; and,• Interact with dynamic working professionals in a positive work environment.
Though SYEP is a short-term employment and training program (traditionally 6 weeks), our goal is to introduce our youth to employers who will positively impact their futures.
Employers in the Washington, D.C., metropolitan area make this annual program possible by volunteering to serve as Host Employers and providing structured job opportunities for youth during the summer.

DEPARTMENT OF EMPLOYMENT SERVICES ANNUAL REPORT
47
Mayor Marion S. Barry Summer Youth Employment Program (MBSYEP)
Looking to Lead
MBYLI youth Julian Ransome, age 21, from Ward 7, participated in a workforce design lab at the Opportunity Nation AT&T Forum in Washington, D.C. on Oct. 25, 2017. During the forum, Julian provided insights on how employers can make it easier for youth to apply and land a job. A 2014 graduate of Phelps Senior High, Ransome currently works as an MBYLI Youth Supervisor and started with the program at age 14. He completed two years of college at Point Park University in Pittsburgh where he studied creative writing. He is in the process of transferring to Bowie State University in Maryland, closer to home. At Bowie State, Ransome plans to study music technology and someday write music for movies.
‘Strive for More’ When Facing Life’s Obstacles By Shannon Travis and Catherine Hollingsworth The Mayor Marion S. Barry Summer Youth Employment Program (SYEP) is just the beginning of exciting opportunities for so many District youth. Shadaye White, who is hearing disabled, is just one example of how the summer job program led to new possibilities–and a promising career!
Shadaye started with SYEP in 2009 when she was 14 years old but it was her experience as a summer intern for Metro that ultimately led to a job. It wasn’t an easy road. White had planned to attend college but dropped out when she couldn’t obtain interpreters on campus. She thought it might be better to put college on hold and enter the workforce, but unfortunately

FISCAL YEAR 2017
48
she found that few employers offered interpreters. All that changed when she paired up with Metro at a career fair sponsored by the Department of Employment Services.
Tiquisha Harris, SYEP coordinator at WMATA hired Shadaye while at the career fair. After her first summer there, with assistance from an American Sign Language interpreter, she did such a great job that WMATA requested her for two additional consecutive summers from 2014-2016. WMATA made her part of their community outreach team and increased her responsibility each summer. She traveled to Gallaudet and throughout the District assisting Metro riders with disabilities.
Her coworkers and supervisors loved her. And when she was old enough to be hired, they actually created a position specifically for her and her skillset. In 2017, Shadaye became an SYEP ambassador sharing her positive summer experiences with the public. Shadaye has emphasized that SYEP taught her how to strive for more. SYEP is still teaching that core principal, to find greater opportunity through employment.
Chasing Dreams to Create Change
District native Arturo Evans has come a long way since his first summer job in the Mayor Marion S. Barry Summer Youth Employment Program (MBSYEP). Currently employed at the Courtyard Marriott Convention Center, Evans recalled his first job in MBSYEP making $5.25 an hour pulling weeds for the DC Department of Real Estate.
“It wasn’t about the money. I really enjoyed the work,” Evans said. He also enjoyed having some money in his pocket. “Of course, it was good to have a $100 check.”
No doubt, it was a sweaty job pulling weeds in humid weather. But as Evans explained, he began to feel a sense of pride in his work as he cleared overgrown weeds to reveal “the finished product.”
Ever since the eighth grade, Evans had heard his friends talk excitedly about MBSYEP, and as soon as he turned 14, he signed up for the summer jobs program. He participated in MBSYEP every summer for five years in a row until he went off to college. By then, he had become interested in the hospitality and tourism industry.
Evans was accepted to one of the top hospitality schools in the nation, University of Nevada, Las Vegas. While in college, Evans returned home during the summers to intern at the Courtyard Marriott Convention Center.

DEPARTMENT OF EMPLOYMENT SERVICES ANNUAL REPORT
49
During his junior year, he was hired full-time and currently works the hotel’s front desk. Due to finances and his mother’s medical condition, Evans left school to accept the job with Marriott. “I believe this is one of the best industries to be in if you’re a people person,” Evans said.
Asked what advice he would give to youth looking for jobs, Evans said, “Don’t chase the money, chase your dreams.” As for his future plans, Evans hopes to become a hotel general manager and run a chain of hotels just like his boss, Thomas Penny, general manager of Courtyard Marriott Convention Center.
Both Evans and Penny served as MBSYEP Ambassadors in 2017, sharing their positive experiences in the summer jobs program. In a television interview that aired this past spring on WUSA 9, Evans shared an important lesson he learned at age 14 in his first summer job: “[The work] may not be targeted toward your career but just a stepping stone for furthering your career.”
For the past 20 years the local hotel industry has placed over 1,000 youth who started as interns, Penny, stated in a recent social media video promoting MBSYEP. “Many of these young people have gone on to graduate college and transition into the hotel industry,” he said. “So from my perspective, getting them exposed to the hotel industry at the high school age only makes their transition better post-college. So I would urge all employers in the city to get involved” in MBSYEP.

FISCAL YEAR 2017
50
PRODUCED BY DISTRICT OF COLUMBIA DEPARTMENT OF EMPLOYMENT SERVICES
Odie Donald IIDirector
Unique Morris- HughesChief Strategy Officer
Office of Strategy & Innovation
Office of Labor Market Research and Performance (LMI) Team
FISCAL YEAR 2017
50

FISCAL YEAR 2017
51
does.dc.gov