department of education: special schools program - ocde.us reports… · ... test scores and...
TRANSCRIPT

SARC2015-16
School Accountability Report Card
Published in 2016-17
Orange County Department of EducationAl Mijares, Ph.D., Superintendent • [email protected] • Phone: (714) 966-4000
Orange County Department of Education • 200 Kalmus Drive Costa Mesa, CA 92626 • www.ocde.us
Orange County Department of
Education: Special Schools Program
Dennis Roberson, Chief Special Education Services
200 Kalmus Dr. Costa Mesa, CA 92626
Grades: Infant, PreK-Adult Phone: (714) 966-4130
www.ocde.us/SPED
CDS Code: 30-10306-6069553
OCDE: Special Schools ProgramSARC 2
Mission StatementThe mission of the Orange County
Department of Education is to ensure that all students are equipped with the
competencies they need to thrive in the 21st century.
School Accountability Report Card
In accordance with state and federal requirements, the School Accountability
Report Card (SARC) is put forth annually by all public schools as a tool for parents and interested parties to stay informed of
the school’s progress, test scores and achievements.
Orange County Board of EducationRebecca Gomez, 1st District
David L. Boyd, 2nd District
Dr. Ken L. Williams, 3rd District
John W. Bedell, Ph.D.; 4th District
Linda Lindholm, 5th District
Vision StatementOrange County will lead the nation
in college and career readiness and success.
Chief’s MessageOrange County Department of Education: Special Schools Program philosophy and mission statement:
It is the goal of the OCDE: Special Schools Program to provide the most meaningful education program de-signed to meet each student’s individual needs. This goal emphasizes the teaching of skills that are aligned with California state standards and are critical to the present and future needs of our students.
Our philosophy is based on the following beliefs: 1. All students have the ability as well as the right to learn and to progress; 2. each student’s educational program shall be developed through the Individualized Edu-cation Program (IEP) process, utilizing a team to identify and implement functional goals and objectives; 3. each student’s educational program shall focus on maximizing student independence; 4. each student shall participate in instructional activities that are positive, age-appropriate, and safe in inclusive settings whenever possible; 5. all students shall participate in instructional opportunities that assist them in participating as fully as possible in their present and future environments.
School description:
The OCDE: Special School Program provides an appropriate special education program for students referred from the 27 local school districts in Orange County and seven school districts outside of Orange County. Educational programs are provided in three types of educational placements, including: 1. special classes for students with severe disabilities, 2. classes for students who are deaf and hard of hearing (DHH), and 3. classes for students with cognitive and emotional disturbance disabilities.
The special classes for students with severe disabilities serve students whose primary disabilities include severe to profound cognitive and/or physical disabilities as well as students who manifest severe language and behavioral disabilities requiring a low student-to-staff ratio in a structured class setting. Students ages 3-21 are enrolled. Specialized physical health care is available for those students whose medical conditions warrant such services.
The DHH classes offer programs for deaf and hard-of-hearing infants and students in prekindergarten through grade 12. Students with hearing loss have the opportunity to be educated in least restrictive environments with hearing peers or in special classes. DHH program options include the Parent-Infant Education and Sup-port (PIES) Program, the Oral Deaf and Hard of Hearing Program (3 years old through the sixth grade), the DHH Total Communication Program for students from grades 7-12, and the DHH Adult Transition Program for students 18-22 years.
The OCDE Special Schools Programs operates a total of 55 classes. These classes are placed on 17 inte-grated school district sites throughout Orange County.
School Mission StatementTo ensure that all students with disabilities are equipped with the 21st century competencies, they need to be as successful and independent as possible in present and future environments.
School Vision StatementOrange County Department of Education: Special Schools is dedicated to fundamental human values of respect, responsibility, integrity and professional ethics. Our priority is service to students with special needs, schools, districts, families and community members. We provide a safe, caring, courteous, and professional environment that fosters collaborative work and individual development for our students.
School SafetyIt is the policy of the Orange County Department of Education to provide a safe and secure learning environ-ment for all students in a courteous and professional setting. We hold each other and ourselves accountable for the highest level of performance, efficiency, resource management and professional conduct.
The California Education Code (Sections 35294-35294.9) requires county offices of education to develop and implement school safety plans. OCDE has written and implemented a comprehensive plan based on principles and procedures that cultivate and foster a safe and caring school climate.
Each of our sites maintains a disaster-preparedness plan that is updated on a regular basis and reflects the policies of the Orange County Department of Education. These disaster plans are coordinated as much as possible with the host district where OCDE programs are housed.
Each year, the sites have a mandatory staff development schedule which includes the review of site disaster plans to assure that staff is versed on the emergency plans and responsibilities for the safety, health and supervision of students during an emergency situation. All OCDE Special Schools staff will receive active-shooter training during the 2016-17 school year.
Mandatory staff development includes: child-abuse reporting, communicable disease transmission, proper lifting procedures, blood-borne pathogens, seizure intervention and care as well as site-specific safety issues.
The school safety report was last reviewed, updated and discussed with the school faculties during specific minimum days at the various administrative units in December 2016. Each administrative unit coordinates its minimum-day schedule with the mandatory topics during the school year. Key elements of the plan include monthly safety drills, crisis-intervention plans, behavior, medical emergency drills and annual fire-extinguish-er training.
OCDE: Special Schools ProgramSARC 3
Class Size Distribution• Class size averaged 8 students per
class for students with severe-to-profound cognitive and/or physical disabilities
• Class size averaged 8 students per class for students in the Deaf and Hard-of-Hearing programs
Suspensions and ExpulsionsThis table shows the school, district, and state suspension and expulsion rates for the most recent three-year period. Note: Students are only counted one time, regardless of the number of suspensions.
Suspensions and Expulsions Three-Year Data
Special Schools OCDE California
13-14 14-15 15-16 13-14 14-15 15-16 13-14 14-15 15-16
Suspension rates 0.0% 0.0% 0.5% 1.0% 0.6% 4.1% 4.4% 3.8% 3.7%
Expulsion rates 0.0% 0.0% 0.0% 0.0% 0.0% 0.0% 0.1% 0.1% 0.1%
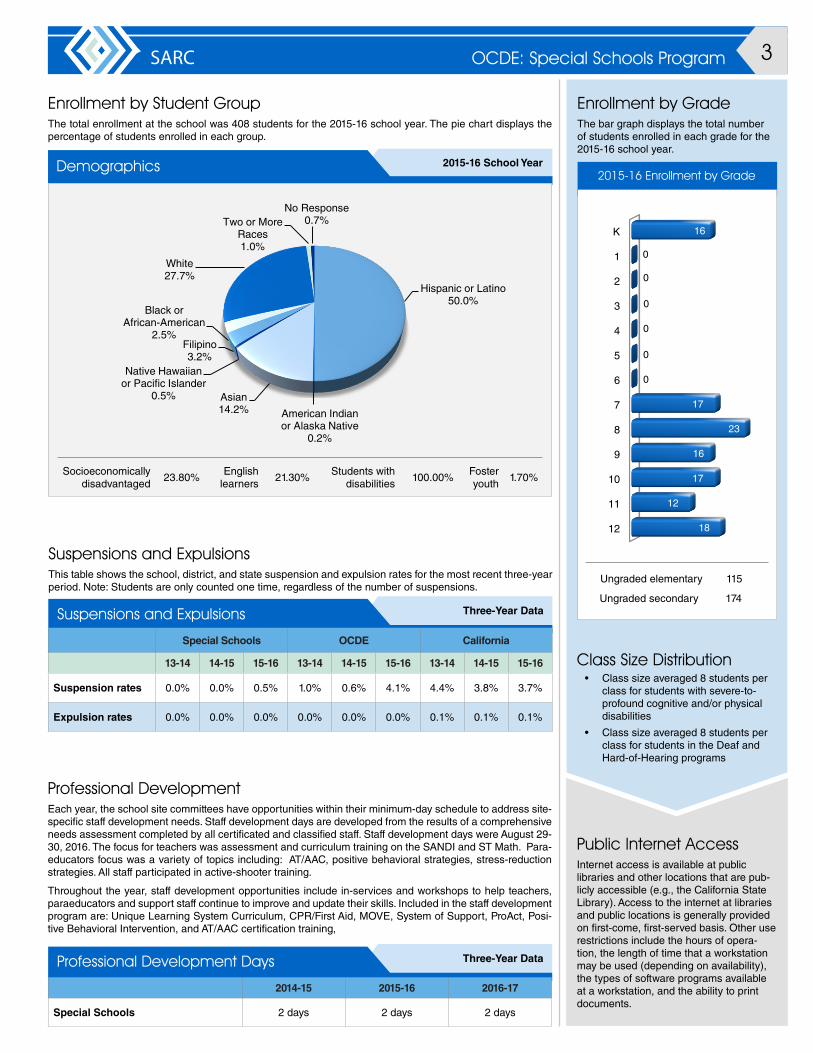
Enrollment by Student GroupThe total enrollment at the school was 408 students for the 2015-16 school year. The pie chart displays the percentage of students enrolled in each group.
2015-16 School YearDemographics
Socioeconomically disadvantaged
23.80%English
learners21.30%
Students with disabilities
100.00%Foster youth
1.70%
Hispanic or Latino50.0%
American Indian or Alaska Native
0.2%
Asian14.2%
Native Hawaiian or Pacific Islander
0.5%
Filipino3.2%
Black or African-American
2.5%
White27.7%
Two or More Races1.0%
No Response 0.7%
Enrollment by GradeThe bar graph displays the total number of students enrolled in each grade for the 2015-16 school year.
2015-16 Enrollment by Grade
Ungraded elementary 115
K
1
2
3
4
5
6
7
8
9
10
11
12
16
0
0
0
0
0
0
17
23
16
17
12
18
Ungraded secondary 174
Professional DevelopmentEach year, the school site committees have opportunities within their minimum-day schedule to address site-specific staff development needs. Staff development days are developed from the results of a comprehensive needs assessment completed by all certificated and classified staff. Staff development days were August 29-30, 2016. The focus for teachers was assessment and curriculum training on the SANDI and ST Math. Para-educators focus was a variety of topics including: AT/AAC, positive behavioral strategies, stress-reduction strategies. All staff participated in active-shooter training.
Throughout the year, staff development opportunities include in-services and workshops to help teachers, paraeducators and support staff continue to improve and update their skills. Included in the staff development program are: Unique Learning System Curriculum, CPR/First Aid, MOVE, System of Support, ProAct, Posi-tive Behavioral Intervention, and AT/AAC certification training,
Three-Year DataProfessional Development Days
2014-15 2015-16 2016-17
Special Schools 2 days 2 days 2 days
Public Internet AccessInternet access is available at public libraries and other locations that are pub-licly accessible (e.g., the California State Library). Access to the internet at libraries and public locations is generally provided on first-come, first-served basis. Other use restrictions include the hours of opera-tion, the length of time that a workstation may be used (depending on availability), the types of software programs available at a workstation, and the ability to print documents.

OCDE: Special Schools ProgramSARC 4
California Assessment of Student Performance and Progress (CAASPP)For the 2015-16 school year, the CAASSP consists of several key components, including:
California Alternate Assessment (CAA) test includes both ELA/literacy and mathematics in grades 3-8 and 11. The CAA is given to those students with significant cognitive disabilities which prevent them from taking the Smarter Balanced Assessments with universal tools, designated supports or accommodations.
Smarter Balanced Assessments include ELA/literacy in grades 3-8 and 11. Smarter Balanced Assessments are designed to measure student progress toward college and career readiness.
The assessments under CAASPP show how well students are doing in relation to the state-adopted content standards. On each of these assessments, student aggregate scores are reported as achievement standards. For more information on the CAASPP assessments, please visit www.cde.ca.gov/ta/tg/ca.
v Scores are not shown when the number of students tested is 10 or fewer, either because the number of students tested in this category is too small for statistical accuracy or to protect student privacy.
CAASPP Test Results for All Students: English Language Arts/Literacy and Mathematics (grades 3-8 and 11)The table below shows the percentage of students meeting or exceeding the state standards in English language arts (ELA) and literacy and mathematics.
Two-Year DataPercentage of Students Meeting or Exceeding State Standards
Special Schools OCDE California
Subject 14-15 15-16 14-15 15-16 14-15 15-16
English language arts/literacy 6% 5% 30% 28% 44% 48%
Mathematics 3% 4% 20% 18% 33% 36%
CAASPP by Student Group: English Language Arts/Literacy and MathematicsThe tables on the following pages display the percentage of students that met or exceeded state standards in English language arts and mathematics for the school by student groups for grades 3-8 and 11.
The “percentage met or exceeded” is calculated by taking the total number of students who met or exceeded the standard on the Smarter Balanced Summative Assessment plus the total number of students who met the standard on the CAAs divided by the total number of students who participated in both assessments.
Note: The number of students tested includes all students who participated in the test whether they received a score or not. However, the number of students tested is not the number that was used to calculate the achievement level percentages. The achievement level percentages are calculated using only students who received scores.
CAASPP Test Results by Student Group: Science (grades 5, 8 and 10)Science test results include CSTs, CMA, and CAPA in grades 5, 8, and 10. The “Proficient or Advanced” is calculated by taking the total number of students who scored Proficient or Advanced on the science assess-ment divided by the total number of students with valid scores.
2015-16 School YearPercentage of Students Scoring at Proficient or Advanced
Group Total Enrollment
Number of Students with Valid Scores
Percentage of Students with Valid Scores
Percentage Proficient or Advanced
All students 96 77 80.21% 41.56%
Male 54 44 81.48% 43.18%
Female 42 33 78.57% 39.39%
Black or African-American v v v v
American Indian or Alaska Native v v v v
Asian v v v v
Filipino v v v v
Hispanic or Latino 50 40 80.00% 32.50%
Native Hawaiian or Pacific Islander v v v v
White 28 20 71.43% 35.00%
Two or more races v v v v
Socioeconomically disadvantaged 19 16 84.21% 43.75%
English learners 15 14 93.33% 28.57%
Students with disabilities 96 77 80.21% 41.56%
Students receiving Migrant Education services v v v v
Foster youth v v v v
CAASPP Test Results for All Students: Science (grades 5, 8 and 10)Science test results include California Standards Tests (CSTs), California Modified Assessment (CMA) and California Alternate Performance Assessment (CAPA) in grades 5, 8 and 10. The tables show the percentage of students scoring at proficient or advanced.
Three-Year DataPercentage of Students Scoring at Proficient or Advanced
Special Schools OCDE California
Subject 13-14 14-15 15-16 13-14 14-15 15-16 13-14 14-15 15-16
Science v v 42% 29% 25% 32% 60% 56% 54%

OCDE: Special Schools ProgramSARC 5
CAASPP Results by Student Group: English Language Arts and Mathematics - Grade 3
Percentage of Students Meeting or Exceeding State Standards 2015-16 School Year
English Language Arts: Grade 3
Group Total Enrollment Number Tested Percentage Tested Percentage Met or Exceeded
All students 22 11 50.00% 0.00%
Male 13 5 38.50% 0.00%
Female v v v v
Black or African-American v v v v
American Indian or Alaska Native v v v v
Asian v v v v
Filipino v v v v
Hispanic or Latino 15 9 60.00% 0.00%
Native Hawaiian or Pacific Islander v v v v
White v v v v
Two or more races v v v v
Socioeconomically disadvantaged v v v v
English learners v v v v
Students with disabilities 22 11 50.00% 0.00%
Students receiving Migrant Education services v v v v
Foster youth v v v v
Mathematics: Grade 3
Group Total Enrollment Number Tested Percentage Tested Percentage Met or Exceeded
All students 22 11 50.00% 0.00%
Male 13 6 46.20% 0.00%
Female v v v v
Black or African-American v v v v
American Indian or Alaska Native v v v v
Asian v v v v
Filipino v v v v
Hispanic or Latino 15 9 60.00% 0.00%
Native Hawaiian or Pacific Islander v v v v
White v v v v
Two or more races v v v v
Socioeconomically disadvantaged v v v v
English learners v v v v
Students with disabilities 22 11 50.00% 0.00%
Students receiving Migrant Education services v v v v
Foster youth v v v v
v Scores are not shown when the number of students tested is 10 or fewer, either because the number of students tested in this category is too small for statistical accuracy or to protect student privacy.

OCDE: Special Schools ProgramSARC 6
CAASPP Results by Student Group: English Language Arts and Mathematics - Grade 4
Percentage of Students Meeting or Exceeding State Standards 2015-16 School Year
English Language Arts: Grade 4
Group Total Enrollment Number Tested Percentage Tested Percentage Met or Exceeded
All students 13 6 46.20% 0.00%
Male v v v v
Female v v v v
Black or African-American v v v v
American Indian or Alaska Native v v v v
Asian v v v v
Filipino v v v v
Hispanic or Latino v v v v
Native Hawaiian or Pacific Islander v v v v
White v v v v
Two or more races v v v v
Socioeconomically disadvantaged v v v v
English learners v v v v
Students with disabilities 13 6 46.20% 0.00%
Students receiving Migrant Education services v v v v
Foster youth v v v v
Mathematics: Grade 4
Group Total Enrollment Number Tested Percentage Tested Percentage Met or Exceeded
All students 13 6 46.20% 0.00%
Male v v v v
Female v v v v
Black or African-American v v v v
American Indian or Alaska Native v v v v
Asian v v v v
Filipino v v v v
Hispanic or Latino v v v v
Native Hawaiian or Pacific Islander v v v v
White v v v v
Two or more races v v v v
Socioeconomically disadvantaged v v v v
English learners v v v v
Students with disabilities 13 6 46.20% 0.00%
Students receiving Migrant Education services v v v v
Foster youth v v v v
v Scores are not shown when the number of students tested is 10 or fewer, either because the number of students tested in this category is too small for statistical accuracy or to protect student privacy.

OCDE: Special Schools ProgramSARC 7
CAASPP Results by Student Group: English Language Arts and Mathematics - Grade 5
Percentage of Students Meeting or Exceeding State Standards 2015-16 School Year
English Language Arts: Grade 5
Group Total Enrollment Number Tested Percentage Tested Percentage Met or Exceeded
All students 23 12 52.20% 0.00%
Male v v v v
Female 13 8 61.50% 0.00%
Black or African-American v v v v
American Indian or Alaska Native v v v v
Asian v v v v
Filipino v v v v
Hispanic or Latino 13 7 53.90% 0.00%
Native Hawaiian or Pacific Islander v v v v
White v v v v
Two or more races v v v v
Socioeconomically disadvantaged v v v v
English learners v v v v
Students with disabilities 23 12 52.20% 0.00%
Students receiving Migrant Education services v v v v
Foster youth v v v v
Mathematics: Grade 5
Group Total Enrollment Number Tested Percentage Tested Percentage Met or Exceeded
All students 23 12 52.20% 0.00%
Male v v v v
Female 13 8 61.50% 0.00%
Black or African-American v v v v
American Indian or Alaska Native v v v v
Asian v v v v
Filipino v v v v
Hispanic or Latino 13 7 53.90% 0.00%
Native Hawaiian or Pacific Islander v v v v
White v v v v
Two or more races v v v v
Socioeconomically disadvantaged v v v v
English learners v v v v
Students with disabilities 23 12 52.20% 0.00%
Students receiving Migrant Education services v v v v
Foster youth v v v v
v Scores are not shown when the number of students tested is 10 or fewer, either because the number of students tested in this category is too small for statistical accuracy or to protect student privacy.

OCDE: Special Schools ProgramSARC 8
CAASPP Results by Student Group: English Language Arts and Mathematics - Grade 6 CAASPP Results by Student Group: English Language Arts and Mathematics - Grade 6
Percentage of Students Meeting or Exceeding State Standards 2015-16 School Year
English Language Arts: Grade 6
Group Total Enrollment Number Tested Percentage Tested Percentage Met or Exceeded
All students 13 10 76.90% 0.00%
Male v v v v
Female v v v v
Black or African-American v v v v
American Indian or Alaska Native v v v v
Asian v v v v
Filipino v v v v
Hispanic or Latino v v v v
Native Hawaiian or Pacific Islander v v v v
White v v v v
Two or more races v v v v
Socioeconomically disadvantaged v v v v
English learners v v v v
Students with disabilities 12 10 83.30% 0.00%
Students receiving Migrant Education services v v v v
Foster youth v v v v
Mathematics: Grade 6
Group Total Enrollment Number Tested Percentage Tested Percentage Met or Exceeded
All students 13 10 76.90% 0.00%
Male v v v v
Female v v v v
Black or African-American v v v v
American Indian or Alaska Native v v v v
Asian v v v v
Filipino v v v v
Hispanic or Latino v v v v
Native Hawaiian or Pacific Islander v v v v
White v v v v
Two or more races v v v v
Socioeconomically disadvantaged v v v v
English learners v v v v
Students with disabilities 12 10 83.30% 0.00%
Students receiving Migrant Education services v v v v
Foster youth v v v v
v Scores are not shown when the number of students tested is 10 or fewer, either because the number of students tested in this category is too small for statistical accuracy or to protect student privacy.

OCDE: Special Schools ProgramSARC 9
CAASPP Results by Student Group: English Language Arts and Mathematics - Grade 7
Percentage of Students Meeting or Exceeding State Standards 2015-16 School Year
English Language Arts: Grade 7
Group Total Enrollment Number Tested Percentage Tested Percentage Met or Exceeded
All students 31 24 77.40% 4.17%
Male 18 13 72.20% 0.00%
Female 13 11 84.60% 9.09%
Black or African-American v v v v
American Indian or Alaska Native v v v v
Asian v v v v
Filipino v v v v
Hispanic or Latino 18 15 83.30% 6.67%
Native Hawaiian or Pacific Islander v v v v
White v v v v
Two or more races v v v v
Socioeconomically disadvantaged v v v v
English learners v v v v
Students with disabilities 31 24 77.40% 4.17%
Students receiving Migrant Education services v v v v
Foster youth v v v v
Mathematics: Grade 7
Group Total Enrollment Number Tested Percentage Tested Percentage Met or Exceeded
All students 31 24 77.40% 8.33%
Male 18 13 72.20% 7.69%
Female 13 11 84.60% 9.09%
Black or African-American v v v v
American Indian or Alaska Native v v v v
Asian v v v v
Filipino v v v v
Hispanic or Latino 18 15 83.30% 6.67%
Native Hawaiian or Pacific Islander v v v v
White v v v v
Two or more races v v v v
Socioeconomically disadvantaged v v v v
English learners v v v v
Students with disabilities 31 24 77.40% 8.33%
Students receiving Migrant Education services v v v v
Foster youth v v v v
v Scores are not shown when the number of students tested is 10 or fewer, either because the number of students tested in this category is too small for statistical accuracy or to protect student privacy.

OCDE: Special Schools ProgramSARC 10
CAASPP Results by Student Group: English Language Arts and Mathematics - Grade 8
Percentage of Students Meeting or Exceeding State Standards 2015-16 School Year
English Language Arts: Grade 8
Group Total Enrollment Number Tested Percentage Tested Percentage Met or Exceeded
All students 37 26 70.30% 7.69%
Male 19 11 57.90% 9.09%
Female 18 15 83.30% 6.67%
Black or African-American v v v v
American Indian or Alaska Native v v v v
Asian v v v v
Filipino v v v v
Hispanic or Latino 17 16 94.10% 6.25%
Native Hawaiian or Pacific Islander v v v v
White 11 5 45.50% 20.00%
Two or more races v v v v
Socioeconomically disadvantaged v v v v
English learners v v v v
Students with disabilities 37 26 70.30% 7.69%
Students receiving Migrant Education services v v v v
Foster youth v v v v
Mathematics: Grade 8
Group Total Enrollment Number Tested Percentage Tested Percentage Met or Exceeded
All students 37 26 70.30% 3.85%
Male 19 11 57.90% 9.09%
Female 18 15 83.30% 0.00%
Black or African-American v v v v
American Indian or Alaska Native v v v v
Asian v v v v
Filipino v v v v
Hispanic or Latino 17 16 94.10% 6.25%
Native Hawaiian or Pacific Islander v v v v
White 11 5 45.50% 0.00%
Two or more races v v v v
Socioeconomically disadvantaged v v v v
English learners v v v v
Students with disabilities 37 26 70.30% 3.85%
Students receiving Migrant Education services v v v v
Foster youth v v v v
v Scores are not shown when the number of students tested is 10 or fewer, either because the number of students tested in this category is too small for statistical accuracy or to protect student privacy.

OCDE: Special Schools ProgramSARC 11
CAASPP Results by Student Group: English Language Arts and Mathematics - Grade 11
Percentage of Students Meeting or Exceeding State Standards 2015-16 School Year
English Language Arts: Grade 11
Group Total Enrollment Number Tested Percentage Tested Percentage Met or Exceeded
All students 22 17 77.30% 12.50%
Male 13 9 69.20% 12.50%
Female v v v v
Black or African-American v v v v
American Indian or Alaska Native v v v v
Asian v v v v
Filipino v v v v
Hispanic or Latino 16 11 68.80% 20.00%
Native Hawaiian or Pacific Islander v v v v
White v v v v
Two or more races v v v v
Socioeconomically disadvantaged v v v v
English learners v v v v
Students with disabilities 22 17 77.30% 12.50%
Students receiving Migrant Education services v v v v
Foster youth v v v v
Mathematics: Grade 11
Group Total Enrollment Number Tested Percentage Tested Percentage Met or Exceeded
All students 22 17 77.30% 5.90%
Male 13 9 69.20% 11.10%
Female v v v v
Black or African-American v v v v
American Indian or Alaska Native v v v v
Asian v v v v
Filipino v v v v
Hispanic or Latino 16 11 68.80% 9.10%
Native Hawaiian or Pacific Islander v v v v
White v v v v
Two or more races v v v v
Socioeconomically disadvantaged v v v v
English learners v v v v
Students with disabilities 22 17 77.30% 5.90%
Students receiving Migrant Education services v v v v
Foster youth v v v v
v Scores are not shown when the number of students tested is 10 or fewer, either because the number of students tested in this category is too small for statistical accuracy or to protect student privacy.

OCDE: Special Schools ProgramSARC 12
Completion of High School Graduation RequirementsThis table displays school, district and California data for the percentages of students in the most recent graduating class who met all state and local graduation requirements for grade 12 completion. The formula for the completion of graduation requirements is the number of grade 12 students who met all graduation requirements divided by the number of students enrolled in grade 12 at the time of the Fall Census Day. Therefore, results may include percentages over 100 percent if students transferred into the school and graduated but were not there at the time of the Fall Census Day enrollment count. For more information, please visit www.cde.ca.gov/ci/gs/hs/hsgrmin.asp or www.cde.ca.gov/ci/gs/hs/cefhsgradreq.asp.
Graduating Class of 2015Completion of High School Graduation Requirements
Group Special Schools OCDE California
All students 12.12% 74.30% 85.66%
Black or African-American v 58.97% 76.88%
American Indian or Alaska Native v 170.00% 74.87%
Asian v 143.48% 92.78%
Filipino v 12.50% 96.80%
Hispanic or Latino 5.56% 64.39% 84.49%
Native Hawaiian or Pacific Islander v v 84.88%
White 42.86% 100.75% 87.23%
Two or more races v 134.78% 91.36%
Socioeconomically disadvantaged 5.56% 36.53% 76.61%
English learners v 50.27% 50.90%
Students with disabilities 12.12% 87.77% 68.38%
Foster youth ± ± ±
Graduation and Dropout RatesThis table displays the graduation and dropout rates for the most recent three-year period for which data is available. The four-year adjusted cohort graduation rate is the number of students who graduate in four years with a regular high school diploma divided by the number of students who form the adjusted cohort for the graduating class. From the beginning of grade 9 (or the earliest high school grade), students who are entering that grade for the first time form a cohort that is “adjusted” by adding any students who subsequently transfer into the cohort and subtracting any students who subsequently transfer out. For more information, please visit http://dq.cde.ca.gov/dataquest.
Three-Year DataGraduation and Dropout Rates
Graduation Rate Dropout Rate
12-13 13-14 14-15 12-13 13-14 14-15
Special Schools ù ù ù ù ù ù
OCDE 87.54% 88.62% 89.96% 7.30% 6.70% 5.70%
California 80.44% 80.95% 82.27% 11.40% 11.50% 10.70%
v Scores are not shown when the number of students tested is 10 or fewer, either because the number of students tested in this category is too small for statistical accuracy or to protect student privacy.
± Information is not available at this time.
County Offices of Education administered schools receive the countywide rate.ù
Course Enrollment for UC/CSU AdmissionThe table displays two measures related to the school’s courses that are required for University of California and California State University admission for the most recent year for which data is available. For more detailed information, visit http://dq.cde.ca.gov/dataquest.
UC/CSU Admission
Special Schools
2014-15 and 2015-16 School Years
Percentage of students enrolled in courses required for UC/CSU admission in 2015-16
0.00%
Percentage of graduates who completed all courses required for UC/CSU admission in 2014-15
0.00%
Admission Requirements for California’s Public UniversitiesUniversity of California: Admission require-ments for the University of California (UC) follow guidelines set forth in the Master Plan, which requires that the top one-eighth of the state’s high school graduates, as well as those transfer stu-dents who have successfully completed specified college course work, be eligible for admission to the UC. These require-ments are designed to ensure that all eligible students are adequately prepared for university-level work. For general admissions requirements, please visit the UC Admissions Information web page at http://admission.universityofcalifornia.edu.
California State University: Eligibility for admission to California State University (CSU) is determined by three factors: 1. specific high school courses, 2. grades in specified courses and test scores, and 3. graduation from high school. Some cam-puses have higher standards for particular majors or students who live outside the lo-cal campus area. Because of the number of students who apply, a few campuses have higher standards (supplementary admission criteria) for all applicants. Most CSU campuses have local admission-guarantee policies for students who graduate or transfer from high schools and colleges that are historically served by a CSU campus in that region. For admis-sion, application and fee information, see the CSU web page at www.calstate.edu/admission/admission.shtml.

OCDE: Special Schools ProgramSARC 13
Textbooks and Instructional MaterialsThe majority of the students enrolled in the OCDE program are participating in a modified or functional life skills curriculum. As a result, many of the instructional materials needed to teach this curriculum are not on the state-adopted textbook list.
In the DHH programs, there are texts available for every student, including English language learners. For students who receive instruction in the core curriculum, textbooks are chosen using the most recently board-approved textbooks from the host school district. With the Severely Handicapped population, teachers assess students using the Student Annual Needs Determination Inventory (SANDI). Modified California Content Standards serve as the guide for instruction. Teachers use the Unique Learning Systems and ST Math cur-riculums for students with moderate-to-severe disabilities.
IEP goals are aligned to grade-level content standards at various levels of implementations. Each school or-ders adapted materials and supplemental materials that make instruction relevant for the students. Assistive technology and/or augmentative alternative communication equipment and strategies are provided so that students are able to access the core curriculum.
Availability of Textbooks and Instructional MaterialsThe following lists the percentage of pupils who lack their own assigned textbooks and instructional materials.
2016-17 School YearTextbooks and Instructional Materials List
Currency of TextbooksThis table displays the date when the most recent hearing was held to adopt a resolution on the sufficiency of instructional materials.
Currency of Textbooks
2016-17 School Year
Data collection date 9/13/2016
Percentage of Students Lacking Materials by Subject
2016-17 School Year
Reading/language arts 0%
Mathematics 0%
Science 0%
History/social science 0%
Visual and performing arts 0%
Foreign language 0%
Health 0%
Science laboratory equipment 0%
Subject Textbook Adopted
English language arts McGraw-Hill (K-5) 2008
English language arts Houghton Mifflin (K-5) 1998
English language arts Corrective Reading Comprehension, SRA/McGraw-Hill (2-6)
2000
English language arts The Apple Tree Curriculum for Developing Written Language, Gander
2013
English language arts Reading Mastery, SRA/McGraw-Hill (K-6) 2008
English language arts Reading Mastery/Language Arts, SRA/McGraw-Hill (K-5) 2008
English language arts Reading, Houghton Mifflin (K-6) 2000
English language arts Language for Learning, SRA/McGraw-Hill (K-6) 2000
English language arts English to Use, AGS 2012
English language arts English, Level K-6; Houghton Mifflin 1998
English language arts Six-Way Paragraphs series 2007
English language arts Writing and Grammar: Handbook, Prentice Hall 2013
English language arts Writing and Grammar: Communication in Action, Prentice Hall
2003
English language arts Wordskills (6-12) 2001
English language arts World Literature, Pacemaker; Globe Fearon 2006
English language arts American Literature, Pacemaker; Globe Fearon 2006
English language arts Anthology Series (Readers, Students, American), Globe Fearon
1998
English language arts Goodman’s Five Star Stories, Jamestown Publishing 1996
English language arts Reading Milestones 2014
English language arts Scholastic Magazines: News (2-3); Action & Scope (3); Upfront
2014
English language arts Oxford Picture Dictionary Series 2014
English language arts Expressive Writing, Levels 1 & 2 2003
English language arts Basic English Grammar, Pacemaker 2013
English language arts Time for Kids Magazine 2014
Health Decisions for Health, Book 1 & 2 2014
Mathematics Algebra, AGS 2000
Quality of TextbooksThe following table outlines the criteria required for choosing textbooks and instructional materials.
Quality of Textbooks
2016-17 School Year
Criteria Yes/No
Are the textbooks adopted from the most recent state-approved or local governing- board-approved list?
Yes
Are the textbooks consistent with the content and cycles of the curriculum frameworks adopted by the State Board of Education?
Yes
Do all students, including English learners, have access to their own textbooks and instructional materials to use in class and to take home?
Yes
Continued on page 14

OCDE: Special Schools ProgramSARC 14
2016-17 School YearTextbooks and Instructional Materials List
Subject Textbook Adopted
Mathematics Houghton Mifflin (K-6) 2002
Mathematics Pre-Algebra, AGS 2004
Mathematics Pre-Algebra, Prentice Hall 2004
Mathematics Pearson, Prentice Hall (6) 2009
Mathematics Algebra 2, AGS 2012
Mathematics Consumer Mathematics, AGS 2012
Mathematics Life Skills Math, AGS 2012
Mathematics Geometry, Pacemaker 2011
Mathematics Algebra 2, Prentice Hall 2006-07
Mathematics Math Steps, Houghton Mifflin (K-6) 2002
Mathematics Excel Math; AnsMar Publishers, Inc. (1-5) 1999
Mathematics Basic Math Skills, AGS 1998
Mathematics Algebra Readiness, McDougal Littell 2009
Mathematics Algebra 1, Holt 2009
Mathematics Geometry, McDougal Littell 2003
Mathematics Algebra 1, Prentice Hall 2010
Mathematics Living on Your Own 2014
Mathematics Math in Focus: Singapore Math (5) 2015
Mathematics Math in Focus: Singapore Math (Course 1) 2015
Mathematics Big Ideas Math, Course 1 2016
Science Harcourt School Publishers (1-5) 2000
Science McGraw-Hill (6) 2007
Science Harcourt 1997
Science Science, Scott Foresman (K-5) 2007
Science Focus on Earth Science, Glencoe (6) 2007
Science Physical Science: Concepts and Challenges, Globe Fearon
2003
Science Earth Science: Concepts and Challenges, Globe Fearon 2000
Science Health, Globe Fearon 2003
Science Focus on Elementary Biology; Focus on Elementary Chemistry; Focus on Elementary Physics
2014
Science The Earth and Beyond, Steck Vaughn 2015
Science Life Science, PCI 2015
Social Science World History and You, Steck-Vaughn 1997
Social science Harcourt School Publishers (1-5) 2007
Social science McDougal Littell (6) 2006
Textbooks and Instructional Materials, Continued from page 13 Career Technical Education ProgramsSecondary special education students who are 16 years of age and older have Individual Transition Plans (ITPs) incorpo-rated into their IEPs. This process assists the student and family to develop postsec-ondary goals in the areas of education/training, employment and independent living. The transition planning process included development of interagency link-ages needed to obtain services and sup-ports for students leaving the school sys-tem and allows sufficient time to develop a comprehensive plan to attain success in post-school placement and integrated work. Adult Transition Programs located on the campuses of Golden West and Saddleback community colleges provided intensive transition planning services for students 18-22 years of age. The Adult Transition Programs (ATPs) are designed to help students move with maximum success from school to post-school place-ment in continuing education, community and integrated work settings. ATP students accessed the college Learning Resource Center and specialized computer lab throughout the year to maximize success in learning. Students were also enrolled in adaptive community college classes such as physical education and swimming.
Interagency collaboration included month-ly participation on the Orange County Adult Transition Task Force and the Adult Services Advisory Committee. These committees included representatives from the OCDE, Regional Center, Depart-ment of Rehabilitation, mental health, local parents, adult service providers and community colleges. In addition, the 30th anniversary edition of Orange County Department of Education Adult Services Transition Planning Resource Directory was published and distributed countywide. The directory included descriptions of 50 postsecondary continuing education programs and adult service agencies. Performance indicators and outcome information for these agencies were also provided. For more detailed information on the directory, please visit www.ocde.us/transition.
Career technical education programs of-fered by the Orange County Department of Education included vocational educa-tion and work-based learning at more than 40 business training sites. This training reflected the local job market and specifi-cally focused on preparation for work in food services, retail, grocery, hotel, cleri-cal, mail services, janitorial and door-to-door delivery. Students also gained work experience through volunteer service at organizations such as Assistance League, a senior assisted-living facility, and a local food bank.
Continued on page 15
Continued on page 15

OCDE: Special Schools ProgramSARC 15
2016-17 School YearTextbooks and Instructional Materials List
Subject Textbook Adopted
Social science Reflections: California, Harcourt (K-5) 2007
Social science Maps, Globes, Graphs; Level A-F; Steck-Vaughn 1996
Social science Social Studies, Level A-F; Steck-Vaughn 1996
Social science United States History, Globe Fearon 2002
Social science American Government: Freedom, Rights, Responsibilities; Steck-Vaughn
1998
Social science Government Today, The People’s Publishing 2002
Social science Economics: Concepts and Applications, Steck-Vaughn 2002
Social science Magruder’s American Government and Foundations Series, Pearson
2013
Social science Prentice Hall Economics & Foundation Series, Pearson 2013
Social science United States Government, PCI 2009
Social science U.S. Law, PCI 2009
Social science United States Citizenship, PCI 2009
Social science Economics, PCI 2009
Social science Economics, Pacemaker 2015
Social science American Government, Pacemaker 2015
History/social science World History, McDougal Littell 2006
U.S. history America’s Story, Steck-Vaughn 2007-08
Global History of Our World, Steck-Vaughn 2007-08
Textbooks and Instructional Materials, Continued from page 14
Special Schools OCDE
Program Improvement status Not Title I In PI
First year of Program Improvement ² 2005-2006
Year in Program Improvement ² Year 3
Number of schools currently in Program Improvement 2
Percentage of schools currently in Program Improvement 100.00%
2016-17 School YearFederal Intervention Program
Federal Intervention ProgramSchools and districts will not be newly identified for Program Improvement (PI) in the 2016-17 school year under the Every Student Succeeds Act (ESSA) that became law in December 2015, which reauthorized the Elementary and Secondary Education Act (ESEA). Schools and districts receiving Title I, Part A funding for the 2015-16 school year and were “In PI” in 2015-16 will retain their same PI status and placement year for 2016-17. Schools and districts receiving Title I, Part A funding for the 2015-16 school year and either had a status of “Not in PI” for the 2015-16 school year or did not receive Title I, Part A funding in the 2014-15 school year will have a status of “Not in PI” for the 2016-17 school year. The percentage of schools identified for Program Improvement is calculated by taking the number of schools currently in PI within the district and dividing it by the total number of Title I schools within the district.
This table displays the 2016-17 Program Improvement status for the school and district. For detailed information about PI identification, please visit www.cde.ca.gov/ta/ac/ay/tidetermine.asp.
²Not applicable. The school is not in Program Improvement.
Career Technical Education ProgramsContinued from page 14
Students attending the Deaf and Hard of Hearing Program located at Univer-sity High School begin their transition planning during their freshman year. As sophomores, students attend a sopho-more conference to plan the remainder of their secondary coursework, and to learn about the agencies that will provide services to them as they exit high school and enter the adult world. At any one time during the school year, more than 30 percent of the DHH students are enrolled in ROP courses, going on job shadows or are holding down paying part-time jobs. Seniors meet their Department of Reha-bilitation counselors in January and make the final preparation for their transition to a variety of educational and employment programs, including the DHH Adult Transi-tion Program located on the campus of Orange Coast College.
Career Technical Education ParticipationThis table displays information about participation in the school’s Career Technical Education (CTE) programs.
Career Technical Education Data
Special Schools
2015-16 Participation
Number of pupils participating in a CTE program
0
Percentage of pupils who completed a CTE program and earned a high school diploma
0.00%
Percentage of CTE courses that are sequenced or articulated between a school and institutions of postsecondary education
0.00%
Advanced Placement Courses No information is available for Orange County Special Education regarding Ad-vanced Placement (AP) courses.

OCDE: Special Schools ProgramSARC 16
• Systems: Gas systems and pipes, sewer, mechanical systems (heating, ventilation and air-conditioning)
• Interior: Interior surfaces (floors, ceilings, walls and window casings)
• Cleanliness: Pest/vermin control, overall cleanliness (school grounds, buildings, rooms and common areas)
• Electrical: Electrical systems (interior and exterior)
• Restrooms/fountains: Restrooms, sinks and drinking fountains (interior and exterior)
• Safety: Fire-safety equipment, emergency systems, hazardous materials (interior and exterior)
• Structural: Structural condition, roofs
• External: Windows/doors/gates/fences, playgrounds/school grounds
School Facility Items Inspected The tables show the results of the school’s most recent inspection using the Facility Inspection Tool (FIT) or equivalent school form. The following is a list of items inspected.
School FacilitiesContinued from left
The host districts are generally respon-sible for maintaining the condition of the facility and the grounds. OCDE works cooperatively with all its host districts to maintain an environment that supports student access to instruction. The Hillview High School facility was renovated by the Tustin Unified School District during the 2011-12 school year, reopening in Sep-tember 2012. In 2015, OCDE renovated Trident Special Classes jointly with the Anaheim Union High School District. Stu-dents from another site were transferred to Trident in September 2015.
The general condition of the sites where OCDE’s programs are housed is good. OCDE has eight custodians who work before, during and after school hours to ensure our facilities are cleaned and sanitized on a daily basis.
The majority of the students in the Special Schools Program receive home-to-school bus transportation. Classroom staff mem-bers meet the buses in the morning, and the students are escorted to their buses in the afternoon. Students are always within direct visual contact of school personnel. Visitors must sign in at the school office and receive a visitor’s pass to enter the campuses.
School Facility Good Repair Status This inspection determines the school facility’s good repair status using ratings of good condition, fair condi-tion or poor condition. The overall summary of facility conditions uses ratings of exemplary, good, fair or poor.
School Facility Good Repair Status 2016-17 School Year
Items Inspected Repair Status Items Inspected Repair Status
Systems Good Restrooms/fountains Good
Interior Good Safety Good
Cleanliness Good Structural Good
Electrical Good External Good
Overall summary of facility conditions Good
Date of the most recent school site inspection 11/14-17/2016
Date of the most recent completion of the inspection form 11/14-17/2016
School FacilitiesThe Special Schools Programs of the Orange County Department of Education provides instructional ser-vices for students with moderate to severe disabilities on 15 different school sites in eight Orange County school districts and on three community college campuses. The number of classrooms on these sites ranges from one to 10. Two of the sites, Philip J. Reilly Elementary School in Capistrano Unified School District and University High School in Irvine Unified School District, were the result of joint building projects between OCDE and the host district. These two sites have features unique to students with special needs (e.g., auto-matic doors and bathroom facilities in the classroom and video technology).
Continued on sidebar
California Physical Fitness TestEach spring, all students in grades 5, 7 and 9 are required to participate in the California Physical Fitness Test (PFT). The Fitnessgram® is the designated PFT for students in California public schools put forth by the State Board of Education. The PFT measures six key fitness areas:
1. Aerobic Capacity
2. Body Composition
3. Flexibility
4. Abdominal Strength and Endurance
5. Upper Body Strength and Endurance
6. Trunk Extensor Strength and Flexibility
Encouraging and assisting students in establishing lifelong habits of regular physical activity is the primary goal of the Fitnessgram. To protect student privacy, scores are not shown when the number of students tested is 10 or fewer. For more detailed information on the California PFT, please visit www.cde.ca.gov/ta/tg/pf.
Deficiencies and RepairsThe table lists the repairs required for all deficiencies found during the site inspection. Regardless of each item’s repair status, all deficiencies are listed.
2016-17 School YearDeficiencies and Repairs
Items Inspected Deficiencies, Action Taken or Planned, and Date of Action
Interior Some damaged/peeling wall paper inside classrooms. Work orders submitted to address the issue. Repairs were completed December 2016-February 2017.
Cleanliness Damaged/stained ceiling tiles. Work orders submitted to address the issue. Repairs were completed December 2016-February 2017.
Safety Secure tall cabinets to wall/floor. Work orders submitted to address the issue. Repairs were completed December 2016-February 2017.
ExternalTermite damage to exterior of portables and some paint chipping. Work orders submitted to address the issue. Repairs were completed December 2016-February 2017.

OCDE: Special Schools ProgramSARC 17
Teacher Misassignments and Vacant Teacher PositionsThis table displays the number of teacher misassignments (positions filled by teachers who lack legal authorization to teach that grade level, subject area, student group, etc.) and the number of vacant teacher positions (not filled by a single designated teacher assigned to teach the entire course at the beginning of the school year or semester). Please note that total teacher misassignments includes the number of teacher misassignments of English learners.
Three-Year DataTeacher Misassignments and Vacant Teacher Positions
Special Schools
Teachers 14-15 15-16 16-17
Teacher misassignments of English learners 0 0 0
Total teacher misassignments 0 0 0
Vacant teacher positions 0 1 0
Core Academic Classes Taught by Highly Qualified TeachersHigh-poverty schools are defined as those schools with student eligibility of approximately 40 percent or more in the free and reduced-priced meals program. Low-poverty schools are those with student eligibility of approximately 39 percent or less in the free and reduced-priced meals program. For more information about ESEA teacher requirements, visit www.cde.ca.gov/nclb/sr/tq.
2015-16 School YearHighly Qualified Teachers
Percentage of Classes in Core Academic Subjects
Taught by Highly Qualified Teachers
Not Taught by Highly Qualified Teachers
Special Schools ± ±
All schools in district 98.76% 1.24%
High-poverty schools in district 99.67% 0.33%
Low-poverty schools in district 96.04% 3.96%
Teacher QualificationsThis table shows information about teacher credentials and teacher qualifications. Teachers without a full credential include teachers with district and university internships, pre-internships, emergency or other permits, and waivers. For more information on teacher credentials, visit www.ctc.ca.gov.
Three-Year Data
OCDE Special Schools
Teachers 16-17 14-15 15-16 16-17
With a full credential 279 62 61 61
Without a full credential 6 3 6 6
Teaching outside subject area of competence (with full credential) 0 0 0 0
Teacher Credential InformationAcademic Counselors and School Support StaffThis table displays information about aca-demic counselors and support staff at the school and their full-time equivalent (FTE).
Academic Counselors and School Support Staff Data
2015-16 School Year
Academic Counselors
FTE of academic counselors 1.0
Average number of students per academic counselor 100
Support Staff FTE
Social/behavioral counselor 0.00
Career development counselor 0.00
Library media teacher (librarian) 0.00
Library media services staff (paraprofessional) 0.00
Psychologist 5.97
Social worker 0.00
Nurse 5.88
Speech/language/hearing specialist 10.88
Resource specialist (nonteaching) 0.00
Other FTE
Audiologist 3.00
Occupational therapist 3.91
Physical therapist 0.91
Teacher of the visually impaired 1.00
Orientation and mobility specialist 1.00
Adapted physical education teacher 4.97
Assistive technology specialist 0.96
Vocational specialist 0.93
± Information is not available at this time.
2013-14 School Accountability Report Card
Data for this year’s SARC was provided by the California Department of Education and school and district offices. For additional information on California schools and districts and comparisons of the school to the district, the county and the state, please visit DataQuest at http://data1.cde.ca.gov/dataquest. DataQuest is an online resource that provides reports for accountability, test data, enrollment, graduates, dropouts, course enrollments, staffing and data regarding English learners. Per Education Code Section 35256, each school district shall make hard copies of its annually updated report card available, upon request, on or before February 1.
All data accurate as of January 2017.
School Accountability Report Card
PUBLISHED BY:
www.sia-us.com | 800.487.9234
OCDE: Special Schools ProgramSARC 18
Financial Data The financial data displayed in this SARC is from the 2014-15 fiscal year. The most current fiscal information available provided by the state is always two years behind the current school year and one year behind most other data included in this report. For detailed information on school expenditures for all districts in California, see the California Department of Education (CDE) Current Expense of Education & Per-pupil Spending web page at www.cde.ca.gov/ds/fd/ec. For information on teacher salaries for all districts in California, see the CDE Certificated Salaries & Benefits web page at www.cde.ca.gov/ds/fd/cs. To look up expenditures and salaries for a specific school district, see the Ed-Data website at www.ed-data.org.
School Financial DataThe following table displays the school’s average teacher salary and a breakdown of the school’s expenditures per pupil from unrestricted and restricted sources.
School Financial Data
2014-15 Fiscal Year
Total expenditures per pupil $17,000
Expenditures per pupil from restricted sources $0
Expenditures per pupil from unrestricted sources $17,000
Annual average teacher salary $104,387
Expenditures Per PupilSupplemental/restricted expenditures come from money whose use is controlled by law or by a donor. Money that is designated for specific purposes by the district or governing board is not considered restricted. Basic/unrestricted expenditures are from money whose use, except for general guidelines, is not controlled by law or by a donor.
Types of Services FundedThe Orange County Department of Spe-cial Education does not receive categori-cal funds.
District Financial DataThis table displays district teacher and administrative salary information and compares the figures to the state averages for districts of the same type and size based on the salary schedule. Note: The district salary data does not include benefits.
2014-15 Fiscal YearDistrict Salary Data
OCDE Similar Sized District
Beginning teacher salary µ µ
Midrange teacher salary µ µ
Highest teacher salary µ µ
Average elementary school principal salary µ µ
Average middle school principal salary µ µ
Average high school principal salary µ µ
Superintendent salary µ µ
Teacher salaries: percentage of budget µ µ
Administrative salaries: percentage of budget µ µ
Financial Data ComparisonThis table displays the school’s per-pupil expenditures from unrestricted sources and the school’s average teacher salary and compares it to the district and state data.
2014-15 Fiscal YearFinancial Data ComparisonExpenditures
Per Pupil From Unrestricted Sources
Annual Average Teacher Salary
Special Schools $17,000 $104,387
OCDE $9,473 $109,743
California $5,677 ±
School and district: percentage difference +79.4% -4.9%
School and California: percentage difference +199.4% u
u The percentage difference cannot be calculated because California Annual Average Teacher Salary is not available.
± Data is not available.µ County Offices of Education that operate schools are not required to report this data.