department of economics working paper series an examination of
TRANSCRIPT

Department of Economics Working Paper Series
http://www.american.edu/academic.depts/cas/econ/working
papers/workpap.htm
Copyright © 2008 by Robert M. Feinberg and Kara M. Reynolds. All rights reserved. Readers may make verbatim copies of this document for non-commercial purposes by any means, provided that this copyright notice appears on all such copies.
An Examination of Entry and Competitive
Performance in Rural Banking Markets
by
Robert M. Feinberg and Kara M. Reynolds
No. 2008-05 May 2008
2
An Examination of Entry and Competitive Performance in Rural
Banking Markets
Robert M. Feinberg and Kara M. Reynolds**
Abstract
This paper explores the change in the level of competition in rural banking markets since the deregulation that occurred following passage of the Riegle Neal Act of 1994. Using an empirical model that utilizes both the number of banks and the value of deposits in a cross-section of rural markets, we decompose the impact of the entry of new banks into resulting changes in per capita demand and the costs/profits of local banks in both 1994 and 2004. We conclude that the banking market is more competitive today despite the fact that the number of banks may have declined; on average fewer banks are now needed to make rural banking markets competitive than were needed in 1994. Key words: Entry, Banking JEL classification: L11
** American University. Contact: Robert M. Feinberg, Department of Economics, American University, 4400 Massachusetts Avenue, NW, Washington, DC 20016-8029. Email: [email protected].
3
Introduction
The 1994 Riegle Neal Act ushered forth a new era in banking deregulation. As
noted by former Federal Reserve Chairman Alan Greenspan in a 2005 speech,
deregulation resulted in a 50 percent decline in the number of banks due to industry
consolidation. However, this decline did not necessarily indicate that the level of
competition declined; Greenspan (2005) went on in his speech to emphasize that despite
the decline in the number of banks, measures of local market banking competition
remained relatively stable between 1990 and 2005.
This paper explores the change in the level of competition in rural banking
markets since passage of the 1994 Riegle Neal Act. Using an empirical model recently
developed that utilizes the number of banks as well as the value of deposits in a cross-
section of rural markets, we decompose the impact of the entry of new banks into
resulting changes in per capita demand and the costs/profits of local banks in both 1994
and 2004. We conclude that the banking market is more competitive today; on average
fewer banks are need to make rural banking markets “competitive” today than were
needed in 1994.
Literature Review
There is a long empirical literature on entry – both determinants and effects –
usually based on manufacturing industry data. Early banking entry papers include
Hanweck (1971) and Rose (1977). More recently, Amel and Liang (1997) present
interesting results on bank entry fairly closely related to this paper’s focus. They jointly

4
explain bank profits and entry over the 1977-88 period for about 2,000 rural counties and
about 300 urban markets (metropolitan statistical areas), and find that supranormal profits
promote entry as does population and population growth, and that entry has the
anticipated pro-competitive effect of reducing profits – though only in rural markets.
Most of the previous studies looked at bank entry in the pre-Riegle-Neal Act
(banking deregulation) period. However, since then Berger et al (2004), Seelig and
Critchfield (2003), and Keeton (2000) have all found – though with somewhat differing
definitions of merger activity and samples – that merger activity generally tends to
promote de novo entry. These findings are consistent with merger activity and/or the
presence of “big banks” in a market as signaling to potential entrants the opportunities for
supranormal profits to be earned.1
Others have recently studied market dynamics in local banking markets. Both
Dick (2007) and Cohen and Mazzeo (2007b) find that the incumbent banks in markets
tend to expand via new branches to aid in deterring new entry when demand grows.
Similarly, Berger and Dick (2007) find that early entrants in banking markets seem to be
able to entrench their positions and have persistently higher market shares.
The work by Bresnahan and Reiss (1991) stimulated a wave of empirical research
on entry. They explain entry in terms of the cross-sectional response to market size and
1 A similar result is found in a non-banking context by Toivanen and Waterson (2005) who explain patterns of fast food entry in the UK by market structure and find that the presence of a major rival increases entry (this presence is viewed as a proxy for future growth and a means of learning by the potential entrant).

5
interpret an increasing population to firm ratio as a strengthening of competition
(requiring more competitive pricing); in other words, the fact that larger sales are
required to offset the fixed costs of entry implies more competitive pricing. A discrete
choice model relates these “entry thresholds” and how they change with subsequent entry
to predictions about price behavior associated with increasing numbers of firms.
Bresnahan and Reiss (1991) take the view that isolated rural markets are best suited to
testing hypotheses regarding entry, generally because of the difficulty in accurately
drawing market boundaries in metropolitan areas or even in rural counties adjacent to
MSAs.
Cetorelli (2002) uses the Bresnahan and Reiss (1991) (BR) methodology to
examine local banking markets and explain (equilibrium) market structure by population
and other county economic characteristics; the paper analyzes numbers of banks in a
large sample of non-metropolitan counties for 1999. While we would argue that
contiguous rural counties may not represent the most appropriate geographic market
definition for local banking, based on his estimated ordered probit coefficients,
significant market power is suggested at least until the number of banks in a county
reaches five in number.2
Cohen and Mazzeo (2007a) apply a variant of the BR approach to rural banking
markets. They look at data for a large number of rural banking markets in 2000 and 2003
to examine the nature of competition within and across three types of institutions –
2 Adams and Amel (2007) present further results on bank entry, also finding past entry to induce future entry, and also provides a nice literature review of the previous bank entry literature.

6
multimarket banks, single-market banks, and thrifts. As in this paper, they choose to
define markets in terms of BLS “labor market areas” which combines contiguous
counties depending on commuting patterns to better proxy geographical markets for
financial services. Cohen and Mazzeo (2007a) find significant product differentiation
(that competition within types is more aggressive than across types) and that variable
profits are significantly reduced by the second firm in a given type, this reduction
becoming smaller for subsequent entry.
We also use a variant of the BR approach. However, unlike Cetorelli (2002) we
consider only rural counties at least one county removed from an MSA and not adjacent
to any other sample county. We also consider the issue of banking competition in small
rural markets in a somewhat different manner than Cetorelli (2002) and Cohen and
Mazzeo (2007a), applying the methodology of Abraham et al (2007) which attempts to
sort out the roles of increased competition and changes in fixed costs as the number of
firms in a market increases.3
Abraham et al. (2007) extend the BR approach by incorporating information on
quantity to analyze the level of competition in the U.S. hospital industry. They claim (p.
266) that using information about quantity “allows us to separate changes in fixed cost
associated with entry from changes in the toughness of competition.” They find, in their
sample of hospital markets, that relatively few firms are required to bring competitive
3 A somewhat similar approach was adopted by Asplund and Sandin (1999) in a study of local competition among Swedish driving schools.
7
behavior (by reducing variable profits and increasing market quantity), with limited
effects beyond three firms in a market.
This paper applies the Abraham et. al. (2007) methodology to local banking
markets in rural markets.4 Our sample of markets is smaller than that used in other recent
studies of banking entry, but more broadly representative of the nation; we consider 115
rural markets (across 44 states) in the U.S., and explain bank and thrift entry in 1994 and
2004, with particular interest in the implications of this entry on the nature of competition
in these markets, and whether the nature of competition in local banking markets has
changed ten years after the Riegle-Neal deregulation of branching.
Descriptive Statistics
The data sources used are the FDIC’s Summary of Deposits Data, and the Federal
Reserve System’s National Information System, along with Census population, land area
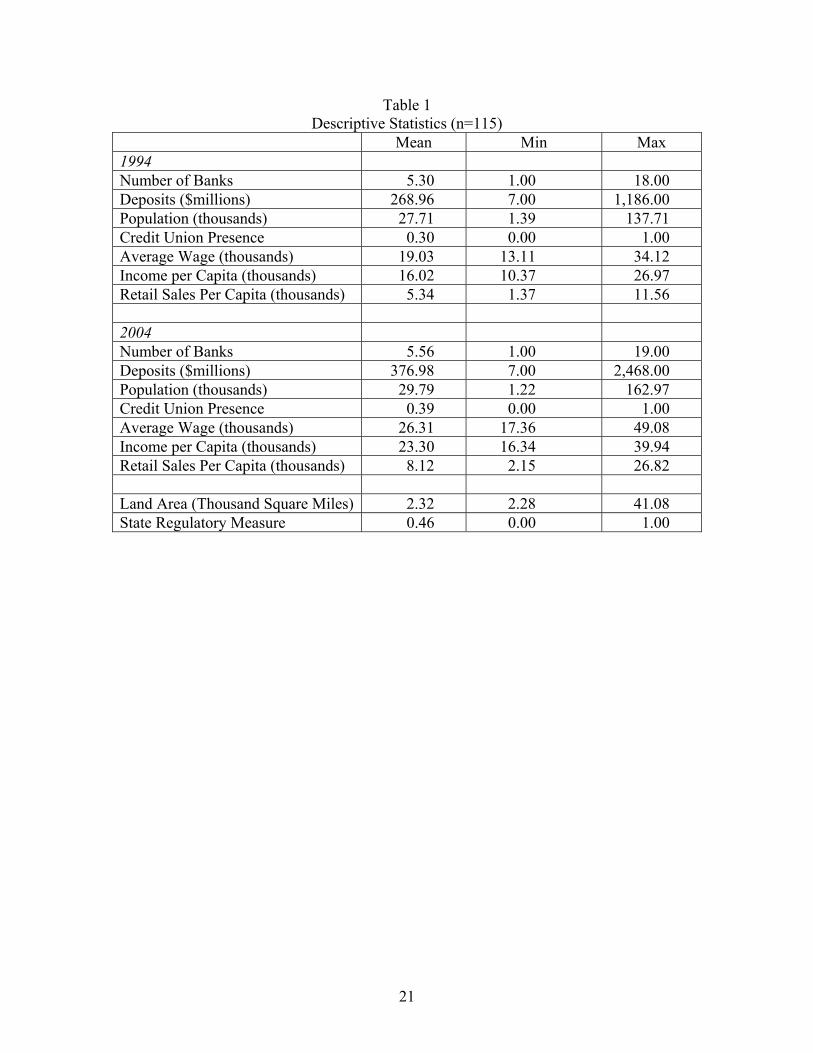
and retail sales estimates, and BEA personal income and wage estimates. Table 1
presents some descriptive statistics on the sample of 115 non-metropolitan BLS “labor
market areas” (LMAs) for 1994 and 2004.5 Initially, counties – no more than three from
any one state -- were chosen from all those at least one county away from a metropolitan
statistical area and not adjacent to another in the sample. Some of these were then
4 An earlier paper, Feinberg (2007), used some of the data examined here to take a somewhat more descriptive look at rural bank entry issues. 5 The sample of LMAs is presented in the appendix.
8
combined with one or two adjacent counties to correspond to the BLS labor market
areas.6
The limit on the number of markets chosen per state was designed to ensure a
broad geographic balance in the sample; the alternative – including all rural counties (as
in Cetorelli (2002)) or all small rural labor market areas (as in Cohen and Mazzeo
(2007a,b)) -- can lead to a disproportionate weighting on a small number of primarily
rural states.7 The choice of rural markets somewhat isolated from metropolitan areas
(and from each other) was designed, as discussed in Bresnahan and Reiss (1991), to allow
for more accurate measurement of market entry.8 The choice of the two time periods,
1994 and 2004, allows us to examine the implications for competitive behavior in local
banking markets of the surge in bank branching activity occurring after the passage of the
Riegle-Neal Act in 1994.
Many of the markets are quite small, with an average population in 1994 of
27,710 (ranging in size from 1,390 to 137,710). The mean number of banking
institutions per market was 5.3 in 1994 (rising slightly to 5.6 by 2004), varying between 1
6 Four of these counties were in labor market areas which changed geographic boundaries between 1994 and 2004; these were dropped from the analysis. 7 For example, 5 states (Texas, Georgia, Kansas, Kentucky, and Nebraska) have more than twenty-five percent of all rural counties in the US. Another grouping of 5 states (Kansas, Kentucky, Nebraska, Missouri, and Iowa), with collectively 6.0% of the nation's population, has more than twenty percent of all rural counties. 8 Due to this relative isolation from nearby markets, we ignore market characteristics in neighboring regions – for work noting the impact of distance on lending decisions, see Degryse and Ongena (2005) and Agarwal and Hauswald (2006).
9
and 18;9 while certainly distinctions remain, we consider both banks and thrifts as
“banking institutions” and do not (as do Cohen and Mazzeo) address the issue of how
closely competitive they are.10 We do, however, consider credit unions as a competitive
threat to both banks and thrifts, especially in small rural markets (and include a credit
union variable as a demand shifter).
The average population per bank/thrift is only about 5,000. The data suggest
surprisingly low thresholds for multiple banks and thrifts -- only below populations of
around 2,300 does monopoly banking seem the norm. Five of the six markets with mean
populations of 2,300 or less over the 1994-2004 period had monopoly banks or thrifts
both years.11 In contrast, of the 21 somewhat larger markets up to 10,000 in population,
only 3 had monopoly banks in any of the three years. At the other end of the spectrum
there are four relatively large markets which may be outliers in the sample, two in
Hawaii, one in South Carolina, and one in California – all with at least 115,000 in
population all three sample years, while the next largest is more than 20,000 smaller.
However, results are not sensitive to the inclusion of both these very large and the very
smallest rural markets.
In order to implement the Abraham et al methodology, a measure of output is
needed; we choose bank/thrift deposits as this variable. While, on the one hand, this may 9There are 7 markets (in 1994) with one bank, 14 with two, 21 with three, 18 with four, 12 with 5, 13 with 6, 7 with seven, 5 with eight, 4 with nine, and 14 with ten or more banks. 10 For a nice concise discussion of similarities (and some differences) between banks and thrifts, see http://www.frbsf.org/econrsrch/wklyltr/wklyltr98/el98-13.html 11 An issue for future research is to investigate the role of other financial institutions, especially credit unions, in these monopoly banking markets.
10
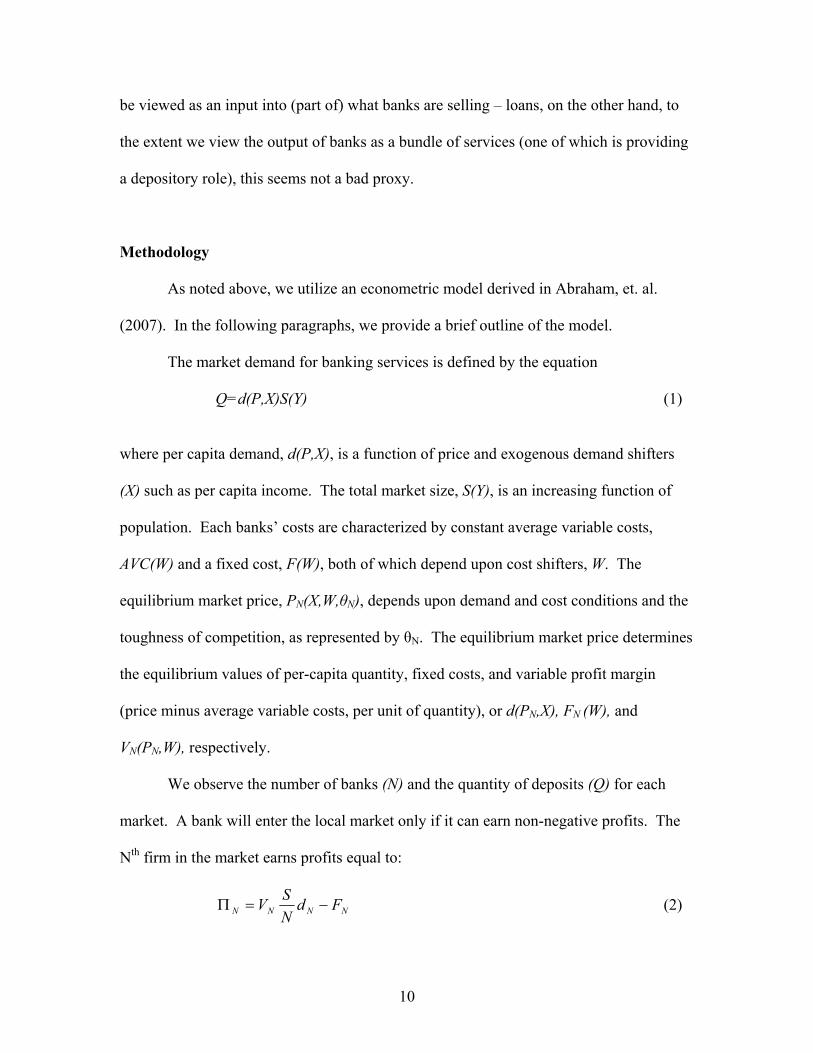
be viewed as an input into (part of) what banks are selling – loans, on the other hand, to
the extent we view the output of banks as a bundle of services (one of which is providing
a depository role), this seems not a bad proxy.
Methodology
As noted above, we utilize an econometric model derived in Abraham, et. al.
(2007). In the following paragraphs, we provide a brief outline of the model.
The market demand for banking services is defined by the equation Q=d(P,X)S(Y) (1)
where per capita demand, d(P,X), is a function of price and exogenous demand shifters
(X) such as per capita income. The total market size, S(Y), is an increasing function of
population. Each banks’ costs are characterized by constant average variable costs,
AVC(W) and a fixed cost, F(W), both of which depend upon cost shifters, W. The
equilibrium market price, PN(X,W,θN), depends upon demand and cost conditions and the
toughness of competition, as represented by θN. The equilibrium market price determines
the equilibrium values of per-capita quantity, fixed costs, and variable profit margin
(price minus average variable costs, per unit of quantity), or d(PN,X), FN (W), and
VN(PN,W), respectively.
We observe the number of banks (N) and the quantity of deposits (Q) for each
market. A bank will enter the local market only if it can earn non-negative profits. The
Nth firm in the market earns profits equal to:
NNNN FdNSV −=Π (2)
11
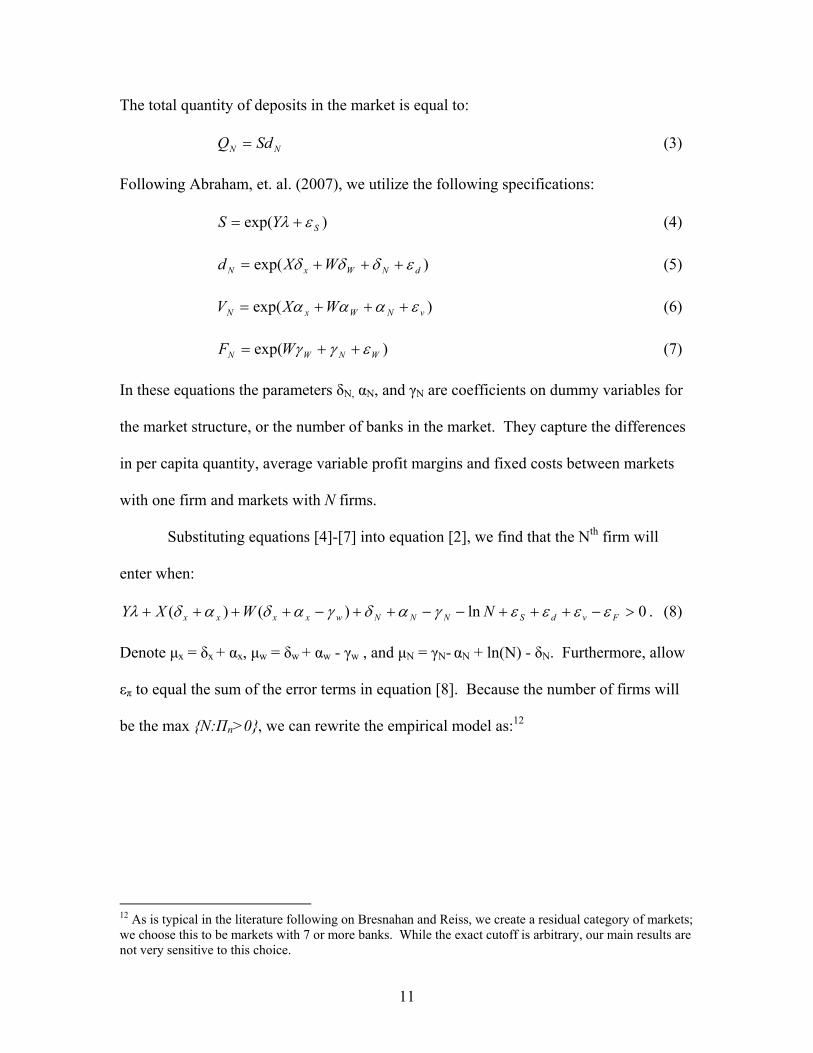
The total quantity of deposits in the market is equal to:
NN SdQ = (3)
Following Abraham, et. al. (2007), we utilize the following specifications:
)exp( SYS ελ += (4)
)exp( dNWxN WXd εδδδ +++= (5)
vNWxN WXV εααα +++= exp( ) (6)
)exp( WNWN WF εγγ ++= (7)
In these equations the parameters δN, αN, and γN are coefficients on dummy variables for
the market structure, or the number of banks in the market. They capture the differences
in per capita quantity, average variable profit margins and fixed costs between markets
with one firm and markets with N firms.
Substituting equations [4]-[7] into equation [2], we find that the Nth firm will
enter when:
0ln)()( >−+++−−++−++++ FvdSNNNwxxxx NWXY εεεεγαδγαδαδλ . (8)
Denote µx = δx + αx, µw = δw + αw - γw , and µN = γN- αN + ln(N) - δN. Furthermore, allow
επ to equal the sum of the error terms in equation [8]. Because the number of firms will
be the max {N:Πn>0}, we can rewrite the empirical model as:12
12 As is typical in the literature following on Bresnahan and Reiss, we create a residual category of markets; we choose this to be markets with 7 or more banks. While the exact cutoff is arbitrary, our main results are not very sensitive to this choice.
12
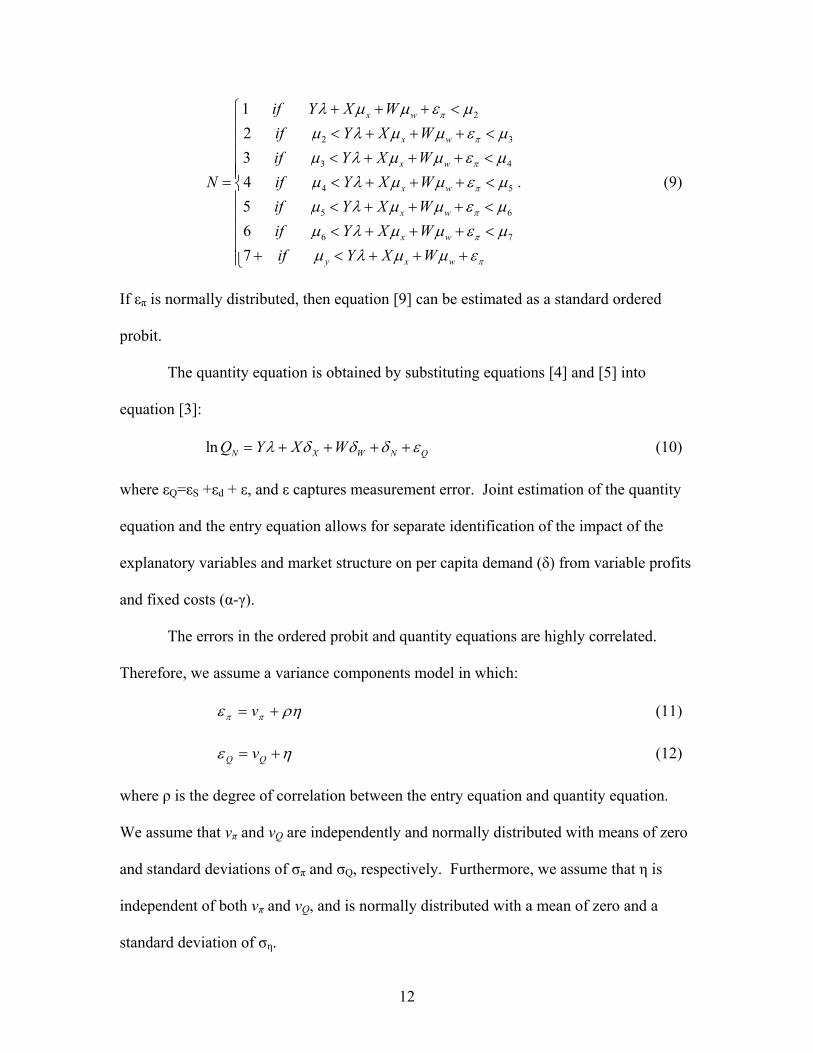
2
2 3
3 4
4 5
5 6
6 7
1234567
x w
x w
x w
x w
x w
x w
y x w
if Y X Wif Y X Wif Y X W
N if Y X Wif Y X Wif Y X Wif Y X W
π
π
π
π
π
π
π
λ µ µ ε µµ λ µ µ ε µµ λ µ µ ε µµ λ µ µ ε µµ λ µ µ ε µµ λ µ µ ε µµ λ µ µ ε
⎧ + + + <⎪
< + + + <⎪⎪ < + + + <⎪⎪= < + + + <⎨⎪ < + + + <⎪⎪ < + + + <⎪ + < + + +⎪⎩
. (9)
If επ is normally distributed, then equation [9] can be estimated as a standard ordered
probit.
The quantity equation is obtained by substituting equations [4] and [5] into
equation [3]:
ln N X W N QQ Y X Wλ δ δ δ ε= + + + + (10)
where εQ=εS +εd + ε, and ε captures measurement error. Joint estimation of the quantity
equation and the entry equation allows for separate identification of the impact of the
explanatory variables and market structure on per capita demand (δ) from variable profits
and fixed costs (α-γ).
The errors in the ordered probit and quantity equations are highly correlated.
Therefore, we assume a variance components model in which:
ρηε ππ += v (11) ηε += QQ v (12) where ρ is the degree of correlation between the entry equation and quantity equation.
We assume that vπ and vQ are independently and normally distributed with means of zero
and standard deviations of σπ and σQ, respectively. Furthermore, we assume that η is
independent of both vπ and vQ, and is normally distributed with a mean of zero and a
standard deviation of ση.
13
The model is estimated using maximum simulated likelihood. Guassian
quadrature techniques are utilized to integrate the likelihood function over the
distribution of η . To identify the selection model inherent in the entry equation, we
include the state-level regulatory climate (as of 1994) and the physical size of the market,
which we expect to affect fixed costs of entry but not variable profits or demand.
Econometric Results and Interpretation
As noted earlier, we consider two time periods in our analysis: (1) 1994, when
state-level regulation was still likely to be a major determinant of entry patterns, and
potential competition from entry was likely to be less significant; and (2) 2004, when -- a
decade past the Riegle-Neal Act -- bank branching and entry were virtually unregulated
and one might expect to see more competition resulting in local markets.
As listed in Table 1, we include a number of potential demand shifters in the
model, including income per capita, retail activity (retail sales per capita), and the
presence of competition from local credit unions. We include the average wage in the
market as a potential cost shifter. We expect fixed costs to increase with the physical size
of the market (land area). Intuitively, the cost of serving the market may increase with
the physical size as banks are forced to invest in more branches. As noted above, the
final explanatory variable we include is a measure of the regulatory environment of the
state, which we view as a proxy for fixed costs of entry, but not affecting quantity

14
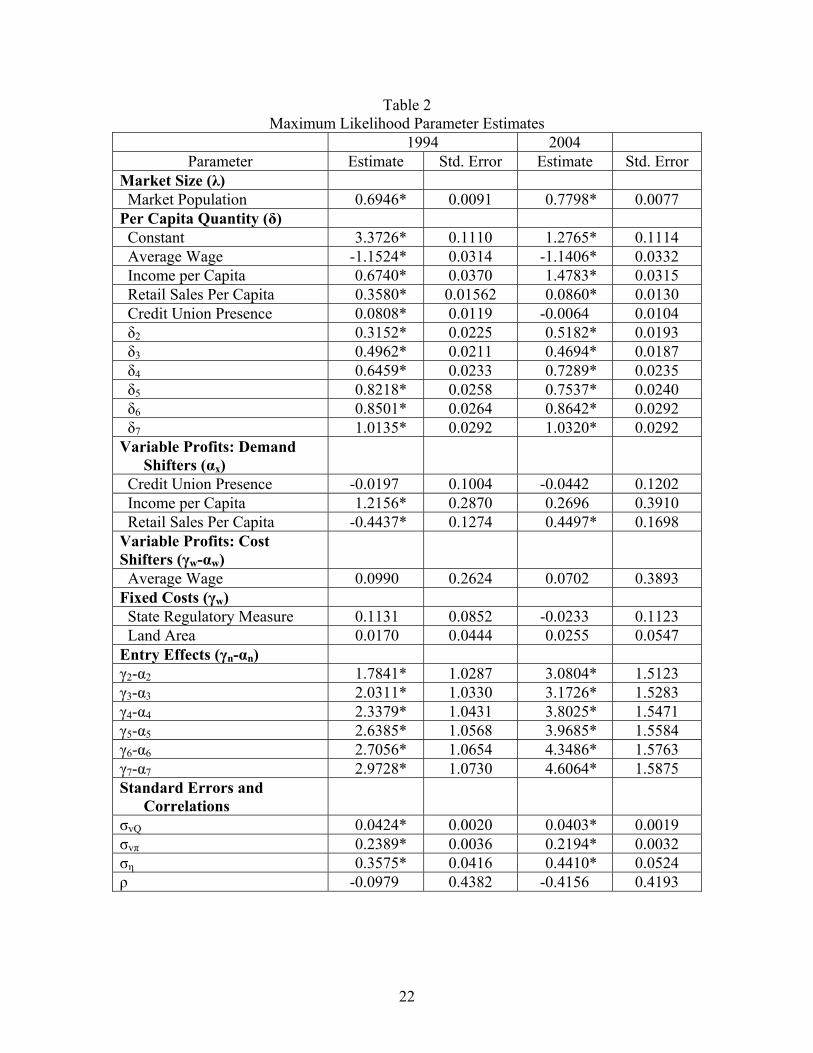
demanded or variable profits.13 Results from the maximum likelihood estimation of the
model are included in Table 2.
As expected, the parameter estimates associated with market population are
highly significant and positive. The coefficients indicate that a one percent increase in
market population increased the quantity of deposits in the market by approximately 0.7
percent in 1994 and by 0.8 percent in 2004. The remaining parameter estimates
associated with equation [10] are listed in Table 2 in the per capita quantity (δ) section.
The single variable cost shifter included in the model, average wage, has the expected
negative impact on per capita quantity in both years, with a one percent increase in the
average wage raising prices and, thus, decreasing per capita quantity by just over one
percent. Two of the primary demand shifters, income and retail sales per capita, have
significant positive impact on per capita demand in both years. As one might expect, as
income levels and retail activity in a market increase so do the per capita quantity of bank
deposits.14
Only a few of the coefficient estimates associated with variable profits are
significant, in part reflecting the positive correlation between per capita personal income
and per capita retail sales. Variable profits increase with the income per capita of the
market in 1994, and with retail sales per capita in 2004, as demand for banking services
grows. The negative coefficient on retail sales per capita in 1994 (while surprising) is far
smaller than the anticipated positive coefficient on per capita income.. None of the cost
shifters, variable or fixed, prove to be significant.
13 This is set equal to 1 if the state (based on Appendix Table B6 in Berger et al. (1995)) allowed all of the following: limited branching, statewide branching, limited multibank holding companes, statewide multibank holding companies, interstate multibank holding companies. 14 The counter-intuitive positive effect of credit union presence in 1994 may reflect an endogeneity between local banking demand growth and credit union entry.
15
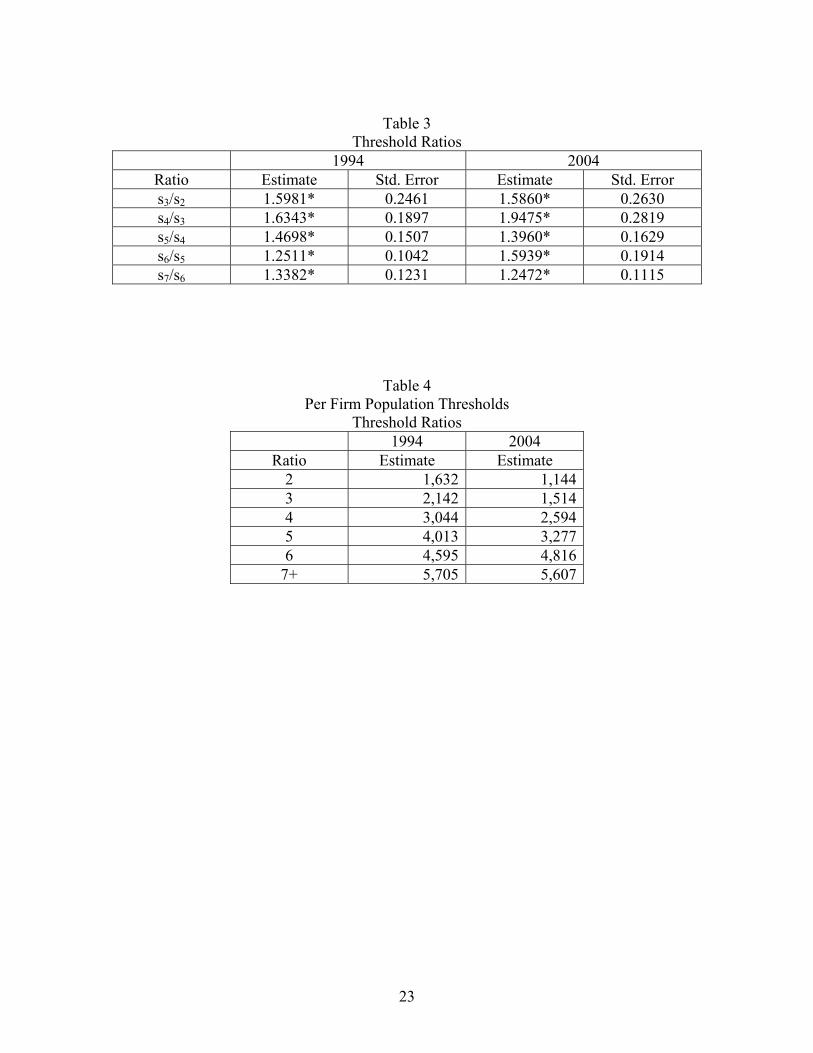
Tables 3 and 4 analyze the market structure dummies by calculating entry
threshold ratios and the per firm population thresholds, respectively. The threshold ratios
from the 1994 sub-sample suggest that the third firm requires about 60 percent more per
firm population than the second to be profitable, and the fourth firm requires a 50 percent
increase in per firm population when compared to the third. The 5/4 and 6/5 thresholds
continue to decrease and reach closer to one (though with a little turbulence along the
way), suggesting that the market is becoming more competitive.
If one assumes that fixed costs are constant in the number of firms in the market,
the reduction in the threshold ratio suggest that competition is pushing prices lower and
lower, with the market reaching closer to a competitive equilibrium. However, banks (in
markets at mean values of all explanatory variables) continue to have market power at
least through the entry of the seventh bank.
The threshold ratios from 2004 do not provide as clear a pattern. The third bank
requires 60 percent more per firm population when compared to the second and the fourth
bank requires 95 percent more per firm population than the third. The threshold ratios
fluctuate, though – as in 1994 – seem to be declining towards 1 by the seventh bank in
the market.
The benefit of the Abraham et. al. method is that we do not have to assume that
fixed costs are constant in the number of firms that enter the market, thus providing a
more accurate depiction of the level of competition in the market place. Note that the
decreasing thresholds that we found in 1994 could be because even though there were no
changes in the competitive conditions as firms entered the market, the fixed costs
increase with the number of banks in the market at a decreasing rate. Similarly, the
16
fluctuating threshold ratios we found in 2004 could be due to interactions between the
rate that fixed costs increase and the rate at which markets reach a competitive
equilibrium.
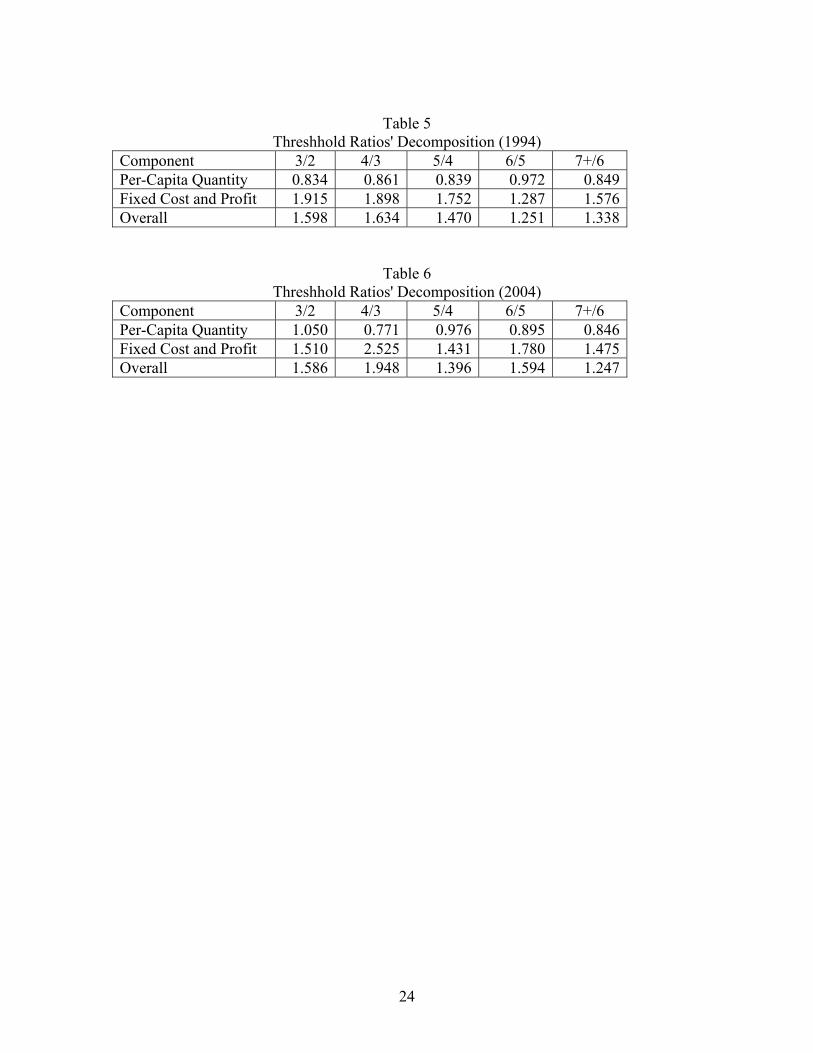
Table 5 and 6 decompose the threshold ratio into the per-capita demand effect and
the variable profit/fixed effect for 1994 and 2004, respectively. Note that the overall
threshold effect is the product of the per-capita quantity effect and the average profit
effect. These results indicate that in 1994, the third firm requires a per-firm market size
only 83 percent as large as the second firm. In other words, per-capita demand increases
by approximately 17 percent with the entry of the third firm. Per capita demand increases
by an additional 13 to 16 percent with the entrance of the fourth and fifth firm, and by the
sixth firm only increases about three percent. At the same time, the decomposition
indicates that entrants are decreasing average variable profits as a fraction of fixed costs.
These effects are consistent with modest reductions in price, thus suggesting that
competition is increasing up until the entry of the sixth firm.15
The effects for 2004 initially suggest that with deregulation, potential competition
has disciplined markets such that 2-firm markets are reasonably competitive – entry of a
3rd has no substantial impact on per capita demand (or price). The 23 percent increase in
per capita demand predicted from the entry of a 4th firm seems to be an anomaly,
especially as the 5th firm again has no significant impact on per capita demand. It must
be acknowledged that our confidence in the local market definition for banking markets
is stronger for 1994 than for 2004, as large internet banks began to make inroads into
deposit-taking by then.
15 The greater increase in per capita demand (of 15%) associated with the 7th firm is hard to explain and may reflect differences we were unable to control for between the smaller and larger of our markets.

17
Conclusion
Other work has examined determinants of entry in local banking markets. In this
paper we apply to this sector a promising new extension to the Bresnahan/Reiss
framework. Examining rural markets in both 1994 and 2004, we find in the earlier period
demand effects of entry consistent with modest reductions in price, suggesting increasing
competition, up until the entry of the sixth firm. In contrast, two-firm markets seem
relatively competitive in 2004.
While our results are not as clear-cut as we would have liked, they are suggestive of
greater competition in banking markets post-Riegle-Neal. Whether this increase in
competition is in fact due to the greater threat of entry associated with the Riegle-Neal
Act or to the rise of Internet banking is a topic for another day.
18
References
Abraham, Jean Marie, Martin Gaynor, and William B. Vogt, “Entry and Competition in Local Hospital Markets,” Journal of Industrial Economics (June 2007), Vol. 60, pp. 265-288. Amel, Dean F. and J. Nellie Liang, “Determinants of Entry and Profits in Local Banking Markets,” Review of Industrial Organization (February 1997), Vol. 12, pp. 59-78. Asplund, Marcus and Richard Sandin, “The Number of Firms and Production Capacity in Relation to Market Size,” Journal of Industrial Economics (March 1999), Vol. 47, pp. 69-85. Berger, Allen N., Seth D. Bonime, Lawrence G. Goldberg, and Lawrence J. White, “The Dynamics of Market Entry: The Effects of Mergers and Acquisitions on Entry in the Banking Industry,” Journal of Business (October 2004), Vol. 77, pp. 797-834. Berger, Allen N. and Astrid A. Dick, “Entry into Banking Markets and the Early-Mover Advantage,” Journal of Money, Credit and Banking (June 2007), pp. 775-807. Berger, Allen N., Astrid A. Dick, Lawrence Goldberg, and Lawrence J. White, “Competition from Large, Multimarket Firms and the Performance of Small, Single-Market Firms: Evidence from the Banking Industry,” Journal of Money, Credit and Banking (March-April 2007), pp. 331-368. Berger, Allen N., Anil K. Kashyap, and Joseph M. Scalise, “The Transformation of the U.S. Banking Industry: What a Long, Strange Trip It’s Been,” Brookings Papers on Economic Activity (2: 1995), pp. 55-218.
Bresnahan, Timothy F. and Peter C. Reiss, “Entry and Competition in Concentrated Markets,” Journal of Political Economy (1991), pp. 977-1009. Cetorelli, Nicola, “Entry and Competition in Highly Concentrated Banking Markets,” Economic Perspectives, Federal Reserve Bank of Chicago, 4Q, 2002, pp. 18-27. Cohen, Andrew M. and Michael J. Mazzeo, “Market Structure and Competition Among Retail Depository Institutions,” Review of Economics and Statistics (February 2007a), pp. 60-74. Cohen, Andrew M. and Michael J. Mazzeo, “Investment Strategies and Market Structure: An Empirical Analysis of Bank Branching Decisions,” working paper, 2007b. Degryse, Hans and Steven Ongena, “Distance, Lending Relationships, and Competition,” Journal of Finance (February 2005), Vol. 60, pp. 231-266.
19
Dell’Ariccia, Giovanni, Ezra Friedman, and Robert Marquez, “Adverse Selection as a Barrier to Entry in the Banking Industry,” Rand Journal of Economics (Autumn 1999), Vol. 30, No. 3, pp. 515-534. Dick, Astrid A., “Market Size, Service Quality and Competition in Banking,” Journal of Money, Credit and Banking (February 2007), pp. 49-81. Dunne, Timothy; Mark Roberts; and Larry Samuelson, “Patterns of Firm Entry and Exit in U.S. Manufacturing Industries,” Rand Journal of Economics (1988), Vol. 19, pp. 495-515. Feinberg, Robert M., “Patterns and Determinants of Entry in Rural County Banking Markets,” Journal of Industry, Competition, and Trade, published online May 2007, print version forthcoming. Feinberg, Robert M. and Joseph Shaanan, “Disaggregated Domestic and Foreign Entry into US Manufacturing Industries: Patterns and Price Effects,” Antitrust Bulletin (Spring 1997), Vol. 42, pp. 197-213. Geroski. Paul A., “What Do We Know About Entry?” International Journal of Industrial Organization (1995), Vol. 13, pp. 421-440. Greenspan, Alan. “Consumer Finance.” Federal Reserve Systems Fourth Annual Community Affairs Research Conference. Washington, DC, April 8, 2005. Hanweck, Gerald, “Bank Entry into Local Markets: An Empirical Assessment of the Degree of Potential Competition via New Bank Formation,” Federal Reserve Bank of Chicago, Proceedings of the 30th Annual Conference on Bank Structure and Competition (May 1971). Keeton, William, “Are Mergers Responsible for the Surge in New Bank Charters?” Federal Reserve Bank of Kansas City, Economic Review (2000), pp. 21-41. Manuszak, Mark D., “Endogenous Market Structure and Competition in the 19th Century American Brewing Industry,” International Journal of Industrial Organization (May 2002), Vol. 20, pp. 673-692. Masson, Robert T. and Joseph Shaanan, “Stochastic-Dynamic Limiting Pricing: An Empirical Test,” Review of Economics and Statistics (August 1982), pp. 413-422. Piloff, Steven J., “Does the Presence of Big Banks Influence Competition in Local Markets,” Journal of Financial Services Research (May 1999), pp. 159-177. Rose, John T., “The Attractiveness of Banking Markets for De Novo Entry: The Evidence from Texas,” Journal of Bank Research (Winter 1977).

20
Seelig, Steven A. and Tim Critchfield, “Merger Activity as a Determinant of De Novo Entry into Urban Banking Markets,” April 2003, unpublished. Toivanen, Otto and Michael Waterson, “Market Structure and Entry: Where’s the Beef?” Rand Journal of Economics (Autumn 2005), pp. 680-699.
21
Table 1 Descriptive Statistics (n=115)
Mean Min Max 1994 Number of Banks 5.30 1.00 18.00 Deposits ($millions) 268.96 7.00 1,186.00 Population (thousands) 27.71 1.39 137.71 Credit Union Presence 0.30 0.00 1.00 Average Wage (thousands) 19.03 13.11 34.12 Income per Capita (thousands) 16.02 10.37 26.97 Retail Sales Per Capita (thousands) 5.34 1.37 11.56 2004 Number of Banks 5.56 1.00 19.00 Deposits ($millions) 376.98 7.00 2,468.00 Population (thousands) 29.79 1.22 162.97 Credit Union Presence 0.39 0.00 1.00 Average Wage (thousands) 26.31 17.36 49.08 Income per Capita (thousands) 23.30 16.34 39.94 Retail Sales Per Capita (thousands) 8.12 2.15 26.82 Land Area (Thousand Square Miles) 2.32 2.28 41.08 State Regulatory Measure 0.46 0.00 1.00
22
Table 2 Maximum Likelihood Parameter Estimates
1994 2004 Parameter Estimate Std. Error Estimate Std. Error
Market Size (λ) Market Population 0.6946* 0.0091 0.7798* 0.0077 Per Capita Quantity (δ) Constant 3.3726* 0.1110 1.2765* 0.1114 Average Wage -1.1524* 0.0314 -1.1406* 0.0332 Income per Capita 0.6740* 0.0370 1.4783* 0.0315 Retail Sales Per Capita 0.3580* 0.01562 0.0860* 0.0130 Credit Union Presence 0.0808* 0.0119 -0.0064 0.0104 δ2 0.3152* 0.0225 0.5182* 0.0193 δ3 0.4962* 0.0211 0.4694* 0.0187 δ4 0.6459* 0.0233 0.7289* 0.0235 δ5 0.8218* 0.0258 0.7537* 0.0240 δ6 0.8501* 0.0264 0.8642* 0.0292 δ7 1.0135* 0.0292 1.0320* 0.0292 Variable Profits: Demand
Shifters (αx)
Credit Union Presence -0.0197 0.1004 -0.0442 0.1202 Income per Capita 1.2156* 0.2870 0.2696 0.3910 Retail Sales Per Capita -0.4437* 0.1274 0.4497* 0.1698 Variable Profits: Cost Shifters (γw-αw)
Average Wage 0.0990 0.2624 0.0702 0.3893 Fixed Costs (γw) State Regulatory Measure 0.1131 0.0852 -0.0233 0.1123 Land Area 0.0170 0.0444 0.0255 0.0547 Entry Effects (γn-αn) γ2-α2 1.7841* 1.0287 3.0804* 1.5123 γ3-α3 2.0311* 1.0330 3.1726* 1.5283 γ4-α4 2.3379* 1.0431 3.8025* 1.5471 γ5-α5 2.6385* 1.0568 3.9685* 1.5584 γ6-α6 2.7056* 1.0654 4.3486* 1.5763 γ7-α7 2.9728* 1.0730 4.6064* 1.5875 Standard Errors and
Correlations
σvQ 0.0424* 0.0020 0.0403* 0.0019 σvπ 0.2389* 0.0036 0.2194* 0.0032 ση 0.3575* 0.0416 0.4410* 0.0524 ρ -0.0979 0.4382 -0.4156 0.4193
23
Table 3
Threshold Ratios 1994 2004
Ratio Estimate Std. Error Estimate Std. Error s3/s2 1.5981* 0.2461 1.5860* 0.2630 s4/s3 1.6343* 0.1897 1.9475* 0.2819 s5/s4 1.4698* 0.1507 1.3960* 0.1629 s6/s5 1.2511* 0.1042 1.5939* 0.1914 s7/s6 1.3382* 0.1231 1.2472* 0.1115
Table 4 Per Firm Population Thresholds
Threshold Ratios 1994 2004
Ratio Estimate Estimate 2 1,632 1,144 3 2,142 1,514 4 3,044 2,594 5 4,013 3,277 6 4,595 4,816
7+ 5,705 5,607
24
Table 5
Threshhold Ratios' Decomposition (1994) Component 3/2 4/3 5/4 6/5 7+/6 Per-Capita Quantity 0.834 0.861 0.839 0.972 0.849 Fixed Cost and Profit 1.915 1.898 1.752 1.287 1.576 Overall 1.598 1.634 1.470 1.251 1.338
Table 6 Threshhold Ratios' Decomposition (2004)
Component 3/2 4/3 5/4 6/5 7+/6 Per-Capita Quantity 1.050 0.771 0.976 0.895 0.846 Fixed Cost and Profit 1.510 2.525 1.431 1.780 1.475 Overall 1.586 1.948 1.396 1.594 1.247