department of economics - au · the economics of immigration into a nordic welfare state - and a...
TRANSCRIPT
The economics of immigration into a Nordic welfare state- and a comparison to an immigration
state and a guest worker state
Sheetal K. Chand and Martin Paldam
Working Paper No. 2004-04
DEPARTMENT OF ECONOMICS
Working Paper
ISSN 1396-2426
UNIVERSITY OF AARHUS C DENMARK
INSTITUT FOR ØKONOMIAFDELING FOR NATIONALØKONOMI - AARHUS UNIVERSITET - BYGNING 322
8000 AARHUS C - F 89 42 11 33 - TELEFAX 86 13 63 34
WORKING PAPER
The economics of immigration into a Nordic welfare state- and a comparison to an immigration
state and a guest worker state
Sheetal K. Chand and Martin Paldam
Working Paper No. 2004-04
DEPARTMENT OF ECONOMICSSCHOOL OF ECONOMICS AND MANAGEMENT - UNIVERSITY OF AARHUS - BUILDING 322
8000 AARHUS C - DENMARK F +45 89 42 11 33 - TELEFAX +45 86 13 63 34

1
12-05-04
The economics of immigration into a Nordic welfare state and a comparison to an immigration state and a guest worker state Sheetal K. Chand, Department of Economics, University of Oslo.1) Martin Paldam, School of Economics and Management, University of Aarhus.2) Abstract: This paper examines the economic and related consequences of immigration from a less developed country (LDC) to a developed country (DC) in three different stylized cases: A guest worker society of the Dubai type, an immigrant society of the US type, and a tax-based welfare state with institutions of the Nordic type. In the Dubai type case it appears that mutually beneficial decisions can be made, and the same applies to a degree in the US type case. However, in the Nordic type evolved welfare case, immigration is only an advantage for the immigrant, especially one with less marketable skills, while it is a disadvantage for the natives. This poses an additional threat to the continuation of this type of welfare state. Keywords: Immigration, welfare state Jel: F22, J41, J70, O15
1. Mail: PO Box 1095 Blindern, N-0317 Oslo, Norway. (Eilert Sundts hus, 12th floor, Moltke Moes vei
31). Phone +47-228 44021. E-mail: <[email protected]>. 2. Mail: Building 322, DK-8000 Aarhus C, Denmark. (Office 325 building 326). Phone +45 8942 1607 or
08. E-mail: <[email protected]>. We want to thank Peter Nannestad for many discussions of the subject matter, and Michael Rosholm and other participants at the Seminar on Welfare Research, Nyborg Strand, December 2003. As well as Harrie Verbon and Vani Borooah and others at the Public Choice Meeting in Berlin and at a seminar at Jena University.

2
The paper examines the economic consequences of immigration from a less developed coun-try (LDC) to a developed country (DC) taking account of economic incentives and institu-tions. A framework is presented that allows for an assessment of the economic advantages from the respective perspectives of both the immigrant and the DC country. It is demon-strated how the institutions of the DC decrease and redistribute the large potential benefits for both sides. The focus of the analysis is on the economic aspects, and humanitarian ones are only discussed insofar as they are economically relevant. A main purpose of this analysis is to show how an alternative policy package, which differs markedly from the one currently being pursued in the Nordic welfare states, can lead to a superior outcome and better help realize the potential gains from immigration. All DCs have their own complex package of institutions. We consider three stylized packages taken to be the extreme cases that span the existing possibilities regarding immigra-tion. By far the most problematic case is the Nordic welfare state. Its package of institutions, which is supported by large majorities of the populations, evolved when immigration was in-significant.3) The second half of the paper therefore concentrates on that case.
The background of the analysis is the stress that is increasingly experienced by the Nordic welfare states. These states are universally recognized as having had considerable success in their striving toward the twin ideals of equality and solidarity, while at the same time ensuring adequate standards of efficiency and productivity. However, the stress is grow-ing: One factor is the gradual slowing of growth. Another is the shift toward an aging popula-tion that has started.
The third stress factor is the perception of increasing problems associated with immi-gration from LDCs. The success of the North European welfare states has made them mag-nets of attraction for LDC-labor flows. We argue that the very institutions of the welfare states convert many immigrants into welfare recipients that add an immigrant burden to the aging burden. The process creates immigrant welfare dependency and a growing hostility to immigrants on the part of the DC natives
To preserve themselves, the welfare states are increasingly raising dikes to stem the flow. Dikes consist of complex rules and cumbersome and slow bureaucracies for handling “foreigners”. This is turning the Nordic Welfare states into bigot anti-foreigner states, reduc-ing their possibilities for reaping the full advantages of globalization. Already cases have ap-peared where international firms – that need an international staff – have decided to move elsewhere where institutions are more oriented to the market. With globalization of research and development (R&D) local firms too are finding it hard to attract highly skilled personnel from the LDCs, despite offering a salary premium as negative perceptions take hold abroad
3. In Denmark no political party with more than 1% of the vote favors major reforms of the welfare state.
The anti-tax party (the Progress Party) of the 1970s has been replaced by a populist party that has the conservation of the welfare state as a key policy. The present center-right prime minister has made firm promises to the voters that his government will not change any of the institutions of the welfare state.

3
concerning the allegedly adverse treatment of immigrants. Increasingly, DC firms are forced to relocate their R&D activities to countries such as India in order to remain competitive.4)
Can the Nordic welfare states be preserved? We believe that they can be and are worth saving, but that the way they try to solve their immigration problem is counterproduc-tive. An alternative approach is needed.
Section I sets up the analytical framework, while section II presents a standard or ref-erence case application. Section III applies the theory to a Dubai-type country where foreign-ers can become guest workers only. Section IV looks at a US-type country that is a society of immigrants with corresponding institutions. Section V turns to the Nordic-type welfare state. The last two sections, concentrating on the Nordic-type case, deal briefly with some addi-tional problems and potentialities generated there, and possible ways to deal with them. I. Analytical Framework The analysis begins at time t = 0, when the immigrant legally enters DC.5) The terminology distinguishes between natives and immigrants, who are also termed insiders and outsiders. The analysis uses the overlapping generation framework, where the immigrant establishes a dynastic family and lives forever through succeeding generations.
To simplify we assume that each country grow at an equilibrium rate. The salary structure in country i is represented by wi. The native in DC receives the salary, wDC, for his labor. It is calculated net of: (a) standard social benefits, such as unemployment benefit at the average unemployment rate, pensions, etc., and (b) of taxes and insurance contributions fi-nancing these benefits. The rest of his taxes finance his consumption of collective goods. I.1 The operational concept of absorption and the difficult concept of integration An immigrant is fully absorbed – he has turned insider – when he receives the salary wDC. At that stage he receives the standard social benefits only, i.e., he has the same average rate of unemployment as do natives, and retires at their average age of retirement, etc. When the immigrant is accepted into DC at time t = 0, he is initially unemployed, with salary 0. He be-gins work and starts earning a salary which rises over time until he becomes fully absorbed, at t = T. This process is described by a designated labor absorption function of time that is denoted here as λDC that rises from 0 to 1. In this interval, the difference between wDC and λDC measures the extent to which the immigrant has been absorbed.
4. Germany has introduced a special visa scheme to attract high-tech workers from these countries, but
the scheme has so far been a fiasco despite the high salary differentials offered. German firms are still out-sourcing or relocation high-tech and other activities to these countries even though the German Chancellor has referred to such transfers as “unpatriotic”.
5. We shall term the immigrant “he”, as the first immigrant in a family is often male. The analysis disre-gards the prior decision of the immigrant to leave his (former) country. Furthermore, we disregard all intermediate stages between a full entry and no entry.

4
Notice that in concentrating on the precise and operational labor market concept of absorption, the paper largely disregards the less precise cultural concept of integration, where the immigrant acquires the language and habits of the natives.
The two concepts are related. Some integration is surely needed before an immigrant can be fully absorbed. This aspect can be included in the form of a cultural distance κ(0) at time t = 0, which then falls to κ when/if the immigrant is so integrated that he resists further integration. No doubt, κ is an important explanatory factor for λ, so that λ= λ(κ, …), and λ = 1 requires that κ < ε, where ε is the level of tolerance of the natives.6)
Table 1. Variables and curves analyzed
Curve Definition (all variables consider one immigrant) Depends upon t, T time from entry t = 0. When t = T the immigrant is absorbed decision is made at t = 0 wDC wage in DC: wDC,t = αeat. It is α for t = 0 grow at constant real rate a wLDC wage in LDC: wLDC,t = βebt. It is β for t = 0 grow at constant real rate b λ(t,…) absorption curve, labor income of immigrant is λwDC t, ρ and other institutions of DC
λ(0) = 0 and rises to λ(T) = 1 for full absorption λ also depends on integrationρ(t,…) excess social subsidy received when λ < λ(x) t and institutions of DC NPV net present values for immigrant NPVI and natives, NPVDC calculated at time t = 0
NPV* potential net present values λ = 1 and ρ = 0 for all t z ratio of surplus production of immigrant typical value z ≈ 0.25 x time of social break even, excess subsidy zero intersection of λ and ρ curves
Note: Excess is above the normal amount received by the average native. Surplus is gain of the natives. While the labor market absorption takes place at T, the social sector absorption already occurs at x.
I.2 Utility: Net present values of income flows and the micro-macro puzzle The net utility gain of the LDC immigrant is a function of several arguments. The economic part of the utility is taken to be a positively monotonous function of the net present values of the changes in the income flows calculated to the time of immigration t = 0. Three agents have to be considered: The immigrant (micro) and the two countries (macro). For the immigrant the change in utility is U = U(NVPI, S, D), where NPVI is the net present value of the changes in his income, as analyzed below. The other variables S and D are the increase in personal security reached by going from LDC to DC, while D is the non-economic loss he experiences before he is absorbed. We assume that S > D, so that S and D increase the utility of the immigrant. S and D are discussed in section IV. The old country of the immigrant is LDC. It is assumed to have so much hidden un-employment that the immigration causes no loss in production, and as the immigrant will re-mit some of his income back home the LDC is likely to have a net gain. This aspect will be disregarded from now on. 6. It is interesting to contemplate if immigrant groups exist, where κ > ε, making a full absorption impos-
sible, or if κ and ε must inevitably adjust in the long run to solve all problems of absorption.

5
The new country of the immigrant is DC. Here the utility is U = U(NPVDC, Q), where NPVDC is the net present value of two flows: (a) The surplus produced by the immigrant in excess of his salary. It is taken to be proportional to his salary λDC by the factor z, which cor-responds to the share of capital so that z ≈ 0.25, and (b) the excess social expenditures paid to the immigrant till he is absorbed. The non-economic variable Q accounts for the social ten-sions created by the immigration. Q reduces the utility of the DC, as discussed in section IV. Notice that while the benefits to the individual immigrant are personalized, they are not for the DC. If U = U(NPVDC,…) is divided between all natives in DC, it is negligible for any one native. This creates a typical macro-micro puzzle, which may also be termed a gen-eralized versus personalized benefits puzzle. A native may want to forbid immigration, but still be in favor of allowing specific persons to enter, e.g., to work in his business or if a touching story is told in the media. I.3 The potential gain to the immigrant, NPVI*, and the host country, NPVDC* The maximum gain possible for both parts occurs when absorption occurs immediately upon entry, so that λ = 1 from t = 0. The immigrant thus shifts from the LDC-wage to the DC-wage. His potential gain from the decision is therefore the net present value of the DC-wage minus the LDC-wage. Using the two formulas for the wages from table 1 and the standard expression for a perpetual annuity, we get:
(1) 0
( ) ( )
0 0* ( ) ( )DC LDC DC
rt r a t r b tI LDCNPV NPV w w w w dte e dt e dtα β
∞ ∞ ∞− − − − −= = − =− − =∫ ∫ ∫
1 /
r a r b r a r a
α β α β β αα
− −− =
− − − −≈ , where the last two expressions holds if a ≈ b
From this expression it is easy to reach some orders of magnitudes. The typical ratio between GDP per capita in PPP terms of the two countries suggests that β is in the range of 15% ± 10% of α. The real rate of interest may be used as an approximation to the rate of discount. Hence, r = 5% is probably in the high end of the scale, and a and b are typically both around 2%. With these values NPVI* ≈ α(1–0.15)/0.03 = 28α. Even for a low α such as $25'000, NPVI* exceeds $ 2/3 mill. NPVI* falls to half if r is high, say 8%. NPVI* rises if r falls toward a. A rough estimate would therefore be:
(2) 2 1
3 3* $INPV mills±=
It is reasonable to argue that the large size of NPVI* drives the flows of immigrants. In prin-ciple the immigrant faces 3 problems: (p1) He may fail to get through the barriers to entry, see section VI. (p2) He may have to pay commissions to agents to get through the barriers, see section VI. (p3) During the absorption period some of NPVI* is lost, see section II.

6
Nevertheless, given the above large estimated size of the potential NPVI* many are likely to think it is worth trying to emigrate.
The potential gain for the DC is the net value of the surplus production of the immi-grant. At λ = 1, there are no excess social expenditures incurred over and above those normal for natives. The potential value is thus:
(3) * ( ) ( * ( )) *DC DC LDCr
NPV NPV zw z z NPV NPV w z NPVα α
α α β− −= = = + ≈
For the values of the variables used this is about 0.3 NPVI*, which is still considerable. The sum of NPVI* and NPVDC* according to the example here is about $ 1 mill. With such large potential gains for both parts it is no wonder that many observers think that the labor flows are highly beneficial for the world. Many stories can be told where this has actu-ally been the case.7)
I.4 Realizing the potential: Three archetypal societies The potential gains are only reached in exceptional cases, see section III. During the time the immigrant needs to be absorbed in the labor market he only earns λwDC. In that period, he may also receive a social subsidy, ρ, that partly compensates for lower earnings. The NPV of the subsidy should be added to NPVI. It is, of course, a cost for the natives, and should be de-ducted from NPVDC.
Many institutions of DC are relevant for the shape of the λ-curve. Some are labor market rules, regulations and customs, systems for receiving and training immigrants, and last – but not least – social policies, formulated as a ρ-curve. Here each DC presents a “pack-age” of institutions. We have chosen three such packages to span the possibility space. In ad-dition the adaptability of the immigrant counts, as well as his response to the incentives pro-vided. As suggested by the title, we are most concerned with the Nordic-like case, which is by far the most problematic. The alternative cases, although of interest in themselves, are ex-amined for the light they can shed on resolving the Nordic-type case. II. The standard case This subsection first introduces the basic logic of the 4 curves of table 1. The next two sub-sections look at the NPV-calculations of the immigrants and the natives. This is followed by an assessment of factors that influence the NPVs of the decision.8)
7. Finland converged to the West from it left the Russian Empire in 1918 to about 1970. During that pe-
riod about 1 million Finns went to work in Sweden, which benefited the development of both countries.
8. The literature has been surveyed by e.g. Borjas (1994) and Hatton and Williamson (2002).

7
II.1 A slow absorption λ, and a social policy ρ The basic curves are likely to have the form drawn in figure 1a. The DC wage, wDC, is 5-10 times higher than the LDC wage, wLDC. However, it takes some time, T, for the immigrant to be absorbed in the labor market at which point he makes the DC-wage. We assume that he starts without a job at t = 0, so the absorption curve, λDC, starts at 0 and reaches wDC at T. Should his income fall below a certain threshold, he is entitled to social support.
Figure 1a. Standard case: Basic curves The subsidy, ρDC, is likely to have two parts: A subsistence payment at the rate ρDC1, and an insurance part that has to be saved up, so ρDC rises from ρDC1 till the maximum ρDC2, which is a certain fraction of wDC. Hence, ρDC depends upon t as drawn. The exact form of the ρ-curve depends on the social policies of the individual DC.9) At the break even point, xDC, the immi-grant ceases to be a net recipient of subsidies. To simplify, assume that the subsidy received is the difference between the subsidy and income made, λDC.
From casual observation and many studies from different countries we know that T is often large. It depends upon the institutions in the DC and the difference between the culture, education, etc. of the immigrants and the natives. Often several generations are needed, and in some cases a full absorption has not happened in 100 years. We should hence have num-bers like T = 40 ± 20 years in mind10) – where the high numbers occur in cases where the so-cial system and other institutions in the DC are such as in the Nordic-like case of section V.
9. The Appendix uses ρDC1 = 0.25, 0.4, 0.8 and ρDC2 = 0.6, 0.7, 0.8 and a period of 15, 10, 0 years to get
from the low to the high value. 10. The Appendix uses T = 20, 40 and 60 years. For the Nordic case several estimates, see e.g. Blume &
Verner (2003), suggest that T = 60 is low, but new policy initiatives are under way reducing T. Corres-ponding calculations for Sweden in Hansen and Lofstrom (2003) show a similar pattern.

8
Table 2. The decrease in the two NPVs in % of NPVI* (1) (2) (3) (4) (5)
Absorption Loss triangle LDC Transfer R = 1/3 LDC Transfer R = 2/3 LDC T (years) For r – a = 0.03 ∆NPVI ∆NPVDC ∆NPVI ∆NPVDC
20 26.4% 17.6% 15.4% 8.8% 24.2% 40 43.5% 29.0% 25.4% 14.5% 39.9% 60 55.5% 37.0% 32.4% 18.5% 50.9%
Note: ∆NPVI = 100(NPVI* – LDC + R)/NPVI*%, while ∆NPVDC = 100(NPVI* – 0.25LDC – R)/ NPVI*%. These formulas are explained in the text.
The slowness of absorption gives rise to two deviations from the ideal “potential” case: A production loss LDC and a social redistribution R. The production loss LDC is the triangle be-tween the wDC-line and the λ-curve – shown on figure 1b as the checkered area:
(4) ( )
0 0 2 2 ( )(1 ) ½ ( )DC DCT Trt r a t
DC DC DCq q
r aL w e dt e dt NPV w αλ α− − −
−= − > = =∫ ∫ ,
where q is the fraction of NPV(wDC) between 0 and T. The approximation is easy to use, but quite crude for large T’s. Table 2 shows some calculations of LDC in column (1).
The redistribution R from the natives to the immigrant is the area between the ρ-curve and the λ-curve from t = 0 to xDC. It is shown in figure 1c. The formula is:
(5) ( )
0 0( ) ( )DC DCx xrt r a t
DC DCR w e dt e dt vLρ λ α ρ λ− − −= − = − ≈∫ ∫
As R compensates a part of LDC only, v must be a positive fraction, 0 < v < 1. If the curves look as drawn in figure 1c, v ≈ 1/3, but we shall meet cases with larger v’s below. Table 2 shows how the two NPVs change for three λ-curves, and for v = 1/3 and 2/3. We shall refer to these calculations as we go along.
Figure 1b. Standard case: NPVI of immigrant

9
II.2 The NPVI-calculation of the immigrant The immigrant’s income gain from being accepted in DC is drawn as the dark-shaded NPVI in figure 1b – note that some NPVI is checkered. The potential NPVI* is the area between the wDC-curve and the wLDC-curve. The gray area of NPVI is somewhat smaller, due to the loss triangle caused by the slowness of absorption. The exact formula is:
(6) 0
( ) *rtI DC LDC DC I DCNPV w w e dt L R NPV L R
∞ −= − − + = − +∫ , as in note to table 2.
The orders of magnitudes for the reduction in NPVI relative to NPVI* are shown in columns (2) and (4) of table 2. If R is only 1/3 of the loss triangle, LDC, up to 40% of the potential may be lost for the immigrant, but with a more generous social compensation the loss falls. A rea-sonable order of magnitude to have in mind is: NPVI ≈ 2/3 NPVI*. II.3 The calculation of the NPVDC of the natives The corresponding calculation by the natives in the DC is shown on figure 1c. The net sur-plus to the natives is assumed proportional to wDC, by the factor z, assessed to be 0.25. (7) ( ( ) ) *DC DC DC DC DCNPV z NPV w L R NPV zL R= − − = − − , as in note to table 2.
Figure 1c. Standard case: NPVDC of natives
In section I.3 we found that NPVDC* was about 0.3 NPVI*, and from columns (3) and (5) in table 2 we find that we have to deduct between 0.15 and 0.5 times NPVI*. Hence, with a fast absorption and stingy social benefits NPVDC is still positive, but with slow absorption and generous social support NPVDC becomes negative. In addition, most DC pay reception and training costs to facilitate the absorption of the immigrant. They easily reach 0.05 NPVI*. The calculations in the appendix show that NPVDC in a majority of the cases covered is actually negative even when no reception and training costs are included.

10
II.4 Two factors affecting the λ-curve: Adverse selection and social policies Below, the λ-curve is taken to be roughly linear from 0 to T, but to have a slope that differs greatly between DCs. Hence, T differs widely between countries. Two related factors must affect the slopes: (a) The selection/self-selection of the immigrants. Immigrants try harder to get into some
countries than to others, and countries also try to sort the immigrants they let in. (b) The incentives generated by package of institutions “offered” by the DC. We here take
the social policies to be the key ones. They are summarized in the ρ-curve. To analyze (1) consider two types of immigrants: Type A has a high labor market value, while type B has a low labor market value. For a given set of institutions the absorption time is thus shorter for the A-type than the B-type. A-type immigrants will surely try to enter the countries where it is most easy to find work, and they will be less interested in the level of social support, while B-type immigrants will have the reverse preference. Hence, countries with long absorption times and generous support systems – as the Nordic welfare states – generate adverse selection of immigrants.
The ρ-curve is determined by the organization of social security among the natives and the tradition for immigration into the country. The principle of nondiscrimination means that the rules for the natives apply to the immigrants as well. Figure 1d shows two ρ-curves and two λ-curves. ρh is high, with no insurance part of the social payment, so the curve is par-allel with and close to the wDC-line. ρl is low, with only a low basic social minimum payment, and the rest of social security is insurance based. The immigrant starts with no contribution to the insurance fund, and it only increases as time passes. The two λ-curves are also extreme: λf is fast, so that immigrants are quickly absorbed. λs is slow, so that immigrants are slowly ab-sorbed. The four curves suggest three points.
Figure 1d. Incentives to immigrants: Alternative cases

11
(i) The differences between the curves have dramatic consequences for the intersection point x and the three areas discussed in the two preceding sections. In particular the amount of so-cial support received by the immigrant differs by about 20 times between the case where the curves are (ρl, λf) and (ρh, λs). This will have large consequences for NPVDC.
(ii) Incentives are different. Imagine that the λ-curve is strongly influenced by effort. The λf-curve is then a high effort curve, and the λs-curve a low effort curve. The two areas marked with gray show the incentive to make an effort. If the ρ-curve is the high alternative, then the immigrant’s loss if he makes a small effort is the light gray area. However, if the ρ-curve is the low alternative then the loss is the sum of the gray and the light gray areas – it is 5-6 times as much. Consequently, the logic of the curves is that if the ρ-curve moves upward, the economic pressures on the immigrant to find work decrease, and the λ-curve hence moves down, and vice versa. While there is no doubt that the two curves move in the opposite direc-tions, the sizes of the movements of the λ-curve are an empirical question.
(iii) Consider NPVI in the (ρl, λf)-case and the (ρh, λs)-case. They are different as well, but less so. If incentive effects on λ are large, the seemingly brutal social policies may not cause large welfare losses. However, if incentive effects are small as illustrated by comparing the (ρh, λs)-case and the (ρl, λs)-case, welfare losses are large for high discount rates.
The incentive effect and the adverse selection effect are difficult to distinguish in practice, and they reinforce each other. II.5 Competition for low-end jobs: Two possible outcomes It appears that most immigrants are in the low-skill group that competes with unskilled na-tives for minimum wage jobs. A minimum wage typically creates excess unemployment at that rate. Immigration thus increases the competition for relatively scarce jobs. Natives and immigrants each have advantages in this competition: (NA) Natives are insiders known by employers and recommended by each other. Immi-
grants are outsiders, often with language problems, who want to “break into” the labor market. Insiders have an advantage even if employers try not to discriminate.
(IA) Immigrants may be keener to work for three reasons: (1) They come from worse con-ditions and more readily accept poor working conditions. (2) A self-selection mecha-nism may work, so that immigrants are more enterprising than natives. (3) Incentives to work will be higher than for natives if the social benefits received include an insur-ance element so that new immigrants receive less in social benefits than natives.
Two outcomes may result: (i) NA dominates: Unemployment will be concentrated among immigrants. (ii) IA dominates: Immigrants replace natives, and unemployment is concentra-ted among natives.11) Both outcomes may lead to social tensions: Outcome (i) means that immigrants are cut off from society, and they may develop anti-native attitudes. Outcome (ii)
11. The solution (i) describes the Nordic outcome, while (ii) has more resemblance to the German out-
come, see Sinn (2003).

12
may cause anti-immigrant attitudes to spread among low-end natives. Both types of tension interact dynamically with the outcome to make it more extreme. III. A society of guest workers: A Dubai-like country It is difficult to find an ideal case of a rich country with a set of institutions allowing both sides to harvest all potential gains. The case closest to this ideal we have found is Dubai. For-eigners are invited in – by native sponsors for a fee – as guest workers on a contract, which may be renewed if both parties agree. This appears to be widely done in Dubai even though formal immigration is not allowed. A society comprising some 200,000 natives has become so dependent on a guest worker population of roughly 800,000, that a proportionately huge foreign worker presence is likely to be a permanent feature of the economy. In Dubai the whole economy is based on the work of contract workers. In addition, immigrants pay taxes and sponsor fees that are a net gain to the natives.
Figure 2a. Dubai-like case: Basic curves III.1 The basic curves in the Dubai-like country The guest worker has a contract from 0 to TC1, subject to renewal. He works immediately af-ter a brief introductory training period. Thus λDu rises steeply after that period, and then it be-comes parallel to the wDu-line at the distance ts, which is the net tax expenditures and sponsor fees. The contract also contains all social security provided.
The zλDu-curve used in calculating the gain to the natives is now easy to draw by shift-ing the λDu-curve down as shown on figure 2a. However, the two figures 2b and 2c have to account for ts in a different way – it is a loss for the guest worker and a gain for the natives.

13
Figure 2b. Dubai-like case: NPVI of guest worker Dubai is a service economy in an oil-rich environment with a high capital to labor ratio,12) and immigrants are thus necessary to operate that capital. Thus we assume that z is much higher than in the case of figure 1, and the natives also receive ts. However, the contract worker is likely to have greater remittances than an immigrant in the standard case. He not only remits to his family, but to himself, as it is likely that he has taken the contract precisely in order to make money for later use. Therefore we still assume that z + ts < 1. Finally the wIMM is drawn higher than the wLDC of the previous figures. Dubai makes contracts with peo-ple from many countries and tailors the contracts to the market.
Figure 2c. Dubai-like case: NPVDu of natives
12. Dubai has much less oil per capita than its neighbors.

14
III.2 The two NPV calculations for the Dubai-like country The gain for the guest worker is easy to calculate as done in figure 2b. It is the area between the two wages for the duration of the contract, except for the small initial training period and ts – the net tax loss and the sponsor fee.
Figure 2c calculates the gain of the natives. In this case it is as large as (or even larger than) the one for the guest worker. It is the area below the (z+ts)λDu-curve minus a small cor-rection for the training period. In the Dubai-like case, contracts are market based and only made if mutually beneficial. Guest workers are allowed to bring family, but have to pay for their upkeep including schools for the kids, health insurance etc. IV. A society of immigrants: A US-like country The main characteristic of the US-like country is that social security is based on an insurance principle and has a small basic payment only. Hence, immigrants have to find a job as quickly as possible. Immigrants with a PhD often start out driving a taxi or washing dishes in a restaurant to get a foothold in the labor market. Some do not succeed, but others do, and the second generation tends to be rather absorbed.13)
Figure 3a. US-like case: Basic curves Figure 3a shows the 4 curves in the US-like case. The main difference is that the ρUS starts low, but as time passes and the immigrant accumulates an insurance capital, ρ goes up. Also, the figure shows that thanks to the low ρUS-curve from the outset, the incentive to find work is high, and the λUS-curve rises relatively fast. 13. A large literature deals with immigration into the US, see Borjas (1999a, 2000).

15
We shall not bring figures 3b and c, as they look like figures 1b and c, though the loss LDC and the transfer R are both relatively small. Consequently, in the US-like case immigra-tion is an economic advantage for the natives. The US is a country of immigration, which ac-counts for the way the curves look. V. A tax-based welfare state: A Nordic-like country In a welfare state of the Nordic type, ρ is high and paid out of the general tax revenue, with hardly any insurance element included. Once the immigrant is accepted, he is, in principle, eligible for social benefits on a par with the natives. The benefits are made to equalize in-comes, so they are highest at the low end of the income scale, where the immigrants are likely to be for some time.
Finally, labor markets in the Nordic-like cases use the local language, which can only be acquired through a large investment on the part of the immigrant. Considerable time thus have to elapse before the immigrant can get a job. During that time the immigrant is a client of the social system. Part of the adverse selection problem of immigration in these countries is that the best educated immigrants will know English or French, but not Danish or Swedish. Hence, they will try much harder to get into a country where they speak the language and are easy to absorb into the labor market.
Figure 4a. Nordic-like case: Basic curves V.1 The basic curves in the Nordic-like country Figure 4a shows the basic curves in the Nordic-like case. The curves have the worst possible shapes as regards the interests of the natives: The ρN-curve is unusually high, and the λN-
16
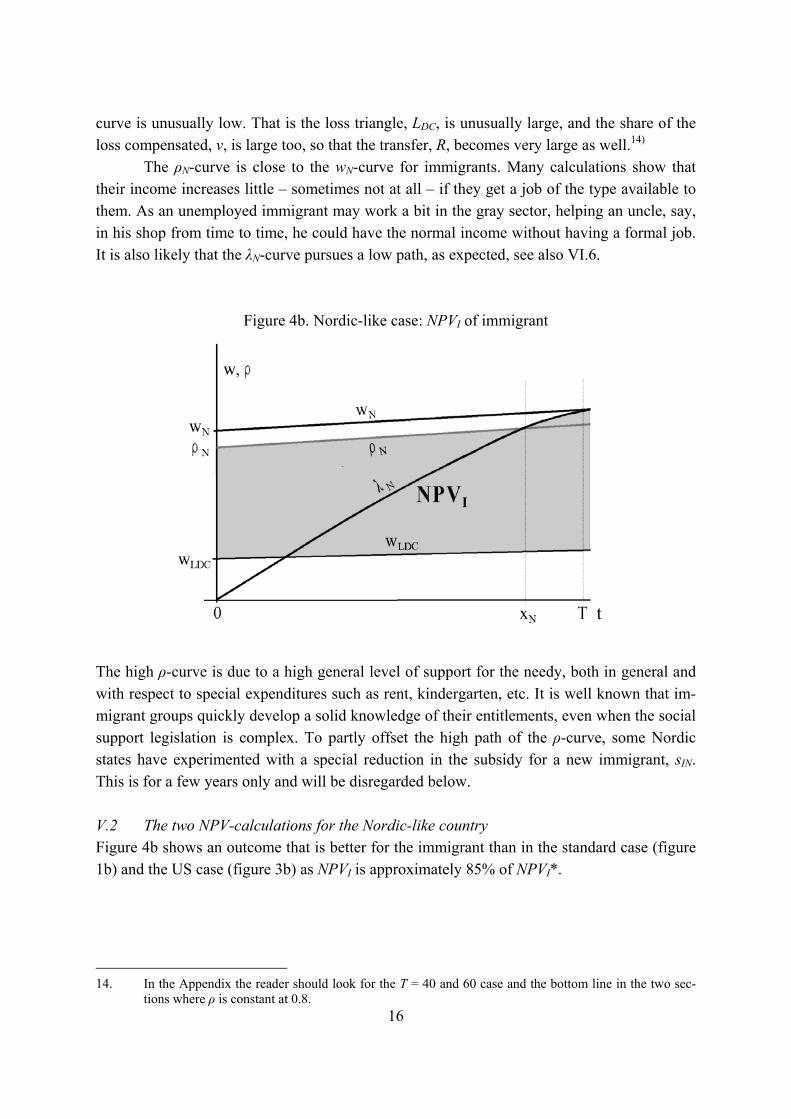
curve is unusually low. That is the loss triangle, LDC, is unusually large, and the share of the loss compensated, v, is large too, so that the transfer, R, becomes very large as well.14)
The ρN-curve is close to the wN-curve for immigrants. Many calculations show that their income increases little – sometimes not at all – if they get a job of the type available to them. As an unemployed immigrant may work a bit in the gray sector, helping an uncle, say, in his shop from time to time, he could have the normal income without having a formal job. It is also likely that the λN-curve pursues a low path, as expected, see also VI.6.
Figure 4b. Nordic-like case: NPVI of immigrant The high ρ-curve is due to a high general level of support for the needy, both in general and with respect to special expenditures such as rent, kindergarten, etc. It is well known that im-migrant groups quickly develop a solid knowledge of their entitlements, even when the social support legislation is complex. To partly offset the high path of the ρ-curve, some Nordic states have experimented with a special reduction in the subsidy for a new immigrant, sIN. This is for a few years only and will be disregarded below. V.2 The two NPV-calculations for the Nordic-like country Figure 4b shows an outcome that is better for the immigrant than in the standard case (figure 1b) and the US case (figure 3b) as NPVI is approximately 85% of NPVI*.
14. In the Appendix the reader should look for the T = 40 and 60 case and the bottom line in the two sec-
tions where ρ is constant at 0.8.

17
Figure 4c. Nordic-like case: NPVN of natives NPVDC now looks as in figure 4c. Both LDC and R are much larger than in the standard case, so it is obviously very difficult to reach positive values of NPVDC. From all estimates we know that T = 60 years is on the low side, and as shown in the appendix, NPVDC is always negative even for T = 40.
With a high T the Appendix shows that NPVN becomes about –0.25 NPVI*. Finally, reception and training costs should be included. The amount is also unusually high as it in-cludes language courses and the costs incurred by the state between the arrival of the pro-spective immigrant to the country and his actual admission. A ball park estimate would be at least 0.05 NPVI*, increasing the total costs to –0.3 NPVI*.
We thus conclude: Immigration is expensive for the natives in the Nordic-like case.15) No mutually advantageous deal can be made. We are dealing with a highly asymmetric situa-tion where one part has a high interest in getting an advantage from the other. This is differ-ent from the Dubai-case and even the US-case. VI. Developing the Nordic-like case The present section discusses some issues neglected in the analysis so far: (1) The non-econo-mic factors. (2) The nature of the acceptance decision and the market for agents. (3) The fam-ily multiplier of immigration. (4) The civil liberty problem. (5) The problems of solidarity and the receptivity of societies to immigration.
15. Several studies of the macro-orders of magnitudes of these aspects have been made. See e.g. Wadensjö
and Orrje (1999) and Pedersen (1999) for Denmark, Storsletten (2003) for Sweden and Roodenburg, Euwalds and Rele (2003) for the Netherlands. They appear to be consistent with our assessments.

18
VI.1 The non-economic costs and benefits: S, D and Q from I.2 Figures 4b and 4c show a situation where NPVI is large and positive, and the interest of the natives, NPVN, is negative. The non-income costs and benefits – S, D and Q – reinforce this pattern by increasing NPVI and decreasing NPVN.
The immigrant will often have human rights reasons in addition to the economic ones for trying to get into a DC. He may belong to a group that does not live in peace and security in his home country, this changes to the better after he gets into DC. Hence, there is a gain S. But the period from the immigrant leaves his country till he is absorbed in DC involves con-siderable mental hardship, D. It is clear that S > D. The difference S – D might in principle be treated as a shadow cost lowering wLDC, and thus increasing NPVI.
The DC has groups of non-absorbed immigrants already and some social tensions be-tween natives and immigrants. (i) An increase in the size of the immigrant group will margin-ally increase these tensions. (ii) Also, the larger the immigrant groups, the easier it is to live separately from the natives,16) making absorption more difficult – i.e., it lowers the λ-curve. (iii) The two mechanisms also increase the problem of “second-generation” immigrants, who feel that they belong neither here nor there, and who are therefore more prone to crime17) or seek group identification in extreme politico/religious groups, thereby slowing down absorp-tion even in the third generation. These effects, Q, should be imputed by the standard meth-ods of cost benefit analysis, and be added to the costs already included. Note that it does not matter that Q is mostly an externality, seen from the point of view of the individual immi-grant, as NPVDC is macro. They thus both decrease NPVDC. VI.2 From economics to law: Building a dike and creating a market for agents In the Nordic-like case, immigration acceptance is therefore treated as a non-economic deci-sion. It is taken by a bureaucracy according to a set of legal rules. Basically, immigrants are accepted on three types of criteria: (a) As refugees from bad regimes, preferably sanctioned by the UN. (b) As close family members of immigrants already accepted. (c) As long-term residents, who have worked on temporary work permits. The criteria are designed to exclude economic immigrants, but everybody knows that the dis-tinction between economic and humanitarian immigrants is often illusionary. The 3 rules are all worked out in many legal details, which often lead to bizarre decisions.
The decisions are also susceptible to political pressures and media campaigns based on the micro-macro puzzle of I.2. While people may be against mass immigration they are
16. This is a part of the dynamics of “ghettos” where nothing goes on in the language of the natives, mak-
ing it impossible for the women to acquire that language, especially for the Muslim groups, who con-sider it important to shield women from the permissive secularized society of the natives.
17. UN (1999) statistics demonstrate that traditional Muslim society has the lowest crime rates known, while the NW-European welfare states are second. It is hence noteworthy that second generation immi-grants from the Middle East have developed higher crime rates than the natives.
19
easily swayed by individual cases, who manage to get into the media. Individual stories are therefore much debated in parliament and the media. Frequently, decisions are changed after a media campaign.
The large amount of money involved and the barriers to entry have generated a mar-ket for agents. Legal agents are lawyers, NGOs and politicians helping immigrants for eco-nomic, humanitarian and other reasons. Some politicians and journalists specialize in running individual cases, etc.
Illegal agents perform two services: (i) They organize secret transport so that the im-migrant turns up in the chosen DC without a legal exit from a country to which he can be sent back. (ii) They provide legends that tally to the rules of admission in the chosen DC. Most LDC-immigrants come from countries with high levels of corruption (see Paldam, 2001), with “bazaars” where many documents can be purchased.18) In many DCs laws increasingly criminalize and punish such agents as “human traffickers”. Consequently, they are becoming more ruthless and well organized.
It appears that the illegal agents often collect fees in the order of $ 10'000 from an immigrant – immigration is not for the poor in the LDCs. In addition, the legal process from when the immigrant enters the country until the decision is made, is likely to take half a year, in which period the immigrant loses, say, ½wLDC .
The decision is thus a legal process where the immigrants are provided with lawyers and NGOs providing media and political access. The legends can only be checked by the DC bureaucrats to a limited degree. To control the legend they have to be able to investigate in the country the DC has declared bad and potentially accuses of persecution of an innocent asylum seeker. It is obvious that in such cases decisions are based on a light burden of evi-dence, and consequently, it must have a large arbitrary element. The implication is that the immigrant may have invested a considerable sum in the attempt to obtain entry. Frequently, his family – that is, his extended family, see next section – has invested in him, so that the family can get a foothold in the DC. This investment is wasted if the application is rejected. Thanks to the large interests, the agents, the family networks etc., some immigrants always manage to seep through the dikes. VI.3 The family multiplier: The extended family and the family obligation So far we have considered the situation of one male immigrant. However, the story does not end here. Most immigrants come from countries that have not made the demographic transi-tion, and where social security is very modest.
Hence, families are extended, and social security and care are a family obligation. This causes a way of life and a set of attitudes that differ from those of the natives in a Nor-dic-type society. It seems that the solidarity within the extended family may dominate atti- 18. Furthermore, the relations between authorities and people are different in DCs and most LDCs, where
people have learned to distrust authorities (see Paldam & Svendsen, 2001) – they may even come from minorities that for centuries have learned that authorities are their enemies. Hence, many immigrants are unlikely to speak truthfully to DC authorities.

20
tudes toward the nation, the system, etc.19) The family member who emigrates still carries the obligation to the extended family, and it is further cemented by the investment the family has made in the immigrant by financing the fees for the agents who have helped him to get in.
Imagine that the immigrant belongs to a family of N members where a mutual support obligation exists. The burden is, e.g., $ x per family member as long as they stay in the old country, or $ x(N-1) if only one family member enters. If two enter, the burden falls for two reasons: (N-1) is reduced by 1, and they are now 2 to carry the burden.
One way to get an extra family member in is by marriage, and it is hence a strong ob-ligation that immigrants marry, say, a cousin from the old country as soon as he reaches the required age. Also, it is perhaps possible to get the immigrant’s parents in, and then their other children and their spouses and the parents of the spouses, and so on. The more members the family manages to get in, the smaller the financial burdens, and the easier it is to keep tra-ditions for one more generation.
It thus appears that each immigrant accepted will generate an additional immigration of µ (say 3-5) persons in the future. The total cost is thus not NPVN, but µNPVN. VI.4 The costs of stopping the seepage: Infringing on the civil liberties of natives In order to reduce the seepage and especially to reduce the family multiplier, a whole set of laws and administrative rules are now being implemented in the Nordic-type societies. Some of the rules define the family as only a DC-type core family, which is deemed sufficiently close to allow immigration. Obviously, this creates further tensions between the groups.
Many of the rules and regulations necessary to control immigration infringe upon the civil rights of the natives. All of a sudden rules are appearing that control the rights of ethnic natives to marry foreigners, and the right of people to cross borders in general. At the bor-ders, cars with people who look “different” are stopped, etc.
This all creates unpleasant images of a police state based on racist criteria, which most ethnic natives resist. In other words, it creates trade-offs between civil liberties on the one side, and economic costs and ethnic tensions on the other side. Difficult and highly poli-ticized choices have to be made.
At the same time the immigration bureaucracy becomes a powerful body administra-ting complex and politicized laws, demanding collection of large amounts of unavailable evi-dence. This leads to decisions, which are frequently cruel and often arbitrary. Hopeful immi-grants are subjected to unbearably long waiting periods, while authorities seek information controlling claims, and lawyers haggle over clearly inadequate evidence and hearsay.
19. Some of the reasons for the tensions between the groups are precisely that the DC-societies have
passed the demographic transition and have core families where both spouses work and the care for old and young is handled by institutions. Many immigrants do not want to be so integrated that this process affects their families. To this comes secularization, which many immigrants abhor.

21
VI.5 Solidarity and the receptivity of countries20) Finally, it should be mentioned that a set of attitudes and values stand between the immigrant and his new country, and depresses the λ-curve. Immigrants are outsiders trying to break into the society of insiders. Some groups react to this challenge by making an extra effort, while others react with disdain and by turning inward to their own values maybe for reasons dis-cussed in II.5.
The welfare state builds on solidarity and shared values, which in the final analysis are based upon some sort of expected reciprocity among insiders. People know that society will support them in case of need, and hence they are also willing to support others. This is buttressed through a system of tax payments on a life-time basis. The welfare system is thus a mutual support system within a group that extends to all insiders. Subgroups of natives do exist, who for several generations need more support than others, but they are not so distinct that solidarity fails. Solidarity comes under pressures when conspicuous groups of immi-grants are seen as sending strong signals that they do not want to belong. It is not religion, culture, dress code, language, but the totality of these differences that has turned into a prob-lem in welfare states of the Nordic type.21)
The other side of this issue is the receptivity of the welfare state to immigrants. Many immigrants indicate that they experience a society that is closed to them – i.e. they are not taken as “normal folks”. They meet a social system that provides money and some social con-trol, but real jobs are hard to get, as the labor market prefers insiders. It is safer and much nicer to stay within the group, and reject decadent native society. So one gets into a vicious circle, where the market prefers insiders forcing the immigrants to remain outsiders, and thereby turning them even more into their own society, making them remain outsiders. One may even argue that the big social payments to the immigrants serve to give natives an excuse for the discrimination in the labor market. But this, of course, is a source of inefficiency. Immigrants represent potential assets that should be effectively util-ized. By restructuring the incentive systems that influence both immigrant efforts and the demand for their work, the λ-curve would more closely approach that of the US and Dubai type societies.
20. This subsection discuss issues covered in more depth in Coleman & Wadensjö (1999), giving the his-
torical perspective, and Nannestad (1999) analyzing recent data. 21. In some parts of all Nordic countries one frequently sees families with women dressed in full chador,
walking with a bunch of children, with whom they speak in their language. It makes natives ask them-selves questions as: In what way do such families want to become part of “our” society? Will they bring up their children to become integrated? What is the nature of the solidarity by which the average native should subsidize the way they live? How much reciprocity can they expect from that family?

22
VII. Can economically efficient and ethically viable solutions be found? The analysis started by showing that the potential gain – measured as net present value – of being accepted into a DC for an LDC immigrant is of the order of $ 2/3 mill. It was also dem-onstrated that there is a potential gain for the DC amounting to about half of that. So the po-tential total gain for the world is no less than $ 1 mill. It is further demonstrated that the insti-tutions of the DC provide a package that reduces the size of the total gain and redistributes it among the two parts.
Some countries have institutions that allow both parts to reap most of the potential benefits of immigration. However, the tax-based welfare system of the Nordic type does pro-vide the immigrant with almost all of the potential gain, while it turns the potential gain for the DC into a loss. Hence, it is a package of institutions that is inconsistent with immigration (see also Nannestad, 2003).
The asymmetry of the economic results of immigration has at least five effects: (1) It generates large flows of hopeful immigrants. (2) It causes increasingly desperate DCs build-ing dikes trying to stop the inflow. (3) It creates a thriving market for agents helping people to get through. It has proved difficult to stop people trying by all means – fair and foul – to seep through the dikes. (4) This has led to an increase in bureaucratization and the imposition of restrictions that cut across the civil rights of natives and immigrants. (5) The more restric-tive environment hampers the recruitment of foreign workers whose skills are needed by Nordic based firms. Currently the political efforts in the Nordic-like cases seem to be concen-trated on heightening and tightening the dikes. It should not be the only policy.
A Nordic-type society would be better served by adopting immigration practices from the other two types discussed, but its highly evolved welfare state makes this very difficult. The evolved welfare state is a public good that the citizens built up through a widespread consensus involving high taxes. Globalization has exposed this system to immigrants, who have not participated in the creation and renewal of the public good. The good is made avail-able to immigrants on a non-excludable basis, in accordance with an entrenched principle of non discrimination. As more people access it without paying for it, the good loses its non-rivalrous character, and less of it is available to the natives, unless they pay higher taxes.
With respect to able-bodied immigrants, a category that should include all economic immigrants, a case could therefore be made that their access to the public good be limited un-til they are able to pay their (imputed) share for its renewal. A qualifying period of x years could be introduced involving specially designated tax payments to the social security system before entitlement commences. This would help defuse understandable resentment on the part of natives over immigrant free riders. Such a policy would reduce the subsidy incentive for the immigrant to come to a Nordic type economy, while preserving the rights of natives.
At the same time, much more should be done to improve the absorption curve, for ex-ample reducing rigid labor market practices and overcoming the hold exerted by insiders. Transaction costs should be reduced to attract high-skilled immigrants. A move away from

23
bureaucratic centralization could be made through adopting the sponsor practices of the US and Dubai, where private firms or individuals demonstrate a need for the immigrant and agree to pay the costs of entry, etc. Such decentralization reduces recourse to bureaucratic solutions and introduces an element of market determination. Insofar as the economic immi-grant is linked to an expected labor shortage, the net benefits for the economy are likely to be high. It would also give the immigrant greater incentives to join the active work force.
In sum, the Nordic-type economy would be much better served if it restructured its highly evolved welfare system in a manner that delivers its intended benefits in a just and fair way. This will enable such an economy to adopt an alternative policy for economic immi-grants as in the two alternative type economies. An equitable treatment for existing immi-grants and their access to the welfare system will need to be found, while applying new norms to prospective immigrants. Closing the borders is not a viable option.

24
References: Blume, K., Verner, M., 2003. Welfare dependency among Danish Immigrants. Working Paper AKF, Seminar
on Welfare Research, Nyborg Strand, December. Borjas, G.J., 1994. The economics of immigration. Journal of Economic Literature 32: 1667-1717. Borjas, G.J., 1999a. Heaven’s Door. Immigration Policy and the American Economy. Princeton UP., Princeton,
NJ. Borjas, G.J., 1999b. Immigration and Welfare Magnets. Journal of Labor Economics 17: 607-637. Borjas, G.J., ed., 2000. Issues in the Economics of Immigration. National Bureau of Economic Research Con-
ference Report, University of Chicago Press. Coleman, D., Wadensjö, E., 1999. Immigration to Denmark. International and National Perspectives. Aarhus
University Press: Aarhus. Hansen, J., Lofstrom, M., 2003. Immigrant Assimilation and welfare participation. Journal of Human Resources
38: 74-98. Hatton, T.J., Williamson, J.G., 2002. What fundamentals drive world migration? NBER working paper 9159.
Revised from <http://cepr.anu.edu.au/Staff/hatton/contact_th.htm>. Nannestad, P., 1999. Solidaritetens pris. Holdningen til indvandrere og flygtninge i Danmark 1987-93. Aarhus
University Press. Nannestad, P., 2003 Immigration as a challenge to the Danish welfare state? Forthcoming in the European Jour-
nal of Political Economy. Paldam, M., Svendsen G.T., 2001. Missing Social Capital and the Transition in Eastern Europe. Journal for In-
stitutional Innovation, Development and Transition 5: 21-33. Paldam, M., 2002. The cross-country pattern of corruption: Economics, culture and the seesaw dynamics.
European Journal of Political Economy 18 (2): 215-20. Pedersen, L.H., 2002. Befolkningsudvikling, integration og økonomisk politik. Dream Model Group: Copenha-
gen. Downloaded from <http://www.dreammodel.dk>. Roodenburg, H., Euwals, R., Rele, H.t., 2003. Immigration and the Dutch Economy. CPB Netherlands Bureau
for Economic Policy Analysis: Den Haag. Downloaded from <http://www.cpb.nl>. Sinn, H.-W., 2003. EU Enlargement, Migration and the New Constitution. CES-ifo Conference paper. Storsletten, K., 2003. Fiscal implications of immigration – a net present value calculation. Scandinavian Journal
of Economics 105: 487-506. UN, 1999. Office for Drug Control and Crime Prevention. Global Report on Crime and Justice. NY. Wadensjö, E., Orrie, H., 2002. Immigration and the public sector in Denmark. Aarhus University Press: Aarhus.

25
Appendix table: Simulations of NPV’s
Social policy parameters Rate of discount minus wage growth (r – a) Min ρ Period Max ρ 2% 3% 4% 5% 6%
NPVI* 50 33.3 25 20 16.7
Simulations for T = 20
NPVI 85.0 79.1 73.8 69.3 65.3
NPVDC 0.25 15 0.60
19.1 16.7 14.5 12.5 10.7
NPVI 88.5 84.0 80.1 76.6 73.6
NPVDC 0.40 10 0.70
15.6 11.7 8.3 5.2 2.4
NPVI 94.1 91.9 90.1 88.5 87.2
NPVDC 0.80 None 0.80
10.0 3.8 –1.7 –6.7 –11.2
Simulations for T = 40
NPVI 76.6 69.1 63.2 58.6 54.9
NPVDC 0.25 15 0.60
10.4 5.2 1.1 –2.3 –5.1
NPVI 82.3 76.8 72.5 69.1 66.4
NPVDC 0.40 10 0.70
4.6 –2.4 –8.1 –12.8 –16.6
NPVI 89.8 87.0 85.0 83.6 82.5
NPVDC 0.80 None 0.80
–2.9 –12.6 –20.7 –27.3 –32.7
Simulations for T = 60
NPVI 70.8 63.2 57.8 53.9 53.9
NPVDC 0.25 15 0.60
2.7 -3.9 -8.8 -12.5 -12.5
NPVI 77.9 72.4 68.6 65.8 63.7
NPVDC 0.40 10 0.70
-4.4 -13.0 -19.5 -24.4 -28.0
NPVI 86.9 84.1 82.5 81.5 80.9
NPVDC 0.80 None 0.80
-13.4 -24.8 -33.5 -40.1 -45.2 Assumptions, see also table 1 of paper: The λ-curve is linear, between t = 0 and t = T, where it becomes wDC and remains so. Social security (in % of wDC) starts at Min ρ, and grows linearly during “period” to Max ρ. NPVI* is a number of times of α = wDC(t = 0). NPVI and NPVDC are both measured in % of NPVI*. No reception and training costs are included.

Working Paper
2003-09: Niels Haldrup: Empirical analysis of price data in the delineationof the relevant geographical market in competition analysis.
2003-10: Niels Haldrup and Morten Ø. Nielsen: Estimation of FractionalIntegration in the Presence of Data Noise.
2003-11: Michael Svarer, Michael Rosholm and Jacob Roland Munch:Rent Control and Unemployment Duration.
2003-12: Morten Spange: International Spill-over Effects of Labour Mar-ket Rigidities.
2003-13: Kræn Blume Jensen, Mette Ejrnæs, Helena Skyt Nielsen andAllan Würtz: Self-Employment among Immigrants: A Last Re-sort?
2003-14: Tue Görgens, Martin Paldam and Allan Würtz: How does PublicRegulation affect Growth?
2003-15: Jakob Roland Munch, Michael Rosholm and Michael Svarer:Are Home Owners Really More Unemployed?
2003-16: Gabriel Pons Rotger: Testing for Seasonal Unit Roots withTemporally Aggregated Time Series.
2003-17: Peter Sandholt Jensen and Martin Paldam: Can new aid-growthmodels be replicated?
2003-17: Sheetal K. Chand and Martin Paldam: The economics of immi-gration into a welfare state.
2004-1: Gabriel Pons Rotger: Seasonal Unit Root Testing Based on theTemporal Aggregation of Seasonal Cycles.
2004-2: Niels Haldrup and Morten Ø. Nielsen: a Regime Switching LongMemory model for Electricity Prices.
2004-3: Morten Spange: Automatic Stabilizers in an Economy withMultiple Shocks.
2004-4: Sheetal K. Chand and Martin Paldam: The economics of immi-gration into a Nordic welfare state - and a comparison to an im-migration state and a guest worker state