department of cooperative governance and traditional...
TRANSCRIPT

DEPARTMENT OF COOPERATIVE GOVERNANCE AND TRADITIONAL AFFAIRS DEPARTMENT OF COOPERATIVE GOVERNANCE AND TRADITIONAL AFFAIRS
1
DEPARTMENT OF COOPERATIVE GOVERNANCE AND TRADITIONAL AFFAIRS
Annual Performance Plan2014-2017
FREE STATE PROVINCE
5 MARCH 2014

DEPARTMENT OF COOPERATIVE GOVERNANCE AND TRADITIONAL AFFAIRS
2
FOREWORDOutcome 9: A responsive, accountable, effective and efficient local government system of the Draft 2014-2019 Medium Term Strategic Framework, which was adopted by Cabinet towards realizing Chapter 13 of the National Development Plan provides for the following sub-outcomes:
Households progressively gain access to sustainable and reliable basic services such as water, sanitation, electricity and refuse removal Public trust in local government is improved through active and deliberative citizen engagement Municipalities demonstrate good financial governance.Quality of management and administrative practices within municipalities improved Municipalities attract and retain skilled and competent personnel responsive to citizens’ priorities and capable of delivering quality services.
Work opportunities created and expanded through programmes such as the CWP Quality of governance arrangements and political leadership enhanced Corruption within local government is tackled more effectively and consistently Concrete actions that ensure a better fit between responsibility and the variation in capacities within municipalities supported.
During the past MTEF period, not all municipalities were able to deliver quality services to communities due to several factors including: limited ability and/or capacity to manage their institutions, inability to engage and/or empower communities they serve adequately.
The problems identified within municipalities in the Province range from issues of poor governance and accountability, weak financial management, high vacancy rates in their top critical posts and, in a number of instances, an inability to deliver even a core set of critical municipal services efficiently and effectively.
In keeping with our vision of an Integrated, responsive and developmental local governance in the Free State Province, we have undertaken a progressive series of intergovernmental initiatives with a view to turn the tide in local government towards 2019. We have undergone a process of strategic planning and introspection and have arrived at what heralds a new way of doing things over the next 5 years, and came to realize that a more hands-on approach is necessary. We have therefore decided to intervene directly where Municipalities are experiencing difficulties or where there is a failure to deliver on our promises to our communities.The following strategic objectives as per our 2014-2019 Strategic Plan will, if implemented successfully, ensure the achievement of the overarching goal of a responsive, accountable, effective and efficient local government system in the Free State Province:
Strengthening the administrative, financial and institutional capabilities of municipalitiesPromoting cooperative governance and service delivery through effective community participationImproving municipal service delivery by coordinating all municipal capacity building initiativesEnsuring effective municipal performance monitoring and -reportingPromoting the development of credible municipal spatial development frameworks in alignment with the Provincial Spatial Development FrameworkEnhancing an improved local economy within the ProvinceImproving the quantity and quality of municipal basic services in formalized areasPromoting an integrated and coordinated approach to disaster risk management in the Province Ensuring reliable and credible municipal integrated development plansSupporting and transforming the institution of traditional leadership in the ProvinceRendering effective and efficient administrative support to the Free State House of Traditional Leaders
Our plans towards realizing the above objectives are set out in detail in the 2014-2019 Annual Performance Plan of the Department, informed by the Draft 2014-2019 MTSF as well as the goals we have set for ourselves in our 2014-2019 Strategic Plan. With the support of and assistance from all our stakeholders and other role-players, I hereby commit the Free State Department of Cooperative Governance and Traditional Affairs to ensure the successful implementation of this Annual Performance Plan over the 2014-2017 MTEF period.
_______________________________________MEC S.M. MLAMLELIEXECUTIVE AUTHORITY: COOPERATIVE GOVERNANCE, TRADITIONAL AFFAIRS AND HUMAN SETTLEMENTS
DATE: 5 MARCH 2014

DEPARTMENT OF COOPERATIVE GOVERNANCE AND TRADITIONAL AFFAIRS DEPARTMENT OF COOPERATIVE GOVERNANCE AND TRADITIONAL AFFAIRS
3
It is hereby certified that this Annual Performance Plan:
Was developed by the management of the Department of Cooperative Governance and Traditional Affairs under the guidance of Ms S.M. Mlamleli, Executing Authority for Cooperative Governance, Traditional Affairs and Human SettlementsTakes into account all the relevant policies, legislation and other mandates for which the Department of Cooperative Governance and Traditional Affairs is responsible Accurately reflects the strategic goals and objectives which the Department of Cooperative Governance and Traditional Affairs will endeavour to achieve over the period 2014/2017.
_______________________________M.S. Tlali Chief Financial Officer
_______________________________I. Howard Director: Departmental Planning and Performance Management
_______________________________M.V. Duma Accounting Officer
________________________________S.M. Mlamleli Executive Authority
Date: 5 MARCH 2014
OFFICIAL SIGN-OFF

DEPARTMENT OF COOPERATIVE GOVERNANCE AND TRADITIONAL AFFAIRS
4
CONTENTSPART A: STRATEGIC OVERVIEW
Situational Analysis 6
OVERVIEW OF THE 2014-2015 BUDGET AND 2014-2017 MTEF ESTIMATES OF THE DEPARTMENT 6
PART B: STRATEGIC OBJECTIVES, PROGRAMMES AND SUB-PROGRAMME PLANS 9
PROGRAMME 1 - ADMINISTRATION 9PURPOSE AND BRIEF DESCRIPTION OF THE PROGRAMME 9STRATEGIC OBJECTIVE- AND PROGRAMME PERFORMANCE INDICATORS WITH ANNUAL AND QUARTERLY TARGETS 9RECONCILIATION OF PERFORMANCE TARGETS WITH THE BUDGET AND MTEF 17
PROGRAMME 2 - LOCAL GOVERNANCE 19PURPOSE AND BRIEF DESCRIPTION OF THE PROGRAMME 19STRATEGIC OBJECTIVE- AND PROGRAMME PERFORMANCE INDICATORS WITH ANNUAL AND QUARTERLY TARGETS 19RECONCILIATION OF PERFORMANCE TARGETS WITH THE BUDGET AND MTEF 25
PROGRAMME 3 - DEVELOPMENT AND PLANNING 27PURPOSE AND BRIEF DESCRIPTION OF THE PROGRAMME 27STRATEGIC OBJECTIVE- AND PROGRAMME PERFORMANCE INDICATORS WITH ANNUAL AND QUARTERLY TARGETS 27RECONCILIATION OF PERFORMANCE TARGETS WITH THE BUDGET AND MTEF 34
PROGRAMME 4 - TRADITIONAL INSTITUTIONAL MANAGEMENT 35PURPOSE AND BRIEF DESCRIPTION OF THE PROGRAMME 35STRATEGIC OBJECTIVE- AND PROGRAMME PERFORMANCE INDICATORS WITH ANNUAL AND QUARTERLY TARGETS 35RECONCILIATION OF PERFORMANCE TARGETS WITH THE BUDGET AND MTEF 38
PROGRAMME 5 - FREE STATE HOUSE OF TRADITIONAL LEADERS 39PURPOSE AND BRIEF DESCRIPTION OF THE PROGRAMME 39STRATEGIC OBJECTIVE- AND PROGRAMME PERFORMANCE INDICATORS WITH ANNUAL AND QUARTERLY TARGETS 39RECONCILIATION OF PERFORMANCE TARGETS WITH THE BUDGET AND MTEF 41
PART C: LINKS TO OTHER PLANS 43
PART D: TECHNICAL PERFORMANCE INDICATOR DESCRIPTIONS 44
Available on the Departmental Website: www.fscogta.gov.za

DEPARTMENT OF COOPERATIVE GOVERNANCE AND TRADITIONAL AFFAIRS DEPARTMENT OF COOPERATIVE GOVERNANCE AND TRADITIONAL AFFAIRS
5
part astrategic o
verview

DEPARTMENT OF COOPERATIVE GOVERNANCE AND TRADITIONAL AFFAIRS
6
PART A
STRATEGIC OVERVIEW
1. Situational Analysis
As per the 2014-2017 Strategic Plan
2. Overview of the 2014-2015 budget and 2014-2017 MTEF estimates of the department
2.1 Expenditure estimates
Table 1: Department of Cooperative Governance and Traditional Affairs Table 1: Department of Cooperative Governance and Traditional Affairs
Summary of payments and estimates: Cooperative Governance and Traditional Affairs
Outcome Main appropriation
Adjusted appropriation
Revised estimate Medium-term estimates
R thousand 2010/11 2011/12 2012/13 2014/15 2015/16 2016/17
Programme 1: Administration 109,912 130,079 113,898 132,659 97,509 93,297 110,123 116,513 122,429
Programme 2: Local Governance 185,615 161,870 101,781 109,000 114,630 120,010 114,784 122,806 123,197
Programme 3: Development and Planning 65,039 55,393 52,844 75,151 62,949 66,883 72,892 76,389 81,084
Programme 4: Traditional Institutional Management 16,413 20,449 23,495 22,851 32,617 26,900 34,400 36,496 38,772
Programme 5: House of Traditional Leaders 11,082 11,454 8,512 8,752 9,751 9,451 9,426 9,980 10,599
Total payments and estimates: 388,061 379,245 300,530 348,413 317,456 316,541 341,625 362,184 376,081
2013/14

DEPARTMENT OF COOPERATIVE GOVERNANCE AND TRADITIONAL AFFAIRS DEPARTMENT OF COOPERATIVE GOVERNANCE AND TRADITIONAL AFFAIRS
7
R thousand 2010/11 2011/12 2012/13 2014/15 2015/16 2016/17
Current payments 293,668 320,848 248,886 281,682 250,178 254,116 274,991 290,811 307,580
Compensation of employ ees 157,396 185,155 133,820 165,704 134,027 130,330 174,285 185,446 197,325
Salaries and w ages 135,869 159,571 118,537 149,230 117,962 114,251 156,764 166,033 176882Social contributions 21,527 25,584 15,283 16,474 16,065 16,079 17,521 19,413 20443
Goods and serv ices 136,272 135,693 115,066 115,978 116,151 123,786 100,706 105,365 110,255
of which
Administrative Fees 267 385 309 509 579 585 576 604 632 Advertising 1,163 1,988 2,220 774 1,129 1,133 1,381 1,274 1337 Assets<R5000 1,009 1,674 506 1,980 1,533 1,727 1,910 1,223 1288 Audit cost: External 4,948 3,276 4,518 5,454 4,580 4,580 4,152 4,360 4578 Bursaries (employees) 98 125 188 218 158 158 150 158 166 Catering: Departmental Activities 4,324 4,425 3,586 3,267 3,683 3,118 3,590 3,257 3448 Communication 3,989 2,864 2,283 4,746 3,339 3,338 2,979 3,071 3224 Computer Services 3,054 4,232 4,378 6,234 5,437 2,334 2,482 2,671 2805 Cons/Prof:business & advisory services 43,792 48,928 43,586 30,724 28,947 39,793 24,495 22,674 23797 Con/Prof: Infrastructre & Planning - - - - - -
Con/Prof: Laboratory services - - - - - -
Con/Prof: Legal cost 5,128 3,716 2,981 1,363 2,557 1,907 1,068 1,263 1330 Contractors 26,105 12,449 2,408 6,493 11,579 14,029 2,322 2,072 2441 Agency & Support/outsourced Services 2,239 1,556 1,331 1,918 4,862 1,642 6,137 7,596 7983 Entertainment 434 24 108 185 147 152 113 141 151 Government Motor Transport - - - - 2,082 2,537 2,750 3,887 4,081
Housing - - - - - - - -
Inventory: Food and Food Supplies 118 129 577 -
Inventory: Fuel, oil and gas 2 1 1 -
Inventory: Clothing Material & accessories -
Inventory: medical supplies - - - - - - -
Inventory: Other consumables -
Consumable: Stationery, Printing and Office Supplies 2,576 2,202 1,952 3,528 2,609 2,775 2,909 3,942 4,116
Consumable Supplies 215 701 17 620 706 715 461 983 1,023
Operating Leases 383 3,941 4,710 4,720 2,309 2,722 2,954 3,282 3,510
Owned & Leasehold Property expenditure 11,942 15,922 17,477 9,873 14,812 14,812 14,337 14,371 15,090
Travel and Subsistence 19,525 19,605 16,447 21,087 15,266 15,582 14,649 17,519 18,442
Training & Staff Development 542 1,790 537 2,862 1,586 1,770 2,500 2,389 2,509
Operating Expnditure 3,334 4,285 2,968 5,213 4,715 4,778 3,990 5,674 5,978
Venues and Facilities 1,085 1,475 1,978 4,210 3,528 3,591 4,792 2,954 2,326
Rent and Hiring 8 8 9
Interest and rent on land 240 214 28 - 30 30 - - -
Interest 238 214 28 30 30
Rent on land 2
Transfers and subsidies to1: 89,574 52,629 46,143 63,955 63,480 58,717 63,160 68,646 65,628
Prov inces and municipalities 87,855 48,957 45,186 61,424 59,617 54,824 60,525 65,924 62,685
Prov inces2
Prov incial Rev enue Funds
Prov incial agencies and funds
Municipalities3 87,855 48,957 45,186 61,424 59,617 54,824 60,525 65,924 62,685
Municipalities 87,855 48,957 45,186 61,424 59,617 54,824 60,525 65,924 62,685
of which: Regional service council levies
Municipal agencies and funds
Departmental agencies and accounts
Social security funds
Prov ide list of entities receiv ing transfers4
Departmental agencies and accounts - 2,870 0 0 - 0 0 0
Univ ersities and technikons
Public corporations and priv ate enterprises5
Public corporations
Subsidies on production
Other transfers
Priv ate enterprises
Subsidies on production
Other transfers
Foreign gov ernments and international organisations
Non-profit institutions 151 255 286 1,622 2,089 2,089 1,638 1,650 1,738
Households 1,568 547 671 909 1,774 1,804 997 1,072 1,205
Social benefits
Other transfers to households 1,568 547 671 909 1,774 1,804 997 1,072 1,205
Payments for capital assets 4,391 4,900 3,753 2,776 3,768 3,678 3,474 2,727 2,873
Buildings and other fix ed structures - - - 0 0 0 0 0 0
Buildings - -
Other fix ed structures
Machinery and equipment 4,358 4,900 3,753 2,776 3,768 3,678 3,474 2,727 2,873
Transport equipment 2,075 - - 0 0
Other machinery and equipment 2,283 4,900 3,753 2,776 3,768 3,678 3,474 2,727 2,873
Heritage assets 33 - -
Softw are and other intangible assets
Land and subsoil assets
Payments for financial assets 188 654 1,720 0
Total economic classification 388,061 379,245 300,530 348,413 317,456 316,541 341,625 362,184 376,081
Payments and estimates by economic classification: Cooperative Governance and Traditional Affairs
Outcome Medium-term estimates
2013/14
Main appropriation
Adjusted appropriation
Estimated Actual

DEPARTMENT OF COOPERATIVE GOVERNANCE AND TRADITIONAL AFFAIRS
8
part bstrategic o
bjectives

DEPARTMENT OF COOPERATIVE GOVERNANCE AND TRADITIONAL AFFAIRS DEPARTMENT OF COOPERATIVE GOVERNANCE AND TRADITIONAL AFFAIRS
9
PART B
STRATEGIC OBJECTIVES, PROGRAMMES AND SUB-PROGRAMME PLANSPROGRAMME 1: ADMINISTRATION
Purpose of the Programme
This programme aims to provide strategic direction, leadership and support to the Office of the MEC and the department
Brief description of the Programme
This programme consists of the following Sub-Programmes:
1. Office of the MEC2. Corporate Services
part bstrategic o
bjectives

DEPARTMENT OF COOPERATIVE GOVERNANCE AND TRADITIONAL AFFAIRS
10
Stra
tegi
c O
bjec
tive
and
Prog
ram
me
Perf
orm
ance
Indi
cato
rs w
ith A
nnua
l and
Qua
rter
ly T
arge
ts
SUB
PRO
GR
AM
ME
CO
RPO
RA
TE S
ERV
ICES
STR
ATE
GIC
OBJ
ECTI
VE
IMPR
OV
ED C
APA
BILI
Ty O
F TH
E D
EPA
RTM
ENT
TO M
EET
ITS
OBL
IGA
TIO
NS
Stra
tegi
c O
bjec
tive
Indi
cato
rs a
nd 2
014-
2017
A
nnua
l Tar
gets
ALI
GN
MEN
TA
udite
d/A
ctua
l per
form
ance
Base
line
2013
/20
14
Med
ium
-term
targ
ets
ND
PM
TSF
FSG
DS
2010
/20
1120
11/
2012
2012
/20
13Ta
rget
2014
/201
5Ta
rget
2015
/201
6Ta
rget
2016
/201
7
1.Ef
fect
ive
and
effic
ient
ad
min
istra
tion
of
the
depa
rtm
ent a
s pe
r (M
anag
emen
t Pe
rfor
man
ce
Ass
essm
ent T
ool)
MPA
T Re
quire
men
ts in
rel
atio
n to
:St
rate
gic
Man
agem
ent
Hum
an R
esou
rces
M
anag
emen
tG
over
nanc
e an
d A
dmin
istra
tion
Fina
ncia
l and
Sup
ply
Cha
in M
anag
emen
t
Cha
pter
s 12
: Bui
ldin
g Sa
fer
Com
mun
ities
and
C
hapt
er 1
4: P
rom
otin
g A
ccou
ntab
ility
and
Fi
ghtin
g C
orru
ptio
n
Cha
pter
3: E
cono
my
and
Empl
oym
ent
Cha
pter
13:
Bui
ldin
g a
Cap
able
and
D
evel
opm
enta
l Sta
te
Cha
pter
15:
Nat
ion
Build
ing
and
Soci
al
Coh
esio
n
Out
com
e 3:
All
Peop
le
in S
A f
eel a
nd a
re s
afe
Out
com
e 4:
Dec
ent
empl
oym
ent t
hrou
gh
incl
usiv
e ec
onom
ic
grow
th
Out
com
e 12
: An
effic
ient
, eff
ectiv
e an
d de
velo
pmen
t orie
nted
pu
blic
ser
vice
Out
com
e 14
: Tr
ansf
orm
ing
soci
ety
and
uniti
ng th
e co
untr
y
Pilla
r 6:
Goo
d go
vern
ance
- D
river
15:
Fo
ster
goo
d go
vern
ance
to
cre
ate
a co
nduc
ive
clim
ate
for
grow
th a
nd
deve
lopm
ent
--
-M
PAT
stan
dard
s ac
hiev
ed a
s fo
llow
s pr
ior
to
mod
erat
ion:
66%
L3/
L44
34.5
% a
t L1/
L2
Mor
e th
an 8
0% o
f M
PAT
stan
dard
s ac
hiev
ed a
t Lev
el
3 /
Leve
l 4
All
MPA
T st
anda
rds
achi
eved
at l
evel
3,
with
mor
e th
an
20%
at l
evel
4
All
MPA
T st
anda
rds
achi
eved
at l
evel
3,
with
mor
e th
an
40%
at l
evel
4
2.Im
prov
ed c
olla
bora
tion
betw
een
the
depa
rtm
ent a
nd
its e
mpl
oyee
s, st
akeh
olde
rs, c
lient
s an
d th
e m
edia
Cha
pter
15:
Nat
ion
Build
ing
and
Soci
al
Coh
esio
n
Out
com
e 14
: Tr
ansf
orm
ing
soci
ety
and
uniti
ng th
e co
untr
y
Pilla
r 6:
Goo
d go
vern
ance
- D
river
15
: Fos
ter
good
go
vern
ance
to c
reat
e a
cond
uciv
e cl
imat
e fo
r gr
owth
and
de
velo
pmen
t
--
-U
nkno
wn
Redu
ctio
n in
th
e nu
mbe
r of
co
mpl
aint
s lo
dged
th
roug
h th
e de
part
men
tal h
elp
desk
Redu
ctio
n in
th
e nu
mbe
r of
co
mpl
aint
s lo
dged
th
roug
h th
e de
part
men
tal h
elp
desk
Redu
ctio
n in
th
e nu
mbe
r of
co
mpl
aint
s lo
dged
th
roug
h th
e de
part
men
tal h
elp
desk
3.Su
itabl
e of
fice
acco
mm
odat
ion
secu
red
for
the
depa
rtm
ent i
n co
mpl
ianc
e w
ith O
HS
requ
irem
ents
Cha
pter
13:
Bui
ldin
g a
Cap
able
and
D
evel
opm
enta
l Sta
te
Out
com
e 12
: An
effic
ient
, eff
ectiv
e an
d de
velo
pmen
t orie
nted
pu
blic
ser
vice
Pilla
r 6:
Goo
d G
over
nanc
e -
Driv
er 1
5:
Fost
er g
ood
gove
rnan
ce
to c
reat
e a
cond
uciv
e cl
imat
e fo
r gr
owth
and
de
velo
pmen
t
--
-38
53
squa
re m
eter
sA
dditi
onal
and
su
itabl
e sp
ace
secu
red
tow
ards
ac
com
mod
atin
g de
part
men
tal
empl
oyee
s
Add
ition
al a
nd
suita
ble
spac
e se
cure
d to
war
ds
acco
mm
odat
ing
depa
rtm
enta
l em
ploy
ees
Add
ition
al a
nd
suita
ble
spac
e se
cure
d to
war
ds
acco
mm
odat
ing
depa
rtm
enta
l em
ploy
ees

DEPARTMENT OF COOPERATIVE GOVERNANCE AND TRADITIONAL AFFAIRS DEPARTMENT OF COOPERATIVE GOVERNANCE AND TRADITIONAL AFFAIRS
11
Programme Performance Indicators and 2014-2017 Annual Targets
Alignment with MTSF
Audited/Actual performance Baseline2013/2014
Medium-term targets2010/2011
2011/2012
2012/2013
2014/2015
2015/2016
2016/2017
1. Effective strategic management practices applied in the department(a) Strategic Planning: Strategic Plans• 2014-2019 Strategic Plan is compliant with Treasury
Regulations and planning guidelines in respect of submission dates and format
• Link between Strategic Plan and MTSF / FSGDS clear and follows a logic progression
• Performance of the department against the strategic plan is revised during the 2014-2019 period
Sub-Outcome 4, Outcome 12
- - -1
11
1
11
1
11
1
11
(b) Strategic Planning: Annual Performance Plans• Annual Performance Plan complies with Treasury
Regulations and planning guidelines in respect of format and submission dates
• Quarterly Performance Reports submitted to EA and Treasury on time
• Annual Performance Plan contains updated analysis on information relevant to external and internal factors, strategic objectives and performance indicators which conform to SMART principles
• Management meets towards exploring quarterly performance information
• Performance targets substantially met and expressed in Annual Report
- - -1
11
1-
1
11
11
1
11
11
1
11
11
(c) Monitoring and Evaluation: Integration of monitoring and evaluation in performance and strategic management• M&E Policy Framework approved• Standardized mechanisms and/or processes and
procedures in place to collect, manage and store data that enable the monitoring of progress made towards achieving departmental goals, targets and core objectives
• One of the major programmes of the department evaluated
- - -
11
-
11
-
11
1
11
1
2. Good governance and accountability practices in place in the departmenta) Service Delivery Improvement Mechanisms• Service Delivery Charter, service standards and SDIP
approved and displayed• Stakeholders / service recipients on service standards
and SDIP consulted• Compliance to service delivery standards and
implementation of the approved SDIP monitored• Monitoring reports on compliance with service delivery
standards considered and used by management to inform improvements to business processes
Sub-outcomes 4 and 6, Outcome 12
- - -1--
-
111
-
111
1
111
1
b) Functionality of Management Structures• Management structures with formal terms of reference
in place• Meetings scheduled and held• Management decisions documented and clear,
responsibility allocated and followed through• Senior Management Meetings agenda focuses on
strategic objectives and priorities of the department as per the Strategic Plan and APP
• Senior Management discuss IGR / Inter-departmental Reports and Resolutions emanating from MINMEC, Technical MINMEC and Food
Sub-Outcome 4, Outcome 12
- - -111
-
-
111
1
1
111
1
1
111
1
1
c) MPAT Implementation• MPAT Self-Assessment for previous cycle completed and
signed-off by HOD• MPAT results discussed by Senior Management • MPAT Improvement Plan developed • MPAT Improvement Plan monitored quarterly
Sub-Outcome 4, Outcome 12
- - -1111
1111
1111
1111

DEPARTMENT OF COOPERATIVE GOVERNANCE AND TRADITIONAL AFFAIRS
12
Programme Performance Indicators and 2014-2017 Annual Targets
Alignment with MTSF
Audited/Actual performance Baseline2013/2014
Medium-term targets2010/2011
2011/2012
2012/2013
2014/2015
2015/2016
2016/2017
d) Assessment of accountability mechanisms (Audit Committee)• Audit Committee in place and constituted in accordance
with Chapter 3 of the National Treasury Regulations• Audit Committee meets as scheduled• Audit Committee has an approved Audit Committee
Charter with clearly defined objectives, key performance indicators and reviewed annually
• Audit Committee assessed by stakeholders such as AG and departmental managers
• Audit Committee reviewed management responses to audit issues and reports thereon
Sub-Outcome 4, Outcome 12
- - -1
11
--
1
11
11
1
11
11
1
11
11
e) Ethics: Assessment of policies and systems to ensure professional ethics• Mechanisms in place towards providing / communicating
the Code of Conduct to employees• All SMS Members completed financial disclosures, signed
by EA and submitted to PSC by 31 May • Disciplinary action taken for non-compliance regarding
submission of financial disclosures• Financial disclosures analyzed, potential conflicts of
interests identified and action taken to address such
Sub-Outcomes 4, 6 and 8: Outcome 12
Sub-Outcome 6, Outcome 3
- - -1
1
N.A.
-
1
1
N.A.
-
1
1
N.A.
1
1
1
N.A.
1
f) Ethics: Prevention of Fraud and Corruption• Fraud Prevention Plan with policy statement and
implementation plan approved• Whistle-blowing Policy and implementation plan
approved• Minimum Anti-Corruption Capacity (MACC) Requirements
Implementation Plan approved• Feedback provided to PSC on anti-corruption hotline
cases within 40 days• Disciplinary procedures and/or criminal procedures
and/or civil procedures applied where fraud and corruption occur
• Fraud and Corruption Risk Assessment conducted to improve internal controls
Sub-Outcomes 4 and 8, Outcome 12
Sub-Outcome 6, Outcome 3
- - ----1
1-
111
1
1-
111
1
11
111
1
11
g) Internal Audit: Assessment of internal audit arrangements• Three-year strategic internal audit plan and operational
plan that is risk-based approved and monitored quarterly
• Internal audit charter approved for internal audit unit• Internal assessment conducted by internal audit unit in
terms of ISPPIA 1311• External review of internal audit unit conducted at least
once every 5 years in terms of ISPPIA 1312• Internal audit recommendations acted on by Management
Sub-Outcome 4, Outcome 12
- - -1
111
(by PT)-
1
111
1
1
111
1
1
111
1
h) Risk Management: Assessment of risk management arrangements • Risk Management Committee in place in accordance with
Chapter 13 of risk management framework• Risk assessment or review conducted by the department• Risk assessment and risk management implementation
plan approved by the Accounting Officer and Audit Committee
• Regular reports provided to the Audit Committee by the Risk Management Committee on the implementation of the Risk Management Plan
• Risk Management Reports acted on by Management
Sub-Outcome 4, Outcome 12
- - -1
11
-
-
1
11
1
1
1
11
1
1
1
11
1
1
i) Delegations: Approved EA and HOD Delegations for public administration in terms of the PSA and PSR• Delegations approved in compliance with the PSA and
PSR• Delegations from EA to HOD and to all relevant
performer levels appropriate for the levels
Sub-Outcomes 1 and 4, Outcome 12
- - -
--
11
11
11
j) Delegations: Approved HOD delegations for financial administration in terms of the PFMA• Delegations approved in alignment to National Treasury
guidelines and approved structure• Delegations from HOD to all relevant performer levels
appropriate for the levels
Sub-Outcome 4, Outcome 12
- - -1
1
1
1
1
1
1
1

DEPARTMENT OF COOPERATIVE GOVERNANCE AND TRADITIONAL AFFAIRS DEPARTMENT OF COOPERATIVE GOVERNANCE AND TRADITIONAL AFFAIRS
13
Programme Performance Indicators and 2014-2017 Annual Targets
Alignment with MTSF
Audited/Actual performance Baseline2013/2014
Medium-term targets2010/2011
2011/2012
2012/2013
2014/2015
2015/2016
2016/2017
k) ICT: Corporate Governance of ICT• Approved:- Corporate Governance of ICT Policy / Framework- Corporate Governance of ICT Charter- ICT Plan- ICT Implementation Plan- ICT Operational Plan • Implemented:- Corporate Governance of ICT Policy / Framework- Corporate Governance of ICT Charter- ICT Plan- ICT Implementation Plan- ICT Operational Plan • ICT Plan periodically improved
Sub-Outcome 4, Outcome 12
- - --
-
-
1
-
-
1
1
-
1
1
1l) Good governance and accountability practices in place in the department in relation to access to information:• Deputy Information Officer appointed• Section 14 manual updated annually and in compliance
with all requirements;• Section 15 notice issued, information disclosed voluntary
and records made available• Section 32 report submitted to the Human Rights
Commission annually, fully compliant with requirements• Compliance to PAIA and periodic review of the
Implementation Plan informed by management discussions
Sub-Outcomes 4 and 6: Outcome12
- - -
11-1
-
1111
-
1111
1
1111
1
3. Effective and efficient human resources management practices applied in the departmenta) Human Resource Strategy and Planning: Human Resource Planning • Annual Adjusted Human Resource (HR) Plan approved by
the MEC in line with DPSA’s format and standards, and submitted to DPSA by 30 June annually
• Annual Human Resources Planning Implementation Report for previous cycle compiled and submitted to DPSA by 31 March annually
• Minutes of review of previous year’s HR Annual Report at top management level kept
Sub-Outcomes 2 and 4: Outcome 12
-
-
-
1
-
-
1
1
1
1
-
1
a) Human Resource Strategy and Planning: Organizational Design and Implementation• Approved structure, aligned with MTEF, implemented in
the Department, with only funded vacancies captured on PERSAL
• Approved structure based on assessment of functions• Structure reviewed periodically, at least in the last 5
years
Sub-Outcome 4, Outcome 12
- - -1
11
1
11
1
1-
1
1-
a) Human Resource Strategy and Planning: Human Resources Development Planning• Approved annual HRD Plan submitted to DPSA (1st Draft
by 31 March and final plan by 31 March)• HRD monitoring questionnaire on implementation
submitted (1st Draft by 31 March and final plan by 31 May)
• HRD Implementation Plan reviewed by Management based on analysis of human resource development planning information
Sub-Outcomes 2 and 4: Outcome 12
Sub-Outcome 7: Outcome 4
- - -1
-
-
1
1
-
1
1
1
1
1
1
b) Human Resource Practices and Administration: Pay sheet certification• Pay sheet certification process in place• Pay sheet certification process fully implemented on a
monthly basis• Process of transferring and terminating staff in place to
avoid fruitless expenditure• Payroll certification analyzed towards identifying
possible ‘ghost workers’ and corrective measures implemented if necessary
Sub-Outcome 4, Outcome 12
- - -----
1121-
11211
11211

DEPARTMENT OF COOPERATIVE GOVERNANCE AND TRADITIONAL AFFAIRS
14
Programme Performance Indicators and 2014-2017 Annual Targets
Alignment with MTSF
Audited/Actual performance Baseline2013/2014
Medium-term targets2010/2011
2011/2012
2012/2013
2014/2015
2015/2016
2016/2017
c) Human Resource Practices and Administration: Application of recruitment and retention practices• Recruitment process with clear roles and responsibilities
approved and fully and consistently implemented• Exit interviews conducted with all employees leaving the
department• Exit interviews analyzed and remedial actions taken if
necessary• Working environment assessment performed and
improvements implemented
Sub-Outcomes 2 and 4: Outcome 12
- - -
1
---
1
11-
1
111
1
111
d) Human Resource Practices and Administration: Management of diversity• Job Access Strategic Framework Implementation Plan in
place• Gender Equality Strategic Framework Implementation
Plan in place• Job Access Strategic Framework Implementation Report
submitted to DPSA 6-monthly• Gender Equality Strategic Framework Implementation
Report submitted to DPSA 6-monthly• Minimum targets of 50% for SMS Female and 2% for
disability met by the Department• Initiatives in place to address perceptions (e.g.
stereotyping) regarding diversity
Sub-Outcome 4: Outcome 12
Sub-Outcome 2: Outcome 14
- - -----
--
1111
--
1111
-1
1111
11
e) Human Resource Practices and Administration: Management of Employee Health• Employee Health and Wellness (EH&W) Operational
Plan, addressing Gender and Human Rights Dimensions of HIV&AIDS and TB in place developed and implemented
• Systems Monitoring Tool (SMT) report submitted to DPSA by 30 September
• All 4 Employee Health and Wellness Policies implemented• Approved GSRB HIV&AIDS Mainstreamed Operational
Plans for the next financial year submitted to DPSA by 31 March 2013
• Quarterly and Annual EH&W Implementation Review reports submitted to DPSA by the following dates:
- 31st July- 31st October- 31st January- 15th May • Budget for EH&W Programme committed in Department’s
approved budget• Health risk assessment conducted towards informing
GSRB HIV&AIDS Mainstreamed Operational Plan
Sub-Outcome 4, Outcome 12
- - --
-1-
-
--
1
111
4
--
1
111
4
1-
1
111
4
11
f) Management of Performance: Implementation of Level 1 - 12 PDM System• Approved PDMS Policy in place• Mid-year assessments and feedback sessions for current
cycle performed • Annual assessment for previous cycle finalized by due
date• Moderation for previous cycle by due date• Performance outcomes in relation to the development of
employees, the management of poor performance and the recognition of performance actively managed by the department
Sub-Outcome 4, Outcome 12
- - -11- -1
11111
11111
11111
g) Management of Performance: Implementation of SMS Performance Management System (excluding HOD)• Signed Performance Agreements signed and submitted
by all SMS Members by the 31st of May• Mid-year assessments and feedback sessions for current
cycle performed• Annual assessment for previous cycle finalized by due
date• Moderation concluded for previous cycle by due date• Performance outcomes in relation to the development of
employees, the management of poor performance and the recognition of performance actively managed by the Department
Sub-Outcome 4, Outcome 12
- - -
1
----
1
1111
1
1111
1
1111

DEPARTMENT OF COOPERATIVE GOVERNANCE AND TRADITIONAL AFFAIRS DEPARTMENT OF COOPERATIVE GOVERNANCE AND TRADITIONAL AFFAIRS
15
Programme Performance Indicators and 2014-2017 Annual Targets
Alignment with MTSF
Audited/Actual performance Baseline2013/2014
Medium-term targets2010/2011
2011/2012
2012/2013
2014/2015
2015/2016
2016/2017
h) Management of Performance: Implementation of SMS Performance Management System for HODs• Signed Performance agreement for the current cycle
submitted to EA by 31 May• Performance Agreement filed with PSC• Changes as directed PSC incorporated• Verification statement submitted on time to relevant
authority for the previous cycle• Performance in relation to the development of poor
performance and recognition of performance managed
Sub-Outcome 4, Outcome 12
- - -
111--
11111
11111
11111
i) Employee Relations: Management of disciplinary cases• Disciplinary cases finalized within policy requirements
and captured on PERSAL (with 80% of suspensions not longer than 60 days and 80% of cases finalized within 90 days of identification and 60 days from notice)
• Disciplinary cases finalized within policy requirements and captured on PERSAL (with no suspensions longer than 60 days and cases finalized within 90 days of identification and 60 days from notice)
• Analysis conducted on nature of misconduct and/or preventative measures implemented unless the department has less than 10 disciplinary cases for the previous 12 months
Sub-Outcome 4, Outcome 12
Sub-Outcome 4: Outcome 4
- - -1
-
1
1
-
1
-
1
1
-
1
1
4. Effective financial management practices applied in the departmenta) Supply Chain Management: Demand Management• Procurement plan iro departmental procurement above
R500,000 that meets Treasury requirements approved and submitted to Treasury by 30 April
• Demand Management Plan that covers all the departmental procurement needs above and below R500,000 approved
• Reports on the procurement plan regularly reviewed • Sourcing strategy that reflect various procurement
options for different categories of spending in place
Sub-Outcomes 4 and 5, Outcome 12
- - -1
1
--
1
1
1-
1
1
11
1
1
11
b) Supply Chain Management: Acquisition Management• Supplier database in place that meets NT minimum
requirements• Bid Committees in place and meeting when required• Code of Conduct signed by Bid Committee Members and
SCM practitioners• Suppliers’ performances reviewed and updated on
the supplier database and information used in future acquisitions
Sub-Outcomes 4 and 5, Outcome 12
- - -111-
111-
1111
1111
c) Supply Chain Management: Logistics Management• Policy / processes for the setting of inventory levels,
placing of orders, receiving, inspection and issuing of goods documented
• Stock holding and distribution policy that minimises stock holdings towards minimizing costs approved
• Inventory management techniques to minimise stock holding costs while ensuring uninterrupted service progressively reviewed
• Internal customer satisfaction survey conducted and actions taken on findings
Sub-Outcome 4: Outcome 12
- - -1
-
-
1
1
-
-
1
1
1
1
1
1
1
1
1
d) Supply Chain Management: Disposal Management• Disposal strategy / policy in place and implemented• Disposal Committee appointed and meetings held• Record of redundant assets unserviceable an obsolete
assets maintained• Financial, social and environmental factors in the disposal
processes considered• Disposal policy / strategy on the basis of reports on
disposals periodically reviewed
Sub-Outcome 4: Outcome 12
- - -1-1--
1111-
1111-
11111

DEPARTMENT OF COOPERATIVE GOVERNANCE AND TRADITIONAL AFFAIRS
16
Programme Performance Indicators and 2014-2017 Annual Targets
Alignment with MTSF
Audited/Actual performance Baseline2013/2014
Medium-term targets2010/2011
2011/2012
2012/2013
2014/2015
2015/2016
2016/2017
e) Expenditure Management: Management of cash flow and expenditure vs. Budget• Cash-flow projection in place and submitted to Provincial
Treasury on time• Expenditure vs. planned budget regularly reviewed by
management and actions taken to prevent under/over expenditure
• Reports provided towards monitoring spending versus planned expenditure
Sub-Outcome 4: Outcome 12
- - -
1-
4
11
4
11
4
11
4
f) Expenditure Management: Payment of suppliers• Monthly exception reports on payment of suppliers
submitted to Provincial Treasury• Invoice tracking system in place• Reports provided towards monitoring the no. of invoices
not paid within 30 days• Reasons for late or non-payment of invoices investigated
and effectiveness of business processes for managing payments reviewed where necessary
Sub-Outcome 4: Outcome 12
- - -11--
1111
1111
1111
g) Expenditure Management: Management of unauthorized, irregular, fruitless and wasteful expenditure• Process in place to prevent and detect unauthorized,
irregular, fruitless and wasteful expenditure• Unauthorized, irregular, fruitless and wasteful
expenditure identified and investigated, management findings communicated to responsible officials and disciplinary action taken against negligent officials
• Audit findings on fruitless, unauthorized and irregular expenditure addressed
• Effectiveness of controls and systems analyzed and reviewed towards preventing recurrence of unauthorized, irregular, fruitless and wasteful expenditure
• Corrective measures implemented
Sub-Outcome 4: Outcome 12
- - -
1
-
--
-
1
1
1-
-
11
11
1
11
11
1
5. Improved communication planning, strategy development and implementation(a) Departmental communication planning, strategy development and implementation• Communication Strategy and implementation plan
developed and approved• Effective involvement in the development and
implementation of the LGCS, Provincial communication strategy
• All key milestones in the approved departmental communication strategy implemented
Sub-Outcome 7: Outcome 4
Sub-Outcome 4: Outcome 12
- - --1
-
11
-
11
1
11
1
(b) Effective implementation and management of campaigns
- - - 1 1 1 1
(c) Effective management and use of appropriate communication channels
- - - 1 1 1 1
(d) Building and sustaining a positive reputation of the department
- - - 1 1 1 1
(e) Effective management of unplanned and urgent communication
- - - 1 1 1 1
6. No. of reports provided towards monitoring the extent to which the department’s accommodation is in line with its needs
Sub-Outcome 4 (Outcome 12)
- - - 2 2 2 2
7. Effective record management practices applied in the department• Record Management Policy approved and/or updated• Record Management Policy fully implemented
- - - -1-
11
11
11
7. No. of Monthly Key Control Matrix Reports submitted to Provincial Treasury
- - - - 12 12 12 12
8. No. of Quarterly Key Control Matrix Reports submitted to Provincial Treasury
- - - - 4 4 4 4
9. No. of reports produced towards monitoring the utilisation of all vehicles in the department
- - - - 4 12 12 12

DEPARTMENT OF COOPERATIVE GOVERNANCE AND TRADITIONAL AFFAIRS DEPARTMENT OF COOPERATIVE GOVERNANCE AND TRADITIONAL AFFAIRS
17
RECONCILING PERFORMANCE TARGETS WITH THE BUDGET AND MTEF: PROGRAMME 1 - ADMINISTRATION
Expenditure estimates
Summary of payments and estimates: Programme 1: Administration
OutcomeMain
appropriationAdjusted
appropriationRevised estimate
Medium-term estimates
R thousand 2010/11 2011/12 2012/13 2014/15 2015/16 2016/17Office of the MEC 7,246 7,212 9,839 11,799 10,237 9,342 10,122 10,639 11,266 Corpotate Services 102,666 122,867 104,059 120,860 87,272 83,955 100,001 105,874 111,163
Total payments and estimates 109,912 130,079 113,898 132,659 97,509 93,297 110,123 116,513 122,429
2013/14

DEPARTMENT OF COOPERATIVE GOVERNANCE AND TRADITIONAL AFFAIRS
18
Payments and estimates by economic classification: Programme 1 Administration
OutcomeMain
appropriationAdjusted
appropriationRevised estimate
Medium-term estimates
R thousand 2010/11 2011/12 2012/13 2014/15 2015/16 2016/17
Current payments 108,029 126,444 109,086 131,284 94,011 89,865 108,099 115,052 120,890
Compensation of employ ees 62,234 70,775 56,503 73,337 41,149 39,089 56,838 60,507 64,412
Salaries and w ages 54,560 61,760 49823 66,103 33,907 31,847 50,559 51,181 54,592
Social contributions 7,674 9,015 6680 7,234 7,242 7,242 6,279 9,326 9,820
Goods and serv ices 45,795 55,669 52,583 57,947 52,862 50,776 51,261 54,545 56,478
of which
Administrative fees 179 118 185 240 266 266 259 301 316
Advertising 1,160 1,838 2199 681 924 928 1,115 1,171 1229
Assets <R5000 720 558 397 1,075 323 509 434 456 479
Audit cost: External 4,948 3,276 4518 5,454 4,580 4,580 4,152 4,360 4578
Bursaries (employees) 98 125 188 218 158 158 150 158 166
Catering: Departmental Activties 1,495 1,679 1223 1,431 907 916 910 955 1003
Communication 2,437 2,857 2283 4,746 3,293 3,292 2,924 3,070 3224
Computer Services 3,054 4,232 4378 6,234 5,437 2,334 2,482 2,671 2805
Cons/prof:business & advisory services 296 181 1136 3,536 325 3,401 239 251 264
Cons/prof:Infrastucture & Planning - - - - -
Cons/prof: Legal cost 4,715 3,650 1 211 110 110 2 3 4
Contractors 683 1,737 1295 1,190 2,104 1,869 2,029 1,733 1820
Agency & Support/Outsourced Services 2,239 1,552 1331 587 4,717 1,641 4,259 5,472 5746
Entertainment 4 19 105 124 110 113 72 73 77
Government motor transport - - - 2,082 2,537 2,750 3,887 4081
Inventory: Food and food supllies 79 74 542
Inventory: Fuel, oil and gas 1 1
Inventory: Clothing Material and Accessories - -
Inventory: Other consumables
Consumable: Stationery, Printing and Office Supplies 1,621 1,460 904 1,958 470 1,358 1,448 1,520 1596
Consumable Supplies 3 6 15 249 1,288 482 308 323 340
Operating Leases 235 3,830 4710 4,142 2,309 2,722 2,954 3,102 3257
Owned & Leasehold property expenditure 11,941 15,922 17477 9,873 14,812 14,812 14,337 14,371 15090
Travel and Subsistence 8,238 9,327 6854 10,714 5,283 5,414 4,930 5,176 5435
Training & Staff Development 534 1,781 511 2,862 1,580 1,580 2,500 2,389 2509
Operating Expenditure 479 821 593 282 1,087 1,057 795 835 877
Venues and Ficilities 636 625 1738 2,140 697 697 2,212 2,268 1582
Other
Interest and rent on land 189 198 28 - 30 30 - - -
Interest 189 198 28 30 30
Rent on land
Transfers and subsidies to1: 192 393 186 169 1,051 1,051 182 183 193
Prov inces and municipalities -
Prov inces2
Prov incial Rev enue Funds
Prov incial agencies and funds
Municipalities3
Municipalities
of which: Regional service council levies
Municipal agencies and funds
Departmental agencies and accounts
Social security funds
Prov ide list of entities receiv ing transfers4
Univ ersities and technikons
Transfers and subsidies to1: - continued
Public corporations and priv ate enterprises5
Public corporations
Subsidies on production
Other transfers
Priv ate enterprises
Subsidies on production
Other transfers
Foreign gov ernments and international organisations
Non-profit institutions
Households 192 393 186 169 1,051 1,051 182 183 193
Social benefits
Other transfers to households 192 393 186 169 1,051 1,051 182 183 193
Payments for capital assets 1,317 2,429 2,878 1,206 2,417 2,351 1,842 1,278 1,346
Buildings and other fix ed structures - -
Buildings
Other fix ed structures
Machinery and equipment 1,317 2,429 2,878 1,206 2,417 2,351 1,842 1,278 1,346
Transport equipment
Other machinery and equipment 1,317 2,429 2878 1,206 2,417 2,351 1,842 1,278 1,346
Cultiv ated assets
Softw are and other intangible assets
Land and subsoil assets
Payments for financial assets 185 615 1720 -
Total economic classification: Programme 1: Administration 109,912 130,079 113,898 132,659 97,509 93,297 110,123 116,513 122,429
2013/14

DEPARTMENT OF COOPERATIVE GOVERNANCE AND TRADITIONAL AFFAIRS DEPARTMENT OF COOPERATIVE GOVERNANCE AND TRADITIONAL AFFAIRS
19
PROGRAMME 2: LOCAL GOVERNANCE
Purpose of the Programme
This Programme aims at establishing, monitoring, regulating, strengthening, supporting and capacitating municipalities in terms of the Constitution of 1996
Brief description of the Programme
This Programme consists of the following Sub-Programmes:
1. Municipal Administration2. Municipal Finance3. Public Participation4. Capacity Development5. Municipal Performance Monitoring, Reporting and Evaluation
Strategic Objective and Programme Performance Indicators with Annual and Quarterly Targets
SUB-PROGRAMMEMUNICIPAL ADMINISTRATION
STRATEGIC OBJECTIVEADMINISTRATIVELy AND INSTITUTIONALLy VIABLE AND SUSTAINABLE
MUNICIPALITIES
Strategic Objective Indicators and 2014-2017 Targets
ALIGNMENT Audited/Actual performance Baseline
2013/2014
Medium-term targets
NDP MTSF FSGDS 2010/2011
2011/2012
2012/2013
Target2014/2015
Target2015/2016
Target2016/2017
1. No. of municipalities whose top 6 posts are filled: • Municipal Manager • CFO • CS Manager • Technical Manager /
Engineer • Town Planner • Communication
Manager
Chapter 13: Building a capable and developmental state
Chapter 5: Transition to a low carbon economy
Outcome 9: Responsive, accountable, effective and efficient developmental local government system
Outcome 10: Protect and Enhance our Environmental Assets and Natural Resources
Pillar 6: Good Governance, Driver 15: Foster good governance to create a conducive climate for growth and development
- - - 6 12 16 20
2. No. of municipalities with skills development plans adopted
- - - 19 19 19 19
3. No. of municipalities that have adopted standardized and customized by-laws
- - - 23 23 23 23
Programme Performance Indicators and 2014-2017 Annual Targets
Alignment with MTSFAudited/Actual performance Baseline
2013/2014
Medium-term targets2010/2011
2011/2012
2012/2013
Target2014/2015
Target2015/2016
Target2016/2017
Standardized Performance Indicators and Targets
1. No. of municipalities supported with fraud and anti-corruption strategy
Sub-Outcome 8: Outcome 9Sub-Outcome 6: Outcome 3
- - - 0 4 24 24
2. No. of reports on the filling of Municipal Managers and section 56 managers’ posts compiled
Sub-Outcome 5: Outcome 9
- - - 4 2 4 4
Non-standardized Performance Indicators and Targets3. No. of municipalities assisted and
supported towards customizing and/or adopting municipal by-laws
Sub-Outcome 4: Outcome 9
Sub-Outcome 5: Outcome 10
- 0 23 14 23 23 23
4. No. of municipalities supported on revenue enhancement through the development of standardised policies in relation to:• Credit control• Indigent• Rates
Sub-Outcome 3: Outcome 9
- - - - 24 24 24

DEPARTMENT OF COOPERATIVE GOVERNANCE AND TRADITIONAL AFFAIRS
20
5. No. of municipalities supported on their skills development plans
Sub-Outcome 5: Outcome 9
10 24 - 0 24 24 24
6. No. of municipalities supported on fraud prevention and anti-corruption through the development of standardized:• Policy Framework• Procedure Manual
Sub-Outcome 8: Outcome 9
Sub-Outcome 6: Outcome 3
- - - 0 1 1 1
7. No. of municipalities supported on the implementation of municipal by-laws through the development of a guide
Sub-Outcome 4: Outcome 9
Sub-Outcome 5: Outcome 10
0 24 24 24
2014-2015 Quarterly Targets Reporting PeriodAnnual Target
2014/2015Q1 Q2 Q3 Q4
Standardized Performance Indicators and Targets
1. No. of reports on the filling of Municipal Managers and section 56 managers’ posts compiled
Bi-Quarterly 2 - 1 - 1
2. No. of municipalities supported with fraud and anti-corruption strategy Quarterly 4 1 1 1 1
Non-Standardized Performance Indicators and Targets3. No. of municipalities assisted and supported towards customizing and/or adopting municipal
by-lawsQuarterly 23 4 6 6 7
4. No. of municipalities supported on revenue enhancement through the development of standardised policies in relation to:• Credit control• Indigent• Rates
Annually 24 - - - 24
5. No. of municipalities supported on their skills development plans Annually 24 - - - 24
6. No. of municipalities supported on fraud prevention and anti-corruption through the development of standardized:• Policy Framework• Procedure Manual
Annually 1 - - - 1
7. No. of municipalities supported on the implementation of municipal by-laws through the development of a guide
Annually 24 - - - 24
SUB-PROGRAMME
MUNICIPAL FINANCESTRATEGIC OBJECTIVE
FINANCIALLy VIABLE AND SUSTAINABLE MUNICIPALITIES
Strategic Objective Indicatorsand 2014-2017 Targets
ALIGNMENT Audited/Actual performance Baseline
2013/2014
Medium-term targets
NDP MTSF FSGDS 2010/2011
2011/2012
2012/2013
Target2014/2015
Target2015/2016
Target2016/2017
1. Improved average monthly collection rate on billings within municipalities
Chapter 13: Building a capable and developmental state
Outcome 9: Responsive, accountable, effective and efficient developmental local government system
Pillar 6: Good Governance, Driver 15: Foster good governance to create a conducive climate for growth and development
- - - 85% 100% 100% 100%
2. % Reduction of debt owed to municipalities
- - - 20% 25% 30% 50%
3. No. of municipalities with debtors more than 50% of own revenue
- - - 14 23 23 23
4. No. of municipalities with unqualified audits
- - - 15 24 24 24
5. No. of municipalities with expenditure management systems
- - - 24 24 24 24
6. No. of municipalities with credible and standardized cash management systems
- - - 24 24 24 24

DEPARTMENT OF COOPERATIVE GOVERNANCE AND TRADITIONAL AFFAIRS DEPARTMENT OF COOPERATIVE GOVERNANCE AND TRADITIONAL AFFAIRS
21
Programme Performance Indicators and 2014-2017 Annual Targets
Alignment with MTSFAudited/Actual performance Baseline
2013/2014
Medium-term targets
2010/2011
2011/2012
2012/2013
Target2014/2015
Target2015/2016
Target2016/2017
Non-standardized Performance Indicators and Targets1. No. of vulnerable municipalities financially assisted Sub-Outcome 3:
Outcome 910 10 7 6 8 8 8
2. No. of vulnerable municipalities supported through customized support programmes
9 5 7 14· Maluti-a-
Phofung· Mafube· Phumelela· Nketoana· Dihlabeng· Ngwathe· Moqhaka· Naledi· Kopanong· Nala· Mohokare· Setsoto· Mantsopa· Matjhabeng
14 14 14
3. No. of municipalities supported to address unauthorised, irregular, fruitless and wasteful expenditures
Sub-Outcome 3: Outcome 9
7 3 23 22 23 23 23
4. No. of municipalities supported in AFS preparation, submission of work files, and predetermined objectives and draft annual reports
Sub-Outcome 7: Outcome 9
7 4 23 23 23 23 23
5. No. of municipalities supported to comply with MPRA Sub-Outcome 3: Outcome 9
2 3 13 20 20 20 20
6. No. of municipalities supported towards GRAP 17 compliance (asset registers)
- - - 8· Moqhaka· Kopanong· Nala· Setsoto· Dihlabeng· Mantsopa· Matjhabeng· Mohokare
8 3 -
2014-2015 Quarterly Targets Reporting Period Annual Target 2014/2015 Q1 Q2 Q3 Q4
Non-Standardized Performance Indicators and Targets1. No. of vulnerable municipalities financially assisted Annually 8 - - - 82. No. of vulnerable municipalities supported through
customized support programmes Annually 14 - - - 14
3. No. of municipalities supported to address unauthorised, irregular, fruitless and wasteful expenditures
Annually 23 - - - 23
4. No. of municipalities supported in AFS preparation, submission of work files, and predetermined objectives and draft annual reports
Annually 23 - - - 23
5. No. of municipalities supported to comply with MPRA Annually 20 - - - 206. No. of municipalities supported towards GRAP 17
compliance (asset registers)Annually 8 - - - 8
SUB-PROGRAMME PUBLIC PARTICIPATION
STRATEGIC OBJECTIVE COOPERATIVE GOVERNANCE AND SERVICE DELIVERY THROUGH EFFECTIVE
COMMUNITY PARTICIPATION
Strategic Objective Indicators
and 2014-2017 Targets
ALIGNMENT Audited/Actual performance Baseline
2013/2014
Medium-term targets
NDP MTSF FSGDS 2010/2011
2011/2012
2012/2013
Target2014/2015
Target2015/2016
Target2016/2017
1. No. of functional Ward Committees
Chapter 13: Building a capable and developmental state
Chapter 15: Nation Building and Social Cohesion
Outcome 9: Responsive, accountable, effective and efficient developmental local government system
Outcome14: Transforming Society and Uniting the Country
Pillar 6: Good Governance, Driver 15: Foster good governance to create a conducive climate for growth and development
- - - 311 317 317 317
2. No. of functional (district) IGR structures with sector and municipal representation
- - - 2 4 4 4

DEPARTMENT OF COOPERATIVE GOVERNANCE AND TRADITIONAL AFFAIRS
22
Programme Performance Indicators and 2014-2017 Annual Targets
Alignment with MTSFAudited/Actual performance Baseline
2013/2014
Medium-term targets2010/2011
2011/2012
2012/2013
Target2014/2015
Target2015/2016
Target2016/2017
Non-standardized Performance Indicators and Targets1. No. of reports produced towards monitoring the
functionality of all Ward Committees Sub-Outcome 2: Outcome 9
- - - 4 4 4 4
2. No. of district IGR structures supported towards improving their functionality
- - - 4 4 4 4
3. No. of Municipalities supported to develop participatory ward level service improvement plans
- - - 15 20 20 20
4. No. of municipalities supported to implement community-based planning as the ward-based planning model
- - - 18 20 20 20
5. No. municipalities supported to implement customer care mechanism
Sub-Outcome 3 (Outcome 14)
- - - 19 20 20 20
6. No. of reports produced on the functionality of District IGR structures
Sub-Outcome 9 (Outcome 14)
- - - 0 4 4 4
7. No. of capacity building initiatives implemented towards building the capacity of ward committees to participate in municipal processes
Sub-Outcome 2: Outcome 9
- - - 1 2 2 2
2014-2015 Quarterly Targets Reporting Period Annual Target 2014/2015 Q1 Q2 Q3 Q4
Non-Standardized Performance Indicators and Targets1. No. of reports produced towards monitoring the functionality of all Ward
Committees Quarterly 4 1 1 1 1
2. No. of district IGR structures supported towards improving their functionality
Quarterly 4 4 4 4 4
3. No. of Municipalities supported to develop participatory ward level service improvement plans
Annually 20 - - - 20
4. No. of municipalities supported to implement community-based planning as the ward-based planning model
Annually 20 - - - 20
5. No. municipalities supported to implement customer care mechanisms Annually 20 - - - 20
6. No. of reports produced on the functionality of District IGR structures Quarterly 4 1 1 1 1
7. No. of capacity building initiatives implemented towards building the capacity of ward committees to participate in municipal process
Annually 2 - - - 2
SUB-PROGRAMME
CAPACITY DEVELOPMENTSTRATEGIC OBJECTIVE
COORDINATED MUNICIPAL SERVICE DELIVERY INITIATIVES
Strategic Objective Indicators and 2014-2017
Annual Targets
ALIGNMENT Audited/Actual performance Baseline
2013/2014
Medium-term targets
NDP MTSF FSGDS 2010/2011
2011/2012
2012/2013
Target2014/2015
Target2015/2016
Target2016/2017
1. No. of municipalities successfully implementing capacity building initiatives towards improving service delivery
Chapter 13: Building a capable and developmental state
Outcome 9: Responsive, accountable, effective and efficient developmental local government system
Pillar 6: Good Governance, Driver 15: Foster good governance to create a conducive climate for growth and development
- - 19 19 19 19 19
2. Reduction in the no. of vulnerable municipalities
- - - 12 10 8 6

DEPARTMENT OF COOPERATIVE GOVERNANCE AND TRADITIONAL AFFAIRS DEPARTMENT OF COOPERATIVE GOVERNANCE AND TRADITIONAL AFFAIRS
23
Programme Performance Indicators and 2014-2017 Annual Targets
Alignment with MTSFAudited/Actual performance Baseline
2013/2014
Medium-term targets2010/2011
2011/2012
2012/2013
Target2014/2015
Target2015/2016
Target2016/2017
Non-standardized Performance Indicators and Targets1. No. of vulnerable municipalities receiving
targeted support Sub-Outcome 4: Outcome 9
- - 12 0 12 12 12
2. No. of meetings held with municipalities towards implementing capacity building programmes
- - 0 2 2 2 2
3. Training plan developed and implemented in municipalities as identified in the Councillor Profile Report
Sub-Outcome 7: Outcome 9
- - - 0 1 1 1
4. Integrated municipal capacity building support plan developed.
Sub-Outcome 4: Outcome 9
- - 0 1 1 1 1
5. Municipal early warning system developed and implemented towards monitoring the functioning of municipalities towards improved service delivery
- - - 0 1 1 1
2014-2015 Quarterly Targets Reporting Period Annual Target 2014/2015 Q1 Q2 Q3 Q4
Non-Standardized Performance Indicators and Targets1. No. of vulnerable municipalities receiving targeted support Annually 12 - - - 122. No. of joint interventions implemented in identified municipalities Annually 2 - - - 123. No. of assessments conducted towards determining the impact of
capacity building programmes on the performance of municipalities (in partnership with SALGA)
Annually 1 - - - 1
4. Integrated municipal capacity building support plans developed and implemented in identified municipalities
Annually 1 - - - 1
5. Municipal early warning system developed and implemented towards monitoring the state of affairs in all municipalities
Annually 1 - - - 1
SUB-PROGRAMME
MUNICIPAL PERFORMANCE MONITORING, REPORTING AND EVALUATIONSTRATEGIC OBJECTIVE
EFFECTIVE MUNICIPAL PERFORMANCE MONITORING AND REPORTING
Strategic Objective Indicators and 2014-2017 Annual Targets
ALIGNMENT Audited/Actual performance Baseline
2013/2014
Medium-term targets
NDP MTSF FSGDS 2010/2011
2011/2012
2012/2013
Target2014/2015
Target2015/2016
Target2016/2017
1. No. of municipalities complying with the LGTAS :• Metro• District• Local
Chapter 13: Building a capable and developmental state
Outcome 9: Responsive, accountable, effective and efficient developmental local government system
Pillar 6: Good Governance, Driver 15: Foster good governance to create a conducive climate for growth and development
- - - 24 24 24 24
2. Consolidated municipal performance report produced and submitted
1 1 1 1 1 1 1

DEPARTMENT OF COOPERATIVE GOVERNANCE AND TRADITIONAL AFFAIRS
24
Programme Performance Indicators and 2014-2017 Annual Targets
Alignment with MTSF
Audited/Actual performanceBaseline2013/2014
Medium-term targets
2010/2011
2011/2012
2012/2013
Target2014/2015
Target2015/2016
Target2016/2017
Standardized Performance Indicators and Targets1. No. of municipalities with functional performance management
system (PMS)Sub-Outcome 4:
Outcome 9- - - - - - -
2. No. of municipal performance reports compiled as per the requirements of Section 47 of the MSA
Sub-Outcome 7: Outcome 9
- - - 1 1 1 1
Non-standardized Performance Indicators and Targets3. No. of provincial reports produced towards monitoring the
implementation of the LGTAS in municipalitiesSub-Outcome 9:
Outcome - - 4 1 2 2 2
4. No. of Outcome 9 reports produced - - - 1 2 2 25. No. of reports produced towards monitoring the signing of
performance agreements by Section 54A Managers that include key LGTAS performance indicators
Sub-Outcomes 4 and 9: Outcome 9
- - - 2 1 1 1
6. No. of reports produced towards monitoring section 54A and s57 managers with:• Signed employment contracts• Signed performance agreements
- - - 2 1 1 1
7. No. of municipalities supported towards producing their annual performance report in terms of Section 46 of the MSA
Sub-Outcome 7: Outcome 9
- 17 - 20 12 12 24
8. Integrated annual performance report compiled and submitted in terms of Section 47 of the MSA
- - - 1 1 1 1
2014-2015 Quarterly Targets Reporting Period Annual Target 2014/2015 Q1 Q2 Q3 Q4
Standardized Performance Indicators and Targets1. No. of municipalities with functional performance management system (PMS) - - - - - -
2. No. of municipal performance reports compiled as per the requirements of Section 47 of the MSA
Annually 1 - - - 1
Non-Standardized Performance Indicators and Targets3. No. of reports produced towards monitoring the implementation of the LGTAS in
municipalities6-Monthly 2 - 1 - 1
4. No. of Outcome 9 reports produced 6-Monthly 2 - 1 - 1
5. No. of reports produced towards monitoring the signing of performance agreements by Section 56 Managers that include key LGTAS performance indicators
Annually 1 - - 1 -
6. No. of reports produced towards monitoring section 57 managers with· Signed employment contracts· Signed performance agreements
Annually 1 - - 1 -
7. No. of municipalities supported towards producing their annual performance report in terms of Section 46 of the MSA
Annually 12 - - - 12
8. Integrated annual performance report compiled and submitted in terms of Section 47 of the MSA
Annually 1 - - - 1

DEPARTMENT OF COOPERATIVE GOVERNANCE AND TRADITIONAL AFFAIRS DEPARTMENT OF COOPERATIVE GOVERNANCE AND TRADITIONAL AFFAIRS
25
RECONCILIATION OF PERFORMANCE TARGETS WITH THE BUDGET AND MTEF
Expenditure estimates
Summary of payments and estimates by economic classification: Programme 2: Local Governance
R thousand 2010/11 2011/12 2012/13 2014/15 2015/16 2016/17
Municipal Administration 14,819 14,622 18,121 19,768 19,843 19,643 19,424 20,578 21,860 Municipal Finance 124,351 64,998 59,470 66,824 77,156 79,736 71,286 77,037 74,675 Public Participation 46,445 82,250 20,100 15,683 11,906 14,906 18,040 18,806 19,882 Capacity Dev elopment - - 4,090 6,725 5,725 5,725 6,034 6,385 6,780
Total payments and estimates 185,615 161,870 101,781 109,000 114,630 120,010 114,784 122,806 123,197
Outcome
2013/14
Medium-term estimates Main
appropriation Adjusted
appropriation Estimated
Actual

DEPARTMENT OF COOPERATIVE GOVERNANCE AND TRADITIONAL AFFAIRS
26
OutcomeMain
appropriation
Adjusted appropriatio
n
Revised estimate
Medium-term estimates
R thousand 2010/11 2011/12 2012/13 2014/15 2014/16 2016/17
Current payments 107,683 124,279 76,456 66,519 68,150 78,584 79,144 82,591 87,506
Compensation of employ ees 53,739 67,082 24,898 31,044 28,544 31,924 45,793 48,726 51,847
Salaries and w ages 44,400 55,484 21,943 27,940 25,617 28,957 42,184 45,334 48,274
Social contributions 9,339 11,598 2,955 3,104 2,927 2,967 3,609 3,392 3,573
Goods and serv ices 53,930 57,181 51,558 35,475 39,606 46,660 33,351 33,865 35,659
of which
Administrative Fees 38 166 51 84 145 156 146 98 96
Advertising - - - - -
Assets <R5000 133 472 35 264 556 564 464 290 296
Audit cost: External - - - - - -
Catering: Departmental Activities 1,278 718 1,118 429 1,299 881 1,132 892 955
Communication 926 - - 4 4 31 1 -
Computer Services - - - - - - - -
Cons/prof: Business & Advisory services 43,439 48,434 41,682 24,462 27,131 34,893 21,955 20,785 21,887
Cons/prof: Infrastructure&planning - - - - - - -
Cons/prof: Laboratory service - - - - - - -
Cons/Prof: Legal Cost 413 2,867 899 2,313 1,663 946 990 1,042
Contractors 63 142 74 105 123 65 87 91
Agency & Support/outsourced Services - 4 1,331 145 1 1,878 2,124 2,237
Entertainment 423 3 3 33 15 17 27 37 42
Inventory: food and food supplies 25 15 17
Inventrory: Fuel, oil &Gas - - 1 - - - -
I nventory: Other consumables
Inventory: Stationery and Printing
Consumable Supplies 191 695 2 305 60 57 65 587 608
Consumables: Stationary, Printing, and Office Supplies 463 169 528 936 493 535 534 1,713 1,774
Operating Leases 90 63 288 180 253
Travel and Subsistence 5,978 5,335 4,866 3,880 4,792 4,937 4,082 4,788 5,030
Training & Staff Development - - - 190 - -
Operating expenditure 374 823 246 823 728 821 394 1,148 1,175
Venues and facilities 96 284 1,667 1,818 1,818 1,632 145 173
Other -
Interest and rent on land 14 16 - - - - - - -
Interest 14 16
Rent on land
Transfers and subsidies to1: 77,588 37,082 24,894 41,872 45,781 40,751 35,008 39,800 35,253
Prov inces and municipalities 76,377 34,127 24,860 40,557 45,619 40,557 33,642 38,384 33,685
Prov inces2
Prov incial Rev enue Funds
Prov incial agencies and funds
Municipalities3
Municipalities 76,377 34,127 24,860 40,557 45,619 40,557 33,642 38,384 33,685
of which: Regional service council levies
Municipal agencies and funds
Departmental agencies and accounts - 2,870 - - - - - - -
Social security funds 2,870
Prov ide list of entities receiv ing transfers4
Univ ersities and technikons
Transfers and subsidies to1: - continued
Public corporations and priv ate enterprises5 - - - - - - - - -
Public corporations
Subsidies on production
Other transfers
Priv ate enterprises
Subsidies on production
Other transfers
Foreign gov ernments and international organisations
Non-profit institutions - 1,200 - 1,200 1,200 1,264
Households 1,211 85 34 115 164 194 166 216 304
Social benefits
Other transfers to households 1,211 85 34 115 164 194 166 216 304
Payments for capital assets 344 476 431 609 699 675 632 415 438
Buildings and other fix ed structures - - - - - - - - -
Buildings
Other fix ed structures
Machinery and equipment 344 476 431 609 699 675 632 415 438
Transport equipment
Other machinery and equipment 344 476 431 609 699 675 632 415 438
Cultiv ated assets
Softw are and other intangible assets
Land and subsoil assets
Payment for financial assets 33 -
Total economic classification 185,615 161,870 101,781 109,000 114,630 120,010 114,784 122,806 123,197
2013/14
Table B.3: Payments and estimates by economic classification: Programme 3 Development and Planning

DEPARTMENT OF COOPERATIVE GOVERNANCE AND TRADITIONAL AFFAIRS DEPARTMENT OF COOPERATIVE GOVERNANCE AND TRADITIONAL AFFAIRS
27
PROGRAMME 3: DEVELOPMENT AND PLANNING
Purpose of the Programme
This Programme aims to facilitate and render support towards integrated planning and development on local government level
Brief description of the Programme
This Programme consists of the following Sub-Programmes:
1. Spatial Planning2. Land Use Management3. Integrated Development Planning 4. Local Economic Development 5. Municipal Infrastructure6. Disaster Management
Strategic Objective and Programme Performance Indicators with Annual and Quarterly Targets
SUB-PROGRAMMESPATIAL PLANNING AND LAND USE MANAGEMENT
STRATEGIC OBJECTIVECREDIBLE SPATIAL DEVELOPMENT FRAMEWORkS
Strategic Objective Indicators and 2014-2017 Annual Targets
ALIGNMENT Audited/Actual performance Baseline
2013/2014
Medium-term targets
NDP MTSF FSGDS 2010/2011
2011/2012
2012/2013
Target2014/2015
Target2015/2016
Target2016/2017
1. No. of municipalities with functional Geographical Information Systems (GIS)
Chapter 13: Building a capable and developmental state
Chapter 6:Inclusive Rural Economy
Chapter 8: Transforming human settlements
Outcome 9 (A responsive, accountable, effective and efficient local government system) , and more specifically on matters related to integrated planning and development across all spheres of government
Outcome 7: Vibrant, Equitable, sustainable rural communities contributing to food security for all
Outcome 8: Sustainable human settlements and improved quality of household life
Pillar 6: Good Governance, Driver 15: Foster good governance to create a conducive climate for growth and development
Pillar 3, Driver 9: Facilitate sustainable human settlements
- - - 0 6 8 8
2. No. of municipalities with updated SDFs in terms of Spatial Planning and Land Use Management Act (SPLUMA).
- - - 0 4 6 6
3. No. of local municipalities with LUMS in terms of SPLUMA
- - - 0 5 4 4
4. No. of sectors participating in meetings of the Provincial Land Use Management Forum• Sector departments• Metro• District Municipalities• Local Municipalities
- - -
1114
19
1114
19
1114
19
1114
19
5. Updated Provincial Spatial Development Framework in place
- - - 1(Draft)
1 1 1

DEPARTMENT OF COOPERATIVE GOVERNANCE AND TRADITIONAL AFFAIRS
28
Programme Performance Indicators and 2014-2017 Annual Targets
Alignment with MTSF
Audited/Actual performance Baseline2013/2014
Medium-term targets2010/2011
2011/2012
2012/2013
Target2014/2015
Target2015/2016
Target2016/2017
1. No. of municipalities supported to implement SDFs in terms of the guidelines
Sub-Outcome 1: Outcome 8
- - - 0 4 5 5
2. No. of municipalities supported for the development of a Geographical Information Systems (GIS):* Assessment conducted* All municipalities supported
Sub-Outcome 3: Outcome 9
Sub-Outcomes 1, 2 and 3: Outcome 7
Sub-Outcome 1, Outcome 8
- - - 01-
-24
-24
3. No. of municipalities supported with the compilation of Spatial Development Frameworks in terms of SPLUMA.
- - - 0 4 6 6
4. No. of local municipalities supported on the compilation of Land Use Management Schemes in terms of SPLUMA
- - - 0 5 4 4
5. No. of meetings held by the Provincial Land Use Management Forum
- - - 2 4 4 4
6. No. of municipalities supported on the implementation of SPLUMA
- - 0 0 24 24 24
7. No. of meetings held by the Townships Board/Provincial Planning Tribunal to consider land development applications
24 16 13 21 20 10 10
8. Development and/or implementation of the Provincial Planning Act:• Proposals submitted for enactment• Advice and training provided to municipalities on
implications / implementation of the new Act• Status of implementation within municipalities
monitored and reported
- - - -1-
-11
-11
2014-2015 Quarter Targets Reporting Period Annual Target 2014/2015 Q1 Q2 Q3 Q4
1. No. of municipalities supported to implement SDFs in terms of the guidelines Quarterly 4 0 1 1 2
2. No. of municipalities supported for the development of a Geographical Information Systems (GIS):* Assessment conducted
Annually 1 - - - 1
3. No. of municipalities supported with the compilation of Spatial Development Frameworks
Annually 4 0 0 0 4
4. No. of local municipalities supported on the compilation of Land Use Management Schemes
Annually 5 0 0 0 5
5. No. of meetings held by the Provincial Land Use Management Forum Quarterly 4 1 1 1 1
6. No. of municipalities supported on the implementation of SPLUMA Annually 24 0 0 0 24
7. No. of meetings held by the Townships Board/Provincial Planning Tribunal to consider land development applications
Quarterly 20 4 6 5 5
8. Development and/or implementation of the Provincial Planning Act:· Proposals submitted for enactment
Annually1 - - - 1
SUB-PROGRAMMELOCAL ECONOMIC DEVELOPMENT (LED)
STRATEGIC OBJECTIVEIMPROVED LOCAL ECONOMY
Strategic Objective Indicators
and 2014-2017 Annual Targets
ALIGNMENT Audited/Actual performance Baseline
2013/2014
Medium-term targets
NDP MTSF FSGDS 2010/2011
2011/2012
2012/2013
Target2014/2015
Target2015/2016
Target2016/2017
1. No. of municipalities with updated LED strategies
Chapter 3: Economy and Employment
Chapter 13: Building a capable and developmental state
Chapter 6: Inclusive rural economy
Chapter 8: Transforming Human Settlements
Outcome 4 (Decent employment through inclusive growth
Outcome 9 (A responsive, accountable, effective and efficient local government system) , and more specifically on matters related to integrated planning and development across all spheres of government
Outcome 7: Vibrant, Equitable, sustainable rural communities contributing to food security for all
Outcome 8: Sustainable human settlements and improved quality of household life
Pillar 6: Good Governance, Driver 15: Foster good governance to create a conducive climate for growth and development
- - - 24 24 24 24
2. No. of municipalities with functional LED units
- - - 24 24 24 24
3. No. of municipalities implementing the CWP in at least 2 wards
- - - 13 20 20 20
4. No. of municipalities with business development forums
- - 3 3 24 24 24
5. No. of (temporary) jobs created though MIG projects
- - - 5748 5000 5000 5000

DEPARTMENT OF COOPERATIVE GOVERNANCE AND TRADITIONAL AFFAIRS DEPARTMENT OF COOPERATIVE GOVERNANCE AND TRADITIONAL AFFAIRS
29
Programme Performance IndicatorsAnd 2014-2017 Annual Targets
Alignment with MTSFAudited/Actual performance
Baseline2013/2014
Medium-term targets
2010/2011
2011/2012
2012/2013
Target2014/2015
Target2015/2016
Target2016/2017
Standardized Performance Indicators and Targets1. No. of work opportunities created through
the CWP Sub-Outcome 6: Outcome 9
Sub-Outcome 8: Outcome 4
- - - 17484 - - -
Non-standardized Performance Indicators and Targets2. No. of municipalities supported towards
ensuring that they have:· Functional LED units· Updated LED Strategies
Sub-Outcome 4: Outcome 7
Sub-Outcome 6: Outcome 9
Sub-Outcome 3: Outcome 4
Sub-Outcome 1: Outcome 8
- -
2411
227
2424
2424
2424
3. No. of municipalities supported on the establishment of business development forums
- - 3 3 24 24 24
4. No. of development initiatives supported to promote revitalization of towns
- - - 0 0 5 10
2014-2015 Quarterly Targets Reporting Period Annual Target 2014/2015 Q1 Q2 Q3 Q4
Standardized Performance Indicators and Targets1. No. of work opportunities created through the CWP - - - - - -
Non-Standardized Performance Indicators and Targets2. No. of municipalities supported towards ensuring that
they have:· Functional LED units· Updated LED Strategies
Quarterly
2424
66
66
66
66
3. No. of municipalities supported on the establishment of business development forums
Quarterly 24 5 10 10 5
4. No. of development initiatives supported to promote revitalization of towns
Quarterly - - - - -
SUB-PROGRAMME MUNICIPAL INFRASTRUCTURE
STRATEGIC OBJECTIVESUCCESSFULLy-IMPLEMENTED MUNICIPAL INFRASTRUCTURE
PROGRAMME
Strategic Objective Indicators
and 2014-2017 Targets
ALIGNMENT Audited/Actual performance Baseline
2013/2014
Medium-term targets
NDP MTSF FSGDS 2010/2011
2011/2012
2012/2013
Target2014/2015
Target2015/2016
Target2016/2017
1. No. of (indigent) households with access to free basic services: · Water · Refuse Removal· Electricity · Sanitation
Chapter 13: Building a capable and developmental state
Chapter 4: Economic infrastructure
Chapter 6: Inclusive Rural Economy
Chapter 8: Transforming Human Settlements
Outcome 9: A responsive, accountable, effective and efficient local government system
Outcome 6: An efficient, competitive and responsive economic infrastructure network
Outcome 7: Vibrant, Equitable, sustainable rural communities contributing to food security for all
Outcome 8: Sustainable human settlements and improved quality of household life
Pillar 3: Improved quality of life, and more specifically Driver 8: Expand and maintain basic and roads infrastructure
- - -
100%100%100%100%
100%100%100%100%
100%100%100%100%
100%100%100%100%
2. No. of municipalities that have updated indigent Registers for the provision of free basic services
- - - 19 20 20 20
3. No. of households with access to basic water supply
- - - 604,068 607,068 610,068 615,909
4. No. of households with access to electricity supply
- - - 899,400 100% 100% 100%
5. No. of households with access to basic level of sanitation services
- - - 605,420 608,420 611,420 615,909
6. No. of households with access to basic refuse removal services
- - - 615,909 615,909 615,909 615,909
7. No. of functional District Municipal Service Partnership Forums
- - - 0 4 4 4

DEPARTMENT OF COOPERATIVE GOVERNANCE AND TRADITIONAL AFFAIRS
30
Programme Performance Indicatorsand 2014-2017 Annual Targets
Alignment with MTSFAudited/Actual
performance Baseline2013/2014
Medium-term targets
2010/2011
2011/2012
2012/2013
Target2014/2015
Target2015/2016
Target2016/2017
Standardized Performance Indicators and Targets1. No. of reports produced on households with
access to basic services Sub-Outcome 1: Outcome 9
Sub-Outcome 1: Outcome 8
- - - 4 4 4 4
Non-standardized Performance Indicators and Targets2. No. of Municipalities supported on MIG Sub-Outcome 1: Outcome 9
Sub-Outcomes 2, 4 & 6 (Outcome 6)
Sub-Outcome 6 (Outcome 7)
Sub-Outcome 1: Outcome 8
- - - 19 19 19 19
3. No. of reports produced towards monitoring compliance by municipalities in relation to:· Public-Private Partnerships· Public-Public Partnerships
- - - 0 4 4 4
4. No. of municipalities supported on the establishment and/or maintenance of municipal service partnerships
25 18 24 0 24 24 24
5. No. of Municipal PMU meetings held towards monitoring and verifying MIG and DIG (departmental infrastructure grant) spending
6 4 3 4 4 4 4
6. No. of local municipalities supported towards developing and successfully implementing policies and strategies to provide qualifying communities access to free basic services
20 19 15 19 19 19 19
7. No. of MIG funded project site visits conducted - - 28 36 36 36 36
8. No. of MIG Project Appraisal Committee Meetings held towards registering projects on MIS
- - 7 6 1 1 1
2014-2015 Quarterly Targets Reporting Period Annual Target 2014/2015 Q1 Q2 Q3 Q4
Standardized Performance Indicators and Targets1. No. of reports produced on households with access to basic services Quarterly 4 1 1 1 1
Non-Standardized Performance Indicators and Targets2. No. of Municipalities supported on MIG Quarterly 19 19 19 19 19
3. No. of reports produced towards monitoring compliance by municipalities in relation to:· Public-Private Partnerships· Public-Public Partnerships
Quarterly 4 1 1 1 1
4. No. of municipalities supported on the establishment and/or maintenance of municipal service partnerships
Quarterly 24 24 24 24 24
5. No. of Municipal PMU meetings held towards monitoring and verifying MIG and PIF(provincial infrastructure fund) spending
Quarterly 4 1 1 1 1
6. No. of local municipalities supported towards developing and successfully implementing policies and strategies to provide qualifying communities access to free basic services
Quarterly 19 19 19 19 19
7. No. of MIG funded project site visits conducted Quarterly 36 9 9 9 9
8. No. of MIG Project Appraisal Committee Meetings held towards registering projects on MIS
Annually 1 0 1 0 0
SUB-PROGRAMME
DISASTER MANAGEMENTSTRATEGIC OBJECTIVE
INTEGRATED RISK PLANNING AND MANAGEMENT OF DISASTERSStrategic Objective Indicators
and 2014-2017 Annual TargetsALIGNMENT Audited/Actual performance
Baseline2013/2014
Medium-term targetsNDP MTSF FSGDS 2010/
20112011/2012
2012/2013
Target2014/2015
Target2015/2016
Target2016/2017
1. No. of municipalities with Disaster Management Centres · Metro · District
Chapter 13: Building a capable and developmental state
Chapter 5: Environmental Sustainability
Outcome 9: A responsive, accountable, effective and efficient local government system
Outcome 10: Protect and enhance our environmental assets and natural resources
Pillar 6: Good Governance, Driver 15: Foster good governance to create a conducive climate for growth and development
Driver 12: Integrate environmental concerns into growth and development planning
- - -12
14
14
14
2. Functional: · Provincial DM Centre · Provincial DM Advisory
Forum
- - -01
11
11
11
3. No. of municipalities with updated Disaster Management Plans
- - - 2 24 24 24
4. Updated and integrated Provincial Disaster Management Plan
- - - 1 1 1 1

DEPARTMENT OF COOPERATIVE GOVERNANCE AND TRADITIONAL AFFAIRS DEPARTMENT OF COOPERATIVE GOVERNANCE AND TRADITIONAL AFFAIRS
31
Programme performance indicators and 2014-2017 Annual Targets
Alignment with MTSF
Audited/Actual performance Baseline2013/2014
Medium-term targets2010/2011
2011/2012
2012/2013
Target2014/2015
Target2015/2016
Target2016/2017
Standardized Performance Indicators and Targets1. No. of meetings of the Intergovernmental
Disaster Management Forum0 0 0 0 4 4 4
Non-standardized Performance Indicators and Targets2. Functional Provincial DM Centre:
• Disaster Operations Centre operational • Adequate office accommodation• Education, training and research facility • Filling of critical vacant posts• Media and public information service
Sub-Outcome 2: Outcome 10
Sub-Outcome 9: Outcome 9
11---
11---
11---
11---
1111-
11111
11111
3. No. of meetings held by the Provincial DM Advisory Forum
- - 1 4 4 4 4
4. Provincial Disaster Management Plan in place, reviewed and updated
1 0 1 1 1 1 1
5. No. of municipalities supported towards ensuring functional disaster management advisory forums:• Metro• District Municipalities
- - -
04
14
14
14
6. No. of municipalities capacitated on Disaster Risk Management draft Plans: • Metro• DM
-5
-5
14
14
14
14
14
7. No. of local municipalities capacitated on Disaster Management Plans (in partnership with District Municipalities)
20 20 19 0 19 19 19
8. No. of reports produced on the state of disaster management in the Province
- - - - 0 2 2 2
9. No. of reports produced on the state of fire services in the Province
- - - - 1 1 1 1
10. No. of meetings held by the Provincial Fire Services Advisory Committee
- - - - 4 4 4 4
11. Updated Provincial Fire Management Plan - - - - 1 1 1 1
2014-2015 Quarterly Targets Reporting Period Annual Target 2014/2015 Q1 Q2 Q3 Q4
Standardized Performance Indicators and Targets1. No. of meetings of Intergovernmental Disaster management Forum Quarterly 4 1 1 1 1
Non-Standardized Performance Indicators and Targets2. Functional Provincial DM Centre:
• Disaster Operations Centre operational • Adequate office accommodation• Education, training and research facility • Filling of critical vacant posts
Annually - - - 1
3. No. of meetings held by the Provincial DM Advisory Forum Quarterly 4 1 1 1 1
4. Provincial Disaster Management Plan in place, reviewed and updated Annually 1 - - - 1
5. No. of municipalities supported towards ensuring functional disaster management advisory forums:• Metro• District Municipalities
Quarterly14
14
14
14
14
6. No. of municipalities capacitated on Disaster Risk Management draft Plans: • Metro• DM
Quarterly14
-1
11
-1
-1
7. No. of local municipalities capacitated on Disaster Management Plans (in partnership with District Municipalities)
Quarterly 19 5 5 5 4
8. No. of reports produced on the state of disaster management in the Province
6-Monthly 2 - 1 - 1
9. No. of reports produced on the state of fire services in the Province Annually 1 - - - 1
10. No. of Provincial Fire Services Advisory Committee meetings held Quarterly 4 1 1 1 1
11. Updated Provincial Fire Management Plan Annually 1 - - - 1

DEPARTMENT OF COOPERATIVE GOVERNANCE AND TRADITIONAL AFFAIRS
32
SUB-PROGRAMME MUNICIPAL INTEGRATED DEVELOPMENT PLANNING
STRATEGIC OBJECTIVEIMPROVED MUNICIPAL INTEGRATED DEVELOPMENT PLANNING
Strategic Objective Indicators and 2014-2017
Targets
ALIGNMENT Audited/Actual performanceBaseline2013/2014
Medium-term targetsNDP MTSF FSGDS 2010/
20112011/2012
2012/2013
Target2014/2015
Target2015/2016
Target2016/2017
1. No. of municipalities with legally compliant IDPs:• Metro• District• Local
Chapter 13: Building a capable and developmental state
Outcome 9: A responsive, accountable, effective and efficient local government system
Pillar 6: Good governance, Driver 15: Foster good governance to create a conducive climate for growth and development
- - -14
19
14
19
14
191419
2. No. of municipalities that have adopted their IDPs:• Metro• District• Local
- - -14
19
14
19
14
19
14
19
3. No. of institutions participating in the IDP processes: • Metro • District • Local • Sector
departments
- - -14
1912
14
1911
14
1911
14
1911
4. No. of identified municipalities implementing the revised IDP framework
- - - 11 11 11 11
Programme performance indicators and 2014-2017
Annual TargetsAlignment with
MTSF
Audited/Actual performance Baseline2013/2014
Medium-term targets2010/2011
2011/2012
2012/2013
Target2014/2015
Target2015/2016
Target2016/2017
Standardized Performance Indicators and Targets1. No. of municipalities
supported with development of legally compliant IDPs
Sub-Outcome 2: Outcome 9
- - - 24 24 24 24
Non-standardized Performance Indicators and Targets2. No. of municipalities
monitored on the adoption of their IDPs:• Metro• District• Local
Sub-Outcomes 2 ad 4: Outcome 9 -
520
14
19
14
19
14
19
14
19
14
19
14
19
3. No. of support initiatives implemented towards improving municipal IDPs: • Provincial IDP Managers
Forum• Provincial IDP Assessment
Session• Provincial Planning and
Development Forum
111
111
111
111
4. No. of municipalities supported on the implementation of the revised IDP framework
- - - 11 11 11 11

DEPARTMENT OF COOPERATIVE GOVERNANCE AND TRADITIONAL AFFAIRS DEPARTMENT OF COOPERATIVE GOVERNANCE AND TRADITIONAL AFFAIRS
33
2014-2015 Quarterly Targets Reporting Period
Annual Target 2014/2015 Q1 Q2 Q3 Q4
Standardized Performance Indicators and Targets1. No. of municipalities supported with development of legally compliant IDP Annually 24 - - - 24
Non-Standardized Performance Indicators and Targets2. No. of municipalities monitored towards ensuring that they have adopted their
IDPs:· Metro· District· Local
Annually14
19
14
19
- -
3. No. of support initiatives implemented towards improving IDP processes: · Provincial IDP Managers Forum· Provincial IDP Assessment· Provincial Planning and Dev Forum
Annually111
11-
1--
1--
1-1
4. No. of municipalities supported on the implementation of the revised IDP framework
Annually 11· Nala· Tokologo· Masilonyana· Letsemeng· Kopanong· Mohokare· Naledi· Ngwathe· Nketoana· Mafube· Phumelela
- - - 11

DEPARTMENT OF COOPERATIVE GOVERNANCE AND TRADITIONAL AFFAIRS
34
RECONCILIATION OF PERFORMANCE TARGETS WITH THE BUDGET AND MTEF
Expenditure estimate
Payments and estimates by economic classification: Programme 3 Development and Planning
OutcomeMain
appropriationAdjusted
appropriationRevised estimate
Medium-term estimates
R thousand 2010/11 2011/12 2012/13 2014/15 2015/16 2016/17
Current payments 53 088 40 264 31 950 53 469 48 204 51 871 45 163 47 976 51 165
Compensation of employ ees 22 198 23 036 24 952 34 094 28 079 29 079 32 366 34 438 36 645
Salaries and w ages 19 541 20 173 21 838 30 685 24 670 25 670 28 420 30 716 32 726
Social contributions 2 657 2 863 3 114 3 409 3 409 3 409 3 946 3 722 3 919
Goods and serv ices 30 862 17 228 6 998 19 375 20 125 22 792 12 797 13 538 14 520
of which
Administrative Fees 15 24 27 69 67 67 72 80 88
Advertising 3 150 21 93 205 205 166 103 108
Assets <R5000 112 397 43 527 592 592 912 354 383
Audit cost: External - - - - -
Catering: Departmental Activities 740 1 040 701 795 780 780 1 118 760 805
Communication 392 7 - 8 8 4 -
Computer Services - - - - -
Cons/prof: Business & Advisory services 57 313 768 2 726 1 479 1 479 1 925 1 638 1646
Cons/prof: Infrastructure&planning - - - - -
Cons/Prof: Legal Cost - 66 253 134 134 120 270 284
Contractors 24 990 10 431 530 5 095 9 152 11 819 58 102 372
Agency & Support/outsourced Services - - - - -
Entertainment 7 1 0 21 16 16 11 25 26
Inventory: food and food supplies 9 11 10
Inventory: Clothing and Accessories
Inventory: Fuel, oil and gas 1 - - -
Consumable Supplies 21 - 45 95 95 70 57 59
Consumable: Stationery, Printing and Office Supplies 311 358 337 512 773 773 812 565 595
Consumable Supplies
Operating Leases 58 48 211 -
Travel and Subsistence 1 912 1 743 2330 4 947 3 082 3 082 3 975 5 833 6163
Training & Staff Development 8 - - -
Operating expenditure 2 095 2 491 2122 3 909 2 777 2 777 2 743 3 470 3694
Venues and facilities 131 148 109 172 957 957 802 281 297
Renting and Hiring 8 8 9
Interest and rent on land 28 - - - - - - - -
Interest 28 - -
Rent on land
Transfers and subsidies to1: 11 494 14 849 20 576 21 005 14 234 14 501 27 026 27 686 29 153
Prov inces and municipalities 11 478 14 830 20 326 20 867 14 000 14 267 26 883 27 540 29 000
Prov inces2
Prov incial Rev enue Funds
Prov incial agencies and funds
Municipalities3
Municipalities 11 478 14 830 20 326 20 867 14 000 14 267 26 883 27 540 29 000
of which: Regional service council levies
Municipal agencies and funds
Departmental agencies and accounts - - - - - - - - -
Social security funds
Prov ide list of entities receiv ing transfers4
Univ ersities and technikons
Transfers and subsidies to1: - continued
Public corporations and priv ate enterprises5
Public corporations
Subsidies on production
Other transfers
Priv ate enterprises
Subsidies on production
Other transfers
Foreign gov ernments and international organisations
Non-profit institutions
Households 16 19 250 138 234 234 143 146 153
Social benefits
Other transfers to households 16 19 250 138 234 234 143 146 153
Payments for capital assets 455 280 318 677 511 511 703 727 766
Buildings and other fix ed structures - - - - - - - - -
Buildings
Other fix ed structures
Machinery and equipment 455 280 318 677 511 511 703 727 766
Transport equipment
Other machinery and equipment 455 280 318 677 511 511 703 727 766
Cultiv ated assets
Softw are and other intangible assets
Land and subsoil assets
Payments for financial assets 2 -
Total economic classification 65 039 55 393 52 844 75 151 62 949 66 883 72 892 76 389 81 084
2013/14
Expenditure estimate
Outcome Main appropriation
Adjusted appropriation
Revised estimate Medium-term estimates
R thousand 2010/11 2011/12 2012/13 2014/15 2015/16 2016/17
Spatial Planning 15,381 15,745 15,173 22,573 19,051 19,051 21,416 22,584 23,962 Development Admin/ Land Use ManagementIntegrated Development and Planning (IDP)Local Economic Development (LED)/ Dev and Planning 3,150 3,401 4,095 5,424 4,924 5,424 5,768 6,074 6,438 Municipal Infrastructure 42,813 32,521 27,408 33,696 30,016 32,950 38,567 40,176 42,398 Disaster Management 3,695 3,726 6,168 13,458 8,958 9,458 7,141 7,555 8,286
Total payments and estimates: Programme 3 65,039 55,393 52,844 75,151 62,949 66,883 72,892 76,389 81,084
Summary of payments and estimates: Programme 3 Development and Planning
2013/14
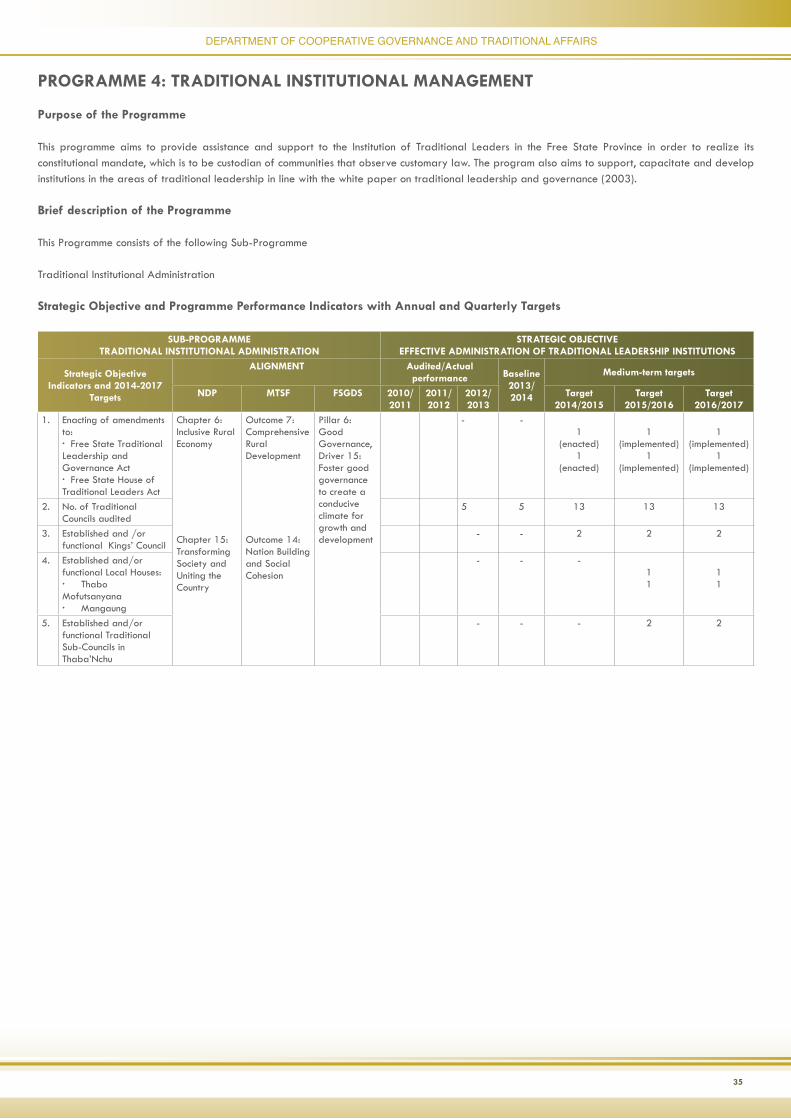
DEPARTMENT OF COOPERATIVE GOVERNANCE AND TRADITIONAL AFFAIRS DEPARTMENT OF COOPERATIVE GOVERNANCE AND TRADITIONAL AFFAIRS
35
PROGRAMME 4: TRADITIONAL INSTITUTIONAL MANAGEMENT
Purpose of the Programme
This programme aims to provide assistance and support to the Institution of Traditional Leaders in the Free State Province in order to realize its constitutional mandate, which is to be custodian of communities that observe customary law. The program also aims to support, capacitate and develop institutions in the areas of traditional leadership in line with the white paper on traditional leadership and governance (2003).
Brief description of the Programme
This Programme consists of the following Sub-Programme
Traditional Institutional Administration
Strategic Objective and Programme Performance Indicators with Annual and Quarterly Targets
SUB-PROGRAMMETRADITIONAL INSTITUTIONAL ADMINISTRATION
STRATEGIC OBJECTIVEEFFECTIVE ADMINISTRATION OF TRADITIONAL LEADERSHIP INSTITUTIONS
Strategic Objective Indicators and 2014-2017
Targets
ALIGNMENT Audited/Actual performance Baseline
2013/2014
Medium-term targets
NDP MTSF FSGDS 2010/2011
2011/2012
2012/2013
Target2014/2015
Target2015/2016
Target2016/2017
1. Enacting of amendments to:· Free State Traditional Leadership and Governance Act· Free State House of Traditional Leaders Act
Chapter 6: Inclusive Rural Economy
Chapter 15: Transforming Society and Uniting the Country
Outcome 7: Comprehensive Rural Development
Outcome 14: Nation Building and Social Cohesion
Pillar 6: Good Governance, Driver 15: Foster good governance to create a conducive climate for growth and development
- -1
(enacted)1
(enacted)
1(implemented)
1(implemented)
1(implemented)
1(implemented)
2. No. of Traditional Councils audited
5 5 13 13 13
3. Established and /or functional Kings’ Council
- - 2 2 2
4. Established and/or functional Local Houses:· Thabo Mofutsanyana · Mangaung
- - -11
11
5. Established and/or functional Traditional Sub-Councils in Thaba’Nchu
- - - 2 2

DEPARTMENT OF COOPERATIVE GOVERNANCE AND TRADITIONAL AFFAIRS
36
Strategic Objective Effective administration of traditional
leadership institutionsAlignment with
MTSF
Audited/Actual performance Baseline2013/2014
Medium-term targets2010/2011
2011/2012
2012/2013
Target2014/2015
Target2015/2016
Target2016/2017
Non-standardized Performance Indicators and Targets1. Proposals developed and submitted on
the amendment of:· Free State Traditional Leadership and Governance Act
· Free State House of Traditional Leaders Act
Sub-Outcome 2 (Outcome 14) -
---
--
00
1(amendment)
1(amendment
1(implemented)
1(implemented)
1(implemented)
1(implemented)
2. No. of reports produced towards monitoring the auditing of Traditional Councils
- - - - 1 1 1
3. No. and type of capacity building programmes implemented targeting all Traditional Leaders:· ABET· LED / IDP· Community Development Work Programme· Traditional Affairs legislation and related matters
112-
----
1110
0111
1111
1111
1111
4. Development and implementation of policies:· Financial Management of Traditional Councils
· Policy on bereavement
-
-
-
-
-
-
-
-
1(draft policy
1(draft policy
1
1
0
0
5. No. of information / awareness sessions held with Traditional Councils on:• Human Resources Management and -Development• Planning, Monitoring and Evaluation• Performance Management• Labour Relations• Corporate Communication• ICT procurement• Access to Information• Financial Management• Supply Chain Management
- 13 2 1 1 1 1
6. No. of partnerships facilitated for traditional councils
Sub-Outcome 2 (Outcome 7)
- - - - 2 2 2
7. No. of reports produced 6-monthly on the performance of each Traditional Council
Sub-Outcome 2 (Outcome 14)
- - - 2 2 2 2
8. No. of traditional councils that actively participate in the development of municipal IDP’s
Sub-Outcome 2 (Outcome 7)
- - - - 13 13 13
9. No. of Traditional Leaders recognized and inaugurated
Sub-Outcome 2 (Outcome 14)
- - 1 2 (kings)
6 7
10. No. of genealogy established / maintained for royal families
- 0 1 1 1

DEPARTMENT OF COOPERATIVE GOVERNANCE AND TRADITIONAL AFFAIRS DEPARTMENT OF COOPERATIVE GOVERNANCE AND TRADITIONAL AFFAIRS
37
2014-2015 Quarterly Targets Reporting Period Annual Target 2014/2015 Q1 Q2 Q3 Q4
Non-Standardized Performance Indicators and Targets1. Proposals developed and submitted on the amendment of:
· Free State Traditional Leadership and Governance Act
· Free State House of Traditional Leaders Act
Annually 1(amendment)
1(amendment
-
-
-
-
-
-
1
1
2. No. of reports produced towards monitoring the auditing of Traditional Councils
Annually 1 - - - 1
3. No. and type of capacity building programmes implemented targeting all Traditional Leaders:· ABET· LED / IDP· Community Development Work Programme· Traditional Affairs legislation and related matters
Annually1111
----
----
----
1111
4. Development and implementation of policies:· Financial Management of Traditional Councils
· Policy on bereavement
Annually1
(draft policy
1(draft policy
-
-
-
-
-
-
1
1
5. No. of information / awareness sessions held with Traditional Councils on:• Human Resources Management and -Development• Performance Management
Quarterly 1 1 - - -
• Labour Relations• Corporate Communication
1 - 1 - -
• ICT procurement• Access to Information
1 - - 1 -
• Financial Management• Supply Chain Management
1 - - - 1
6. No. of partnerships facilitated for traditional councils Quarterly 2 (kings)
- - 1 1
7. No. of reports produced 6-monthly on the performance of each Traditional Council
Annual 2 - 1 - 1
8. No. of traditional councils that actively participate in the development of municipal IDP’s
Quarterly 13 - 1 11 1
9. No. of newly-appointed Traditional Leaders recognized and inaugurated
Quarterly 2 - - - 2
10. No. of genealogies established / maintained for royal families Annually 1 - - - 1

DEPARTMENT OF COOPERATIVE GOVERNANCE AND TRADITIONAL AFFAIRS
38
RECONCILIATION OF PERFORMANCE TARGETS WITH THE BUDGET AND MTEF
Expenditure estimates
Outcome Main
appropriation
Adjusted appropriatio
n
Revised estimate
Medium-term estimates
R thousand 2009/10 2010/11 2011/12 2013/14 2014/15 2015/16
Current payments 15 990 19 869 23 050 21 984 23 734 25 717 33 499 35 563 37 790
Compensation of employ ees 14 593 18 762 21 241 20 181 29 381 23 664 31 630 33 626 35 750
Salaries and w ages 12 971 16 916 19 069 18 163 27 363 21 646 28 435 31 423 33 430
Social contributions 1 622 1 846 2 172 2 018 2 018 2 018 3 195 2 203 2 320
Goods and serv ices 1 391 1 101 1 809 1 803 2 053 2 053 1 869 1 937 2 040
of which
Administrative Fees 11 25 22 37 47 37 48 40 43
Advertising - - - - -
Assets <R5000 35 82 14 47 27 27 51 54
Audit cost: External - - - - -
Bursaries (employees) - - - - -
Catering: Departmental Activities 68 185 301 259 554 404 280 280 295
Communication 194 - - 30 30 20 -
Computer Services - - - - -
Cons/prof: Business & Advisory services - - - 10 20 376 -
Cons/prof: Infrastructure&planning - - - - -
Cons/Prof: Legal Cost - - 113 - - -
Contractors 45 - 69 50 159 159 60 60 63
Agency & Support/outsourced Services - - - - -
Entertainment - 1 3 3 3 3 3 3
Government Motor transport - - - - -
Inventory: food and food supplies 2 2 2
I nventory: fuel, oil and gas - - - - -
I nventory: Other Supplies
Inventory: Stationery and Printing
Consumable Supplies 11 66 66 13 12 12
Consumable: Stationary, Printing and Office Supplies, 18 35 63 90 40 80 90 101 106
Operating Leases - - 37 - -
Travel and Subsistence 931 753 1 111 1 059 957 1 007 883 1 154 1 216
Training & Staff Development - - 26 - - - -
Operating expenditure 3 3 7 90 120 120 50 101 106
Venues and facilities 84 15 81 120 40 100 46 135 142
Other
Interest and rent on land 6 6 - - - - - - -
Interest 6 6 -
Rent on land
Transfers and subsidies to1: 297 303 437 624 1 106 1 106 648 671 706
Prov inces and municipalities - - - - - - - - -
Prov inces2
Prov incial Rev enue Funds
Prov incial agencies and funds
Municipalities3
Municipalities
of which: Regional service council levies
Municipal agencies and funds
Departmental agencies and accounts - - - - - - - - -
Social security funds
Prov ide list of entities receiv ing transfers4
Univ ersities and technikons
Transfers and subsidies to1: - continued
Public corporations and priv ate enterprises5
Public corporations
Subsidies on production
Other transfers
Priv ate enterprises
Subsidies on production
Other transfers
Foreign gov ernments and international organisations
Non-profit institutions 151 255 286 422 866 866 438 450 474
Households 146 48 151 202 240 240 210 221 232
Social benefits
Other transfers to households 146 48 151 202 240 240 210 221 232
Payments for capital assets 125 277 8 243 77 77 253 262 276
Buildings and other fix ed structures - - - - - - - - -
Buildings
Other fix ed structures
Machinery and equipment 125 277 8 243 77 77 253 262 276
Transport equipment
Other machinery and equipment 125 277 8 243 77 77 253 262 276
Cultiv ated assets
Softw are and other intangible assets
Land and subsoil assets
Payments for financial assets 1 -
Total economic classification 16 413 20 449 23 495 22 851 32 617 26 900 34 400 36 496 38 772
2012/13
Payments and estimates by economic classification: Traditional Institutional Management
Summary of payments and estimates:Programme 4 Traditional Institutional Management
Outcome Main appropriation
Adjusted appropriation
Revised estimate Medium-term estimates
R thousand 2010/11 2011/12 2012/13 2014/15 2015/16 2016/17
Traditional Institutional Administration 16,413 20,449 23,495 22,851 32,617 26,900 34,400 36,496 38,772
Total payments and estimates: Programme 4 16,413 20,449 23,495 22,851 32,617 26,900 34,400 36,496 38,772
2013/14

DEPARTMENT OF COOPERATIVE GOVERNANCE AND TRADITIONAL AFFAIRS DEPARTMENT OF COOPERATIVE GOVERNANCE AND TRADITIONAL AFFAIRS
39
PROGRAMME 5: FREE STATE HOUSE OF TRADITIONAL LEADERS
Purpose of the Programme
This Programme aims to promote and enhance the effective and efficient functioning of the Free State House of Traditional Leaders as well as Local Houses
Brief description of the Programme
This Programme consists of the following Sub-Programme:
Administration of Houses of Traditional Leaders
Strategic Objective and Programme Performance Indicators with Annual and Quarterly Targets
SUB-PROGRAMMEADMINISTRATION OF HOUSE OF TRADITIONAL LEADERS
STRATEGIC OBJECTIVE EFFECTIVE FUNCTIONING OF THE FS HOUSE OF TRADITIONAL LEADERS
Strategic Objective Indicators and 2014-2017 Annual
Targets
ALIGNMENT Audited/Actual performance Baseline
2013/2014
Medium-term targets
NDP MTSF FSGDS 2010/2011
2011/2012
2012/2013
Target2014/2015
Target2015/2016
Target2016/2017
1. No. of meetings held by fully functional Committees of the House of Traditional Leaders
Chapter 6: Inclusive Rural Economy
Chapter 15: Transforming Society and Uniting the Country
Outcome 7: Comprehensive Rural Development
Outcome 14: Nation Building and Social Cohesion
Pillar 6: Good Governance, Driver 15: Foster good governance to create a conducive climate for growth and development
24 26 5 12 12 12 12
2. No. of sittings held by the Executive Committee to review progress on decisions taken
8 15 18 18 18
3. No. of sittings held by the House of Traditional Leaders to review progress of the institution
- - - 2 4 4 4
Programme Performance Indicatorsand 2014-2017 Annual Targets
Alignment with MTSF
Audited/Actual performance Baseline
2013/2014
Medium-term targets
2010/2011
2011/2012
2012/2013
Target2014/2015
Target2015/2016
Target2016/2017
Non-standardized Performance Indicators and Targets1. No. of MOUs signed and/or maintained
with stakeholders or partners to enable the House to perform oversight functions towards monitoring, reviewing and evaluating the implementation of government programmes in traditional communities
Sub-Outcomes 1 and 2: Outcome 14
- - - 1 1 1 1
2. No. of outreach and empowerment programmes facilitated and participated in with regards to community development and empowerment
Sub-Outcomes 1,2,3,4 and 6: Outcome 7
- 7 3 8 4 4 4
3. No. of capacity building programmes implemented towards capacitating members of the House
- - - - 1 1 1
4. No. of constituency and progress meetings held with traditional councils towards ensuring the implementation of decisions of the House of Traditional Leaders
- - - 13 52 52 52
5. No. of annual cultural heritage celebrations hosted towards promoting tradition, culture, heritage and social cohesion
- - 5 1 5 5 5
6. Communication and marketing tool developed and/or implemented
- - - - 1(Developed and
partially implemented)
1(Implemented)
1(Implemented)

DEPARTMENT OF COOPERATIVE GOVERNANCE AND TRADITIONAL AFFAIRS
40
2014-2015 Quarterly Targets Reporting Period
Annual Target 2014/2015 Q1 Q2 Q3 Q4
Non-Standardized Performance Indicators and Targets1. No. of MOUs signed and/or maintained with stakeholders or partners
to enable the House to perform oversight functions towards monitoring, reviewing and evaluating the implementation of government programmes in traditional communities
Annually 1 - - - 1
2. No. of outreach and development programmes coordinated and participated in with regards to community development and empowerment
Quarterly 4 1 1 1 1
3. No. of capacity building programmes implemented towards capacitating members of the House
Annually 1 - - - 1
4. No. of constituency and progress meetings held with traditional councils towards ensuring the implementation of decisions of the House of Traditional Leaders
Quarterly 52 13 13 13 13
5. No. of annual cultural heritage celebrations hosted towards promoting tradition, culture, heritage and social cohesion
Quarterly 5 1 1 2 1
6. Communication and marketing tool developed and implemented Annually 1(Developed and
partially implemented)
- 1(Developed)
- 1(Partially
implemented)

DEPARTMENT OF COOPERATIVE GOVERNANCE AND TRADITIONAL AFFAIRS DEPARTMENT OF COOPERATIVE GOVERNANCE AND TRADITIONAL AFFAIRS
41
RECONCILIATION OF PERFORMANCE TARGETS WITH THE BUDGET AND MTEF
Expenditure estimates
Summary of payments and estimates: Programme 5: House of Traditional Leaders
OutcomeMain
appropriationAdjusted
appropriationRevised estimate
Medium-term estimates
R thousand 2010/11 2011/12 2012/13 2014/15 2015/16 2016/17
Administration of Houses of Traditional Leaders 11,082 11,454 8,512 8,752 9,751 9,451 9,426 9,980 10,599
Total payments and estimates 11,082 11,454 8,512 8,752 9,751 9,451 9,426 9,980 10,599
2013/14
Table B.3: Payments and estimates by economic classification: Programme 5 House of Traditional Leaders
OutcomeMain
appropriation
Adjusted appropriatio
n
Revised estimate
Medium-term estimates
R thousand 2010/11 2011/12 2012/13 2014/15 2015/16 2016/17
Current payments 8,929 10,014 8,344 8,426 8,379 8,079 9,086 9,629 10,229
Compensation of employ ees 4,632 5,500 6,226 7,048 6,874 6,574 7,658 8,149 8,671
Salaries and w ages 4,397 5,238 5,864 6,339 6,405 6,105 7,166 7,379 7,860
Social contributions 235 262 362 709 469 469 492 770 811
Goods and serv ices 4,294 4,514 2,118 1,378 1,505 1,505 1,428 1,480 1,558
of which
Administrative Fees 24 52 24 79 54 59 51 85 89
Advertising - - - 100 -
Assets <R5000 9 165 17 67 35 35 100 72 76
Audit cost: External - - - - -
Bursaries (employees) - - - - -
Catering: Departmental Activities 743 803 243 353 143 137 150 370 390
Communication 40 - - 4 4 - -
Computer Services - - - - -
Cons/prof: Business & Advisory services - - - - -
Cons/prof: Infrastructure&planning - - - - -
Cons/Prof: Legal Cost - - - - -
Contractors 324 281 372 84 59 59 110 90 95
Agency & Support/outsourced Services - - - - -
Entertainment - - 4 3 3 3 3
Government motor transport - - - - -
Inventory: food and food supplies 3 27 6
I nventory: fuel, oil and gas - -
Inventory: Stationery and Printing
Consumables Supplies 10 15 15 5 4 4
Consumable: Stationary, Printing and Office Supplies 163 180 120 32 15 29 25 43 45
Lease Payments - - 42 -
Property payments 1 - - - -
Travel and Subsistence 2,466 2,447 1286 487 1,158 1,142 779 568 598
Training & Staff Development - 9 - - -
Operating expenditure 383 147 109 3 3 8 120 126
Venues and facilities 138 403 50 111 16 19 100 125 132
Other
Interest and rent on land 3 - - - - - - - -
Interest 3 -
Rent on land
Financial transactions in assets and liabilities
Transfers and subsidies to1: 3 2 50 285 1,308 1,308 296 306 323
Prov inces and municipalities - - - - - - - - -
Prov inces2
Prov incial Rev enue Funds
Prov incial agencies and funds
Municipalities3
Municipalities
of which: Regional service council levies
Municipal agencies and funds
Departmental agencies and accounts - - - - - - - - -
Social security funds
Prov ide list of entities receiv ing transfers4
Univ ersities and technikons
Transfers and subsidies to1: - continued
Public corporations and priv ate enterprises5
Public corporations
Subsidies on production
Other transfers
Priv ate enterprises
Subsidies on production
Other transfers
Foreign gov ernments and international organisations
Non-profit institutions 1,223 1,223
Households 3 2 50 285 85 85 296 306 323
Social benefits
Other transfers to households 3 2 50 285 85 85 296 306 323
Payments for capital assets 2,150 1,438 118 41 64 64 44 45 47
Buildings and other fix ed structures - - - - - - - - -
Buildings
Other fix ed structures
Machinery and equipment 2,117 1,438 118 41 64 64 44 45 47
Transport equipment 2,075
Other machinery and equipment 42 1,438 118 41 64 64 44 45 47
Heritage assets 33 -
Softw are and other intangible assets
Land and subsoil assets
Py aments for Capital Assets
Total economic classification 11,082 11,454 8,512 8,752 9,751 9,451 9,426 9,980 10,599
2013/14

DEPARTMENT OF COOPERATIVE GOVERNANCE AND TRADITIONAL AFFAIRS
42
part clinks to o
ther plans

DEPARTMENT OF COOPERATIVE GOVERNANCE AND TRADITIONAL AFFAIRS DEPARTMENT OF COOPERATIVE GOVERNANCE AND TRADITIONAL AFFAIRS
43
PART CLINKS TO OTHER PLANS
1. Links to the long-term infrastructure and other capital plans
None
2. Conditional grants
None
3. Public entities
None
4. Public-private partnerships
None
part clinks to o
ther plans

DEPARTMENT OF COOPERATIVE GOVERNANCE AND TRADITIONAL AFFAIRS
44
part dtechnical perForMance
indicator descriptions
(AVA
ILABL
E ON TH
E DEP
ARTMEN
T’S W
EBSIT
E)
ww
w. F s c o g t a . g o v . z a

DEPARTMENT OF COOPERATIVE GOVERNANCE AND TRADITIONAL AFFAIRS DEPARTMENT OF COOPERATIVE GOVERNANCE AND TRADITIONAL AFFAIRS
45
part dtechnical perForMance
indicator descriptions

DEPARTMENT OF COOPERATIVE GOVERNANCE AND TRADITIONAL AFFAIRS
46

DEPARTMENT OF COOPERATIVE GOVERNANCE AND TRADITIONAL AFFAIRS DEPARTMENT OF COOPERATIVE GOVERNANCE AND TRADITIONAL AFFAIRS
47

DEPARTMENT OF COOPERATIVE GOVERNANCE AND TRADITIONAL AFFAIRS
48