department of chemical engineering massachusetts …icr.coh.org/docs/pdf powerpoint conversions/ckc...
TRANSCRIPT

Islet Quality Assessment
Clark K. Colton
Department of Chemical EngineeringMassachusetts Institute of Technology Cambridge, MA
Introductory overviewQuantity and composition of islet preparationsQuantitative membrane integrity measurementsOxygen consumption rate measurements
Stirred chambermethods and characteristicsprediction of transplantation outcome
Oxygen biosensor system

Islets Are Damaged During Isolation from Human Pancreas
Distension with Collagenase/Protease solution
Density Gradient Centrifugation
Ischaemic Conditions
Exocrine Tissue
Islet Preparation
Shaker
Enzymatic Digestion and Mechanical Disruption
1-2% original pancreas volume150 µm

What Do We Want To Know?For a given islet preparation: What is the “potency” or “dose?”
Can we predict transplantation outcome?
Goals for Islet Quality Assessment
QuantityHow much tissue is there?
• Volume • Number of cells
What is the tissue composition? • Islet – βcells, other• Exocrine– acinar, duct
FunctionWhat is the insulin secretory
capacity?
ViabilityFor (1) total tissue and (2) islets
• How much is viable?• What fraction is viable?
What does viability mean, anyway?• Dead• Live• Live now, dead later because
of irreversible commitment to the cell death process

4. Many techniques for cells are inapplicable to islets because the islets cannot be usefully dissociated into cells.
Why Are Islet Preparations So Difficult To Characterize?
1. Islets are cellular aggregates.Variety of shapes and sizesVisual size estimation is • prone to error• operator dependent• large uncertainty
2. Human preparations havevarying amounts of impurities.Distinguishing properties of islets/exocrine tissue difficult
3. The islet is a moving target.Damage occurs during • isolation• culture • shipment
Islet Dispersed Cells
agitationSerine proteases
(trypsin)
• Cells are damaged: anoikis • Cells are lost• Recovered cells are likely not representative of original islet

What Tools Are Available?• Safety
• Identity
• Quantity of tissueVolumeNumber of CellsComposition
• ViabilityMembrane IntegrityMitochondrial FunctionApoptosis
• PotencyGlucose Stimulated Insulin ReleaseImmunodeficient Mouse Transplant
• Other Gene Expression Profiling

Quantity of Tissue
Volume
Number of Cells
Cell Composition
Islet Preparation
Islet Preparation
Islet Preparation
Dispersed Cells
Tissue volume
Islet volume
Total DNATotal intact cell nuclei
Volume fraction islets
Individual cell types
Individual cell types
● Packed cell volume of tissue pellet● Ultrasound scattering● Insulin content● Dithizone (DTZ) staining
Visual countingImage analysis
● DNA content● Nuclei counting
● DTZ staining● Morphology (light microscopy)● Ultrastructural analysis(electron microscopy)● Differential staining(laser scanning cytometry)
Enumeration of islet equivalents (IEQ)
Type of QuantityTissue
AssayedParameter Measured Method

Viability of Tissue
Cell MembraneIntegrity
MitochondrialFunction
Apoptotic Events
Islet Preparation
Islet Preparation
Dispersed Cells
Islet Preparation
Disrupted Cells
Fixed Tissue or Cells
Live/Dead (Membrane Permeable)Fluorescein Diacetate (FDA)/Propidium Iodide (PI)SYTO 13/Ethidium Bromide (EB)
All/Dead LDS 751/Sytox Orange
Dead Trypan BlueQuantitative assay via Nuclei Counting- 7- AAD
Redox state of the cell-Tetrazolium salts MTT, MTSOxidative phosphorylation-Oxygen consumption rateEnergetic State-[ATP], [ATP]/[ADP], ATP production rate
Mitochondrion membrane potential (MMP)-Fluorescent dyes JC-1, TMRE (Flow Cytometry)
Magic angle spinning 1H-NMR spectroscopy
Early: Signaling pathway – Caspase activation Late: Nucleosome DNA fragmentation
Phosphatidyl serine translocation – Annexin VDNA fragmentation – TUNEL
Type of AssayTissue
Assayed Method

Viability of Tissue
Cell MembraneIntegrity
MitochondrialFunction
Apoptotic Events
Islet Preparation
Islet Preparation
Dispersed Cells
Islet Preparation
Dispersed Cells
Fixed Tissue or Cells
Live/Dead (Membrane Permeable)Fluorescein Diacetate (FDA)/Propidium Iodide (PI)SYTO 13/Ethidium Bromide (EB)
All/Dead LDS 751/Sytox Orange
Dead Trypan BlueQuantitative assay via Nuclei Counting- 7-aminoactinomycin D
Redox state of the cell-Tetrazolium salts MTT, MTSOxidative phosphorylation-Oxygen consumption rate (OCR)Energetic State-[ATP], [ATP]/[ADP], ATP production rate
Mitochondrion membrane potential (MMP)-Fluorescent dyes JC-1, TMRE
Magic angle spinning 1H-NMR spectroscopy
Early: Signaling pathway – Caspase activation Late: Nucleosome DNA fragmentation
Phosphatidyl serine translocation – Annexin V
Type of AssayTissue
Assayed Method
Do These Assays Give Equivalent Results?

Frac
tion
Apo
ptot
icC
ells
( )
Time of Stress Exposure (hr)
Relative Fraction of C
ells w
ith Intact Mem
branes ( )
Rel
ativ
e Fr
actio
n of
Via
ble
Cel
ls (
)
Jurkat CellsSuspension Culture1 µM Camptothecin
INS-1 CellsSurface-attached culture
5 mM Streptozotocin Mitochondrial Function
OCR, ATP, MTT, MTSApoptosis Events
Annexin V, Multi-caspase activationMembrane integrity
Trypan blue, FDA/PI, 7-AAD, LDS 751/Sytox Orange
Time Dependence of Cell Death and Cell Viability Assays
Assays performed:
Apoptosis Events
MembraneIntegrity
Rat, Human IsletsAnoxia, 37 oC
Mitochondrial function
Membrane Integrity measurements (7-AAD) lag other measures of cell viability

∆pO2 across tissueliquid flow rate
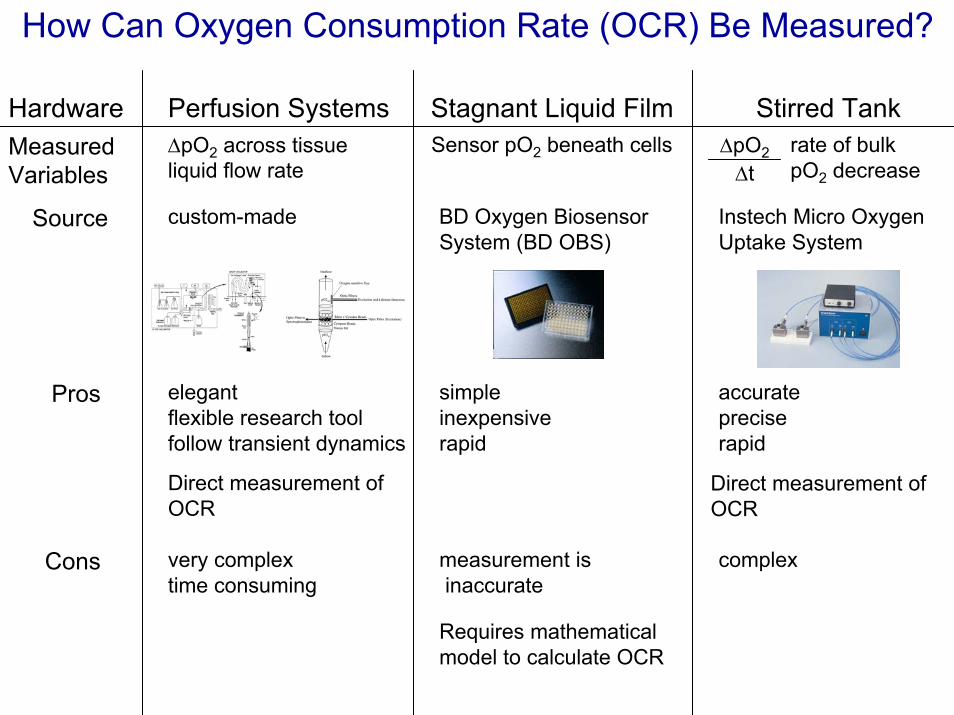
How Can Oxygen Consumption Rate (OCR) Be Measured?
Perfusion Systems Stirred TankStagnant Liquid FilmHardwareMeasuredVariables
Sensor pO2 beneath cells rate of bulkpO2 decrease
∆pO2∆t
Source custom-made BD Oxygen Biosensor System (BD OBS)
Instech Micro Oxygen Uptake System
Pros elegantflexible research toolfollow transient dynamics
simpleinexpensiverapid
accuratepreciserapid
Cons very complextime consuming
measurement is inaccurate
complex
Direct measurement of OCR
Direct measurement of OCR
Requires mathematical model to calculate OCR

How Can Oxygen Consumption Rate (OCR) be Measured?
Perfusion Systems Stirred TankStagnant Liquid FilmHardware
MeasuredVariables
∆pO2 across tissueliquid flow rate
pO2 beneath cells rate of bulkpO2 decrease
∆pO2∆t
Source custom-made BD oxygen biosensor system
Instech micro oxygen uptake system
Pros elegantflexiblefollow transient dynamics
simpleinexpensiverapidlittle training required
accuratepreciserapid
Cons very complexresearch toolnot for routine use
precision is pooraccuracy is questionablelimited experience
moderately expensiveDionne, K.E., et al. A microperifusion system with environmental control for studying insulin secretion by pancreatic tissue, Biotechnol. Prog., 7, 1991, 359-368
∆pO2 across tissueliquid flow rate
How Can Oxygen Consumption Rate (OCR) Be Measured?
Perfusion Systems Stirred TankStagnant Liquid FilmHardwareMeasuredVariables
Sensor pO2 beneath cells rate of bulkpO2 decrease
∆pO2∆t
Source custom-made BD Oxygen Biosensor System (BD OBS)
Instech Micro Oxygen Uptake System
Pros elegantflexible research toolfollow transient dynamics
simpleinexpensiverapid
accuratepreciserapid
Cons very complextime consuming
measurement is inaccurate
complex
Direct measurement of OCR
Direct measurement of OCR
Requires mathematical model to calculate OCR

How Can Oxygen Consumption Rate (OCR) be Measured?
Perfusion Systems Stirred TankStagnant Liquid FilmHardware
MeasuredVariables
∆pO2 across tissueliquid flow rate
pO2 beneath cells rate of bulkpO2 decrease
∆pO2∆t
Source custom-made BD oxygen biosensor system
Instech micro oxygen uptake system
Pros elegantflexiblefollow transient dynamics
simpleinexpensiverapidlittle training required
accuratepreciserapid
Cons very complexresearch toolnot for routine use
precision is pooraccuracy is questionablelimited experience
moderately expensive
Sweet I.R., et al. Regulation of ATP/ADP in Pancreatic Islets, Diabetes, 53, 2004, 401-409

∆pO2 across tissueliquid flow rate
How Can Oxygen Consumption Rate (OCR) Be Measured?
Perfusion Systems Stirred TankStagnant Liquid FilmHardwareMeasuredVariables
Sensor pO2 beneath cells rate of bulkpO2 decrease
∆pO2∆t
Source custom-made BD Oxygen Biosensor System (BD OBS)
Instech Micro Oxygen Uptake System
Pros elegantflexible research toolfollow transient dynamics
simpleinexpensiverapid
accuratepreciserapid
Cons very complextime consuming
measurement is inaccurate
complex
Direct measurement of OCR
Direct measurement of OCR
Requires mathematical model to calculate OCR

How Can Oxygen Consumption Rate (OCR) be Measured?
Perfusion Systems Stirred TankStagnant Liquid FilmHardware
MeasuredVariables
∆pO2 across tissueliquid flow rate
pO2 beneath cells rate of bulkpO2 decrease
∆pO2∆t
Source custom-made BD oxygen biosensor system
Instech micro oxygen uptake system
Pros elegantflexiblefollow transient dynamics
simpleinexpensiverapidlittle training required
accuratepreciserapid
Cons very complexresearch toolnot for routine use
precision is pooraccuracy is questionablelimited experience
moderately expensive
Microplate with oxygen sensitive fluorophor immobilized at the bottom.
Cells or islets are placed within the microplate, settle to the bottom, and consume oxygen
Oxygen partial pressure in the sensor decreases and can be used to estimate the OCR
Guarino, R.D., et al. Method for determining oxygen consumption rates of static cultures from microplate measurements of pericellular dissolved oxygen concentration, Biotechnol. Bioeng., 86(7), 2004, 775-787

∆pO2 across tissueliquid flow rate
How Can Oxygen Consumption Rate (OCR) Be Measured?
Perfusion Systems Stirred TankStagnant Liquid FilmHardwareMeasuredVariables
Sensor pO2 beneath cells rate of bulkpO2 decrease
∆pO2∆t
Source custom-made BD Oxygen Biosensor System (BD OBS)
Instech Micro Oxygen Uptake System
Pros elegantflexible research toolfollow transient dynamics
simpleinexpensiverapid
accuratepreciserapid
Cons very complextime consuming
measurement is inaccurate
complex
Direct measurement of OCR
Direct measurement of OCR
Requires mathematical model to calculate OCR

How Can Oxygen Consumption Rate (OCR) be Measured?
Perfusion Systems Stirred TankStagnant Liquid FilmHardware
MeasuredVariables
∆pO2 across tissueliquid flow rate
pO2 beneath cells rate of bulkpO2 decrease
∆pO2∆t
Source custom-made BD oxygen biosensor system
Instech micro oxygen uptake system
Pros elegantflexiblefollow transient dynamics
simpleinexpensiverapidlittle training required
accuratepreciserapid
Cons very complexresearch toolnot for routine use
precision is pooraccuracy is questionablelimited experience
moderately expensive
Commercially Available from Instech Labs http://www.instechlabs.com/Oxygen/

Summary: Where Are We?Volume Number of Cells Cell CompositionPacked Cell Volume DNA Dithizone StainingInsulin Content Nuclei Counting Morphology (Light Microscopy)Dithizone staining Ultrastructural Analysis (Electron Microscopy)
IEQ enumeration Differential Staining (Laser Scanning Cytometry)Ultrasound Scattering
Quantity
Apoptotic EventsIntact Islets
Magic angle spinning 1H-NMR spectroscopyDisrupted Islets
Early: Signaling pathway – Caspase activation
Late: Nucleosome DNA fragmentation Fixed Tissue or Cells
Phosphatidyl serine translocation – Annexin VDNA fragmentation – TUNEL
Cell Membrane Integrity (Intact Islets)Live/Dead (Membrane Permeable)
Fluorescein Diacetate (FDA)/Propidium Iodide (PI)SYTO 13/Ethidium Bromide (EB)
All/Dead - LDS 751/Sytox OrangeDead - Trypan BlueQuantitative assay via Nuclei Counting
7- aminoactinomycin D (7AAD)
ViabilityMitochondrial FunctionIntact Islets: Redox state of the cell – Tetrazolium salts MTT, MTS
Oxidative phosphorylation – oxygen consumption rate (OCR)Energetic State – [ATP], [ATP]/[ADP], ATP production rate
Single Cells: Mitochondrial membrane potential (MMP) – Fluorescent dyes JC-1, TMRE

Summary: Where Are We?Volume Number of Cells Cell CompositionPacked Cell Volume DNA Dithizone StainingInsulin Content Nuclei Counting Morphology (Light Microscopy)Dithizone staining Ultrastructural Analysis (Electron Microscopy)
IEQ enumeration Differential Staining (Laser Scanning Cytometry)Ultrasound Scattering
Quantity
Apoptotic EventsIntact Islets
Magic angle spinning 1H-NMR spectroscopyDisrupted Islets
Early: Signaling pathway – Caspaseactivation
Late: Nucleosome DNA fragmentation Fixed Tissue or Cells
Phosphatidyl serine translocation – Annexin VDNA fragmentation – TUNEL
Cell Membrane Integrity (Intact Islets)Live/Dead (Membrane Permeable)
Fluorescein Diacetate (FDA)/Propidium Iodide (PI)SYTO 13/Ethidium Bromide (EB)
All/Dead - LDS 751/Sytox OrangeDead - Trypan BlueQuatitative assay via Nuclei Counting
7- aminoactinomycin D (7AAD)
ViabilityMitochondrial FunctionIntact Islets: Redox state of the cell – Tetrazolium salts MTT, MTS
Oxidative phosphorylation – oxygen consumption rate (OCR)Energetic State – [ATP], [ATP]/[ADP], ATP production rate
Single Cells: Mitochondrial membrane potential (MMP) – Fluorescent dyes JC-1, TMRE

Quantity of Tissue
Volume
Number of Cells
Cell Composition
Islet Preparation
Islet Preparation
Islet Preparation
Dispersed Cells
Tissue volume
Islet volume
Total DNATotal intact cell nuclei
Volume fraction islets
Individual cell types
Individual cell types
● Packed cell volume of tissue pellet● Ultrasound scattering● Insulin content● Dithizone (DTZ) staining
Visual countingImage analysis
● DNA content● Nuclei counting
● DTZ staining● Morphology (light microscopy)● Ultrastructural analysis(electron microscopy)● Differential staining(laser scanning cytometry)
Enumeration of islet equivalents (IEQ)
Type of QuantityTissue
AssayedParameter Measured Method
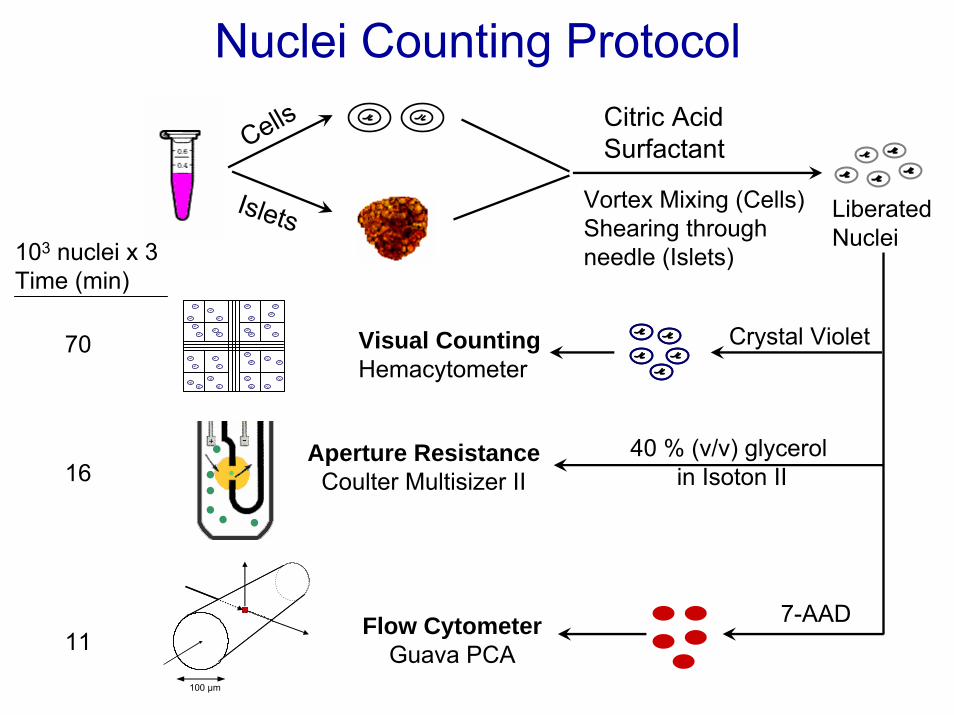
Nuclei Counting Protocol
Cells
Islets
Citric AcidSurfactant
Vortex Mixing (Cells)Shearing through needle (Islets)
Visual CountingHemacytometer
Crystal Violet
40 % (v/v) glycerol in Isoton II
Aperture ResistanceCoulter Multisizer II
7-AADFlow CytometerGuava PCA
100 µm
103 nuclei x 3Time (min)
70
16
11
Liberated Nuclei

Measured versus Calculated Nuclei Concentration
Line of Identity
Visual Counting gives slightly highestimate because some fragments are included along with nuclei
6 x 10⁵ nuclei/ml
7 x 10⁴ nuclei/ml

Precision of Measurements
• Visual counting and flow cytometry follow approximately Poisson statisticsFor cells, N=103, COV ≈ 3 %
• Precision with islets depends on number of islets sampled and pipette tip used For 125+ IEQ, COV ≤ 6 %
104

DNA Content* Per Cell Based on Nuclei Counting
Islet Sources: Rat and fresh human islets from Joslin Diabetes CenterShipped human islets from other centers
Freq
uenc
y
DNA Concentration (pg DNA/cell)
Mean ± SD 6.5 ± 1.9 6.9 ± 2.3 8.5 ± 2.3
n=37 n=22
Rat Human-Joslin Human-shipped
n=26
*DNA data obtained using CyQUANT dye. Different results obtained using PicoGreen.

Quantity of Tissue
Volume
Number of Cells
Cell Composition
Islet Preparation
Islet Preparation
Islet Preparation
Dispersed Cells
Tissue volume
Islet volume
Total DNATotal intact cell nuclei
Volume fraction islets
Individual cell types
Individual cell types
● Packed cell volume of tissue pellet● Ultrasound scattering● Insulin content● Dithizone (DTZ) staining
Visual countingImage analysis
● DNA content● Nuclei counting
● DTZ staining● Morphology (light microscopy)● Ultrastructural analysis(electron microscopy)● Differential staining(laser scanning cytometry)
Enumeration of islet equivalents (IEQ)
Type of QuantityTissue
AssayedParameter Measured Method

Cell Composition of Human Islet PreparationsFix, dehydrate, clear, embed, cure, trim
1 µm section
500-800 cellsanalyzed
Light Microscopy
10 min
Volume fraction islets, fL
Individual cell counting
2 hr
Number fraction islets, fE
500 µm
Acinar Duct IsletIsletNon-islet
Stereological point counting
Electron Microscopy
sections parallel to surface
NIslets=fL· NTotal
IEQ= NIslets2000
3 or 4 days
NTotal NIslets
Light EM DTZ fL+E
fL fE fDTZ fDTZ
1 0.60 ± 0.10 0.49 0.85 0.64 - - - -2 0.56 ± 0.01 0.62 0.90 0.66 - - - -3 0.66 ± 0 0.68 0.80 0.84 - - - -4 0.86 ± 0 - 0.95 0.91 10.8 9.3 47,000 100,0005 0.64 ± 0.01 - 0.80 0.80 6.4 4.1 21,000 55,000
Preparation
Fraction Islets (%) IEQ
106 cellsNuclei
CountingConventional
Method*
* Reported by the isolation center

Quantity of Tissue
Volume
Number of Cells
Cell Composition
Islet Preparation
Islet Preparation
Islet Preparation
Dispersed Cells
Tissue volume
Islet volume
Total DNATotal intact cell nuclei
Volume fraction islets
Individual cell types
Individual cell types
● Packed cell volume of tissue pellet● Ultrasound scattering● Insulin content● Dithizone (DTZ) staining
Visual countingImage analysis
● DNA content● Nuclei counting
● DTZ staining● Morphology (light microscopy)● Ultrastructural analysis(electron microscopy)● Differential staining(laser scanning cytometry)
Enumeration of islet equivalents (IEQ)
Type of QuantityTissue
AssayedParameter Measured Method

Water Outlet
Oscilloscope
Power Amplifier
Pulse Receiver
Waveform Generator
Stirring Motor
Suspension
Stirring Bar
Water Inlet
Transducer
Water Jacket Acrylic
Chamber
9.5 mm
Ultrasound Pulsed Doppler (USPD) Measurement of Particle Concentration
Computer
System Arrangement and Test Chamber
FocalVolume
13 mm

USPD Reflected Power versus Tissue Concentration

Viability of Tissue
Cell MembraneIntegrity
MitochondrialFunction
Apoptotic Events
Islet Preparation
Islet Preparation
Dispersed Cells
Islet Preparation
Dispersed Cells
Fixed Tissue or Cells
Live/Dead (Membrane Permeable)Fluorescein Diacetate (FDA)/Propidium Iodide (PI)SYTO 13/Ethidium Bromide (EB)
All/Dead LDS 751/Sytox Orange
Dead Trypan BlueQuantitative assay via Nuclei Counting- 7-aminoactinomycin D
Redox state of the cell-Tetrazolium salts MTT, MTSOxidative phosphorylation-Oxygen consumption rate (OCR)Energetic State-[ATP], [ATP]/[ADP], ATP production rate
Mitochondrion membrane potential (MMP)-Fluorescent dyes JC-1, TMRE
Magic angle spinning 1H-NMR spectroscopy
Early: Signaling pathway – Caspase activation Late: Nucleosome DNA fragmentation
Phosphatidyl serine translocation – Annexin V
Type of AssayTissue
Assayed Method

Quantitative Membrane Integrity Protocol
Nuclei of membrane –permeable cells are stained
Cells
Islet
7 Wash, disrupt tissue
Citric Acid and
Vortex mixing
Shearingthrough needle
Cells:
Islets:
7All nuclei are stained
=N2
N1
CountCount
N2=Total number of cells N1=Number of cellswith permeablemembranes
Cells
Islet
7-AAD
Citric Acid andSurfactant
7-AADFraction of cellspermeable to 7-AAD =
CountStainedNuclei
CountStained Nuclei

Procedure for Validating New Test
Mixture Composition (%)
Cellsor
Islets
Store on ice
60 oC, 45 min
Live Tissue
Heat-killed Tissue
100 75 50 25 0
0 25 50 75 100
Cells IsletsTrypan Blue
MTT
7-AADQuantitative Membrane
Integrity Protocol
Count stained cellsHemacytometer
Count stained nucleiFlow Cytometer
(Guava PCA)
Assay viability of cells and intact islets
Plate Reader
100 µm

Slope = 0.99 ± 0.03Slope = 0.99 ± 0.03
Comparison of 7-AAD Sequential Staining with MTT assay with Islets

Nuclei Counting: Conclusions
Nuclei counting provides rapid, accurate, and precise quantitative measurements that can be used advantageously
1. Nuclei counting can measure the number of cells in an islet preparation. Combination with microscopic observations (Light and/or EM) gives a reliable, quantitative estimate of the number of islet cells (IEQs) in impure islet preparations.
2. Sequential staining of nuclei with 7-AAD before and after cell disruption, followed by nuclei counting with a flow cytometer, provides an estimate of the fraction of cells that have compromised membrane integrity

Viability of Tissue
Cell MembraneIntegrity
MitochondrialFunction
Apoptotic Events
Islet Preparation
Islet Preparation
Dispersed Cells
Islet Preparation
Dispersed Cells
Fixed Tissue or Cells
Live/Dead (Membrane Permeable)Fluorescein Diacetate (FDA)/Propidium Iodide (PI)SYTO 13/Ethidium Bromide (EB)
All/Dead LDS 751/Sytox Orange
Dead Trypan BlueQuantitative assay via Nuclei Counting- 7-aminoactinomycin D
Redox state of the cell-Tetrazolium salts MTT, MTSOxidative phosphorylation-Oxygen consumption rate (OCR)
Energetic State-[ATP], [ATP]/[ADP], ATP production rate
Mitochondrion membrane potential (MMP)-Fluorescent dyes JC-1, TMRE
Magic angle spinning 1H-NMR spectroscopy
Early: Signaling pathway – Caspase activation Late: Nucleosome DNA fragmentation
Type of AssayTissue
Assayed Method

∆pO2 across tissueliquid flow rate
How Can Oxygen Consumption Rate (OCR) Be Measured?
Perfusion Systems Stirred TankStagnant Liquid FilmHardwareMeasuredVariables
Sensor pO2 beneath cells rate of bulkpO2 decrease
∆pO2∆t
Source custom-made BD Oxygen Biosensor System (BD OBS)
Instech Micro Oxygen Uptake System
Pros elegantflexible research toolfollow transient dynamics
simpleinexpensiverapid
accuratepreciserapid
Cons very complextime consuming
measurement is inaccurate
complex
Direct measurement of OCR
Direct measurement of OCR
Requires mathematical model to calculate OCR

Instech Stirred Chamber for OCR Measurements Schematic Diagram
Water jacketed titanium chamber with fluorescence-quenched O2 sensor
Medium initiallyequilibrated
with air
StirredChamber(200 µl)
O2Sensor
Isletsor Cells
Sealing cap
Stirring bar

y = 44.7x - 81
0
100
200
300
400
0 3 6 9 12
Characteristics of OCR Measuring Chamber
Chamber volume (µl):MIT cap 1 200 ± 3, 198 ± 2
cap 2 177 ± 3, 175 ± 2Joslin 205 ± 1, 210 ± 3
Temperature equilibration: Complete in 15 seconds
O2 leakage rate: 0-0.2 mmHg/min mmHg (cap dependent)
Recovery of tissue after OCR measurement: 1.003 ± 0.043
Sensor Calibration: 0 and 160 mmHg
Rot
atio
nal S
peed
(r
ev/m
in)
Setting
Stirrer rotational speed: 50 - 300 rpm (setpoint dependent)

Flow Visualization in Transparent Model
Chamber diameter is about 6 mmStirring bar length is about 3 mm
Islets suspension is stirred at the minimum speed to suspend the islets

Measurement of Oxygen Consumption Rate
OCR = Vch · α · slope
Actual data fit to straight lines Calculation of OCR
molmin mmHg·ml
mol mmHgmlmin
OCRcell
OCRnumber of cells
=
OCRcell
α · slopecell concentration
=
or
Same for OCR
DNA
OCR
nucleusand
Time from Islet Addition (min)
∆pO2
∆ timeSlope =
60
80
100
120
140
160
0 10 20 30 40 50 60
140 IEQ3806501890 260
Islets added
Time from Islet Addition (min)
∆pO2
∆ timeSlope =
60
80
100
120
140
160
0 10 20 30 40 50 60
140 IEQ3806501890 260
Islets added
pO2
(mm
Hg)
Time from Islet Addition (min)
∆pO2
∆ timeSlope =
60
80
100
120
140
160
0 10 20 30 40 50 60
140 IEQ3806501890 260
Islets added
Time from Islet Addition (min)
∆pO2
∆ timeSlope =
60
80
100
120
140
160
0 10 20 30 40 50 60
140 IEQ3806501890 260
Islets added
pO2
(mm
Hg)
Slope =

OCR Chamber Troubleshooting
Bubble FormationChipped or defective sealing capIncomplete fillingLow temperature of suspension
Inadequate Passivation
Inadequate Stirring
Decrease in sensor sensitivity
Problems
Use undamaged caps (no chipping)Use excess tissue suspensionLet tissue suspension warm in chamber before sealingPassivate
Check stirring bar is rotating occasionally
Recoat sensor every 6 months
Suggestions

Reproducibility: Typical Triplicate Measurementswith Fresh Samples
0 20 40 60 80 100Time (min)
6 x 10⁶ INS-1 cells/ml
1 13.87 ± 0.082 14.10 ± 0.093 13.51 ± 0.05
Slope (mmHg/min)
1 2 3
1 4.84 ± 0.022 5.29 ± 0.013 4.93 ± 0.03
1.6 x 10⁶ Rat Islet nuclei/ml
1 2 3
0
50
100
150
200
0 20 40 60 80 100
pO2 (
mm
Hg)
04/25/05
Time (min)
OCRnucleus
= 2.94 ± 0.24 fmolmin nucleus
OCRnucleus
= 3.82 ± 0.45 fmolmin nucleus
Slope (mmHg/min)

Precision of Measurements
0
5
10
15
20
25
30
0
5
10
15
20
25
30
0 2 4 6 8 100 2 4 6 8 10
RatHuman
Viable Islet Equivalents
SingleSlope
TriplicateMeasurement
Coe
ffici
ent o
f Var
iatio
n (%
)
Oxygen Consumption Rate (nmol/min)
Porcine
0 500 1000 1500 2000

Stirring Speed Effects on Islet Membrane Integrity
Frac
tion
of c
ells
with
impe
rmea
ble
cell
mem
bran
es b
y 7-
AA
D (%
)
Stirring Speed Setting
Effect of Time Stirring Speed Effect of Islets tested 4 hr after isolation, stirred 15 min
Rat Islets, 2 days culture 37oC

Curvature is Indicator of Dying Islets
100
120
140
160
180
200
0 25 50 75 100 125
Time (min)
pO2 (
mm
Hg)
0 10 20 30Adjusted Time (min)
3
96
Measurements made 4 hr after isolation of rat islets
Stirrer Setting Initial Final
0 60.09 3.24 2.34 38.33 2.82 1.72 30.16 1.84 1.16 32.4
Slope (mmHg/min) Fraction of cells with impermeable membranes
by 7-AAD (%)

Curvature is Present Immediately After Isolation in Otherwise Viable Islets
0
30
60
90
120
150
180
0
30
60
90
120
150
180
0 5 10 15 0 20 40 60 80 100
10/30/03
04/25/05
Adjusted Time (min) Time (min)
Oxy
gen
Part
ial P
ress
ure,
pO
2(m
mH
g)
Immediately After Isolation 4 hr Later

1. Oxidative PhosphorylationGlucose +36ADP+ 36Pi+36 H++ 6O2 6CO2+ 42H2O+36ATP
Interpretation of Oxygen Consumption Rate Parameters
ATP Production Rate = 6 x Oxygen Consumption Rate
2. Assume the average OCR per viable cell under standard conditions, 37oC, DMEM, no serum is the same for all islet batches
OCR Number of viable cells Amount of good tissueVolume of viable tissue
DNA Number of cells Total amount of tissueTotal tissue volume
Parameter Proportional To Measure of
OCRDNA
Viable tissue volumeTotal tissue volume
Quality of the tissueOCR/DNA
(OCR/DNA)v= Fractional Viability

380 ± 100
480 ± 130Mean ± SD = 3.6 ± 1.6
OCR/cell in Rat Islets
OCR/DNA of viable cell
OCR/DNA(nmol/min· mg DNA)
OCR/viable cell
2.7 ± 1.2
OCR/nucleus (fmol/min·nucleus)
Freq
uenc
y
n=43 n=40
n=42 n=40

OCR/cell in Human Islets
Freq
uenc
y
Other centers(shipped)
Other centers(shipped)
JoslinJoslin
OCR/DNA(nmol/min· mg DNA)
OCR/nucleus (fmol/min·nucleus)
n=22
Mean ± SD = 2.3 ± 1.3
n=22
n=29 n=28
280 ± 150
300 ± 1502.4 ± 1.1

0
20
40
60
80
100
Num
ber o
f Iso
latio
ns
0
2
4
6
8
10
0 100 200 300 400 500 0 100 200 300 400 500 0 100 200 300 400 500
Fractional Viability by Live/dead Staining (%)
Frac
tiona
l Via
bilit
y by
OC
R/D
NA
(%)
0 20 40 60 80 100
Rat Porcine Human
0 20 40 60 80 100 0 20 40 60 80 100
Distribution of OCR/DNA and Comparison with FDA/PI
OCR/DNA (nmol/min mgDNA)
n=41 n=14 n=22
n=14 n=16 n=17

Typical Responses to Rat and Porcine Islet Transplants in Diabetic Balb/C Mice (Anti-CD4)
050
100150200250300350400
-1 4 9 14 19Time After Transplantation (days)
Blo
od G
luco
seC
once
ntra
tion
(mg/
dl)
0
C
BA
A Blood glucose ≤ 100 mg/dl for ≥ 7 days-Rapid normalization (1 - 2 days)B Blood glucose 100 - 200 mg/dl-Some with delayed normalizationC Blood glucose > 200 mg/dl (usually > 300 mg/dl)

Normalized Oxygen Consumption Rate, OCR/DNA (nmol/min•mgDNA)
Oxy
gen
Con
sum
ptio
n R
ate,
OC
R (n
mol
/min
)
Fractional Viability (%)
Viable Islet E
quivalents, VIE
QResponse to Rat Islet Transplants in Diabetic Balb/C Mice (Anti-CD4)
2 / 0 / 0 1 / 0 / 0
2 / 0 / 0
2 / 0 / 0
6/ 0 / 0
4/ 0 / 0
3 / 0 / 0
3 / 0 / 0
1 / 0 / 10 / 1 / 2
1 / 0 / 1
2 / 0 / 0
1 / 0 / 0
0 / 1 / 0
1 / 0 / 0
3 / 0 / 0
2 / 0 / 0
3 / 0 / 0
all cure
mixed
all fail
Group
3 / 0 /0
2 / 0 / 0
1 / 0 / 2
1 / 0 / 0
0
4
5
6
0 50 100 150 200 250 300 350 400 450
100800
700
600
500
400
300
200
100
0
0 50402010 6030 8070 90
0 / 1 / 1
0 / 0 / 4
0 / 0 / 6
0 / 0 / 3
0 / 0 / 2
1
2
3
0 / 0 / 30 / 0 / 2
Data presentation : A / B / C

Rat islets transplanted into kidney capsule of immunosuppressed diabetic BalbC mice
OCR Measurements Can Predict Transplantation Outcome
Normalized Oxygen Consumption Rate, OCR/DNA (nmol/min•mgDNA)
Oxy
gen
Con
sum
ptio
n R
ate,
OC
R (n
mol
/min
)
Fractional Viability (%)
Viable Islet E
quivalents, VIE
Q
0
4
5
6
0 50 100 150 200 250 300 350 400 450
100800
700
600
500
400
300
200
100
0
0 50402010 6030 8070 90
1
2
3
No data
All Cure
None Cure
SomeCure
All Cure
No Data
Normalized Oxygen Consumption Rate, OCR/DNA (nmol/min•mgDNA)
Oxy
gen
Con
sum
ptio
n R
ate,
OC
R (n
mol
/min
)
Fractional Viability (%)
Viable Islet E
quivalents, VIE
Q
0
4
5
6
0 50 100 150 200 250 300 350 400 4500 50 100 150 200 250 300 350 400 450
100800
700
600
500
400
300
200
100
0
800
700
600
500
400
300
200
100
0
0 50402010 6030 8070 90
1
2
3
No data
All Cure
None Cure
SomeCure
All Cure
No Data

None Cure
All Cure
Some Cure
Response to Human Islet Transplants in Diabetic Immunodeficient MiceHuman islets were taken from the highest purity fraction (>90% by DTZ)

Stimulation of OCR by Exogenous Substrates
Stimulated OCRBasal OCR
Tissue Species n Glucose 20 mMIslets Rat 9 1.58 ± 0.14
Human 6 1.48 ± 0.13Porcine 3 1.49 ± 0.30
Exocrine Rat 1 1.0Human 3 0.90 ± 0.10Porcine 2 1.0
Stimulated OCR: PBS 37oC after the addition of glucoseBasal OCR: PBS 37oC, no glucose
Similar measurements in DMEM, no serum
Islets Rat 5 1.16*
* Entire increase occurred between 0 and 3 mM glucose

Basal conditions: PBS, 37oC, no exogenous substrates
1
1.2
1.4
1.6
1.8
0 20 40 60 80 100
RATPORCINEHUMAN
20mM Glucose
Fractional Islet Purity (%)
Stim
ulat
ed O
CR
Bas
al O
CR
Stimulation Ratio in Prepared Islet and Exocrine Mixtures

Conclusions
OCR Measurements with Instech Stirred Chamber
1. The Instech stirred tank system provides rapid, accurate, and precise measurement of the OCR of islet preparations.
2. It has been used reliably in our laboratory by about 10 technical staff for over 500 measurements with about 100 islet preparations.
3. OCR measurements obtained with the Instech system are predictive of transplantation outcome in immuno-deficient diabetic mice transplanted with rat islets and high purity (>90% DTZ) human islet preparations.

Schematic Representation of BD OBS Well Containing Islets
From: Wang W, Upshaw L, Strong DM, Robertson RP, and Reems J., “Increased oxygen consumption rates in response to high glucose detected by a novel oxygen biosensor system in non-human primate and human islets,” J. Endocrinology, 185, 445-455 (2005).

Development of Oxygen Profiles in BD OBS250,000 Jurkat cells in 100 µl of culture medium within an idealized OBS well
(OCR/cell = 0.84 fmol/min cell)
Calculation of OCR at steady state
OCRD · α · A
L= · (∆pO2)
D = Diffusivity of oxygen in waterα = Bunsen solubility coefficient of
oxygen in waterA = Area of wellL = Height of liquid∆pO2 = pO2 (ambient) - pO2(surface, x=0)60
80
100
120
140
160
0.0 1.0 2.0 3.0Distance from Well Bottom, x (mm)
pO2
(mm
Hg) .

0
20
40
60
80
100
120
140
160
0 2 4 6 8 10
Time1/2 (min1/2)
Sen
sor p
O2
(mm
Hg)
Theoretical Prediction of Sensor Oxygen Partial Pressure in Idealized Well
Full theory Theory for short time
Jurkat cells in 100 µl of culture medium (OCR/cell = 0.84 fmol/min cell)
0
20
40
60
80
100
120
140
160
0 20 40 60 80 100
Time (min)
Sen
sor p
O2
(mm
Hg) . 100,000 cells
250,000 cells
500,000 cells

0
20
40
60
80
100
120
140
0 2 4 6 8 10 12 14Time (hr)
Sens
or p
O2
(mm
Hg)
100 Islets50 Islets
OCR Measurement with Human Islets in BD OBS
0
1
2
3
4
0 2 4 6 8 10 12 14Time (hr)
Cal
cula
ted
OC
R/n
ucle
us
(fnm
ol/m
in n
ucle
us)
100 Islets50 Islets
Time (hr)Time (hr)
Islets10050

Comparison of Initial OCR Values Obtained with the Stirred Tank and BD OBS*
Cell type
OCR (fmol/min cell)
Stirred tank OBS
Jurkat (human lymphocyte)
INS-1 (rat insulinoma)
Human islets
0.84 0.38
5.33.0
3.0 1.3
50 per test
100 per test
Ratio
2.2
2.3
1.91.82.9
*Approximately followed procedure of Guarino et al., 2004

Why are the Results Different?
Stirred vessel directly measures of oxygen consumption
OBS plate directly measures average pO2 at a surface
• Determination of oxygen consumption rate requires use of the integrated form of Fick’s law of diffusion applicable at steady state
• Application of Fick’s law invokes many assumptions
• Results are only as good as the assumptions that are made

Perfectly still medium
Medium mixed by plate movement
Assumptions Required for OCR Determination with OBS Plate at Steady State
Idealized Well (assumed) Actual Well
Perfect cylinder Round bottomed well
Uniform cell distribution
Cells collect in middle of well
Impermeable wallsOxygen permeable walls
Full area read by plate reader
Inner 65% of area read by plate reader
Thin uniform sensor material
Varying thickness of silicone rubber and sensor

0
20
40
60
80
100
120
140
160
0 2 4 6 8 10
Time1/2 (min1/2)
Sen
sor p
O2
(mm
Hg)
Theoretical Prediction of Sensor Oxygen Partial Pressure in Actual Well
Real Well Idealized Well
0
20
40
60
80
100
120
140
160
0 20 40 60 80 100
Time (min)
Sen
sor p
O2
(mm
Hg) .
100,000 cells
250,000 cells
500,000 cells
Jurkat cells in 100 µl of culture medium (OCR/cell = 0.84 fmol/min cell)

0
20
40
60
80
100
120
140
160
0 20 40 60 80 100
Time (min)
Sen
sor p
O2
(mm
Hg) .
Theoretical Prediction of Sensor Oxygen Partial Pressure in Actual Well
Rounded Well Flat Well
100,000 cells
250,000 cells
500,000 cells
0
20
40
60
80
100
120
140
160
0 2 4 6 8 10
Time1/2 (min1/2)
Sen
sor p
O2
(mm
Hg)
Jurkat cells in 100 µl of culture medium (OCR/cell = 0.84 fmol/min cell)

Computer Simulation of Ideal and Real Wells100,000 Jurkat cells (doubling time = 1 day) in oxygenated medium placed in
each well at time = 0pO2 (mm Hg)
160 (ambient)
120
Time in hours

Transient Response in OBS Well
Time (min)
Sen
sor p
O2
(mm
Hg)
Assuming ideal system
assuming real system
Theory
110
120
130
140
150
160
0 60 120 180 240 300
100,000 Jurkat cells in 100 µl of culture medium

Transient Response in OBS Well
Time (min)
Sen
sor p
O2
(mm
Hg)
Assuming ideal system
Assuming real system
Theory
Experiments
110
120
130
140
150
160
0 60 120 180 240 300
100,000 Jurkat cells in 100 µl of culture medium
Every well is read -plate moves (2 independent experiments)

110
120
130
140
150
160
0 60 120 180 240 300
Transient Response in OBS Well
Time (min)
Sen
sor p
O2
(mm
Hg)
Assuming ideal system
Assuming real system
Theory
Experiments
100,000 Jurkat cells in 100 µl of culture medium
Every well is read -plate moves (2 independent experiments)
Single well reading - plate remains stationary (2 independent experiments)

0
0.25
0.5
0.75
1
0 60 120 180 240 300
Computed OCR/cell from pO2 Values (using Fick’s Law)
Time (min)
OC
R/c
ell (
fmol
/min
cel
l)
Assuming ideal system
Assuming real system
Theory
Experiments
OCR/cell in stirred chamber
100,000 Jurkat cells in 100 µl of culture medium
Single well reading - plate remains stationary (2 independent experiments)
Every well is read -plate moves (2 independent experiments)

Transient Sensor pO2 ResponseStep change from 0 to 160 mm Hg, no cells present
Water 0.5% Agarose Gel
Immobilization of water with 0.5% agarose dramatically reduces the rate of O2 transport
Volume (µl)
50100150200250300
0
20
40
60
80
100
120
140
160
0 100 200 300Time (min)
Sen
sor p
O 2 (m
m H
g) .
0
20
40
60
80
100
120
140
160
0 100 200 300Time (min)

Comparison of OCR Calculated Various ways using the BD OBS
OCR (fmol/min cell)
Stirred TankBD OBS
Steady State T1/2 fit T fit
2.8 1.4 0.71 0.36
130
135
140
145
150
155
160
0 5 10 15 20
Time1/2 (min1/2)
g
Single well transient, 17.8 HIEQ in well
linearsquare root
5 flashes/measurement
200 flashes/measurement
130
135
140
145
150
155
160
0 100 200 300 400
Time (min)
Sen
sor p
O2
(mm
Hg) .

0
1
2
3
4
5
6
7
8
0.00 0.05 0.10 0.15 0.20 0.25 0.30 0.35 0.40
Total OCR (nmol/min)
Rat
io o
f Ins
tech
to O
BS
cel
l spe
cific
OC
R
0 20 40 60 80 100 120 140 160
pO2 Drop from Liquid to Sensor Surface (mm Hg)
Porcine 6-23
Porcine 6-9
Human 3-16
Human 6-18
Comparison of OCR/cell measured with Stirred Tank and BD OBS at Different Total OCR values
OCR estimated from steady-state pO2 reading for all runs shown
Islet Preparation
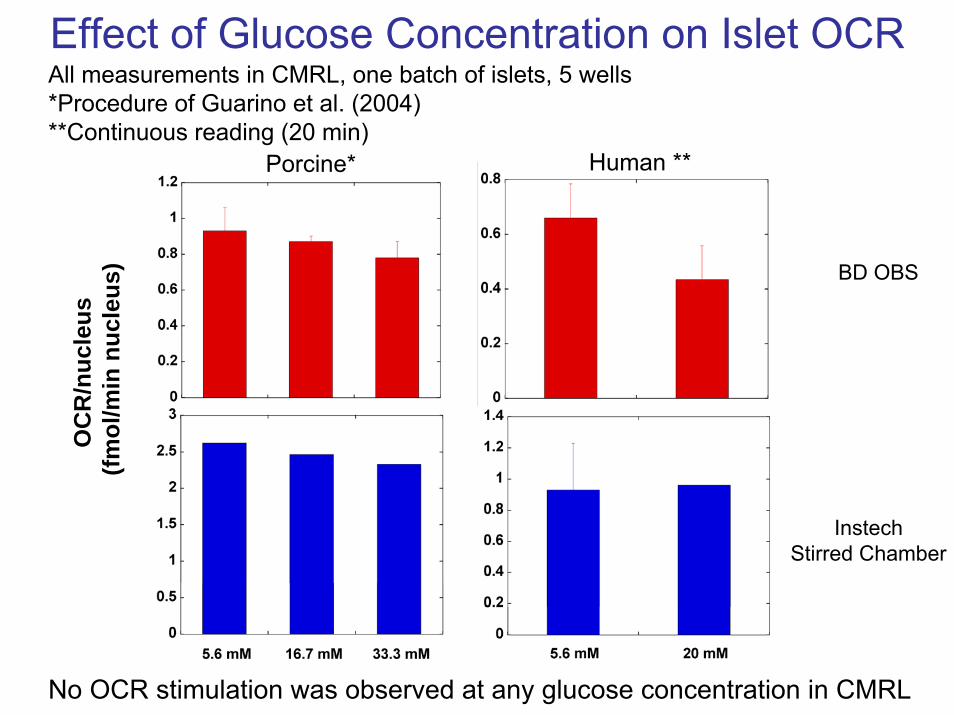
Effect of Glucose Concentration on Islet OCR
Human **
All measurements in CMRL, one batch of islets, 5 wells*Procedure of Guarino et al. (2004)**Continuous reading (20 min)
No OCR stimulation was observed at any glucose concentration in CMRL
Porcine*
OC
R/n
ucle
us
(fmol
/min
nuc
leus
) BD OBS
InstechStirred Chamber
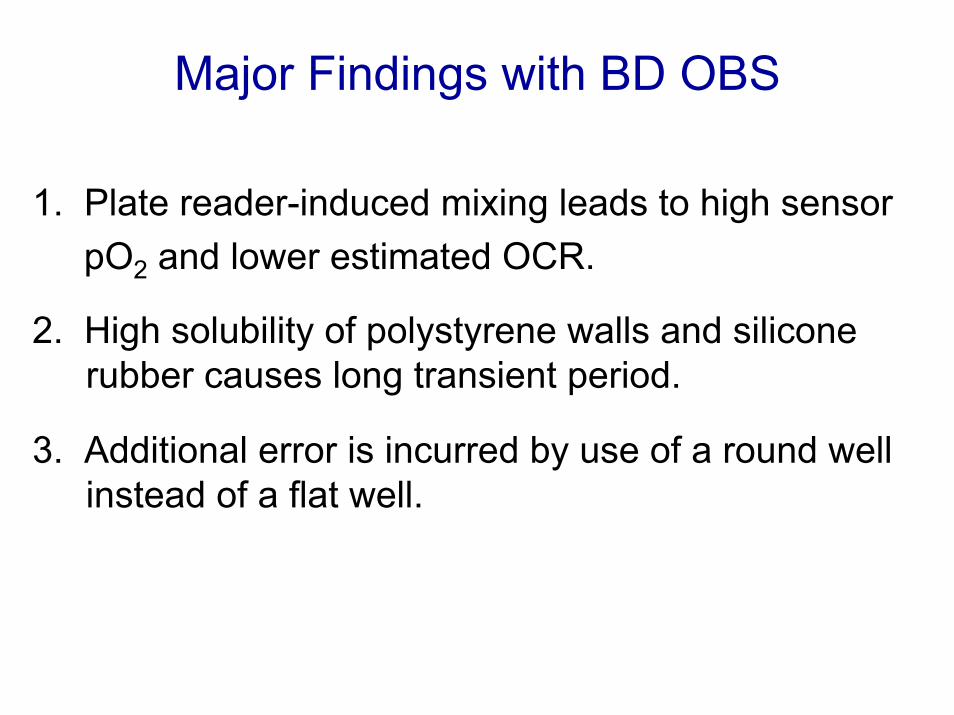
Major Findings with BD OBS
1. Plate reader-induced mixing leads to high sensor pO2 and lower estimated OCR.
2. High solubility of polystyrene walls and silicone rubber causes long transient period.
3. Additional error is incurred by use of a round well instead of a flat well.

Requirements for Accurate OBS Results
1. Mixing of the liquid in the plate must be avoided• movement in the plate reader• transport from incubator to plate reader• use of agarose may be beneficial
2. If transient data are to be employed, walls should be made of material with much lower O2 permeability than polystyrene, and the volume of silicone rubber must be reduced. Otherwise, sufficient time must be allotted for the system to reach steady state (quasi-steady state if cells grow).3. The well geometry should be flat.4. Sensor pO2 must be high enough, and/or cell loading must be low enough, so that islet cells do not become oxygen starved
Operating conditions, design, and materials that lead to significant non-ideal conditions should be eliminated

Summary
1. Improvement in islet quality assessment requires development of meaningful, quantitative assays.
2. Nuclei counting combined with microscopy has promise for accurate enumeration of islets.
3. Oxygen consumption rate, which is a measure of oxidative phosphorylation, is a direct measurement of mitochondrial function.
4. OCR measurements made with a stirred chamber using the most purified human islet fraction are predictive of transplantation outcome in mice.
5. The BD OBS is attractive because of its apparent simplicity, but further improvements are needed to ensure meaningful data.

AcknowledgementsMIT/University of MinnesotaKlearchos K. Papas
MITAnna PisaniaDaryl E. PowersMichael J. RappelHaiyan WuEfstathios S. AvgoustiniatosAmy S. Lewis
Massachusetts General HospitalMaria KoulmandaHugh AuchinclossAndy Kipo
University of MinnesotaBernhard J. Hering
Joslin Diabetes CenterSusan Bonner-WeirGordon WeirAbdulkadir OmerVaja TchipasvilliGaurav ChandraChristopher Cahill
Becton DicksonMark Timmins
NIH Grants:1 R43-DK063727-01 Prodyne R01-DK063108-01A1NCRR ICR U4Z 16606
NIDDK SBIR Contract N44-DK-3-2535 Giner, Inc
JDRF Center for Islet Transplantation at Harvard Medical School

Extra Slides

Cure
No cure
Response to Rat Islet Transplants in Diabetic Balb/C Mice (Anti-CD4)
=(OCR)·(OCR/DNA)

Cure
No cure
Response to Human Islet Transplants in Diabetic Immunodeficient Mice
Human islets were taken from the highest purity fraction (>90% by DTZ)
=(OCR)·(OCR/DNA)