department of chemical engineering archnves
TRANSCRIPT

Feature-Based Investment Cost Estimation Based on Modular Design of a ContinuousPharmaceutical Manufacturing System
By
Donovan CollinsB.S., Chemical EngineeringStanford University, 2006
Submitted to the MIT Sloan School of Management and theDepartment of Chemical Engineering
in Partial Fulfillment of the Requirements for the Degrees of
Master of Business Administrationand
Master of Science in Chemical Engineering
In conjunction with the Leaders for Global Operations Program at the
Massachusetts Institute of Technology
June 2011
@ Massachusetts Institute of Technology. All rights reserved.
MASSACHUSETTS INSTTUTEOF TECHNOLOGY
JUN 15 2011
LIBRARIES
ARCHNvES
Signature of AuthorMay 6, 2011
MIT Sloan School of Management, Department of Chemical Engineering
Certified By _Bernhardt Trout, Thesis Supervisor
Professor, Director, Novar/s-0' IT Center for C/tinjous Manufacturing, Department of Chemical Engineering
Certified E
charlie Fine, Thesis SupervisorChrysler Leaders for Global Operations Professor of Management, MIT Sloan School of Management
Accepted By_William Deen
Accepted ByDebbie Berechman
Executive Director of MBA Program, MIT Sloan School of Management

This page has been intentionally left blank.

Feature-Based Investment Cost Estimation Based on Modular Design of a ContinuousPharmaceutical Manufacturing System
ByDonovan Collins
Submitted to the MIT Sloan School of Management and the Department of ChemicalEngineering on May 6, 2011, in Partial Fulfillment of the Requirements for the Degrees of
Master of Business Administration and Master of Science in Chemical Engineering
Abstract
Previous studies of continuous manufacturing processes have used equipment-factored cost
estimation methods to predict savings in initial plant investment costs. In order to challengeand validate the existing methods of cost estimation, feature-based cost estimates were
constructed based on a modular process design model. Synthesis of an existing chemicalintermediate was selected as the model continuous process. A continuous process was
designed that was a literal, step by step, translation of the batch process. Supporting designwork included process flow diagrams and basic piping and instrumentation diagrams. Designparameters from the process model were combined with feature-based costs to develop aseries of segmented cost estimates for the model continuous plant at several productionscales.
Based on this analysis, the continuous facility seems to be intrinsically less expensive only at
a relatively high production scale. Additionally, the distribution of cost areas for thecontinuous facility differs significantly from the distribution previous assumed for batch
plants. This finding suggests that current models may not be appropriate for generating costestimates for continuous plants. These results should not have a significant negative impacton the value proposition for the continuous manufacturing platform. The continuousprocess designed for this project was not optimized. Therefore, this work reiterates that theswitch to continuous must be accompanied with optimization and innovation in the
underlying continuous chemistry.
Thesis Supervisor: Bernhardt TroutProfessor, Director, Novartis-MIT Center for Continuous Manufacturing,Department of Chemical Engineering
Thesis Supervisor: Charlie FineChrysler Leaders for Global Operations Professor of Management,MIT Sloan School of Management

This page has been intentionally left blank.

Acknowledgements
I would like to express my sincerest appreciation to the people who have supported me in
completion of this thesis and of the LGO program generally. To all my friends, classmates,
mentors, and most importantly to my family, thank you for everything.

This page has been intentionally left blank.

Table of Contents
A b stra ct...............................................................................................................--.------... ..--- 3
Acknow ledge m ents ................................................................................................................ 5
Table of Contents ................................................................................................................... 7
L ist o f F ig u re s ......................................................................................................................... 9
Chapter 1. Introduction and Project Background ............................................ 10
1.1 Introduction ....................................................................................................... 10
1.2 Project Background ....................................................................................... 11
1 .3 O v e rv ie w ............................................................................................................ 1 3
Chapter 2. Technical Background and Literature Review .................................. 14
2.1 M anufacturing in the Pharmaceutical Industry............................................... 14
2.2 Continuous M anufacturing............................................................................. 15
2.3 Cost Engineering for New Technologies.......................................................... 17
Chapter 3. Problem Statement and Hypothesis .............................................. 19
3.1 Detailed Problem Statem ent .......................................................................... 19
3.2 Design Considerations ................................................................................... 20
3 .3 H y p o th e sis ......................................................................................................... 2 2
Chapter 4. Process M odel Form ulation............................................................ 23
4.1 Process M odel Structure ................................................................................ 23
4.2 Design of Primary Process Equipment ........................................................... 23
4.3 Process Sim ulation ......................................................................................... 28

4.4 Process Flow Diagrams................................................................................... 28
4.5 Piping & Instrumentation Diagrams................................................................ 30
4.6 Plant Layout ....................................................................................................... 31
Chapter 5. Cost M odel Form ulation .................................................................. 32
5.1 Cost M odel Structure .................................................................................... 32
5.2 Prim ary Process Equipm ent Costs ................................................................. 32
5.3 Other Direct Investment Costs ........................................................................ 33
5.4 Indirect Investm ent Costs............................................................................... 35
5.5 Batch Investm ent Costs ................................................................................... 38
Chapter 6. Results .......................................................................................... 40
6.1 Investm ent Costs........................................................................................... 40
6.2 Continuous Plant Operation .......................................................................... 43
Chapter 7. Conclusions and Opportunities for Further Investigation................47
7.1 Cost Advantages of Continuous Manufacturing System s ................................. 47
7.2 Robustness of Cost Estimates ........................................................................ 48
7.3 Utility of Cost Estim ates ................................................................................ 49
7.4 Alternative Fram eworks for Evaluating Investment Costs................................50
7.5 Other Opportunities for Further Investigation................................................ 52
B ib lio g ra p h y ......................................................................................................................... 7 2

List of Figures
Figure 1. Novartis TechOps' Strategic Vision .................................................................... 54
Figure 2. Process M odel Structure .................................................................................. 55
Figure 3. Design Elem ent: Process Sim ulation .................................................................. 56
Figure 4. Design Element: Process Flow Diagram ........................................................... 57
Figure 5. Design Element: Piping & Instrumentation Diagram ........................................ 58
Figure 6. Existing Methodology for Cost Estimation ......................................................... 59
Figure 7. Proposed Methodology for Cost Estimation ..................................................... 60
Figure 8. Investment Cost Scaling With Installed Capacity .............................................. 61
Figure 9. Direct Investment Costs for Continuous Plant .................................................. 62
Figure 10. Other Investment Costs for Continuous Plant................................................. 63
Figure 11. Total Costs for Continuous Plant ..................................................................... 64
Figure 12. Direct Investment Costs by Unit Operation .................................................... 65
Figure 13. Relative Costs and Scaling Factors for Continuous Plant .................................. 66
Figure 14. Running Costs for Batch vs. Continuous Production ........................................ 67
Figure 15. Low Utilization Perform ance .......................................................................... 68
Figure 16. O perational Reliability ..................................................................................... 69
Figure 17. Relative Economic Benefit of Batch vs Continuous .......................................... 70
Figure 18. Cost Savings Associated With Various Process Improvements.........................71
Chapter 1. Introduction and Project Background
1.1 Introduction
The pharmaceutical industry is currently facing a number of challenges, including pricing
pressure and an increase in regulatory scrutiny over product quality. In order to address
these challenges, many firms have invested in innovative process technology. By
implementing innovative technologies including process analytical technology (PAT), novel
unit operations, advanced material handling systems, and real-time product release, firms
hope to improve the performance and compliance of their manufacturing organizations.
Continuous manufacturing systems have the potential to be the next great leap forward in
pharmaceutical manufacturing. In contrast to conventional manufacturing systems, in which
large batches of chemical and drug product intermediates are produced, in continuous
systems materials will flow continuously from operation to operation. Various economic
studies have predicted continuous systems that will require less initial investment, lower
operational expenses, and decreased throughput time relative to conventional batch
manufacturing. The potential for order of magnitude improvements and savings has spurred
investment in continuous manufacturing.
Once only conceptual, continuous systems now exist in various developmental stages across
the industry. Fully integrated continuous manufacturing systems, though not yet a reality,
can now be envisioned and designed in a more robust way. It is clear that these systems will
operate completely differently from conventional plants. In order to justify additional
investment in development of these systems, there is a need for development of financial
models that are sensitive to the fundamental operational differences between batch and
continuous plants. This will identify the greatest opportunities to create value via the
implementation of continuous processing.
This thesis proposes an alternative, feature-based, methodology for estimating capital
investment costs for continuous manufacturing facilities. The methodology combines
relatively detailed design work with cost estimates based on the outputs of the process
design. In order to pilot the methodology, cost estimates are generated for a model
continuous process and compared with estimates for a comparable batch plant. Total cost
estimates are presented, as well as results segmented based on unit operation and cost
area. Throughout the thesis, financial figures and design work has been disguised, but ratios
and non-financial data are presented as found.
Based on this analysis, the continuous facility seems to be intrinsically less expensive only at
a relatively high production scale. Additionally, the distribution of cost areas for the
continuous facility differs significantly from the distribution assumed for batch plants. This
finding suggests that current models may not be appropriate for generating cost estimates
for continuous plants. Further work should therefore be done either to define and validate a
more realistic cost estimation methodology, or to develop an alternative framework for
evaluating investment decisions for this technology platform. To this end, several
opportunities for further investigation are proposed.
1.2 Project Background
In 2007, MIT and Novartis entered into a research partnership to develop new continuously
operated technologies for pharmaceutical drug substance and drug product manufacturing.
Early work for this collaboration focused on the technical development of new continuous
unit operations. Current work streams include ongoing work to develop individual unit

operations as well as the integration of sequential unit operations into a functioning
continuous manufacturing system. In parallel with this development work, several studies
have been issued comparing the economic benefit of continuous vs. batch processing.
(Wilburn, 2010)1 These studies have found continuous manufacturing to be favorable based
on a variety of advantages, including reduced investment cost, improved yields, cheaper raw
materials, and lower labor costs.
Previous studies report a 35%-40% decrease in continuous plant investment costs relative to
batch. There is internal concern within Novartis that the cost estimation methods developed
in previous studies may not be appropriate for justifying additional investment. These
concerns stem largely from the fact that the equipment factors proposed were developed
for batch plants based on many years of constructing batch plants. Continuous plants are
expected to operate differently than batch plants, so the existing equipment factors may not
be appropriate. Additionally, because many of the proposed continuous process equipment
are newly available or unavailable at commercial sizes, there is significant uncertainty
regarding their cost. This implies significant uncertainty in the resulting estimates even if
accurate scaling factors are assumed.
In order to address these concerns, an alternative cost estimation methodology has been
developed as part of a student internship project. The new methodology calculates
investment costs based on design of the main process equipment as well as explicit
estimates for various secondary cost areas. This study is conceptually similar to previous
work in that it makes a financial comparison between a model batch and continuous
1 Among others. Additional economic studies have been developed as part of this collaboration but are not inthe public domain.

process. However, rather than test the economic benefit of continuous manufacturing, it
has been designed to provide internally credible cost findings for a continuous system.
The model chemical process was not optimized for continuous manufacturing. In fact, an
effort was made to model a continuous process that was a "direct translation" of the batch
chemistry, which may not be the optimal process design strategy. Therefore, the results
presented here should be interpreted as instructive primarily towards the development of
more robust financial models.
1.3 Overview
The thesis is organized into several chapters. First, a brief literature review is presented,
providing some technical context for this work. Next, a discussion of the problem statement
and further project context is presented. Then, both the design model and cost model are
described in detail. Results are then presented, followed by interpretation of these results,
reflections on the process, and potential opportunities for further investigation.

Chapter 2. Technical Background and Literature Review
2.1 Manufacturing in the Pharmaceutical Industry
Production of pharmaceuticals comprises of upstream ("chemical") and downstream
("pharmaceutical") processing steps. During the chemical synthesis, raw materials are
combined and purified via a series of chemical unit operations. This generally includes
reaction steps, where chemicals are combined to form a new product, and isolation steps, in
which the desired product is separated from unwanted solvents, catalysts, or impurities.
Most unit operations are performed in large tank reactors. Materials are transferred
between reactors via pumping or physical conveyance systems. In addition to tank reactors,
isolation often requires filtration and drying, which are generally performed using a
pressurized filter and agitated dryer. Although the primary batch equipment is generally
multi-purpose, most process steps require extensive custom installations to provide the
required inlet and outlet flows, level of agitation, heat transfer, pressure, or surface area.
The transition between upstream and downstream occurs following the final isolation step.
The output of this step is the pure drug or active pharmaceutical ingredient (API). Following
isolation and release of the API, it is combined with other inactive ingredients and processed
into a suitable dosage form. Traditional downstream process equipment includes solid
mixers, granulators, dosage forming and coating equipment. Downstream equipment is
generally multi-purpose, although customization is often required to provide product
containment and product flow.

2.2 Continuous Manufacturing
"Continuous manufacturing" refers generally to a process that is operated over an extended
period of time, in contrast to batch processes which are operated intermittently.
Continuous manufacturing is common in other industries, but rare in pharmaceuticals. This
has been variously attributed to differences in regulatory standards, production scale,
standards for quality control, and process equipment flexibility.
2.2.1 Expected Benefits
The economic benefits of continuous processing have been proposed both internally at
Novartis and in the academic literature. (Thomas, Transforming the Pharma Industry: Lean
Thinking Applied To Pharmaceutical Manufacturing, 2006) (Fletcher, 2010) Benefits are
expected to be seen for both chemical and pharmaceutical processing, and should be seen
at both system and unit-operation levels. (Thomas, Batch to Continuous: Coming of Age,
2008)
Shifting a single unit operation to a continuous process can often provide significant
benefits. Chemical operations can benefit from "intensified chemistry". (Schwalbe, Autze,
Hohmann, & Stirner, 2004) That is, in many cases continuous reactions can be operated at
higher temperature and concentrations than corresponding batch reactions. This leads to
shorter processing time, higher yield, or reduction in solvent waste. Additionally, continuous
processing has the potential to reduce to standing concentrations of various intermediate
products. For intermediates which are too hazardous to store in large quantities, continuous
processing is the only option. Similarly, in pharmaceutical manufacturing continuous
processing is occasionally required to produce a stable final product. (Lakshman, Cao,
Kowalski, & Serajuddin, 2008)

Continuous manufacturing is also expected to provide benefit at the system-level.
Integrated continuous systems are predicted to be intrinsically more efficient, due to
reduced investment costs, reduced operating costs, increased quality, decreased in-process
inventories, and decreased throughput time relative to batch. (Wilburn, 2010) On the
pharmaceutical side, there is speculation that developing and implementing continuous
manufacturing for pharmaceutical dosage forms would provide a number of additional
benefits. These include accelerated development timelines, faster regulatory approvals, and
flexible dosage forming. (Novartis, 2010)
2.2.2 Recent Trends
Interest in continuous pharmaceutical manufacturing has spurred an increase in continuous
process development. The feasibility and advantages of various continuous unit operations
have been studied, and there is general optimism that in many instances continuous
processes can be implemented to demonstrate discrete benefits. (Roberge, Zimmermann,
Rainone, Gottsponer, & Eyholzer, 2008) In addition to advances on the academic side, there
has been a recent increase in the capabilities of 3rd party equipment manufacturers and
engineering service providers to support implementation of continuous projects.
2.2.3 MIT-Novartis Collaboration
Novartis has made significant investments in developing continuous manufacturing
technologies. A research collaboration was initiated with MIT in 2007 for the purpose of
developing new continuous unit operations. In addition to this basic research, MIT has also
constructed a pilot facility that will produce drug product. As of late 2010, various individual
unit operations have been developed and tested, and the MIT team is in the process of
linking unit operations and integrating various plant systems.

Responsibility for the implementation of continuous manufacturing technologies at Novartis
falls primarily to the Technical Operations (TechOps) organization, Novartis' pharmaceutical
manufacturing and supply network. Development of continuous capability is a key part of
TechOps' long term strategic vision, as shown in Figure 1. Continuous manufacturing is
positioned as the natural next step in the organization's transformation towards improved
process excellence and operational efficiency.
There are several major work streams for continuous manufacturing at Novartis.
Collaboration with MIT is ongoing. Modular equipment skids that control process feeds and
reactions have been developed in collaboration with an outside vendor. Several continuous
units have been purchased for development use. A commercially available continuous drug
product processing line has been evaluated. Conceptual design of a new continuous
manufacturing plant has been initiated.
2.3 Cost Engineering for New Technologies
2.3.1 Type of Cost Estimates
Investment in new production facilities will always require an initial financial justification.
Generally, this involves estimates of the capital and ongoing expenses for operating the
plant, weighed against estimates of the additional revenue generated. As projects advance
from concept to design, the requirement for accuracy in cost estimates increases.
(Christensen & Dysert, 2005) The utility of the cost estimates also shifts from financial
justification to budgeting and control. (Humphreys, 2005) This increase in required accuracy
mirrors the increase in available engineering design information, which can be used to
construct more accurate estimates.

Roy offers a general framework for classifying various types of cost estimates. (Roy, 2003)
During early development, very little is known about the product and a first sight estimate
(FSE) is the only number that can be produced. The accuracy of FSEs depends on the
experience of the estimator and the level of product definition. Later during the design
process, costs can be estimated based on appropriate product parameters. Parameter
based estimates (PBEs) associate product parameters such as product mass or annual plant
production volume to a cost function based on exiting data. Similarly, as more design
information is available, this data can be used to generate more robust estimates. Feature-
based estimates (FBEs) associate specific product features, such as number of edges in a
machined part or reactor volume in a production line, with cost functions for each feature.
2.3.2 Cost Estimates for Pharmaceutical Plants
In the process industries, and in the pharmaceutical industry in particular, FBEs are
commonly used to support project planning and cost control. (Hwang, 2006) To estimate
the cost of a new plant, preliminary design work is done to identify unit operations,
production volumes, and primary process equipment. Cost values for equipment are then
calculated individually for each unit operation and multiplied by a scaling factor to account
for other plant costs. (Perry & Green, 1997) The American Association for Cost Engineering
(AACE) refers to such estimates as Equipment Factor Estimates, or EFEs. According to AACE,
EFEs are accurate and appropriate "if the equipment factors are appropriate, if the correct
adjustments have been applied, and if the list of process equipment is complete and
accurate." (Dysert, 2003) It is unclear whether existing methods for continuous plants meet
this general criterion.
Chapter 3. Problem Statement and Hypothesis
3.1 Detailed Problem Statement
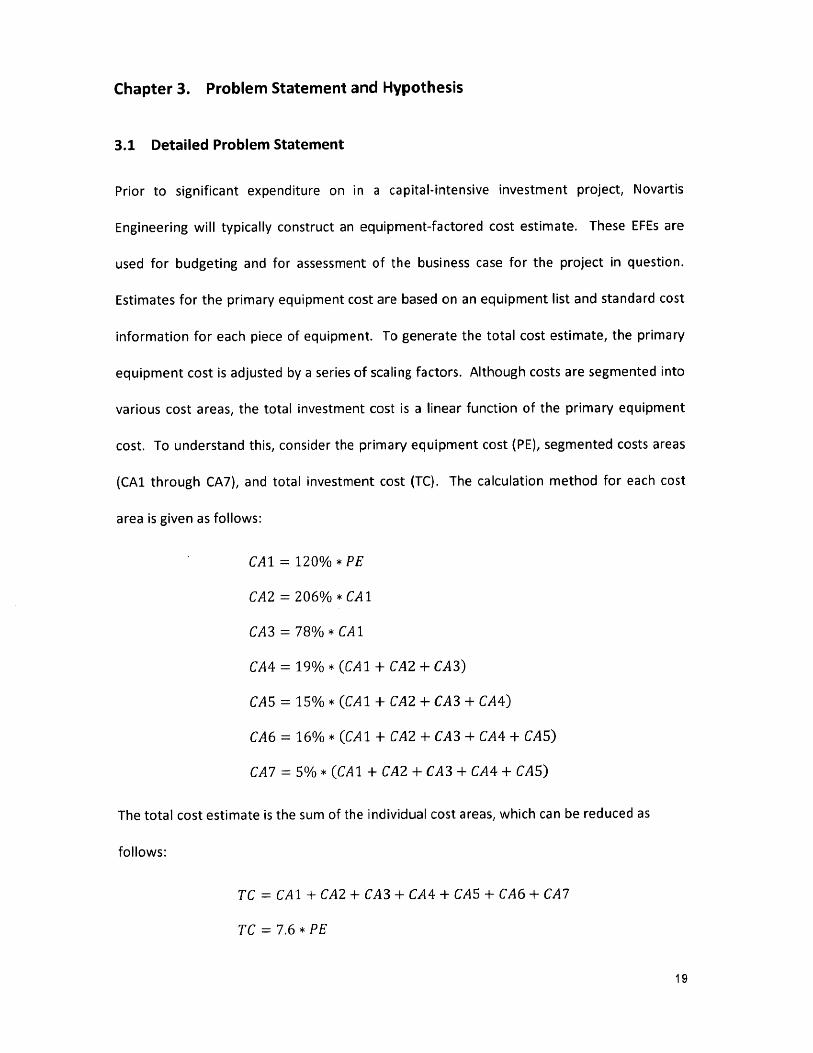
Prior to significant expenditure on in a capital-intensive investment project, Novartis
Engineering will typically construct an equipment-factored cost estimate. These EFEs are
used for budgeting and for assessment of the business case for the project in question.
Estimates for the primary equipment cost are based on an equipment list and standard cost
information for each piece of equipment. To generate the total cost estimate, the primary
equipment cost is adjusted by a series of scaling factors. Although costs are segmented into
various cost areas, the total investment cost is a linear function of the primary equipment
cost. To understand this, consider the primary equipment cost (PE), segmented costs areas
(CA1 through CA7), and total investment cost (TC). The calculation method for each cost
area is given as follows:
CA1 = 120% * PE
CA2 = 206% * CA1
CA3 = 78% * CA1
CA4 = 19% * (CA1 + CA2 + CA3)
CA5 = 15% * (CA1 + CA2 + CA3 + CA4)
CA6 = 16% * (CA1 + CA2 + CA3 + CA4 + CA5)
CA7 = 5% * (CA1 + CA2 + CA3 + CA4 + CA5)
The total cost estimate is the sum of the individual cost areas, which can be reduced as
follows:
TC = CA1 + CA2 + CA3 + CA4 + CA5 + CA6 + CA7
TC = 7.6 * PE

Accuracy of the total cost estimate is therefore extremely sensitive to uncertainty in the
primary equipment cost, uncertainty in the assumed scaling factors, and to validity of the
underlying model. This implies several clear drawbacks to applying this method to
continuous plants. Because continuous plants are expected to operate differently than
batch plants, the relative weight of each cost area may be different, and existing scaling
factors may not be appropriate. Additionally, there is significant uncertainty in the cost of
the main equipment, as the equipment for many continuous unit operations is less
established on the commercial market. Finally, the relative sizes of each cost area may vary
with production scale, making this type of model appropriate only across a narrow range of
production scales.
Based on these reservations, there is a need for an alternative methodology for estimating
investment costs. To this end, a model batch process was selected from Novartis' existing
manufacturing portfolio. An analogous continuous process was designed, and cost
estimates were prepared for both the batch and continuous processes. The primary goal for
this project was to increase the credibility of estimates for the investment costs associated
with continuous chemical plants. This is expected to remove a roadblock to the continued
development of the continuous technology platform. This project is also expected to
generate additional insights into the development strategy for continuous manufacturing.
3.2 Design Considerations
Because the goal of this exercise was to deliver an improved estimation methodology, rather
than demonstrate the superiority of either batch or continuous scheme, care was taken to
align the process and cost model design to be consistent with this goal.

3.2.1 Process Model Design
The continuous process was developed to be a literal translation of the batch chemistry. No
new reactions, raw materials, or unit operations have been assumed. The project has not
proposed any consolidation or elimination of unit operations. There has been no other
optimization of the process chemistry. This design strategy is quite different from those
proposed for previous studies. Historically, the shift from a batch to a continuous process
has assumed numerous changes in the chemical synthesis in conjunction with the shift in
operating method. The proposed approach isolates the intrinsic benefit of continuous
processing.
Additionally, all unit operations have been reviewed to ensure that the analogous
continuous process is feasible. For the final isolation step, no feasible analogous process
could be identified, so that unit operation is designed to run in batch mode. Excluding
unproven unit operations reduces model uncertainty and makes the cost estimates more
credible.
Finally, care was taken to select the appropriate level of process design. The strategy for this
exercise was to perform the process design at a greater level of detail and therefore provide
more believable estimates. However, too much design work would deliver a model that was
so process specific and labor intensive that it could not be easily applied to other systems.
The work depicted here represents an appropriate balance between design depth and
usability/transparency.
3.2.2 Cost Model Design
Project goals also influenced development of the cost model. A model was developed that
would generate explicit estimates for various cost segments. These include direct

(equipment, installation, qualification) vs. indirect costs (building, infrastructure), and cost
segmentation by unit operation, installation component, and equipment function. Flexible
cost segmentation allows a broader range of analyses, as well as easier troubleshooting as
underlying assumptions are refined.
Second, cost projections were developed to be collectively exhaustive of all potential
investment costs. Each cost area was systematically reviewed to identify exactly what was
spent so that all cost areas are at least nominally covered in the new model. This should
avoid systematic errors associated with exclusion of key areas.
Finally, activity-based costing principles were used to develop directly comparable estimates
for various cost areas. Indirect costs have been generated based on process requirements of
a variety of common resources.
3.3 Hypothesis
We expect that if additional layers of process design are added to the basis for cost
estimation, the resulting feature-based cost estimation methodology will provide robust,
internally credible, and actionable cost estimates.

Chapter 4. Process Model Formulation
4.1 Process Model Structure
The model continuous process has been designed in a hierarchical, modular fashion, as
shown in Figure 2. A process simulation is the fundamental design element, scales to an
assumed production volume. The next element in the hierarchy is a series of process flow
diagrams (PFDs). These PFDs detail the various continuous streams, secondary equipment,
required utility connections, and basic control structure. The fundamental design element is
a series of simple piping and instrumentation diagrams (P&lDs). These P&IDs specify the
number of instruments and number of piping elements for each subunit. Each element in
the process model provides design information that is fed into the process model.
4.2 Design of Primary Process Equipment
A series of analyses were performed to model the existing batch process and propose a new
continuous process. Process parameters for the first reaction have been developed at
Novartis. AspenPlus@, a commercially available software package, was used to model the
initial reactions and calculate separation performance. Material flows, thermal loads, and
reaction volumes were output from the process simulation and used to design and size
individual primary process equipment.
4.2.1 Reaction 1
The first unit operation is a chemical reaction. One stream is a commercially available
pre-mixed solution of a highly reactive compound. The second stream is an intermediate
from upstream processing. The reaction is relatively rapid and exothermic, so good heat
transfer is required to operate it safely.

For the continuous process, the unit residence time and composition of feed streams were
optimized experimentally. These parameters were used along with an analysis of previously
designed continuous equipment to specify the size and design of the required reaction
system. Achieving precise stoichiometry for this reaction is critical, as small deviations in
reactant concentration are expected to result in significant yield losses. Precise control is
achieved through the use of metering pumps that supply each reactant solution at a tightly
controlled flow rate. Additionally, a high reactor surface area is required in order to control
the reaction temperature. The continuous reactor therefore includes internal baffling to
achieve plug flow and good heat transfer.
In the batch process, this reaction is conducted in a jacketed stirred-tank reactor. The
reactive reagent is charged over a period of several hours in order to control heat release
and the formation of unwanted side products.
4.2.2 Reaction 2
In the second reaction, the reaction mass from the first reaction is mixed with a complex
reactant solution. The second reaction is a multi-step dimerization of the reacting
intermediate, requiring a long residence time and addition of a catalyst.
For the continuous process, the unit residence time and feed stoichiometry were
determined experimentally. These parameters were used along with an analysis of
previously designed continuous equipment to specify the size and design of the required
reaction system. The column height and number of stages required is determined based on
acceptable residence time distribution. Run continuously, this reaction is quite slow,
requiring several hours of residence time to ensure completion. The reactant solutions are
fed via metering pumps to a static mixer and then to an agitated vertical reaction column.

The column is relatively tall and requires a relatively large number of stage plates. There is
vertical downward flow through the column, induced by gravity and by an axial pressure
gradient. A baffled agitator provides radial mixing.
In the batch process, the second reaction is conducted in the same stirred-tank reactor as
the first. The two reacting compounds are prepared as a solution and the catalyst is added
at a controlled rate. Total process time is comparable to residence time of the continuous
unit.
4.2.3 Quench
After the reaction mass leaves the reactor, it is quickly mixed with an acidic solution,
quenching the reaction. After mixing, phase separation takes place rapidly, and the resulting
phases are separated physically.
For the continuous process, the reaction mass is combined in a baffled tubular mixer with
the quench solution. Residence time in the mixing unit is sufficient to achieve an emulsion.
Phase separation is performed in an overflow-controlled settler tank with a residence time
of around half an hour. Phase separation is rapid, with some impurities partitioning into the
aqueous phase. Both the aqueous and organic phase are transferred from the settler tank at
a metered rate.
In the batch process, the reaction mass is quickly transferred to a second jacketed stirred
tank reactor. Acid is added under high agitation over a period of several hours. Agitation
then stops and phase separation is allowed to occur. Complete phase separation takes
approximately an hour, after which the organic phase is transferred out.

4.2.4 Wash
The wash step is similar to the quench. Water is added to the organic mass, mixed, and
separated. Some residual impurities are removed in the aqueous phase.
The continuous train is similar to the quench train, with mixed feed streams, a static mixer,
and a settler tank. The residence time for phase separation is again less than an hour.
In the batch process, the wash step takes place in the same reactor as the quench. Water is
added, followed by agitation and phase separation.
4.2.5 Solvent Exchange
Following the quench, the product mass contains the crude product, process impurities, and
a mix of solvents. Selective crystallization of the product requires a different solvent
environment, so a solvent exchange is required. To achieve this, the reaction solvents are
evaporated off, followed by addition of the crystallization solvents.
This solvent exchange is challenging to run continuously. Because the product mass must be
continuously flowing, it must remain non-viscous and therefore total solvent concentrations
must remain relatively high. In order to maintain this minimum solvent concentration, the
solvent exchange is performed via a series of three falling-film evaporators. Each evaporator
reduces the concentration to the minimum value, followed by mixing with heated
crystallization solvent and an additional evaporation. The final outlet stream is the product
mass in the crystallization solvent controlled at a high temperature to prevent premature
crystallization. Total residence time of the evaporator system is estimated to be less than an
hour.
Solvent exchange is significantly easier in the batch process. Because the solution does not
need to be flowable at all times, there is no need for multiple additions of crystallization
26

solvent. To perform the batch process, the product mass is transferred to a third reactor,
equipped with a top-mounted condenser. The product mass is heated until the process
solvents are evaporated, and then mixed with a stream of crystallization solvent.
4.2.6 Crystallization
Selective crystallization of the product is the next isolation step. To achieve selective,
quantitative crystallization of the product, the solution is cooled over a period of several
hours using a linearly decreasing cooling gradient.
The continuous crystallization process replicates the batch cooling profile by passing the
product mass through a series of stirred-tank reactors. This process has not been
implemented experimentally, and there has been some internal debate as to whether it is
technically feasible. We will assume so for the purpose of our analysis. There is a possibility
that a quicker or more selective crystallization is possible due to improved process control,
(Lawton, Steele, & Shering, 2009) but we will not make this assumption for our analysis.
Transition between reactors is metered by control valves and does not require intermediate
pumping. There are five reactors in total, all mounted on a single skid. The total residence
time for the system is identical to residence time for the batch crystallization process.
The batch crystallization is conducted in a fourth reactor. The initial product temperature is
relative high following the solvent exchange step, and the product solution is again cooled
over a period of several hours.
4.2.7 Filtration & Drying
The cooled product slurry is then passed through a nutsche filter and dried in a paddle-drier.
No continuous technology has been identified that will be able to operate this process, so for

the continuous system we assume this unit operation is conducted in a semi-batch fashion
using identical equipment.
4.3 Process Simulation
With the primary process equipment designated, a process simulation was used to
determine the flow rates and compositions of the various continuous streams. AspenPlus@
was used as the simulation platform. The primary challenge of constructing the model is the
assignment of physical properties to various non-standard compounds. The reactants and
product are not present in Aspen's compound library. Therefore, physical properties from
existing molecules deemed to be structurally or functionally analogous were used. We
therefore expect some error in the simulated behavior of these species, specifically in their
partitioning across various process solvents. Process information, including heating duties,
stream sizes, pump duties, and requirements for heating and cooling fluids can be read
directly off the Aspen sheet. The process model was constructed so that is was simple to
calculate stream compositions for a variety of product output levels. This facilitated
calculation of process requirements for various production scales. The process simulation is
shown in Figure 3.
4.4 Process Flow Diagrams
In addition to the main equipment, secondary systems required to operate the process were
identified. This included additional equipment for material handling, process control, and
buffering, as well as requirements for heating and cooling utility connections, connections
between equipment, and a basic strategy for process control. In order to specify these
systems, process flow diagrams were constructed for each unit operation. The design

considerations for each secondary system were as follows. An example PFD is shown in
Figure 4.
4.4.1 Material Handling Equipment
In order to run the process continuously, reactants must be staged and mixed prior to
introduction into the continuous system. We assume raw material feeds are prepared daily
and propose appropriately-sized tanks for this purpose. Additionally, scales and powder
transfers systems are required for weigh and solid handling, respectively. Some reactants
are stored off-site and pumped in to the process floor, which was not modeled explicitly.
4.4.2 Process Controlling Equipment
Various pumps and heat exchangers are required to maintain the appropriate flow rates,
temperatures, and pressures. Duties and materials for each piece of equipment have been
individually specified. The primary design considerations for this equipment are process
material (corrosive streams require plastic, glass, or hastelloy) and precision (some functions
reactions require equipment with a higher degree of precision than standard process
equipment).
4.4.3 Buffering Equipment
A series of buffer tanks has been proposed for the continuous system. These are placed
after the first reaction, following the wash step, and immediately prior to filtration and
drying. The purpose of these buffers is to de-couple the various unit operations, which will
reduce the effect of perturbations and allow units to keep running in the case of mechanical
failure or out of expectation observations. It is unclear whether any or all of these buffers
will be optimal for a functional continuous system, but they have been included in order to
provide a conservative, feasible proposal for the continuous system.
4.4.4 Heating and Cooling System
The number of unique heating & cooling connections were counted for each PFD. Each
stream is assumed to be mixed and controlled locally.
4.4.5 Process Control Strategy
The number of process control loops are counted for each PFD. Control loops were defined
qualitatively and are expected to be a reasonable surrogate for complexity and cost of
automating the plant's control system.
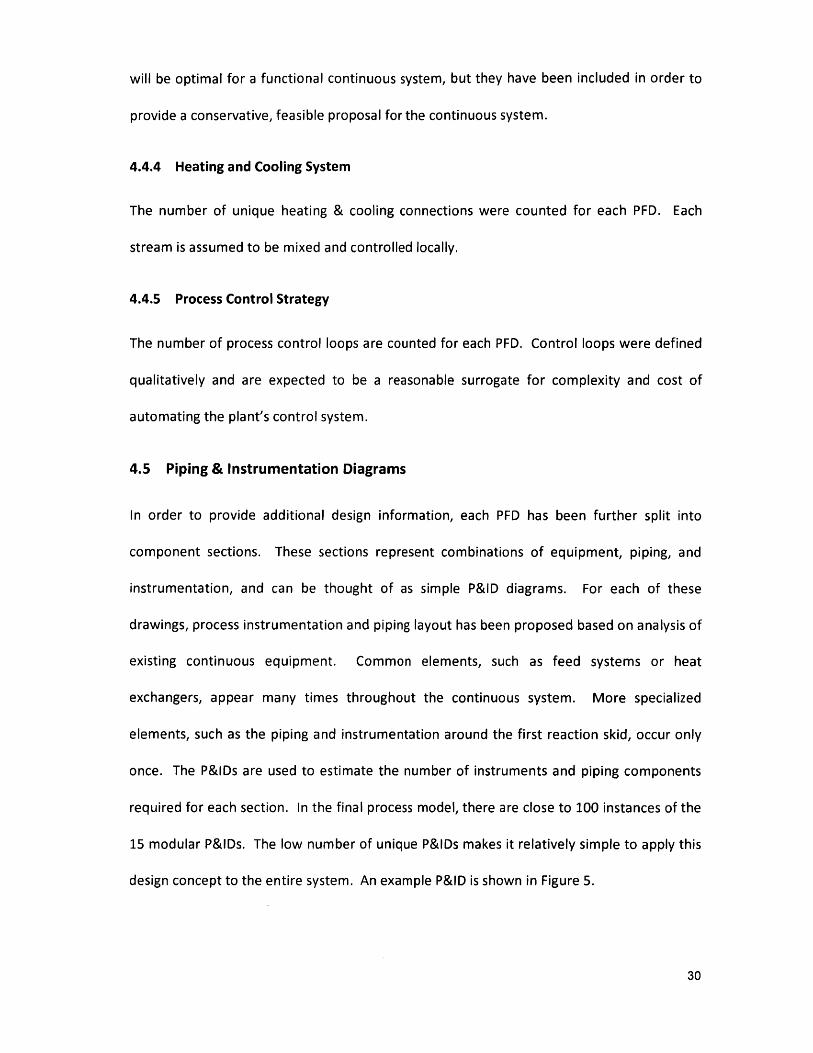
4.5 Piping & Instrumentation Diagrams
In order to provide additional design information, each PFD has been further split into
component sections. These sections represent combinations of equipment, piping, and
instrumentation, and can be thought of as simple P&ID diagrams. For each of these
drawings, process instrumentation and piping layout has been proposed based on analysis of
existing continuous equipment. Common elements, such as feed systems or heat
exchangers, appear many times throughout the continuous system. More specialized
elements, such as the piping and instrumentation around the first reaction skid, occur only
once. The P&lDs are used to estimate the number of instruments and piping components
required for each section. In the final process model, there are close to 100 instances of the
15 modular P&lDs. The low number of unique P&lDs makes it relatively simple to apply this
design concept to the entire system. An example P&ID is shown in Figure 5.

4.6 Plant Layout
in addition to the design elements mentioned above, a basic plant layout was proposed for
the continuous process. This layout allows for a basic quantitative estimate of the
production space occupied by the continuous process. To construct the plant layout, the
footprint of each piece of large equipment, including all primary process equipment and
tanks from the buffer system, was estimated based on design work. Each piece of
equipment was lain out in a linear fashion, representing a model continuous line. Smaller
equipment, including pumps, heat exchangers, and piping, was not explicitly included, as it
can be installed in the space already reserved for the large equipment.

Chapter 5. Cost Model Formulation
5.1 Cost Model Structure
As stated previously, Novartis' established method for estimating investment costs involves
design of the primary process equipment, construction of cost estimates for this equipment
based on historical cost data, and the use of scaling factors to generate total cost estimates
based on primary equipment cost. This is illustrated graphically in Figure 6.
In the new model, an alternative series of cost estimates was constructed based on design of
the primary process equipment and supporting plant systems. This alternative structure is
illustrated graphically in Figure 7.
The proposed cost model exists as a series of spreadsheets, each tabulating costs for an
individual unit operation. Design information from the process model is entered into each
spreadsheet. Additionally, design information from the process model and component unit
operation spreadsheets is used to calculate indirect costs that should allocated to the
continuous process, but cannot be assigned to any single unit operation. Costs have been
segmented in various ways. This includes cost segmentation by unit operation, cost area,
and direct/indirect.
5.2 Primary Process Equipment Costs
Main equipment is defined as reactors, mixers, and work up equipment. That is, any
equipment responsible for modifying stream composition. For each piece of main
equipment, calculation of the equipment cost was performed explicitly based on the process
model. For conventional equipment, such as the falling film-evaporators, standard cost
information for units of various sizes are available. Design information was used to

determine the size of the unit required. For the more novel continuous equipment, such as
the tubular reactor, cost estimates were made based on a detailed design of the process
equipment. Cost for individual components such as reaction tubes, hoses, skidding,
instrumentation, and assembly were determined from vendor quotations.
5.3 Other Direct Investment Costs
5.3.1 Secondary Equipment
Secondary equipment has been defined as tanks, pumps, and heat exchangers. For each of
these, equipment size was calculated based on process requirements from the process
model. Internal standard cost data was used to price each piece of equipment based on its
required size, material of construction, and design.
5.3.2 Installation
This cost area refers to the physical equipment installation, including skidding, anchoring,
and secondary construction work. Installation costs were generated for each piece of
equipment based on its weight and the likely complexity of the installation. Installation
costs were formulated arbitrarily based on historical data. Accuracy for this cost area is
likely to be low, but it is required to ensure the tabulated installation costs are collectively
exhaustive. Installation costs are a small portion of the total direct investment costs.
5.3.3 Instrumentation
This cost area refers to the direct installation cost for the distributed control system. This
includes probe hardware and installation, as well as connection to the distributed control
system. This cost also includes the server, software, and GUIs for the distributed control

system. Standard instrumentation costs per instrument and per motor were assumed. The
number of instruments and motors was counted based on the P&IDs.
5.3.4 Piping
This cost area refers to direct installation of process piping. This includes piping connections
between the process equipment and distribution headers as wells as connections between
equipment. Piping costs were based on required piping meterage. Meterage was
determined by counting various design parameters from the simple P&ID diagrams. Each
main equipment connection, t-junction, connection to an adjacent P&ID section, and dead
end was counted as Y2 an R-unit. Each R-unit was counted as 9m of piping. Piping diameter
was then calculated based on flow rate and an assumed superficial velocity.
Piping costs per meter varies as a function of complexity and pipe diameter. Notably,
because flow rates for the continuous system were significantly lower than for batch
systems, process piping was calculated to be on the lower range (ID 10-15mm) for
permanently installed rigid metal piping. Installation costs are essentially flat in this range,
as they cover the welding, installation, and design work rather than the cost of the steel.
In practice, many of the piping installations proposed in this work would use temporary,
flexible piping connections. This is expected to reduce the installation costs per meter below
the figures calculated for this exercise.
5.3.5 Specialty Instrumentation
This cost area refers to any instrumentation beyond temperature, pressure, flow, or level
gauges. All of the specialty instruments specified in this process were PAT units. Limited
internal cost information is available for PAT implementation projects, so benchmark costs
for hardware, automation, and method development were used. These benchmarks are
34

very rough estimates, as method development costs are expected to vary greatly by product.
PAT costs are expected to decrease as Novartis becomes more experienced developing PAT
applications. The proposed design contains three PAT elements, but it is still uncertain how
many, if any, will be required in order to operate the continuous system.
5.3.6 Engineering
This cost area refers to process engineering costs associated with detailed equipment design
and P&ID creation, as well as software engineering costs associated with programming and
validating control automation. Standard costs per 10 and per meter of piping were assumed.
10s and piping meterage were calculated as previously described. In order to account for
more complex control required for continuous plants, an additional cost was applied for
each primary control relationship, as defined in the PFDs.
5.3.7 Qualification
Qualification costs were calculated as 10% of the total direct investment costs. This factor
was determined empirically in order to generate a qualification cost that was on the same
order (4%-6% of the total investment cost) as that observed for batch plants.
5.4 Indirect Investment Costs
Prior to construction of the cost model, various indirect investment cost areas were
considered. An assessment was made for whether each investment cost area would vary
significantly based on the requirements of the continuous process. These areas were
allocated based on process utilization of various plant resources (square meterage, heating
and cooling capacity, and waste production). Areas for which no significant difference was

anticipated were bundled together and allocated to the continuous process based on the
required plant footprint.
This cost allocation strategy is consistent with activity-based costing principles, and delivers
an appropriate economic comparison between the batch and continuous processes. The
cost charges for various resources assume a large plant, and therefore take advantage of
economies of scale. The figures are therefore not representative of the costs for a
standalone greenfield project. This modeling strategy was selected because the continuous
system is expected to exist within the context of an existing facility or a new, large scale
continuous facility. In the future, indirect cost allocations can be modified to fit the
economic reality of specific investment projects.
5.4.1 Utilities
Heating and cooling utility consumption was modeled explicitly. Steady-state consumption
is available for each heating/cooling operation based on the process simulation. Novartis
has historical investment cost data for heating and cooling systems in its batch plants.
However, there should be significant differences in actual utility consumption due to
differences in usage profile, heat loss, and non-productive heat transfer (ie. heating/cooling
of equipment between batches). Per-kW charges for the continuous system have been
adjusted to reflect these differences.
Consumption of other utilities, including electricity, process air, other process gases, and
cleaning solvents, is expected to be comparable to consumption in a batch plant.
Investment costs for these additional utility systems have therefore been bundled together
and allocated based on plant footprint.

5.4.2 Waste Treatment
Treatment of both organic and aqueous waste is the second indirect cost area. In the batch
plant, aqueous waste is collected and transported to central wastewater treatment facilities.
A portion of the organic waste is recovered, and the remainder is incinerated at a central
incineration facility. For the model process, the waste streams for the batch and continuous
processes are similar in composition, but not in volume. Therefore, investment costs
associated with the waste treatment system of the batch plant have been determined on a
per L/hr basis and allocated to the continuous system based on volume of waste generated.
These standard allocations should not be used generically, as the investment cost for waste
treatment depends greatly on the composition of the waste streams, the economic
attractiveness of recovery, and the availability of local centralized treatment facilities.
5.4.3 Building
Building costs are available for the batch facility. The continuous process will require a
similar facility in terms of capabilities, but is expected to occupy a different volume than the
batch process. Therefore, investment costs associated with construction have been
determine on a per m2 basis and allocated to the continuous system based on process
footprint. This charge is for "usable floor space" calculated by dividing the building cost for
the batch plant by the space occupied by process equipment. This does not include
walkways, storage space, airlocks, or offices. The building charge can be modified to reflect
the economic reality of new projects.
Other building costs, including costs for the HVAC system, pilings, lighting, interior finishing,
active safety systems, and power distribution, are expected to be fundamentally identical on
a per m2 basis. These costs have been bundled together with the building charge.

5.5 Batch Investment Costs
Batch investment costs are broken into direct and indirect costs similar to continuous.
However, less rigorous process modeling and equipment design work has been done for the
batch equipment. Therefore, the cost estimation methods used for the continuous costs
could not be repeated for batch. Several secondary cost areas (procurement, direct
installation, engineering, qualification) were calculated by multiplying batch costs by
Novartis' standard scaling factors. Cost areas which could be calculated explicitly (utilities,
building, and infrastructure) were calculated identical to the continuous plant.
This creates some concern that batch and continuous costs may not be constructed on the
same basis. However, cost estimation based on scaling factors is expected to be more
accurate for batch than for continuous because equipment cost benchmarks and scaling
factors are more established for batch.
5.5.1 Main Equipment Costs
Main equipment was taken from the installed batch equipment train. Standard costs for all
equipment are available internally at Novartis and are based on recent vendor estimates on
a local (Swiss) cost basis.
5.5.2 Procurement
An addition 20% of the main equipment cost was figured to account for procurement of
equipment not represented in the initial process design. This initial scaling factor is referred
to as CAL.
5.5.3 Installation
The direct installation costs (CA2) were calculated to be 206% of CAL.

5.5.4 Engineering
Engineering costs (CA4) were calculated to be 73% of CA1.
5.5.5 Qualification
Qualification costs (CA7) were calculated to be 26% of CA1.
5.5.6 Indirect Costs
Indirect costs (CA3 - utilities, CA5 - building, CA6 - infrastructure) were calculated identically
to the continuous process, based on resource allocation.

Chapter 6. Results
Investment costs were calculated for the continuous and batch plants at a series of
production scales. These cost estimates were determined in aggregate and segmented
across a variety of categories.
Additionally, because the work depicted here involved the design of feasible, operating
continuous systems, various unanticipated findings resulted from these analyses. These can
be generally associated with operation and design of the continuous manufacturing systems.
The results are presented below and should be considered a starting point for planning
around these issues.
Finally, it should be noted that design of the continuous process was conservative, having
assumed no improvements in process performance or optimization of the process to run
continuously. Segmented cost data has been used to quantify and rank the cost savings
associated with various process improvements that could potentially be realized in the
continuous system.
6.1 Investment Costs
6.1.1 Scaling of Total Investment Costs
Total plant investment costs as a function of installed capacity are shown in Figure 8. Based
on this analysis, the batch process appears to be favorable at installed capacities below
800 tpy, and continuous appears to be favorable at capacities above 1200 tpy. The primary
driver for the difference between batch and continuous is doubling up of the batch
equipment at scales beyond 700 tpy. At 1400 tpy, the 700 tpy line has been fully duplicated
and the plant will comprise of two lines operating independently.

6.1.2 Direct Cost Areas
Direct investment costs are costs that are needed to construct a continuous system,
assuming the building, utilities, and infrastructure are already present. These costs are
shown in Figure 9. Notably, different scaling behavior is observed for each cost area. The
cost of the main equipment increases with the production scale, as the size and complexity
of the equipment increases. Installation and piping costs also appear to scale less steeply
than costs for the main equipment. Costs associated with instrumentation, PAT, and
engineering remain constant across the three model production scales.
6.1.3 Other Cost Areas
In addition to the direct cost for the continuous plant, the model accounts for indirect costs
and the cost of the filtration and drying system. These are shown in Figure 10. Charges for
the utility installations double along with the doubling of production scale, as the process
requires twice as many resources. The building costs also increase, but not linearly, as the
continuous equipment increases in size. The filtration and drying system, for which a
continuous unit operation could not be identified, is a significant portion of the overall
investment cost.
6.1.4 Fixed vs. Variable Investment Costs
In Figure 11, investment costs have been aggregated as either fixed, variable with
production scale, or related to filtration and drying. Filtration and drying costs are
segregated because this unit operation will be run batch-wise in the model continuous
system. There appears to be a significant fixed cost associated with installation of a
continuous process. Qualitatively, process engineering, method development,
instrumentation, and automation will have to be performed for any plant, and are not
41

expected to change significantly with the installed capacity. In addition to these fixed cost,
there is a variable element with cost related to the volume of material flow, resource
utilization, change in equipment size, and minor duplication of equipment.
6.1.5 Cost Segmentation By Unit Operation
Direct investment costs can be segmented by unit operation as shown in Figure 12. These
values are for an installed capacity of 700 tpy. As shown in this figure, consolidation of unit
operations in the batch plant leads to more equipment, and therefore a greater investment
cost, for the continuous plant.
For individual unit operations, there is variability in terms of the economic benefit relative to
batch. Extraction and solvent exchange are roughly equivalent in cost, while reaction and
crystallization seem to be slightly more favorable in batch. The filtration and drying step is
significantly more expensive than other unit operations.
6.1.6 Apparent Scaling Factors
Cost ratios and apparent scaling factors have been derived from the continuous cost
estimates. These are shown in Figure 13. In general, the continuous factors are on the same
order as the existing batch factors. However, the apparent scaling factors vary significantly
with production capacity, as different cost areas scale at different rates. The ratio of main
equipment to installation cost decreases with increasing production scale, while the charge
for utilities increases linearly. These factors are instructive, and comparable enough to the
batch factors that they seem credible.
6.2 Continuous Plant Operation
In addition to investment cost modeling, the process design was used to derive some
information about how the continuous plant would operate. Simple estimates for various
operation expenses areas were made. Additionally, several key operational challenges were
identified. These are presented here, along with analysis for the system in question, and a
general framework for modeling these areas in the future.
6.2.1 Operating Costs
Based on work from previous MIT projects, the ongoing operating costs for continuous
plants have been identified as raw material costs, labor, depreciation of capital, QA/release,
waste disposal, and overhead are the primary operational costs. Rough estimates of several
operating cost areas were constructed based on past work. These values, based on annual
production of 700 tpy, are shown in Figure 14. It is important to note that these estimates
have not been constructed as rigorously as the figures for investment cost. They should,
however, be representative enough to give a sense of the relative value of each cost area.
The operating costs are similar for both processes, with relatively small variations that can
be qualitatively explained. However, even though the predicted differences are small
relative to the absolute costs, they are large relative to the investment cost, and particularly
a yearly allocation of the investment cost. This suggests that for the model process,
investment cost alone is not sufficient to evaluate the business cast for batch vs. continuous.
6.2.2 Raw Material Costs
Raw materials costs are driven by raw material consumption and process yield. The batch
and continuous processes have an identical yield, so the costs are almost equal. The

continuous process can be run at a lower concentration of catalyst concentration than
batch. This results in a significant yearly savings because the catalyst is expensive and not
recoverable. The solvent exchange produces more solvent waste when run continuously,
increasing the operating cost.
6.2.3 Waste Treatment Costs
Waste treatment costs are calculated as a function of the total waste produced. Again, the
solvent exchange is less efficient when run continuously, resulting in a small additional cost.
6.2.4 Heating and Cooling
Heating and cooling costs are calculated as a function of the various unit operations. Based
on this analysis, costs for the continuous process will be slightly higher than for the batch.
This has not been validated, and may be incorrect due to greater ambient heat loss for the
batch process.
6.2.5 Low Utilization Performance
For products ramping up in demand, or for products where initial demand projects are not
realized, capacity utilization will be significantly less than 100%. This will lead to idle
capacity for both batch and continuous systems. While batch systems can respond to
idleness by reducing the number of campaigns or batches, continuous systems are restricted
by the minimum system throughput.
For continuous systems, the minimum throughput is the minimum throughput of the least
flexible piece of equipment. Stated mathematically, the minimum system throughput (V) for
a system containing i integrated unit operations is
Vsystem = min (Vi)
The continuous system we have proposed has a minimum throughput of approximately 33%
of maximum. Therefore, when demand is less than 33%, the continuous system must be run
in campaigns to avoid significant accumulation of inventory. This will result in some
inventory accumulation over the course of each campaign, as well as additional costs
incurred for startup, shutdown, and changeover. Individual component capacities and
inventory profiles for levels of product demand are shown in Figure 15.
6.2.6 Equipment Reliability
The continuous system would optimally run throughout the year, with only a single annual
stoppage for maintenance. However, reliability of the continuous equipment is unclear, and
there is potential for continual equipment stoppages due to component failure, process
drift, external disruptions, or variability in raw material quality. The frequency of equipment
stoppages is a function of both the reliability of the individual components and of the
number of integrated continuous unit operations. The number of system stoppages (S) in a
given period of time for a system containing i integrated unit operations, each with an
expected number of unplanned stoppages Si is
Ssystem = Si
In case of failure, some product would have to be discarded as waste due to being
potentially out of spec. For the model process, we assume that for every failure, the
material in the reactors would be discarded, but the material in the workup equipment
could be isolated and retained. After line stoppage, we assume 3 residence time equivalents
of raw material would be discarded as the system returns to equilibrium.

There is clearly the potential for significant product losses if we assume a
reliability. One option to mitigate these losses is the installation of a buffer
would allow the reaction system to run in case of stoppages in other sections.
this buffer system and the range of potential savings are shown in Figure 16.
challenges of developing the capability for continuous manufacturing will be
stable, highly reliable system that is robust to external disruptions.
low system
system that
The cost of
One of the
to deliver a
6.2.7 Salvage Value
Based on a technical assessment of the continuous equipment, no equipment is so
specialized that it could not be adapted for another process in case of product failure.
Therefore, the salvageable costs for continuous equipment should be the same as those for
batch, assuming there are a sufficient number of continuous projects available. Salvageable
costs are defined as equipment, building, and supporting infrastructure, and exclude
process-specific automation and design. Based on this assumption, salvageable batch
investment costs are 88% of total, and 83% of total for continuous. The difference is driven
by PAT implementation costs for continuous, which are not recoverable. Recovering this
equipment value is only feasible if there is sufficient demand for used process equipment (ie.
sufficient continuous projects available internally or an external market for continuous
equipment and facilities).
Chapter 7. Conclusions and Opportunities for Further Investigation
Based on this work, various conclusions can be drawn regarding the technology described
here, and about the use of equipment-factored cost estimation in general.
7.1 Cost Advantages of Continuous Manufacturing Systems
For the model process, the continuous facility will only be cheaper at relatively high
production scales, ie. greater than 1000 tpy. This is at the high end of expected production
requirements, suggesting that without any optimization of the batch chemistry, continuous
should only be beneficial at the highest production volumes. Investment in continuous is
intrinsically more expensive at lower scales because unit operations cannot be consolidated,
process automation is more expensive, and equipment is more expensive on a cost/volume
basis. Continuous becomes favorable at higher scales because multiple trains become
required for the batch process, and investment costs for the batch system begin to scale
linearly with production scale.
These results should not imply a significant negative impact on the potential value of
continuous manufacturing systems. Instead, this work reiterates that to deliver continuous
systems that require a reduced capital investment, the switch to continuous must be
accompanied with innovations in the underlying chemistry. This could include alternative
synthetic pathways, consolidation of unit operations, accelerated processing times,
elimination of isolation steps, improvements to process yield, or the implementation of
lower-cost reactants. Value on the unit operation level will be driven by the feasibility of
implementing these improvements for continuous processing.

In additional to more efficient unit operations, continuous manufacturing systems are
expected to provide benefits at the system level. This was explored in some detail in this
analysis, but results were inconclusive. The greatest drivers for value on the system-level
are expected to be reduction in labor costs, an order-of magnitude decrease of in-process
inventory, and elimination of most ongoing costs associated with quality control. (Wilburn,
2010) Our system is expected to deliver an in-process inventory reduction of 70%.
However, the key driver for lower operating costs will be reduction in direct labor and in
costs associated with QC and product release. Based on the experience of operations
experts at Novartis, reductions in labor cost on the order of 50% seem possible. However, a
quantitative justification for this assumption could not be constructed. Until a functioning
commercial system is in place, these assumptions cannot be validated.
7.2 Robustness of Cost Estimates
This work is based on the premise that if process modeling could be performed in greater
detail, the resulting cost estimates would be more robust. The only way to truly confirm this
assumption would be to build the physical plant and compare each set of estimates with
validated cost figures. Technological and financial constraints make this impractical.
Therefore, it is impossible to determine whether the new estimates are truly more reliable.
This limitation is a fundamental drawback of new methodology for cost estimation in an
industry with a low clockspeed and slow iteration cycle. In this case, it is probably wisest to
rely on the indicator I have referred to as internal credibility. That is, if after review by a
cross-functional team of internal experts, there is a consensus that financial estimates were
generated in an appropriate manner, they should be accepted. Future projects should focus

on assembling the appropriate team of internal experts and communicating results and
methodology in a clear way so that they can be easily reviewed.
7.3 Utility of Cost Estimates
This thesis has proposed an alternative method equipment-factored cost estimation.
However, equipment-factored estimates remain attractive for because they require
relatively little upfront design work to construct. In future work it will be critical to identify a
cost modeling strategy that is appropriate for the task at hand. Should simple back of the
envelope cost estimates be needed, equipment-factored estimates could be constructed
using the scaling factors derived from this project. Alternately, a cost estimate could be
constructed using only a process simulation, derived scaling factors for the direct investment
costs, and consumption-based cost allocations for indirect cost areas. Either choice will
result in more credible estimates, but require relatively modest design work.
The newly proposed methodology, even if it is more robust, will require between 5x and 10x
the investment in design and modeling time due to the higher level of process design and
manual data entry required. This makes it poorly-suited for early conceptual-stage
estimation tasks. However, if estimates are require to support implementation of a specific
investment, preliminary design work will have to be done in any case, and it would be
reasonable to develop the process design and cost model concurrently. Similarly, if there
are other new technologies for which conventional cost factors do not seem to be
appropriate, revising the estimation methodology to reflect more in-depth design work is a
good strategy. In either case, it is important to balance the level of apparent robustness
with the effort required to produce these estimates.

7.4 Alternative Frameworks for Evaluating Investment Costs
Equipment-factored estimates and design-based estimates can both be used for the
purposes of initial cost estimation and budgeting. However, if the task at hand is to compare
two alternative technologies at a very early conceptual stage (ie. batch vs. continuous),
these estimates can often be misleading. Consider the following scenario.
Conventional wisdom at Novartis is that uncertainty for conceptual-stage estimates is at
least ±35%. Suppose this implies the true cost is a normal random variable with a mean of p
and a standard deviation of 0.175p. Consider cost estimates for two alternative facilities,
one of CHF 50M, one of CHF 40M. If we compare two estimates, Ci and C2, we see:
C1 = N(50,8.5)
C2 = N(40,7)
The difference between the two estimates can be thought of as economic benefit of one
versus the other:
B = C1 - C2
With an assumed correlation coefficient p between the two estimates, the benefit can be
expected to be distributed as follows:
B = N(10, ((8.5)2 + (7)2 - 120p )O.5)
Although the expected savings for the C2 investment are CHF 10M, the economic benefit is
uncertain, as illustrated in Figure 17. With relatively low estimated cost differences (10-20%)
high uncertainty in the underlying estimates (35% or more) and low correlation between the
two outcomes (unclear, but 0.5 seems like a reasonable high end estimate), it is challenging
to compare two model processes with any degree of accuracy.

The practical implication of this exercise is that relatively small estimated cost differences do
not rigorously prove that one investment is the superior option. Instead, these differences
suggest that one method is likely to be better, and that there is a potential economic benefit
associated with the option to use continuous processing. If two competing technologies are
to be evaluated against each other, it would be wise to consider an alternative framework
for evaluating this dilemma.
7.4.1 Option Valuation
One alternative for evaluating risky investment decisions is an option valuation model. This
model seeks to quantify the expected benefit from investment in a new project based on the
potential economic benefit and the probability of success. (McGrath & Nerkar, 2004) In the
previous example, assume the firm has the capability of implementing the C1 process, but
would have to invest to develop the capability of implementing the C2 process. In this case,
the value of the option to implement C2, V, is average value of the lower investment costs.
V = 1 - mn(C1 ,C2 )
I ran a simple Monte Carlo simulation for the probabilistic scenario described in the previous
section, yielding an option value of CHF 12M - CHF 10M for values of p ranging from 0 to 1.
The firm should be willing to pay around this value to develop the option to build a facility
with the C2 technology.
This type of option-based valuation is preferable to simply comparing equipment-factored
estimates because it takes into account the uncertainty in the underlying estimates and can
be directly related to development expenses. Future work that seeks to evaluate the
economic benefit of emerging continuous technology should incorporate these
considerations into the financial model.

7.4.2 Value of Potential Process Innovations
The process design and cost model described in this work can also be used to inform
decisions surrounding development of new continuous capabilities. There is optimism that
continuous processing will yield benefits through a host of potential process innovations.
These include reduction in the number of unit operations, process intensification, use of
cheaper reactants, and various other innovations.
In order to understand the relative impact of these potential innovations, I used the
segmented cost results to make a rough estimate of the impact of each innovation in the
context of the fully designed continuous system. As an example, to determine the impact of
eliminating a single unit operation, I found the average direct cost incurred by each unit
operation. Similarly, to determine the impact of an increase in yield, I took the value of 5%
of the primary raw material costs. Figure 18 shows the value of selected potential process
improvements in the context of the model continuous system.
While the exact value of each potential cost savings bears significant uncertainty, their
relative magnitude is instructive. Based on this analysis, dramatic changes in the cost
structure will only be achieved through significant improvements to the chemistry - more
efficient synthetic pathways, cheaper reactants, increased yields, or significant consolidation
of unit operations. There appears to be less economic value associated with thermal recycle
or waste reduction. These insights can be used to focus development efforts on continuous
capabilities that will provide the most value in their implementation.
7.5 Other Opportunities for Further Investigation
The models documented here could be expanded upon in a variety of ways. In the context
of continuous manufacturing, validation of the standard costs associated with individual cost

areas should be the main area of focus. Additionally, this study has raised a number of
questions concerning the operational capabilities of continuous systems. These areas should
be concurrently investigated alongside the ongoing design and implementation of
continuous systems.
Beyond these immediate applications, I see an opportunity to integrate modular design work
with feature-based cost estimation in other fields. The methodology documented here
could be repeated for batch pharmaceutical plants, and could also be extended other
capital-intensive industries. The capability to assemble quick, relatively accurate cost
estimates based on initial design work is probably most valuable to engineering firms or
other organizations that routinely construct such estimates.

Figure 1. Novartis TechOps' Strategic Vision
Operations
per orn v
Wnufacturn ugh
process innovation
rovement culture
bal brand supply model
Low COGS
2005 2010 Future

Figure 2. Process Model Structure
1 Process Simulation
6 PFDs
15 Modular P&IDs80+ Unique Instances

Figure 3. Design Element: Process Simulation

Figure 4. Design Element: Process Flow Diagram

Figure 5. Design Element: Piping & Instrumentation Diagram
UnitST (Connections to M ai)E (# of Dead End Flanges)U (Change in pipeldesigner/P&ID)AZ (T points)InstrumentsMotors
Wash

Figure 6. Existing Methodology for Cost Estimation
Eq-nt Tot5Ios
Primary Equipment Design = f(process model)
Primary Equipment Costs (PE) = f(primary equipment design, historical equipment costs)
Total Cost (TC) = f(primary equipment costs, scaling factors)
PrimaryEquipment
C CostsScaling0 s
(;tOrsactors

Figure 7. Proposed Methodology for Cost Estimation
PrimaryEquipment -
Design
ProcessSimulation
ProcessFlow-
Diagrams
P&lDs-
Plant*a-u
Laou
PrimarySEquipment-
Costs
nDirectCosts
Allocations
Primary Equipment Design = f(process model)
Process Simulation = f(process model)
Process Flow Diagrams = f(process model)
P&IDs = f(process model)
Plant Layout = f(process model)
Additional Direct Costs = f(process simulation, process flow diagrams, P&lDs)
Indirect Costs Allocations = f(process simulation, plant layout)
Primary Equipment Costs = f(primary equipment design, historical equipment costs)
Total Cost Estimate = f(primary equipment costs, additional direct costs, indirect cost
allocations)

Figure 8. Investment Cost Scaling With Installed Capacity
0
UU
E * Batch
>_ m Continuous
0 500 1000 1500
Installed Capacity (tpy product)
0 .r
** Ik * Batch
E__ m Continuous
"" 0 500 1000 1500
Installed Capacity (tpy product)

Figure 9. Direct Investment Costs for Continuous Plant
-$-Primary Equipment
--- Secondary Equipment
-*-Installation
-!O-Piping
-)(--Instrumentation
-- Specialty Instrumentation
-+-Engineering
-Qualification
0 500 1000 1500
Installed Capacity (tpy product)

Figure 10. Other Investment Costs for Continuous Plant
U-sr-Central Installations (CA3)
--- Infrastructure (CA5)
-4-Building (CA6)
--+-Filtration & Drying
0 500 1000 1500
Installed Capacity (tpy product)

Figure 11. Total Costs for Continuous Plant
-- "Fixed" ContininuousInvestment Cost
-- "Variable" ContinuousInvestment Cost
--- Filtration & Drying
0 500 1000 1500
Installed Capacity (tpy product)

Figure 12. Direct Investment Costs by Unit Operation
Ir-iII l'11
(~. 0
I0 Batch
* Continuous

Figure 13. Relative Costs and Scaling Factors for Continuous Plant
% of Total
Continuous Continuous Continuous Standard1400 tpy 700 tpy 350 tpy Batch
Main Equipment (CA1) 16% 15% 16% 16%
Installation (CA2) 33% 35% 39% 32%
Central Installations (CA3) 15% 11% 7% 12%
Engineering (CA4) 12% 14% 17% 11%
Infrastructure (CA5) 8% 8% 7% 11%
Building (CA6) 10% 10% 9% 13%
Qualification (CA7) 6% 6% 7% 4%
Scaling Factors
Continuous Continuous Continuous Standard1400tpy 700 tpy 350 tpy Batch
Main Equipment (CA1) 100% 100% 100% 120%
Installation (CA2) 207% 231% 246% 206%
Central Installations (CA3) 93% 73% 42% 78%
Engineering (CA4) 20% 24% 27% 19%
infrastructure (CA5) 11% 10% 9% 15%
Building (CA6) 12% 12% 10% 16%
Qualification (CA7) 7% 7% 8% 5%

Figure 14. Running Costs for Batch vs. Continuous Production
Batch Cost Continuous Cost Savings
Operating Cost - Raw Materials
ReactiveC tive CHF 25,090,200 CHF 27,628,636 -CHF 2,538,436
Compounds
Catalyst CHF 26,401,150 CHF 20,250,288 CHF 6,150,862
Solvents CHF 15,251,171 CHF 15,913,793 -CHF 662,622
Operating Cost - Waste Treatment
Reaction CHF 0 CHF 0 CHF 0
Isolation CHF 1,173,958 CHF 1,211,523 -CHF 37,565
Operating Cost - Heating & Cooling
Reaction CHF 51,862 CHF 48,037 CHF 3,825
Isolation CHF 109,021 CHF 205,723 -CHF 96,702
Note: Values have been disguised

Figure 15. Low Utilization Performance
Minimum Annual Product Throughput (base = 700 tpy product)
Batch Continuous
Reaction 1 1 batch (1.4 t/year) 10% of max (70 t/y)
Reaction 2 1 batch (1.4 t/year) 10% of max (70 t/y)
Quench 1 batch (1.4 t/year) <5% of max (35 t/y)
Extraction 1 batch (1.4 t/year) <5% of max (35 t/y)
Solvent Exchange 1 batch (1.4 t/year) 10% of max (70 t/y)
Crystallization 1 batch (1.4 t/year) 33% of max (233 t/y)
Filtration & Drying 1 batch (1.4 t/year) 1 batch (1.4 t/y)
Continuous System Performance
Product Demand 50 tpy 100 tpy 150 tpy 200 tpy
Optimal Campaigns/year 2 2 2 2
Avg. Product Inventory 10.3 15.3 15.4 10.6
(tons)

Figure 16. Operational Reliability
50
40
a30
20
0 5 10 15
Number of Linked Steps
0-- No Buffers
0
-*-MultipleBuffers
0 20 40
Unplanned Stops/year

Figure 17. Relative Economic Benefit of Batch vs Continuous
M0
00
4-'s
Up = 0.1
2- A p = 0.5
Op = 0.95
-20 -10 0 10 20 30 40
Relative Economic Benefit (CHF M)

Figure 18. Cost Savings Associated With Various Process Improvements
Process Innovation CapEx Savings OpEx Savings
Enable use of cheaper reactant - CHF 12M/y
Increase reaction yield 5% - CHF 4M/y
Eliminate filtration and drying CHF 8M CHF 3M/y
Reduce catalyst consumption by 10% - CHF 3M/y
Develop more efficient solvent exchange CHF 2M CHF 2M/y
Eliminate single unit operation CHF 2M
Consolidate extraction steps CHF 1M
Reduce aqueous waste 25% - CHF 0.10M/y
Reduce energy use 25% - CHF 0.05M/y
Note: Values have been disguised

Bibliography
Christensen, P., & Dysert, L. (2005). Cost Estimate Classification System - As Applied inEngineering, Procurement, and Construction for the Process Industries. Morgantown, WV:AACE International.
Chun-Te Lin, J., & Livingston, A. (2007). Nanofiltration membrane cascade for continuoussolvent exchange. Chemical Engineering Science, 2728 - 2736.
Dysert, L. (2003). Sharpen Your Cost Estimating Skills. Cost Engineering, 22-30.
Fletcher, N. (2010). Turn Batch to Continuous Processing. Manufacturing Chemist, 24-26.
Hessel, V. (2009). Novel Process Windows - Gate to Maximizing Process Intensification viaFlow Chemistry. Chemical Engineering Technology, 1655-1681.
Humphreys, K. (2005). Project and Cost Engineers' Handbook. New York: Dekker.
Hwang, B. (2006). Development of a Performance Measurement System for the Delivery ofPharmaceutical Capital Facility Projects. Austin, TX: University of Texas at Austin.
lerapetritou, M., & Pistikopoulos, E. (1996). Batch Plant Design and Operations underUncertainty. Ind. Eng. Chem. Res. , 772-787.
Kirschneck, D. (2010, January). Manufacturing efficiency by Modular Multi-purpose Plants.Chemistry Today, pp. 55-58.
Kirschneck, D., & Tekautz, G. (2007). Integration of a Microreactor in an Existing ProductionPlant. Chemical Engineering Technology, 305-308.
Lakshman, J., Cao, Y., Kowalski, J., & Serajuddin, A. (2008). Application of Melt Extrusion inthe Development of a Physically and Chemically Stable High-Energy Amorphous SolidDispersion of a Poorly Water-Soluble Drug. Molecular Pharmaceutics, 994-1002.
Lawton, S., Steele, G., & Shering, P. (2009). Continuous Crystallization of PharmaceuticalsUsing a Continuous Oscillatory Baffled Crystallizer. Organic Process Research & Development
, 1357-1363.
McGrath, R., & Nerkar, A. (2004). Real Options Resoning and a New Look at the R&DInvestment Strategies of Pharmaceutical Firms. Strategic Management Journal, 1-21.
Novartis. (2010). Continuous Manufacturing Factsheet (Internal Document).
Perry, R., & Green, D. (1997). Chemical Engineer's Handbook, Sevent Ed. Columbus: McGraw-Hill.
Roberge, D., Ducry, L., Bieler, N., & Cretton, P. (2005). Microreactor Technology: ARevolution for the Fine Chemical and Pharmaceutical Industries. Chemical EngineeringTechnology, 318-323.
Roberge, D., Zimmermann, B., Rainone, F., Gottsponer, M., & Eyholzer, M. (2008).Microreactor Technology and Continuous Processes in the Fine Chemical and PharmaceuticalIndustry: Is the Revolution Underway? Organic Process Research & Development, 905-910.
Roy, R. (2003). Cost Engineering: Why, What, and How. Cranfield University: DecisionEngineering Report Series.

Schwalbe, T., Autze, V., Hohmann, M., & Stirner, W. (2004). Novel Innovation Systems for aCellular Approach to Continuous Process Chemistry from Discovery to Market. OrganicProcess Research & Development, 440-454.
Sheth, J., Qin, Y., Sirkar, K., & Baltzis, B. (2003). Nanofiltration-based diafiltration process forsolvent exchange in pharmaceutical manufacturing. Journal of Membrane Science, 251-261.
Thomas, H. (2008). Batch to Continuous: Coming of Age. The Chemical Engineer Today, 38-40.
Thomas, H. (2006). Transforming the Pharma Industry: Lean Thinking Applied ToPharmaceutical Manufacturing. Retrieved June 2010, from Foster Wheeler Website:http://www.fwc.com/publications/
Wilburn, K. (2010). Business Case for Continuous Manufactruing of Pharmaceuticals.Cambridge: Massachusetts Institute of Technology.