department of agriculture, fisheries and food forest … · department of agriculture, fisheries...
TRANSCRIPT

Department of Agriculture, Fisheries and Food Forest Service
Forestry Schemes Mapping Standards
25th May, 2011

Forestry Schemes Mapping Standards
1 General ....................................................................................................................................................................3
2 Area and Boundary Mapping Cross Checking ........................................................................................................3
3 Maps Required for Approval and Grant Aid ...........................................................................................................3
3.1 Pre-Approval Map Requirements (Form 1) .....................................................................................................3
3.2 Maps Required for Grant Claims (Form 2 and Form 3) ..................................................................................4
3.3 Map Formats - Paper and Electronic Submission of Certified Species Maps..................................................4
3.3.1 Paper Submission - OSi Map Originals or Composites............................................................................4
3.3.2 iNET.........................................................................................................................................................4
3.3.2.1 Form 1, Pre-Approval Online Submissions...........................................................................................4
3.3.2.2 Paper Form 2 and Form 3 Submissions (Hardcopy Outputs from iNET) .............................................5
3.4 Certified Species Map......................................................................................................................................5
3.4.1 Use of Standardised Symbols, Colours and Text.....................................................................................5
3.4.2 Mapping Plantation and Plot Boundaries .................................................................................................6
3.4.3 Compiling the Certified Species Map plot table.......................................................................................6
3.4.3.1 Plot No. (Plot Number) ............................................................................................................7
3.4.3.2 Area (ha)(Claimed Area) .........................................................................................................7
3.4.3.3 GPC (Grant and Premium Category).......................................................................................7
3.4.3.4 LUT (Land Use Type) .............................................................................................................8
3.4.3.5 Spp. (Approved Species Planted – Species Abbreviations).....................................................8
3.4.3.6 No. of Trees (000s) (Number of trees planted) (Form 2 only).................................................9
3.4.3.7 Spp. Area (ha) (Species Area) .................................................................................................9
3.4.3.8 Mix. Type (Mixture Type).....................................................................................................10
3.4.3.9 P./Yr. (Planting Year) (Forms 2 and 3 only)..........................................................................10
3.4.3.10 Est. YC (Estimated Yield Class)..........................................................................................10
3.4.3.11 Exc. Type (Exclusion Type) ................................................................................................11
3.4.3.12 Certified Species Map Plot Table - A Worked Example .....................................................12
3.4.3.13 Updating Plot Information (Form 2, Form 3 and Management plans) ................................13
3.5 Fencing Map ..................................................................................................................................................16
3.6 Biodiversity Map (BIO Map).........................................................................................................................19
3.6.1 Mapping and Recording ABE Features..................................................................................................20
3.7 Forest Road/Track Mapping Conventions .....................................................................................................23
3.7.1 General ...................................................................................................................................................23
3.7.2 Forest Road Scheme Mapping Requirements.........................................................................................23
3.8 Woodland Improvement Scheme (WIS) Mapping Conventions (Tending and Thinning of Broadleaves). ..27
3.9 Reconstitution of Woodlands Scheme Mapping Conventions.......................................................................30
3.10 Summary of Mapping Requirements by Scheme Type...............................................................................33
Appendix A – Measuring Distance and Area Using Paper Maps (1:5,000 Scale)...............................................34
A.1 Verifying Map Scale .....................................................................................................................................34
A.2 Measuring Distance.......................................................................................................................................34
A.3 Measuring Area.............................................................................................................................................34

Forestry Schemes Mapping Standards
3
Forestry Schemes Mapping Standards 1 General This document sets out the procedures and standards required when compiling and submitting maps in support of approval and grant aid. This document is subject to change and will be revised and updated where necessary following implementation of new standards and the introduction and/or modification of the Department’s Afforestation and associated Support Schemes. Registered Foresters should ensure that ground survey and boundary information is compiled and recorded correctly. Maps and plot information that do not comply with the standards outlined in this document will be returned for correction to the Registered Forester. 2 Area and Boundary Mapping Cross Checking The Certified Species Map submitted for grant aid for the Departments afforestation schemes will be digitised into the DAFF area payments database. This digitised map will represent the defining area in the calculation and payment of forestry claims. If the calculation of area from these procedures displays any discrepancies from the claimed area it may be necessary to adjust the amount of the premium and grant and apply a penalty. With effect from the 2009 Single Farm Payment (SPS) year, land that was on a 2008 SPS application form that gave rise to an SPS payment and is planted after 01/01/2009 is eligible to draw down SPS payments. As such these planted lands must conform to cross compliance rules and may be subject to SPS eligibility inspections. Where discrepancies from the claimed area are discovered following a Departmental inspection it may be necessary to adjust the amount of the premium and grant aid paid and apply a penalty. Full details regarding penalties applicable for over declaration of area and appeals procedures are available from the Department. 3 Maps Required for Approval and Grant Aid The following section describes the maps and associated mapping standards required by the Department to assess applications for approval and facilitate payment of grant aid. 3.1 Pre-Approval Map Requirements (Form 1) The following maps are required: • Certified Species Map • Fencing Map • Biodiversity Map or BIO Map These maps must be drawn on a 1:5,000 colour aerial photograph printed from the Department’s online mapping system, iFORIS Internet (iNET). Alternatively an original composite Ordnance Survey map at a scale of 1:5,000 (based on the OSi 1:5,000 National Raster product) may be submitted. A Fencing Map is also required to the record the length and location of proposed fencing for the application where this operation is proposed.

Forestry Schemes Mapping Standards
4
3.2 Maps Required for Grant Claims (Form 2 and Form 3) The following maps are required: • Certified Species Map • Fencing Map • Biodiversity Map or BIO Map The Certified Species Map must record accurately all areas and plot boundaries as surveyed on the ground. Detailed mapping conventions are outlined below and must be strictly followed. The Form 2 and 3 BIO Map must record any revised details of features if applicable (e.g. cultivation type, additional silt traps or firelines installed). The Fencing Map is required to record the length and location of all erected fencing being claimed as part of the Form 2 application. 3.3 Map Formats - Paper and Electronic Submission of Certified Species Maps 3.3.1 Paper Submission - OSi Map Originals or Composites The Department strongly encourages the use of iNET for the submission of pre-approval applications. In situations where a Registered Forester does not use or does not have access to iNET, a hard copy Certified Species Map must be submitted where an applicant seeks approval and payment of a grant (see also Section 3.10). In this case, Registered foresters must submit an original or composite Ordnance Survey paper map at a scale of 1:5,000 (based on OSi 1:5,000 National Raster product). All paper map submissions must be in A4 format. Two or more A4 maps should be submitted where the size of the application is such that it spans more than the area covered by a single A4 Ordnance Survey map. All paper A4 maps submitted should include a sequence number where applicable(e.g. 1 of 3, 2 of 3, 3 of 3 etc). See Appendix A for notes on distance and area calculations using 1:5,000 scale paper maps 3.3.2 iNET 3.3.2.1 Form 1, Pre-Approval Online Submissions iNET has been developed by the Forest Service to aid in the calculation of area and preparation of digital and hardcopy maps by Registered Foresters. The system has been developed for Registered Foresters who have access to broadband (i.e. 512 kb or greater internet connection speed. Lower connection speeds will vary in performance). iNET can be used to map and submit new pre-approval (Form 1) applications online for the Afforestation, FEPS and Forest Roads Schemes. In addition, iNET can be used to track online the progress of any pre-approval forestry application submitted by a registered user. iNET provides access for Registered Foresters to OSi map data including colour ortho-photography for the entire country. Environmental Statutory Designations and other relevant spatial or mapping datasets to assist with forestry pre-approval applications are also available within iNET.
Registered Foresters can register to use iNET by logging onto the Departments website at www.agriculture.ie. Selecting the “Click here for Department’s Online Services” button will lead users through a number of simple steps to register to use the applicationn
Registered Foresters must have received training by DAFF or other approved training prior to using the iNET online application system. A user manual outlining the steps for submitting Afforestation, FEPS and Forest Roads applications is available from the Department’s website.

Forestry Schemes Mapping Standards
5
Foresters who submit pre-approval applications using iNET must also attach a Biodiversity Map (BIO Map) and Fencing Map to their grant application posted to the Forest Service. These maps should be printed from iNET and annotated as per the instructions listed in Sections 3.5 and 3.6. 3.3.2.2 Paper Form 2 and Form 3 Submissions (Hardcopy Outputs from iNET) In future iNET will be developed to allow electronic submission of Form 2 and Form 3 maps as well as submissions for the other Support Schemes administered by DAFF. In the interim, Form 2 and Form 3 maps may be digitised using the Departments iNET system (plot boundaries redlined, plot areas calculated, plot tables generated etc.). Form 2 and 3 hard copy maps outputs prepared using iNET must accord with the standards outlined in this document. The printed hard copy maps should be sent to the Department along will all other relevant forms and documents required for the scheme in question (e.g. signed Form 2/3s, folios, provenance declaration forms etc.). 3.4 Certified Species Map The Certified Species Map for Form 1, 2 and 3 maps should indicate clearly the location of all plot boundaries comprising the application. The Certified Species Map will be used to digitise boundaries of the plantation into the Departments mapping system. Examples of Certified Species, Fencing and Biodiversity Maps (BIO Map) prepared using a 1:5,000 OSi A4 map and an orthophoto map printed from the Departments iNET system are presented at the end of section 3.4. In these examples, the maps have been printed in hard copy and then subsequently annotated by hand to include plot boundaries and other standardised symbols, colours and text. As discussed already in Section 3.3.2.2 Registered Foresters may also use the redlining functionality available within iNET to prepare hard copy Certified Species, Fencing and BIO Maps for Form 2 and 3 applications. Hardcopy maps printed from iNET must also conform to the mapping standards outlined in this document. 3.4.1 Use of Standardised Symbols, Colours and Text The mapping symbols and symbol colours illustrated in the example maps provided at the end of section 3.4, 3.5 and 3.6 must be used for all hard copy maps submitted to the Department. All text, symbols and map annotations used on hard copy maps must be legible and easy to differentiate. Any relevant information which will facilitate the inspector in evaluating the proposal for grant aid must be included in the remarks section of the map legend. Registered Foresters must ensure that the BIO Map identifies the access routes/points to and from the proposed planting area using the appropriate access symbol. This will aid the inspector to gain access to the site should a field inspection be required. Applicants and Registered Foresters should also be aware that maps submitted in support of grant aid applications may be forwarded to relevant referral bodies (NPWS, Local Authorities, An Taisce, Fáilte Ireland) and/or may be made available to the public or other interested parties through the normal public consultation process or via freedom of information requests. Template Certified Species, Fencing and BIO Map legends are available from the Departments Web site at (http://www.agriculture.gov.ie/forestservice/). These template legends provide the format for the map legends and associated tables which must be used when submitting maps to the Department. Failure to observe Forest Service mapping conventions which require the use of standardised, legible mapping symbols, colours and text will result in a request for a new compliant map(s) and may delay the assessment and evaluation of the proposal for grant aid.

Forestry Schemes Mapping Standards
6
3.4.2 Mapping Plantation and Plot Boundaries Registered Foresters must certify all boundaries and areas submitted for approval and grant aid. A thin red line is required to delineate all plot and plantation boundaries. Plots must be numbered sequentially in red. The rules regarding the placement of plot lines are summarised below:
• If the boundary of a plot is a visible feature on the orthophoto map or OSi map (e.g. hedgerow, field boundary, ridgeline) the red line is drawn to the centre of this feature. If the feature also happens to be an exclusion then the red line must be drawn to the edge of this feature (e.g. existing woodland, lake or water body).
• The exact position of undefined boundaries must be measured on the ground and adjusted for
slope. The use of GPS survey points can help locate the true position of undefined boundaries (e.g. internal and plot external boundaries See also below). Any visible features on the colour photographs should be utilised when surveying boundaries.
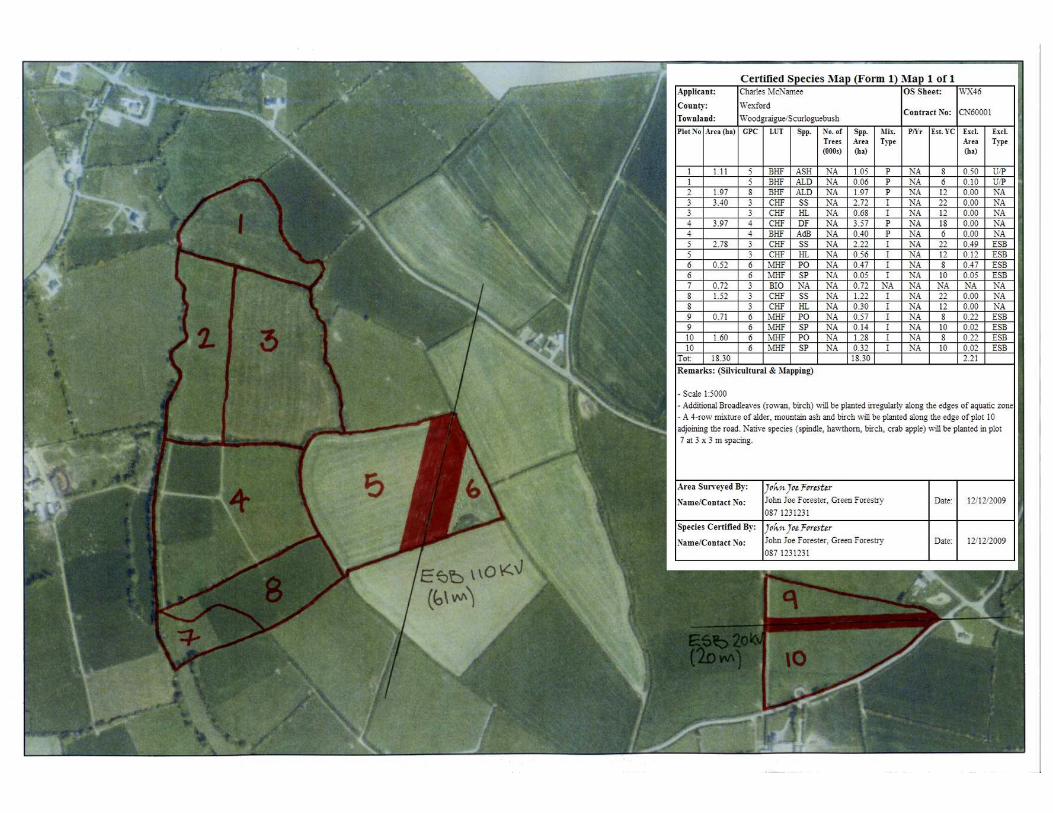
Undefined boundaries All undefined external boundaries must be surveyed on the ground using a differential Global Positioning System (DGPS) or mapped by a qualified surveyor. In general, the exact location of an undefined boundary will not be visible on either the orthophoto map or the 1:5000 Scale OSi map. In situations where an external undefined boundary represents a straight line between two clearly defined landmarks visible on the hard copy maps, for example the corners of a field or a road junction, the undefined boundary can be plotted and the map annotated without recourse to the use of GPS technologies. Use of Differential Global Positioning Systems (DGPS) Operators who are trained in the use of DGPS, accuracy of +/- 2 metres, can use this technology to prepare maps and calculate area by electronic means. If using DGPS the undefined boundaries making up the application must be walked and mapped using the DGPS (i.e. along the edge of the plantation boundary at the fence line). Capturing an offset(s) using a DGPS may is also permitted when surveying undefined boundaries using DGPS. Registered Foresters may submit paper maps at (1:5000 scale) generated using DGPS, which will be digitised into the Departments mapping database. Easting and Northing National Grid (IG) coordinates can be included on the map for undefined boundaries to facilitate digitising. iNET also provides a facility for displaying DGPS guide points collected in the field (see also the iNET user manual available from the Departments website). 3.4.3 Compiling the Certified Species Map plot table In addition to mapping plantation and plot boundaries on the Certified Species Map, a plot table must be compiled and attached to the hard copy map submitted in support of scheme approval (Form 1) and grant aid instalments (Form 2, Form 3). The plot table summarises the area and species information for each of the plots making up the proposal. An example plot table is available at (http://www.agriculture.gov.ie/forestservice/). This template should be used when preparing Certified Species Maps. An example of a completed plot table and associated fields is presented in the figure below (see also the completed Certified Species Map at the end of section 3.4). A worked example explaining how to deal with types of exclusion areas ineligible (plots 1, 7 and 8) for grant aid is also provided below.

Forestry Schemes Mapping Standards
7
Note: Values for “P./Yr.” and “No. of Trees (000)” fields are required for Certified Species Maps submitted with Form 2 and 3 applications only. 3.4.3.1 Plot No. (Plot Number) The Forestry Schemes documents submitted under the National Development Plan 2007-2013 provides information on the minimum areas and widths for conifer and broadleaf plantations and plots. All areas of plot size must be assigned a sequential plot number. One plot can only have one GPC. Note: When mapping plot boundaries on the Certified Species Map any proposed planting area split in two by a county boundary, townland boundary, DED boundary, an ESB line or other exclusion, must be attributed using different plot numbers and each of the two plots created must be assigned sequential plot numbers (i.e. each plot must have a unique plot number). 3.4.3.2 Area (ha)(Claimed Area) Claimed area refers to the area for which an applicant has applied for a pre-approval application, forestry grant or premium payment. All area values in the Certified Species Map plot table, including claimed area, must be reported to a maximum of 2 decimal places (e.g. 2.45, 1.77). Registered Foresters must ensure that the total area claimed is equal to the sum of the area of the individual plot areas. The claimed area does not include areas unsuitable for grant or premium payment. The claimed area must not incorporate ineligible (non granted aided) exclusions (see also Section 3.4.3.12). See also Appendix A for notes on distance and area calculations using 1:5,000 scale paper maps 3.4.3.3 GPC (Grant and Premium Category) The GPC is the category which best describes the profile of the plot(s) which will be used to determine premium and grant payment rate in the relevant scheme. The Certified Species Map for all schemes must reflect at plot level the area claimed for grant aid.

Forestry Schemes Mapping Standards
8
GPC No. Land Classification GPC Definition GPC 1 Unenclosed lands Unenclosed Land GPC 2 Enclosed/improved lands Sitka spruce/lodgepole pine - Note a plantation comprised only of
this GPC is not eligible for grant aid as it does not conform to the plantation rules of the Afforestation/FEPS Schemes. May also include additional broadleaves (AdB).
GPC 3 Enclosed/improved lands 10% diverse mix – A GCP3 plot comprises Sitka spruce or lodgepole pine and a suitable diverse conifer (see Section 3.4.3.5 below). The diverse conifer content must be at least 10%. This 10% mix can be made up of trees intimately mixed through the plantation, trees planted in groups through the plantation or a combination of both where silviculturally compatible with the main species. The diverse conifer species in this intimate mix may be substituted by suitable broadleaves, including birch, planted in groups where soils are suitable. Broadleaves adjacent to roads and watercourses may also form part of this 10%. (These broadleaves can not be used to satisfy rule 1 in plantations greater than 3 ha).
GPC 4 Enclosed/improved lands Diverse - This plot is made up of an acceptable conifer species (see Section 3.4.3.5 below) other than Sitka spruce and lodgepole pine. May also include AdB.
GPC 5 Enclosed/improved lands Broadleaf (Non Oak/Beech) - This plot is made up of acceptable broadleaves other than oak and beech (see Section 3.4.3.5 below).. May also include AdB.
GPC 6 Enclosed/improved lands Oak - This GCP is made up of either pure oak or a oak/broadleaf/ conifer mix planted at 3300 stems per hectare. On large sites where additional shelter is required a nurse species may be introduced a long as there are at least 10 links of oak between each nurse. For species diversity of pure sites, up to 5% of planted trees may contain other species intimately mixed or planted in groups.
GPC 7 Enclosed/improved lands Beech - This GCP is made up of either pure beech or a beech/ broadleaf/conifer mix planted at 3300 stems per hectare. On large sites where addition shelter is required a nurse species may be introduced a long as there are at least 10 links of oak between each nurse. For species diversity of pure sites, up to 5% of planted trees may contain other species intimately mixed or planted in groups.
GPC 8 Enclosed/improved lands Alder - This plot is made up of pure alder (2500 stems per hectare).
3.4.3.4 LUT (Land Use Type) Each plot in the plot table must have one of eight broad land use type categories assigned to it based on the definitions identified in the table below. Land Use Type Definition GPC Definition CHF Coniferous High Forest GPC’s 1, 2, 3 and 4. MHF Mixed High Forest This includes all broadleaved / conifer nurse
mixtures in GPC’s 6 and 7. BHF Broadleaved High Forest Broadleaved GPC’s 5, 6 and 7 where plots are
planted pure. BURNED Burned LUT assigned to areas damaged by fire. BLOWN Blown LUT assigned to areas damaged by wind. FELLED Felled LUT assigned to felled areas. BIO Biodiversity Denotes area of biodiversity of plot size. BCF Broadleaved Coppice Forest Pilot grant aid sites where coppicing is carried
out i.e. willow.
3.4.3.5 Spp. (Approved Species Planted – Species Abbreviations) The main species by area must be listed in the plot table for every plot. All broadleaves not of plot size or minimum width must have an area recorded against them in the species label and recorded as

Forestry Schemes Mapping Standards
9
“Additional Broadleaves” (AdB) per plot. A list of approved conifer and broadleaf species, their botanic names and associated abbreviations are listed in the tables below. Conifer Species Botanic name Abbreviation Lawson cypress Chamaecyparis lawsoniana LC Leyland cypress Cupressocyparis leylandii LEC Monterey cypress Cupressus macrocarpa MC Western Hemlock Tsuga heterophylla WH European Larch Larix decidua EL Hybrid Larch Larix eurolepis HL Douglas Fir Pseudotsuga menziesii DF Grand Fir Abies grandis GF Austrian pine Pinus nigra (var. nigra) AP Corsican pine Pinus nigra (var. maritima) CP Lodgepole pine Pinus contorta (North Coastal) LPNC Lodgepole pine Pinus contorta (South Coastal) LPSC Monterey pine Pinus radiata MP Scots pine Pinus sylvestris SP Norway spruce Picea abies NS Serbian spruce Picea omorika SES Sitka spruce Picea sitchensis SS Western Red Cedar Thuja plicata WRC Coast Redwood Sequoia sempervirons CR Other conifer OC Broadleaf Species Botanic name Abbreviation Common alder Alnus glutinosa ALD Ash Fraxinus excelsior ASH Beech Fagus sylvatica BE Southern beech Nothofagus procera / N. oblique SBE Cherry Prunus avium CH Spanish (Sweet) chestnut Castanea sativa SC Lime Tilea cordata / T.platyphllos LIM Norway maple Acer platanoides NM Sycamore Acer pseudoplatanus SYC Pedunculate oak Quercus robur PO Sessile oak Quercus petraea SO Red oak Quercus rubra RO Other General Abbreviations Additional Broadleaves - AdB Scrub Scrub Scrub None No species None
3.4.3.6 No. of Trees (000s) (Number of trees planted) (Form 2 only) In the case of maps supporting Form 2 applications, the total number of trees planted in each plot must be recorded by species in the plot table. Provenance declarations forms submitted with the Form 2 application must support number of trees planted and listed in the Plot table. 3.4.3.7 Spp. Area (ha) (Species Area) All species listed in the plot table must have an area associated with them. Species with the largest area should be recorded first. In broadleaved/conifer nurse mixtures the broadleaved species will be recorded first as this species will form the main species in the final crop. Where broadleaved mixtures are planted the main species by area will be recorded first.
Forestry Schemes Mapping Standards
10
Species in Mixture Canopy Area Breakdown Pattern Oak/Conifer nurse species 90% Oak and 10% Conifer nurse 10 rows of oak and 1 nurse
line Beech/ Conifer nurse species 90% Beech and 10% Conifer nurse 10 rows of oak and 1 nurse
line Beech / Conifer nurse species (spacing pre-2009)
67 % Beech 33 % Conifer nurse species Enter equivalent area in Ha
2 rows of Beech and 1 row of conifer nurse
Oak / Conifer nurse species (spacing pre-2009)
50 % Oak 50 % Conifer nurse species Enter equivalent area in Ha
1 row of Oak and 1 row of Conifer nurse
Other mixtures Record area associated with canopy 3.4.3.8 Mix. Type (Mixture Type) Species mixture type codes, their associated definitions and examples of species mixtures that should be used to populate the Mixture Type field in the plot table submitted with the certified species map are provided in the table below. Mixture type Definition Examples ‘R’ = Row Where nurse species planted in rows/
lines PO&BI, PO&ALD, PO&SP, PO&EL, BE&EL, BE&SP
‘I’ =Intimate Where nurse or second species not planted in rows but planted evenly throughout the plot.
10% Diverse SS&HL. However sometimes this mixture will have HL planted in Groups.
‘G’ = Group Where trees are planted in “small” groups but are less than plot size of 30X40 metres
Additional broadleaves or where HL planted in groups in 10 % Diverse
‘P’ = Pure All plots where there is only one main species
3.4.3.9 P./Yr. (Planting Year) (Forms 2 and 3 only) Planting year is defined as the year in which the first growing season occurs. For example a tree planted in February 2009 will have a planting year of 2009. A tree planted in November 2009 will have a planting year of 2010 and not 2009. In both examples trees will grow during the 2010 growing season. Note that for administrative reasons the annual planting programme returns will continue to be based on the total area submitted for grant payment (based on the contract works completion date) in any given year. 3.4.3.10 Est. YC (Estimated Yield Class) Registered Foresters should estimate Yield Class (i.e. m3/ha/year) for each species. Values for estimated Yield Class should be realistic and should be based on an assessment of the site to be planted (e.g. soil fertility, exposure, dominant vegetation etc.) and knowledge of the same species growing on geographically adjacent and similar site types. 3.4.3.11 Exc. Area (ha) (Exclusion area hectares) Any exclusion area(s) which result in the gross area be being reduced to determine the claimed area must be recorded on the plot table (e.g. ABE areas greater that Afforestation Scheme thresholds). The Exclusion Abbreviation table below identifies the type of exclusion areas for which exclusion areas must be recorded against each plot.

Forestry Schemes Mapping Standards
11
Exclusion Abbreviations Exclusion Area Description ESB Power line corridors (10 – 400 kV) GAS Gas line U/P Unplantable areas
Shallow, rocky soils Rock Rock and scree
Water Aquatic zones (area occupied by lake/river) P-Forest Plantation Forest. (Conifer High Forest and
Broadleaf High Forest – this includes newly planted areas with conventional stocking densities.)
N-Forest Non Plantation forest Building Dwelling house/associated building setback
area ROW Rights of way held by third party Turb Areas with turbary rights held by a third party Graz Areas with grazing rights held by a third party W-Mains Major water mains Road Public road Other Other exclusion Scrub Scrub
The example plot table presented in Section 3.4.3.12 illustrates how the areas for two different exclusions types (ESB and unplantable areas) are recorded. The reader is referred to Chapter 7 of the Forest Schemes Manual for instances where certain types of exclusions may be eligible for premium and grant payment. 3.4.3.11 Exc. Type (Exclusion Type) Any relevant exclusions which resulted in the claimed area being reduced must be recorded along with an associated area in the Certified Species Map plot table. Where an area proposed for planting is split by an ESB line or other exclusion such as a gas pipe line, the area must be attributed different plot numbers either side of the exclusions (see also Section 3.4.3.12 for an example of mapping an ESB corridor exclusion). In the case of ESB exclusions, the Department will confirm in writing a letter stating the area affected by the power line and the applicant can apply to the ESB directly for compensation. A table of corridor widths by ESB power line voltage is included below. Power Line Type Corridor Width (centred) Low voltage (230/400V) None (clearance from branches/tree tops only) 10 kV and 38 kV 20 m 110 kV 61 m 220 kV 68 m 400 kV 74 m Note: All trees must be outside their falling distances from line support structures The reader is referred to Chapter 7 and 8 of the Forestry Schemes Manual for further information regarding setback/corridor width conventions for various constraints such as public roads, dwelling houses, gas pipelines, wind turbines etc. Exclusion areas that are eligible for grant and premiums and satisfy the 15% ABE criteria or (18-20% ABE in the case of FEPS) should not be recorded as an exclusion or exclusion type e.g. archaeological sites and their exclusions zones. Features that may be incorporated as part of the ABE but are not subject to grant aid or to premium should be excluded from the plot area.

Forestry Schemes Mapping Standards
12
3.4.3.12 Certified Species Map Plot Table - A Worked Example The table presented below provides an example of how the plot table of a Certified Species Map should be structured. The worked examples for Plots 1 and 2 show how two different types of exclusions (unplantable areas, ESB power line exclusions) should be treated. Plot 1 – Unplantable/Unmappable Exclusion Example The gross area of plot 1 when first surveyed is 1.17 ha. However, following the field survey of the site by the registered forester a number of smaller unplantable and unmappable areas were found scattered across the plot which amount to a total 0.60 hectares. The area claimed for grant and/or premium must not include ineligible exclusions which can easily be identified on the ground e.g. rock outcrops and/or unplantable ground. If it is not possible to map ineligible exclusion areas, the claimed area must be adjusted and the associated exclusion area noted in the plot table. The area submitted for approval or grant payment is therefore 1.11 ha and recorded as per the table below. The unplantable exclusions associated with the plot species, 0.50 ha for ash and 0.10 ha for alder, are also recorded in the plot table
Plots 5 and 6 – ESB exclusion Both plots 5 (2.78 ha) and 6 (0.52 ha) are separated by a non-grant aided power line corridor. As per mapping conventions both plots are mapped to the edge of the non-grant aided corridor and numbered separately. As the area calculated does not include the corridor the claimed area is not reduced. However in order to determine the area for ESB compensation, the area of the corridor is recorded in the plot table against the species planted in the two plots. Thus, the total corridor area and payable compensation is 0.61 ha for plot 5 and 0.52 ha for plot 6.
A complete example of a Plot table including exclusion examples is provided below.

Forestry Schemes Mapping Standards
13
Note: Values for “P/Yr” and “No of Trees” fields are required for maps submitted with Form 2 and 3 applications only. NA should be used to fill in the plot table in all situations where information required is not applicable. 3.4.3.13 Updating Plot Information (Form 2, Form 3 and Management plans) Any area or species changes that may have occurred in the in plantation either at Form 2 or Form 3 stage must be reflected in the revised Certified Species Map and plot table submitted. Applications that have been reconstituted must be submitted showing the new species and plot boundaries of the areas reconstituted. Plots that have been reconstituted must have a revised planting year recorded. All applicants are expected to write to the and notify the Department of any change to plot boundaries (e.g. due to house building or removal of forest area) during the time since submission of the Form 3 certified species map. Such changes must be reflected in a revised Certified Species Map submitted to the Department. The area removed from the plantation should be clearly indicated on the map and the plot boundaries amended to reflect any changes since establishment grants were paid. Any changes to plot details or plantation boundaries must also be present on the Certified Species Map submitted with the management plan required at year 10. Failure to alert the Department to changes to the plantation area may result in sanctions being taken by the Department against the applicant, including repaying the Department any grant and premium paid in respect of the plantation. Forest owners must inform the Department in advance before any areas are removed.


Forestry Schemes Mapping Standards
16
3.5 Fencing Map A fencing map is required to support claims for proposed (Form 1) and erected (Form 2) fencing. In order to produce the Fencing Map the Certified Species Map should be photocopied. Annotations and symbols for proposed and erected fencing should be added to the Certified Species Map using a blue marker/pen. The total length in meters of each fencing type and the plots where proposed or new fencing is to be erected (Form 1) or where new fencing has been erected (Form 2) should be noted in the Fencing Map legend. Compliance (or non-compliance) of the fencing material erected with fencing standard IS436:2007 should be clearly indicated on the fencing map legend as in the example below. An example of a Fencing Map prepared using a 1:5000 OSi map and a colour orthophoto printed from the Departments system at a scale of 1:5000 is presented below. Additional fence colours may be used in situations where there are more than 2 fencing types required for a given application. A legend template for the Fencing Map is available from the Departments website (http://www.agriculture.gov.ie/forestservice/). This should be attached to the Fencing Map submitted for all Form 1 and Form 2.

17

18

Forestry Schemes Mapping Standards
19
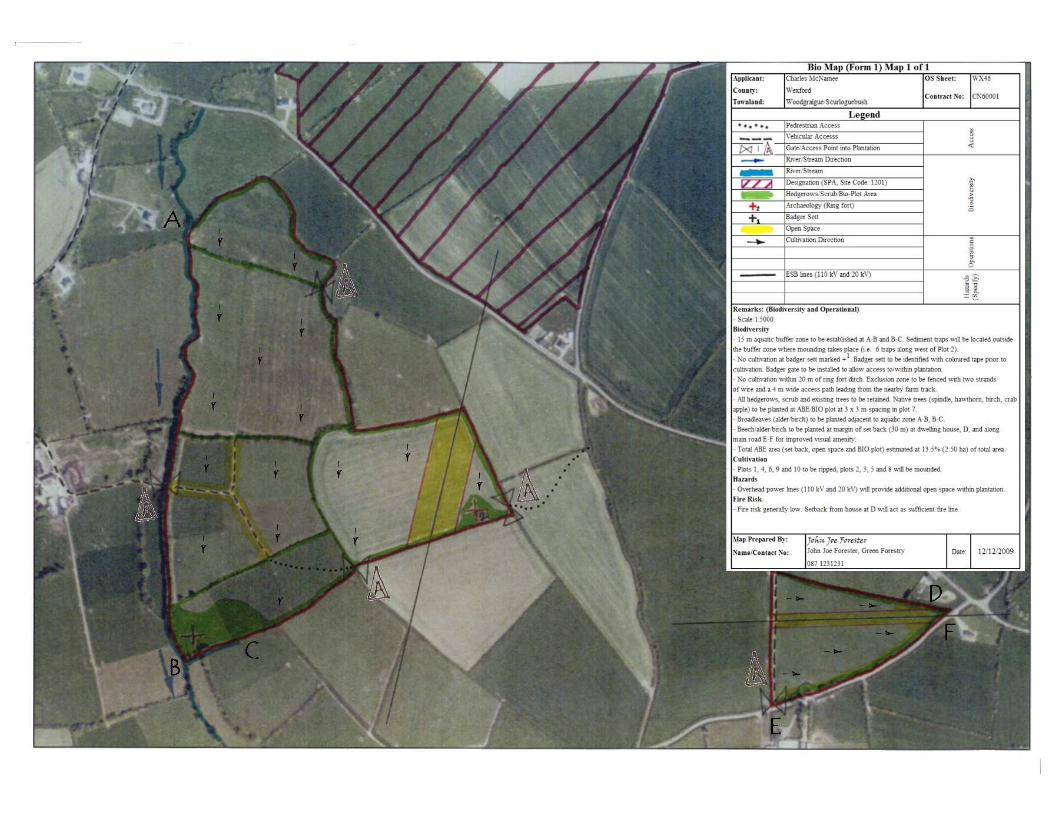
3.6 Biodiversity Map (BIO Map) The submission of a BIO Map is required at Form 1 and Form 2 stage for the Afforestation, FEPS and Forest Road schemes. It is important that this map shows clearly the presence of existing biodiversity features including species and habitats. This map combines the previous requirement to submit a separate map for cultivation, biodiversity and a fire plan. The Department will not digitise the BIO Map. However the contents of the Bio Map will be assessed by a Forest Service Inspector to evaluate the proposal in terms of its suitability regarding the terms and conditions of the scheme involved as well as the environmental suitability of the proposal and the adherence to Forest Service Guidelines and Code of Best Forest Practice. The BIO map may also be sent to statutory and non-statutory referral bodies (e.g. NPWS, Fisheries Board, An Taisce) for their comments and observations regarding the proposal. The following features must be included (if present) on the BIO Map:
• Biodiversity features e.g. badger sett, heronry, hedgerows, scrub, aquatic areas and retained habitat/open space. Linear features should be labelled and point features indicated by a
numbered cross (see BIO Map examples below) e.g. +1. • ABE areas including linear features, point features and plotted bio areas must be clearly
identified on the BIO map legend. • Buffer zones/set back distances associated with aquatic areas/houses should be clearly
identified on the map legend. Sediment trap locations must also be clearly identified where possible either on the BIO map or the in the BIO map legend.
• Designated sites adjoining or overlapping proposed areas must be clearly identified using diagonal lines or cross hatching and labelled in the legend using the designation name and site code. Alternatively the designated layer may be displayed and printed from the iNET system.
• Archaeological sites should be recorded in the legend with the type and Site and Monument Record Number of the site also noted where known, e.g. a ringfort. Monuments should be identified on the map with a numbered prominent red cross as shown in the BIO Map examples below. Alternatively the monument of interest may be displayed and printed from the iNET system.
• Vehicle and pedestrian access to the site must be identified. • Planned and existing firelines should be labelled where required. • Cultivation direction with cultivation type per plot indicated in the remarks section as shown
below. The existing drainage network on the site should be indicated where possible. • Exclusion zones (e.g. unplantable areas, rock outcrops) should be identified and clearly
labelled. • Hazards e.g. ESB lines, steep slopes, rough terrain should be identified. • The remarks section of the BIO Map legend should be used to identify any relevant features
or additional information that will help in the evaluation of the application.
The “FEPS Measures – Guidance Notes” document provides information in regard to biodiversity and operational features which must be mapped for FEPS applications. A clear legend on the biodiversity map indicating where each of the 6 optional FEPS biodiversity measures are located is required. FEPS point features (e.g. bird/bat boxes, deadwood, pond/water features) should be indicated by a numbered cross. Additional legend text should also be included in instances where space on the map is insufficient to include all details related to FEPS biodiversity measures.

Forestry Schemes Mapping Standards
20
An example of a BIO Map prepared using a 1:5000 OSi map and a colour orthophoto printed from the Departments system at a scale of 1:5000 is presented below. The colour schemes used in the attached example must be used for all BIO Maps submitted. Additional colours may be used to identify other features not listed in the attached example. A legend template for BIO Maps is available from the Departments website (http://www.agriculture.gov.ie/forestservice/). This should be attached to the BIO Map submitted for all Form 1 and Form 2 applications. 3.6.1 Mapping and Recording ABE Features An ABE of plot size should be mapped and recorded as a plot in the Certified Species Map legend. Bio plots must have a minimum width of 30 metres. The abbreviation “BIO” should be used on map legends. The GPC adopted should be that of the largest adjoining planted plot with the exception of unenclosed ground which will receive GPC 1 in all cases. Areas chosen as ABEs should represent the best areas for biodiversity enhancement within a forest and must meet the approval of the relevant Forest Service Inspector. ABE’s are areas suitable for planting where the potential for a commercial forest crop is foregone for the purpose of retaining open spaces and habitats for biodiversity. An ABE must be included as an intrinsic part of the individual grant aided project (i.e. it cannot be a completely separate area plot away from the main area comprising the plantation). The Forest Biodiversity Guidelines require that ABEs should comprise approximately 15% of individual grant aided afforestation projects, which are greater than 10 hectares. (In sites less than 10 ha in area the open space element of ABEs should be redesigned in conjunction with neighbouring land use and may be reduced). The area occupied by linear (e.g. hedgerows, public road setbacks etc.), point features (e.g. archaeological sites) and plotted bio areas are grant aided up to a maximum of 15% of the area of the plantation in the case of the afforestation scheme or up to 20% in the case of FEPS or NWS establishment. Note: in Hen Harrier pSPA areas a maximum of 20% ABE can be claimed for the afforestation scheme. Where ABEs add up to more that 15% (or 20% in the case of FEPS of NWS) of the total area the following calculation will be applied: Payment area = Actual Area X 100/85. Or in the case of FEPS/NWS: Payment area = Actual Area X 100/80.

21
22

Forestry Schemes Mapping Standards
23
3.7 Forest Road/Track Mapping Conventions 3.7.1 General Forest road mapping requirements conform to the new Forest Road Scheme rules made available by the Department in 2010 (Circulars 4, 5, 2010). The Forest Road grant will be payable in two instalments of 80% and 20% respectively. The first instalment will be paid on successful completion of the road to the standard outlined in the approval letter and the COFORD Forest Road Manual. The second instalment will be paid when at least half of the area served by the road is harvested. The Forest Road Scheme is a cost based scheme and grants are paid based on 80% of total costs subject to a maximum rate of €45 per metre. Where at least half of the approved eligible area is not thinned/harvested within 3 years of date of first instalment payment, the 20% final payment or second instalment will be forfeited. Funding for Special Construction Works is not provided under the current Forest Roads Scheme. Roads approved that require Special Construction Works must be built to the required standard with no additional grant aid provided in excess of €45 per metre. 3.7.2 Forest Road Scheme Mapping Requirements The Department’s iNET system can be used to submit (Form 1) forest road applications online (see also Section 3.3.2). Alternately roads for approval and lengths claimed for grant aid can be clearly and accurately plotted on a 1:5,000 OSi map or 1:5,000 orthophoto map printed from the Departments iNET system. The Department will then digitise all grant aided roads into its mapping database. The road features recorded on the forest road map should be annotated as follows for proposed (Form 1 applications) and built roads (Form 2 and 3 applications):
• Harvesting road must be shown with a dashed red line (i.e. A B ) • Upgraded forest road must be shown cross and dash black line (i.e. A x- x - x - x B ) • Existing roads to/within the plantation must be shown by a continuous thick black line
( i.e. ) • Species information and plot boundaries (use an existing Certified Species Map if available).
Form 1, 2 and Form 3 maps should clearly identify the location of bellmouths, t-turning areas and loading bays. The registered forester should ensure that adequate provisions have been made for equivalent road lengths arising form the extra work/quantities necessary due to road widening at bellmouths, t-turning areas and loading bays (i.e. bellmouth - 30 m, standard t turning area - 70 m, standard loading bay with internal turning area - 105 m, standard back in type loading bay - 30 m, circle turning area - 110 m, standard passing place - 45 m, see also COFORD Forest Road Manual). Environmental features that may be potentially affected by the proposed road development (e.g. archaeology) should be included on the Form 1 map where relevant. The harvest area (area to be harvested within the next two years) to be served by a proposed road must be clearly identified and outlined in blue on the Form 1 Map. In addition to relevant applicant details and Contract Number, the Forest Roads Form 1 application map legend should contain the following information and be positioned on the top right hand corner of the map:
• Length of the proposed Harvest Road (m). • Area requiring harvesting within the next 2 years and served by the proposed Harvest Road (ha). • Ages(s) of plantations served by the proposed road.

Forestry Schemes Mapping Standards
24
Although not grant aided, sites of special construction works must be lettered and identified on the legend attached to the map. In addition, features such as archaeological sites and aquatic zones must be identified on a BIO Map using the mapping conventions detailed in Section 3.6. Inventory information for the area to be harvested should be attached to the application. This information should support the claim that the area is suitable for harvesting within the next two years. An updated Certified Species Map will suffice for existing grant aided plantations for area and species information. If the forest was not grand aided and no Certified Species Map is present a new Certified Species map must be prepared. Road specifications details (e.g. length/distance, peat depth, formation type, road etc.) associated with particular road sections should also be included (where required) by annotating the map along specific sections of the proposed road using letters (e.g. A-B, B-C, C-D etc). The format presented in the table below should be used where these road specification data are required. Section Location (on map) A-B B-C C-D D-E E-F…. 1 Distance (m) 2 Peat depth (mm) 3 Formation (type) 4 Well drained (Yes or No) 5 Culvert (No. X size (mm)) 6 Pavement (total depth (mm)) 7a Pavement base material type Pavement base material depth 7b Pavement surface material type Pavement surface material depth 8 Road Gradient (% or ratio) 9 Cross slope (% or ratio) 10 Construction type Comments: NOTE: Section Location, Give a column to each road section (A-B, B-C, C-D, etc.). Item 3, select the formation type that best matches from Table 12, FRM. Item 4, a well drained site is one where the water table is more than 600 mm below formation level. Item 5, for guidance on appropriate culvert sizing and layout – see section 11, Streams and Water Crossings, FRM. Item 6, depending on item 3 and item 4 determine pavement depth from Table 12, FRM. Item 7, see Section C.7. Construction Material and Appendix E.6 Specification for Road Material, FRM. Item 10, e.g. ‘excavate’ formation or ‘build on top’ etc. See section C.3 Forest Road formation methods, FRM. *FRM = Forest Road Manual. Guidelines for the construction and management of forest roads. Second edition. Authors Tom Ryan, Henry Philips, James Ramsay and John Dempsey. Published by COFORD, 2005
For Form 2 submissions, the forest road map must accurately represent the position and extent of the completed road for which the grant aid is being claimed. Where the services of an engineer/surveyor have been engaged at design stage, completed works must be certified as having met the specified standard for the road design and specification. The Forest Roads Form 2 Maps should include:
• Length of the built Harvest Road (m). • Area requiring harvesting within the next 2 years and served by the Harvest Road (ha). • Ages(s) of plantations served by the built road.
For Form 3 submissions, the harvest area (the area that was harvested) served by the built road must be clearly identified and outlined in blue. As per the conditions of Forest Road Scheme this must equate to at least half of the approved eligible area identified in the original Form 1 application. Examples of a Form 1 forest road application Map created using a 1:5,000 OSi map and a 1:5,000 orthophoto map are presented below at the bottom of this section.

25

26

Forestry Schemes Mapping Standards
27
3.8 Woodland Improvement Scheme (WIS) Mapping Conventions (Tending and Thinning of Broadleaves). This element of the Woodland Improvement Scheme applies to young broadleaved woodlands (planted post 1980) that are suitable for tending or thinning. Area and width criteria as per the Afforestation Scheme apply. Grant aid for the treated area is available for either tending or thinning operations depending on which is the most appropriate to the site. Full details relating to the thinning schedules and technical aspects of the scheme are available from the Department’s website. A Certified Species Map must be supplied along with all WIS Form 1 applications. A Certified Species Map should be prepared according to the standards as outlined in section 3.3.4. The Certified Species Map should indicate clearly the location of all relevant plot boundaries and be numbered sequentially (where possible matching the plot numbers of the original grant aided plantation). The Certified Species Map will be used to digitise boundaries of the proposed operations into the Departments mapping system. Any relevant notes or remarks should be recorded on the map to aid the assessment of the application and its suitability for grant aid. If the area submitted for approval has received grant aid in the past the Contract Number for the area must be noted on the Certified Species Map. Example Certified Species Maps prepared using a 1:5,000 OSi A4 map and an orthophoto map printed (1:5,000 Scale) from the Departments iNET system are presented at the end of Section 3.7.


Forestry Schemes Mapping Standards
30
3.9 Reconstitution of Woodlands Scheme Mapping Conventions This grant scheme applies when damage to a plantation has occurred as a result of natural causes. From June 1st 2009 reconstitution is available for plantations that suffer from 'significant damage' due to frost, drought, deer, grey squirrel, vole, disease and insect damage. 'Significant damage' implies death or irremediable damage of 30% or more of the trees in the relevant plantation covered by one contract number. The reconstitution scheme does not cover any fire or wind damage occurring after 1 June 2009. A Certified Species Map must be supplied along with all Reconstitution Form 1, Form 2 and Form 3 applications. The Certified Species Map should be prepared according to the standards as outlined in section 3.4. A Fencing Map is also required for Form 1 and Form 2 applications where applicable. A BIO Maps for Form 1 and Form 2 applications should be prepared as per section 3.6. The Certified Species Map should indicate clearly the location of all affected areas covered by the reconstitution grant application. Where the application covers more that one area/plot, plots should be numbered sequentially. The Certified Species Map will be used to digitise boundaries of the proposed reconstitution area into the Departments mapping system. Any relevant notes or remarks should be recorded on the map to aid the assessment of the application and its suitability for grant aid. In addition to the Certified Species Map for the Reconstitution application, the original Certified Species Map to which the Reconstitution application refers must also be submitted. Example Certified Species Maps prepared using a 1:5000 OSi A4 map and an orthophoto map printed (1:5000 Scale) from the Departments iNET system are presented at the end of section 3.8. In this example the Certified Species Map presented at the end of Section 3.4 would also be sent to the Department along with the Reconstitution Certified Species Map. A total of 1.23 ha of the ash plot (Plot 1 in the Reconstitution Certified Species Map) has suffered severe frost damage and must be restored to Forest Service Standards.


Forestry Schemes Mapping Standards
33
3.10 Summary of Mapping Requirements by Scheme Type The table below summarises the mapping requirements for Form 1 (F1), Form 2 (F2) and Form 3 (F3) maps for the Afforestation Scheme (Affor), Forest Environment Protection Scheme (FEPS), Forest Roads Scheme (Roads), Woodland Improvement Scheme (WIP) and Reconstitution Scheme (Recon). Scheme Type Affor FEPS Roads WIP Recon Map Type F1 F2 F3 F1 F2 F3 F1 F2 F3 F1 F2 F3 F1 F2 F3 Certified Species Map� � � � � � � � � � � � � �
Fencing Map � � � � � � BIO Map � � � � � � Mapping requirements for the Native Woodland Scheme (NWS) are covered in detail in the Native Woodland Scheme manual and readers are referred to this document for further information.

Forestry Schemes Mapping Standards
34
Appendix A – Measuring Distance and Area Using Paper Maps (1:5,000 Scale). A.1 Verifying Map Scale All paper maps submitted to the Department in support of grant aid must be printed at a scale of 1:5,000. On a scale of 1:5,000 one centimetre on the map represents 5000 cm or 50 m on the ground. One millimetre on the map is equivalent to 5 meters on the ground. In terms of area, on a scale of 1:5,000, one square centimetre on a paper map represents an area of 50 m by 50 m on the ground (i.e. 0.25 hectares). The accuracy of scale on a printed map can be verified by using a ruler to measure a clearly identifiable feature such as a hedgerow or fence-line. The length of a fence or hedgerow should then be measured with a tape measure on the ground and adjusted for slope. Verification of the printed map scale can carried out by using the following formula: Scale = ------------------------------------------------------------ For example, if the length of fence was measured as 280 m and the length of the fence on the printed 1,5,000 scale map was 56 mm, the formula would be used as follows: Scale = --------------- = 5000 The true scale on the measured part of the map is therefore 1:5,000. Registered foresters must ensure maps are printed at the correct scale before taking measurements for a grant claim. A.2 Measuring Distance The following steps should be used to measure distance using 1:5,000 scale maps:
• Use a metric ruler to measure the length of the linear feature (stream, hedgerow, fence line) • Multiply the measured length by the scale ratio • Convert this number to meters
For example a distance of 50 mm on a map with a scale of 1:5,000 will represent: 50 mm x 5000 mm = 250,000 mm (or 250 m) Distance measurements should be corrected for slope on the ground where applicable. A.3 Measuring Area A five millimetre grid sheet should be used to measure area on 1:5,000 paper maps (see over). When printing the grid sheets to a transparency select the appropriate print option (please see the top of the grid sheet page for more detail). You should also check the measurements on the transparency print-out with a ruler. When using a five millimetre grid on a 1:5,000 scale map each square represents 0.06 hectares.
Measured length of feature (m) x 1000
Length of feature on map (mm)
280 x 1000
56

Forestry Schemes Mapping Standards
35
The following steps must be used to measure area using 1:5,000 scale maps:
• Randomly place a transparency grid sheet over the plot/area to be measured (do not place grid-lines on straight lines on the map such as hedgerows as a high level of accuracy is required).
• Count all the dots that fall within the boundaries of the plot/area being measured. • Multiply the number of dots counted by the area represented by each dot (0.06 ha) to
determine the total plot area. For example, on a scale of 1:5,000 if 28 dots are counted within a plot, each grid square represents 0.06 hectares. Therefore to determine the plot area from the paper map multiply 28 x 0.06 ha to obtain a plot area of 1.68 hectares. The process must be repeated 3 times for the same plot and then the results averaged to yield a more representative plot area.
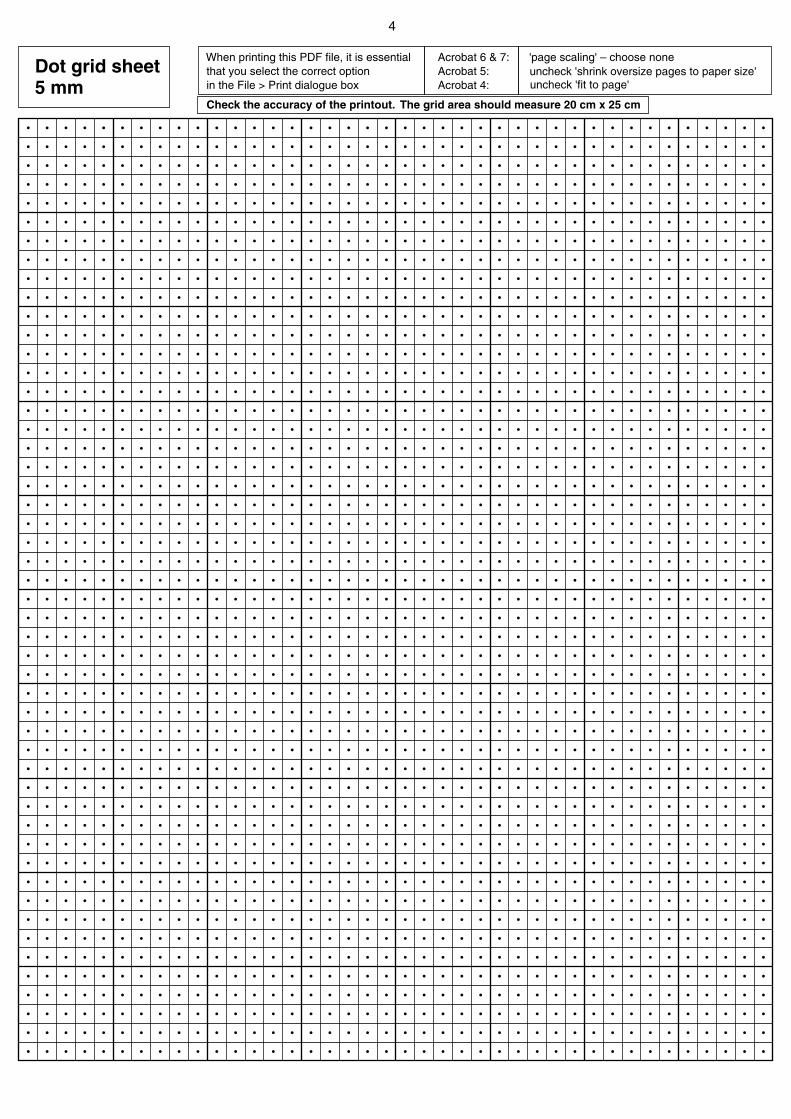
Dot grid sheet5 mm
4
When printing this PDF file, it is essentialthat you select the correct optionin the File > Print dialogue box
Check the accuracy of the printout. The grid area should measure 20 cm x 25 cm
Acrobat 6 & 7:Acrobat 5:Acrobat 4:
'page scaling' – choose noneuncheck 'shrink oversize pages to paper size'uncheck 'fit to page'