department for stream report - gov.uk
TRANSCRIPT

Department for Communities and Local Government Final Work Stream Report: BD 2887 Compartment sizes, resistance to fire and fire safety project Work stream 6 – Space Separation 286860 (D28V2) CPD/04/102
The authors of this report are employed by BRE. The work reported herein was carried out under a Contract placed by the Department for Communities and Local Government. Any views expressed are not necessarily those of the Department for Communities and Local Government.
Prepared for: Brian Martin Department for Communities and Local Government Building Regulations and Standards Division 2 Marsham Street London, SW1P 4DF 03 March 2015

2 Final Work Stream Report BD 2887 (D28V2) 286860
Commercial in confidence © Building Research Establishment Ltd 2015
Printed on environmentally friendly paper
FIRE
BD 2887
Compartment sizes, resistance to fire and fire safety project
Final Work Stream Report for Work Stream 6 Space Separation
Prepared for Brian Martin
Prepared by Richard Chitty and Tom Lennon
BRE output ref. 286860 (D28V2)
Approved on behalf of BRE
Name Dr Debbie A Smith
Position Director, Fire Sciences and Building Products
Date 18 March 2015
Signature
BRE Bucknalls Lane Garston Watford WD25 9XX Tel : 01923 664922 Fax : 01923 664910 Email : [email protected] Website : www.bre.co.uk

3 Final Work Stream Report BD 2887 (D28V2) 286860
Commercial in confidence © Building Research Establishment Ltd 2015
Printed on environmentally friendly paper
Executive Summary
Building Regulations and Standards Division, Department for Communities and Local Government (DCLG) commissioned BRE to carry out a project titled “Compartment sizes, resistance to fire and fire safety”. The main aim of this project was to produce robust evidence and data based on research, experimental fire testing, computer modelling and laboratory testing, where necessary, on a number of linked work streams in relation to fire safety and associated provisions in Schedule 1 of Part B of the Building Regulations 2010.
This Final work stream report describes the findings of the research for Work stream 6 – Space Separation. The aim of the work stream was to provide robust evidence to support modified or alternative calculation methods for building separation distances considering:
• Highly insulated buildings • Flame projection • Definition of unprotected areas (impact of current standards of glazing) • Sprinkler protection.
This work has considered the background to the current guidance in relation to building separation: a review of the background to existing Approved Document B requirements; external fire spread and building insulation calculations; glazing and glass breaking mechanisms and a review of fires in large spaces. In addition, this work has drawn on the revision of BR 187 ‘External fire spread: building separation and boundary distances’, published in July 2014. In order to consider the impact of the levels of insulation typical of modern forms of construction on fire growth, development and spread and hence building separation, a number of new fire experiments have been undertaken. This work stream has also involved the participation of an industry Steering Group. The conclusions of this work stream are as follows:
• The experimental programme has confirmed that, for buildings with low levels of insulation, the current approaches in AD B and BR187 are adequate. Improving the levels of thermal insulation to those recommended by Approved Document L1A (Conservation of fuel and power in new buildings) may lead to higher fire temperatures; these can be compensated for by reducing the unprotected area of an elevation by 70%. However, this does not include the impact of any external flaming.
• Calculation of the extent of the external flame envelope using the methods in Eurocode 1 (BS EN 1991-1-2 Actions on structures exposed to fire, 2002) and PD 7974-3 (Application of fire safety engineering principles to the design of buildings, Structural response and fire spread beyond the enclosure of origin, 2003) is not dependent on the level of thermal insulation in a compartment and cannot therefore be used as part of a building separation calculation.
• Methods to predict the extent of external flaming from compartments need to be extended to include the impact of high levels of compartment insulation.

4 Final Work Stream Report BD 2887 (D28V2) 286860
Commercial in confidence © Building Research Establishment Ltd 2015
Printed on environmentally friendly paper
Contents
1 Introduction and Objectives 5 1.1 Appraisal of existing evidence 6 1.2 Scope of work 7
2 Programme of work 8 2.1 Stakeholder engagement 8 2.2 Review of background to existing AD B requirements 9 2.3 Review of external fire spread and building insulation 10 2.3.1 Calculation of compartment temperature 15 2.3.2 Radiation intensity from unprotected areas 17 2.3.3 Calculation of separation distance 17 2.4 Review of glazing 19 2.4.1 Glass breaking mechanisms 20 2.4.1.1 Single glazing 20 2.4.1.2 Double glazing 20 2.4.1.3 Glass fallout 20 2.4.2 External fire spread and glazing 21 2.4.3 Conclusion of review of glazing 21 2.5 Review of fires in large spaces 21 2.5.1 Flashover in large spaces 22 2.5.2 Travelling fires 23 2.5.3 Application of travelling fires 25 2.5.4 Sprinkler protection 26 2.6 Experimental programme 27 2.6.1 Experiment 1 - details and observations 31 2.6.2 Experiment 1 – results 32 2.6.3 Experiment 2 - details and observations 37 2.6.4 Experiment 2 – results 37 2.6.5 Experiment 3 - details and observations 41 2.6.6 Experiment 3 – results 42 2.7 Data Analysis 45 2.7.1 Current methods - BRE data and space separation 45 2.7.2 Parametric curves - BRE data and space separation 46 2.7.3 External flaming 50 2.7.4 Discussion of building separation 53 2.7.5 Cost benefit analysis 54
3 Conclusions 55 4 Acknowledgements 55 5 References 56 Appendix A – Summary of the Research Appendix B - London Rebuilding Act 1667 Appendix C - Ministry of Home Security Bulletins C28/29

5 Final Work Stream Report BD 2887 (D28V2) 286860
Commercial in confidence © Building Research Establishment Ltd 2015
Printed on environmentally friendly paper
1 Introduction and Objectives This Final work stream report is delivered as part of the Department for Communities and Local Government (DCLG) project BD 2887, titled “Compartment sizes, resistance to fire and fire safety”, DCLG Contract reference CPD/04/102/010. The main aim of this project was to produce robust evidence and data based on research, experimental fire testing, computer modelling and laboratory testing (where necessary) on a number of linked work streams in relation to fire safety and associated provisions in Schedule 1 of Part B of the Building Regulations 2010. The project has been broken down into specific work streams.
This report describes the findings of the research for Work stream 6 – Space separation.
Many major cities have histories of devastating fires caused either by natural phenomena (e.g. volcanoes, earthquakes, wildfires), accidents or military action. These fires have usually grown due to narrow streets and the use of combustible building materials that allow fire to easily spread from one building to another.
To reduce the risk of such conflagrations, requirements have been placed on building users and owners to:
• Control processes in a building that may cause fires • Use appropriate fire protection measures to mitigate the effects in the event of a fire • Control the separation between buildings.
Initially, these requirements were prescriptive and often introduced as a retrospective response to an event.
In 1991, BRE published a report BR187 ‘External fire spread: building separation and boundary distances’ [1]. This report describes a number of methods for calculating building separation distances based on work conducted at the Fire Research Station up to 1963.
Since the original work was conducted, there have been numerous studies of compartment fires, including a large international experimental programme organised by the Conseil lnternational du Bâtiment (ClB) [2], which investigated a number of different compartment shapes and scales with different ventilation conditions and fire loads.
More recent data, although not specifically intended for analysis of building separation, recorded compartment temperature and external thermal radiation. Some of this more recent work included compartments with levels of insulation typical of current buildings, these indicated higher compartment temperatures than earlier data where the compartments were relatively poorly insulated [3].
The building separation calculation methods include several assumptions that may either over or under compensate for each other:
• Temperature within the fire compartment • Flame projection from openings • Total compartment involvement and fire duration • Instant failure of unprotected areas • Acknowledgement of sprinkler protection (halving the boundary distance).
AD B [4] and the referenced documents [1] need to reflect the advances in fire science and changes in building design/materials that have occurred since the separation calculation methods were developed 50 years ago.

6 Final Work Stream Report BD 2887 (D28V2) 286860
Commercial in confidence © Building Research Establishment Ltd 2015
Printed on environmentally friendly paper
This work stream has followed on from work carried out for the revision of BR187 “External fire spread: Building separation and boundary distances” (Second edition) [5] which identified that the current calculation methods are based on data that may not be relevant to modern, well insulated, buildings and that some issues do not have an identifiable scientific basis.
1.1 Appraisal of existing evidence
Most accidental fires start as small fires which initially present a very small hazard to adjacent buildings. If a fire grows, then, as windows in the compartment break due to the elevated temperature, more air can enter the compartment allowing the fire to grow further until it is limited either by the amount of fuel, availability of air or the extent of the compartment. Thermal radiation from the openings to the burning compartment and from flames leaving the compartment will then heat surfaces on adjacent buildings. This has the potential, especially if burning brands are present, to provide pilot ignition, to allow the fire to spread to the adjacent building. If left unchecked, the fire could then propagate from building to building and develop into a large urban fire.
To reduce the risk of such conflagrations, requirements have been placed on building users and owners to:
• Control processes in a building that may cause fires • Use appropriate fire protection measures to mitigate the effects in the event of a fire • Control the separation between buildings.
Initially, these requirements were prescriptive and often a retrospective response to an event. For example [6], following a large fire in London, an Ordinance was issued by King John in 1212 requiring new or restored roofs to be made tiled, shingled, boarded or covered with lead and not covered with reeds or rush. The Great Fire of London in 1666 resulted in a number of regulations to classify buildings based on their construction and to control the width of streets each class of building could be built on (Appendix B).
During World War II, the Ministry of Home Security [7] developed guidance for reducing the window areas of buildings (by temporary boarding or bricking up) to limit the thermal radiation to adjacent buildings. This was presented as the maximum percentage area of a building elevation that could remain as windows. These calculations used, and probably pioneered, the same approach as the current “Enclosing Rectangles” method (Appendix C).
Following World War II, there was systematic investigation of fire damage and detailed research into how fires could develop in one building and cause ignition of an adjacent one. By the early 1960’s, the Building Regulations for Scotland, and shortly afterwards for England and Wales, included methods for calculating the spacing between buildings and requirements to control the use of combustible materials on the external surfaces of a building. This was probably the first practical application of what is now referred to as Fire Safety Engineering in a legislative framework.
In 1991, BRE published the first edition of a report BR187 ‘External fire spread: building separation and boundary distances’ [1]. This report described a number of methods for calculating building separation distances that were previously described in the Building Regulations (up to 1976) and in Approved Document B ‘Fire Safety’ (1985 edition). In addition, BR187 included a reproduction of a technical report that described the underlying principles of the calculation methods.
It should be noted that it is impractical to completely eliminate the risk of fire spread between buildings; the objective of using building separation calculations is to ensure that ignition of a building adjacent to a fire is

7 Final Work Stream Report BD 2887 (D28V2) 286860
Commercial in confidence © Building Research Establishment Ltd 2015
Printed on environmentally friendly paper
sufficiently delayed so that the Fire and Rescue Service would have time to arrive on site and could take the necessary preventative action.
1.2 Scope of work
A recent study [5] has identified that the current recommendations in AD B and the related documents (BR187) may be limited as:
• They are based on data from compartments having what would now be regarded as having poor insulation.
• They do not include flame projection from openings.
• A simple factor (a reduction of the calculated distance by a half or doubling of the unprotected area) is applied if a building has a sprinkler system. BRE is not aware of any supporting scientific evidence for this factor.
The objective of this work stream was to provide robust evidence to support modified or alternative calculation methods for building separation distances considering:
• Highly insulated buildings • Flame projection • Definition of unprotected areas (impact of current standards of glazing, the role of cladding) • Sprinkler protection.
The original analysis [1] of compartment fires to establish compartment temperatures that could be used in building separation calculations was based on data from small scale experiments (between 0.3 m and 1.0 m sides) and a few larger fires in a 3 m square brick building. It was found that fully ventilated fires could achieve a compartment temperature of 1040°C (corresponding to a value of radiation intensity at the openings of 168k W/m2. However, if there was a low fire load (less than 25 kg/m2) then a value of 830°C (radiation intensity 84 kW/m2) was more appropriate. Approved Document B uses the lower value for Residential, Office or Assembly and Recreation purpose groups and the higher value for all other purpose groups.
New experimental work carried out as part of this work stream has considered a simple compartment with fixed fire loads and ventilation conditions, but differing levels of thermal insulation so that the impact on building separation could be investigated.

8 Final Work Stream Report BD 2887 (D28V2) 286860
Commercial in confidence © Building Research Establishment Ltd 2015
Printed on environmentally friendly paper
The Work stream 6 tasks were:
• Task 6.1 Establishment and meetings of Satellite Steering Group
• Task 6.2 Literature review and scoping of project detail
• Task 6.3 Experimental programme
• Task 6.4 Data analysis and cost benefit analysis
• Task 6.5 Development of new guidance document
• Task 6.6 Reporting.
2 Programme of work
2.1 Stakeholder engagement
This work stream has involved the participation of an industry Steering Group, Satellite Steering Group B. This group provided input during the course of the work, giving feedback on the research methodology as well as key deliverables and milestones. This group met three times.
The organisations represented at the Steering Group are as follows.
Organisations represented at the Steering Group
• Building Regulations and Standards Division, Department for Communities and Local Government (DCLG)
• BRE Project team • Association of Specialist Fire Protection (ASFP) • Association of Building Engineers (ABE) • British Automatic Fire Sprinkler Association (BAFSA) • British Parking Association • British Standards Committee FSH/25/3 Smoke ventilation in car parks • Business Sprinkler Alliance (BSA) • Chief Fire Officers Association (CFOA) • The Chartered Institute of Building (CIOB) • Fire Brigades Union (FBU) • Fire Industry Association (FIA) • Institution of Fire Engineers (IFE) • LABC • National Fire Sprinkler Association (NFSN) • National Register of Access Consultants (NRAC) • Passive Fire Protection Federation (PFPF) • RICS Building Control Professional Group (RICS) • RISC Authority • Scottish Building Standards (SBS) • Shore Engineering • Smoke Control Association • Water UK • Welsh Government (WG)

9 Final Work Stream Report BD 2887 (D28V2) 286860
Commercial in confidence © Building Research Establishment Ltd 2015
Printed on environmentally friendly paper
2.2 Review of background to existing AD B requirements
The recommendations in AD B for building separation distances and external fire spread follow the Requirement B4 of Part B Section 1 of the Building Regulations 2010:
External Fire Spread
B4.(1) The external walls of the building shall adequately resist the spread of fire over the walls and from one building to another, having regard to the height, use and position of the building.
For a wall that meets the fire resistance requirements (as specified in Appendix A of AD B) over its whole area then the fire resistance requirements should be met for fires either inside or outside of the building if the distance to the relevant boundary is less than 1m, or if the building is high, or if building in in the Assembly or Recreation purpose group. For other cases, if the boundary is greater than 1m, then the fire resistance requirement need only be met from the inside of the building.
However, the walls of buildings usually have areas (such as windows) that do not meet the fire resistance requirements. Section 9 of AD B volume 1 and Section 13 of AD B volume 2 presents recommendations to calculate the required boundary distance depending on the internal compartmentation of the building and the total area of the wall that does not meet the fire resistance requirement (the unprotected area). The reverse calculation may also be performed to find the maximum unprotected area for a fixed boundary distance.
The recommendations include exceptions for small areas, such as small windows or air bricks. There are also recommendations so that the beneficial effects of suppression systems can be included.
In many cases, the recommendations in AD B are sufficient; however, there are more complex scenarios where more detailed calculations are required. These are provided in the BRE report BR187 ‘External fire spread: building separation and boundary distances’.
The calculation methodology is based on the following assumptions:
• The fire is confined to a single fire compartment, but totally involves that compartment.
• All the unprotected areas on a compartment elevation have failed and can be represented by a source of thermal radiation with a radiation intensity based on the building purpose group. (This is derived from experimental data).
• The radiation intensity at the separation distance should not exceed 12.6kW/m2 (based on the radiation intensity required for pilot ignition of wood after 10 minutes exposure).
• The boundary distance is half the separation distance. (This assumes a situation where the two adjacent buildings are “mirror images” of each other with the boundary at the midpoint between the buildings).
• The boundary distance may be halved, subject to a minimum value of 1 m if a suppression system (as detailed in Paragraph 0.16 of AD B) is installed.
• External flaming is not considered directly.
This approach was developed between 1943 and 1963 and the experimental data used reflect the building materials of that time; notably the thermal insulation of the compartment.

10 Final Work Stream Report BD 2887 (D28V2) 286860
Commercial in confidence © Building Research Establishment Ltd 2015
Printed on environmentally friendly paper
2.3 Review of external fire spread and building insulation
Over the years, the requirements of the Building Regulations in the United Kingdom for the thermal insulation of a building envelope have been progressively increased. Table 1 compares the maximum U value requirements from Approved Document F of the Building Regulations 1976 (Regulation F3 and associated table) [8] and Approved Document L1A 2010 (England) Edition (4.20, Table 2) [9]. It should be noted that the better the thermal insulation, the lower the U value.
Table 1 - Maximum U value requirements
Element of building Maximum U value (Approved Document F 1976)
Maximum U value (Approved Document L1A 2010) (England, New Build) (Area Weighted Average)
(W/m2°C) (W/m2K) Roof 0.6 0.2 Wall 1.0 any part
1.8 average including openings 0.3
Floor 1.0 0.25 Party wall 0.5 0.2 Windows 5.7 single glazed
2.8 double glazed 2.0
The objective of increasing the insulation requirements is so that less energy is required to maintain the temperature inside a building to a given value. However, insulation will “work” just as well in the event of a fire and a smaller fire heat release rate will be required to reach a specified temperature in a new building compared to an old building. Alternatively, for a given fire heat release rate, the temperature in a room meeting the current insulation requirements will be higher than in a room meeting older insulation standards (all other factors, such as ventilation, being equal).
The NIST fire simulation zone model CFAST [10] has been used here to demonstrate the difference in the thermal conditions in a small compartment (7 m by 3.5 m by 2.4 m high, a domestic room) containing a well-ventilated, pre flashover 1 MW fire. The material properties are given in Table 2. These are taken from the SFPE Handbook of Fire Protection Engineering [11] for the indicative materials indicated.

11 Final Work Stream Report BD 2887 (D28V2) 286860
Commercial in confidence © Building Research Establishment Ltd 2015
Printed on environmentally friendly paper
Table 2 - Thermal properties for CFAST insulation comparison
Low insulation U
(W/m2/K) Thickness (d) (m)
Thermal conductivity (k) (W/m/K)
Density (ρ ) (kg/m3)
Specific heat capacity (cp) (J/kg/K)
Wall Brick 1.8 0.4 0.7 1600 840 Roof Wood lath 0.6 0.46 0.28 800 1000 Floor Concrete 1.0 0.1 0.1 1500 1000
High insulation U
(W/m2/K) Thickness (d) (m)
Thermal conductivity (k) (W/m/K)
Density (ρ ) (kg/m3)
Specific heat capacity (cp) (J/kg/K)
Wall Insulated wall panel
0.3 0.07 0.02 1500 1000
Roof Insulated wall panel
0.2 0.1 0.02 1500 1000
Floor Concrete 0.25 0.4 0.1 1500 1000
It should be noted that the properties used in Table 2 are not intended to represent real building elements but to characterise the insulation performance required by the Regulations presented in Figure 1. Figure 1 shows a clear temperature difference between compartment temperature with current (High) and historical (Low) insulation levels; this indicates that the highly insulated compartment is likely to flashover at approximately 10 minutes (600 s) when the compartment temperature exceeds 500°C,whereas the compartment with a lower standard of insulation may not flash over at all.
Figure 1 - Predicted effect of insulation of compartment fire temperature

12 Final Work Stream Report BD 2887 (D28V2) 286860
Commercial in confidence © Building Research Establishment Ltd 2015
Printed on environmentally friendly paper
The effect is also apparent when comparing temperature measurements in fire experiments. In the fire literature, a large number of compartment fire tests have been reported, notably the CIB series of experiments conducted at a number of laboratories in the 1960s [2]. Many early experiments, however, did not consider the effect of thermally insulating the compartment and typically used structures built from brick or refractory sheet materials although a few used mineral wool insulation and there were studies with, combustible, fibreboard linings.
A review of large scale fire tests was undertaken as part of another work stream (Work stream 1 – Periods of fire resistance) to consider how the results (in relation to peak temperature, overall duration and equivalent period of fire severity) tie in with predictive methods from performance based fire engineering codes and standards such as the parametric approach set out in BS EN 1991-1-2 [12] or the time equivalent methodology underpinning the alternative approach to specifying fire resistance periods in BS 9999 [13]. These data are also relevant to this work stream (Work stream 6) as the peak compartment temperature is related to the radiation intensity from unprotected areas.
Figure 2 shows maximum temperature records from a number of the experiments reported in Work stream 1 together with the equivalent thermal radiator temperature used for building separation calculations. This shows a number of points that are significantly higher than the value assumed for building separation.
Figure 2 - Maximum temperatures recorded in fire experiments
From this data set, values from experiments with compartment walls having a U value of less than 3 W/m2/K have been plotted in Figure 3. This shows most of the high temperature results are associated with highly insulated compartments.

13 Final Work Stream Report BD 2887 (D28V2) 286860
Commercial in confidence © Building Research Establishment Ltd 2015
Printed on environmentally friendly paper
Figure 3 - Maximum temperatures recorded in fire experiments with highly insulated compartments
Calculation methods for building separation guidance currently assume radiation intensity at unprotected areas for different purpose groups as given in Table 3 (the group descriptions are similar throughout the UK). The compartment temperatures given in Table 3 are shown in Figures 2 and 3 as the red and blue lines.
Table 3 - Radiant intensity from unprotected areas
Fire load Purpose group (England)
Temperature Radiation intensity
Low fire load Residential, Office, Assembly and recreation groups
830°C 84 kW/m2
High fire load Shops commercial, industrial and storage groups
1030°C 168 kW/m2
The higher temperatures shown in Figure 3 indicate that, for highly insulated buildings, the radiation intensity currently assumed at unprotected areas may be low. This would lead to separation distances being lower than required to achieve an equivalent level of safety to buildings with lower insulation.
Figure 4 shows the building separation distance predicted using the enclosing rectangles method described in BR187 [1, 5] for a building elevation 27 m by 3 m high (i.e. the distance for the radiation intensity in line with the centre of the elevation to fall to 12.6 kW/m2) and indicates the separation distance for high and low fire loads. Note the building elevation size has been arbitrarily chosen to demonstrate the impact of the alternative fire loads.

14 Final Work Stream Report BD 2887 (D28V2) 286860
Commercial in confidence © Building Research Establishment Ltd 2015
Printed on environmentally friendly paper
Figure 4 - Variation of required separation distance with temperature
It can be seen that increasing the temperature corresponding to the high fire load to, say 1100°C, would increase the minimum separation distance by several metres. This could be critical for some developments.
The impact of increasing insulation and thereby the compartment temperature can also be shown by considering the variation in radiation intensity. Figure 5 uses the same building elevation of 27 m by 3 m and plots the radiation intensity against temperatures at a distance of 9 m (the low fire load separation distance from the previous example). In this case, increasing the temperature of the compartment to 900°C would increase the radiation intensity on an adjacent building from12.6 kW/m2 to 16 kW/m2. This is not high enough (in this case) to lead to spontaneous ignition, but would reduce the time required for pilot ignition.
Low fire load
High fire load

15 Final Work Stream Report BD 2887 (D28V2) 286860
Commercial in confidence © Building Research Establishment Ltd 2015
Printed on environmentally friendly paper
Figure 5 - Radiation intensity 8 m from a 27 m by 3 m building elevation
The impact of insulation can also be illustrated using the parametric time temperature curves described in Eurocode 1 (BS EN 191-1-2:2002 Eurocode 1, Annex A) [12].
This approach would be too complex for day-to-day building separation calculations, but provides a meaningful way of examining the impact of variations in parameters (insulation, fire load, ventilation) on building separation requirements. It also illustrates how a fire engineering approach could be taken to determining building separation; this route is especially attractive as it would provide consistency with the structural calculations that would have an impact on the integrity of the building.
2.3.1 Calculation of compartment temperature The temperature, θg, of the hot gases in the fire compartment can be calculated from: = 20 + 1325(1− 0.323 . ∗ − 0.204 . ∗ − 0.472 ∗) [Equation 1]
Where t* = tΓ
t is the time (in hours) and
Γ = 0.04 1160
[Equation 2]

16 Final Work Stream Report BD 2887 (D28V2) 286860
Commercial in confidence © Building Research Establishment Ltd 2015
Printed on environmentally friendly paper
In Equation 2, the variable, O, is the opening factor, characterising the compartment ventilation and b is derived from the compartment wall thermal properties, characterising the compartment insulation.
= ℎ [Equation 3]
Where Av is the total area of all the vents in the walls, heq the weighted average of the opening heights and At the total surface area of the compartment (walls, floor, ceiling, including openings).
The equation for O is valid in the range 0.02 to 0.2 m1/2.
If the boundary of the enclosure is constructed from a single uniform material then = [Equation 4]
Where k (written as γ in Eurocode 1) is the thermal conductivity, ρ is the density and c the specific heat capacity of the compartment boundary material. If the surface is made of multiple layers b is calculated by estimating the thermal penetration depth at the time of the maximum temperature and considering the layers of materials involved. If the walls ceilings and floor are made from different materials then an area weighted average is found. The procedures for calculating b if multiple materials are involved are detailed in the Eurocode 1. Values of b in the range 100 to 2200 are valid (PD 7974-3 [14] gives the limits as 1000-2200). The Eurocode 1 is based on a larger data set than PD 7974-3 allowing the wider range of values of b to be justified.
The maximum temperature, θmax occurs at tmax where
= 0.002 , , [Equation 5]
Where qt,d is the fire load divided by the surface area of the enclosure, At, in the range 50 to 1000 MJ/m2. The fire load is often expressed and tabulated in terms of the fire load density qf,d, with respect to the floor area, Af. The values can be converted using qt,d = qf,dAf/At.
tlim is taken as 25 minutes for a SLOW growth rate fire, 20 minutes for a MEDIUM growth rate and 15 minutes for a FAST fire.
If the value of tlim is used then a revised calculation of the ventilation factor, O, is required: = 0.0001 [Equation 6]
This value cascades through the calculation with a recalculation of Γ, t* and finally to θg in Equation 1.
These calculations (with simplifications and minor variations) can also be found, in a summarised form, in PD 7974-3:2003 [14].

17 Final Work Stream Report BD 2887 (D28V2) 286860
Commercial in confidence © Building Research Establishment Ltd 2015
Printed on environmentally friendly paper
2.3.2 Radiation intensity from unprotected areas Using the value for the temperature of the hot gases in the compartment, θg, taken from above at the value of tmax, the radiation intensity Imax at each unprotected area is = [Equation 7]
Where σ is the Stefan Boltzmann constant (5.67 x 10⁻⁸ W/m2/K4), ɛ is the emissivity of the surface and Tmax is the absolute temperature of the hot gases (θg + 273 K). As it is assumed that the compartment has flashed over, the flames can be assumed to be optically thick and the emissivity can be taken as 1.0.
Moving away from the compartment openings, the radiation intensity, I, reduces depending on the distance and the size of the opening so that = [Equation 8]
Where φ is a view factor determined geometrically (note when the distance becomes very large with respect to the size of the opening this approaches the inverse square law).
The maximum value of radiation intensity received on the surface of a building from a fire at its neighbour should not be more than 12.6 kW/m2. This is based on the pilot ignition of wood after 10 minutes exposure. This may be considered to be conservative as a burning or other ignition source is required for fire spread. Some materials such as thermoplastics (e.g. downpipes) may soften and fall away before they ignite.
2.3.3 Calculation of separation distance Building elevations are usually rectangular and have regular distributions of unprotected areas (areas on the elevation having a lower fire resistance than the main structure, usually windows) over the total area. The total radiated energy from the building elevation can be calculated = [Equation 9]
This gives an average radiation intensity from elevation of Iaverage = Etotal/Aelevation where
= ∑ [Equation 10]
Therefore at the minimum separation distance is found when = 12.6 [Equation 11]

18 Final Work Stream Report BD 2887 (D28V2) 286860
Commercial in confidence © Building Research Establishment Ltd 2015
Printed on environmentally friendly paper
It is convenient to express the ratio of the unprotected areas to the elevation area as an “Unprotected Fraction” or “Unprotected Percentage”, so that
= 12.6 [Equation 12]
The total area enclosing the unprotected areas has been referred to in the context of the building, or compartment elevation; however, any rectangle that encloses the unprotected area could be used; in practice, the smallest enclosing rectangle gives the minimum error with the various calculation tools.
Calculating φ for the rectangular scenario considered so far requires evaluation of a complex equation. For a rectangle with a width W and height H, at a distance d from the centre of the rectangle, the view factor φ can be found from
= 2 √1 + √1 + + √1 + √1 + [Equation 13]
Where X = W/2d and Y=H/2d.
It is not possible to rearrange the above equation so that the distance can be calculated directly, so repeated calculations have to be performed testing different values of d until a value of φ is found to the required accuracy.
The view factor is calculated based on the size of the opening and temperature calculated from the parametric curve.
This allows the required separation distance to be calculated for the duration of the fire, Figure 6.

19 Final Work Stream Report BD 2887 (D28V2) 286860
Commercial in confidence © Building Research Establishment Ltd 2015
Printed on environmentally friendly paper
Figure 6 - Calculation of separation distance and temperature
Clearly, the separation distance between buildings cannot be varied as a fire progresses; however, a graph such as Figure 6 may be useful as it shows the time that the critical radiation intensity could be exceeded at various distances.
2.4 Review of glazing
To calculate minimum building separation distances, Building Regulations guidance considers the elevation of each fire compartment in a building and identifies areas on that elevation that have a fire resistance that is less than the fire resistance required for the compartment boundaries; these are referred to as unprotected areas. The unprotected areas are usually windows, doors and combustible materials greater than 1 mm thick on the external surface of a building. The calculation methods assume that all the unprotected areas on an elevation have failed and are assumed to be replaced by surfaces that emit thermal radiation.
In the original war time context, it was reasonable to assume that there would be total compartment involvement, due to multiple ignition sources, and all the unprotected areas may have failed due to blast damage.
When the building separation calculations were developed in the 1960s, most windows would have been single glazed and could be assumed to break easily. However, today (2015), windows are more likely to be double-glazed or laminated which may be more robust, in terms of integrity, during a fire. Consequently, glazing may remain in place and, by limiting the ventilation to the fire, either prevent or delay the onset of flashover reducing compartment temperatures and thereby the requirements for building separation.

20 Final Work Stream Report BD 2887 (D28V2) 286860
Commercial in confidence © Building Research Establishment Ltd 2015
Printed on environmentally friendly paper
2.4.1 Glass breaking mechanisms
2.4.1.1 Single glazing A single pane of glass exposed to a fire environment will be heated by convection from hot gases to the exposed surface and by absorption of thermal radiation passing through the glass. At the edges of a window pane, the glass will be shielded from the fire by the window frame. This creates a temperature gradient between the shielded and exposed parts of the glass which leads to large tensile stress developing which may become sufficient to break the glass. This mechanism has been analysed by Pagni [15] and implemented in the computer software BREAK1 [16].
2.4.1.2 Double glazing The presence of a second pane of glass in a window unit is more complex than the single glazed case as heat transfer across the gap between the panes of glass needs to be included. Most of the thermal radiation will be absorbed by the first pane and there may be little heating of the second pane before the first pane fails. Failure of the second pane may occur quickly after the first pane as it will be suddenly exposed to high fire temperatures compared to the relatively slow heating of the first pane which would follow the development of the fire [17].
2.4.1.3 Glass fallout The thermal analysis by Pagni outlined above does not consider the glass falling out of its frame once it has cracked. Some experimental work [18] has shown that for single panel float glass, there is only a small amount of fall out when the exposure is below 9 kW/m2.
For glass to fall out, several cracks have to form creating an isolated “island” that is not linked to the edge of the pane, Figure 7. The location of cracks depends on imperfections in the glass structure which will depend on installation and manufacturing process; this is difficult to predict and approaches using probabilistic methods are being developed [19, 20]. Fall out will also depend on external wind and internal pressures generated in the building due to the fire.
Figure 7 - Cracks in glazing forming an island that may fall out
Island formed by cracks

21 Final Work Stream Report BD 2887 (D28V2) 286860
Commercial in confidence © Building Research Establishment Ltd 2015
Printed on environmentally friendly paper
2.4.2 External fire spread and glazing Minimum building separation distances are determined from the total unprotected area in a building elevation. This usually corresponds to the window area. Assuming that all the windows in a fire compartment will fail instantly is a conservative assumption. If the glazing remains in place, then a fire may not develop to flashover as the limited ventilation will prevent the growth of the fire. However, breaking and fallout of glass will allow a fire to develop and may interact with the travelling fire spread mechanism.
It may be possible to develop a fire engineering analysis using a probabilistic approach for fire growth and glazing failure to give an indication of the probability of fire spread between buildings as a function of the separation distance as shown indicatively in Figure 8.
Figure 8 - Probabilistic approach to building separation
2.4.3 Conclusion of review of glazing In relation to the B4 requirement of the building regulations, the assumption of complete failure of glazing is a conservative approach when considered within the context of the random modes of actual glazing failures through crack formation and propagation and ultimately falling away.
2.5 Review of fires in large spaces
In a small enclosure, a fire will, if not controlled or limited by the availability of fuel or oxygen, grow from involving the initial burning item to the point where ignition of all the combustible surfaces in the space are involved. This is a consequence of the temperature in the compartment reaching the point (at about 500°C) where the thermal radiation from the flames and hot gases in the compartment is sufficient (in excess of 20 kW/m2) to ignite most common building materials or furnishings. The transition from an initial burning item to full involvement of the space is known as flashover and can be a very rapid event.
For some calculation procedures used in fire safety engineering (building separation and fire resistance), it is commonly assumed that this mode of behaviour occurs for all sizes of compartment and full involvement of a compartment is taken to be a worst case condition that will give a conservative (and thereby safe) result to the calculation.

22 Final Work Stream Report BD 2887 (D28V2) 286860
Commercial in confidence © Building Research Establishment Ltd 2015
Printed on environmentally friendly paper
Analysis of a fire in a compartment usually considers conditions before and after the flashover transition separately and a number of empirically based correlations have been developed to calculate either pre [21] or post [22] flashover temperatures. In addition, computer models have been developed to predict the development of a fire in a compartment (such as CFAST [10]. These calculations are quoted in fire engineering guidance such as PD 7974-1 [23] or CIBSE Guide E [24] and are currently used in fire safety design to fulfil requirements of Building Regulations. However, it must be noted that the data used to establish these (and similar) correlations were typically obtained from experiments involving small compartments (as small as 300mm cubes) under steady state conditions. While this is adequate for small compartments (e.g. domestic rooms and cellular offices), additional factors and mechanisms need to be considered for very large compartments.
2.5.1 Flashover in large spaces The usual definition of flashover used in standards is the ‘sudden transition from a localised fire to the ignition of all exposed flammable surfaces within an enclosure’ (e.g. PD 7974-1 [23] paragraph 3.15). This definition was established in the context of small rooms; however, in the large open spaces found in some modern buildings (especially warehouses) “flashover” may be limited (at least initially) to a localised part of the space.
In a small space, all the combustible items in the room will be relatively close to the initial flaming item, the fire can readily spread from item to item allowing the temperature in the compartment to reach the point at which thermal radiation from the hot gas layer is sufficient for all the exposed combustible surfaces to ignite. In Figure 9, the items marked A are heated directly from the flames on the initial burning item, however, all the other items in the compartment are heated to a lesser degree by thermal radiation from the walls and hot gas layer. As the fire progresses, the initial fire will grow and involve the items marked A, increasing the compartment temperatures and thereby the thermal radiation to the other items in the room.
Figure 9 - Small compartment
Figure 10 shows a large space containing the same items as shown in Figure 9.
A
A

23 Final Work Stream Report BD 2887 (D28V2) 286860
Commercial in confidence © Building Research Establishment Ltd 2015
Printed on environmentally friendly paper
Figure 10 - Large compartment
In this case, the radiation from the flames to the immediately adjacent items will be similar to the small compartment case. However, the temperature of the hot gases accumulating in the compartment will be much less than in the small compartment so that heating of the items more remote from the fire will be less and they may not reach the conditions required for ignition until the fire spreads to an immediately adjacent item. Consequently, over a long enough time period, although all the items in the large compartment scenario may be ignited the fire may travel progressively from item to item rather than rapidly jump and involve all the items simultaneously. This leads to the concept of a “travelling fire” which progresses through a compartment item by item. This may result in a lower average compartment temperature and longer burning time than a conventional flashed-over fire, alternatively this might be considered as a small localised fire zone moving through the compartment. This could have an impact on building separation and fire resistance calculations.
2.5.2 Travelling fires From the standards definition of flashover, a travelling fire is not a flashed-over fire as, by definition, not all of the combustible surfaces in an enclosure will be burning simultaneously and the fire remains a localised fire. However, it may be an important phase of development towards a flashover, or in some cases the ultimate development of a fire in a large space.
Figure 11 shows a fire in large compartment. As a new item ignites, items that were ignited earlier in the fire burn out as all the local combustible material is consumed.

24 Final Work Stream Report BD 2887 (D28V2) 286860
Commercial in confidence © Building Research Establishment Ltd 2015
Printed on environmentally friendly paper
Figure 11 - Travelling fire
Table 4, based on PD 7974-1 [23], gives values of the burning rate per unit area for a fuel controlled fire in different occupancies. This must be regarded with some caution as it may reflect an assumption used in the derivation of the values used in the tables. The origin of the data in PD 7974-1 has to be traced through a chain of references and is not, as stated in the standard, of USA origin but from the UK, based on surveys or fire statistics. The fire load density is based on a CIB programme that collated data from a number of surveys in different countries [25]. Fire load data was also reviewed as part of Work stream 1.
Table 4 - Fire duration for a unit area of fuel
Occupancy Average fire load density (MJ/m2 ) (A19)
Heat release rate per unit area (kW/m2) (Table 4)
Fire duration per unit area (minutes)
Office 420 290 24 Shop 600 550 18
The area of the travelling fire will depend on the location of the ignition source as shown in Figure 12 (other burning patterns are possible). The total burning area will determine the heat release rate of the fire. This assumes that the distribution of fuel is uniform, areas with higher fuel density will burn longer and areas with lower fuel density will burnout more quickly distorting the burning patterns shown in Figure 12.

25 Final Work Stream Report BD 2887 (D28V2) 286860
Commercial in confidence © Building Research Establishment Ltd 2015
Printed on environmentally friendly paper
Figure 12 - Alternative travelling fires
The figures for heat release rate per unit area given in Table 4 assume that the burning rate is not significantly changed by the conditions in the compartment while the fire remains fuel bed controlled. However, the heat release rate per unit area will depend on the thermal feedback between the compartment and the fuel surface; for high compartment temperatures or for high temperatures near the fire (i.e. for a ceiling jet), then the burning rate may be enhanced and the values from Table 4 may not be valid.
An on-going EPSRC project being conducted by the BRE Centre for Fire Engineering at Edinburgh University [26] has included an experimental programme to investigate the behaviour of travelling fires and highly insulated compartments.
2.5.3 Application of travelling fires If it can be shown that the fire development in a large compartment can be represented by a travelling fire, then a fire engineering design may result in:
• Reduced boundary/separation distances: The separation distance can be based on the extent of the burning region of the travelling fire and not the complete compartment elevation.
• Reduced fire resistance requirements: The fire resistance is based on the time period of localised heating of a structural element from the fire in travelling across the compartment and not the total duration of the fire in the compartment.
This alternative calculation approach may have a significant impact on the design of large buildings. However the associated calculation methods are still being developed and require the validation data that will be provided by experiments such as those from the on-going ‘Real Fires for the Safe Design of Tall Buildings’ project [26].
Linear fuel bed. End ignition
Linear fuel bed. Central ignition Radial spread from central ignition

26 Final Work Stream Report BD 2887 (D28V2) 286860
Commercial in confidence © Building Research Establishment Ltd 2015
Printed on environmentally friendly paper
2.5.4 Sprinkler protection Approved Document B [4] permits the reduction of the boundary distance if a building has a suitable sprinkler system. This assumes that the probability of successful sprinkler operation (maximum of 95% from PD 7974-7 [27], Table A 17) and thereby the probability of preventing building to building fire spread, is acceptable. In AD B, the calculated boundary distance may be reduced by a factor of 2, or the unprotected area doubled if a sprinkler system is installed.
The presence of an automatic sprinkler system in a building will not affect the response of the building exterior to thermal radiation from an adjacent building. However, if the unprotected areas on the exposed face of the building fail, sprinklers will control the spread of fire into the compartment. This is illustrated in Figure 13 where an external fire broke the windows and ignited items near the window (curtains and pelmet) but the operation of sprinklers prevented further items igniting.
Figure 13 - Fire spread from broken windows controlled by sprinklers (Photograph courtesy of Avon Fire and Rescue Service)
BRE is not aware of the origin of the value of 2 used in AD B to allow for the beneficial effects of sprinklers.
In the Scotland non-domestic technical handbook [28], the residential tables (Table B of [28]) may be used in place of normal fire load tables (Table A of [28]) if a suppression system is installed. It should be noted that NFPA 80A [29] considers that no exposure hazard is assumed to exist if the exposing building is fitted throughout with a properly installed and maintained automatic sprinkler system.

27 Final Work Stream Report BD 2887 (D28V2) 286860
Commercial in confidence © Building Research Establishment Ltd 2015
Printed on environmentally friendly paper
2.6 Experimental programme
Figures 2 and 3 show that while there have been a large number of experimental fires providing compartment temperature data for different compartment sizes and opening factors a relatively small number have considered the effect of thermal insulation. The impact of increasing thermal insulation is to increase the compartment temperature (as shown in Figure 3) which would have an impact on the required building separation distance.
Three fully-developed post-flashover fire experiments were conducted in support of Work stream 6. A specially designed compartment was used to carry out the experiments relevant to this work stream as well as providing additional information for other work streams within the research project.
These experiments have provided a set of data where the only variable changed between the experiments is the level of thermal insulation.
The compartment had internal dimensions of 3.6 m long, 3.6 m deep and 2.4 m high with provision for a 2.0 m high, 2.0 m wide opening in one wall. The walls of the compartment were built from medium density load bearing concrete blocks 100 mm thick (density 1400 kg/m3). The roof of the compartment was constructed from a reinforced concrete beam and block system supported on two of the block walls. The floor of the laboratory was protected by either plaster board sheets or sand.
To provide alternative levels of thermal insulation to the rig, non-combustible linings were selected to give thermal performance equivalent to walls and ceilings used in modern buildings. The insulation options and experimental programme are given in Table 5.
Table 5 – Experimental programme for Work stream 6
Experiment number
Work stream
Ventilation Insulation Roof structure
Date
1 6
(and 1)
Wall 1.5m2 Very high Closed 28th November 2013
2 6
(and 1)
Wall 1.5m2 High Closed 11th December 2013
3 6
(and 1)
Wall 1.5 m2 Low Closed 17th December 2013
The 2 m by 2 m opening provided access to the rig to change lining materials, construct the fire and to remove debris. During each fire, the opening was partly blocked to provide the wall ventilation required by each experiment.
The basic structure, prior to Experiment 1 is shown in Figure 14.

28 Final Work Stream Report BD 2887 (D28V2) 286860
Commercial in confidence © Building Research Establishment Ltd 2015
Printed on environmentally friendly paper
Figure 14 - View of the fire compartment looking in from front ventilation opening
To assist with the location of instrumentation and other items in the rig, a reference grid was devised. This is shown in Figure 15.
Figure 15 - Plan of rig showing reference grid and location of cribs
4
3
2
1
A B C D E
Opening

29 Final Work Stream Report BD 2887 (D28V2) 286860
Commercial in confidence © Building Research Establishment Ltd 2015
Printed on environmentally friendly paper
To provide alternative levels of thermal insulation, the rig included a non-combustible lining selected to give thermal performance equivalent to walls and ceilings used in modern buildings. The three options are given in Table 6.
Table 6 - Thermal insulation
Level Relative degree of insulation
Construction Thermal properties U value (W/m2K)
1 Low Walls: Block work, no lining Conductivity 0.42 W/mK Thermal inertia 660 J/m2s1/2K
3.33
Roof: Precast concrete beam and block floor
Conductivity 1.0 W/mK Thermal inertia 1100 J/m2s1/2K
2.36
2 High Walls: Block work, lined with plasterboard
Conductivity 0.24 W/mK Thermal inertia 520 J/m2s1/2K
1.64
Roof: Precast concrete beam and block floor lined with plasterboard
Conductivity 0.24 W/mK Thermal inertia 520 J/m2s1/2K
1.90
3 Very high Walls: Block work lined with ceramic blanket
Conductivity 0.02 W/mK Thermal inertia 54 J/m2s1/2K
0.36
Roof: Precast concrete beam and block floor lined with ceramic blanket
Conductivity 0.02 W/mK Thermal inertia 54 J/m2s1/2K
0.59
The key dimensions and material properties of the experimental rig are summarised as follows.
Internal dimensions:
Width 3.6 m
Depth 3.6 m
Height 2.4 m
Wall block thickness: 100 mm
Insulation thickness:
Ceramic fibre: 25 mm
Plasterboard: 12.5 mm
Wall opening: 2.0 m by 2.0 m
Blocked to 1.5 m wide by 1.0 m high opening in Experiments 1, 2 and 3

30 Final Work Stream Report BD 2887 (D28V2) 286860
Commercial in confidence © Building Research Establishment Ltd 2015
Printed on environmentally friendly paper
Material properties: Table 7 - Thermal properties for compartment linings
Material Density (ρ)
Conductivity (k)
Specific heat capacity (c)
Thermal inertia ( = )
(kg/m3) (W/m/K) (J/kg/K) (J/m2s1/2K)
Block work 1375 0.42 753 660
Plasterboard 900 0.24 1250 520
Sand 1750 1.0 800 1185
Ceramic fibre
128 0.02 1130 54
For each experiment, a fire load of 570 MJ/m2 (averaged over the entire floor area) has been used.
For Experiments 1 to 3, the fire load was distributed across six wooden cribs made up of 1 m long 50 mm square section Scots pine timber sticks with a moisture content of less than 13%. The sticks were arranged in seven layers of ten sticks as shown in Figure 16. Figure 15 shows the locations of the cribs centred at locations B2, C2, D2, B3, C3, and D3. The crib at location C2 was constructed on a weighting platform; this raised its upper surface by approximately 150 mm (see Figure 16).
Figure 16 - View of cribs inside rig prior to Experiment 1

31 Final Work Stream Report BD 2887 (D28V2) 286860
Commercial in confidence © Building Research Establishment Ltd 2015
Printed on environmentally friendly paper
The common instrumentation for all the experiments was:
• Six thermocouple columns at locations B2, C2, D2, B3, C3, and D3.
• Each column had thermocouples at distances of 100, 400, 600, 1000 and 1400 mm from the ceiling.
• Weighing platform under crib C3.
• Two sets of three wall thermocouples (exposed side, middle, unexposed side) at grid lines A and 4.
Experiments 1 to 3 with a wall opening included heat flux meters at 4 m from the centre of the opening (1.4 m from the floor) and wood targets at 1 m and 3 m.
Experiments 1 to 3 included an array of six velocity measurement probes and thermocouples as shown in Figure 14. The instruments were located on the centre line of the opening at 1/5, 2/5, 3/5 and 4/5 of the depth from the top of the opening and one at ¼ and ¾ width of the opening and 1/5 from the top of the opening.
The data were recorded using a data logger scanning each channel every 2.5 seconds.
Each experiment was recorded with at least one fixed video camera and observers took still and video images together with visual observation notes.
2.6.1 Experiment 1 - details and observations
Date and time: 28th November 2013 at 14:00
Ventilation: Wall opening 1.5 m wide, 1.0 m high, sill 0.9m above floor.
Ventilation factor ( √ ) = 1.5 m3/2
Opening Factor ( √ ) = 1.5/47.5 = 0.032 m1/2
Insulation: Very high (see Table 6)
Thermal inertia, b = 54 J/m2s1/2K
Fire load: Six wood cribs, fire load = 570 MJ/m2
Observations: Laboratory ambient temperature = 10°C prior to ignition

32 Final Work Stream Report BD 2887 (D28V2) 286860
Commercial in confidence © Building Research Establishment Ltd 2015
Printed on environmentally friendly paper
Table 8 – Experiment 1 observations
Time (mins: secs)
Observation
-5:00 Ignition countdown started: data logging begins 0:00 Ignition started 1:30 Ignition established, lower section of opening in place 3:00 Flames tips at sill level 7:00 Flame tips reach compartment ceiling 7:50 Flames leave compartment 7:50 Intumescent on indicative specimen activated 8:00 Flashover 10:00 Strong external flaming black smoke. Smoke from Target 1 12:00 Smoke from Target 2 17:00 Mass loss instrumentation fails 30:30 Target 1 falls from stand 40:00 Frame over sill falls away 53:00 Spalling of roof – test terminated 57:00 Explosive failure of lintel 90:00 Data logging stopped
2.6.2 Experiment 1 – results Figure 17 shows the spatially-averaged temperature of the six thermocouples mounted 1 m below the ceiling (at approximately the centre height of the opening) and some of the key events during the experiment.
Figure 17 - Average temperature 1 m below ceiling and key events for Experiment 1
To illustrate the severity of the conditions in the compartment, Figure 18 shows a comparison between the average temperature 1 m below the ceiling and the standard “fire resistance” curves [14]

33 Final Work Stream Report BD 2887 (D28V2) 286860
Commercial in confidence © Building Research Establishment Ltd 2015
Printed on environmentally friendly paper
Figure 18 - Average temperature 1 m below ceiling and “fire resistance curves” for Experiment 1
Figure 19 summarises the development of the fire using a series of “snapshots” of the data at key times during the experiment. These show an image of the fire, the vertical temperature profile at location C3 (above the back centre crib), an approximate calculation of heat release rate based on the weighing platform data, maximum temperature recorded and the radiation intensity 4 m from the centre of the opening. An indication of the heat release is calculated from the mass loss rate obtained for crib C2. The assumption is that the mass loss rate from the other cribs is identical and that the heat release rate is given by a two minute time averaged mass loss rate multiplied by the heat of combustion for timber (17.5 MJ/kg). The weighting platform failed at 15 minutes.

34 Final Work Stream Report BD 2887 (D28V2) 286860
Commercial in confidence © Building Research Establishment Ltd 2015
Printed on environmentally friendly paper
Heat release rate 0.8 MW
Maximum Temperature 247°C
Radiation intensity at 4 m, 0.05 kW/m2
5 minutes (Pre flashover)
Heat release rate 3.5 MW
Maximum Temperature 830°C
Radiation intensity at 4 m, 2.7 kW/m2
8 minutes (Flashover)
Heat release rate 3.5 MW
Maximum Temperature 950°C
Radiation intensity at 4 m, 2.7 kW/m2
9 minutes (Post flashover)
Heat release rate 3.5 MW
Maximum Temperature 1131°C
Radiation intensity at 4 m, 4.7 kW/m2
12 minutes

35 Final Work Stream Report BD 2887 (D28V2) 286860
Commercial in confidence © Building Research Establishment Ltd 2015
Printed on environmentally friendly paper
Maximum Temperature 1162°C
Radiation intensity at 4 m, 5.6 kW/m2
15 minutes
Maximum Temperature 1158°C
Radiation intensity at 4 m, 6.3 kW/m2
17 minutes (end of mass loss data)
Maximum Temperature 1230°C
Radiation intensity at 4 m, 8.6kW/m2
30 minutes (prior to target at 2m falling away)
Maximum Temperature 1231°C
Radiation intensity at 4 m, 9.4 kW/m2
40 minutes (frame above sill falls away)
Maximum Temperature 1213°C
Radiation intensity at 4 m, 10.2 kW/m2

36 Final Work Stream Report BD 2887 (D28V2) 286860
Commercial in confidence © Building Research Establishment Ltd 2015
Printed on environmentally friendly paper
45 minutes
Maximum Temperature 1211°C
Radiation intensity at 4 m, 9.3 kW/m2
50 minutes
Maximum Temperature 1172°C
Radiation intensity at 4 m, 7.7 kW/m2
53 minutes (at termination)
Figure 19 - Time line for Experiment 1
37 Final Work Stream Report BD 2887 (D28V2) 286860
Commercial in confidence © Building Research Establishment Ltd 2015
Printed on environmentally friendly paper
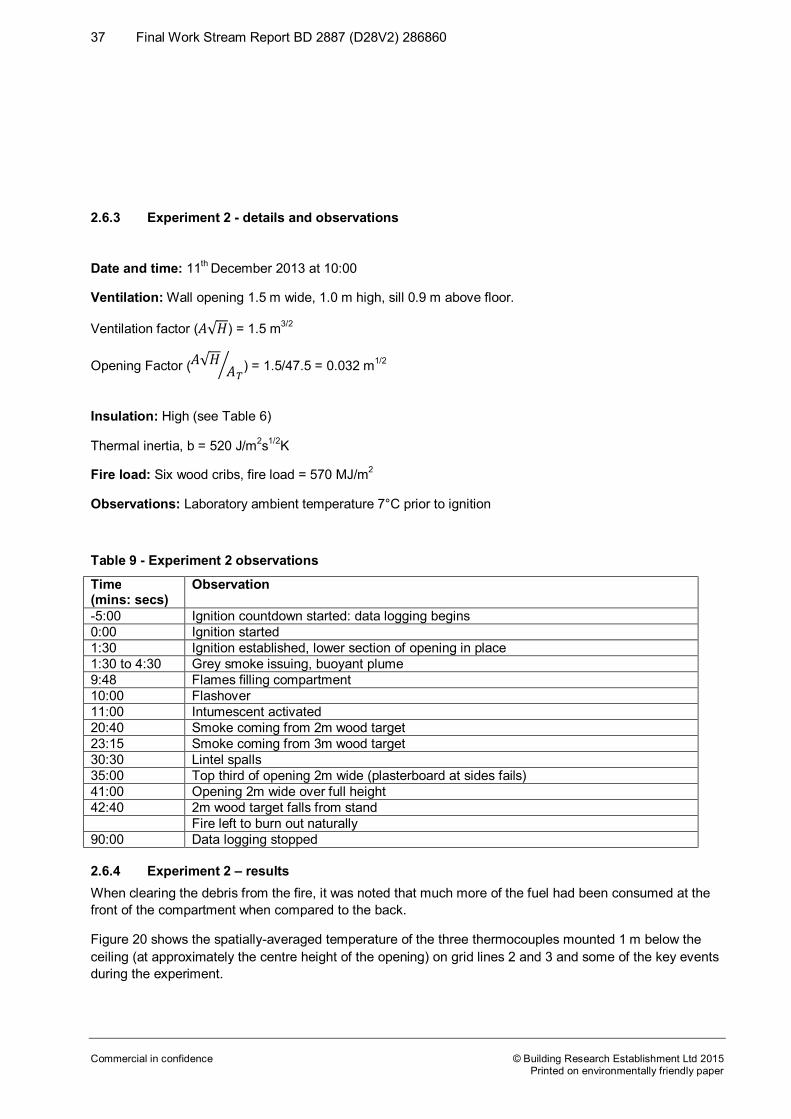
2.6.3 Experiment 2 - details and observations
Date and time: 11th December 2013 at 10:00
Ventilation: Wall opening 1.5 m wide, 1.0 m high, sill 0.9 m above floor.
Ventilation factor ( √ ) = 1.5 m3/2
Opening Factor ( √ ) = 1.5/47.5 = 0.032 m1/2
Insulation: High (see Table 6)
Thermal inertia, b = 520 J/m2s1/2K
Fire load: Six wood cribs, fire load = 570 MJ/m2
Observations: Laboratory ambient temperature 7°C prior to ignition
Table 9 - Experiment 2 observations
Time (mins: secs)
Observation
-5:00 Ignition countdown started: data logging begins 0:00 Ignition started 1:30 Ignition established, lower section of opening in place 1:30 to 4:30 Grey smoke issuing, buoyant plume 9:48 Flames filling compartment 10:00 Flashover 11:00 Intumescent activated 20:40 Smoke coming from 2m wood target 23:15 Smoke coming from 3m wood target 30:30 Lintel spalls 35:00 Top third of opening 2m wide (plasterboard at sides fails) 41:00 Opening 2m wide over full height 42:40 2m wood target falls from stand Fire left to burn out naturally 90:00 Data logging stopped
2.6.4 Experiment 2 – results When clearing the debris from the fire, it was noted that much more of the fuel had been consumed at the front of the compartment when compared to the back.
Figure 20 shows the spatially-averaged temperature of the three thermocouples mounted 1 m below the ceiling (at approximately the centre height of the opening) on grid lines 2 and 3 and some of the key events during the experiment.

38 Final Work Stream Report BD 2887 (D28V2) 286860
Commercial in confidence © Building Research Establishment Ltd 2015
Printed on environmentally friendly paper
Figure 20 - Average temperature 1 m below ceiling and key events for Experiment 2
To illustrate the severity of the conditions in the compartment, Figure 21 shows a comparison between the average temperature 1 m below the ceiling and the standard “fire resistance” curves.
Figure 21 - Average temperature 1 m below ceiling and standard “fire resistance curves” for Experiment 2
Figure 22 summarises the development of the fire using a series of “snapshots” of the data at key times during the experiment. This shows an image of the fire, the vertical temperature profile at location C3 (above the back centre crib an indication of heat release rate based on the weighing platform data as described previously, maximum temperature recorded and the radiation intensity 4 m from the centre of the opening.

39 Final Work Stream Report BD 2887 (D28V2) 286860
Commercial in confidence © Building Research Establishment Ltd 2015
Printed on environmentally friendly paper
Heat release rate 1.3 MW
Maximum Temperature 180°C
Radiation intensity at 4 m, 0.03 kW/m2
5 minutes (Pre flashover)
Heat release rate 1.3 MW
Maximum Temperature 593°C
Radiation intensity at 4 m, 0.47 kW/m2
10 minutes (Flashover)
Heat release rate 1.3 MW
Maximum Temperature 788°C
Radiation intensity at 4 m, 1.3 kW/m2
11 minutes (Post flashover)
Heat release rate No data
Maximum Temperature 837°C
Radiation intensity at 4 m, 2.5 kW/m2
15 minutes
Heat release rate 1.9 MW
Maximum Temperature 966°C
Radiation intensity at 4 m, 4.0 kW/m2

40 Final Work Stream Report BD 2887 (D28V2) 286860
Commercial in confidence © Building Research Establishment Ltd 2015
Printed on environmentally friendly paper
20 minutes
Heat release rate 2.3 MW
Maximum Temperature 1127°C
Radiation intensity at 4 m, 8.0 kW/m2
30 minutes
Heat release rate 2.7 MW
Maximum Temperature 1190°C
Radiation intensity at 4 m, 10.6 kW/m2
40 minutes
Maximum Temperature 1195°C
Radiation intensity at 4 m, 9.6 kW/m2
50 minutes
Figure 22 - Time line for Experiment 2

41 Final Work Stream Report BD 2887 (D28V2) 286860
Commercial in confidence © Building Research Establishment Ltd 2015
Printed on environmentally friendly paper
2.6.5 Experiment 3 - details and observations
Date and time: 17th December 2013 at 15:00
Ventilation: Wall opening 1.5 m wide, 1.0 m high, sill 0.9 m above floor.
Ventilation factor ( √ ) = 1.5 m3/2
Opening Factor ( √ ) = 1.5/47.5 = 0.032 m1/2
Insulation: Low (see Table 6)
Thermal inertia, b = 660 J/m2s1/2K
Fire load: Six wood cribs, fire load = 570 MJ/m2
Observations: Laboratory ambient temperature 9°C prior to ignition
Table 10 - Experiment 3 observations
Time
(mins: secs)
Observation
-5:00 Ignition countdown started: data logging begins 0:00 Ignition started 1:30 Ignition established, lower section of opening in place 1:50 Buoyant smoke plume rising from compartment 8:28 Intumescent starts to activate 11:57 Flames just starts to come out of opening 12:50 Intermittent flames out of opening 14:28 Back of compartment visible 16:16 Back of compartment visible; appears as though one crib is out 23:00 Flashover 23:29 Fire “picking up” 28:25 Insulation went 32:35 Back of compartment visible 35:30 Test terminated due to development of severe cracks in structure of rig 90:00 Data logging stopped Post test Due to the damage to the experimental rig that occurred, it was decided not
attempt another experiment with exposed blockwork until the end of the programme.

42 Final Work Stream Report BD 2887 (D28V2) 286860
Commercial in confidence © Building Research Establishment Ltd 2015
Printed on environmentally friendly paper
2.6.6 Experiment 3 – results Figure 23 shows the spatially-averaged temperature of the six thermocouples mounted 1 m below the ceiling (at approximately the centre height of the opening) and some of the key events during the experiment.
Figure 23 - Average temperature 1 m below the ceiling and key events for Experiment 3
To illustrate the severity of the conditions in the compartment, Figure 24 shows a comparison between the average temperature 1m below the ceiling and the “fire resistance” curves [14].
Figure 24 - Average temperature 1 m below the ceiling and “fire resistance curves” for Experiment 3
Figure 25 summarises the development of the fire using a series of “snapshots” of the data at key times during the experiment. This shows an image of the fire, the vertical temperature profile at location C3 (above the back centre crib), maximum temperature recorded and the radiation intensity 4 m from the centre of the opening.

43 Final Work Stream Report BD 2887 (D28V2) 286860
Commercial in confidence © Building Research Establishment Ltd 2015
Printed on environmentally friendly paper
Maximum Temperature 219°C
Radiation intensity at 4 m, 0.01 kW/m2
5 minutes
Maximum Temperature 647°C
Radiation intensity at 4 m, 0.43 kW/m2
10 minutes
Maximum Temperature 728°C
Radiation intensity at 4 m, 1.1 kW/m2
15 minutes
Maximum Temperature 731°C
Radiation intensity at 4 m, 1.34 kW/m2
20 minutes

44 Final Work Stream Report BD 2887 (D28V2) 286860
Commercial in confidence © Building Research Establishment Ltd 2015
Printed on environmentally friendly paper
Maximum Temperature 797°C
Radiation intensity at 4 m, 1.7 kW/m2
23 minutes (flashover)
Maximum Temperature 884°C
Radiation intensity at 4 m, 2.4 kW/m2
25minutes
Maximum Temperature 910°C
Radiation intensity at 4 m, 2.7 kW/m2
27 minutes (Left hand side panel moves)
Maximum Temperature 942°C
Radiation intensity at 4 m, 3.2 kW/m2
29 minutes
Figure 25 – Timeline for Experiment 3

45 Final Work Stream Report BD 2887 (D28V2) 286860
Commercial in confidence © Building Research Establishment Ltd 2015
Printed on environmentally friendly paper
2.7 Data Analysis
2.7.1 Current methods - BRE data and space separation Using Equations 7 and 13 (the basis of the enclosing rectangle method presented in BR187) the radiation intensity from the opening can be calculated at different distances using the opening radiation intensities recommended in AD B, Figure 26.
Figure 26 - Radiation calculation based on Equations 7 and 13
The experimental measurement was made at a distance of 4 m during each of the BRE experiments; the maximum values for the unshielded measurements are shown in Table 11.
Table 11 - Radiation measurements and calculations at 4 m from opening
Source Radiation Intensity
(kW/m2)
Experiment 1 (high insulation) 10*
Experiment 2 (medium insulation) 11
Experiment 3 (low insulation) 4
Calculated (low fire load) 2.4
Calculated (high fire load) 4.8
* Shielded measurement only

46 Final Work Stream Report BD 2887 (D28V2) 286860
Commercial in confidence © Building Research Establishment Ltd 2015
Printed on environmentally friendly paper
The fire load used in the experiments was 570 MJ/m2 equivalent to 32 kg/m2 of wood so that the high fire load calculation would be suitable for comparison with the measured data. This indicates that the current methods are adequate for compartments with low levels of thermal insulation.
2.7.2 Parametric curves - BRE data and space separation The objective of linking the parametric time temperature curves to the building separation requirements is to provide an indication of sensitivity of separation distances to various building parameters, especially thermal insulation. Eurocode 1 [12] notes that the Equation 1 is valid for values of b (the thermal properties of the enclosure) between 100 and 2200 Jm-2s-1/2K-1. However, PD 7974-3 [14] is more cautious suggesting a lower limit of 1000 Jm-2s-1/2K-1 noting that great care should be taken using the equation for highly insulated compartments where b is less than 720 Jm-2s-1/2K-1.
Table 12 gives the values of b and its components for common building materials taken from PD 7974-3 Table A1.
Table 12 - Thermal properties of common building materials
Material Thermal conductivity (Wm-1K-1)
Density
(kg/m3)
Specific heat capacity
(J/kg/K)
b
(Jm-2s-1/2K-1)
Clay brick 0.69 1600 837 961
Fireclay brick 1.04 2050 962 1432
Concrete (normal density)
1.47 2400 879 1650
Aerated concrete 0.3 620 800 386
Gypsum plaster 0.48 1442 837 761
Wood (pine)
0.15 432 2803 426
Mineral wool 0.04 20-200 840 426
The BRE experimental programme was intended to extend the amount of data that is available for fires in highly insulated buildings. A single test compartment was used with different lining materials to provided different levels of insulation. These are given in Table 13.

47 Final Work Stream Report BD 2887 (D28V2) 286860
Commercial in confidence © Building Research Establishment Ltd 2015
Printed on environmentally friendly paper
Table 13 – Insulation details for BRE experimental programme
Insulation Level
Element Construction Density Conductivity Specific heat capacity
B
kg/m3 W/m/K J/kg/K J/m2/K/s1/2 Low Walls Block work 1375 0.42 753 660 Roof Concrete
blocks 2034
Floor Sand 1750 1.0 800 1185 High Walls Block work
and plasterboard
900 0.24 1250 520
Roof Concrete blocks and plaster board
520
Floor Sand 1185 Very high Walls Block work
and ceramic fibre
128 0.02 1130 54
Roof Concrete blocks and ceramic fibre
54
Floor Plasterboard 520 To obtain an overall b value for the compartment an area weighted average is found = 1( − ) + + [Equation 14]
The results of Equation 14 for the materials used in each of the BRE experiments are given in Table 14.
Table 14 - “b values” for BRE experimental programme Experiment Insulation level Area weighted b
value 3 Low 1094 2 High 680 1 Very high 157
Figure 27 shows the resulting parametric temperature curves for the BRE Experimental programme (Experiments 1 to 3).

48 Final Work Stream Report BD 2887 (D28V2) 286860
Commercial in confidence © Building Research Establishment Ltd 2015
Printed on environmentally friendly paper
Figure 27 - Parametric temperature curves for the BRE experimental programme
The predictions of peak time and temperatures are compared with the measured data in Table 15.
Table 15 - Comparison of BRE experiments and predictions
Maximum temperature (measured/predicted)
Time to maximum temperature (measured/predicted)
Experiment 1 0.97 0.76 Experiment 2 1.17 0.76 Experiment 3 1.14 0.59
The comparison with the BRE experiments and other reported data (as discussed in the Work stream 1 report) show that in the majority of cases the predicted temperature is within 20% of the measured temperature value for a range of opening sizes, compartment sizes and insulation conditions. This provides confidence the predictive method.
The BRE experiments also included measurements of radiation intensity in line with the centre of the compartment opening. Two measurement devices were used, one had an unobstructed view of the compartment and any external flaming whist the other had a shield so that it only measured radiation from the opening. The difference between the two measurements was intended to give an indication of the proportion of the radiation due to external flaming.
The radiation intensity has also been calculated from the parametric curves for each of the experiments using Equation 7.
In each case, it would be expected the shielded instrument to give values close to the 4 m prediction from the parametric curves. This is because the prediction shown in the figure is based on a hot surface the size
Parametric time-temperature curves

49 Final Work Stream Report BD 2887 (D28V2) 286860
Commercial in confidence © Building Research Establishment Ltd 2015
Printed on environmentally friendly paper
of the window and does not include external flaming. Note the shielded heat flux meter was found to be faulty during Experiment 1.
Figure 28 shows the comparison between the measured and predicted radiation intensity.
Measured data Prediction
Figure 28 – Measured and predicted parametric curves for each experiment
As the parametric curves over predict the compartment temperature for Experiments 2 and 3, an over prediction of radiation intensity would also be expected.
Focusing on Experiment 3, removes the complication of external flame which, as can be seen on photographs (see Figure 25) and by the similarity of the two radiation intensity measurements, was not significant during the experiment. Taking the predicted maximum temperature of ~800°C and multiplying by 1.14 to account for the difference between measurement and prediction (see Table15) gives a temperature of 912°C. This leads to a prediction of radiation intensity of 3.2 kW/m2 at a distance of 4 m, which agrees with the measured value.
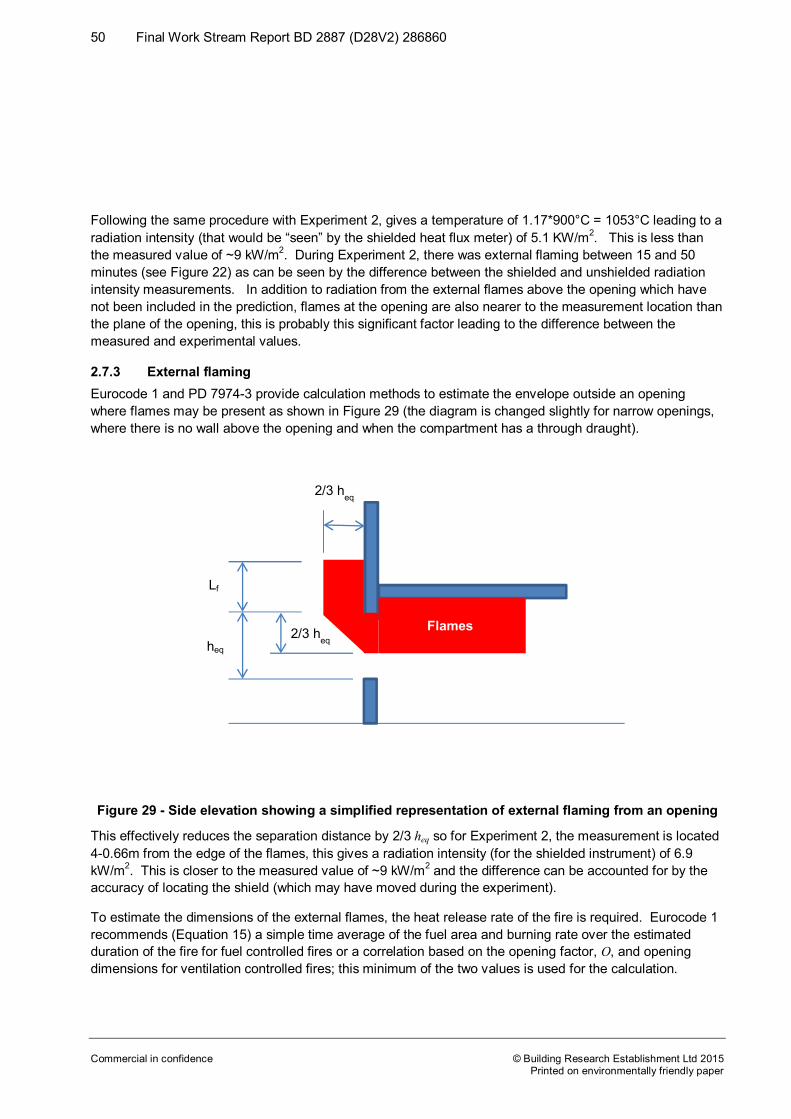
50 Final Work Stream Report BD 2887 (D28V2) 286860
Commercial in confidence © Building Research Establishment Ltd 2015
Printed on environmentally friendly paper
Following the same procedure with Experiment 2, gives a temperature of 1.17*900°C = 1053°C leading to a radiation intensity (that would be “seen” by the shielded heat flux meter) of 5.1 KW/m2. This is less than the measured value of ~9 kW/m2. During Experiment 2, there was external flaming between 15 and 50 minutes (see Figure 22) as can be seen by the difference between the shielded and unshielded radiation intensity measurements. In addition to radiation from the external flames above the opening which have not been included in the prediction, flames at the opening are also nearer to the measurement location than the plane of the opening, this is probably this significant factor leading to the difference between the measured and experimental values.
2.7.3 External flaming Eurocode 1 and PD 7974-3 provide calculation methods to estimate the envelope outside an opening where flames may be present as shown in Figure 29 (the diagram is changed slightly for narrow openings, where there is no wall above the opening and when the compartment has a through draught).
Figure 29 - Side elevation showing a simplified representation of external flaming from an opening
This effectively reduces the separation distance by 2/3 heq so for Experiment 2, the measurement is located 4-0.66m from the edge of the flames, this gives a radiation intensity (for the shielded instrument) of 6.9 kW/m2. This is closer to the measured value of ~9 kW/m2 and the difference can be accounted for by the accuracy of locating the shield (which may have moved during the experiment).
To estimate the dimensions of the external flames, the heat release rate of the fire is required. Eurocode 1 recommends (Equation 15) a simple time average of the fuel area and burning rate over the estimated duration of the fire for fuel controlled fires or a correlation based on the opening factor, O, and opening dimensions for ventilation controlled fires; this minimum of the two values is used for the calculation.
heq 2/3 heq
2/3 heq
Lf
Flames

51 Final Work Stream Report BD 2887 (D28V2) 286860
Commercial in confidence © Building Research Establishment Ltd 2015
Printed on environmentally friendly paper
= ; 3.15 1 − . MW [Equation 15]
Where τ is the free burning fire duration and is taken to be 1200s.
PD 7974-3 requires the burning rate of the fire (the heat release rate divided by the heat of combustion of the fuel) but does not make a recommendation of how it should be calculated for the purpose of estimating the height of external flames.
The flame height from the top of the opening, LL, is then, from Eurocode 1:
= 1.9 / − ℎ [Equation 16]
And from PD 7974-3
= 12.8 / − ℎ [Equation 17]
Note: Q = Rhc, using hc = 17.5 MJ/kg (a typical value for wood) then these expressions are equivalent.
Applying Equations 15 and 16 to the BRE experiments, gives a heat release rate of 3.6 MW (ventilation control) and a flame height above the opening of 2.4 m for all of the experiments. The value is the same in all the experiments because Equation 15 does not include a factor for the insulation of the compartment. This implies that the ventilation controlled estimate of the fire heat release rate, Q, in Equation 15 has been derived for a specific range of thermal insulation values.
As part of the BRE experimental programme, an attempt was made to measure the burning rate of the fire using a weighing platform under one of the cribs. It was assumed that the burning rate of each crib would be similar, as they were all be ignited simultaneously. The total burning rate was then approximated by simply multiplying the measured data by the number of cribs. Obviously, using weighing platforms in compartment fires with post flashover fires has a number of practical difficulties, most obviously damage to the sensors and disturbances due to any falling debris and collapse of the fire source as the fire develops. As a consequence, the data obtained are indicative due to the high uncertainty associated with factors that cannot be controlled experimentally. Despite the indicative nature of the measurements, there is a trend showing at higher levels of compartment insulation there was more external flaming and a higher total heat release rate of the fire for the same fire load and ventilation conditions. Values taken from Figures 19, 22 and 25 are shown in Table 16 with calculations of the flame length using Equation 15 and the indicative measured heat release rate.

52 Final Work Stream Report BD 2887 (D28V2) 286860
Commercial in confidence © Building Research Establishment Ltd 2015
Printed on environmentally friendly paper
Table 16 - Measured heat release rate
Experiment Measured Heat Release Rate
Observed external flaming
Predicted flame length based on measured heat release rate using Equation 16
(m)
1 3.5 MW at 12 minutes Yes 2.3
2 2.3 MW to 2.7 MW 20 to 40 minutes
Some 1.6
3 1.8 MW 15-30 minutes Little 1.1
Figure 30 is a photograph, taken during Experiment 1, showing external flaming from the side of the enclosure.
Figure 30 - External flaming during Experiment 1
Figure 30 can be compared to Figure 29 and shows flames 1.5 m (Lf) above the top of the opening projecting 0.7 m from the wall. In this case the prediction of flame projection (2/3 heq) is close to the observed value; however, the flame length is over predicted.

53 Final Work Stream Report BD 2887 (D28V2) 286860
Commercial in confidence © Building Research Establishment Ltd 2015
Printed on environmentally friendly paper
2.7.4 Discussion of building separation The BRE experiments have shown that, for small compartments with higher levels of thermal insulation, the current building separations may not be conservative due to the presence of external flaming which, in turn, may be a consequence of higher compartment temperatures.
An approach to analysing this using the parametric time-temperature curves presented in Eurocode 1 and PD 7974-3 is only partly successful as the estimate of fire heat release rate given in these standards is independent of the thermal properties of the compartment. In addition, the 20% difference between the measured values and the predictions (found in Work stream 1) of the parametric temperature curves will lead to an unacceptable discrepancy in the calculation of radiation intensity due to the values being raised to the fourth power (in Equation 7). Consequently, the available calculation methods to predict the extent of external flaming are not comprehensive enough or sufficiently precise to provide reliable estimates of thermal radiation intensity and thereby separation distances.
The work considered under this work stream has provided validation for design methods already in the public domain and already in widespread use for buildings that do not have very high levels of thermal insulation. For buildings with high insulation, the current design methods in AD B and BR187 may not be conservative. Comparing the boundary distance required for equivalent building elevations with temperatures of 1040°C (the current normal fire load) and 1150°C (from Figure 17, temperature measurements from Experiment 1) gives an increase of 20% to 40% for the higher temperature, see Figure 31.
Figure 31 - Comparison of boundary distances for temperatures of 1040°C and 1150°C
Figure 31 shows that the changes in compartment temperature observed in the experimental programme would have a significant impact on the calculation of boundary distances.
Using an alternative presentation of the data in Figure 31, in Figure 32 it can be seen that, if the unprotected area is reduced from 100% to about 70%, then the boundary distances for both the temperatures are equal. As a simple rule of thumb, the unprotected area of a highly insulated building should be 70% of the area of a less well insulated building to maintain the same separation distance.

54 Final Work Stream Report BD 2887 (D28V2) 286860
Commercial in confidence © Building Research Establishment Ltd 2015
Printed on environmentally friendly paper
Figure 32 - Comparison of unprotected percentages for alternative compartment temperatures
This is because, for a fixed boundary distance, the view factor will be the same for each compartment temperature.
So from Equation 7: = [Equation 18]
Where U is the unprotected percentage and T is the compartment temperature (K)
Or
= [Equation 19]
If Tpoor = 1040°C (1313K) and Thigh =1150°C (1423K) then
Uhigh = 0.72 Upoor
However, this does not include the impact of any external flaming.
The BRE experimental programme has indicated that the detailed calculations to predict the extent of external flaming presented in Eurocode 1 and PD 7974-3 could be unduly onerous due to over prediction of the external flaming envelope and that the capability to reliably predict the extent of external flaming (if any), depending on the level of thermal insulation of a compartment, needs to be developed before building separation distance requirements can be modified.
2.7.5 Cost benefit analysis As specific changes cannot be proposed to either the guidance or the regulations at this time, a cost benefit analysis has not been conducted for this work stream.

55 Final Work Stream Report BD 2887 (D28V2) 286860
Commercial in confidence © Building Research Establishment Ltd 2015
Printed on environmentally friendly paper
3 Conclusions The principal objective of this work stream was to produce robust evidence and data to explore alternative approaches to the specification of fire building separation distances in Approved Document B if they are found to be inadequate.
The conclusions of this work stream are as follows:
• The experimental programme has confirmed that, for buildings with low levels of insulation, the current approaches in Approved Document B and BR187 are adequate. Improving the levels of thermal insulation to those recommended by Approved Document L may lead to higher fire temperatures; these can be compensated for by reducing the unprotected area of an elevation by 70%. However, this does not include the impact of any external flaming.
• Calculation of the extent of the external flame envelope using the methods in Eurocode 1 and Publication Draft PD 7974-3 is not dependent on the level of thermal insulation in a compartment and cannot therefore be used as part of a building separation calculation.
• Methods to predict the extent of external flaming from compartments need to be extended to include the impact of high levels of compartment insulation.
4 Acknowledgements The authors, Richard Chitty and Tom Lennon, would particularly like to acknowledge the valuable contribution provided by the following:
• Satellite Steering Group B and the overall Project Steering Group.
• BRE colleague: Corinne Williams.
• BRE experimental team for Experiments 1 to 6: Tom Lennon, Phil Clark, Simon Barrow, Harry Granados.
• Steering Group member companies who contributed materials for construction, rig linings and indicative test specimens for BRE Experiments 1 to 6: The Concrete industry, beam and block floor and blocks for walls, ASFP, plasterboard for linings, insulation blanket, indicative specimens.
• Steering Group members who provided specialist advice in relation to the construction of the experimental rig.

56 Final Work Stream Report BD 2887 (D28V2) 286860
Commercial in confidence © Building Research Establishment Ltd 2015
Printed on environmentally friendly paper
1. ReferencesR E H Read, External fire spread: building separation and boundary distances, BRE, 1991.
2. P H Thomas, A J M Heselden, Fully-developed fires in single compartments. A co-operative research programme of the Conseil International du Bâtiment (CIB) Report No 20, Fire Research Station Note 923, Fire Research Station, 1972.
3. D Moore and T Lennon, The natural fire safety concept – full scale tests at Cardington, Fire Safety Journal, 38, pp603-643, 2003.
4. Department for Communities and Local Government. The Building Regulations 2010 (England). Approved Document B: Fire safety. Volume 1: Dwellinghouses (2006 edition incorporating 2010 and 2013 amendments). Volume 2: Buildings other than dwellinghouses (2006 edition incorporating 2010 and 2013 amendments).
5. R Chitty, External fire spread: building separation and boundary distances, second edition, IHS, 2014.
6. S B Hamilton, A short history of the structural fire protection of buildings, particularly in England’ Department of Scientific and Industrial Research, National Building Studies Special Report 27. London, HMSO, 1958.
7. Structural protection of buildings against small incendiary bombs and spread of fire. Part 2: Lateral protection, Bulletin C.29, Ministry of Home Security – Research and Experiments Department, 1943.
8. Building Regulations section F 1976.
9. Department for Communities and Local Government. The Building Regulations 2010 (England). Approved Document L1A: Conservation of Fuel and Power in new buildings, 2013 edition for use in England.
10. W Jones et al, CFAST – Consolidated Model of fire growth and smoke transport (version 6) Technical reference guide, NIST Special Publication 1026, May 2008.
11. SFPE Handbook of Fire Protection Engineering’ Appendix B, 4th Edition, SFPE/NFPA, 2008.
12. British Standards Institution. BS EN 1991-1-2 Eurocode 1: Actions on structures – Part 1-2: General actions – actions on structures exposed to fire, London, 2002.
13. British Standards Institution. BS 9999 Code of practice for fire safety in the design, management and use of buildings, London, 2008.
14. British Standards Institution. Publication Draft PD 7974-3 ‘Application of fire safety engineering principles to the design of buildings – Part 3: Structural response and fire spread beyond the enclosure of origin’, London, 2003.
15. P J Pagni and A A Joshi, Glass breaking in fires, 3rd International Symposium on Fire Safety Science, pp791-802, 1991.
16. A A Joshi and P J Pagni, Users guide to BREAK1, The Berkeley algorithm for breaking window glass in a compartment fire, NIST GCR-91-596, US Department of Commerce, 1991.

57 Final Work Stream Report BD 2887 (D28V2) 286860
Commercial in confidence © Building Research Establishment Ltd 2015
Printed on environmentally friendly paper
17. B R Cuzzillo and P J Pagni, Thermal breakage of double pane glazing by fire, Journal of Fire Protection Engineering, 9, (1) pp 1-11, 1998.
18. K Harada and A Enomoto, An experimental study of glass cracking and fallout by radiant heat exposure, 6th International symposium on Fire Safety Science, pp1063-1074, 1999.
19. J Hietaniemi, ‘Probabilistic simulation of glass fracture and fallout in fire’ VTT – Working Papers 41. ISBN 951-38-6593-2. VTT Building and Transport, Finland, 2005.
20. S Dembele R Rosario and J Wen, Thermal and stress analysis of glazing systems under fire conditions, Interflam 2010, Interscience, 2010.
21. B J McCaffery, J G Quintiere, M F Harkleroad, Estimating room temperature and the likelihood of flashover using fire test data correlations, Fire Technology, Volume 17, No. 2, pp 198-119.
22. M Law, Fire safety of external building elements – The design analysis, Engineering Journal, 2nd Quarter 1978, American Institute of Steel Construction.
23. British Standards Institution, PD 7974-1 Application of fire safety engineering principles to the design of buildings – Part 1: initiation and development of fire within the enclosure of origin, London, 2003.
24. CIBSE, CIBSE Guide E: Fire Safety Engineering, third edition, 2010.
25. Design Guide: Structural Fire Safety – CIB W14 Workshop Report, Fire Safety Journal, Volume 10, No 2, 1986.
26. Real Fires for the Safe Design of Tall Buildings, EPSRC EP/J001937/1, 2012-2014.
27. British Standards Institution, PD 7974-7 Application of fire safety engineering principles to the design of buildings – Part 7: Probabilistic risk assessment, London, 2003.
28. Scottish Building Standards Agency. The Building (Scotland) Regulations 2004. Technical Handbook 2013. Non-domestic. Section 2: Fire.
29. National Fire Protection Association, NFPA 80A: Recommended Practice for Protection of Buildings from Exterior Fire Exposures, USA, 2012.

58 Final Work Stream Report BD 2887 (D28V1) 286860
Commercial in confidence © Building Research Establishment Ltd 2015
Printed on environmentally friendly paper
Appendix A – Summary of the Research
Building Regulations and Standards Division, Department for Communities and Local Government (DCLG) commissioned BRE to carry out a project titled “Compartment sizes, resistance to fire and fire safety”. The main aim of this project was to produce robust evidence and data based on research, experimental fire testing, computer modelling and laboratory testing, where necessary, on a number of linked work streams in relation to fire safety and associated provisions in Schedule 1 of Part B of the Building Regulations 2010.
This Final work stream report describes the findings of the research for Work stream 6 – Building separation. The aim of this work stream was to provide robust evidence to support modified or alternative calculations methods for building separation distances.
The experimental programme has confirmed that, for buildings with low levels of insulation, the current approaches in Approved Document B (The Building Regulations 2010 (England) Approved Document B: Fire safety) and BRE publication BR 187 (External fire spread: building separation and boundary distances, second edition, IHS, 2014) are adequate. Improving the levels of thermal insulation to those recommended by Approved Document L (The Building Regulations 2010 (England) Approved Document L: Conservation of fuel and power) may lead to higher fire temperatures; these can be compensated for by reducing the unprotected area of an elevation by 70%. However, this does not include the impact of any external flaming.
Calculation of the extent of the external flame envelope using the methods in Eurocode 1 and Publication Draft PD 7974-3 is not dependent on the level of thermal insulation in a compartment and cannot therefore be used as part of a building separation calculation.
Methods to predict the extent of external flaming from compartments need to be extended to include the impact of high levels of compartment insulation.

59 Final Work Stream Report BD 2887 (D28V1) 286860
Commercial in confidence © Building Research Establishment Ltd 2015
Printed on environmentally friendly paper
Appendix B - London Rebuilding Act 1667
From the Post War Building Studies, the requirements of the London Rebuilding Act of 1667 can be summarised using the following table.
Sort of building
Maximum height*
Thickness of front and rear walls
Thickness of party walls
Street type
First 18ft 1 ½ -2 bricks 1 ½ bricks Lanes
Second 29ft 1 ½ -2 bricks 1 ½ - 2 bricks Streets and lanes of note
Third 38ft 1 ½ -2 ½ bricks 1 ½ - 2 bricks High and principal streets
This was supported by definitions of “Sorts of Buildings” and “Street Types” and further recommendations that:
• Outsides of buildings to be built of brick or stone. • Buildings may have cellars and garrets. • A fourth building type “mansion houses of the greatest bigness” should not exceed four storeys.
These had similar requirements for walls. • Narrow passages less than 14 feet wide to be enlarged.
This indicates that the provision of fire resistance to compartment walls, elevation size and street width as being requirements to prevent fire spread between buildings have been considered as important factors for many years. The implementation of these requirements will be present in the design of some existing buildings.

60 Final Work Stream Report BD 2887 (D28V1) 286860
Commercial in confidence © Building Research Establishment Ltd 2015
Printed on environmentally friendly paper
Appendix C - Ministry of Home Security Bulletins C28/29
B1 Background
During World War II the Ministry of Home Security conducted research into the action of incendiary bombs. It was realised that grouping of incendiary bombs could overwhelm fire-fighters and lead to a conflagration. In addition to developing fire-fighting tactics, precautions to make buildings more resistant to attack were also examined. These precautions were of three kinds:
• Overhead protection to prevent bombs entering a building
• Lateral protection to prevent a fire in one building involving another
• Internal compartmentation.
In the context of current controls for building separation, it is the approach to “lateral protection” that is of interest here. Ministry of Home Security Bulletins C28 and C29 present the work done up to the end of 1943 and provides guidance and associated tables to improve the protection of existing buildings. The main thrust of the guidance was to reduce the window area on the elevation of buildings by providing shutters or fully or partially bricking up windows. To date, the contemporary records of the calculation methods have not been identified. However, National Building Studies Technical Paper No 5 presents a method that is consistent with the results presented in C29.
At that time, instruments that could be used to measure radiant intensity in fire had not been developed; however, comparative measurements were made using a thermocouple mounted on a gold 1 inch diameter disc. The disc was blackened on the exposed side with the thermocouple and polished on the unexposed side. The discs were calibrated so that the temperature of the disc could be related to an exposure to a 1000°C source. The temperature of the disc could be used to find the configuration factor assuming a 1000°C source.
At the time, wood was regarded to be the most common combustible material on the elevation of a building, so experiments were devised to determine the behaviour of wood exposed to thermal radiation from a source at 1000°C. The results in Table B1 were found.
Table B1
Gold disc temperature
(°C)
Note
100 Slight flow of resin
150 Considerable flow of resin
200 Severe charring, brand may cause ignition

61 Final Work Stream Report BD 2887 (D28V1) 286860
Commercial in confidence © Building Research Establishment Ltd 2015
Printed on environmentally friendly paper
It was considered that a gold disc temperature of 150°C was the maximum value that timber could be heated to without the risk of easy ignition.
From the calibration, this gave a maximum configuration factor of 0.056 with a 1000°C source; this was referred to as the critical value.
Configuration factors for building fenestrations could then be calculated and compared with the critical value to determine if there was a hazard due to fire spread by thermal radiation.
Using this value and the following equation for geometric calculation of configuration factor for a rectangular surface to a point aligned with the centre of the surface, the view factor from a rectangle to a point in line with and facing a corner can be found from
= 12 √1 + √1 + + √1 + √1 + [Equation B1]
Where X = W/S and Y = H/S
This allows Table II in Bulletin C29 to be reproduced as follows.
Table II (1943 Original)
Dimensions Height 30’ 50’ 80’
Length 60’ 100’ 140’ 60’ 100’ 140’ 60’ 100’ 140’
Distance between buildings
% % % % % % % % %
60’ 42 30 26 28 20 18 19 14 12
80’ 72 47 38 46 31 25 30 20 17
100’ 85 62 48 61 42 33 38 28 23
Table II (2014 Recalculation)
Dimensions Height 30’ 50’ 80’
Length 60’ 100’ 140’ 60’ 100’ 140’ 60’ 100’ 140’
Distance between buildings
% % % % % % % % %
60’ 42.3 30.7 26.8 27.0 19.5 17.0 19.2 13.8 11.9
80’ 69.8 47.5 39.4 43.4 29.5 24.5 29.5 20.0 16.5
100’ 100 68.8 55.0 64.6 43.3 33.8 42.7 27.9 22.2

62 Final Work Stream Report BD 2887 (D28V1) 286860
Commercial in confidence © Building Research Establishment Ltd 2015
Printed on environmentally friendly paper
The 2014 version (shown to 1 decimal place so that rounding effects can be observed) was calculated using a short FORTAN computer program, whereas the original 1943 version probably used a graphical method to evaluate Equation B1. This may explain the discrepancies that appear for large area where the graphs concerned approach asymptotes and precise values are difficult to read.
The comparison confirms that Equation B1 and the critical configuration factor of 0.056 were used to create Tables I and II in Bulletin C28/C29.
C29 notes that under peacetime conditions considerable relaxation of the values in the tables would be allowed.
The critical configuration factor, based on the gold disc temperature, has to be related to incident radiant intensity to provide a comparison with current methods. Since the factor is based on a radiation source at 1000°C, this can be found directly from the factors using: = [Equation B2]
Gold disc temperature (°C)
Configuration factor Radiant intensity (kW/m2)
Note
150 0.056 8.4 kW/m2 Direct radiation 300 0.161 24 kW/m2 Through glass
Therefore, the maximum radiation intensity on an exposed building should be less than 8.4 kW/m2. In the case of buildings with no exposed combustible material and glazed with wired glass, the radiation intensity should be less than 24kW/m2. This compares to the current critical radiation intensity of 12.6 kW/m2 used in the current calculation methods.
B2 F Division (from the National Archive)
The problem of fire research in wartime was essentially a study of the effects of incendiary attack and the means of combating them. As it was soon realised that the knowledge gained in wartime would have permanent value, the Research and Experiments Department engaged in comprehensive scientific study of fire raising, fire prevention and fire fighting. In July 1941, increased co-ordinating and supervisory powers in respect of fire prevention were given to the regional commissioners, other government departments with fire prevention responsibilities devolving them on their regional representatives. These changes and the dissolution of the Fire Prevention Executive Committee of the Cabinet led to a revision in October that year of the arrangements for providing scientific advice to the Home Office and the Ministry of Home Security on fire prevention problems, the functions of the chief scientific adviser on research and experiment being widened to cover fire fighting and fire prevention.
A new Fire Research Division (F Division) of the Research and Experiments Department was formed under Lord Falmouth in September 1941 to deal with fire problems calling for advice or research arising from the work of fire watchers, fire-fighting parties or works fire brigades. The division comprised Analysis, Research and Establishments Services Sections. In order to secure the fullest co-ordination of experimental activities and establish priorities, the Civil Defence Research Committee constituted a special Fire Research Sub-committee, with Lord Falmouth as chairman, in October 1941. F Division relied heavily on the reports of the Bomb Census Field Organisation and also collected basic information on fires not

63 Final Work Stream Report BD 2887 (D28V1) 286860
Commercial in confidence © Building Research Establishment Ltd 2015
Printed on environmentally friendly paper
caused by the enemy. After the dissolution of the ministry, the division continued under the Home Office until it was transferred in April 1946 to the Department of Scientific and Industrial Research.
The Technical Intelligence Section was formed at the outbreak of war as an intelligence and information unit, within the Research and Experiments Branch, constituting a technical inquiry service at headquarters and directing the operations of a field staff of 19 regional technical officers. In May 1940 it was designated the Technical Intelligence and Liaison Section. It grew into the Technical Intelligence Division (B Division) as a result of the expansion of its bomb census field organisation and was responsible for assessing the current civil defence situation on behalf of the department.