department for communities and local government · accounts 2011-12 (for the year ended 31 march...
TRANSCRIPT

HC 50 LONDON: The Stationery Office £29.00
Department for Communities and Local
Government
Annual Report and Accounts 2011-12 (For the year ended 31 March 2012)


Department for Communities and Local
Government
Annual Report and Accounts 2011-12
(For the year ended 31 March 2012)
Ordered by the House of Commons to be printed 28 June 2012
Accounts presented to the House of Commons pursuant to section 6(4) of the Government
Resources and Accounts Act 2000
Report presented to the House of Commons by Command of Her Majesty
Report and Accounts presented to the House of Lords by Command of Her Majesty
HC 50 LONDON: The Stationery Office £29.00

This is part of a series of Annual Reports and Accounts which, along with the Main Estimates 2012-13 and the document Public Expenditure: Statistical Analyses 2012, present the Government’s outturn and planned expenditure. © Crown copyright 2012 You may re-use this information (excluding logos) free of charge in any format or medium, under the terms of the Open Government Licence. To view this licence, visit http://www.nationalarchives.gov.uk/doc/open-government-licence/ or mailto:[email protected]. Where we have identified any third party copyright information you will need to obtain permission from the copyright holders concerned. Any enquiries regarding this publication should be sent to us at Department for Communities and Local Government Eland House Bressenden Place London SW1E 5DU Telephone 030 3444 0000 Website: www.communities.gov.uk This publication is available for download at www.official-documents.gov.uk ISBN: 9780102978704 Printed in the UK by The Stationery Office Limited on behalf of the Controller of Her Majesty’s Stationery Office ID 2494515 06/12 Printed on paper containing 75% recycled fibre content minimum.

Department for Communities and Local Government Annual Report and Accounts 2011-12 Contents
1
Contents
Forewords to the Annual Report and Accounts 2011-12 3 Introduction and Summary of Achievements 6 Annual Report and Accounts 2011-12 1. About the Department for Communities and Local Government 8 2. How the Department performed in 2011-12
Decentralising power as far as possible 11 Reinvigorating accountability, democracy and participation 13 Supporting and incentivising local growth 16 Meeting people’s housing aspirations 18 Putting communities in charge of planning 21 Tackling the budget deficit 22
3. Progress on the Structural Reform Plan and input / impact indicators 24 4. Other Information 32 5. Introduction to the Accounts 33 6. Management commentary 34 7. Other financial information 70 8. Remuneration Report 77 9. Statement of Accounting Officer’s responsibilities 85 10. Governance Statement 87 11. The Certificate and Report of the Comptroller and Auditor General to the
House of Commons 99 12. Accounting schedules:
Statement of Parliamentary Supply 101 Consolidated Statement of Comprehensive Net Expenditure 102 Consolidated Statement of Financial Position 103 Consolidated Statement of cash flows 104 Consolidated Statement of changes in Taxpayers’ Equity 106
Notes to the Accounts 108

Department for Communities and Local Government Annual Report and Accounts 2011-12 Contents
2
Trust Statement in respect of National Non-Domestic Rates collected on behalf of the Consolidated Fund 163
Statement of Accounting Officer’s Responsibilities in respect of the Trust Statement 165
Governance Statement in respect of the Trust Statement 166 The Certificate and Report of the Comptroller and Auditor General to the
House of Commons in respect of the Trust Statement 167 Trust Statement: Statement of Revenue, Other Income and Expenditure 169 Trust Statement: Statement of Financial Position 170 Trust Statement: Statement of Cash Flows 171 Notes to the Trust Statement 172 Trust Statement: Accounts Direction given by HM Treasury in accordance with
section 7 (2) of the Government Resources and Accounts Act 2000 174 Annexes
A: Indicator measurements 175 B: Glossary 177

Department for Communities and Local Government Annual Report and Accounts 2011-12 Forewords
3
Forewords to the Annual Report and Accounts 2011-12 Foreword from the Secretary of State When people look back at the past twelve months I hope they will see it as a landmark year for my Department and its Group. A year when we passed the Localism Act - the most radical shift in power for a generation, giving local people powerful new rights to run services and help shape planning in their neighbourhoods. A year when we brought in the National Planning Policy Framework - reducing nearly 1,300 pages of guidance to around 50 pages. A year when we introduced our far-reaching Housing Strategy - setting out how we will make housing more affordable, support new building and tackle empty homes. And, as you'll read in this report, these were far from the only highlights. Our City Deals are allowing our great cities to rise from the shadow of the capital. Our Local Government Finance Bill will support local economic growth, letting councils keep part of their business rates to support local firms and jobs. We led the Government recovery effort from last August’s riots, in support of councils whose initial response was very effective. We're piloting plans to revive the high street and turn round the lives of troubled families. We’re supporting local areas to help them improve weekly bin collections. And we're helping set up new Enterprise Zones and Local Enterprise Partnerships across England, and stimulating local business through the Growing Places Fund. This is all done by taking a novel approach for Whitehall - cutting red tape and regulation. But what really matters is the results of all that backroom activity. We're giving communities and neighbourhoods the power to turn their lives around. We're helping hard working families buy a home and vulnerable people keep their heads above water. We're enabling local people to reshape their areas so they don't simply have great homes but great parks, shops and play areas to be proud of. And, by empowering councils and local businesses, we're strengthening the economy and creating jobs. And, as we look forward to the next twelve months, we must not slacken the pace. We must keep giving power back, keep cutting red tape, keep putting the local interest first, leaving no stone unturned until growth returns to Britain. Right Honourable Eric Pickles, MP Secretary of State for Communities and Local Government

Department for Communities and Local Government Annual Report and Accounts 2011-12 Forewords
4
Foreword from the Permanent Secretary
The Departmental Group faces a major challenge: moving away from central management and putting more power in the hands of people and communities, being transparent about public spending, and delivering more for less. We are becoming a smaller and stronger Group that uses its resources – people, public money and property assets – as efficiently and creatively as possible to deliver real change. The Department has restructured itself efficiently and fairly, reducing its workforce by 37% against the starting baseline. Staff exits will complete by October 2012. Our administration budget will reduce by one third over the Spending Review period. The Departmental Group will reduce by two thirds - already, 11 of our 26 Arm’s Length Bodies have been closed or transferred, including in March 2012 the Tenant Services Authority, Standards Board for England and Infrastructure Planning Commission. In 2011-12 the Department was given additional responsibilities and funding, which indicates the importance of our work and growing confidence in our ability to deliver. We announced the Growing Places Fund, Right to Buy, NewBuy, Get Britain Building and City Deals, and the Regional Growth Fund was brought into the Department. We have also established a new unit and programme to turn round the lives of 120,000 most troubled families. Our achievements this year, outlined in the Report, are testament to the professionalism and dedication of staff across the Department and Group, and I would like to commend them. In particular, we successfully completed the Localism Act 2011, launched the Housing Strategy and National Planning Policy Framework and introduced the Local Government Finance Bill. We delivered the major new programmes and savings mentioned above. I would also single out our major achievements in bringing transparency to local housing finance by abolishing the Housing Revenue Account subsidy system, and reducing our liabilities on the 2000-2006 European Regional Development Fund. Drawing on the high levels of drive and commitment that have enabled us to achieve so much this year, I am confident that we will continue to deliver on our business plan. Sir Bob Kerslake Head of the Civil Service and Permanent Secretary Department for Communities and Local Government

Department for Communities and Local Government Annual Report and Accounts 2011-12 Forewords
5
Foreword from the Lead Non-Executive Director
DCLG has had a very challenging and busy year, successfully delivering strong progress against its major Structural Reform Plan priorities: Localism, Housing, Planning and Local Growth, whilst, at the same time, undertaking a substantial streamlining of its organisation.
The DCLG Board, chaired by the Secretary of State, has now been in place for over a year and has met six times in 2011-12. The Board supports and challenges the Department, to enable successful delivery of its part in the Government’s Structural Reform Plan. In December 2011, we welcomed one new Non-Executive Director, Stewart Gilliland, whose strong commercial experience will add further to the Board’s expertise.
On behalf of the Secretary of State, I completed a review of the Board’s effectiveness in spring 2012. The review sought comments from all Board members, and concluded:
• that the Board, and its independent Non-Executive Directors, have added tangible value over the year: ‐ bringing external perspective on the Department’s strategic priorities, ‐ adding experience in effective implementation to the major programmes including
the Housing Strategy and Local Growth initiatives, ‐ using its commercial expertise to aid reviews of the Audit function; the options for
the QEII Conference Centre and the Fire Service College, ‐ providing input and challenge to the Department’s Capability review and staff
development plans.
• through a year of considerable change, the DCLG leadership have remained focused on a clear set of priorities, implementing through a new, more decentralised way of working; feedback from DCLG’s key partners has confirmed that the Department has become more collaborative, engaging and effective as a result.
• the Board should continue to seek ways by collective dialogue between Ministers, Executives and Non-Executive Directors to increase its impact and challenge to the Department’s plans.
• actions arising from the Effectiveness Review for the year ahead will see: ‐ greater external stimulus and cross-departmental input to Board discussions, ‐ continued focus on improving management information clarity and actionability ‐ focus on improving the engagement of all staff in the Department’s strategy,
priorities and progress, ‐ an increased focus on measuring the impact of the Department’s actions to feed
into future plans.
Sara Weller Lead Non Executive Director

Department for Communities and Local Government Annual Report and Accounts 2011-12 Introduction
6
Introduction This is the combined Departmental Annual Report and Accounts covering the period from 1 April 2011 to 31 March 2012.
The Annual Report provides an overview of the Department's performance in 2011-12, structured around the five Coalition Priorities set out in the Business Plan, and the role the Department is playing in reducing the deficit. The Report aims to be accessible and also easy to navigate online (as it uses weblinks to provide access to further detail – often the relevant news release which may include links to other sources).
The Accounts provide detailed accounting and expenditure information. There are also two annexes: a list of indicator measurements and a glossary.
If you cannot find the information you want, either in this document or online via the web links provided, please email the relevant policy contact listed at: http://www.communities.gov.uk/corporate/about/who/policycontacts
or email the general enquiry address at [email protected]. Key achievements A list of the Department’s key achievements in 2011-12 is as follows:
• On decentralising power as far as possible…
- introduced the Local Government Finance Bill, including business rate retention
- reduced regulatory costs to business by £14m per year through the Localism Act
- proposals to turn around the lives of 120,000 troubled families
- setting up the Whole-Place and neighbourhood Community Budget pilots.
• On reinvigorating accountability, democracy, participation and transparency…
- Localism Act was passed, including community right to bid for assets and services
- support for rebuilding after riots, and a cross-government approach on integration
- provision of up to £250m to improve waste collection services for communities
- local audit reform including disbanding Audit Commission will save around £650m
- empowered fire and rescue authorities to deliver the services communities expect

Department for Communities and Local Government Annual Report and Accounts 2011-12 Introduction
7
- actions to make central and local government spend and assets more transparent.
• On supporting and incentivising local growth…
- set up 24 Enterprise Zones, with business rate discounts and simplified planning
- support to Local Enterprise Partnerships, setting up £730m Growing Places Fund
- transfer of powers to London, and completion of City Deals to other core cities
- response to the Portas review of high streets, including funding innovative pilots.
• On meeting people’s housing aspirations…
- far-reaching Housing Strategy, incentivising new build and tackling empty homes
- promotion of home ownership through NewBuy and reformed Right to Buy
- removal of the bureaucratic Housing Revenue Account subsidy system.
• On putting communities in charge of planning…
- issued National Planning Policy Framework to replace current policy
- introduced neighbourhood planning to give communities more say.
• On tackling the budget deficit…
- completed change programme, identifying 37% workforce reductions
- reduced inherited European Regional Development Fund liability by £195m
- completed abolition of Government Offices for the Regions, saving £190m.

Department for Communities and Local Government Annual Report and Accounts 2011-12 About the Department
8
Annual Report 1. About the Department for Communities and Local Government
Organisational Structure and Accountability 1.1 The Secretary of State, the Right Honourable Eric Pickles MP has overall responsibility
for the Department for Communities and Local Government. The Secretary of State leads the following team of Ministers:
• The Rt Hon Greg Clark MP – Minister for Decentralisation and Cities (also a Minister in the Department of Business, Innovation and Skills)
• The Rt Hon Grant Shapps MP – Minister for Housing and Local Government • Andrew Stunell OBE MP – Parliamentary Under Secretary of State • Bob Neill MP – Parliamentary Under Secretary of State • Baroness Hanham CBE – Parliamentary Under Secretary of State.
1.2 Ministers are supported by a Departmental Board, which meets six times a year. The Board is chaired by the Secretary of State and attended by Baroness Hanham, two other Ministers on rotation, the Non-Executive Directors, and members of the Executive Team (who lead the day-to-day operations of the Department). The Board’s role is to advise on and supervise five key areas: strategic clarity; commercial sense; talented people; results focus; and management information.
1.3 Non-Executive Directors are responsible for contributing to the collective decisions of the Department’s Board. They chair two committees which carry out some of these activities: an Audit and Risk Committee, which reviews financial performance, interfaces with external auditors and reviews the management of the Department’s key risks; and the Nominations and Governance Committee, which advises on People strategy, including staff capability, engagement, succession planning and reward. They bring their particular knowledge, skills and experience to discussions, as well as providing independent advice and challenge to decision making. They are: • Sara Weller (Lead Non-Executive Director) • Stephen Hay (Chair of the Audit and Risk Committee) • Diana Brightmore-Armour (Chair of the Nominations and Governance Committee) • Stewart Gilliland (appointed in 2011-12).
1.4 The Board is supported by an Executive Team responsible for managing the Department’s daily business, and has three sub-committees: People, Finance and Performance.
1.5 The Department has become smaller: it is organised into three Groups, a cross-cutting strategy function, and the new Troubled Families Team. One reason for these structural changes is so the Department can provide stronger leadership across government on the key agenda of localism and decentralisation. The Department has also established a number of Programme Boards to manage various aspects of the Department’s

Department for Communities and Local Government Annual Report and Accounts 2011-12 About the Department
9
business, particularly the change agenda. These Boards provide a formal structure for risk management and ensure effective delivery.
1.6 Further detail on the financial organisation of the Department can be found at
paragraph 6.1 in the Management Commentary of the Accounts. More general information and biographies can also be found on our website: http://www.communities.gov.uk/corporate/about/who/ .
The Departmental Group 1.7 The Department is reducing the number of its Arm’s Length Bodies by around two thirds
through abolition, merger or reform (see 2.63 below). Ongoing reform to remaining bodies means the Group now includes a sharply focused and enabling Homes and Communities Agency and integration of major infrastructure planning into the Planning Inspectorate. The Group will continue to play a crucial role in delivering Ministerial priorities and empowering communities.
1.8 From autumn 2012, the Cabinet Office will produce a comprehensive annual Public Bodies directory providing details of Non Departmental Public Bodies and similar
Sir Bob Kerslake, Head of the Civil Service and Permanent Secretary
Peter SchofieldDirector General,
Neighbourhoods Group
David ProutDirector General,Localism Group
Sue HigginsDirector General, Finance
& Corporate Services Group
Louise Casey CBDirector General
Troubled Families
Responsible for support services. Expected to deliver efficiency savings by internal consolidation and setting up shared services with other departments.
Jon WhitfieldDirector, Internal AuditSusanna McGibbonDirector, Legal and People Capability and ChangeDavid RossingtonDirector, FinanceStephen AldridgeDirector, Analysis and InnovationProf. Jeremy WatsonChief Scientific AdviserGeorge EykynDirector, Communication
Responsible for the transfer of power and funding from Whitehall to individuals and communities and building the Big Society.
Patrick White Director, Local Government Policy and ProductivitySimon RidleyDirector, Local Government FinanceMark CarrollDirector, Decentralisationand the Big SocietyNeil O’ConnorDirector, Fire, Resilienceand EmergenciesSir Ken Knight CBE QFSM DLChief Fire and RescueAdviser
Responsible for creating the conditions which re-energise and empower individuals, communities and business to buildsuccessful cities, towns and neighbourhoods.
Terrie AlafatDirector, Housing Growth & Affordable HousingJon BrightDirector, Homelessness and Support, Building Standards and Climate ChangeShona DunnDirector, PlanningPhilip CoxDirector, Local Economies, Regeneration and European ProgrammesSir Michael PittChief Executive, The Planning Inspectorate
Responsible for driving forward the Prime Minister’s commitment to turn around the lives of 120,000 most troubled families.
Joe TukeDirector,Troubled Families Team
Responsible for Business Plan implementation; corporate governance; localities; London policy; and Departmental strategy.
Andrew CampbellDirector, Strategy

Department for Communities and Local Government Annual Report and Accounts 2011-12 About the Department
10
bodies. This information will be published online. A list of those which the Department sponsors, including a summary of their responsibilities, can also be found in Note 36.
Delivering Coalition Priorities 1.9 In May 2010 the Coalition Agreement set out that the Department would lead a radical
redistribution of power and funding from Government to local people, transforming public services and ensuring that all communities are equipped and incentivised to grow and prosper. Its five specific priorities, as amended for 2011-12, are to: • decentralise power as far as possible (paragraphs 2.1 – 2.12 below, covered in the
Localism Estimate line); • reinvigorate accountability, democracy, participation and transparency
(paragraphs 2.13 – 2.27 below, Localism Estimate line); • support and incentivise local growth (paragraphs 2.28 – 2.39 below, Local
Economies, Regeneration and European Programmes Estimate line); • meet people's housing aspirations (paragraphs 2.40 – 2.54 below,
Neighbourhoods Estimate line); and • put communities in charge of planning (paragraphs 2.55 – 2.59 below,
Neighbourhoods Estimate line).
1.10 This Annual Report is structured around performance against these five priorities, alongside the role the Department is playing in helping to tackle the deficit.
1.11 Individual actions to deliver these five priorities are in the Department’s Structural Reform Plan, first published in July 2010 and later updated as part of a comprehensive Business Plan for 2011-20151. This sets out the Department’s vision and how it is being delivered through the Structural Reform Plan and increased transparency.
1.12 The Department has made good progress so far with work started (and in some cases completed) on its Coalition Agreement actions. By the end of March 2012, the Department had delivered 85% of its challenging Structural Reform Plan actions in line with its Plan dates. At the same time, we have delivered on implementation of the challenging Housing Strategy and Growth Review agendas which have developed over the year.
1.13 The Department’s Refreshed Business Plan was published on 31 May 2012 on our website. It includes actions to be delivered between 2012 and 2015, a breakdown of the completed actions in our Structural Reform Plan and also key indicators for each of our priorities.
1.14 We have been at the forefront of delivering greater transparency and enabling the public to hold Government to account, such as by publishing all departmental spend over £500.
1
/http://www.communities.gov.uk/publications/corporate/businessplan2012

Department for Communities and Local Government Annual Report and Accounts 2011-12 How the Department performed in 2011-12
11
2. How the Department Performed in 2011-12
Decentralising Power As Far As Possible (2.1 - 2.12) 2.1 The Department has the lead across central Government on decentralising power and
funding. Our approach is that decisions should be made at the lowest possible level, and local authorities need to be able to get on with making the right decisions for their area. In 2011-12, we helped achieve this by: providing greater financial freedoms and flexibilities to local government; taking powers to create directly elected mayors; establishing community budgets; and proposals to turn around the lives of 120,000 troubled families. Financial freedoms and flexibilities
2.2 The Department introduced the Local Government Finance Bill on 19 December 2011, to encourage local economic growth; reduce the deficit; and drive decentralisation so that more decisions over how public money is spent can be taken locally.
2.3 The Bill will enable the local government sector to retain 50 percent of locally generated business rates, freeing councils to generate more income and support local firms and jobs. At present, £19 billion in business rates are redistributed each year in England. The reforms will establish a direct link between the effort that councils put into growing local economies and the money they have to spend on local people, while ensuring that the changes are fair to councils and the interests of the vulnerable and local taxpayers are protected.
2.4 The Bill enables councils to potentially use Tax Increment Finance, which lets councils pay for infrastructure by borrowing against forecast growth in business rates. Ministers have announced that this will be supported by up to £150m for large scale infrastructure projects in core cities. It provides a framework for localising council tax support in England, giving more financial autonomy to councils and saving Government over £400m. Changes to the council tax system, including incentivising owners of empty properties to bring them into use, allow councils to help keep bills down for hard-working families and pensioners.
2.5 The Department delivered other important amendments to local taxation outside the Bill. Helping small shops and businesses grow is a crucial part of rebalancing and rebuilding the economy. We doubled Small Business Rate relief, saving about £390m for 500,000 businesses and making it easier to apply. We introduced measures to cancel unexpected backdated business rate liabilities, including for some businesses based in ports.
2.6 The Department’s Local Government Finance settlement ensured that the councils most dependent on central government funding received smaller reductions in Formula Grant than less dependent ones. Transition Grant ensured that the average reduction in spending power for 2011-12 remained at 4.4 per cent. The removal of ring-fencing from local government grants has given councils the freedom and flexibility to manage their budgets to fit the needs of their local communities.

Department for Communities and Local Government Annual Report and Accounts 2011-12 How the Department performed in 2011-12
12
2.7 The Government introduced a voluntary council tax freeze in 2011-12, giving councils a grant equivalent to a 2.5 to 3 per cent increase on Band D council tax if they choose not to raise council tax. This offer was baselined across all the years of the Spending Review. All eligible councils accepted the deal. We announced a new one-year deal for 2012-13, and 85% of eligible councils accepted it. The freeze in 2011-12 and average 0.3% Band D rise in 2012-13 represents a real terms cut in council tax in both years.
Non-financial freedoms and flexibilities 2.8 The Government took powers in the Localism Act 2011 (paragraph 2.14 below) to
enable local people to choose whether their city should be run by a directly elected mayor in England's twelve largest cities outside of London. Such mayors can help shift power away from central government, improve the governance of our cities, provide better local public services, and give strong and accountable democratic local leadership. Leicester and Liverpool have already elected a Mayor and Bristol will hold a mayoral election in November 2012. In May 2012 people in the other nine cities chose not to change the way their city is governed.
2.9 A Community Budget enables local public service providers to come together and agree how services can be better delivered, how the money to fund them should be managed and how they will organise themselves. In December 2011, Ministers selected fourteen areas to pioneer a local public service revolution. Four areas (Cheshire West and Chester, Essex, Greater Manchester, the Tri-Borough2 partnership) are developing a Whole-Place Community Budget to see what a single budget comprising all funding on local public services might look like and how it could enable radical reform and transformation of local services in each area. Saving just 2 per cent of local budgets will free up over £1 billion. The other ten areas are developing a Neighbourhood Community Budget. These are about giving people more power over local services and budgets in a neighbourhood and aligning these with all the other resources that the local community can bring.
2.10 The Department published the single data list for 2012-13, which reduces the number of central government data demands on councils to 156, from 193 in 2011-12. We have also developed a gateway system with the Local Government Association to challenge new and existing demands and prevent future build up.
2.11 The Department is helping to create the conditions for businesses to grow by implementing reductions to the cost to business over the last three Statements of New Regulation which bring our total reduction to £4.52m per year. The Localism Act 2011 made important changes on Neighbourhood Development Orders and Community Right to Build which will benefit business by about £14m per year. Through the Red Tape Challenge, we have reviewed all regulations on the housing and construction sector to help remove barriers to growth. We received over 200 comments and suggestions, and aim to launch a deregulatory package in summer 2012.
2
The Boroughs of Hammersmith and Fulham, Kensington and Chelsea and Westminster.

Department for Communities and Local Government Annual Report and Accounts 2011-12 How the Department performed in 2011-12
13
2.12 The Department has a new responsibility to lead a cross-government drive to improve the prospects of the country's most troubled families, and reduce the cost. Children in troubled families are far more likely to be excluded from school, go into care, or have contact with the police, costing the taxpayer about £9bn per year. Beginning in 2012, the Government will invest almost £450m to turn around the lives of 120,000 families over this Parliament, covering up to 40% of the cost. This is intended to drive a radical shift in the way services are configured and money is spent in local areas. We are using a new payment by results basis, paying on success in reducing crime and anti-social behaviour, getting adults on the path to work, and children back into school. Councils have agreed to appoint a network of co-ordinators to oversee each area’s action programme, and every upper tier council has accepted an offer of £20,000 preparatory funding in this financial year for the programme.
Achievement Link to more detail
Local Government Finance Bill http://www.communities.gov.uk/localgovernment/localgovernmentfinance/lgfinancebill/
Business rates retention http://www.communities.gov.uk/news/corporate/2054393
Small business rate relief http://www.communities.gov.uk/news/corporate/1972646
Ports – backdated business rates http://www.communities.gov.uk/news/corporate/2100112
Local Government Finance Settlement http://www.local.communities.gov.uk/finance/1213/grant.htm#set
Council tax freeze http://www.communities.gov.uk/news/corporate/2111070
Direct election of mayors http://www.communities.gov.uk/news/newsroom/2085395
Community Budgets http://www.communities.gov.uk/news/newsroom/2056449
Red Tape Challenge http://www.redtapechallenge.cabinetoffice.gov.uk/themehome/housing-and-construction/
Troubled Families http://www.communities.gov.uk/publications/communities/troubledfamiliesframework
Reinvigorating Accountability, Democracy, Participation and Transparency (2.13-2.27)
2.13 To enable the Big Society to flourish, the Department is working to empower communities by creating rights for people to get more involved, encouraging community activism, giving more choice and better service standards in public services, and opening up government to public scrutiny. The Department is delivering these mainly through the Localism Act 2011.
Localism Act 2011 2.14 The Department secured powers to deliver this new accountability in the Localism Act
2011. The Act gives councils a general power of competence allowing them to do anything an individual can do, from holding formal prayers to working together creatively to improve services. A similar power was secured for fire and rescue and other types of authority.
2.15 The Act abolishes the Standards Board for England, replacing it with local codes of conduct. It enables councillors to participate freely in local debate without fear of legal

Department for Communities and Local Government Annual Report and Accounts 2011-12 How the Department performed in 2011-12
14
challenge, legislates for directly elected mayors (see paragraph 2.8 above), and takes forward reforms to strengthen and streamline London’s governance.
2.16 The Act also gives local communities new powers, such as the Right to Bid to buy local assets like local pubs and shops and keep them as part of local life, and the Right to Challenge makes it easier for communities to bid to run council services. Local people will have powers to approve or veto excessive council tax rises in a binding referendum.
2.17 The Act provides for a more democratic, effective and clear planning system. It removes central controls on plan making, introduces arrangements for neighbourhood planning and strengthens enforcement powers for councils to tackle unauthorised development. It allows more decisions about housing to be taken locally, allowing councils to offer flexible tenancy agreements and manage their own waiting lists, and tenants to move home and hold landlords to account (see paragraphs 2.40 to 2.59 below). Communities can also bring forward proposals for development they want, such as homes, shops, playgrounds or meeting halls, through the Community Right to Build.
Encouraging community activism 2.18 The Department published Creating the Conditions for Integration in February 2012.
Integration is a local issue and creating the conditions for local leadership and action is central to our work. When there has been a clear role for Government we have acted, including by supporting: the Big Jubilee Lunch; national youth organisations such as the Guides; additional English language provision (with £10m funding); the integration of Gurkhas into Britain; tackling the inequalities facing Gypsies and Travellers; a review of barriers to Black and Minority Ethnic individuals accessing business finance; and locally-led community activism through the Church of England-led Near Neighbours programme.
2.19 Baroness Helen Newlove joined the Department from the Home Office in April 2011 as Government Champion for Active Safer Communities, to encourage and champion community activism. One of her top priorities is tackling binge and underage drinking, and the Baroness launched a new £1m fund in February 2012 to support ten community partnerships taking forward projects to tackle alcohol abuse.
Recovery from the August 2011 public disorder 2.20 Following the public disorder in August 2011, the Department took the lead in
supporting councils both in their very effective initial response, and the subsequent joint recovery effort. The Secretary of State set up and chaired a Ministerial Recovery Group to ensure residents and local firms could quickly access funding to rebuild their communities. We provided just under £3m to help with immediate clean-up costs, £7.4m to help get firms trading again (jointly funded with the Department for Business, Innovation and Skills); and reimbursed councils for the cost of business rate relief and emergency accommodation.
2.21 During the disorder, we co-ordinated information flows between the national crisis response committee and local partners. This year, our Resilience Advisers supported

Department for Communities and Local Government Annual Report and Accounts 2011-12 How the Department performed in 2011-12
15
local action to make places more resilient and manage risks for themselves, reflecting the National Risk Assessment for UK civil contingencies.
Standards in public services 2.22 The Government is committed to diversifying the supply of public services, giving
more choice and better service standards. The Department outsourced the Audit Commission’s centralised audit practice for councils through contracts to four firms to begin in September 2012. Most Commission staff will transfer to the winning bidders. It is our intention to abolish the Commission when Parliamentary time allows, replacing it with a decentralised framework which will refocus audit to help people hold councils to account. Local audit reforms, together with the end of inspection work and disbanding the Commission, would save the public purse around £650m over five years.
2.23 The Department supports better weekly bin collections for residents through the £250m Weekly Collection Support Scheme, to start in 2012-13, and following on from the Government’s Waste Review.
2.24 The Government’s response to the independent sector-led Fire Futures review of fire and rescue provision in England sets out how we will take forward reform in the context of strengthening national resilience, especially by changing the relationship with Government and improving local accountability. We are also providing up to £81m to support locally-led projects to improve the resilience and efficiency of fire and rescue control rooms across England. We are selling the Fire Service College as a going concern to generate new business and to provide the capital investment that it needs to secure its long term future as a national resilience and emergency services training and exercise centre.
Increasing Transparency 2.25 The Department is committed to open up central and local government to public
scrutiny, by releasing government information into the public domain, so that people can know how their money is spent, how it is used and to what effect. Our new Code of Recommended Practice covers transparency in key council data such as salaries over £58,200, contracts and grants, and public land, encouraging councils to be accountable to local people.
2.26 To accompany the Localism Act’s pay accountability measures, the Department issued new guidance stating that in their local pay policies, councils should vote in public on salary packages over £100,000 per year, and should review their approach to senior appointments, in particular to root out inappropriate tax avoidance measures.
2.27 In August 2011, the Department published a map of 180,000 assets owned by almost 600 public sector bodies. The map shows public sector assets are worth an estimated £385bn, almost two thirds owned by councils, and savings through better property management could potentially save £35 billion over 10 years. The public could use this alongside their new community rights to protect local treasures.
Achievement Link to more detail
Localism Act 2011 http://www.communities.gov.uk/publications/

Department for Communities and Local Government Annual Report and Accounts 2011-12 How the Department performed in 2011-12
16
Achievement Link to more detail localgovernment/localismplainenglishguide
Response to the public disorder http://www.communities.gov.uk/news/corporate/1964306
Active Safer Communities http://www.communities.gov.uk/news/newsroom/2088542
Creating the conditions for integration http://www.communities.gov.uk/news/corporate/2092147
Training volunteer leaders http://www.communities.gov.uk/news/corporate/2078960
Supporting Gurkhas http://www.communities.gov.uk/news/corporate/2028939
English Language Support http://www.communities.gov.uk/news/corporate/2097253
Near Neighbours Fund http://www.communities.gov.uk/news/corporate/20288651
Audit Commission outsourcing savings http://www.communities.gov.uk/news/localgovernment/2141890
Waste Collection http://www.communities.gov.uk/news/corporate/2122211
Fire and Rescue http://www.communities.gov.uk/fire/firerescueservice/firefutures/
Local pay accountability http://www.communities.gov.uk/news/newsroom/2032134
Code of Recommended Practice on Data Transparency
http://www.communities.gov.uk/publications/localgovernment/transparencycode
Public property map http://www.communities.gov.uk/news/corporate/1960911
Supporting and Incentivising Local Growth (2.28 - 2.39)
2.28 The Government is committed to promoting strong local economies by putting power in the hands of councils and local businesses, rather than regional agencies. We aim to stimulate private growth and employment, catalysing investment, encouraging enterprise and creating the right conditions for long term sustainable growth.
2.29 The Government’s Growth Plan of March 2011 highlights the urgent need for the United Kingdom to remove barriers to growth and boost competitiveness, and sets out actions. Growth is a cross-Government objective, supported by the Department through radical reforms (such as Local Enterprise Partnerships, National Planning Policy Framework and New Homes Bonus) and focused interventions (such as the Regional Growth Fund and Growing Places Fund).
2.30 The Department’s economic development role has expanded following the transfer of former Regional Development Agency land and property assets (outside London) to the Homes and Communities Agency. The Department published a regeneration ‘toolkit’, highlighting the powers and tools devolved to local residents and business as incentives to drive growth and improve the social and physical quality of their areas.
2.31 The Department has established 24 new Enterprise Zones in England, to encourage investment, growth and the creation of new jobs and businesses. The Zones will attract hundreds of new and expanding firms with over £150m in tax breaks available over the next four years. Ambitious planning simplification proposals are being taken forward in the zones, with 18 Local Development Orders having already been put in place and about 40 more to come. These Orders provide certainty to businesses, and make the process of developing in the Zones quicker and cheaper.

Department for Communities and Local Government Annual Report and Accounts 2011-12 How the Department performed in 2011-12
17
2.32 The Government is on target with the current European Regional Development Fund
programme. Funds must be spent by 2015 and we have already invested some two-thirds of the money, at a point when we are two-thirds of the way through the duration of the programme. All areas have met their 2011 spending targets, and some 93% of the total allocation is contracted or awaiting contract.
2.33 The Department encouraged the creation of Local Enterprise Partnerships, which operate within an area that makes economic sense, and enable local business and civic leaders to decide on local economic priorities and deliver growth and job creation. The inaugural conference for the national network for the 38 Partnerships was held in September 2011.
2.34 Local Enterprise Partnerships received £730m from across Government, including £175m from the Department, in up-front, flexible funding through the Growing Places Fund. We set up the Fund to boost economic growth by building infrastructure, getting stalled projects moving, and creating new homes and jobs. Partnerships decide what to prioritise, and are encouraged to secure a return and reinvest their money.
2.35 The Department will contribute £1.9 billion over three years to the Regional Growth Fund (of a total £2.4 billion) for key projects which deliver economic growth and jobs. Local Enterprise Partnerships have advised companies bidding for the Fund.
2.36 Improved productivity in cities is crucial to economic success. Government has offered bespoke ‘City Deals’ with eight core cities and their Local Enterprise Partnerships, which grant freedoms from central control such as a consolidated capital funding pot and powers to lower business rates for certain companies. Cities will need to offer something in return such as strong, accountable leadership and increased efficiency. We have agreed deals with Liverpool and Manchester; the latter includes an infrastructure fund, investment framework, apprenticeship and skills hub, low carbon hub, and housing investment board.
2.37 In February 2012 the Government agreed to decentralise power to the Greater London Authority by transferring housing and regeneration responsibilities in the Localism Act 2011. The Department made a settlement worth about £3 billion to support the transfer of power. The Mayor is committed to building 55,000 affordable homes by March 2015, and to bring 45,000 existing social homes up to standard. The settlement will also support the Mayor’s London Legacy Development Corporation in delivering new homes for East London, through new receipt sharing arrangements.
2.38 The Department is granting £52m to the Coalfields Regeneration Trust over four years to support coalfield communities, and transform the Trust into a self-sustaining organisation. The Department will also lead on delivering England’s share of a £23.7m fund to support new opportunities in struggling coastal communities.
2.39 In March 2012, the Government responded to Mary Portas’ independent review into the future of high streets. We provided councils with £10m through a High Street Innovation Fund, and announced other measures including support for pilot areas, a

Department for Communities and Local Government Annual Report and Accounts 2011-12 How the Department performed in 2011-12
18
£1m High Street Challenge Fund for the most creative solutions, and £1m for high street Neighbourhood Plans.
Achievement Link to more detail
The Plan for Growth http://cdn.hm-treasury.gov.uk/2011budget_growth.pdf
Regional Development Agency Assets http://www.homesandcommunities.co.uk/news/growth-boost-hca-launches-new-economic-assets-programme
Regeneration toolkit http://www.communities.gov.uk/publications/regeneration/communityledregenerationtoolkit
Enterprise Zones http://www.communities.gov.uk/regeneration/economicgrowth/enterprisezones
Local Enterprise Partnerships http://www.communities.gov.uk/news/corporate/1881523
Growing Places Fund, Tax Increment Financing http://www.communities.gov.uk/news/corporate/2118875 http://www.communities.gov.uk/news/corporate/2079177
Regional Growth Fund http://nds.coi.gov.uk/content/detail.aspx?NewsAreaId=2&ReleaseID=423400&SubjectId=2
City Deals (Manchester) http://www.communities.gov.uk/news/corporate/2110432
London settlement and the Olympics legacy http://www.communities.gov.uk/news/newsroom/2082928
Coalfield communities http://www.communities.gov.uk/news/corporate/2075333
Coastal communities http://www.communities.gov.uk/news/corporate/2085781
Portas Review of high streets http://www.communities.gov.uk/news/corporate/2120114
Meeting People’s Housing Aspirations (paragraphs 2.40 – 2.54)
2.40 The Department leads on the Government’s commitment to provide support to get house building going again; take action to improve affordability and support aspiration, choice and quality for tenants; tackle empty homes and seek to improve the quality and sustainability of homes. In November 2011, we launched the Housing Strategy.
Reforming the Housing Revenue Account 2.41 The Government abolished the bureaucratic and complex Housing Revenue Account
subsidy system. Under this funding model, rent income was redistributed between councils based on complex calculations made by Government. Under the new devolved self-financing system, councils now fund their own housing from their own rents, giving them the flexibility and resources necessary to plan long term and drive efficiency. It also provides a transparent link between the rents tenants pay and the services they receive. Self-financing was implemented through a one-off series of payments between 168 local authorities and Government on 28 March 2012 with a total value over £19 billion. As a result of close working with councils and across Government, this complex transaction went smoothly and the new system started as planned on 1 April.
Promoting homeownership 2.42 In March 2012, Ministers launched the NewBuy Guarantee to enable up to 100,000
buyers frozen out of the housing market to secure loans on newly built homes with only a 5% deposit. Government and housebuilders will provide security for the loan, so if the

Department for Communities and Local Government Annual Report and Accounts 2011-12 How the Department performed in 2011-12
19
house is sold for less than the outstanding mortgage total, the lender can recover most of its loss. From May 2012, the scheme will be supported by banks covering 73% of the new build mortgage market. Many of the United Kingdom’s biggest housebuilders are participating, and nearly 30,000 homebuyers have registered an interest, potentially providing 25,000 new homes.
2.43 The Government also published the revised Right to Buy with an increased discount of up to £75,000, giving most social tenants the opportunity to buy the homes they live in. Our aim is that every additional home sold be replaced by a new affordable rent home.
2.44 The Department is giving up to £180m over two years to help over 10,000 aspiring home-owners through the FirstBuy scheme (launched June 2011), which makes equity loans for up to 20% of a home. This is co-funded by housebuilders, and repaid on sale of the home.
Strong incentives to build new homes 2.45 Over 200 stalled building projects will share the £570m Get Britain Building fund,
helping to deliver up to 16,000 new homes and 30,000 construction jobs. The Government has also announced £30m additional funding to support provision of short term project finance for self-build housing on a repayable basis.
2.46 The Government is providing £100m of funding to bring empty homes back into use as affordable housing. £70m of that will bring over 5,600 empty homes back into use and £30m is available to community and voluntary groups. It wastes resources if, for every two families who need a home, there is one standing empty. A further £50m will tackle large clusters of empty homes.
2.47 Departments with significant landholdings have published strategies for how their land can be used to build up to 100,000 new homes by 2015. As part of this, the Homes and Communities Agency will deliver over 11,000 housing starts on land they are releasing. The public will be able to request a sale of unused or underused public land through a simple form as part of Community Right to Reclaim Land.
2.48 The New Homes Bonus incentivises housing growth through grant based on the council tax raised from additional homes and long-term empty homes brought into use. This ensures that growing areas have resources to meet the needs of new and existing residents, replacing top down development targets with transparent cash incentives. Ministers confirmed in February 2012 that 353 councils will receive £432m of match funding in 2012-13 in respect of 159,000 homes provided.
2.49 The Housing Strategy will support greater investment in the private rented sector, driving large scale investment through changes to the tax rules for bulk purchases of buy-to-let homes, and encouraging the growth of Real Estate Investment Trusts, which provide low cost access to capital. An independent review will also consider whether there are barriers to greater large-scale investment in rented housing. We launched a consultation in April 2012 on the potential for Trusts to support private investment in the social housing sector.

Department for Communities and Local Government Annual Report and Accounts 2011-12 How the Department performed in 2011-12
20
2.50 The Department launched a consultation in January 2012 on changes to Building Regulations to streamline and simplify parts of the Regulations and to deliver on the Structural Reform Plan commitment to improve the energy efficiency of new homes.
Protecting the most vulnerable 2.51 Appetite for the Affordable Homes Programme surpassed expectations in 2011-12,
with 146 providers sharing almost £1.8 billion to build 80,000 homes under the programme. This is part of an overall investment of £4.5 billion, and puts Government on track to deliver up to 170,000 new homes by 2015, safeguarding 80,000 jobs (mainly construction).
2.52 Funding has been maintained in priority areas to protect vulnerable and disadvantaged people and ensure more decent social homes, including:
• £6.5 billion for Supporting People, protected in the 2010 Spending Review, and now provided through Formula Grant. £1 spent on Supporting People saves £3 in reduced costs for homelessness, crime, health and other costs;
• £725m for Disabled Facilities Grant over the 2010 Spending Review period, enabling councils to fund adaptations to peoples' homes, helping people live independently; and
• £2.1bn over four years for Decent Homes (£1.6 billion for councils) to make much-needed improvements to social housing. The Department is ahead of schedule, and 93% of all homes now meet the Decent standard, up from 90% in 2009.
2.53 In addition to £100m homelessness prevention funding for councils in 2011-12 to meet their statutory duties, the Department also made £70m available to assist households:
• £20m to help protect vital front line homelessness services and to help councils adopt London’s 'No Second Night Out' rough sleeping standard across England;
• £20m to enable local authorities to offer small loans or grants to help people stay in their homes, including £1m for free on-the-day legal advice from court desks;
• £20m for housing advice for single homeless people; • £5m for improved hostel provision and for 1,500 new and improved bed spaces; • £5m for a Social Impact Bond using payment by results to help persistent rough
sleepers in London.
2.54 The Department is radically reforming social housing tenancies, making the system fairer by striking a sensible balance between the needs of new and existing tenants, and allowing more decisions about housing to be taken locally. Reforms include:
• allowing councils to offer flexible agreements for new tenancies instead of a home for life, ensuring more social homes are available to people who need them;
• allowing tenants wanting to swap their home to see every available home online; • abolishing the Tenant Services Authority; • helping landlords to combat anti-social behaviour through new court statements; • offering responsible tenants extra cash and basic DIY training to do minor repairs;

Department for Communities and Local Government Annual Report and Accounts 2011-12 How the Department performed in 2011-12
21
• consulting on reform to the Right to Manage, which allows tenants to bid to take over day-to-day maintenance, and Right to Transfer, which requires councils to work with tenants who want their homes transferred to a housing association.
Achievement Link to more detail
Housing Strategy http://www.communities.gov.uk/news/corporate/2033724
Housing Revenue Account Self-financing http://www.communities.gov.uk/publications/housing/draftdeterminationsselffinancing
NewBuy Guarantee and Right to Buy http://www.communities.gov.uk/news/corporate/2104121
FirstBuy: equity loans for first time buyers http://www.communities.gov.uk/news/corporate/1926856
Get Britain Building http://www.communities.gov.uk/news/corporate/2109358
Empty Homes http://www.communities.gov.uk/news/corporate/2099450
Government land for new homes http://www.communities.gov.uk/news/corporate/2001971
New Homes Bonus http://www.communities.gov.uk/housing/housingsupply/newhomesbonus/
Preventing Repossessions Fund http://www.communities.gov.uk/news/corporate/2086207
Support for homelessness http://www.communities.gov.uk/news/corporate/2102160
Affordable Housing Programme http://www.communities.gov.uk/news/newsroom/2124305
Supporting People http://www.communities.gov.uk/news/corporate/2110095
Decent Homes http://www.communities.gov.uk/news/corporate/2040762
Social housing allocations policy http://www.communities.gov.uk/news/corporate/2060987
HomeSwap Direct http://www.communities.gov.uk/news/corporate/201468712
Tackling neighbours from hell http://www.communities.gov.uk/news/corporate/2108492
Right to Manage and Right to Transfer http://www.communities.gov.uk/news/corporate/2107148
Putting Communities in Charge of Planning (paragraphs 2.55 – 2.59)
2.55 The Department is committed to putting power into the hands of communities to shape the places where they live, by reforming the planning system. The purpose of planning is to help achieve sustainable development, which is about positive growth - making economic, environmental and social progress for this and future generations including by helping to create the homes and jobs which people need.
2.56 In March 2012 Ministers published the new National Planning Policy Framework, which:
• enshrines the local plan as the keystone of the planning system; • makes planning much simpler and more accessible – reducing nearly 1,300 pages
into a clear, readable guide of around 50 pages; • establishes a powerful presumption in favour of sustainable development; • maintains robust protection for our natural environment, including the Green Belt; • encourages the use of brownfield land in a way determined locally;

Department for Communities and Local Government Annual Report and Accounts 2011-12 How the Department performed in 2011-12
22
• remove national parking restrictions to help high streets attract customers; and • strengthens the requirement for new development to be of good design.
2.57 The Localism Act 2011 introduces neighbourhood planning powers. 108 areas announced in March 2012 will trial these new rights. Before Royal Assent, 125 ‘front runners’ tested neighbourhood planning, helped by free expert planning advice and £20,000 for their local council. For example, in Sherston, Wiltshire, the Parish Council aims to deliver affordable homes for elderly and disabled residents, and is looking at the need for key infrastructure such as high speed broadband and new schools, and at developing a community orchard.
2.58 The first councils started charging Community Infrastructure Levy to support development by funding infrastructure that councils and communities want. The Localism Act 2011 introduced a requirement for councils to pass part of the Levy to neighbourhoods, giving far more ability to shape their area and accommodate the impact of new development.
2.59 To ensure the planning system for delivery of major infrastructure is rapid, transparent and accountable, the Localism Act 2011 abolished the Infrastructure Planning Commission. The Department closed it in March 2012, returning responsibility for decisions to elected Ministers, advised by a Major Infrastructure Planning Unit within the Planning Inspectorate.
Achievement Link to more detail
Simplification of planning policy http://www.communities.gov.uk/news/corporate/2115421
Neighbourhood Planning http://www.communities.gov.uk/news/corporate/20075571
Community Infrastructure Levy http://www.communities.gov.uk/planningandbuilding/planningsystem/communityinfrastructurelevy/
Tackling the Budget Deficit (paragraphs 2.60 – 2.66)
2.60 At the beginning of 2011-12, the Department implemented its reduction in planned programme spending to contribute to the Government’s plans to stabilise the public finances. This reduced the Department’s budgets in real terms by 33% on resource3 and 74% on capital by 2014-15 (compared to 2010-11), and transferred over £6.7 billion of funding to local government.
2.61 In 2011-12, the Department was given additional responsibilities and funding beyond our Spending Review Settlement. We announced the following new significant programmes: Growing Places Fund, Right to Buy, Troubled Families, NewBuy, Get Britain Building and City Deals. We provided £500m of an extra £1 billion for the Regional Growth Fund, and the remaining round 1 funding was centralised in the Department.
3
Or 51% if reflecting the transfer of Supporting People grant to Local Government.

Department for Communities and Local Government Annual Report and Accounts 2011-12 How the Department performed in 2011-12
23
2.62 The Department is implementing a 33% saving in real terms on administration costs. Our Change Programme has concluded. Alongside reductions to estates and other non-pay costs, this required that we cut paybill costs by 34% and reduce our workforce by 37% against the starting baseline. By October 2011, reductions had been identified through selection exercises carried out by grade and a number of voluntary exit opportunities. Staff exits will be complete by October 2012, as planned.
2.63 The Department announced plans in March 2011 to rationalise the Departmental Group by two thirds, which is estimated to save around £170m by 2014-15 on our main budget and £60m on our Local Government budget. The number of Arm’s Length Bodies will reduce from 26 to nine, of which eleven have now closed or transferred – the Tenant Services Authority, Infrastructure Planning Commission and Standards Board for England closed in March 2012 as a result of the Localism Act 2011. The bodies which will remain are putting in place measures to increase efficiency, including securing better value for money in procurement and reducing running costs. For savings from local audit reforms see paragraph 2.22 above.
2.64 Internally, the Department has also:
• completed abolition of the Government Offices for the Regions, saving £190m over four years;
• cut spend on consultancy to £3.4m in 2011-12, from £60m in 2009-10 and £19m in 2010-11, and cut spend on agency staff by two thirds since 2010-11;
• cut Government Procurement Card spending by 64%; • consolidated our presence in Eland House by vacating two floors, giving additional
income of £1.2m in 2011-12 (increasing in later years); and • entered into a joint Facilities Management contract with the Department for
Education which will save this Department £2.1m per year.
2.65 The Government inherited £236m in potential liabilities for the 2000-06 European Regional Development Fund. By the end of March 2012, the Department had reduced this to just over £41m of which £26.3m is a specific charge to 2011-12. This has been delivered against a backdrop of a well managed major transition programme (from the Government Office structure to a smaller centralised Department-led team) and continued negotiations with the Commission, leading to closure of seven of the 20 programmes on a significantly faster timetable than the 1994-99 programme.
2.66 The Department will continue to develop more commercial approaches to raise private sector investment, such as NewBuy, and approaches that invest and secure a financial return rather than simply spend taxpayer money, such as Getting Britain Building.
Achievement Link to more detail
Rationalising the Departmental Group http://www.communities.gov.uk/news/newsroom/1865652
European Regional Development Funding http://www.communities.gov.uk/news/corporate/1957698

Department for Communities and Local Government Annual Report and Accounts 2011-12 Progress on the Structural Reform Plan and input / impact indicators
24
3 Progress on the Structural Reform Plan and input / impact indicators
Structural Reform Plan 3.1 Progress against the Structural Reform Plan actions due to complete in 2011-12 (as of
31 March) is set out at the end of the Results table below.
3.2 At the end of March, the Department had completed 85% of our actions (166 out of 196), including completing 18 actions early. The one delayed action by year end was consulting on proposals to simplify information required to support planning applications, particularly at outline stage. This has been integrated within a package on wider planning reforms. The Budget 2012 included a commitment to implement simplification proposals by 2013.
3.3 All the monthly implementation reports and latest data, including details on the actions due to start and complete each month, can be found on the Department’s website: http://www.communities.gov.uk/publications/corporate/structuralreformplan
3.4 The actions in the Results table below are those from the Structural Reform Plan published in May 2011 as part of the Department’s Business Plan and can be found on the Department’s website: http://www.communities.gov.uk/publications/corporate/businessplan2011
Input and Impact Indicators 3.5 The Business Plan also sets out the Department’s input and impact indicators, as
required for all departments which have published a Plan as part of the Transparency Framework. The Results table below outlines progress on each of the indicators over 2011-12.
3.6 Where available we have provided annual rather than quarterly figures. In cases where annual data is not yet available we have presented figures for those quarters where data is available. Details on when these will be available are in the table footnotes. Quarterly data is available for some indicators in the Quarterly Data Summaries at http://www.communities.gov.uk/corporate/about/howwework/corporatereports/businessplans/
3.7 The Department’s commentary on the results is as follows: • In 2011-12 the Homes and Communities Agency (HCA) delivered 15,698
affordable housing starts on site. Whilst this was a decrease from 2010-11 (49,363) the figures reflect a period of transition following the ending of the National Affordable Housing Programme (NAHP) and the launch of our new Affordable Homes Programme (AHP). In 2011-12 the HCA delivered 51,665 affordable housing completions, a small decrease (7.5%) on 2010/11, but significantly exceeding their target of 35,000. The number of starts on site in the second half of the year has been very encouraging and the numbers are consistent with expectations to deliver the 80,000 completions anticipated through the AHP.

Department for Communities and Local Government Annual Report and Accounts 2011-12 Progress on the Structural Reform Plan and input / impact indicators
25
• The total number of house building starts and completions indicators show that house building performance has been broadly steady between 2010-11 and 2011-12.
• The average New Homes Bonus grant payable per dwelling per year has risen moderately in 2011-12 compared to 2010-11 (5% in England) driven by the affordable homes premium.
• The energy efficiency of new build housing (average Standard Assessment Procedure energy rating score) has fallen slightly to 79.6 from 81.3. Since the time series began in 2008, the vast majority of private sector homes will have been built to the 2006 Building Regulations standard. However, affordable homes supported by the HCA have been built to a higher standard (what is now the 2010 Building Regulations standard). It is possible therefore that the reduction in affordable housing completions (see above) in proportion to the private sector may have decreased the SAP average. Over the next year, we can expect to see the impact of the higher standards of the 2010 Building Regulations start to have an effect as new home homes built to those standards are completed.
• There were 50,510 households in temporary accommodation on 31 March 2012 (seasonally adjusted), compared with 48,310 at the same date last year. Whilst this represents a rise of 5 per cent in the number of households in temporary accommodation over the year, the figure represents a 50 per cent decrease from the peak quarterly figure in 2004.
• The number of planning applications granted as a percentage of all applications for major and minor schemes in the October to December quarter 2011 has shown a small increase compared with the corresponding quarter in 2010.
• The quarterly fire-related casualties (per 100,000 population) figures show little change year-on-year compared with 2010-11.
3.8 The following tables provide data on the Structural Reform Plan for 2011-12 and 2010-11.

Department for Communities and Local Government Annual Report and Accounts 2011-12 Progress on the Structural Reform Plan and input / impact indicators
26
2011-12 2010-11N/A -(j)
England N/A 76.0%i) London boroughs N/A 80.8%ii) Metropolitan districts N/A 81.1%iii) Unitary authorities N/A 75.2%iv) Shire counties N/A 70.8%v) Shire districts N/A 57.9%vi) Greater London Authority N/A 85.2%vii) (a) Other authorities - fire authorities N/A 55.2%vii) (b) Other authorities - excluding fire authorities & GLA N/A 76.5%
N/A £41.44
England £1,400 £1,334i) Shire areas £1,427 £1,351ii) Metropolitan areas £1,269 £1,223iii) London £1,528 £1,452
i) Inner London boroughs and City 188.7% 187.5%ii) Outer London boroughs 97.8% 99.1%iii) London (including City) 131.0% 131.8%iv) GLA - fire 7.8% 8.3%v) Metropolitan districts 127.0% 127.9%vi) Joint fire authorities (metropolitan districts) 6.5% 7.3%vii) Unitary authorities (act as fire authorities) 100.6% 99.4%viii) Unitary authorities (do not act as fire authorities) 92.2% 91.7%ix) Shire counties (act as fire authorities) 67.7% 67.3%x) Shire counties (do not act as fire authorities) 66.1% 64.7%areas) 4.5% 4.8%
4. Average New Homes Bonus grant payable per dwelling per year to different classes of authority(c)
5. Formula Grant per head as a percentage of England average (d)
ResultsInput Indicators
1. Affordable Rent payment per dwelling by the HCA (a)
2. Percentage of local authority revenue expenditure funded by central government grants, broken down by class of authority(b)
3. Expenditure per head on the Fire and Rescue Service(b)
(for notes, see next page)

Department for Communities and Local Government Annual Report and Accounts 2011-12 Progress on the Structural Reform Plan and input / impact indicators
27
2011-12 2010-11
Starts: total for year (e) 104,970 112,060Completions: total for year (e) 117,870 111,250
N/A 121,200
Starts: total for year 15,698 49,363Completions: total for year 51,665 55,860
Weighted annual mean of published quarterly average scores (g) 79.6 81.28
Total for year 50,510 48,310
1 April to 30 June 3.8 3.61 July to 30 September 3.6 3.51 October to 31 December N/A 4.21 January to 31 March N/A 3.7Average for year N/A 3.7
N/A 92.2%
1 April to 30 June 83.6% 82.6%1 July to 30 September 83.6% 82.5%1 October to 31 December 83.8% 83.3%1 January to 31 March N/A 82.5%Average for year N/A 83.6%
2011-12 2010-11166 81
1 170 0
30 46
Total number of actions completed during the yearTotal number of actions overdue at the end of the yearNumber of overdue actions that are attributable to external factorsTotal number of actions ongoing
Structural Reform Plan Actions
5. Households in temporary accommodation, seasonally-adjusted *
7. Decentralisation of central government funding through percentage of un-ring fenced grants(b)
8. The number of planning applications granted as a percentage of all applications for major and minor schemes(i)
3. Number of affordable housing starts and completions delivered through the Homes and Communities Agency
6. Fire-related casualties (h) *
4. Energy efficiency of new build housing (average Standard Assessment Procedure energy rating score)
1. Total number of housing starts and completions, seasonally- adjusted (as a leading indicator of net additions)
2. Number of net additions to the housing stock(f)
Impact Indicators
Notes: Full technical details for each indicator, and contextual information on the indicators, can be found in the Indicator Measurement Annex A and at: http://www.communities.gov.uk/corporate/about/howwework/corporatereports/businessplans/
* Provisional Figures N/A = not available at the time of publication (but see footnotes for publication dates) (a) Data not available until Q2 2012-13. (b) Outturn figures for 2011-12 will be published in August 2012. (c) Figures reported for 2011-12 relate to payments made in April 2012 but relate to new homes
in 2011-12. (d) Excluding police funding. City of London non-police figures have been estimated for 2010-11. (e) The annual total is not necessarily equal to the sum of the seasonally-adjusted figures for
each quarter, as published in the Quarterly Data Summary (QDS).

Department for Communities and Local Government Annual Report and Accounts 2011-12 Progress on the Structural Reform Plan and input / impact indicators
28
(f) Figures for 2011-12 will be published in autumn 2012 – see http://www.communities.gov.uk/housing/housingresearch/housingstatistics/housingstatisticsby/stockincludingvacants/housingstockpublications/ .
(g) The annual figures have not been calculated using the underlying data and so are not precise averages but they are nevertheless fit for purpose. A weighted average has been calculated using the number of seasonally adjusted housing completions in each quarter.
(h) Provisional data for last two quarters 2011-12 are published In July 2012: http://www.communities.gov.uk/fire/researchandstatistics/firestatistics/firestatisticsmonitors/ .
(i) Figures for the last two quarters 2011-12 will be published in late June 2012: http://www.communities.gov.uk/planningandbuilding/planningbuilding/planningstatistics/statisticsplanning/ .
(j) Not available because the Affordable Rent scheme did not exist before 2011.
3.9 Full technical details for each indicator, and contextual information on the indicators, can be found in the Indicator Measurement Annex A and at: http://www.communities.gov.uk/corporate/about/howwework/corporatereports/businessplans/
3.10 The following tables provide data on the items included in the Quarterly Data Summary which is published four times a year by the Department. Latest versions of these tables can be downloaded from http://www.communities.gov.uk/corporate/publications/corporate-reports/ together with the Indicator Measurement Annex for these tables.

Department for Communities and Local Government Annual Report and Accounts 2011-12 Progress on the Structural Reform Plan and input / impact indicators
29
2011-12 2010-11 2011-12 2010-11
5,642,328 9,915,408 26,549,931 28,797,909
1,821,401 3,845,324 26,557,648 25,865,615
81,145 - 19,000,000 21,500,000234,260 - 5,905,455 3,167,008
190,531 2,165,807 1,327,222 -
60,373 82,050 152,000 150,19656,586 70,194 - -
273,474 349,524 172,671 156,150250,402 386,594 15,200 21,944
1,048,248 2,483,895 26,366,794 25,694,0013,820,921 6,458,741 (7,716) -66,7931,621,646 2,887,710 - -
300,000 622,191 - -
453,083 - - -
180,007 168,802 - -
194,247 133,675 - -
(197,287) 594,611 732,307 1,292,624
152,824 842,973 744,304 1,110,845315,776 383,844 - -
(704,179) (581,662) - -
D: HCA: Affordable Homes Programme 64,255 - - -
60,579 - - -
Total Departmental Expenditure Limit (DEL)
Up to top 5 contributory elements
A: New Homes Bonus / NNDR Payments
of which Resource DEL
D: Homes & Community Agency / Valuation Office E: Fire Future Controls
B: Decent Homes (LAs)C: HCA: Property and Regeneration
Budget DCLG Communities
E: HCA: Property & Regeneration
D: Disabled Facilities GrantE: Decent Homes Gap Funding
Total Annually Managed Expenditure (AME)
Up to top 5 contributory elements
A: Overhanging Debt Repayment / NNDR outturn
Up to top 5 contributory elements
A: HCA Affordable Housing Programme
DCLG Local Government
Spend Indicators
B: Fire SuperannuationC: HRAS Housing Revenue Account Subsidy
Purchase of goods and services within Resource DELPayroll within Resource DEL
Grants within Resource DELof which Capital DEL
B: Regional growth fund / Revenue Support Grant
C: local support services grant / Council Tax freeze
2011-12 2010-11
Accuracy of Cash Forecasting ( +/- %) 2.01 5.70Working Capital Forecast (% variance of Actual v Forecast) N/A(1) N/A(1)
Net Book Value (% variance of Actual v Forecast) N/A(1) N/A(1)
Financial Indicators
Note 1: The Department does not forecast working capital or net book value

Department for Communities and Local Government Annual Report and Accounts 2011-12 Progress on the Structural Reform Plan and input / impact indicators
30
2011-12 2010-11
Total office estate (m2) 17,783 26,667Total cost of office estate (£m) 21.8 20.5Cost per FTE (£) (1) 13,018 7,929Cost per m2 (£) 1,113 767Total Procurement Spend (£m) 253.3 310.3Price of standard box of A4 white copier paper (£/2500 sheets) 11.34 9.18
Average price of energy (£/KWH) 0.07 0.07Total 3rd Party ICT Cost (£m) 51.0 68.4Cost of desktop provision per FTE (£) 2,445 2,270Human Resources (£m) 3.9 4.5Finance (£m) 7.8 8.3Procurement (£m) 1.4 1.5Legal (£m) 6.2 8.4Communications (£m) 3.3 3.8Total Identified Fraud (£m) 0.00 0.04Total known Errors (£m) 7.9 4.0Total Debt (£m) 242.8 369.7Debtor Days 6.8 11.8Procurement spend with SME (£m) 49.5 24.4Procurement spend with VCS (£m) 1.4 5.6Grants to VCS (£m) 50.4 104.7
Common Areas of Spend
Procurement
Estate Costs
Corporate Service Cost
Voluntary and community sector (VCS)/ Small and medium enterprises (SME)
Fraud, Error, Debt
IT
Note 1 The cost of the DCLG estate per FTE and per metre squared has risen in 2011-12 due to cost increases outside of the Department’s control and because of existing sub-tenancy agreements expiring. The cost per full time equivalent figures have also been impacted by the significant reduction in staff.
2011-12 Whole life cost
£m £mReform of the Audit Commission 12.1 53.1ICT re-let 0.2 36.6Housing Investment and Regulatory Reform Programme 16.7 25.5PINS/IPC Integration Programme 1.4 8.1Housing Revenue Account reform 0.8 1.9
Total (all major projects) 39.9 123.3
Major projects expected cost (top 5)
Major Projects

Department for Communities and Local Government Annual Report and Accounts 2011-12 Progress on the Structural Reform Plan and input / impact indicators
31
31 March 12 31 March 11
Department and Agency 2,422 3,474Non-departmental public bodies 1,175 1,542Department Family 3,597 5,016Average Staff Costs £55,581 £52,018
Department and Agencies 53 37Non-departmental public bodies 23 23Department Family 76 60
Year ended 31 March 12
Year ended 31 March 11
Administrative Assistants and Administrative Officers 14% 15%
Executive Officers 16% 16%Higher and Senior Executive Officers 35% 33%Grades 6 & 7 32% 31%Senior Civil Servants 4% 4%Part Time 16.6% 16.5%Recruitment Exceptions N/A N/AAnnual Turnover Rate 23.7% 13.0%Black and Minority Ethnic 20.2% 17.9%Women 48.2% 48.5%Disabled 6.3% 6.9%Black and Minority Ethnic 7.8% 8.0%Women 37.2% 39.8%Women (Top Management Posts) 27.3% 29.2%Disabled 3.9% 7.1%Actual 6.3% 6.8%Standardised N/A N/A
2011 survey 2010 survey
40% 53%Leadership and Managing Change 26% 38%My Work 65% 74%My Line Manager 63% 66%Organisational Objectives & Purpose 57% 70%
People
Payroll Staff
Attendance (AWDL)
Contingent Labour
Department and Agencies Only
Whole Department Family - Workforce Size
Department only; People Survey Metrics
Engagement Index
Theme scores
Workforce Shape
Workforce Dynamics
Workforce Diversity
Workforce Diversity (Senior Civil Servants only)
Note: Entries with N/A are where data is not yet available. This will be published in Q1 12-13 QDS

Department for Communities and Local Government Annual Report and Accounts 2011-12 Other Information
32
4 Other Information Personal Data Related Incidents
4.1 The Department, its Agency and NDPBs manage a range of data which relates to staff and citizens, most of which is used to support policy analysis and review and does not allow the identification of individuals. Procedures and processes are in place to protect information and data and to ensure it is only used for the purposes for which it was collected. The recommendations of the Data Handling Review have been implemented and a coordinated approach to compliance adopted across the Group.
4.2 The Department had no significant Personal Data Related Incidents to report in 2011-12. The following table summarises minor Personal Data Related Incidents in the year.
Table 1: Summary of Other Protected Personal Data Related Incidents in 2011-12
Incidents deemed by the Data Controller not to fall within the criteria for report to the Information Commissioner’s Office but recorded centrally within the Department are set out in the table below. Small, localised incidents are not recorded centrally and are not cited in these figures.
Category Nature of incident Total
I Loss of inadequately protected electronic equipment, devices or paper documents from secured Government premises Nil
II Loss of inadequately protected electronic equipment, devices or paper documents from outside secured Government premises Nil
III Insecure disposal of inadequately protected electronic equipment, devices or paper documents Nil
IV Unauthorised disclosure Nil
V Other(*) 1
Note * relates to an incident involving the transmission of personal data to an insecure internet address. Complaints to the Parliamentary Ombudsman
4.3 There have been no cases against the Department accepted for investigation by the Parliamentary Ombudsman. Consequently there have been no investigations reported nor recommendations made.
Performance in responding to correspondence from the public 4.4 In 2011-12 the Department received 16,509 pieces of correspondence from members
of the public and external organisations4. Of these 9,604 (58%) were answered within fifteen working days.
4
These figures exclude correspondence from Members of Parliament and Peers, details of which are reported separately to Parliament on an annual basis. The latest Written Ministerial Statement on departmental performance can be found at:
http://www.publications.parliament.uk/pa/cm201212/cmhansrd/cm120315/wmstext/120315m0001.htm#12031546000003

Department for Communities and Local Government Annual Report and Accounts 2011-12 Introduction to the accounts
33
5 Introduction to the accounts 5.1 The Report and Accounts present the consolidated results for the financial year 2011-
12 of the following principal entities: the Department for Communities and Local Government – the core department – its Executive Agency, the Planning Inspectorate (PINS), 11 non-Departmental Public Bodies (NDPBs) and one other body (The Commission for Local Administration). Note 36 to these Accounts provides a full list of public bodies sponsored by the Department and identifies those that make up the Departmental Group.
5.2 These accounts have been prepared in accordance with the Direction given by the Treasury in pursuance of the Government Resources and Accounts Act 2000.
5.3 The Department produces a number of performance reports during the year and these can be found on the corporate publications section of the Department’s website: http://www.communities.gov.uk/corporate/publications/corporate-reports
5.4 PINS and all other bodies included in this consolidation publish separate Annual Reports and Accounts which are available on their website. Relevant links are included against each body at Note 36.

Department for Communities and Local Government Annual Report and Accounts 2011-12 Management commentary
34
6 Management Commentary
Financial Organisation of the Department 6.1 The Department operates a system of delegated resource management
responsibilities for programme and administrative expenditure, the aim being to give managers as much discretion as possible to make the most effective use of resources while still securing propriety, regularity and best value for money. Senior managers are held accountable through a requirement to report periodically on the discharge of their management responsibilities and control of resources entrusted to them. These arrangements are set out in the Department’s Governance Statement, which can be found in section 10.
6.2 In 2011-12, the Department strengthened these controls and expanded the principles to include its Arms Length Bodies, in particular in relation to the new Administration budget controls.
6.3 The Department has a number of management systems in place designed to ensure that objectives are met efficiently and effectively. The business planning process allows Ministers and the Board to review and agree key priorities and how these should be delivered in the context of the Department’s objectives and budgets.
6.4 The HM Treasury led Clear Line of Sight project is aligning budgets, estimates and accounting definitions. From 2011-12, accounts of the Department’s Non Departmental Public bodies have been consolidated with the Department’s accounts and the tables have been prepared on this consolidated basis.
The Future 6.5 The Department’s core budget (the Communities DEL) over the current Spending
Review period is now £18.3bn, of which £7.0bn is resource and £11.3bn is capital. These totals have increased from £16.2bn at the beginning of 2011-12 (£6.7bn resource and £9.5bn capital) as a result of additional funding being provided to support troubled families, the Growing Places Fund, the Regional Growth Fund and other new or expanded programmes. Further details of changes to budgets are provided at paragraph 6.8 to 6.16 below. As part of the settlement, the Department transferred £6.7bn over the Spending Review period into Formula Grant.
6.6 The Department is also responsible for the Local Government resource budget (LG DEL) and the settlement over the Spending Review period is a real-terms decrease of 28 per cent. When grants from other departments are included, the overall reduction in revenue grants will be 26 per cent in real terms. Local authorities also receive income from other sources, such as council tax. Through a transition grant from Communities DEL, the Department has ensured that no council’s overall spending power has been reduced by more than 8.8 per cent in either 2011-12 or 2012-13.
6.7 The expenditure plans in Tables 1a and 1b represent the Department’s position following Budget 2012. As noted above, both capital and resource budgets have increased since the 2010-11 accounts.

Department for Communities and Local Government Annual Report and Accounts 2011-12 Management commentary
35
Key budget changes for 2011-12 and future years 6.8 In December 2011 the Government announced a £465m fund to support Troubled
Families to reduce the burden they place on public services over the Spending Review 2010 (SR10) period. The Department has received an additional £227m from other Departments in the Supplementary Estimate and provided £150m from its own resources. The remaining element will be funded by other Departments.
6.9 The Department was also awarded funding for two new economic growth programmes during 2011-12. Treasury provided the Department with an additional £570m capital to support the Get Britain Building programme, which aims to encourage the development of stalled housing sites and £42m towards Empty Homes. Government funded the £730m Growing Places Fund in 2011-12 to stimulate housing growth through investment in infrastructure. £510m of this funding was paid out by the Department, including contributions of £375m from the Department for Transport and Treasury.
6.10 Initial funding for the Regional Growth Fund is now centralised within DCLG DEL. The Department for Transport and the Department for Environment, Food and Rural Affairs have transferred £245m resource and £265m capital to DCLG DEL. Following Budget 2012, an additional £1bn has been provided by the Treasury for the Regional Growth Fund, which has been split at the 2012-13 Main Estimate between DCLG and BIS DELs. The Department has received £500m capital.
6.11 Treasury also provided LG DEL with an additional £675m in 2011-12 towards the Council Tax Freeze.
6.12 The 2011-12 Supplementary Estimate, also reflected a number of Machinery of Government changes and transfer to other departments and DELs. £13m resource was transferred to Local Government DEL in relation to the Riots Recovery Scheme and High Street Support Scheme and £30m was transferred to Treasury to cover borrowing in relation to the Local Authority Social Housing Programme.
6.13 Machinery of Government changes included the transfer of the Residential Property Tribunal Service to the Ministry of Justice, while the Ordnance Survey Trading Fund was transferred to BIS in order to help prepare the ground for the establishment of a Public Data Corporation. Following the closure of the Regional Development Agencies, BIS transferred their land and property assets to the Homes and Communities Agency.
6.14 The Department used the new Budget Exchange mechanism to transfer some unspent funding from 2011-12 into 2012-13 - £20m resource and £69m capital on Communities DEL and £45m resource on Local Government DEL.
6.15 In line with the Housing Revenue Account Self-financing deal, which completed in March, £462m of AME costs were transferred into Communities DEL for council housing PFI projects. A further £30m was transferred from AME to Communities DEL to cover a change in the treatment of foreign exchange rate gains and losses on ERDF.
6.16 £15m from Communities Administration DEL and £737m from Local Government DEL was returned to the Treasury to contribute towards public sector pay restraint.

Department for Communities and Local Government Annual Report and Accounts 2011-12 Management commentary
36
Table 1a: Past, current and future departmental resource spending £’000
2008-09 2009-10 2010-11 2011-12 2012-13 2013-14 2014-15outturn outturn outturn outturn plan plan plan
Spending in DEL - DCLG CommunitiesVoted expenditureOf which:A: Localism 967,803 1,013,667 2,433,954 669,921 347,525 307,621 300,440B: Neighbourhoods 1,932,603 2,038,148 202,255 346,829 643,312 502,998 505,756C: Local Economies, Regeneration & European Programmes 605,166 480,040 618,851 319,857 200,472 426,502 8,877D: Troubled Families - - - 10,377 103,000 128,000 129,000E: Research, Data and Trading Funds 21,781 34,226 4,169 34,404 43,414 61,951 61,332F: DCLG Staff, Building and Infrastructure Costs 317,920 290,137 308,793 209,410 241,446 226,096 201,805G: Departmental Unallocated Provision - - - - 59,138 224,497 62,270H: Neighbourhoods (NDPB)(net) 243,613 271,672 199,232 119,262 157,633 114,496 102,142I: Local Economies, Regeneration & European Programmes (NDPB) (net) 33,325 202,410 76,853 110,377 1,874 (6,287) 431
Localism (NDPB) (net) 7,812 3,546 1,217 964 - - -Total Spending in DEL - DCLG Communities 4,130,023 4,333,846 3,845,324 1,821,401 1,797,814 1,985,874 1,372,053Spending in DEL - DCLG Local GovtVoted expenditureOf which:J: Revenue Support Grant 2,909,446 4,547,431 3,167,008 5,905,455 477,407 22,943,143 21,347,266K: Non-Domestic Rates Payments 20,500,000 19,500,000 21,500,000 19,000,000 23,119,000 - -L: London Governance 46,432 46,472 46,540 63,423 55,313 46,173 44,430M: Other grants and payments 1,009,187 1,227,682 980,458 1,383,277 170,687 770,982 769,115N: Valuation Services 166,000 163,800 150,196 152,000 149,000 154,000 150,000O: Audit Commission and Disbanding 1,315 1,322 517 12,080 24,993 - -P: Local Government (NDPB)(net) 18,495 30,020 20,896 41,413 22,759 24,569 22,459Total Spending in DEL - DCLG Local Govt 24,650,875 25,516,727 25,865,615 26,557,648 24,019,159 23,938,867 22,333,270Total Resource DEL 28,780,898 29,850,573 29,710,939 28,379,049 25,816,973 25,924,741 23,705,323
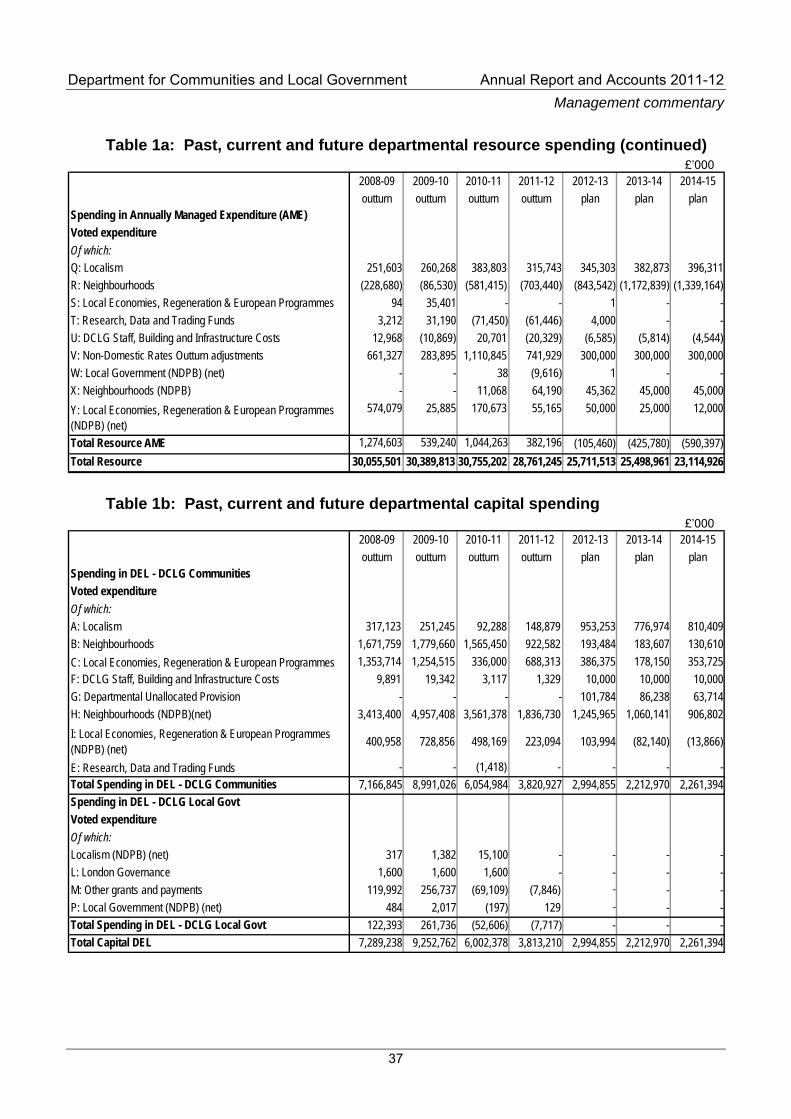
Department for Communities and Local Government Annual Report and Accounts 2011-12 Management commentary
37
Table 1a: Past, current and future departmental resource spending (continued) £’000
2008-09 2009-10 2010-11 2011-12 2012-13 2013-14 2014-15outturn outturn outturn outturn plan plan plan
Spending in Annually Managed Expenditure (AME)Voted expenditureOf which:Q: Localism 251,603 260,268 383,803 315,743 345,303 382,873 396,311R: Neighbourhoods (228,680) (86,530) (581,415) (703,440) (843,542) (1,172,839) (1,339,164)S: Local Economies, Regeneration & European Programmes 94 35,401 - - 1 - -T: Research, Data and Trading Funds 3,212 31,190 (71,450) (61,446) 4,000 - -U: DCLG Staff, Building and Infrastructure Costs 12,968 (10,869) 20,701 (20,329) (6,585) (5,814) (4,544)V: Non-Domestic Rates Outturn adjustments 661,327 283,895 1,110,845 741,929 300,000 300,000 300,000W: Local Government (NDPB) (net) - - 38 (9,616) 1 - -X: Neighbourhoods (NDPB) - - 11,068 64,190 45,362 45,000 45,000Y: Local Economies, Regeneration & European Programmes (NDPB) (net)
574,079 25,885 170,673 55,165 50,000 25,000 12,000
Total Resource AME 1,274,603 539,240 1,044,263 382,196 (105,460) (425,780) (590,397)Total Resource 30,055,501 30,389,813 30,755,202 28,761,245 25,711,513 25,498,961 23,114,926
Table 1b: Past, current and future departmental capital spending
£’000 2008-09 2009-10 2010-11 2011-12 2012-13 2013-14 2014-15outturn outturn outturn outturn plan plan plan
Spending in DEL - DCLG CommunitiesVoted expenditureOf which:A: Localism 317,123 251,245 92,288 148,879 953,253 776,974 810,409B: Neighbourhoods 1,671,759 1,779,660 1,565,450 922,582 193,484 183,607 130,610C: Local Economies, Regeneration & European Programmes 1,353,714 1,254,515 336,000 688,313 386,375 178,150 353,725F: DCLG Staff, Building and Infrastructure Costs 9,891 19,342 3,117 1,329 10,000 10,000 10,000G: Departmental Unallocated Provision - - - - 101,784 86,238 63,714H: Neighbourhoods (NDPB)(net) 3,413,400 4,957,408 3,561,378 1,836,730 1,245,965 1,060,141 906,802I: Local Economies, Regeneration & European Programmes (NDPB) (net) 400,958 728,856 498,169 223,094 103,994 (82,140) (13,866)
E: Research, Data and Trading Funds - - (1,418) - - - -Total Spending in DEL - DCLG Communities 7,166,845 8,991,026 6,054,984 3,820,927 2,994,855 2,212,970 2,261,394Spending in DEL - DCLG Local GovtVoted expenditureOf which:Localism (NDPB) (net) 317 1,382 15,100 - - - -L: London Governance 1,600 1,600 1,600 - - - -M: Other grants and payments 119,992 256,737 (69,109) (7,846) - - -P: Local Government (NDPB) (net) 484 2,017 (197) 129 - - -Total Spending in DEL - DCLG Local Govt 122,393 261,736 (52,606) (7,717) - - -Total Capital DEL 7,289,238 9,252,762 6,002,378 3,813,210 2,994,855 2,212,970 2,261,394

Department for Communities and Local Government Annual Report and Accounts 2011-12 Management commentary
38
Table 1b: Past, current and future departmental capital spending (continued) £’000
2008-09 2009-10 2010-11 2011-12 2012-13 2013-14 2014-15outturn outturn outturn outturn plan plan plan
Spending in Annually Managed Expenditure (AME)Voted expenditureNeighbourhoods 516,448 170,736 842,972 152,824 946,000 658,000 658,000Total Spending in AME 516,448 170,736 842,972 152,824 658,000 658,000 658,000Total Capital 7,748,005 9,365,817 6,845,350 3,966,034 2,951,000 2,472,000 2,619,000
Table 2: Administration budgets
£’000 2008-09 2009-10 2010-11 2011-12 2012-13 2013-14 2014-15Outturn Outturn Outturn Outturn Plans Plans Plans
E: DCLG Staff, Building & Infrastructure Costs 305,455 276,944 252,221 194,124 235,196 220,096 195,805G: Neighbourhoods (NDPB) (net) 173,667 190,381 153,814 117,521 152,563 113,423 101,067H: Local Economies, Regeneration & European Programmes (NDPB) (net) 13,412 13,548 12,480 26,370 5,620 - -
Localism (NDPB) (net) 7,812 3,548 1,118 964 - - -
Total administration expenditure 500,346 484,421 419,633 338,979 393,379 333,519 296,872
6.17 The administration costs regime has been reformed to capture the costs of policy,
funding and regulation more accurately.
6.18 The Spending Review resulted in the allocation of a Single Administration Budget to cover administration expenditure in Arm’s Length Bodies, the core Department and the initial costs arising from the closure of the Government Office Network. The Single Administration Budget allocated for 2014-15 is a third lower in real terms than the 2010-11 baseline. The Department has started its delivery of this challenging target by adopting a number of measures including:
• a phased programme of staff reductions, controlled carefully to avoid an adverse impact on operational delivery combined with close scrutiny of all proposals for the use of consultants and temporary staff to ensure they are unavoidable
• delivery of back office savings, including shared service initiatives both within the group and with other government organisations.
6.19 The Department has an established quarterly review process. Arrangements have been made to include Arm’s Length Bodies in the process, thereby enabling them to give up budgets which are not needed so that those funds can be used elsewhere in the group or for other bodies to seek additional funding when new pressures have arisen.
Capital 6.20 Table 3 below provides detail of the capital employed by the Department.

Department for Communities and Local Government Annual Report and Accounts 2011-12 Management commentary
39
Table 3: Capital employed £’000
2008-09 2009-10 2010-11 2011-12 2012-13 2013-14 2014-15Outturn Outturn Outturn Outturn Plans Plans Plans
Assets Non-Current Assets (>1 year)
Intangible Assets 69,345 79,936 24,734 16,832 10,404 8,797 6,275Property, plant and equipment 69,263 71,945 118,661 109,004 101,022 94,122 86,481
of whichLand and Buildings 10,531 12,808 73,992 79,640 75,973 71,853 67,221Plant and machinery 8,287 9,349 7,893 4,587 3,057 2,641 2,489Vehicles 26,666 24,171 21,674 11,176Information technology 4,262 7,136 4,572 3,366 9,247 9,273 8,008Payments on account and assets under construction 16,919 13,952 6,698 7,617 10,956 9,133 7,928Other 2,599 4,527 3,832 2,618 1,789 1,222 835
Investment Property - - 28,806 28,511 29,281 30,013 30,763Financial assets: investments 66,420 69,791 32,767 31,348 32,194 32,999 33,824Trade and other receivables 125,551 170,334 174,328 14,346 14,562 14,783 15,009
Current Assets (<1 year) 678,931 711,507 762,968 826,673 719,541 700,094 663,631 Liabilities
Current liabilities (<1 year) (1,040,014) (1,157,656) (1,218,131) (1,798,683) (1,394,887) (1,357,188) (1,286,501)Provisions (<1 year) (92,997) (121,941) (57,530) (10,061) (8,120) (6,881) (5,810)
Non-current liabilities (>1 year) (503,495) (194,997) (297,636) (301,928) (304,142) (308,279) (312,507)Provisions (62,401) (29,341) (29,713) (22,079) (20,070) (14,623) (10,235)
Capital employed within core Department and Agency (689,395) (400,422) (460,746) (1,106,037) (820,215) (806,162) (779,068)
Non-Departmental Public Bodies' total assets less liabilities 1,002,448 1,225,960 1,867,509 1,720,134 2,276,993 2,426,987 2,299,760
Total capital employed in departmental group 313,053 825,538 1,406,763 614,097 1,456,778 1,620,825 1,520,692
Notes:
Assets and liabilities in the Statement of Financial Position at year end:
Capital employed for entities joining or leaving the department under Machinery of Government changes is not included until the year in which the change takes place.
Capital employed is the funding required by an organisation to set it up and continue its existence. Capital consists of funding invested in the organisation (shareholders' equity in private sector organisations) and loans to the organisation (either directly as money lent or indirectly as credit allowed in business activity e.g. time allowed to pay invoices).The capital employed by an organisation is reported in the Statement of Financial Position in its financial statements. The Statement of Financial Position lists the organisation's assets and its liabilities.
From 2009-10 the figures are based on International Financial Reporting Standards (IFRS) and International Generally Accepted Accounting Practice (IGAAP). 2007-08 and 2008-09 are restated in IFRS/IGAAP. Investments are assets that represent funding provided to other organisations as equity (e.g. public dividend capital) or as loans.
Assets can be "non-current assets" (providing benefit for more than one year after acquisition) or "current assets" providing benefit within one year of acquisition.
Liabilities show payment owed by the Department to third parties. Liabilities are analysed between those having to be paid within one year, and those for which payment will be after one year.

Department for Communities and Local Government Annual Report and Accounts 2011-12 Management commentary
40
Investment and Funding 6.21 The Department is accountable to Parliament for its expenditure. Parliamentary
approval for its spending plans was sought through Supply Estimates presented to the House of Commons, specifying the estimated expenditure and requesting the necessary funds. The Department then drew down funds in year from the Consolidated Fund as required.
6.22 Tables 4a to 4e on pages 41 – 45 of this Report and the Statement of Parliamentary Supply, on Page 101 of the Accounts, show outturn figures against Estimates.
6.23 The Consolidated Statement of Cash Flows on Pages 104 & 105, analyses the net cash flow from operating activities, identifies cash spent by the Department on capital expenditure and investment and shows the funding that the Department drew down from the Consolidated Fund in order to finance its activities during the year.

Department for Communities and Local Government Annual Report and Accounts 2011-12 Management commentary
41
Table 4a: 2011-12 Resource outturn against budget £’000
original budget final budget outturn variance against final budget
Spending in DEL - DCLG CommunitiesVoted expenditureLocalism 413,558 568,449 669,921 (101,472)Neighbourhoods 305,237 353,640 346,829 6,811Local Economies, Regeneration & European Programmes 354,696 415,455 319,857 95,598Troubled Families - 16,524 10,377 6,147Research, Data and Trading Funds 76,593 63,762 34,404 29,358DCLG Staff, Building and Infrastructure Costs 525,849 262,473 209,410 53,063Departmental unallocated provision 106,824 - - -Localism (NDPB)(net) 1,566 1,718 964 754Neighbourhoods (NDPB)(net) 33,060 181,235 119,262 61,973Local Economies, Regeneration & European Programmes (NDPB) (net) 236,894 86,915 110,377 (23,462)
Total Spending in DEL - DCLG Communities 2,054,277 1,950,171 1,821,401 128,770Spending in DEL - DCLG Local GovtVoted expenditureRevenue Support Grant 5,905,455 5,905,455 5,905,455 -Non-Domestic Rates Payments 19,000,000 19,000,000 19,000,000 -London Governance 63,419 63,419 63,423 (4)Other grants and payments 779,759 1,466,038 1,383,277 82,761Valuation Services 152,000 152,000 152,000 -Audit Commission and Disbanding 56,100 20,090 12,080 8,010Local Government (NDPB)(net) 44,739 44,689 41,413 3,276Total Spending in DEL - DCLG Local Govt 26,001,472 26,651,691 26,557,648 94,043Total Spending in DEL 28,055,749 28,601,862 28,379,049 222,813
Spending in Annually Managed Expenditure (AME)Voted expenditureLocalism 323,091 323,091 315,743 7,348Neighbourhoods (642,156) (630,172) (703,440) 73,268Local Economies, Regeneration & European Programmes - - - -Research, Data and Trading Funds - (30,000) (61,446) 31,446DCLG Staff, Building and Infrastructure Costs - (20,000) (20,329) 329Non-Domestic Rates Outturn adjustments 300,000 750,000 741,929 8,071Localism (NDPB) - 1 - 1Local Government (NDPB)(net) - - (9,616) 9,616Neighbourhoods (NDPB) 35,503 23,419 64,190 (40,771)Local Economies, Regeneration & European Programmes (NDPB) (net)
34,827 94,827 55,165 39,662
Total Spending in AME 51,265 511,166 382,196 128,970Total for Estimate 28,107,014 29,113,028 28,761,245 351,783Of which:
Voted expenditure 26,687,987 29,113,028 28,761,245 351,783Non-voted expenditure - - - -
2011-12

Department for Communities and Local Government Annual Report and Accounts 2011-12 Management commentary
42
Table 4b: 2011-12 Capital outturn against budget
£’000
original budget final budget outturn variance against final budget
Spending in DEL - DCLG CommunitiesVoted expenditureLocalism 115,400 249,149 148,879 100,270Neighbourhoods 578,810 919,119 922,582 (3,463)Local Economies, Regeneration & European Programmes 158,782 491,521 688,313 (196,792)Troubled Families - - - -Research, Data and Trading Funds 15,000 - - -DCLG Staff, Building and Infrastructure Costs 10,000 4,441 1,329 3,112Departmental unallocated provision 29,890 - - -Localism (NDPB) (net) - - -Neighbourhoods (NDPB) (net) 2,126,000 1,870,320 1,836,730 33,590Local Economies, Regeneration & European Programmes (NDPB) (net) 428,718 320,447 223,094 97,353
Total Spending in DEL - DCLG Communities 3,462,600 3,854,997 3,820,927 34,070Spending in DEL - DCLG Local GovtVoted expenditureOther grants and payments - - (7,846) 7,846Local Government (NDPB) (net) - 50 129 (79)Total Spending in DEL - DCLG Local Govt - 50 (7,717) 7,767Total Spending in DEL - 3,855,047 3,813,210 41,837Spending in Annually Managed Expenditure (AME)Voted expenditureNeighbourhoods 658,000 370,000 152,824 217,176Total Spending in AME 658,000 370,000 152,824 217,176Total for Estimate 4,120,600 4,225,047 3,966,034 259,013Of which:
Voted expenditure 4,120,600 4,225,047 3,966,034 259,013Non-voted expenditure - - - -
2011-12
Note: In tables 4a and 4b ‘original budget’ = Estimates provision and ‘final budget’ = Supplementary Estimates provision, both recast to 2012-13 Estimates format.
6.24 The outturn shows the resources consumed by the Department. As well as the Resource Requirement in the departmental Estimates the Department also has a Resource Budget, which is split between the Departmental Expenditure Limit (DEL) and Annually Managed Expenditure (AME).

Department for Communities and Local Government Annual Report and Accounts 2011-12 Management commentary
43
Table 4c: Reconciliation of Statement of Consolidated Net Expenditure to resource Estimate and budget
£’000 2011-12 2011-12
Plans Outturn
Gross Administration Costs 406,063 359,455Less:
Administration DEL (DCLG Communities) Income (29,017) (20,476)Administration DEL (DCLG Local Govt) Income - -
Net Administration Costs 377,046 338,979
Gross Programme Costs 41,631,199 40,667,407Less:
Programme DEL (DCLG Communities) Income (570,249) (569,527)Programme DEL (DCLG Local Govt) Income (1,373) (6,840)Programme AME Income (8,252,057) (8,021,067)Non-budget income (6,404,300) (6,479,415)
Net Programme Costs 26,780,466 25,590,558
Total Net Operating Costs 27,157,152 25,929,537Of which:
Resource DEL (DCLG Communities) 1,949,522 1,482,422Resource DEL (DCLG Local Govt) 26,651,691 26,557,648Capital DEL (DCLG Communities) 3,715,145 3,502,729Capital DEL (DCLG Local Govt) - (7,846)Resource AME 498,408 382,196Capital AME 370,000 152,824Non-budget (6,404,300) (6,479,415)
Adjustments to include:Departmental Unallocated Provision (resource) - -OCS - -
Adjustments to remove:Capital in the SoCNE (3,980,845) (3,647,707)Non-Budget Consolidated Fund Extra Receipts in the SoCNE 6,404,300 6,479,415
Other adjustments (90,893) -
Total Resource Budget 29,113,028 28,761,245Of which:
Resource DEL (DCLG Communities) 1,950,171 1,821,401Resource DEL (DCLG Local Govt) 26,651,691 26,557,648Resource AME 511,166 382,196
Adjustments to remove:Consolidated Fund Extra Receipts in the resource budget - -
Total Resource (Estimate) 29,113,028 28,761,245

Department for Communities and Local Government Annual Report and Accounts 2011-12 Management commentary
44
Table 4d: Reconciliation of net resource requirement to net cash requirement £’000
2011-12 2011-12Final budget Outturn
Net Resource Requirement 29,113,028 28,761,245
Net Capital Requirement 4,225,047 3,966,034
Accruals to cash adjustments 25,574 (1,289,070)
of whichAdjustments to remove non-cash items
Depreciation (34,734) (21,399)New provisions and adjustments to previous 49,683 35,662Departmental Unallocated Provision - -Supported capital expenditure (revenue) - (290,809)Prior period adjustments - -Other non-cash items (20,000) 13,760
Adjustment for NDPBsRemove voted resource and capital (2,607,528) (2,431,919)Add cash grant in aid 2,639,153 2,270,765
Adjustments to reflect movements in working balancesIncrease (+ )/ decrease (-) in inventories - 66,792Increase (+ )/ decrease (-) in receivables (1,000) (365,600)Increase (- )/ decrease (+) in payables - (585,763)Use of provisions - 19,441
Removal of non-voted budget items
of whichConsolidated Fund Standing Services - -Other adjustments - -
Net Cash Requirement 33,363,649 31,438,209

Department for Communities and Local Government Annual Report and Accounts 2011-12 Management commentary
45
Table 4e: Reconciliation of resource expenditure between Estimates, accounts and budgets
£’000 2011-12 2010-11Outturn Outturn
Net Resource Outturn 28,761,245 30,755,202 Adjustments to remove non-budget elements:
Prior period adjustments - -Adjustments include
Consolidated Fund Extra Receipts in the budget but not in the OCS - -
Total Resource Budget Outturn 28,761,245 30,755,202
of which Departmental Expenditure Limits (DEL) 28,379,049 29,710,939Annually Managed Expenditure (AME) 382,196 1,044,263
Adjustments include:Capital grants 3,647,707 6,061,870Consolidated Fund Extra Receipts in the SoCNE (6,479,415) (118,478)Grant in aid to NDPBs - 1,423
Total Net Operating Costs 25,929,537 36,700,017
2011-12 Variances of outturn against Estimate
6.25 Variance explanations are provided below where the comparison of outturn against Estimate has shown an overspend or an underspend of more than £0.5m and 10 per cent of the Estimate.
Table 4f: Subhead variance against Estimate – resource Subhead Variance Explanation
Line A Localism: overspend of £95.575m
There was a £143.4m increase in resource spend on the London Settlement which arose from changes post Supplementary Estimate to the final quantum of the settlement and the need to adjust the resource / capital split on the Regional Growth Fund (RGF), see Line C. A £17.8m underspend on the Communities budget arising after the Supplementary Estimate from funding to support the introduction of measures in the Localism Act on community rights and a number of initiatives related to Decentralisation and the Big Society. A £6.1m underspend on the Troubled Families programme which is a new programme run primarily on a payment-by-results basis. A £17.6m underspend on Fire Programmes because spend was held back after the Supplementary Estimate to cover potential asset revaluations and some emerging new pressures, including managing the profile of the Resilience and Efficiency grant. The remaining difference is due to a number of small under-spends against a collection of minor Programmes.

Department for Communities and Local Government Annual Report and Accounts 2011-12 Management commentary
46
Subhead Variance Explanation
Line C Local Economies, Regeneration & European Programmes: underspend of £123.219m.
The Regional Growth Fund secretariat informed the Department after the Supplementary Estimate process was complete that the resource / capital split for the budget did not match likely expenditure (-£134m / +£134m). To resolve this DCLG brought forward projects from future years and agreed with local authorities, including the GLA and Fire and Rescue Authorities, exchanges of resource for capital for scheduled payments to manage this. The remaining difference is mainly due to a credit back from the European Union under the ERDF programme post Supplementary Estimate.
Line D Research, Data & Trading Funds: underspend of £1.737m
An underspend of £1.7m against research and communication planned spending post Supplementary Estimate.
Line E Staff, Building and Infrastructure Costs: underspend of £53.063m
The main part of this underspend (£36m) arose because the restructuring process in DCLG progressed faster than had been initially expected, resulting in a significant number of voluntary departures accruing in 2010-11. Other savings of about £13m arose from the Department's drive to make savings on non pay costs and reduce the reliance on external support services. There was also an underspend on depreciation (£4m).
Line F Localism (NDPB) (net): underspend of £0.754m
This underspend arose because closure costs relating to FiRebuy came in under provision.
Line G Neighbourhoods (NDPB) (net): underspend of £58.980m
This variance arose because of a underspend by the Homes and Community Agency and Tenant Services Authority arising because of lower than expected restructuring costs and reclassification of restructuring expenditure post Supplementary Estimate from Line G to Line H.
Line H Local Economies, Regeneration & European Programmes: overspend of £23.462m
The overspend mainly relations to £23m of restructuring costs for the Homes and Communities agency, budgeted for under Line G above.
Line N Audit Commission Disbanding: underspend of £8.009m
Most of the 2011-12 AC disbanding budget was transferred into 2012-13 as part of the Budget Exchange process. £8m was held to provide against possible AC disbanding costs in 2011-12 and as a contingency which in the event was not required.
Line R Local Economies, Regeneration & European Programmes: over-recovery of £31.438m
Late favourable movement in the Euro / Sterling exchange rate resulted in ERDF unrealised foreign exchange gains that were higher than expected.
Line V Neighbourhoods (NDPB): overspend of £28.350m
HCA pension provision actuarial costs, which are only assessed after year end, came in higher than expected.
Line W Local Economies, Regeneration & European Programmes: underspend of £39.662m
Underspend represents a reversal of a provision for the Homes and Communities Agency which arose post Supplementary Estimate.
Table 4g: Subhead variance against Estimate – capital
Subhead Variance Explanation
Line A Localism: underspend Underspends of £48.3m on Fire Programmes and £56.5m London Settlement. The reduction in capital was to help manage the resource / capital split on the

Department for Communities and Local Government Annual Report and Accounts 2011-12 Management commentary
47
Subhead Variance Explanation of £100.270m Regional Growth Fund (RGF), see Line C.
The remainder of the difference is due to a number of small over spends against a collection of programmes.
Line C Local Economies, Regeneration & European Programmes: overspend of £208.384m.
Overspend of £84.9m on Regional Development Agencies expenditure from April to June 2012 reclassified as DCLG expenditure following the transfer of responsibility for ERDF. An equivalent underspend is shown in Line H. Overspend of £123.4m on Regional Growth Fund (RGF). The RGF secretariat informed the Department after the Supplementary that the resource / capital split for the budget did not match likely expenditure. DCLG had to agree with local authorities exchanges of resource for capital for scheduled payments to manage this.
Line E Staff, Building and Infrastructure Costs: underspend of £3.112m
Budget retained after the Supplementary Estimate as a contingency against emerging pressures. Pressures did not materialise.
Line H Local Economies, Regeneration & European Programmes (NDPB) (net): underspend of £97.353m
Underspend of £84.9m on Regional Development Agencies – see Line C above. The remainder of the difference is due to a number of small variances against a collection of programmes.
Line M Other Grants & Payments: underspend of £7.846m
This relates to a 10-11 accrual for the former Local Government Reward Grant Scheme for possible legal challenge. This has now fallen away.
Line Q Neighbourhoods: underspend of £217.176m
Underspend of £217.1m on Overhanging Debt. DCLG pays the remaining overhanging housing debt for authorities transferring their council housing stock to Housing Associations. Some LA’s were not able to complete before the end of March 2012.
6.26 The Department’s Net Cash Requirement is the amount of cash needed to support the
Department’s activities. The Statement of Parliamentary Supply provides a reconciliation of the Estimate to the Net Cash Requirement and shows an overall variance of £1,925m (5.8 per cent) against the Estimate provision for the Net Cash Requirement of £33,363m (2010-11: £328m (0.9 per cent) against an Estimate of £39.5bn). Table 4d above provides more detail and variance explanations are provided below where the comparison of outturn against Estimate has resulted in a variance of the greater of £0.5m and 10 per cent of the Estimate.
Table 4h: Variance against net cash requirement Estimate Variance Explanation
Non-cash items: variance of £257.7m against the Estimate of £5.1m
This non-cash category includes a number of items which are difficult to forecast. Depreciation was lower than expected because of reduced holdings of assets. The main variances however arose because £300m of Supported Capital Expenditure was not included in this table in the Estimates and from the change in management of the 2007-13 ERDF Programme transferring transfer of the administration of the 2007-13 Programme to the Department. This resulted in a reduced advances balance of £187m which had not been included in Estimates.
Adjustment for NDPBs: variance of £161.2m against the Estimate of £31.6m
The voted expenditure removed was £175.6m less than in Estimates and the cash grant in aid added required to support net NDPB expenditure was £368.4m less than in Estimates. Therefore the variance arose because the removal of the

Department for Communities and Local Government Annual Report and Accounts 2011-12 Management commentary
48
Variance Explanation NDPB voted expenditure was smaller than the addition of grant in aid required to support this expenditure.
Adjustments to reflect movements in working balances; variance of £865.1m against the Estimate of £1m
These items report balances at the accounting date and are subject to significant daily variances depending on timing of cash payments and receipts. To reflect this uncertainty the Department includes a notional £1m in the Estimate. In the outturn there were net movements in inventories of £66.8m arising from the transfer of management of the 2007-13 ERDF Programme to the Department. The overall net movement in receivables and payables was £951.3m.
6.27 A National Statistical analysis of departmental expenditure by the countries within the
UK and by English areas for the years to 2010-11 can be accessed via the Treasury website (http://www.hm-treasury.gov.uk/pespub_index.htm).
Significant Events since the End of the Financial Year 6.28 The Queen Elizabeth II Conference Centre is a departmental executive agency with
trading fund status; it is not within the consolidation boundary. Ministers announced on 23 April 2012 that the Department would be undertaking pre-market engagement during this year to explore options for the future of the Queen Elizabeth II Conference Centre business. Following that, ministers would decide whether it should continue under existing arrangements, or be marketed to external providers as a going concern. The announcement also stated that the Department would retain the freehold of the building (see Note 34).
6.29 The Fire Service College is a departmental executive agency with trading fund status. On 10 April 2012, following a period of pre-market engagement, Ministers announced it was commencing the sale process for the Fire Service College and that it welcomed expressions of interest from potential bidders. This follows the Government's announcement in March 2012 that to secure the future of the College it intended to dispose of it as a going concern (see Note 34).
Payment Performance 6.30 From April 2010 the Department’s policy has been to pay all undisputed supplier
invoices within 5 days of receipt, or within contractual terms if less, in line with the cross Whitehall policy and in line with the Confederation of British Industry’s "Prompt Payment Code”. Previously, it had been the Department’s policy to pay all undisputed supplier invoices within 10 days of receipt, or within contractual terms if less. The Department discloses the following information in accordance with Regulations SI 1997/571.
6.31 The combined 5 day prompt payment performance for the core Department and PINS was 82.14 per cent in 2011-12 against a target of 80 per cent. This represents 13,989 invoices being paid to target from a total of 17,030 invoices processed in 2011-12. Overall year on year performance improved compared to 2010-11 when the percentage of invoice payments made on time was 79.33 per cent (representing 24,700 invoices paid on time from a total of 31,135 invoices paid).

Department for Communities and Local Government Annual Report and Accounts 2011-12 Management commentary
49
Payments to Charities 6.32 Section 70 of the Charities Act 2006 sets out a power for Ministers to give financial
assistance to charitable, benevolent or philanthropic institutions and requires that payments made under this power are reported.
6.33 In the normal course of business, the Department provides financial assistance to a range of bodies which provide services in support of the Department’s objectives. Organisations supported include charities and funding is mostly to community related bodies.
6.34 The following table sets out the financial assistance provided by the Secretary of State under this power for the year 2011-12, totalling £7.4m (2010-11, £71.2m).
Table 4f: Payments to Charities £’000
Institution Payments 2011-12
Purpose
BCC Local Enterprise Partnership Network
British Chamber of Commerce (BCC)
68 To promote Local Enterprise Partnership Networks in deprived areas thereby engendering job creation and developing avenues for wealth creation and prosperity.
Big Society Vanguard
Voluntary Action – Cumbria 20 To support community led projects in Eden Vanguard, they range from transport studies to renewable projects.
British Youth Council
British Youth Council 25 The funding is to cover the cost of 3 young BYC volunteers working jointly with DCLG Barrier Busting officials and the Minister for Decentralisation Greg Clark MP, to address and explore young people’s role in the Big Society and the barriers they may face to getting involved with their local communities.
Civic Voice Transitional Funding Grant
Civic Voice 25 Transitional funding for Civic Voice was agreed as a form of seed funding to help the organisation develop and transition to a self sustaining model. The grant will help them to strengthen and develop their unique network of community groups, build confidence within the sector, raise awareness of and support the take up by communities of the new rights and opportunities provided by the Localism Act and the Big Society.
Cohesion & Faith Grant
Al-Haqq Education Trust 2
Al-Khoei Benevolent Foundation 1
These grants were to allow the organisations to take part in the National Inter Faith Week 2011. The events were held on 20 & 21 November 2011.
British Sikh Consultative Forum 1

Department for Communities and Local Government Annual Report and Accounts 2011-12 Management commentary
50
£’000
Institution Payments 2011-12
Purpose
Christian Muslim Forum 2
Churches Together in England 1
Council of Christians and Jews 2
Council of Dharmic Faiths 2
Faith Based Regeneration Network UK
2
FaithnetSouthwest 1
Faiths Forum for London 2
Hindu Christian Forum 2
Hindu Council UK
Hindu Forum Britain 1
Interfaith Action 2
Jain Network UK 1
Joseph Interfaith Foundation 2
Minorities Europe 2
Mitzvah Day 1
Multi-Faith Centre at the University of Derby
2
Nishkam Civic Association 2
North East Regional Faiths Network 2
North West Faiths Forum (Faiths 4 Change)
2
South East England Faiths Forum 2
St Ethelburga's Centre 1
St Philip’s Centre 2
Three Faiths Forum 2
United Religions Initiative UK 2
Woman's Interfaith Faith Network 2
Zoroastrian Trust Funds of Europe 1
INFORM (Information Network Focus On Religious Movements)
45 Transitional funding agreement to meet the running cost of the receipient - Information Network on Religious Movements (INFORM) from April to June 2011.

Department for Communities and Local Government Annual Report and Accounts 2011-12 Management commentary
51
£’000
Institution Payments 2011-12
Purpose
Communities Engagement & Integration
INFORM (Information Network Focus On Religious Movements )
65 Grant funding to provide reliable and up to date information on minority religions and fringe political movements.
Community Leadership Fund
Prince’s Trust 176 DCLG are giving £10 million over 2.5 years to Youth United, a coalition of the major youth volunteering organisations, established by the HRH The Prince of Wales and supported by The Prince of Wales's Charitable Foundation, to increase the number of volunteering opportunities for young people. The fund will support Youth United in recruiting and training 2,700 new adult volunteers to run 400 new youth groups in communities across the country that will mean over 10,000 more young people will be able to join a pack or troop.
Community Music
Superact 40 The Department has provided funding of £240,000 to Superact and Making music to expand and enhance their existing annual Bandstand Marathon community music events. The grant is to enable Bandstand Marathon to double the length of the local events to four hours, and to provide an enhanced offer to potential participants to develop the events from being a celebration into a community-led engagement event. Bandstand Marathon are aiming for 500 community music events to take place across the UK at 1pm on Sunday 9 September 2012 to coincide with the final day of the Paralympics. An initial grant of £40,000 was made in 2011-12, with the balance of £200,000 due to be paid this financial year.
Connecting Lives Project Grant
Jewish Museum 10 The Jewish Museum’s will address “casual” anti-Semitism in schools through a project entitled ‘Connecting Lives’. The Museum provides a safe environment in which to ask questions, and aims to address any negative preconceptions about Judaism and Jewish people and to build positive connections and understanding.
Digital Inclusion & Sheltered Housing Grant
National Institute of Adult Continuing Education (NIACE)
54 This programme is designed to help older people in sheltered accommodation learn how to use digital technology.
Employment Mobility Grant
Northern Housing Consortium 43 Pilot social housing and employment mobility scheme.
Empowerment Fund
Action for Market Towns 80
Carnegie UK Trust 100
The Empowerment Fund is supporting organisations with charitable, philanthropic or benevolent purposes working across the country, to assist local communities to take

Department for Communities and Local Government Annual Report and Accounts 2011-12 Management commentary
52
£’000
Institution Payments 2011-12
Purpose
Centre for Sustainable Energy 100
Community Matters 100
forward the key themes of empowerment. It is designed to support the Voluntary and Social Enterprise sector as it works towards helping build more, cohesive, empowered and active communities.
Environmental Law Foundation 80
HACT (Housing Associations Charitable Trust)
100
LOCALITY 100
Media Trust 100
Novas Scarman 100
Operation Black Vote 80
Oxfam UK 100
Platform 51 100
RADAR (The Royal Association for DisAbility Rights)
50
Royal Society for Arts (RSA) 100
School for Social Entrepreneurs 100
Sheila McKechnie Foundation 80
Social Firms UK 80
TPAS (Tenant Participation Advisory Service)
100
Urban Forum 100
Workers Education Association 100
Young Foundation 100
Enterprise Business Connectors
Business in The Community (BiTC) 130 The Enterprise Business Connectors scheme aims to help small businesses in these areas to survive and to thrive through identifying the barriers and difficulties they are currently facing. "Business Connectors" will be seconded into each area from large companies (such as BT and Boots) who will work with both small and large firms locally to encourage them to work together in the interests of both themselves and the local area. This scheme contributes to the social mobility and participation strands of DCLG's Approach to Integration, and also has clear links to the High Streets Agenda and Portas Review. A second payment to match-fund the scheme for 2012-13 (£170,584) is due to be paid to BiTC in May/June 2012.

Department for Communities and Local Government Annual Report and Accounts 2011-12 Management commentary
53
£’000
Institution Payments 2011-12
Purpose
Enterprise Challenge
Business in The Community(BiTC) 28 The Enterprise Challenge encourages enterprise and entrepreneurship in schools in disadvantaged communities by bringing together young people from different backgrounds to engage in an online business game with professional business mentors. The purpose of the grant is to help pay for the cost of expanding an already successful programme, Enterprise Challenge, enabling it to reach a greater number of beneficiaries, drawn from a wider group of communities.
Housing Management
Chartered Institute of Housing (CIH) 200 To take forward the work of the CIH Anti Social Behaviour team with stronger focus on tenant, as well as landlord capacity building.
NCRC (National Communities Resource Centre)
136 To provide a range of free, professionally delivered, residential training courses to empower social housing tenants.
TPAS (Tenant Participation Advisory Service)
28 To produce a framework for delivering credible tenant panels.
Integration Division Strategic Funding Grant
Faith Based Regeneration Network UK
75 The Faith based Regeneration Network is a key delivery partner of the Department. It exists to encourage, resource and link up faith-based regeneration and renewal projects, particularly in urban areas.
Holocaust Memorial Day Trust 750 The grant is Strategic Funding for the recipient to promote, aid and raise awareness to a large range of organisations, individuals and groups across the UK. HMD also organise the events for the annual Holocaust Memorial Day activities.
Muslim Hate Crime Reporting (MAMA)
Faith Matters 92 MAMA (Measuring Anti-Muslim Attacks) collates and analyses anti-Muslim incidents in England and offers support to victims. This project will contribute to the tolerance and extremism pillar of integration and improve the evidence base and understanding of anti-Muslim hatred.
National Citizens Legacy Project
Young Advisors Company 30 The funding enabled the Charity to provide Young Advisors training to a range of National Citizen Service (NCS) graduates, post their NCS participation. This training provided trained participants with an opportunity to continue volunteering in their local communities, therefore providing a legacy of the NCS programme.
Near Neighbours Initiative Grant
Church Urban Fund 1,882 The purpose of the Near Neighbours grant is to enable the Church Urban Fund to make small grants to projects that

Department for Communities and Local Government Annual Report and Accounts 2011-12 Management commentary
54
£’000
Institution Payments 2011-12
Purpose
bring together people from different faiths to improve their neighbourhoods, using the resources and infrastructure of the Church of England, and also to run training and mentoring programmes for clergy, young people and community activists.
Older People Programme
EAC 843 The aim is to deliver quality advice on housing and related areas for older people in England. It delivers a national telephone and website service and works with local services. The advice line is staffed by specialist advisors who cover the areas of housing and related areas including care, support, finance and entitlements.
Promoting Enterprises
Anne Frank Trust 58 The Anne Frank Trust’s programmes use Anne Frank’s life, times and diary to promote her message of compassion, respect, tolerance and understanding. The programmes address real problems in British society and opens up the debate about the social problems experienced in many communities. This is achieved through education and highlighting the dangers of prejudice and discrimination. This exposure leads to a change in attitude and behaviour. This is achieved by running a combination of exhibitions focusing on Anne Frank and interactive workshops which explore the issues from stereotyping and intolerance, through to freedom of speech and individual identity. Over the last three years the Anne Frank Trust has worked in a number of local authority areas facing the most significant challenges to integration and extremism.
Strategic Funding
Inter Faith Network for UK 282 The Inter Faith Network is a key delivery partner of the Department. It exists to encourage, resource and link up inter faith groups at the local, regional and national levels; and to take forward projects designed to improve understanding and cooperation between people of different faiths.
Tackling on line anti-Semitism
European Institute for the Study of Contemporary Anti-Semitism (EISCA)
16 The purpose of the grant is to enable EISCA to: 1 document, for the first time, the scale of anti-Semitic comments on mainstream news websites, 2. analyse the originating sources and context of these comments and 3 make recommendations on how organisations that produce online media can best deal with anti-Semitic content.
The Big Lunch Project
Eden Project 36 The Department is providing £185,000 to the Eden Project over the two financial years 2011-12 and 2012-13. This funding will enable the Eden Project to provide targeted

Department for Communities and Local Government Annual Report and Accounts 2011-12 Management commentary
55
£’000
Institution Payments 2011-12
Purpose
support to selected deprived areas in the run up to The Big Lunch annual events in 2012 and 2013. Work has already started in twenty areas which have been selected on the basis that there has been little or no activity to date compared with more affluent and engaged communities. Organisers from the Big Lunch will work with community volunteers and leaders to help encourage local residents to plan and organise their own Big Lunch celebrations, which will help foster better community relations and engagement.
Transitional Funding
Inter Faith Network for UK 104 The Inter Faith Network is a key delivery partner of the Department. It exists to encourage, resource and link up inter faith groups at the local, regional and national levels; and to take forward projects designed to improve understanding and cooperation between people of different faiths.
Young Advisors Grant Scheme
Young Advisors Company 34 The funding will enable training of 40 new Young Advisors, who will work with more than 400 young people, affecting the lives of thousands of young people from deprived communities. In addition to this the company will deliver training to further enhance young people’s awareness of Big Society and the localism agenda so as they too will be able to take advantage of the new rights offered to them.
Your Square Mile Project
Your Square Mile 18 The grant is to fund the project, namely a conference aimed at the local project and stream leaders of the 16 involved in 16 pilot areas and similar projects across the UK.
Total 7,480
Auditors
6.35 These accounts have been audited by the Comptroller and Auditor General (C&AG). The total cost of audit across the departmental group is £1,203,100 of which £540,100 is a cash charge and £663,000 is a notional charge (2010-11: total £932,600 comprising £477,600 cash costs and £455,000 notional charge).
6.36 The audit fee for the core Department is £562,000 in total (2010-11: £357,000), broken down as £351,000 for the departmental audit, £110,000 for consolidation work within the Department and £101,000 for the cost of consolidation at Designated Bodies. In the prior year, charges were for the departmental audit work only.
6.37 In addition, the Department meets the costs of the NNDR audits which were £22,000 for the White Paper account (2010-11: £22,000) and £36,000 for the Trust Statement (2010-11: £35,000). These fees and those detailed in paragraph 6.36 above are notional charges.

Department for Communities and Local Government Annual Report and Accounts 2011-12 Management commentary
56
6.38 The National Audit Office also performed other statutory audit work, including value for money studies, and other reports to management at no cost to the Department.
6.39 So far as the Accounting Officer is aware, there is no relevant audit information of which the External Auditors are unaware.
6.40 The Accounting Officer has taken all steps that he ought to have taken to make himself aware of any relevant audit information, and to establish that the Department’s auditors are aware of that information.
6.41 The audit of the designated bodies was carried out by NAO under various statutes and the costs are included in paragraph 6.35 above. Further details are given in the accounts of the bodies concerned.
Human resources5 Overview of key HR activities for 2011-12
6.42 The principal focus of the majority of this year was the conclusion of the departmental restructuring begun in October 2010. Selection exercises were run for staff at Grades 6 and below (i.e. all staff below Senior Civil Service (SCS) level) which included opportunities for requesting voluntary redundancy. The main selection processes were completed by October 2011. Staff exits are phased and will complete by October 2012. All staff leaving the Department will have had the opportunity to access a programme of redeployment support, to assist them in finding alternative employment. Overall, the restructuring process has achieved the required level of staffing reductions.
6.43 Alongside restructuring, there has been a strong ongoing focus on building the Department’s overall capability in response to changing Government priorities and to a reduced level of staffing. This has centred around four key themes: strong leadership, powerful influencing, staff development, and consistently getting the basics of departmental life right. During the final quarter, the Department held a series of staff engagement sessions to give all staff the opportunity to contribute to devising departmental priorities and a change plan. The detailed plan was published in the first quarter of 2012-13.
6.44 Other key HR activities in 2011-12 have included:
• a sustained focus on improving the quality and consistency of performance management within the Department, including through developing and piloting changes to DCLG’s performance management system for 2012-13 onwards. The changes were subject to a major staff consultation and engagement process, and are intended to enable staff to better own their own performance and development, allied with producing a more rounded assessment of their overall performance. Alongside this, we have also announced policy and process
5
For clarity, and unless shown otherwise, this section relates to the core Department only. Please refer to the Annual Report and Accounts of the individual bodies for information on HR issues in the Department’s ALBs.

Department for Communities and Local Government Annual Report and Accounts 2011-12 Management commentary
57
changes to better support and enable managers to address poor and under-performance;
• introducing a new Exceptional Performance Scheme, whereby staff can be nominated for outstanding performance and achievements at any point in the year. This has replaced both of the previous Annual Performance Bonus (linked to performance reports) and in year Special Performance Bonus schemes;
• greater emphasis on learning and development in the restructured Department, including specific development events and providing webtools for staff;
• publication of a Workforce Diversity Data Report for 2010-11, providing a statistical overview and analysis of the Department’s staffing by each of the protected characteristics described in the Equality Act 2010;
• management of exemptions to the recruitment freeze in the main Department, its agencies and NDPBs, to deliver a balance between control and continuity of business delivery; and
• continuing to promote transparency by publishing organisational and staff information on a regular basis, including a greater degree of information about staff salaries over £58,200
(http://www.communities.gov.uk/corporate/transparencyingovernment/staffdata/seniorstaffsalaries/).
Civil Service People Survey 2011 6.45 In October 2011 76 per cent of the Department’s staff completed questionnaires in the
third civil service-wide staff engagement survey. Overall the results were disappointing, showing a drop in the Department's "engagement index" and in thematic areas relating to "Leadership and Managing Change", "Organisational Objectives and Purpose" and "Learning and Development". Staff were most positive in their responses to questions in three theme areas, relating to "My Team", "My Work" and "My Line Manager".
6.46 2011-12 was a very challenging year for DCLG staff, given the significant restructuring process referred to above and which directly affected almost every member of staff. While this will undoubtedly have had an impact on survey results, there was clear consistency in the pattern of responses at theme level with previous surveys, which suggests that staff views of the Department’s strengths and the challenges it faces remain broadly constant. It remains a priority of the Department's leadership team to boost levels of staff engagement significantly in the current year, as set out in the Department's Capability Action Plan.
Staffing - restructuring 6.47 The staffing reductions that took place in 2011-12 should be viewed in the context of
the departmental restructuring programme that commenced in the previous year (October 2010), and which aimed to reduce headcount by up to 40% against a starting baseline of 2,216 FTE staff. This baseline was based on the number of people directly employed by the Department – ie everyone with a right to a job in DCLG, including those out on loan, maternity leave, career break etc.
6.48 By 31 March 2011, the total number of people employed by the Department had reduced to 2,087 FTE, representing a reduction of 129 FTE staff (5.8%). By 31 March 2012, this figure had reduced further to 1,876 FTE, representing a total reduction of

Department for Communities and Local Government Annual Report and Accounts 2011-12 Management commentary
58
340 FTE staff (15.34%) from the October 2010 baseline. Further exits took place at the end of April and will take place at the end of October 2012.
6.49 However, this figure includes 347 FTE who joined the Department as a result of Machinery of Government changes - primarily the closure of the Government Office Network and the Regional Development Agencies. If they are not included, then, on a like-for-like basis, the Department reduced by 687 FTE (31.0%) against the October 2010 baseline.
6.50 The Department’s original headcount target was 1,398 FTE (ie fully funded posts), on a like for like basis with the October 2010 baseline position, representing an overall reduction of 818 FTE (37%). The Department’s actual planned establishment for 1 November 2012 is now 1,757 FTE. The increase arises from the transfer in of work from the closures of the Government Office Network and Regional Development Agencies, the transfer in of additional roles in the Troubled Families Unit, and the need to provide posts to cover other urgent business, recognising that not all permanent staff are immediately available for deployment.
Staffing – staff in post 6.51 The officially reported staffing figures for the Department are based on Office for
National Statistics (ONS) definitions of staff, which exclude any staff who are on unpaid leave out of the Department (e.g. career break) but include any staff on loan or secondment into the Department where they are paid directly through the Department’s payroll. This differs to the methodology used for the Department’s restructuring process above.
6.52 The following table illustrates the staffing position for the past three years using ONS definitions of staff:
Table 5.1: Staff in Post – full time equivalents
Year 2009-10 2010-11 2011-12
Actual (1) Actual (2) Actual (3)
DCLG – Central Department
Permanent Staff (4) 2,068 1,892 1,807
Fixed Term Appointments 41 42 15
Total 2,109 1,934 1,822
Government Office Network (GON)
Permanent Staff (4) 1,625 923 0
Fixed Term Appointments 47 7 0
Total 1,672 930 0
Total Core Department 3,781 2,864 1,822
Planning Inspectorate
Permanent Staff (4) 719 610 600

Department for Communities and Local Government Annual Report and Accounts 2011-12 Management commentary
59
Fixed Term Appointments 2 0 0
Total 721 610 600
Total Department
Permanent Staff (4) 4,412 3,425 2,407
Fixed Term Appointments 90 49 15
Total 4,502 3,474 2,422(1) Full Time Equivalent Figures (FTE) (rounded) as at 31 March 2010 (2) FTE figures (rounded) as at 31 March 2011 (3) FTE figures (rounded) as at 31 March 2012 (4) Includes staff on inward loan and inward secondment and staff on paid maternity leave, paid outward
loans and secondment and long-term sick. Note: The Department now publishes monthly workforce management information, including numbers of payroll and non-payroll staff, for the Main Department, Executive Agencies and Executive NDPBs on the departmental website. This information can be found here: http://www.communities.gov.uk/corporate/transparencyingovernment/staffdata/workforceinformation/ The figures above differ from those reported in Note 7 for two reasons. • Note 7 figures, in accordance with the Financial Reporting Manual (FReM)
requirements show average numbers for the year whereas the figures above are staff in post at 31 March 2012.
• Note 7 figures are compiled according to FReM definitions whereas the figures above follow Office for National Statistics (ONS) definitions.
Reconciliation between the table above and numbers in Note 7 for core Department staff is below:
Table 5.2: Staff in Post – reconciliation
Core PINS
2011-12 Average Number of persons employed as per Note 7 2,014 614 Difference arising from use of Staff in Post figures 151 14
March Actual 1,863 600
Excluded from ONS numbers:
Excluded as not paid through DCLG payroll:
Reimbursed Secondment In 21
Reimbursed Loan In 12
Career Break
Excluded as not defined as civil servants:
Ministers 6
Special Advisers 2
ONS FTE Staff Numbers Table 5.1 above 1,822 600

Department for Communities and Local Government Annual Report and Accounts 2011-12 Management commentary
60
6.53 The table below provides details of staff recruited to the Department from outside the civil service by type of appointment and diversity. The Department has been operating a recruitment freeze since May 2010. The figures in the table represent recruitment activities carried out prior to the freeze and those that have been granted exception since. All recruitment is carried out in line with the Civil Service Commissioners’ Recruitment Principles.
6.54 While all staff are encouraged to complete their diversity details, this is not a mandatory requirement and so details of the number of BME and disabled staff is based only on the information provided.
Table 5.3: Recruitment 2011-12 Pay
Band Non-Civil Servants
Fixed Term Appointments
Permanent Casual Total Recruitment
Women BME Disabled
1 - - - - - - - -
2 - - - - - - - -
3 - - - - - - - -
4 - 4 10 - 14 8 1 -
5 - - 3 - 3 1 - -
6 - - 4 - 4 - - -
7 - - 3 - 3 2 - -
SCS - - 6 - 6 3 - -
Totals - 4 26 - 30 14 1 -
Note: The figures above relate to the core Department only. Fast Stream staff have been included in Pay Band 4 in the table above.
SCS salaries and staffing
Table 5.4: SCS Salaries as at 31 March 2012 Salary band Number Salary band Number
£55,000 – £59,999 5 £120,000 – £124,999 -£60,000 – £64,999 14 £125,000 – £129,999 2£65,000 – £69,999 20 £130,000 – £134,999 3£70,000 – £74,999 15 £135,000 – £139,999 1£75,000 – £79,999 7 £140,000 – £144,999 -£80,000 – £84,999 5 £145,000 – £149,999 -£85,000 – £89,999 2 £150,000 – £154,999 -£90,000 – £94,999 2 £155,000 – £159,999 -£95,000 – £99,999 5 £160,000 – £164,999 -
£100,000 – £104,999 1 £165,000 – £169,999 1£105,000 – £109,999 4 £170,000 – £174,999 -£110,000 – £114,999 2 £175,000 – £179,999 -£115,000 – £119,999 - Total SCS 89
Not including Permanent Secretary Note: The figures above reflect full time equivalent salaries for those staff on the Department’s payroll. Where individuals work part time they will receive a pro-rated salary.

Department for Communities and Local Government Annual Report and Accounts 2011-12 Management commentary
61
6.55 The Department has published details on those staff earning over £58,200 as at September 2011 on the Department’s website. Please note that not all staff earning over £58,200 are SCS staff. This information can be found here: http://www.communities.gov.uk/corporate/transparencyingovernment/staffdata/seniorstaffsalaries/
6.56 As at 31 March 2012, there were 90 SCS staff on the DCLG payroll, including the Permanent Secretary, one member of staff on loan to another department and one on maternity leave. These figures are derived from the ONS definitions of staff in post.
6.57 In addition, there were five SCS members who were not on the Department’s payroll as of 31 March 2012. Of these, two were shared with another department as part of a shared service arrangement and three were on loan or secondment in or outside DCLG.
Table 5.5: Number of SCS by Pay Band as at 31 March 2012 SCS pay band On DCLG
PayrollShared Service
Loan or Secondment
SCSPB1 67 1 2SCSPB1A 2SCSPB2 16 1 1SCSPB3 4
Permanent Secretary 190 2 3
Sickness Absence
6.58 The quarterly sickness absence statistics produced by the Department contribute to Cabinet Office’s analysis of absence for the civil service as a whole. An aggregate data set is produced for the departmental group, excluding Non-Departmental Public Bodies but including executive agencies. The data draws from individual and manager recorded sickness absence and is broken down into a number of categories including location, age, gender, short v long-term absence and reasons for absence.
6.59 The quarterly statistics for the year to 30 June 2011 show that the overall Average Working Days Lost (AWDL) for the civil service was 8.0. The figure for the DCLG Group at 31 December 2011 stood at 6.9 and at 6.5 for the core Department.
6.60 The DCLG Group has reported an increase across the last four quarters from 5.8 in Q4 2010 to 6.9 in Q4 2011, although the rate for the core Department only has risen to 6.5. The percentage of civil servants taking no sick leave during the calendar year 2011 for the DCLG Group was 53 percent and 57 percent for the core Department only.
Sustainable Development Introduction
6.61 DCLG is fully committed to operating an efficient estate and to reducing the environmental impact of its operations and their associated costs. This is the second year that DCLG has reported non-financial and financial indicators of its sustainability performance in its Annual Report and Accounts, and follows the HM Treasury

Department for Communities and Local Government Annual Report and Accounts 2011-12 Management commentary
62
guidance: ‘Public Sector Sustainability Reporting’ published at www.financial-reporting.gov.uk. Furthermore, this is the first year that the Department is reporting a full data set including its executive agencies and non-Departmental Public Bodies (NDPBs). Sustainability data and delivery plans are also reported more frequently to the Cabinet Office.
Scope 6.62 This section of the report seeks to align the Greening Government Commitments
(GGC) and the Department’s accounting boundaries. However, where differences exist, financial data has been aligned to the Department’s accounting boundary and non-financial data aligned to GGC. As such, non-financial data includes information from the Audit Commission, QEII Conferencing Centre (QEIICC) and Fire Service College (FSC).
6.63 FSC and QEIICC are primarily non-office sites and while included in the Department’s total water consumption data, fall outside the office benchmark figures.
Targets and Summary of 2011-12 Performance 6.64 DCLG has aligned its Sustainable Operations delivery plan and targets to the
requirements of GGC (http://sd.defra.gov.uk/gov/green-government/commitments/), and 2011-12 performance is summarised in the following tables. Where the GGC framework does not set specific targets, the Department has defined its own aspirational targets, including a total estate water reduction target and a target recycling rate. These are detailed in relevant sections and in Table 1a.
Table 1a: Non-financial 2011-12 performance against key Greening Government 2015 targets, measured against 2009-10 baseline
Reduce GHG (scope 1, 2 & 3
gross) Emissions by 25%
Reduce Total Estate Water
Consumption by 25%
Reduce Total Waste
Generation by 25%
Achieve Recycling Rate
of 85%
Performance (2011-12 measured against 2009-10)
-37% -35% -32% 75%
Table 1b: Financial benefits of our Greening Government programme
£’000
Energy UK Business Travel
Waste Disposal Water Use Total
2011-12 cost comparison vs. 2009-10 -981 -3,075 -21 -25 -4,102
2011-12 cost comparison vs. 2010-11 -381 -1,346 -39 -3 -1,738
Greenhouse Gas Emissions
6.65 Targets for Greenhouse Gas (GHG) emission reductions:

Department for Communities and Local Government Annual Report and Accounts 2011-12 Management commentary
63
• reduce GHG emissions by 25% by 2015 from a 2009-10 baseline from the whole estate and business-related transport; and
• cut domestic business travel flights by 20% by 2015 from a 2009-10 baseline.
Table 2: Greenhouse Gas Emissions Summary Greenhouse Gas Emissions 2009-10 2010-11 2011-12
Total Gross Emissions for Scopes 1 & 2. 22,680 19,666 15,314
Total Gross Emissions attributable to Scope 3 official UK business travel
5,146 3,916 2,172Non-Financial Indicators (tonnesCO2e)
Number of domestic air travel flights 1,530 655 198
Electricity: Non-Renewable 29,287,161 25,939,024 21,593,528Electricity: Renewable 1,695,042 2,524,916 1,030,648Gas 30,984,844 25,780,798 18,600,762LPG 0 0 0
Related Energy Consumption (kWh)
Other 186,257 131,310 74,943Total expenditure on energy 2,944 2,344 1,963CRC Licence Expenditure (2010 onwards) N/A 0 1
Expenditure on accredited offsets (e.g. GCOF). 1 1 0
Total expenditure on official UK business travel 6,160 4,431 3,085
Financial Indicators (£'000)
Expenditure on domestic air travel 270 97 22
6.66 DCLG has continued to reduce its total in-scope gross GHG emissions through 2011-
12, achieving a total 37% reduction since the 2009-10 baseline year. The Department has also met the previous Administration's Sustainable Operations on the Government Estate (SOGE) targets for carbon emissions related to both energy use (gas and electricity) and administrative road travel. DCLG also met the Prime Minister's target to reduce carbon emissions from offices by 10% over 12 months from May 2010, achieving a 18.6% reduction.
6.67 Reductions have largely been realised through low cost energy efficiency measures, for example through estate rationalisation (by using space more efficiently and co-locating with other organisations), and operating our remaining buildings even more efficiently.
6.68 The most significant aspects of DCLG's GHG are from electricity use and fuel consumption by vehicles and gas boilers. Point of use hot water heaters has enabled main gas boilers to be switched off during warmer periods in some buildings.

Department for Communities and Local Government Annual Report and Accounts 2011-12 Management commentary
64
6.69 The Department has produced its delivery plans to ensure emissions are reduced in line with GGC requirements.
6.70 The Department has a significant influence on delivering sustainable development through the National Planning Policy Framework, published in March 2012, which has at its heart the presumption in favour of sustainable development which should be embedded into plan-making and decision-taking at both a national and local scale.
6.71 The Department influences greenhouse gas reduction in the built environment through its responsibilities for housing and the building regulations. Specific policies include: enabling new homes to be Zero Carbon from 2016 and new non-domestic buildings from 2019 and Part L of the Building Regulations (Conservation of fuel and power). The Department is responsible for implementing the EU Energy Performance of Buildings Directive, including through maintaining Energy Performance Certificates (EPCs) and Display Energy Certificates (DECs), which can help improve the energy efficiency of buildings. The Department is also responsible for the Code for Sustainable Homes (the Code), the national voluntary standard for the sustainable design and construction of new homes.
6.72 The Department has also been working with its suppliers to reduce the emissions of their goods and services, in particular with its facilities management providers. New ICT technologies are also facilitating emissions reductions and decreasing embedded carbon. For example, 373 printers, scanners, photocopiers and fax machines have been replaced by 50 multi-functional devices at DCLG’s HQ site.
6.73 Where appropriate, sustainability clauses are being incorporated into all new contracts to help ensure suppliers are meeting the Government Buying Standards and supporting the Department’s efficiency work.
Waste Management 6.74 Targets for waste management:
• reduce the amount of waste generated by 25% from a 2009-10 baseline by 2015; • cut paper use by 10% in 2011-12; • implement a closed loop6 recycled paper service; and • ensure that redundant ICT equipment is reused (within government, the public
sector or wider society) or recycled responsibly.
An internal DCLG target to recycle 85% of waste by 2015 has also been introduced.
6 Closed loop paper allows for the safe and secure disposal of confidential and non-confidential waste paper; the very same paper is then recycled and supplied back to the department at a lower cost than standard recycled paper supplies.

Department for Communities and Local Government Annual Report and Accounts 2011-12 Management commentary
65
Table 3: Waste Disposal Summary Waste 2009-10 2010-11 2011-12
Total Waste Production 2,272 2,819 1,542Hazardous waste Total 1 2 3
Landfill 367 368 233Incinerated/energy from waste 189 359 154
Total reused/ recycled 1,606 1,972 1,075
Non-hazardous waste
Composted 109 116 77Total ICT waste reused/recycled 1 1 24
Non-Financial Indicators (tonnes)
Paper Procured Total A4 equivalent reams 92,148 57,385 44,648
Total Disposal Costs 252 239 231
Landfill 7 7 10Reused/Recycled 168 319 187
Non-hazardous waste - Total disposal cost Composted 1 1 1
Financial Indicators (£'000)
Paper Procured Total Spend 202 174 136
6.75 The Department has successfully reversed the recent upward trend in waste
generation, reducing total waste by over a third since last year. This reduction is largely down to estate rationalisation and the closure of the regional Government Offices Network. The Department has achieved a high recycling rate of 75%; this is based on total reused, recycled and composted materials compared to our total waste produced.
6.76 The Department is currently developing waste management plans to maintain high recycling rates and further reduce waste wherever possible. In rationalising the estate, the Department has sought to redeploy equipment within the DCLG group and its main ICT contracts require that all redundant ICT equipment is either reused or recycled.
6.77 The Department has met the in-year 10% paper reduction commitment by reducing the total quantity of A4-equivalent reams purchased by 52% in 2011-12 compared to the 2009-10 baseline year. The Department is also working towards adopting the cross-Government closed loop paper recycling and supply framework by summer 2012, and has already amended procurement processes to purchase closed loop recycled paper.
6.78 The Department continually reviews its waste management processes to identify more sustainable solutions for reducing waste and for processing unavoidable waste in the most sustainable manner. In early 2012, the Department entered a joint WRAP/Defra-led voluntary agreement to work with catering suppliers to reduce food and packaging waste by 5%, and to increase volumes sent to anaerobic digestion (AD) or composting to at least 70%, both by 2015. Progress will be reported next year.

Department for Communities and Local Government Annual Report and Accounts 2011-12 Management commentary
66
6.79 The Department also has an impact on waste management through its responsibility for national waste planning policy, currently set out in PPS10: Planning for Sustainable Waste Management. Positive planning has an important role in delivering sustainable waste management and driving waste up the waste hierarchy: through the development of appropriate strategies for growth, regeneration and the prudent use of resources; and, by providing sufficient opportunities for new waste management facilities of the right type, in the right place and at the right time.
Finite Resource Consumption – Water 6.80 The Department's total water consumption has been reduced over recent years to
successfully meet the SOGE reduction target; however, further work is required to achieve the GGC good practice benchmark.
6.81 Water efficiency targets include an internal target to reduce total consumption by 25% by 2015 from a 2009-10 baseline, and to report on office water use against the following GGC benchmarks:
• ≥6 m3 water consumption per Full Time Equivalent – poor practice; • 4m3 to 6m3 per FTE – good practice; • ≤4m3 per FTE – best practice; • percentage of offices meeting the best/good/poor practice benchmark.
Table 4: Water Consumption Summary Finite Resource Consumption – Water 2009-10 2010-11 2011-12
Office Estate 62,710 56,840 46,383
Office Estate per FTE 7.84 6.92 7.24Non-Financial
Indicators (M3) Water Consumption
Whole Estate 114,890 101,385 94,307
Financial Indicators (£'000) Water Supply Costs 122 100 97
6.82 DCLG's water office consumption is primarily from tea points, canteens and toilets,
and cooling plant. Reductions to date have largely been achieved through staff awareness work and leak reduction activity. The Department is also trialling the efficacy of a number of water efficiency devices across its estate, with a view to rolling these out more broadly. In 2011-12 the Department’s water consumption per FTE increased compared to the previous year. This was due to a reduction in total number of staff following the Department’s restructuring process.
6.83 Further work is required to align DCLG’s office water consumption per FTE with good practice benchmarks. In response the Department will be auditing all key sites in 2012, to identify further water savings. And in response to the current drought, the Department will be running an awareness campaign to ensure that all staff and

Department for Communities and Local Government Annual Report and Accounts 2011-12 Management commentary
67
contractors are aware of the Department’s policy on water efficiency, as well as the actions needed to save water in the office and at home.
6.84 The Department has an impact on water efficiency in new homes through its responsibilities for the Building Regulations and the Code for Sustainable Homes (the Code). Building Regulations7 require all new homes to have a calculated wholesome water demand of not more than 125 litres per person per day (compared to the current average consumption of 145 litres per person per day).
6.85 The Code (mentioned above) measures the sustainability of a new home against nine categories of sustainable design, including the consumption of potable water. It encourages the use of water efficient fittings and appliances, and water recycling systems.
Transparency Commitments 6.86 The Department has an impact on meeting the challenge of climate change through its
National Planning Policy Framework, which came into force in March 2012. The Framework expects local authorities to demonstrate a move to a low carbon future with plans for new developments to be located in locations and ways which reduce greenhouse gas emissions, actively support energy efficiency improvements to existing buildings and when setting any local requirement for a building’s sustainability, do so in a way consistent with the Government’s zero carbon buildings policy and adopt nationally described standards.
6.87 The Framework provides a positive contribution to biodiversity, setting out criteria for local planning policies to ensure they contribute to the Government’s commitment to halt the overall decline in biodiversity and provide net gains where possible, including by establishing coherent ecological networks that are more resilient to current and future pressures.
6.88 The Department is also required to report against a number of transparency commitments as part of GGC. Progress is summarised in Table 5.
Table 5: Summary Table of Transparency Commitments Transparency Commitment Action Taken
Climate Change Adaptation: steps taken to adapt the estate to a changing climate.
DCLG is using the Environment Agency flood map service to inform lease and tenancy agreements.
Sustainable Operations policies require that CCA is considered when making estates and property decisions. These policies are currently being reviewed in response to the
7 The relevant regulations are Regulation 36 & 37 of the Building Regulations 2010 and Regulation 20 of the Building (Approved Inspectors) Regulations 2010.

Department for Communities and Local Government Annual Report and Accounts 2011-12 Management commentary
68
Transparency Commitment Action Taken GGC Framework.
The Department has compiled robust business continuity plans for coping with extreme weather conditions.
DCLG has also incorporated climate resilient design in retrofit projects and new builds, including rain water harvesting, green roof, heat recovery heating and ventilation systems.
Innovative energy efficiency technologies have also been trialled such as next generation window film for reducing solar heat gain, and behaviour change ICT efficiency devices.
Biodiversity and Natural Environment: including action taken to promote, conserve and enhance biodiversity, including use of Biodiversity Action Plans or equivalent and the management of Sites of Special Scientific Interest.
The Department implements Biodiversity Action Plans where applicable across the estate. For example, the Fire Service College has an action plan in place for a number of years to promote conservation and enhance biodiversity on the College estate. This has included creating a nature reserve and installing bird nesting boxes.
Procurement of food and catering services: including action taken within the context of overarching priorities of value for money and streamlining procurement, to encourage the procurement of food that meets British or equivalent production standards where this does not lead to an overall increase in costs; and to reduce the environmental impacts of food and catering services and support a healthy balanced diet.
Staff are required to ensure that all purchasing is channelled through Government Procurement Services using Government Buying Standards (GBS). The requirement to comply with GBS and GGC commitments is a core theme of the department’s new total facilities management contract.
Standard contract clauses include requiring suppliers to provide environmental policies, method statements, organisational objectives and practices and to cooperate in seeking reasonable and practical ways to improve the sustainability of delivering goods or services.
Tender evaluations include consideration of whole-life costs, including operational, maintenance and disposal costs.
Sustainable Construction: including the management of construction waste to best practice standards, the application of BRE's Environmental Assessment Methodology (BREEAM), and the extent to which standards used at the London 2012 Games are being applied/exceeded.
The Department has not undertaken any construction in 2011-12, nor major refurbishments requiring a BREEAM assessment.
People: including for example, reporting on The Department has delivered events through

Department for Communities and Local Government Annual Report and Accounts 2011-12 Management commentary
69
Transparency Commitment Action Taken social and environmental assessment of office re-locations, and action taken to promote staff wellbeing. In addition to reporting on actions taken to promote staff wellbeing, staff volunteering is a priority within the work on Big Society, on which the Cabinet Office Leads.
the ‘Green Champions Network’ to engage staff to support the delivery of the Greening Government Commitments and encourage positive behaviour change.
Environmental Management System (EMS): information on whether they have implemented an EMS such as ISO14001, EMAS or BS8555. This can include information on whether an accredited certified EMS has been applied to the whole estate, or in selected buildings only, or plans for obtaining a certified EMS in the future.
The Department operates an EMS modelled on ISO14001:2004.
Note on calculations: The majority of this report has been compiled using accurately measured data, verified through internal controls. This includes checking samples of automatically generated meter reading (AMR) data with manual meter reads, and periodic audits of data gathering processes conducted by the department’s Internal Audit Services (IAS) team undertaking. Where complete data sets have not been available, (for example through lack of granularity, or due to landlord service charges), internal benchmark figures have been applied based on known parameters and data sets. Climate Change
6.89 The Department is taking action to ensure that its policies and delivery address the need to adapt to climate change. In May 2011 the Department published a review and update of the Departmental Adaptation Plan which set out priorities. Since then the Department has:
• Published the National Planning Policy Framework in March 2012 which stresses that local planning authorities should adopt proactive strategies to mitigate and adapt to climate change, taking full account of flood risk, coastal change and water supply and demand considerations; and
• Published the Housing Strategy in November 2011 which emphasises the importance of new and existing homes fit for a future climate. Consultation on building regulations in early 2012 considered the impacts of climate change and explained that as part of Government’s wider built environment resilience work the evidence on overheating in homes was under review – with a focus on the causes and impacts of overheating and initial consideration of potential policy options.
6.90 The Department is working with other government departments to contribute to the National Adaptation Programme scheduled for 2013.

Department for Communities and Local Government Annual Report and Accounts 2011-12 Other financial information
70
7 Other Financial Information 7.1 The information in the following paragraphs gives additional information about entries
included in the financial statements and notes.
Clear Line of Sight (CLoS) boundary and Machinery of Government (MoG) 7.2 The accounts of the Departmental Group have been impacted in 2011-12 by the
changes in the accounting boundary under the Treasury CLoS initiative, Transfers of Functions following MoG changes and by classification changes introduced as part of the 2010 spending review. Further details are given in paragraphs 7.3 – 7.6 below and where there is an impact on the Department’s accounts this is shown in Note 32.
CLoS Boundary changes 7.3 Under the CLoS initiative to align the rules governing budgets, accounts and estimates
the accounts of Departmental bodies included in the Designation Order (The Government Resources and Accounts Act 2000 (Estimates and Accounts) (Amendment) Order 2011 - SI 3004) have been consolidated with those of the Department. Transactions between the bodies within the consolidation have been eliminated.
MoG changes 7.4 MoG changes are applied to the accounts under merger accounting principles in line
with the FReM and HMT requirements. Where a transfer of function is applied under merger accounting principles, the accounts are produced to reflect the position as if the function had always been in existence in the receiving body’s accounts and, conversely, as if it had never been in existence in the transferring body’s accounts. The impact of this application is that prior year comparative data is restated. Four MoG changes have been incorporated in the Department’s accounts during 2011-12:
(1) with effect from 18 July 2011 sponsorship of the Ordnance Survey moved from DCLG to the Department for Business, Innovation and Skills (BIS); (2) with effect from 1 July 2011 responsibility for the Residential Property Tribunal Service has moved from DCLG to the Ministry of Justice; (3) with effect from 19 September 2011 responsibility for control and management of regeneration assets has moved from the Regional Development Agencies, which are NDPBs of BIS, to the Homes and Community Agency, a Departmental NDPB included in the DCLG consolidation; and (4) in November 2011 the policy function for tackling troubled families transferred from the Department for Education to DCLG, which included the transfer of the budget for the Families with Multiple Problems programme. This was a new programme in 2011-12 so no adjustments to 2010-11 were required but 2011-12 year to date expenditure incurred by DfE totalling £7,489k was transferred to DCLG. There were no assets or liabilities included in the transfer.
Classification changes 7.5 As a result of the 2010 spending review the classification of programme and
administration income and expenditure has been changed to ensure that expenditure and income which is administration in nature, eg agency running costs, forms part of

Department for Communities and Local Government Annual Report and Accounts 2011-12 Other financial information
71
the Departmental administration costs. This change requires that 2010-11 outturn reported last year is restated to align with the new definitions. The impact of this change is a reclassification of programme expenditure and income to administration expenditure and income of £39,944k.
Accounting policy change 7.6 As reported in Note 1.8 to the accounts the treatment of government grants and
donated assets has changed and such accounting policy changes would be expected to result in prior period adjustments. In the Department’s case neither change requires adjustment in the amounts reported since separate balances were not maintained for either a government grant or donated asset reserve, the relevant balances being held within the general reserve. The abolition of these reserves therefore does not affect balances reported in reserves at 31 March 2010 or 31 March 2011.
Retention of Income previously paid over to the Consolidated Fund 7.7 As a result of the 2010 spending review, Departments are allowed to retain income
which is within the ambit of the Vote and where the income does not exceed 20% of the overall income allowable within the Estimate. In order to provide meaningful comparative data, these accounts have been restated to present the prior year position as if income, previously surrendered to the Consolidated Fund, had been retained. This is recognised as ‘Housing Revenue Account’ income of £996m in 2010-11 in Note 11 of these accounts with the impact of this retention also reflected in the Statement of Cash Flows, Statement of Taxpayers’ Equity and Note 4.
Housing Revenue Account Subsidy (HRAS) 7.8 In addition to the changes brought about in paragraph 7.7 above, the Housing
Revenue Account Subsidy system for payment and recovery of subsidy to and from Local Authorities has been replaced with a self financing system in 2012-13. In order to implement this, at the end of 2011-12, local authorities either took on additional debt or repaid outstanding debt with amounts payable to the Consolidated Fund as required. The impact of this on the Department accounts has been an increase of HRAS retainable income recognised in Note 11 of £7.994 bn in 2011-12 and an increase of CFER income of £6.479 bn which has since been paid over to the Consolidated Fund under the terms of the agreement.
ERDF Liabilities: Accrual, Provisions and Contingent Liabilities 7.9 The European Regional Development Fund (ERDF) was set up in 1975 to stimulate
economic development in the least prosperous regions of the European Union (EU). For the past 10 years, the Department has been managing the 2000-06 ERDF programmes in England. The 2000-06 programmes were completed at 31 March 2010 when final declarations and reports were forwarded to the European Commission (EC). These are subject to audit and challenge by the EC before final sign off that the programmes are closed.
7.10 Where project spending is not in conformity with ERDF Regulations it becomes ineligible for ERDF grant funding. The liabilities in respect of such ineligible expenditure are recovered from grant recipients but fall to the Department where such recovery is not possible. In parallel with the closure process, the Department

Department for Communities and Local Government Annual Report and Accounts 2011-12 Other financial information
72
undertook a full review of the current state of ERDF supported projects to identify all potential liabilities. The liabilities were then categorised as accruals or provisions with possible liabilities either recorded as contingent liabilities or, where sufficiently remote, not disclosed in the accounts.
7.11 For example if a possible requirement to repay grant is identified:
• an accrual is raised as a charge to the Consolidated Statement of Comprehensive Net Expenditure (SoCNE) when a payment is expected to be made, although the amount payable may remain an estimate;
• a provision is raised where the amount of a known overpayment is in dispute, but where it is considered probable (i.e. more likely than not) that the dispute will be lost; and
• in other cases where a liability to repay grant may exist but the occurrence of the repayment is dependent on the outcome of a future event, (e.g. an EC hearing, or result of a court case) such that it is considered that it is unlikely that payments will be made will either be treated as a contingent liability or not disclosed.
7.12 As part of the closure process, the Department has calculated potential liabilities from the following three categories (labelled a to c below):
a) Debt at risk - background 7.13 Debt at risk relates to recognised debt that the Department is seeking to recover from
grant recipients who have failed to comply with the requirements of the grant. Where recovery does not prove possible the amount may need to be written off, but before any amount is agreed to be written off, proposals must be submitted to a Department debt panel for approval. Additionally, material write offs (>£500,000) must be approved by the Treasury. Only after this process has been followed can write offs be sanctioned and charged to the SoCNE. This category has a potential liability of £21.6m.
a) Debt at risk - accounting treatment 7.14 The Department has thoroughly reviewed the current debt list, and has taken the view
that, although the recovery and write-off process has not been completed in all cases, there is little hope of recovery of £7.9m and has categorised this as a charge. The balance of £13.7m remains as being currently expected to be recovered.
b) Capping - background 7.15 Capping relates to the proportion of match funding against the ERDF grant funding,
which was agreed at the start of or during the programmes by the EC. Failure to deliver the agreed proportion of match funding can lead to a liability for the Department.
7.16 Details of final match funding were included in the closing statements for the grants submitted by 31 March 2010. The EC will determine the actual liability based on a standard formulaic approach using the information provided in the closing statements for the programmes. The maximum liability for this category has been estimated at £6.2m.

Department for Communities and Local Government Annual Report and Accounts 2011-12 Other financial information
73
b) Capping - accounting treatment 7.17 The fact that the regulations state that a capping penalty will apply, and is calculable
using prescribed formulae applied to figures from the final declarations, allows the amount of liability anticipated by programme to be calculated and categorised. The anticipated penalty is £6.1m and this has been accrued as a charge to the SoCNE – the likelihood that the remaining balance (£13k) will need to be recognised as a liability is considered remote and immaterial and so has not, therefore, been disclosed as a contingent liability.
c) Estimated potential corrections - background 7.18 The estimated potential corrections relate to either:
• the outcome of audit work carried out by the Audit Authority, European Commission, or European Court of Auditors on records held for the ERDF programmes. The audit bodies identify potential liabilities arising from a failure to comply with ERDF regulations or requirements and it is then for the Managing Authority to either prove there is no liability (usually through providing adequate additional evidence), or the scale of the liability has to be negotiated and agreed with the audit bodies and/or the EC; or
• potential corrections being investigated by the Managing Authority relating to handling of asset disposals.
c) Estimated potential corrections - accounting treatment 7.19 There is an accrual charged to the SoCNE of £2.3m relating to known corrections
arising from audit work – with a further £1.5m not now expected to be charged to the accounts (and thus not disclosed as a contingent liability). In respect of corrections related to error rate amounts up to 2 per cent there is an expected liability of £10m which has been accrued. This amends the provision that had been entered in the accounts in 2010-11 when the position was less clear. During the year the EC has been given further evidence which has resulted in the clearance of the outstanding points noted last year and their response and the greater clarity about cases means there is now no requirement for a contingent liability arising from those cases.
Summary of ERDF liabilities 7.20 The above changes result in a total charge to the Department’s accounts in 2011-12
of £26.3m.
7.21 Final closure of all 2000-06 ERDF programmes is expected during 2012-13.
ERDF 2007-13 programme 7.22 The Department is responsible for managing the ERDF 2007-13 programmes. Until
30 June 2011 administration of these programmes was delegated by the Department to the Regional Development Agencies (RDAs). During 2010 the Government decided to abolish the RDAs and as a result these responsibilities were taken back in house and have been delivered by DCLG staff since 1 July 2011. This change was not considered a Machinery of Government change and so in accounting terms has been treated as an acquisition, whereby ERDF balances held by the RDAs at 30 June 2011

Department for Communities and Local Government Annual Report and Accounts 2011-12 Other financial information
74
have been taken onto DCLG’s books. In London ERDF continues to be delivered by an intermediary body, the Greater London Authority, so no changes to the previous accounting treatment have been made.
7.23 The treatment of ERDF grant income has not altered as a result of this change. ERDF income is recognised once the relevant claim has been certified by the Department’s ERDF Certifying Authority team. But the treatment of grant supported expenditure has changed. Prior to 30 June 2011 payments to projects were made by the RDAs who then submitted aggregated claims to the Department. On certification these claims were paid and the ERDF expenditure recognised in the Department’s accounts. From 1 July 2011, however, payments to projects have been made by the Department but, so as to maintain the policy that ERDF supported expenditure can only be recognised as an expense once certified, these payments have been treated as current asset inventories on the Statement of Financial Position and only transferred to expenditure on certification. In the event that the payments fail certification the amounts are reclaimed from projects.
7.24 All programmes have an associated intervention rate, which is the percentage of eligible project expenditure which attracts ERDF funding. This intervention rate is applied over the programme at regional level and must be achieved by the end of the programme period, and any surplus income would need to be returned to the EU. Claims are made to the EU based on this intervention rate, but since individual projects within a programme may have different intervention rates differences arise between the amount of certified expenditure recognised for income purposes and that paid out to projects. The differences between these amounts are posted to the Statement of Financial Position either as current asset inventories or deferred income within current payables.
7.25 At the start of the programme 7.5% of the value of the programme was paid by the EU to the Department as an advance payment. This payment is to provide working capital and any interest gained on the cash balances is to be used as match funding within the programme, and where not so utilised returned to the EU. Initially the Department paid over these amounts to the RDAs in proportion to their share of the programme and the amounts were retained in bank accounts by the RDAs with interest received retained by the RDAs and utilised to support eligible project expenditure. From 1 July the advances were repaid by the RDAs to the Department together with unutilised interest. The Department now retains the advances in a specific interest paying bank account set up for the purpose together with unutilised interest. This latter amount is treated as deferred income until used.
7.26 The following table shows the relevant balances on the Statement of Financial Position reported in these accounts
£’000 Item At 31 March 2011 At 1 July 2011 At 31 March 2012
Project payments: Inventories
-
-
66,792

Department for Communities and Local Government Annual Report and Accounts 2011-12 Other financial information
75
Item At 31 March 2011 At 1 July 2011 At 31 March 2012
Intervention rate: Inventories Deferred income
- -
-
(46,990)
-
(62,224)
Interest received: Deferred income(1)
-
(4,868)
(5,383)
Advances to RDAs 173,889(2) 13,151 13,570(3)
ERDF bank account - 187,187(4) 187,252(5)
(Debit values are shown as positive and credit values as negative in brackets) Note 1: This amount relates to interest earned by the former RDAs’ and combined with DCLG
interest earned on the bank deposit is available for use as ERDF match funding Note 2: This amount was classified as a non-current receivable and was, therefore,
discounted from nominal value in accordance with IAS 39. The discounting was unwound on repayment.
Note 3: Balance relating to London has not been repaid. The difference between the 1 July and 31 March values arises from the unwinding of the discount.
Note 4: Amount shown is the assumed cash balance as at 1 July, the cash being returned to the Department by the RDAs at later dates.
Note 5: Increase 1 July to 31 March is the interest earned on those bank deposits remitted back to DCLG.
NDPB Closure 7.27 During or at the end of 2011-12 five departmental NDPBs were closed or were
reorganised such that they lost operational activities. The Department has considered these changes against the requirements of IFRS 5 - Non-current assets held for sale and discontinued operations. It has determined that none of these changes should be recognised as a discontinued operation because neither of the criteria expressed in IFRS 5 – that the change represents a separate major line of business or major geographical area of operations – has been met.
7.28 The impact of these closures on these accounts is as below.
Standards Board for England (SBE) 7.29 Under the Localism Act 2011 SBE was abolished and it closed completely on 31
March 2012. As far as possible it had cleared all its assets and paid off all liabilities at this point. All SBE bank balances were returned to the Department on 30 March 2012. To achieve closure by 31 March SBE had to close some contracts early, and where this required additional payments these have been recorded as constructive losses, the total amount so recorded was £104k and is recorded in Note 31. On closure, pension liabilities for SBE’s staff crystallised and the cessation payment of £8.3m has been accrued in their accounts. The Department has taken on SBE’s final closing receivables, liabilities and reserves and will receive cash for the receivables and discharge the liabilities in 2012-13.

Department for Communities and Local Government Annual Report and Accounts 2011-12 Other financial information
76
Thurrock Thames Gateway Development Corporation (TTGDC) 7.30 Under the terms of a Transfer Order made under the terms of the Local Government
Planning and Land Act 1980 TTGDC ‘s operational activities and associated assets and liabilities were transferred to Thurrock District Council on 31 March 2012. The main change was that holdings of development land and buildings, recognised as inventories in these accounts on consolidation, were transferred to Thurrock Council on that date for nil consideration. The total value of these inventories was £49.6m. These transfers were accounted for by crediting the inventories account with the full value. The matching debit to the Consolidated Statement of Comprehensive Net Expenditure was treated as a capital grant in kind. This treatment, which has been agreed by HM Treasury, results in a nil impact on budgets. It should be noted that this transfer results in a transfer of assets from central government to local government which has different lines of Parliamentary accountability. Therefore the Department has given full consideration to the terms of Managing Public Money to determine whether the transfer of these assets should be recorded as a gifts but has concluded that the terms of the Order makes clear that the transfer is part of a transfer of functions which not only includes the assets but also other staff and other accounting entries. Consequently the Department does not view these transfers as gifts and no entry in the Gifts Note has been made.
7.31 TTGDC will remain in existence until 31 October 2012 to wind up its affairs. At that point any remaining assets, including bank balances, liabilities and reserves will be incorporated into those of the Department
Infrastructure Planning Commission (IPC) and Tenants Services Authority (TSA) 7.32 The IPC and TSA were both abolished on 31 March 2012 but in both cases their
functions were incorporated in other bodies in the DCLG group – the Planning Inspectorate and Homes and Community Agency respectively. Because abolition involved a merger into another body rather than a cessation of activities directors of both bodies determined that they should continue to operate as going concerns. Therefore there were no implications for IPC or TSA accounts in 2011-12.
7.33 These mergers will be accounted for as Machinery of Government changes in the Department’s 2012-13 accounts.
Firebuy 7.34 The functions of Firebuy Ltd, a departmental NDPB and limited company, were closed
or passed to other bodies in early 2011. Firebuy went into voluntary liquidation on 13 July 2011 when liquidators were appointed. This process is expected to be completed in the first half of 2012-13 and Firebuy will then be formally wound up. Firebuy’s accounts to 31 March 2012 include all liabilities expected to be recognised before final closure and are consolidated into these accounts.

Department for Communities and Local Government Annual Report and Accounts 2011-12 Remuneration Report
77
8 Remuneration Report8 Remuneration Policy
8.1 The remuneration of senior civil servants is set by the Prime Minister following independent advice from the Review Body on Senior Salaries. The Review Body also advises the Prime Minister from time to time on the pay and pensions of Members of Parliament and their allowances; on Peers’ allowances; and on the pay, pensions and allowances of Ministers and others whose pay is determined by the Ministerial and Other Salaries Act 1975.
8.2 The Review Body takes account of the evidence it receives about wider economic considerations and the affordability of its recommendations. Further information about the work of the Review Body can be found at www.ome.uk.com
Service contracts 8.3 The Constitutional Reform and Governance Act 2010 requires Civil Service
appointments to be made on merit on the basis of fair and open competition. The Recruitment Principles published by the Civil Service Commission specify the circumstances when appointments may be made otherwise.
8.4 Unless otherwise stated below, the officials covered by this report hold appointments which are open-ended. Early termination, other than for misconduct, would result in the individual receiving compensation as set out in the Civil Service Compensation Scheme.
8.5 Further information about the work of the Civil Service Commissioner can be found at http://civilservicecommission.independent.gov.uk
Remuneration (including salary) and pension entitlements 8.6 The following sections provide details of the remuneration and pension interests of the
ministers and most senior management (ie Board members) of the Department and are subject to audit. Equivalent information relating to the other bodies within the departmental group consolidated into the Department’s accounts is provided in their own separate published accounts. The Non-Executive Directors did not receive a salary in their capacity as Board Members and details of fees paid to them are in paragraph 8.11.
8
The Remuneration Report refers to the core Department only. Similar Remuneration Reports are available in the Annual Reports and Accounts of the individual ALBs.

Department for Communities and Local Government Annual Report and Accounts 2011-12 Remuneration Report
78
Remuneration (salary and payments in kind)
MinistersSalary Benefit-in-Kind Salary Benefit-in-Kind
£ (to nearest £100) £ (to nearest £100)
The Rt Hon Eric Pickles MP 68,827 - 61,056(1) -
The Rt Hon Grant Shapps MP 33,002 - 29,099(2) -The Rt Hon Greg Clark MP 33,002 - 29,099(3) -Bob Neill MP 23,697 - 20,894(4) -Andrew Stunell MP 23,697 - 20,894(5) -Baroness Hanham CBE 72,470 - 63,898(6) -
2011-12 2010-11
2010-11 1 Figure quoted is for the period 12 May 2010 to 31 March 2011. The full year equivalent is £68,827 2 Figure quoted is for the period 14 May 2010 to 31 March 2011. The full year equivalent is £33,002 3 Figure quoted is for the period 14 May 2010 to 31 March 2011. The full year equivalent is £33,002 4 Figure quoted is for the period 14 May 2010 to 31 March 2011. The full year equivalent is £23,697 5 Figure quoted is for the period 14 May 2010 to 31 March 2011. The full year equivalent is £23,697 6 Figure quoted is for the period 14 May 2010 to 31 March 2011. The full year equivalent is £72,470
Paragraph 8.8 gives information on the salaries of Ministers shared between departments. Paragraph 8.9 gives information on the remuneration of Ministers who are members of the House of
Lords. A full month’s salary is paid if a Minister leaves part-way through a month.
Officials
Salary Bonus Payments
Benefit-in-Kind
Salary Bonus Payments
Benefit-in-Kind
£'000 £'000 to nearest £100 £'000 £'000 to nearest £100
Sir Bob KerslakePermanent Secretary 175-179(1) - - 70-74(6) - -
Sue HigginsDirector General 90-94(2) - - - - -
David Prout Director General 130-134 - - 130-134 5-9 -
Andrew Campbell Director 95-99(3) 10-14 - 20-24(7) - -
Richard McCarthy Director General 160-164(4) 10-14 - 175-179 10-14 -David Rossington Acting Director General 40-44(5) 10-14 - 120-124 10-14 -
Band of highest paid Director's total remuneration (FTE)
200-204 185-189
Median total actual (FTE) 36,022 35,295Remuneration ratio 5.62 5.31
2011-12 2010-11

Department for Communities and Local Government Annual Report and Accounts 2011-12 Remuneration Report
79
2011-12 1. Figure quoted includes an additional payment from 1 January 2012 on appointment as Head of the Civil Service.
The full year equivalent is in the range £200k - £204k 2. Figure quoted is for the period 1 August 2011 to 31 March 2012. The full year equivalent is in the range £135k -
£139k. 3. Figure quoted includes the period 13 November 2011 to 23 March 2012 as acting Director General during which
time temporary responsibility allowance was paid. 4. Figure quoted is for the period 1 April 2011 to 10 November 2011 and includes compensation in lieu of notice. The
full year equivalent is in the range £175k - £179k 5. Figure quoted is for the period 1 April 2011 to 31 July 2011. The full year equivalent is in the range £120k- £124. 2010-11 6 Figure quoted is for the period 1 November 2010 to 31 March 2011. The full year equivalent is in the range
£170,000 - £174,999. 7. Figure quoted is for the period 4 January 2011 to 31 March 2011. The full year equivalent is in the range £90k -
£94k. Details of Benefits-in-Kind are explained in paragraph 8.12.
Salary 8.7 ‘Salary’ includes gross salary; overtime; reserved rights to London weighting or London
allowances; recruitment and retention allowances; private office allowances and any other allowance to the extent that it is subject to UK taxation.
8.8 This report is based on payments made by the Department, and thus recorded in these accounts. In respect of Ministers in the House of Commons, departments bear only the cost of the additional ministerial remuneration. The salary for their services as an MP (£65,738 from 1 April 2010) and various allowances to which they are entitled are borne centrally. Greg Clark MP also had joint responsibilities with the Department of Business, Innovation and Skills but was paid by the Department for Communities and Local Government and his full salary and pension details are shown in this report.
8.9 The arrangement for Ministers in the House of Lords is different. They do not receive a salary as a member of the House of Lords but an additional remuneration as part of their ministerial salaries which cannot be quantified separately. This total remuneration for Baroness Hanham, as well as any allowances to which she was entitled, was paid by the Department and is, therefore, shown in full in the figures in this report.
8.10 Peter Schofield joined the Department and was appointed to the Board as Director General on 26 March 2012. He had not been paid by the Department on 31 March 2012 and, therefore, has not been included in the remuneration report for 2011-12. Louise Casey CB was appointed as a Director General in the Department in November 2011 and is a member of the senior management team. However she is not a member of the Board and so her remuneration for 2011-12 is not included in this report.
8.11 Non-Executive Directors received the following fees for their work during 2011-12:
Sara Weller – £5,806 for the period 1 December 2011 to 31 March 2012 Stephen Hay - £10,000 in 2011-12 Diana Brightmore-Armour - £7,500 in 2011-12

Department for Communities and Local Government Annual Report and Accounts 2011-12 Remuneration Report
80
Stewart Gilliland - £3,172 for period 7 December 2011 to 31 March 2012.
Benefits in Kind 8.12 The monetary value of benefits in kind covers any benefits provided by the Department
and treated by HM Revenue and Customs as a taxable emolument. There were no benefits in kind during the year.
Bonuses 8.13 Bonuses are based on performance levels attained and are made as part of the
appraisal process. Bonuses relate to the performance in the year in which they become payable to the individual. The bonuses reported in 2011-12 relate to performance in 2010-11 and the comparative bonuses reported for 2010-11 relate to the performance in 2009-10.
Pay Multiples 8.14 Reporting bodies are required to disclose the relationship between the remuneration of
the most highly-paid director in their organisation and the median remuneration of the organisation's workforce.
8.15 The banded remuneration of the most-highly paid director in DCLG in the financial year 2011-12 was £200k - £204k (2010-11 £185 - £189k). This was 5.62 times (2010-11 5.31 times) the median remuneration of the workforce, which was £36,022 (2010-11 £35,295).
8.16 For the financial year 2011-12 the most-highly paid individual was not the same as in 2010-11. The change to the remuneration of the most-highly paid individual in 2011-12, reflects the appointment of the Permanent Secretary as Head of the Civil Service. Without the additional payment for this role, the multiple is reduced to 4.79.
8.17 DCLG entered a 2 year pay freeze in 2010 -11. The slight increase in median salary for 2011-12 arises because of the payment of contractual milestones.
Pension benefits £
The Rt Hon Eric Pickles MP 2,880 1,530 47,646 20,639 17,711
The Rt Hon Grant Shapps MP 1,797 837 19,228 9,498 4,750The Rt Hon Greg Clark MP 1,797 837 19,744 9,760 4,990Bob Neill MP 1,339 611 22,162 11,133 7,033Andrew Stunell MP 1,339 611 23,031 12,237 7,430
CETV at 31/03/11
Real increase in CETV
Ministerial pensions Accrued pension at
age 65 as at 31/03/12
Real increase in pension at
age 65
CETV at 31/03/12
8.18 Pension benefits for Ministers are provided by the Parliamentary Contributory Pension
Fund (PCPF). The scheme is made under statute (the regulations are set out in Statutory Instrument SI 1993 No 3253, as amended).

Department for Communities and Local Government Annual Report and Accounts 2011-12 Remuneration Report
81
8.19 Those ministers who are Members of Parliament may also accrue an MP’s pension under the PCPF (details of which are not included in this report). The arrangements for ministers provide benefits on an ‘average salary’ basis, taking account of all service as a Minister. The accrual rate has been 1/40th since 15 July 2002 (or 5 July 2001 for those that chose to backdate the change) but ministers, in common with all other members of the PCPF, can opt for a 1/50th accrual rate and a lower rate of employee contribution. An additional 1/60th accrual rate option (backdated to 1 April 2008) was introduced from 1 January 2010.
8.20 Benefits for ministers are payable at the same time as MPs’ benefits become payable under the PCPF or, for those who are not MPs, on retirement from ministerial office from age 65. Pensions are re-valued annually in line with changes with Pensions Increase Legislation. From 1 April 2009 members pay contributions of 5.9% of their ministerial salary if they have opted for the 1/60th accrual rate, 7.9% of salary if they have opted for the 1/50th accrual rate or 11.9% of salary if they have opted for the 1/40th accrual rate. There is also an employer contribution of 28.7% of the ministerial salary paid by the Exchequer representing the balance of cost as advised by the Government Actuary. Increases to member and Exchequer contributions will apply from 1 April 2012.
8.21 The accrued pension quoted is the pension the minister is entitled to receive when they reach 65, or immediately on ceasing to be an active member of the scheme if they are already 65.
The Cash Equivalent Transfer Value (CETV) 8.22 This is the actuarially assessed capitalised value of the pension scheme benefits
accrued by a member at a particular point in time. The benefits valued are the member’s accrued benefits and any contingent spouse’s pension payable from the scheme. A CETV is a payment made by a pension scheme or arrangement to secure pension benefits in another pension scheme or arrangement when the member leaves a scheme and chooses to transfer the pension benefits they have accrued in their former scheme. The pension figures shown relate to the benefits that the individual has accrued as a consequence of their total Ministerial service, not just their current appointment as a minister. CETVs are calculated in accordance with The Occupational Pension Schemes (Transfer Values) (Amendment) Regulations 2008 and do not take account of any actual or potential reduction to benefits resulting from Lifetime Allowance Tax which may be due when pension benefits are taken.
The Real increase in the value of the CETV 8.23 This is the element of the increase in accrued pension funded by the Exchequer. It
excludes increases due to inflation and contributions paid by the minister. It is worked out using common market valuation factors for the start and end of the period.

Department for Communities and Local Government Annual Report and Accounts 2011-12 Remuneration Report
82
Civil Service pensions £’000
Officials Accrued pension at
pension age at 31/03/12 and related lump
sum
Real increase in pension and related lump
sum at pension age
CETV at 31/03/12
CETV at 31/03/11*
Real increase in CETV
Sir Bob Kerslake 5-10 plus nil lump sum
2.5-5.0 plus nil lump sum 68 18 42
Sue Higgins(from 1 August 2011)
5-10 plus nil lump sum
0-2.5 plus nil lump sum 61 59 (1)(1)
David Prout 5-10 plus nil lump sum
0-2.5 plus nil lump sum 78 44 26
Andrew Campbell 35-40 plus 65-70 lump sum
0-(2.5) plus (2.5)-(5) lump sum 691 646 (12)(1)
Richard McCarthy(to 10 November 2011)
30-35 plus nil lump sum
0-2.5 plus nil lump sum 557 497 28
David Rossington(to 31 July 2011)
30-35 plus 50-55 lump sum
0-2.5 plus 0-2.5 lump sum 518 492 13
Note 1: Taking account of inflation, the CETV funded by the employer has decreased in real terms.
(*) The actuarial factors used to calculate CETVs were changed in 2011-12. The CETVs at 31 March 2011 and 31 March 2012 have both been calculated using the new factors for consistency. The CETV at 31 March 2011, therefore, differs from the corresponding figure in last year’s report which was calculated using the previous factors.
8.24 Pension benefits are provided through the Civil Service pension arrangements. From
30 July 2007, civil servants may be in one of four defined benefit schemes: either a ‘final salary’ scheme (classic, premium or classic plus); or a ‘whole career’ scheme (nuvos). These statutory arrangements are unfunded with the cost of benefits met by monies voted by Parliament each year. Pensions payable under classic, premium, classic plus and nuvos are increased annually in line with Pensions Increase legislation. Members who joined from October 2002 may opt for either the appropriate defined benefit arrangement or a ‘money purchase’ stakeholder pension with a significant employer contribution (partnership pension account).
8.25 Employee contributions are set at the rate of 1.5% of pensionable earnings for classic and 3.5% for premium, classic plus and nuvos. Increases to employee contributions will apply from 1 April 2012. Benefits in classic accrue at the rate of 1/80th of final pensionable earnings for each year of service. In addition, a lump sum equivalent to three years’ pension is payable on retirement. For premium, benefits accrue at the rate of 1/60th of final pensionable earnings for each year of service. Unlike classic, there is no automatic lump sum. Classic plus is essentially a hybrid with benefits for service before 1 October 2002 calculated broadly as per classic and benefits for service from October 2002 worked out as in premium. In nuvos a member builds up a pension based on pensionable earnings during their period of scheme membership. At the end

Department for Communities and Local Government Annual Report and Accounts 2011-12 Remuneration Report
83
of the scheme year (31 March) the member’s earned pension account is credited with 2.3% of their pensionable earnings in that scheme year and the accrued pension is up-rated in line with Pensions Increase legislation. In all cases members may opt to give up (commute) pension for lump sum up to the limits set by the Finance Act 2004.
8.26 The partnership pension account is a stakeholder pension arrangement. The employer makes a basic contribution of between 3% and 12.5% (depending on the age of the member) into a stakeholder pension product chosen by the employee from a panel of three providers. The employee does not have to contribute but where they do make contributions, the employer will match these up to a limit of 3% of pensionable salary (in addition to the employer’s basic contribution). Employers also contribute a further 0.8% of pensionable salary to cover the cost of centrally-provided risk benefit cover (death in service and ill health retirement).
8.27 The accrued pension quoted, is the pension the member is entitled to receive when they reach pension age, or immediately on ceasing to be an active member of the scheme if they are already at or over pension age. Pension age is 60 for members of classic, premium and classic plus and 65 for members of nuvos.
8.28 Further details about the Civil Service pension arrangements can be found at the website http://www.civilservice.gov.uk/pensions
Cash Equivalent Transfer Value 8.29 A Cash Equivalent Transfer Value (CETV) is the actuarially assessed capitalised
value of the pension scheme benefits accrued by a member at a particular point in time. The benefits valued are the member’s accrued benefits and any contingent spouse’s pension payable from the scheme. A CETV is a payment made by a pension scheme or arrangement to secure pension benefits in another pension scheme or arrangement when the member leaves a scheme and chooses to transfer the benefits accrued in their former scheme. The pension figures shown relate to the benefits that the individual has accrued as a consequence of their total membership of the pension scheme, not just their service in a senior capacity to which disclosure applies.
8.30 The figures include the value of any pension benefit in another scheme or arrangement which the member has transferred to the Civil Service pension arrangements. They also include any additional pension benefit accrued to the member as a result of their buying additional pension benefits at their own cost. CETVs are worked out in accordance with The Occupational Pension Schemes (Transfer Values) (Amendment) Regulations 2008 and do not take account of any actual or potential reduction to benefits resulting from Lifetime Allowance Tax which may be due when pension benefits are taken.
The Real increase in the value of the CETV 8.31 This reflects the increase in CETV that is funded by the employer. It does not include
the increase in accrued pension due to inflation, contributions paid by the employee (including the value of any benefits transferred from another pension scheme or arrangement) and uses common market valuation factors for the start and end of the period.

Department for Communities and Local Government Annual Report and Accounts 2011-12 Remuneration Report
84
Sir Bob Kerslake 27 June 2012 Accounting Officer Department for Communities and Local Government

Department for Communities and Local Government Annual Report and Accounts 2011-12 Statement of Accounting Officer’s Responsibilities
85
9 Statement of Accounting Officer's Responsibilities 9.1 Under the Government Resources and Accounts Act 2000 (the GRAA), HM Treasury
has directed the Department for Communities and Local Government to prepare, for each financial year, consolidated accounts detailing the resources acquired, held, or disposed of and the use of resources during the year by the Department (inclusive of its executive agency) and its sponsored non-departmental and other arms length public bodies designated by order made under the GRAA by Statutory Instrument 2011 nos 723 and 2004 (together known as the ‘departmental group’, consisting of the Department and bodies listed in Note 36 to the accounts). The accounts are prepared on an accruals basis and must give a true and fair view of the state of affairs of the Department and the departmental group and of the net resource outturn, resources applied to objectives, recognized gains and losses and cash flows of the departmental group for the financial year.
9.2 In preparing the accounts the Accounting Officer is required to comply with the requirements of the Government Financial Reporting Manual and in particular to:
• observe the Accounts Direction issued by the Treasury, including the relevant accounting and disclosure requirements, and apply suitable accounting policies on a consistent basis;
• ensure that the Department has in place appropriate and reliable systems and procedures to carry out the consolidation process;
• make judgements and estimates on a reasonable basis including those judgements involved in consolidating the accounting information provided by non departmental and other arms length public bodies;
• state whether applicable accounting standards, as set out in the Government Financial Reporting Manual, have been followed, and disclose and explain any material departures in the accounts; and
• prepare the accounts on a going concern basis.
9.3 The Treasury has appointed Sir Bob Kerslake, the Permanent Head of the Department, as Accounting Officer of the Department for Communities and Local Government.
9.4 The Accounting Officer of the Department has also appointed the Chief Executives or equivalents of its sponsored non-departmental and other arms length public bodies as Accounting Officers of those bodies. The Accounting Officer of the Department is responsible for ensuring that appropriate systems and controls are in place to ensure that any grants that the Department makes to its sponsored bodies are applied for the purposes intended and that all income and expenditure of the sponsored bodies is properly accounted for, for the purposes of consolidation within the accounts. Under their terms of appointment, the Accounting Officers of the sponsored bodies are accountable for the use, including the regularity and propriety, of the grants received and the other income and expenditure of their organisation.
9.5 The responsibilities of an Accounting Officer, including responsibility for the propriety and regularity of the public finances for which an Accounting Officer is answerable, for

Department for Communities and Local Government Annual Report and Accounts 2011-12 Statement of Accounting Officer’s Responsibilities
86
keeping proper records and for safeguarding the assets of the Department or sponsored body, are set out in Managing Public Money published by the Treasury.

Department for Communities and Local Government Annual Report and Accounts 2011-12 Governance Statement
87
10 Governance Statement Introduction
10.1 During the year, the Department continued to support housing and regeneration activity and looked at policy areas to ensure that, together with local delivery partners, it was responding effectively to difficult economic circumstances. We also faced the challenges of restructuring the business and managed the risk of challenging programmes such as the Olympics, Troubled Families, the National Planning Policy Framework and the delivery of a consolidated set of accounts for the first time. An important theme for the next reporting year (2012-13) will be the implementation of our “Change Plan” to become a top performing Department.
10.2 The Department is supported in delivering this challenging agenda by a number of Arms Length Bodies (ALBs). The Homes and Communities Agency (HCA) and the Planning Inspectorate (PINS) are the Department’s largest ALBs and as such impact most materially on the Department’s delivery of its objectives, financial planning and risk management.
Compliance with the Corporate Governance Code 10.3 The detailed provisions of the Corporate Governance Code published by HM Treasury
and the Cabinet Office relate to Ministerial departments, of which the Department for Communities and Local Government (DCLG) is one. This Governance Statement sets out DCLG’s compliance with the principles set out in the Code.
Scope of responsibility 10.4 As Principal Accounting Officer, I have responsibility for maintaining a sound system
of internal control that supports the achievement of the policies, aims and objectives for the Department for Communities and Local Government (DCLG), whilst safeguarding the public funds and departmental assets for which I am personally responsible, in accordance with the responsibilities assigned to me in Managing Public Money.
10.5 I am also responsible for ensuring that there is a high standard of financial management in the Department as a whole. Therefore I have a duty to be satisfied that ALBs sponsored by DCLG have adequate financial systems and procedures in place to promote the efficient and economical conduct of their business and to safeguard financial propriety and regularity. I am also responsible for the effective management of the single administration budget across the Departmental Group.
Local accountability frameworks 10.6 The report Accountability: Adapting to decentralisation, published in September 2011,
proposed that in future departmental accounting officers should publish accountability system statements explaining how they achieve accountability for the grants they distribute to local bodies. This allows Accounting Officers to demonstrate that, as the government moves to decentralise power to local communities, the appropriate accountability mechanisms are still in place. The Treasury included this requirement in the Managing Public Money guidance, via a letter to departments on 17 February 2012.

Department for Communities and Local Government Annual Report and Accounts 2011-12 Governance Statement
88
10.7 The accountability system statement sets out the accountability system for local authorities and fire and rescue authorities for the financial year 2012-13. It sets out current funding systems, legislation and guidance which forms the system at present, and it signposts changes which are expected to be made during the year. As DCLG Accounting Officer I am the lead accounting officer for local authorities and Fire and Rescue authorities. That statement therefore covers the core accountability system for local authorities, which is concerned with issues such as their financial management and democratic accountability. The statement is available on DCLG’s website.
10.8 Departments which oversee other services run by local government will publish statements in relation to these services. The main additional systems cover education and children’s services (Department for Education), adult social care (Department of Health), public health (Department of Health), transport (Department for Transport) and waste (DEFRA). These statements will explain any other grants made to local authorities, and relevant legislation and regulation in respect of those services.
The purpose of the system of internal control 10.9 The system of internal control is the set of processes and procedures in place in the
Department for Communities and Local Government and the wider DCLG Group to ensure that the Group delivers its policies, aims and objectives. It is designed to identify and prioritise the risks, to evaluate the likelihood of those risks being realised and the impact should they be realised, and to manage them efficiently, effectively and economically.
10.10 The system of internal control manages risk to a reasonable level rather than eliminating all risk of failure to achieve policies, aims and objectives; it can therefore only provide reasonable and not absolute assurance of effectiveness. The system of internal control has been in place in the Department for the year ended 31 March 2012 and up to the date of approval of the annual report and consolidated accounts, and accords with Treasury guidance.
The Group governance framework The Board
10.11 The DCLG Board is chaired by the Secretary of State and another Minister permanently attends. Other DCLG Ministers attend in rotation. This is a slight divergence from the Code which recommends that all Ministers attend the Board. However this approach has been agreed with the Secretary of State and the ministerial team and the arrangement works well. The Board’s role is to advise and support Ministers on the operational implications and effectiveness of policy proposals, focusing on getting policy translated into results. In accordance with Cabinet Office guidance, 6 Board meetings were held throughout the year and the Board discussed a variety of issues affecting the Department including Housing Growth and the Department’s restructure.
10.12 Lead Non- Executive Director (NED), Sara Weller conducted a Board Effectiveness Evaluation in accordance with Cabinet Office requirements. The conclusions of the evaluation are outlined in her Foreword to the Annual Report.

Department for Communities and Local Government Annual Report and Accounts 2011-12 Governance Statement
89
Sub-Committees to the Board 10.13 There are two sub-committees to the Board
• The Audit and Risk Committee (chaired by Stephen Hay, who is a Non-Executive Member of the departmental Board) is responsible for assessing and assuring the Department’s overall risk management framework and for ensuring financial propriety. The Committee gives independent advice to the Accounting Officer on the adequacy of audit arrangements (internal and external) and on the assurances received on the existence and effectiveness of systems for accountability and control in the organisation. Its remit applies across the whole of the DCLG Group and it is assisted in this context through the close working relationships with the HCA and PINS.
• The Nominations and Governance Committee (chaired by Diana Brightmore-Armour, who is a Non Executive member of the departmental Board) is responsible for providing governance for the Department’s senior civil service performance and rewards as required by the Cabinet Office.
The Executive Team 10.14 The Board is also supported by an Executive Team which is responsible for driving
and managing the daily business of the Department. The Executive Team is responsible for reviewing those issues escalated to it and issuing instructions regarding them. It can also raise any issue for discussion and will also determine which issues to escalate to the Board.
Sub-Committees to the Executive Team 10.15 There are three sub-committees to the Executive team:
• The Finance Sub-Committee is responsible for detailed financial monitoring reviewing investment proposals over £50m across the Spending Review period and maintaining oversight of the governance arrangements for ALBs. It determines which issues should be escalated for review by the Executive Team and is supported in discharging its responsibilities by the Investment Sub- Committee (see paragraphs 10.33 – 10.34 below)
• The Performance Sub-Committee is responsible for scrutinising in detail the progress and delivery of the full range of policy commitments and responsibilities – including whether the staff and resources applied to commitments are appropriate and cost effective determining which issues should be escalated to the Executive Team
• The People Sub-Committee is responsible for overseeing the development and delivery of a business-focussed people strategy and the people aspects of the next phase of the Business Change programme. It will be responsible for governance of SCS performance.
Programme boards 10.16 Programme Boards are responsible for scrutinising in detail the progress and delivery
of specific relevant policy commitments and responsibilities and submitting reports to the Performance Sub-Committee.

Department for Communities and Local Government Annual Report and Accounts 2011-12 Governance Statement
90
Sponsorship arrangements 10.17 Through its sponsorship teams, the Department engages directly with each body
proportionate to the level of risk the body poses to the Department. Sponsor teams attend regular meetings with Finance colleagues, formal delegations are in place where bodies are funded from the single administration budget and I meet regularly with the Accounting Officers of the ALBs. There is a regular Forum for Arms Length Bodies in the DCLG Group.
Risk management 10.18 Throughout the reporting year the Board, the Executive Team, and key Sub-
Committees of the Board continued to take an active lead in embedding risk management in the organisation.
10.19 Senior Responsible Owners were accountable for the effective management and escalation of risks within their groups and programmes.
10.20 The Executive Team has used the Corporate Risk Register to review the critical risks to Departmental business and the actions being taken to mitigate them and as a result has called in policy teams for a more detailed discussion of risks such as the Department’s work on Welfare Reform.
10.21 The Audit and Risk Committee has taken an active interest in the way in which the Department has managed risk. During the year the Committee has considered the Department's overall risk register and also reviewed in detail the Department's approach to particular risks.
10.22 The key Programme Boards across the Department have regularly reviewed their risks and escalated strategic and cross-cutting risks to the Finance, Performance and People Sub Committees for discussion and potential inclusion on the Corporate Risk Register.
10.23 The Performance Sub-Committee has provided scrutiny for the highest risk programmes, with focus on assuring that the biggest financial and delivery risks were being effectively managed and to determine whether an issue should be escalated to the Executive Team.
10.24 OGC Gateway reviews have been used to provide external assurance for the most important programmes and their management of risk. These reviews have been complemented by a number of internal assurance reviews which have provided an independent assessment of risk.
10.25 Internal Audit reviewed the adequacy and effectiveness of the Department’s risk, control and governance framework through a programme of audits and advisory work.
10.26 National Audit Office (NAO) Value for Money (VfM) Studies on Fire Control and the Mortgage Rescue Scheme and a Landscape Review on Formula Funding of Local Public Services were published in the period.

Department for Communities and Local Government Annual Report and Accounts 2011-12 Governance Statement
91
10.27 The Department has carried out a risk review which has improved the way risks are reported to provide more detail of underlying risks and also implemented a new risk escalation procedure which ensures that risks are managed at the appropriate level.
10.28 The Department has challenged Governance Statements produced by each Director half way during the year, and at the end of the year. This challenge was exercised by Assurance Panels chaired by the Director General Finance and Corporate Services or the Finance Director, and including NEDs for a sample of Directorates.
10.29 The Department ensured that appropriate policies and guidance were in place to assure compliance with Cabinet Office mandates on electronic and physical data security. A small number of minor suspected security breaches were identified in the period; each was investigated and no loss of personal or proprietary data was identified.
10.30 During the period, DCLG management teams have sought to integrate Homes and Communities Agency and the Planning Inspectorate as much as possible into the governance framework of the Department to engender a DCLG Group approach. For example, the Finance Directors of both the Homes and Communities Agency and the Planning Inspectorate are attendees of the Department’s Finance Sub-Committee and attend the quarterly business review meetings with Executive Team. The HCA Audit and Risk Committee Chair is now a member of the Departmental Audit and Risk Committee and HCA officials attend too. These closer working relationships have helped significantly in terms of engendering Group-wide financial planning, risk management and decision making.
10.31 Capacity to handle risk within the Homes and Communities Agency is embedded within the non executive and executive governance structures, policies and procedures established within the organisation to manage strategic and operational business and within the core risk management policy and through guidance and training. Key methods of embedding risk management in the activity of the business include - • risk identification, assessment and mitigation plans included in Corporate and
Business Plans • routine consideration of risk in all investment decision making processes • regular review of risk registers for programmes, operating areas, corporate
directorates and projects • research and analysis of the property and housing market to help inform strategy
development and investment decisions • regular risk reporting to senior management, the Audit and Risk Committee and
the Board
10.32 A key element of the way the Planning Inspectorate (PINS) approached the management of risk during the reporting period was to incorporate risk mitigation as a part of ‘business as usual’. This included close liaison with policy and sponsorship teams in DCLG, clear communication with its staff and stakeholders, and proactive in-house forecasting of future demand. As a result the key strategic risks faced by the organisation during the period, were appropriately managed.

Department for Communities and Local Government Annual Report and Accounts 2011-12 Governance Statement
92
Evidence based decision making 10.33 The Investment Sub-Committee (ISC) supports the Finance Sub-Committee in its
responsibilities on reviewing investment decisions within the Department, and its Arms Length Bodies where these decisions exceed their agreed delegation levels. In particular, the ISC is responsible for reviewing and approving investment proposals for the Department of between £1m and £50m in value (or those proposals judged sensitive by the Finance Director) across the Spending Review (SR) period, and the associated business cases, taking into account deliverability, affordability, value for money, risk management and transparency of procurement. The ISC makes recommendations to the Finance Sub-Committee.
10.34 The ISC met very frequently in the reporting period. It has reviewed high profile policies and programmes such as Troubled Families, the London Settlement, Right to Buy, Get Britain Building, NewBuy and the issues arising from the closure of the Audit Commission. Investment appraisals outside the delegation frameworks of the Homes and Communities Agency and the Planning Inspectorate were also scrutinised.
Facing challenges 10.35 The Annual Report talks about the policy and delivery challenges which the
Department and its Group have faced over the reporting period and highlights our achievements. Below are some examples of how the governance, control and risk management framework has assisted delivery of our policies and programmes.
Departmental Restructure 10.36 A Change Programme Board which I chaired provided senior governance for the
duration of the restructuring process, managing risks to delivery and taking decisions on progress. The Department’s exit schemes were the subject of an Internal Audit review in September 2011, which provided an independent opinion on how processes and controls were managed. This concluded that departmental procedures for exits management were fit for purpose and were being followed, including in relation to value for money; and awarded a substantial assurance level for each of risk management, control and governance.
Review of Arms Length Bodies (ALBs) 10.37 Throughout the reporting period work continued on Arms Length Body reform and the
Arms Length Bodies Reform Board continued to focus on top programme risks and challenges in relation to reform projects and the robustness of implementation plans and progress. Financial risks have continued to receive significant management time. The DCLG Board discussed the ALB reform in August and was content with the level of governance and assurance the programme provided. The Department’s Audit and Risk Committee also considered the ALB reform programme and decided to de-escalate the ALB risk off the top level corporate risk register.
Homes and Communities Agency (HCA) 10.38 Key challenges for the HCA during the year have been the development of the
Affordable Homes Programme 2011-15, delivering a new form of social housing Affordable Rent and the development of further programmes to support the Government’s Housing Strategy including Get Britain Building. The HCA has also implemented a substantial and complex change and restructuring programme which

Department for Communities and Local Government Annual Report and Accounts 2011-12 Governance Statement
93
has reduced the size of the organisation which will enable it to live within its administration budget. This has in part included preparation to absorb functions and staff from the Tenant Services Authority (TSA) and to transfer staff and assets to the Greater London Authority (GLA). In all cases procedures have been established to help ensure that the internal control environment remains effective.
10.39 The governance arrangements in place within the HCA in the period were the HCA Board, its Committees and Advisory Groups and also included executive level fora. The Board set the strategic direction of the business, ensuring the effective operation of risk management and that a sound system of internal control was in place. Committees to the Board included the Audit & Risk Committee, the Remuneration Committee and the Investment Committee which is the key non executive decision making committee as it considers all of the HCA’s major investment proposals.
10.40 In addition to these committees, there were a range of Advisory Groups which provided focus and challenge to the HCA's work in key, cross-cutting areas.
10.41 The executive governance / decision making arrangements that have operated in the period included:
• Programme Boards which reviewed and updated the risk registers for the programmes within their oversight and ensured that actions were taken to mitigate risks. The Housing and Land and Regeneration Programme Boards met frequently throughout the year. Following the transfer of RDA assets to the HCA on 19 September 2011, these assets were combined with HCA assets within the Economic Assets Programme (EAP). This Programme is monitored by the Land and Regeneration Programme Board and also reports to an oversight board which includes the HCA, DCLG and the Department for Business, Innovation and Skills (BIS);
• The Directors Group which includes all HCA Directors, and; • The Projects Executive which meets monthly to consider and approve
investments within the Chief Executive’s delegated authority and which convened additional meetings throughout the financial year to discuss investments related to the Economic Assets Programme.
Merger of the Infrastructure Planning Commission with the Planning Inspectorate 10.42 One of the key challenges for the organisation in the reporting period was in relation to
the merger of Infrastructure Planning Commission The Government's decision to abolish the Infrastructure Planning Commission was confirmed through the Localism Act 2011, and the Commission's functions transferred to a unit within a restructured Planning Inspectorate (PINS) on 1 April 2012. This process was managed through a programme of extensive engagement with external stakeholders, staff and DCLG and culminated in a smooth transition, with the Commission and the Inspectorate both maintaining their service levels.
10.43 During the year the Board provided the strategic direction of the organisation. The Board was supported by two standing sub-committees, plus working groups responsible for taking forward two main strategic themes – Communications &

Department for Communities and Local Government Annual Report and Accounts 2011-12 Governance Statement
94
Engagement and Workforce Planning. There were a number of executive level fora designed to manage the organisation at a tactical level.
10.44 Within the framework of the strategic direction, Directors met on a regular basis to make decisions. In preparation for integration and to ensure consistency between the Planning Inspectorate and the Infrastructure Planning Commission, Directors’ meetings were attended by Directors of both organisations. Directors of the Infrastructure Planning Commission attended in an advisory capacity.
Audit Commission closure 10.45 Following the announcement of the closure of the Audit Commission, the Department
set up a dual-purpose Future of Local Audit project, supported by two Boards. The purpose of the project is twofold, the management of the closure of the Audit Commission, with oversight and scrutiny provided by a Closedown Board and to formulate the new audit arrangements following closure, to ensure there is robust framework that will uphold high audit standards as a key way of assuring accountability to Parliament for Local Authority spending. This is led by a cross-Whitehall Programme Board, chaired by the Director of Local Government Policy.
Regional Growth Fund (RGF) 10.46 The Regional Growth Fund programme has been reviewed by National Audit Office
(NAO), Internal Audit and HM Treasury (HMT) during the year. The NAO report was issued in May 2012. The management of RGF has been simplified, with ownership consolidated from 4 departments to 2, adding a further £1bn funding at the same time. From a DCLG perspective, the key issues faced during the year have been to ensure the RGF Secretariat had adequate resource to deliver the various stages of handling and that the Budget profile could be delivered as well. Both of these activities have been challenging and taken considerable effort to resolve to the satisfaction of all parties.
European Regional Development (ERDF) ERDF 2000-06 Programmes
10.47 The reductions in liabilities set out in paragraph 2.65 have been achieved through the rigorous oversight of a Programme Board. There has been continued focus on reducing the levels of liabilities associated with the programme through challenge of EC interpretations of complex Fund rules where this is appropriate, and debt collection procedures against grant applicants who have breached the EC’s compliance framework. Internal Audit Services have worked in conjunction with the ERDF Managing Authority based in DCLG throughout the year to resolve numerous queries raised by the EC.
ERDF 2007-13 Programmes 10.48 For 2007-13 Programmes, ongoing monitoring and audit work is in place. In March
2011, the EC interrupted payments (to the Department) for six (of ten) programmes, as they did not have sufficient assurance that management and control systems were working effectively (which at the time were devolved to Regional Development Agencies). This interruption was lifted in July 2011, the EC being satisfied with the Department's plans to improve management and control systems - the key tenet being

Department for Communities and Local Government Annual Report and Accounts 2011-12 Governance Statement
95
the establishment of a single national integrated management structure for the ERDF programme (post abolition of the Regional Development Agencies).
10.49 In December 2011, the Audit Authority for the ERDF programme issued its Annual Control Report. This offered an unqualified audit opinion of the management and control systems for the English ERDF programme, reporting a concluded error rate of 1.57% (which is below the EC's 2% materiality threshold). In their February 2012 response, the EC considered that the annual control report and annual audit opinion submitted were acceptable and met their requirements
10.50 The ERDF Transition team is responsible for mitigating risks relating to transfer of scheme records and achieving correct novation of contracts relating to ERDF 2007-13 programmes. Prior to the winding up of the Regional Development Agencies, the programme boards for ERDF 2000-06 programme and the ERDF 2007-13 programme were brought together. In April 2012, the Managing Authority functions of the two programmes were also merged.
Managing the Risk of Financial Loss 10.51 The Executive Team approved the methodology for the Managing Risk of Financial
Loss (MRoFL) project, to implement a mandatory, but internally driven review of our key financial systems (namely payroll and expenses, procurement and grants) to assess the extent to which they might be vulnerable to fraud and to implement any counter-measures deemed necessary as a result. It was agreed that two of the work streams, on procurement and grants, would be subject to a full review using the HM Treasury MRoFL toolkit; and that the other workstream, on payroll and expenses, would be reviewed as part of the Department’s Internal Audit work programme. The assessments of the three workstreams did not reveal any major control issues. However, action plans have been put in place and are being taken forward to strengthen governance and provide a higher level of assurance. DCLG participates in the National Fraud initiative and the results have provided further assurance about the counter fraud controls in place within the Department.
Review of effectiveness of the system of internal control 10.52 As Accounting Officer, I have responsibility for reviewing the effectiveness of the
system of internal control. Executive managers within the Department have responsibility for the development and maintenance of the internal control framework. My review of the effectiveness of the system of internal control is informed by the work of the internal auditors and the comments made by the external auditors in their management letter and other reports, including Value for Money reviews; recommendations are implemented on a timely basis. Internal Audit updates the plan to reflect changes in risk profile and the revised plan is reviewed and approved by the Audit and Risk Committee.
10.53 I have been advised, in my review of the effectiveness of the system of internal control, by the Executive Team and its committees and by the Department’s Audit and Risk Committee. The priority for 2012-13, in terms of risk management, will continue to be the delivery of the Departmental Business Plan.

Department for Communities and Local Government Annual Report and Accounts 2011-12 Governance Statement
96
Significant internal control issues 10.54 Following Internal Audit Service reviews, the following issues have been identified.
• Information Technology (IT) Governance – following Internal Audit Service’s review of Information Technology Governance, IT Strategy and Risk Management, opportunities were identified (and have been taken forward) to strengthen overall corporate governance arrangements and their relationship to IT governance, and to review IT resourcing levels in relation to overall demand and the requirements for specialist skills/roles.
• IT Disaster Recovery (DR) Planning Arrangements – management arrangements are to be strengthened to improve governance, risk management and control in relation to the Department’s DR provision. Specifically, this will involve:
o Clearly defining and effectively empowering responsibility for IT DR management and ownership of the associated processes, roles etc, and constructing an appropriate Department-wide IT DR framework;
o Framing a consistent view of business requirements against which to set IT DR capability / effectiveness; and
o Mapping end to end departmental critical processes in order to identify interdependent services that need to be provided for in DR terms.
• Personnel Information Management System (PIMS) Application Controls - actions are in train to address shortfalls in risk management concerning the lack of formal disaster recovery arrangements, including testing of plans, and gaps in control in particular regarding a lack of monitoring of system administrator accounts.
10.55 There were two instances in the reporting period where procedures for laying financial minutes before Parliament were not followed correctly. Actions are in train to address this moving forwards. There are no further significant control issues to report.
Role of Internal Audit 10.56 The Department’s Internal Audit Service (IAS) plays a crucial role in the review of the
effectiveness of risk management, controls and governance by:
• focusing audit activity on the key business risks; • being available to guide managers and staff through improvements in internal
controls; • auditing the application of risk management and control as part of Internal Audit
reviews of key systems and processes; and • providing advice to management on internal control implications of proposed and
emerging changes.
10.57 IAS also has extensive links across the Group, acting as the audit service to PINS, and has been liaising with HCA’s Internal Audit provider around possible joint reviews and sharing assurances. The DCLG Director of Internal Audit has regular discussions with the HCA Head of Internal Audit.

Department for Communities and Local Government Annual Report and Accounts 2011-12 Governance Statement
97
10.58 The Department’s Internal Auditors operate in accordance with Government Internal Audit Standards and to an Internal Audit Plan approved by the Audit and Risk Committee. Internal Audit updates the plan to reflect changes in risk profile and the revised plan is reviewed and approved by the Audit and Risk Committee. Internal Audit submits regular reports on the adequacy and effectiveness of the Department’s systems of internal control and the management of key business risks, together with recommendations for improvement. These recommendations have been accepted by Management including an agreed timetable for implementation. The status of Internal Audit recommendations, and the collection of evidence to verify their implementation, is reported to the Audit and Risk Committee.
Internal Audit Opinion The Department
10.59 Following completion of the planned audit work for 2011-12 for the Department, the Head of Internal Audit issued an independent and objective opinion on the adequacy and effectiveness of the Department’s system of risk management, governance and internal control. It stated that:
“We have completed the programme of internal audit work for the year ended 31 March 2012 and we can report that our work did not identify any significant control weaknesses that we consider to be pervasive in their effect on the system of internal control. However, we have identified significant control weaknesses in some specific systems and processes covering Information Technology (IT) Governance, IT Disaster Recovery and the Department’s Personnel Information Management System (PIMS) (see paragraph 10.54).”
For the ERDF programmes, Internal Audit Services can give a substantial assurance. For the 2000-06 programme, sufficient controls are in place to ensure financial risks are gradually being reduced. For the ERDF 2007-13 programme, there has been an increased assurance on the management and control system, including the implementation of agreed actions to lift the payment interruption for 6 of the 10 operational programmes. Further work will be required to embed the single national integrated management structure and standardised management controls fully.
On that basis we give substantial assurance on the adequacy and effectiveness of the system of internal control throughout the year. In the majority of individual areas we were able to give substantial (and in some cases full) assurance”.
The Homes and Communities Agency 10.60 The Homes and Communities Agency’s Internal Audit opinion supports strong
assurance for the Agency’s governance and risk management arrangements in 2011-12, particularly in relation to Change Programme activities. There are areas highlighted within the overall control framework which are considered insufficient to manage the associated risks where either the existing controls are not considered sufficient or more frequently where existing requirements are not being complied with. These issues are not considered to have seriously undermined the overall control framework during 2011-12.

Department for Communities and Local Government Annual Report and Accounts 2011-12 Governance Statement
98
The Planning Inspectorate 10.61 Internal Audit’s opinion in relation to the Planning Inspectorate gives a substantial
(amber/green) assurance as to the overall adequacy and effectiveness of the Inspectorate’s systems of risk management, control and governance. These findings reflect the Inspectorate’s generally sound governance and control environment. Where there have been amber/green opinions, these indicate areas of further development rather than concern.
Conclusion 10.62 Prior to signing this Governance Statement, the Department’s Audit and Risk
Committee has confirmed that I have the necessary level of assurance from senior colleagues.
Sir Bob Kerslake 27 June 2012 Accounting Officer Department for Communities and Local Government

Department for Communities and Local Government Annual Report and Accounts 2011-12 The Certificate and Report of the Comptroller and Auditor General to the House of Commons
99
11 The Certificate and Report of the Comptroller and Auditor General to the House of Commons
I certify that I have audited the financial statements of the Department for Communities and Local Government and of its Departmental Group for the year ended 31 March 2012 under the Government Resources and Accounts Act 2000. The Department consists of the core Department and its agencies. The Departmental Group consists of the Department and the bodies designated for inclusion under the Government Resources and Accounts Act 2000 (Estimates and Accounts) Order 2011. The financial statements comprise: the Department’s and Departmental Group’s Statements of Comprehensive Net Expenditure, Financial Position and Cash Flows and Changes in Taxpayers’ Equity; and the related notes. I have also audited the Statement of Parliamentary Supply and the related notes. These financial statements have been prepared under the accounting policies set out within them. I have also audited the information in the Remuneration Report that is described in that report as having been audited.
Respective responsibilities of the Accounting Officer and auditor As explained more fully in the Statement of Accounting Officer’s Responsibilities, the Accounting Officer is responsible for the preparation of the financial statements and for being satisfied that they give a true and fair view. My responsibility is to audit, certify and report on the financial statements in accordance with the Government Resources and Accounts Act 2000. I conducted my audit in accordance with International Standards on Auditing (UK and Ireland). Those standards require me and my staff to comply with the Auditing Practices Board’s Ethical Standards for Auditors.
Scope of the audit of the financial statements An audit involves obtaining evidence about the amounts and disclosures in the financial statements sufficient to give reasonable assurance that the financial statements are free from material misstatement, whether caused by fraud or error. This includes an assessment of: whether the accounting policies are appropriate to the Department’s and the Departmental Group’s circumstances and have been consistently applied and adequately disclosed; the reasonableness of significant accounting estimates made by the Accounting Officer; and the overall presentation of the financial statements. In addition I read all the financial and non-financial information in the Annual Report to identify material inconsistencies with the audited financial statements. If I become aware of any apparent material misstatements or inconsistencies I consider the implications for my certificate.
I am required to obtain evidence sufficient to give reasonable assurance that the Statement of Parliamentary Supply properly presents the outturn against voted Parliamentary control totals and that those totals have not been exceeded. The voted Parliamentary control totals are Departmental Expenditure Limits (Resource and Capital), Annually Managed Expenditure (Resource and Capital), Non-Budget (Resource) and Net Cash Requirement. I am also required to obtain evidence sufficient to give reasonable assurance that the expenditure and income recorded in the financial statements have been applied to the purposes intended by Parliament and the financial transactions recorded in the financial statements conform to the authorities which govern them.
Opinion on regularity In my opinion, in all material respects:

Department for Communities and Local Government Annual Report and Accounts 2011-12 The Certificate and Report of the Comptroller and Auditor General to the House of Commons
100
• the Statement of Parliamentary Supply properly presents the outturn against voted Parliamentary control totals for the year ended 31 March 2012 and shows that those totals have not been exceeded; and
• the expenditure and income recorded in the financial statements have been applied to the purposes intended by Parliament and the financial transactions recorded in the financial statements conform to the authorities which govern them.
Opinion on financial statements In my opinion:
• the financial statements give a true and fair view of the state of the Department’s and the Departmental Group’s affairs as at 31 March 2012 and of the Department’s net operating cost and Departmental Group’s net operating cost for the year then ended; and
• the financial statements have been properly prepared in accordance with the Government Resources and Accounts Act 2000 and HM Treasury directions issued thereunder.
Opinion on other matters In my opinion:
• the part of the Remuneration Report to be audited has been properly prepared in accordance with HM Treasury directions made under the Government Resources and Accounts Act 2000; and
• the information given in the Management Commentary, Sustainability Report, Other Financial Information and Remuneration Report for the financial year for which the financial statements are prepared is consistent with the financial statements.
Matters on which I report by exception I have nothing to report in respect of the following matters which I report to you if, in my opinion:
• adequate accounting records have not been kept or returns adequate for my audit have not been received from branches not visited by my staff; or
• the financial statements and the part of the Remuneration Report to be audited are not in agreement with the accounting records and returns; or
• I have not received all of the information and explanations I require for my audit; or • the Governance Statement does not reflect compliance with HM Treasury’s guidance.
Report I have no observations to make on these financial statements. Amyas C E Morse Comptroller and Auditor General National Audit Office 157-197 Buckingham Palace Road London SWIW 9SP 27 June 2012

Department for Communities and Local Government Accounts 2011-12 Statement of Parliamentary Supply
101
Statement of Parliamentary Supply For the year to 31 March 2012
Summary of Resource and Capital Outturn 2011-12 £’000 2010-11Outturn
Restated
Note Voted Non-Voted Total Voted Non-Voted Total Net Total
Spending in Departmental Expenditure Limit (DEL) - DCLG Communities
Resource 2.1 1,950,171 - 1,950,171 1,821,401 - 1,821,401 128,770 3,845,324Capital 2.2 3,854,997 - 3,854,997 3,820,927 - 3,820,927 34,070 6,070,084
Spending in DEL - DCLG Local Government
Resource 2.1 26,651,691 - 26,651,691 26,557,648 - 26,557,648 94,043 25,865,615Capital 2.2 50 - 50 (7,717) - (7,717) 7,767 (67,706)
Spending in Annually Managed Expenditure (AME)
Resource 2.1 511,166 - 511,166 382,196 - 382,196 128,970 1,044,263Capital 2.2 370,000 - 370,000 152,824 - 152,824 217,176 842,972
Total Budget 33,338,075 33,338,075 32,727,279 32,727,279 610,796 37,600,552Non Budget: -
Resource - - - - - - - -Total 33,338,075 33,338,075 32,727,279 32,727,279 610,796 37,600,552
Total Resource 2.1 29,113,028 - 29,113,028 28,761,245 - 28,761,245 351,783 30,755,202Total Capital 2.2 4,225,047 - 4,225,047 3,966,034 - 3,966,034 259,013 6,845,350Total 33,338,075 - 33,338,075 32,727,279 - 32,727,279 610,796 37,600,552
2011-12Estimate Outturn Outturn
compared with
Estimate: saving/
(excess)
Net Cash Requirement 2011-12
£’000 2010-11
Restated
Note Estimate OutturnOutturn compared
with Estimate: saving/(excess)
Outturn
Net Cash Requirement 4 33,363,649 31,438,209 1,925,440 (36,797,932)
2011-12
Administration Costs 2011-12
£’000 2010-11
Restated
Note Estimate OutturnOutturn compared
with Estimate: saving/(excess)
Outturn
Administration Costs 3.2 377,046 338,979 38,067 419,633
2011-12
The Notes on pages 108-162 form part of these accounts.

Department for Communities and Local Government Accounts 2011-12 Consolidated Statement of Comprehensive Net Expenditure
102
Consolidated Statement of Comprehensive Net Expenditure For the year ended 31 March 2012
£’000
2011-12 2010-11restated
Note Core Department
Core Department &
Agency
Departmental Group
Core Department
Core Department &
Agency
Departmental Group
Administration CostsStaff Costs 7 105,525 133,673 205,604 171,943 205,120 257,685
Other Costs 8 100,362 113,684 193,725 169,432 182,372 288,293
Income 10 (14,437) (23,396) (60,350) (44,436) (53,865) (80,501)
Programme CostsStaff Costs 7 3,332 3,338 22,873 11,736 11,736 18,653
Other Costs 9 38,248,714 38,249,897 40,644,534 33,409,854 33,413,088 37,786,341
Income 11 (14,968,019) (14,968,019) (15,076,849) (1,416,699) (1,416,677) (1,571,877)
Grant-in-aid to NDPBs 2,270,765 2,270,765 - 4,394,700 4,394,700 1,423
Net Operating Costs for the year ended 31 March 25,746,242 25,779,942 25,929,537 36,696,530 36,736,474 36,700,017
Total Expenditure 40,728,698 40,771,357 41,066,736 38,157,665 38,207,016 38,352,395
Total Income (14,982,456) (14,991,415) (15,137,199) (1,461,135) (1,470,542) (1,652,378)
Net Operating Costs for the year ended 31 March 25,746,242 25,779,942 25,929,537 36,696,530 36,736,474 36,700,017
Other Comprehensive Net ExpenditureNet (Gain) / Loss on:Pension Schemes 24 108 108 32,491 - - (28,189)Disposal of available for sale assets recognised in net expenditure
- - 3,330 - - 1,024
Revaluation of property, plant and equipment 12 (1,275) (1,275) (1,438) (231) (231) (150)
Revaluation of intangibles - - - - -Revaluation of inventories 19 - - (72,023) - - 42,466Fair value gain on available for sale assets 16 - - 17,108 - - (14,366)
Income tax on items in other comprehensive expenditure - - 16,854 - - (7,597)
Total comprehensive expenditure for the year ended 31 March
25,745,075 25,778,775 25,925,859 36,696,299 36,736,243 36,693,205
-
All activities are continuing, the impact of Clear Line of Sight (CLoS) boundary and Machinery of Government transfers can be found at Note 32
The Notes on pages 108-162 form part of these accounts.

Department for Communities and Local Government Accounts 2011-12 Consolidated Statement of Financial Position
103
Consolidated Statement of Financial Position as at 31 March 2012
£’000 31-Mar-12 31-Mar-2011
restated31-Mar-2010
restated
Note Core Department
Core Department &
Agency
Departmental Group
Core Department
Core Department &
Agency
Departmental Group
Departmental Group
Non-current assetsProperty, plant and equipment
12 108,868 109,004 117,711 118,457 118,661 137,858 94,832
Intangible assets 13 16,722 16,832 20,130 24,554 24,734 29,294 85,288Investments 15 31,348 31,348 356,160 32,767 32,767 419,005 400,553
Available for sale assets 16 - - 550,208 - - 556,556 454,049
Investment properties 17 28,511 28,511 28,511 28,806 28,806 28,806 21,782Trade and other receivables 20 14,329 14,346 155,947 174,300 174,328 396,807 401,414
Total non-current assets 199,778 200,041 1,228,667 378,884 379,296 1,568,326 1,457,918
Current assetsAssets classified as held for sale - - - - - - 5
Inventories 19 66,792 66,792 1,121,879 - - 1,109,489 1,425,765Trade and other receivables 20 361,888 366,795 530,060 567,058 572,783 761,032 646,834
Cash and cash equivalents 21 393,086 393,086 440,682 190,185 190,185 319,365 254,952
Total current assets 821,766 826,673 2,092,621 757,243 762,968 2,189,886 2,327,556
Total assets 1,021,544 1,026,714 3,321,288 1,136,127 1,142,264 3,758,212 3,785,474
Current liabilities
Trade and other payables 22 1,795,476 1,798,527 2,103,200 1,212,212 1,217,975 1,614,120 1,585,391
Provisions 23 9,748 10,061 37,696 57,185 57,530 88,486 149,988Pensions 24 156 156 11,741 156 156 2,155 156Total current liabilities 1,805,380 1,808,744 2,152,637 1,269,553 1,275,661 1,704,761 1,735,535
Non-current assets plus/less net current assets/liabilities
(783,836) (782,030) 1,168,651 (133,426) (133,397) 2,053,451 2,049,939
Non-current liabilities
Trade and other payables 22 300,094 300,094 301,866 295,858 295,858 298,420 198,366
Provisions 23 21,989 22,079 176,916 29,536 29,713 199,551 201,299Pensions 24 1,834 1,834 75,772 1,778 1,778 148,717 244,757Total non current liabilities
323,917 324,007 554,554 327,172 327,349 646,688 644,422
Assets less liabilities (1,107,753) (1,106,037) 614,097 (460,598) (460,746) 1,406,763 1,405,517
Taxpayers' equityGeneral reserve (1,126,718) (1,125,014) 467,894 (479,060) (479,221) 1,373,138 1,439,170Revaluation reserve 19,073 19,085 221,107 18,462 18,475 180,182 206,245Pension reserve (108) (108) (74,904) - - (146,557) (239,898)
Total taxpayers' equity (1,107,753) (1,106,037) 614,097 (460,598) (460,746) 1,406,763 1,405,517
Sir Bob Kerslake 27 June 2012 Accounting Officer Department for Communities and Local Government The Notes on pages 108-162 form part of these accounts.

Department for Communities and Local Government Accounts 2011-12 Consolidated Statement of Cash Flows
104
Consolidated Statement of Cash Flows For the year ended 31 March 2012
£’000
Note 2011-12 2010-11restated
Cash Flows from Operating ActivitiesNet Operating Cost SoCNE (25,929,537) (36,700,017)Movements in receivables not passing through the SoCNE (178,449) (20,179)Movements in payables not passing through the SoCNE (5,008) 75,067Cash utilisation of provisions 23 (65,153) (30,076)Non cash movement in provisions (excluding utilisation) (8,272) (52,569)Movement on non current asset accruals & payables 45 -(Increase)/Decrease in trade and other receivables 20 466,069 (92,681)Increase/(Decrease) in trade payables 22 350,666 124,218Depreciation and amortisation 8,9 27,213 31,719Revaluation movement (through the SoCNE) 295 (7,039)Interest - (208)Impairments 8,9 90,424 63,491Loss on disposal 8,9 9,922 54,410Other non-cash transactions 8,9,10,11 9,853 71,178(Additions) of inventories 19 (307,598) (87,526)Disposal of inventories 19 282,142 197,681Impairment of inventories through the SoCNE 19 85,089 167,683Pension costs 19 - (65,343)Pension movements - non cash 24 (96,621) -Income and Corporation Tax (20,462) 11,230Net Cash outflow from operating activities (25,289,382) (36,258,961)
Cash flows from Investing ActivitiesPurchase of property, plant and equipment 12 (19,227) (114,813)Purchase of intangible assets 13 (2,190) (3,716)Purchase of additions to financial assets 16 (114,534) (143,338)Proceeds from disposal of property, plant and equipment 12 31 64Proceeds from disposal of intangible assets 13 - 2Proceeds on disposal of financial assets 16 31,990 15,549Repayments from other bodies 221,882 16,167Loans to other bodies 14 (12,127) (53,148)Interest 8,9 7 (96)Finance Lease repayments - 6Capital and other financial investments - (7,351)Net Cash inflow / (outflow) from investing activities 105,832 (290,612)
8

Department for Communities and Local Government Accounts 2011-12 Consolidated Statement of Cash Flows
105
Consolidated Statement of Cash Flows (continued) For the year ended 31 March 2012
£’000
Note 2011-12 2010-11restated
Cash Flows from FinancingFrom the consolidated fund (supply) - current year 31,824,505 37,626,961Advances from the contingencies fund 34 -Repayments to the contingencies fund (34) -NNDR non-supply funding - 9,323Receipt of non operating CFERs 389 2,670Capital element of payments in respect of finance leases and on-balance sheet PFI contracts (897) (844)
Other adjustments - financing activities (75) 2,093Interest paid - 1Finance charge on pension scheme 1,635 -Net Financing 31,825,557 37,640,204
Net increase/decrease in cash and cash equivalents in the period before adjustment for receipts and payments to the Consolidated Fund 6,642,007 1,090,631
Cash flow from Non-Financing activitiesReceipts due to the Consolidated Fund which are outside the scope of the Department's activities (2,578) (533)
Payments due to the Consolidated Fund (6,665,038) (122,819)Other balances surrenderable to the Consolidated Fund - (902,866)Net Non-Financing (6,667,616) (1,026,218)
Net increase/decrease in cash and cash equivalents in the period after adjustment for receipts and payments to the Consolidated Fund (25,609) 64,413
Cash and cash equivalents at the beginning of the period 319,365 254,952
Cash and cash equivalents at the end of the period 293,756 319,365 The Notes on pages 108-162 form part of these accounts.

Department for Communities and Local Government Accounts 2011-12 Consolidated Statement of Taxpayers’ Equity
106
Consolidated Statement of Changes in Taxpayers’ Equity For the year ended 31 March 2012
£’000 Note General Fund Revaluation
ReservePension Reserve Total Reserve
Balance at 31 March 2010 815,081 165,480 (239,898) 740,663Change in relation to Machinery of Government changes 624,089 40,765 664,854Restated Balance at 1 April 2010 1,439,170 206,245 (239,898) 1,405,517
Changes in taxpayers' equity for 2010-11Net gain / (loss) on revaluation of property, plant and equipment 12 - 150 - 150Net gain / (loss) on revaluation of inventories 19 - (42,466) - (42,466)Release of reserves to the operating cost statement SoCNE (1,024) - - (1,024)Deferred tax movements (14,740) - - (14,740)Transfers between reserves (58,840) (6,312) 65,152 -Recognition of Actuarial gains/losses 24 - - 28,189 28,189Net operating cost for the year SoCNE (36,700,017) - - (36,700,017)Additions - other reserves 14,366 - - 14,366Tax charge/credit on revaluations - 22,337 - 22,337Total comprehensive expenditure (36,760,255) (26,291) 93,341 (36,693,205)Non-cash charges - auditor's remuneration 8,9 455 - - 455Other adjustments to reserves 4 (3) -Impairments 8,9 - 231 - 231Total recognised income and expense for 2010-11 (36,759,796) (26,063) 93,341 (36,692,518)
Net Parliamentary Funding - drawn down 37,626,961 - - 37,626,961Net Parliamentary Funding - deemed supply 216,043 - - 216,043Supply receivable from the Consolidated Fund (142,207) - - (142,207)Supply payable to the Consolidated Fund (211,331) - - (211,331)Other balances surrenderable to the Consolidated Fund (902,865) - - (902,865)Other General Fund Movements - Transfer of Assets 213 - - 213Other General Fund Movements - Other non-asset and liability transfer 106,950 - - 106,950Sub Total 36,693,764 - - 36,693,764
Balance at 31 March 2011 1,373,138 180,182
1
(146,557) 1,406,763Changes in taxpayers' equity for 2011-12Net gain / (loss) on revaluation of property, plant and equipment 12 - 1,438 - 1,438Net gain/(loss) on revaluation of inventories - 72,023 - 72,023Release of reserves to the operating cost statement SoCNE (3,330) - - (3,330)Deferred tax movements 2,814 - - 2,814Transfers between reserves (91,272) (12,872) 104,144 -Recognition of Actuarial gains/losses 24 - - (32,491) (32,491)Net operating cost for the year SoCNE (25,929,537) - - (25,929,537)Change arising from revaluations (17,108) - - (17,108)Tax charge/credit on revaluations - (19,668) - (19,668)Total comprehensive expenditure (26,038,433) 40,921 71,653 (25,925,859)Non-cash charges - auditor's remuneration 8.9 663 - - 663Other adjustments to reserves (505) 4 - (501)Total recognised income and expense for 2011-12 (26,038,275) 40,925 71,653 (25,925,697)
Net Parliamentary Funding - drawn down 31,824,505 - - 31,824,505Net Parliamentary Funding - deemed supply 142,207 - - 142,207Supply payable to the Consolidated FundSupply payable for 2011-12 (528,503) - - (528,503)Supply adjustment to reserves 174,236 174,236CFERs payable to the consolidated fund (6,479,414) - - (6,479,414)Sub Total 25,133,031 - - 25,133,031
Balance at 31 March 2012 467,894 221,107 (74,904) 614,097

Department for Communities and Local Government Accounts 2011-12 Consolidated Statement of Taxpayers’ Equity
107
Core Department and Agency Statement of Changes in Taxpayers’ Equity For the year ended 31 March 2012
£’000 Note General Fund Revaluation
ReservePension Reserve Total Reserve
Balance at 31 March 2010 (455,901) 19,399 (436,502)Change in relation to Machinery of Government changes 18,040 18,040Restated Balance at 1 April 2010 (437,861) 19,399 (418,462)
Changes in taxpayers' equity for 2010-11Net gain / (loss) on revaluation of property, plant and equipment 12 - 231 - 231Transfers between reserves 1,100 (1,100) - -Net operating cost for the year SoCNE (36,736,474) - - (36,736,474)Total comprehensive expenditure (36,735,374) (869) (36,736,243)Non-cash charges - auditor's remuneration 8,9 455 - - 455Other adjustments to reserves 8 (55) - (47)Total recognised income and expense for 2010-11 (36,734,911) (924) - (36,735,835)
Net Parliamentary Funding - drawn down 37,626,961 - - 37,626,961Net Parliamentary Funding - deemed supply 216,043 - - 216,043Supply receivable from the Consolidated Fund (142,207) - - (142,207)Supply payable to the Consolidated Fund (211,331) - - (211,331)Other balances surrenderable to the Consolidated Fund (902,865) - - (902,865)Other General Fund Movements - Other non-asset and liability transfer 106,950 - - 106,950
Sub Total 36,693,551 36,693,551
Balance at 31 March 2011 (479,221) 18,475 (460,746)Changes in taxpayers' equity for 2011-12Net gain / (loss) on revaluation of property, plant and equipment 12 - 1,275 - 1,275Transfers between reserves 667 (667) - -Recognition of Actuarial gains/losses 24 - - (108) (108)Net operating cost for the year SoCNE (25,779,942) - - (25,779,942)Total comprehensive expenditure (25,779,275) 608 (108) (25,778,775)
Non-cash charges - auditor's remuneration 8.9 663 - - 663Other adjustments to reserves (212) 2 - (210)Total recognised income and expense for 2011-12 (25,778,824) 610 (108) (25,778,322)
Net Parliamentary Funding - drawn down 31,824,505 - - 31,824,505Net Parliamentary Funding - deemed supply 142,207 - - 142,207Supply payable to the Consolidated FundSupply payable for 2011-12 (528,503) (528,503)Supply adjustment to reserves 174,236 - - 174,236CFERs payable to the consolidated fund (6,479,414) - - (6,479,414)Sub Total 25,133,031 25,133,031
Balance at 31 March 2012 (1,125,014) 19,085 (108) (1,106,037) Note: The line ‘Supply adjustment to reserves’ relates to the overstatement of supply payable to the Consolidated Fund in previous years with a cumulative total of £174,236k. Parliamentary funding is on a cash basis so the year end Supply payable figure becomes the in-year deemed supply figure for the following year. Therefore the overstatement is corrected within 2011-12 rather than as a prior period adjustment. The Notes on pages 108-162 form part of these accounts.

Department for Communities and Local Government Accounts 2011-12 Notes to the Departmental Accounts
108
Notes to the Departmental Accounts Note 1. Statement of Accounting Policies
General N1.1. These consolidated financial statements have been prepared in accordance with the
Accounts Direction issued by HM Treasury under section 5 (2) of the Government Resources and Accounts Act 2000.
N1.2. The accounting policies adopted are in accordance with the 2011-12 Government Financial Reporting Manual (FReM) issued by HM Treasury which apply International Financial Reporting Standards (IFRS) as adapted or interpreted for the public sector context. Where the FReM permits a choice of accounting policy, the accounting policy which has been judged to be most appropriate to the particular circumstances of the Department for Communities and Local Government group (the department) for the purpose of giving a true and fair view has been selected. The particular policies adopted by the group are described below. They have been applied consistently in dealing with items that are considered material to the accounts.
N1.3. In addition to the primary statements prepared under IFRS, the FReM also requires the department to prepare an additional primary statement; The Statement of Parliamentary Supply. This Statement, and associated supporting notes, shows outturn against Estimate in terms of the net resource requirement and the net cash requirement.
N1.4. These financial statements represent the department’s first time adoption of a change in the consolidation boundary; bodies outside of the core department and executive agency have been designated for consolidation by statutory instrument with agreement of HM Treasury. An explanation of the effect of the transition is given in section 7 of the other financial information on page 70 of these financial statements with the financial impact being reflected in Note 32.
N1.5. The Group Financial Statements incorporate those of the departmental group and subsidiary bodies of members of the group. The group’s associated undertakings are bodies in which a member of the group has a participating interest and over whose operating and financial policy it exercises significant influence. The group’s joint ventures are all undertakings in which the group exercises joint control. In the Group Financial Statements, investments in associates are accounted for using the equity method. The consolidated Statement of Comprehensive Net Expenditure includes the group’s share of associates’ profits less losses while its share of net assets of associates is shown in the consolidated Statement of Financial Position. HCA’s share of net assets and profit information is based on unaudited Financial Statements or management information to 31 March 2012 except for Priority Sites Limited and English Cities Fund. For these associates, Financial Statements to 31 December 2011 have been used because these do not generally produce significantly different results and are prepared to a reporting date within three months of that of HCA. Significant transactions following this date have been adjusted for. The department considers that all subsidiaries, associates and joint ventures are properly included in the consolidation under the terms of IAS 27, 28, 31 the FReM and the 2011-12 Designation Order.
Accounting convention N1.6. These accounts have been prepared under the historical cost convention modified to
account for the revaluation of property, plant and equipment, investment properties, inventories and certain financial assets and liabilities.

Department for Communities and Local Government Accounts 2011-12 Notes to the Departmental Accounts
109
Significant estimates and judgements N1.7. During the preparation of these accounts significant estimates and judgements were made
in respect of :
• The determination of the market value of property/development assets. By its nature, this process involves a significant amount of estimation uncertainty, particularly given the complexity of some of the Group’s properties, and the current market conditions. Valuations are performed by qualified valuers with independent external valuers appointed for the majority of the portfolio’s value and also to value complex properties.
• Available for sale financial assets (HCA) are valued using either published regional house price indices or cash flow forecasts, depending on the scheme. However these only provide an estimate of the fair value of these assets because house price indices cannot accurately predict the value of individual units, and cash flow forecasts by their nature are based on estimates.
• The provision for additional consideration on development land is calculated by estimating the profits from, and timing of, future land disposals. These estimates are based on current market conditions and HCA’s current plans for utilisation of the site and any provision included within ‘other’ provisions.
• During the preparation of these accounts significant estimates and judgements were made in respect of the 2000-06 ERDF programmes, particularly assessments of the extent to which grant expenditure is eligible for grant . Details are in section 7 of the management commentary.
Changes in accounting policies N1.8. The department has made the following changes to accounting policies during the year. The
FReM withdraws the option of offsetting a government grant against the cost of an asset. The option provided in International Accounting Standard (IAS) 20 to defer grant income related to an asset is restricted to income where the funder imposes a condition that the future economic benefits embodied in the grant are consumed as specified by the grantor or must be returned to them. The option to recognise a donated asset through reserves has also been removed by the FReM. The impact of the removal of Government Grant and Donated Asset reserve has been reflected within these statements and the prior year comparators restated to reflect the change in accounting policy. There is no impact on the DCLG group in 2011-12.
N1.9. The department has assessed the following standards, amendments and interpretations that have been issued but are not yet effective and determined not to adopt them before the effective date when adoption would be required on the grounds that the changes would have no, or an immaterial, effect on these accounts and would not provide additional information that would aid the reader:
• IAS 1 Presentation of Financial Statements – Other Comprehensive Expenditure
• IAS 12 Deferred Tax – recovery of underlying assets.
• IAS 19 Post-Employment Benefits – presentation and disclosures concerning defined benefit plans
• IFRS 3 -Business combinations o Amendments resulting from May 2010 Annual improvements
• IFRS 7 Financial instruments disclosures o Disclosures about transfer of financial assets o Enhancing disclosures about offsetting assets and liabilities

Department for Communities and Local Government Accounts 2011-12 Notes to the Departmental Accounts
110
o Enhancing disclosures about initial application of IFRS 9 o Classification and measurement of financial assets
• IFRS 9 Financial Instruments o Classification and measurement of financial assets o Accounting for liabilities and deregulation
• IFRS 10 - Consolidated Financial Statements
• IFRS 11 - Joint Arrangements
• IFRS 12 - Disclosure of interests in other entities
• IFRS 13 - Fair Value Measurement
Basis of consolidation N1.10. These accounts comprise a consolidation of the core department, the departmental agency
(the Planning Inspectorate – PINS) and those arms length bodies which fall within the departmental boundary as defined by the FReM and make up the ‘departmental group’. Transactions between entities included in the consolidation are eliminated.
N1.11. During 2010-11 the Community Development Foundation (CDF) was a departmental NDPB and a charity. It closed with effect from 31 March 2011 transferring its remaining functions to a new body in the charity sector. CDF is not included in the Designation Order for 2011-12 and therefore the accounts of CDF are not consolidated into these accounts. Transactions between the CDF and other members of the departmental group have not been eliminated either in 2011-12 or 2010-11.
N1.12. The Leasehold Advisory Service and Firebuy are departmental NDPBs included in the consolidation and are also companies. These bodies prepare accounts in accordance with the Companies Act 2006 and in accordance with UK GAAP rather than IFRS. There are no material differences arising from the use of UK GAAP rather than IFRS by these bodies. Firebuy entered voluntary liquidation on 13 July 2011 and transactions before that date and incurred by the liquidators on behalf of Firebuy after that date have been included in these accounts. The Independent Housing Ombudsman is also a company producing accounts in accordance with the Companies Act 2006, but it has adopted International Accounting Standards and prepares accounts in accordance with the FReM so there are no differences in policies.
N1.13. The Department for Communities and Local Government (DCLG) is the parent of the departmental group. These 2011-12 Accounts are the first consolidated accounts produced for the DCLG group. Where appropriate restated 2010-11 and 2009-10 comparative figures are also shown. Where material, accounting policies of the group have been aligned.
N1.14. Note 36 includes a list of departmental entities showing those inside and outside the departmental accounting boundary.
Operating segments N1.15. During 2010-11 the previous performance regime of Public Service Agreements (PSAs) and
Departmental Strategic Objectives (DSOs) was ended and departments are now required to apply the terms of IFRS 8 Operating Segments. IFRS 8 requires that segments are determined based on the entity’s business model including the reporting of information to business decisions makers. Although interlocking the department’s objectives are separated into three components for management reporting and decision making purposes and it has therefore determined that it has three operating segments: Localism, Neighbourhoods and Local Economies, Regeneration and European Programmes.
N1.16. The department manages administration expenditure as a separate component and does not apportion such costs to its three segments. In line with IFRS 8 therefore it would not be

Department for Communities and Local Government Accounts 2011-12 Notes to the Departmental Accounts
111
appropriate to apportion administration costs to segments for segmental reporting purposes. Furthermore administration (overhead) expenditure is not valid as a segment in its own right, since it does not directly impact on performance, and it is not therefore reported as a separate segment. Therefore, in accordance with IFRS 8, not all the department’s net expenditure is allocated to segments. Details of expenditure and income against these segments are reported in Note 6.
N1.17. As the department is a central government funded body, there is no requirement to raise funds and maintain shareholder value. Therefore, the department does not manage its assets in the same way as the private sector and does not rely on different segments to contribute towards profit by optimising use of assets. Therefore, the department does not report a segmental analysis of net assets.
Property, plant and equipment N1.18. Property, Plant and Equipment assets are reported under IAS 16. Where appropriate
information technology software and development assets have been reported as Intangible Assets under IAS 38 and some buildings and land assets have been reported as Investment Properties under IAS 40.
N1.19. Title to the freehold land and buildings shown in the accounts and recorded as property, plant and equipment and shown in these accounts under core department and agency is held by the Secretary of State. Otherwise title is held by the relevant NDPB.
N1.20. Non-current assets are held at fair value as described in more detail in the paragraphs below.
N1.21. Freehold land and buildings are restated at current value using full professional valuations undertaken every five years in accordance with Royal Institution of Chartered Surveyors (RICS) guidance and IAS 16. In intermediate years such properties are restated at amounts assessed by professional valuers using appropriate indices and other factors relevant to the locality. The department has determined that, given that property asset values are not material, this approach gives an acceptable approximation to fair value. Non-property assets disclosed as property, plant and equipment assets are stated at depreciated historical cost revalued annually using appropriate indices published by the Office for National Statistics. In some NDPBs depreciated historical cost is considered an acceptable proxy for fair value and so property, plant and equipment assets are not restated using indices. Assets under construction are held at the accounting date at their historical cost until they become operational and are not revalued.
N1.22. Upward revaluations of non-current assets are credited to the revaluation reserve in the year of revaluation and downward revaluations are charged to the revaluation reserve except where to do so would result in debit balances for the relevant assets on the reserve in which case, the excess amount over the amount realiseable in the reserve, is charged to the Statement of Comprehensive Net Expenditure (SoCNE). Impairments in property plant and equipment are charged to the SoCNE except where the impairment is due to fluctuations in the market, in which case the treatment is the same as for revaluations.
N1.23. The core department's capitalisation threshold is £5,000. Other entities use capitalisation thresholds between £1,500 and £5,000 depending on their circumstances. These differences have no material impact on the asset values reported in these accounts. There is no minimum threshold in respect of land assets.
N1.24. The department allows grouping of items (including assets under construction) as follows:
• Information technology: Networked computer infrastructure; Strategic IT equipment;
• Plant and machinery: Telecommunications assets; Civil resilience strategic material; and

Department for Communities and Local Government Accounts 2011-12 Notes to the Departmental Accounts
112
• Furniture and fittings: Furniture assets purchased as part of a refurbishment project.
N1.25. Where the department replaces key components of grouped assets, the replacement is depreciated over the remaining useful life of the asset. Where regular maintenance is performed, this is expensed during the year.
N1.26. No depreciation is provided on freehold land as it has an unlimited or very long estimated useful life.
N1.27. In accordance with IAS 16 depreciation is provided at rates calculated to write off the valuation of buildings and other property, plant and equipment assets on a straight-line basis over their estimated useful lives. Assets under construction are not depreciated until the asset is brought into use. Asset lives are in the following ranges:
• Buildings 50 years or length of lease • Information Technology & Strategic Information Technology 2 to 10 years • Plant and Machinery 3 to 15 years • Motor Vehicles 5 to 10 years (unspecialised) 5 to 30 years (specialised) • Furniture and Fittings 2 to 10 years
Intangible assets N1.28. Intangible assets comprise the capitalised value of systems developed in-house or bought in
software, software licences and systems under development. Intangible assets are valued at cost less amortisation and impairment. Intangible assets are not revalued; the department considers the amortised replacement cost basis of valuation is not materially different from fair value.
N1.29. The core department's capitalisation threshold for intangible assets is £5,000. Other entities use capitalisation thresholds between £1,500 and £5,000 depending on their circumstances. These differences have no material impact on the asset values reported in these accounts.
N1.30. Costs incurred on internally generated intangible assets are recorded as systems under development. On completion of the development, or at such intermediate stage whereby the development is partially in use for its intended purpose, the asset is treated as live and the costs transferred to intangible assets as software.
N1.31. In accordance with IAS 38, software and software licences are amortised on a straight line basis over the shorter of the term of the licence and the useful economic life (3 to 10 years as appropriate). Systems under development are not amortised.
Investments N1.32. The core department’s financial interests in public sector bodies, which are outside the
departmental boundary, are treated as investments since they are held for the long term. These investments comprise Public Dividend Capital (PDC) of the QEII Conference Centre, Coalfields Growth and Enterprise Funds and the Fire Service College, and loans issued to the Fire Service College. The QEII Conference Centre and Fire Service College are Trading Funds outside the departmental accounting boundary. Under paragraph 9.2.4 of the FReM PDC is excluded from the Financial Instruments Standards and PDC is, therefore, included at historical cost less impairments. Loans to public sector bodies are valued at nominal value in accordance with the FReM. Coalfields Growth and Enterprise Funds are valued every quarter by Fund Managers and the impact of year end valuations recognised in the Statement of Comprehensive Net Expenditure.

Department for Communities and Local Government Accounts 2011-12 Notes to the Departmental Accounts
113
N1.33. Departmental NDPBs have a number of investments in other bodies either as loans or equity. The values of these investments in associates and joint ventures are recognised at cost less provision for impairment.
N1.34. Where possible the share of net asset and profit information is based on audited Financial Statements to 31 March 2012. Unaudited or Financial Statements to 31 December 2011 have been used where audited March Statements are not available because these do not generally produce significantly different results and are prepared to a reporting date within three months of that of the department.
Available for sale financial assets N1.35. The department’s available for sale financial assets are interests in future sales proceeds of
properties bought with financial assistance from the Homes and Community Agency. The HCA provides financial assistance to home buyers to buy a share in a new build home. The buyer must contribute a minimum of 50% of the full purchase price of the property and the HCA will assist with up to 50% of the full property price. The assistance is paid to the participating housebuilder, not the buyer. However, as part of the sales agreement, the HCA has an entitlement to a share of the future sales proceeds which will be equal to the initial percentage contribution. This is secured by a second charge on the property and enables the HCA to share future sale proceeds. In accordance with IAS39, the investments are stated at fair value and classified as available for sale financial instruments. The HCA also makes investments in certain private sector developments, where the returns are based on a share of the profitability of the scheme. These investments are also classified as available for sale and are stated at fair value.
N1.36. Gains and losses arising from changes in fair value are recognised directly in reserves, except for impairment losses which are recognised in the SoCNE. On disposal of the asset the cumulative gain or loss previously recognised in reserves is included in the SoCNE for the period.
Investment properties N1.37. The QEII Conference Centre operates as a Trading Fund but the department has freehold
ownership of the QEII Conference Centre land and building. The department also has freehold ownership of the Burlington Houses which are let to tenants. As these properties are not utilised by departmental staff or in delivery of departmental objectives they are considered as Investment Properties under the terms of IAS 40.
N1.38. Investment properties are restated at fair value at the accounting date using annual professional valuations in accordance with IAS 40 and Royal Institution of Chartered Surveyors (RICS) guidance. Fair value equates to market value and valuation is based on the properties’ current use and on the assumption that the current use will be maintained as part of a continuing business on a going concern basis and would be exchanged as part of the exchange of all the assets of the business.
N1.39. Changes arising from revaluations are taken direct to the SoCNE. Investment properties are not depreciated.
Financial assets N1.40. All non-derivative financial assets are initially measured at fair value and, where non current,
subsequently measured at amortised cost. N1.41. Financial assets consist of investments, available for sale assets, trade and other
receivables, non-property inventories, cash and cash equivalents and other financial assets. Financial assets are classified as current assets unless settlement is expected to be at least twelve months after the end of the reporting period.

Department for Communities and Local Government Accounts 2011-12 Notes to the Departmental Accounts
114
Loans N1.42. Loans are shown at amortised cost using the effective interest rate and are included within
non-current assets.
Trade and other receivables N1.43. Trade and other receivables are financial assets with fixed or determinable payments that
are not quoted in an active market. Trade and other receivables are measured at amortised cost less provisions for bad debts. The net of these balances are classified as either current or non-current ‘trade and other receivables’ in the consolidated Statement of Financial Position.
N1.44. To reflect the time value of money the valuation of non-current receivables is adjusted by discounting the estimated risk-adjusted cash flows using the real rate set by HM Treasury (currently 2.2%) in accordance with the terms of IAS 39.
N1.45. Under the 2007-13 European Regional Development Fund Programmes the department received advance funding from the European Union at the start of the programme period. The amounts concerned represented 7.5% of the total value of the 2007-13 ERDF Programmes in England. These advance payments were paid over to the Regional Development Agencies (RDA) which, until 30 June 2011, managed the programmes on behalf of the department. The amounts paid to each RDA were in proportion to its share of the programme and, with the exception of the London Development Agency, were repaid to the department during 2011-12 consequent to the decision to transfer management of delivery of the ERDF programmes from the RDAs to the department. The discounting applied to the advances was unwound on repayment.
Inventories Development Assets
N1.46. Property assets, held for development purposes and consisting of land and buildings, are treated as inventories under the terms of the FReM and IAS2. IAS2 requires that inventories are valued at the lower of cost and net realisable value and the department’s policy is to value these inventories at fair (market) value, as allowed by the FReM. The department considers such values are an acceptable approximation of net realisable value. A valuation of the whole portfolio is carried out at the end of each financial year by qualified valuers (who might be internal or external), with independent external valuers appointed to perform the majority of the portfolio’s value and also to value complex properties. In all cases the valuations were in accordance with the Statement of Asset Valuation and Guidance Notes (6th Edition) published by the Royal Institution of Chartered Surveyors.
N1.47. Each asset has an individual calculation in order to calculate the net gain or loss on each site following the revaluation. Any increase above historical cost is taken to the revaluation reserve whilst losses are written off against the reserve up to the value of the credit balance in the reserve and are shown in the Statement of Comprehensive Net Expenditure thereafter as an impairment charge. A write back of an impairment charge may occur if the value of an asset increases up to a maximum of its historical cost. Upon disposal of a development asset, any revaluation reserve relating to that asset is transferred to the general reserve.
N1.48. Income (net of VAT) from the disposal of development property assets is recognised when there is a legally binding sale agreement, which has become unconditional and irrevocable by the end of the reporting period, subject to any provisions necessary to cover residual commitments relating to the property.
N1.49. Where proceeds are receivable over a period of more than 12 months after the end of the reporting period, the proceeds are discounted at the Treasury discount rate of 2.2% to reflect the net present value of the receipts. The corresponding receivable is also discounted and

Department for Communities and Local Government Accounts 2011-12 Notes to the Departmental Accounts
115
the difference between actual cash receipts and the net present value of the receipts is credited to interest receivable over the life of the debt. ERDF Work in Progress
N1.50. Claims for payment to ERDF projects are initially charged against work in progress and only recognised as expense once certified as compliant with the ERDF Regulations such that the related ERDF income can be recognised. Where any amounts charged to work in progress subsequently fail certification recovery of the cost is sought from projects. Work in progress is valued at the lower of cost and net realisable value.
Cash and cash equivalents N1.51. In accordance with IAS 7 cash comprises cash in hand, demand deposits and cash
equivalents which comprise highly liquid investments that are readily convertible to known amounts of cash and where there is an insignificant risk of changes in value. These items are reported as cash and cash equivalents in the consolidated Statement of Financial Position.
Financial liabilities N1.52. All non-derivative financial liabilities are initially measured at fair value and subsequently
measured at amortised cost. N1.53. Financial liabilities consist of trade and other payables, finance lease payables and
provisions. Financial liabilities are classified as current liabilities unless the department has an unconditional right to defer settlement for at least twelve months after the end of the reporting period.
Trade and other payables N1.54. Under both the 2000-06 and the 2007-13 ERDF Programmes the department received
advance funding from the European Union at the start of the programme period. The advance payments are either used up in support of eligible grant expenditure or, if not so utilised, will be returned by the department to the EU at the end of the programme period. There are no other Regulations which require the repayment of the advances. Accordingly the advance payments when received are treated as long term payables in the department’s accounts. However the 2000-06 programmes are closing and no further grant payments are being made. The remaining balances relating to advances for the 2000-06 programmes held by the department have, therefore, been transferred to current liabilities.
N1.55. The advances are paid by the EU in Euros and translated to Sterling when received by HM Treasury using the spot rate applied to such translations on the date of receipt.
N1.56. To reflect the time value of money the valuation of non-current payables is adjusted by discounting the estimated risk-adjusted cash flows using the real rate set by HM Treasury (currently 2.2%) in accordance with the terms of IAS 39. This adjustment is made to the Euro values which are then translated to Sterling at the Bank of England spot rate applicable at the period end date in accordance with IAS 21.
Research and development expenditure N1.57. Expenditure on research and development, other than development expenditure specifically
incurred in the development of IT systems recorded as Intangible non-current assets under IAS 38 (see Note N1.28), is treated as programme expenditure in the SoCNE in the year in which it is incurred.
Administration and programme expenditure N1.58. Income and expenditure reported in the SoCNE is analysed between administration and
programme. The classification of income and expenditure as administration or as programme follows the definitions set by HM Treasury.

Department for Communities and Local Government Accounts 2011-12 Notes to the Departmental Accounts
116
N1.59. Income and expenditure of the Planning Inspectorate and NDPBs was categorised as programme in 2010-11. Changes have been made to the administration cost regime for 2011-12 whereby PINS and NDPB income and expenditure is split between administration and programme. Notes 2, 7, 8, 9, and 10 and the Consolidated Statement of Comprehensive Net Expenditure reflect the new definitions and 2010-11 comparatives have been restated.
Operating income N1.60. Income is recorded on an accruals basis at the transacted amounts, or the amounts at which
customers are committed to pay. N1.61. Some departmental NDPBs included within these accounts have statutory authority to
determine planning applications within their area. They receive a fee for applications lodged and monies received are recorded as deferred income. Planning fee receipts are recognised as income over the period from receipt of application to final determination.
N1.62. Operating income is income which relates directly to the operating activities of the department. It principally comprises EU income, fees and charges for services provided on a full-cost basis to external customers, public repayment work and income from investments.
N1.63. Operating income includes certain income payable to the Consolidated Fund in accordance with the FReM requirements.
Value Added Tax N1.64. Most of the activities of the department are outside the scope of VAT and, in general, output
tax does not apply. But some NDPBs have trading activities where VAT is charged at the prevailing rate and where related input VAT costs are deemed recoverable. Input VAT is also recovered on certain contracted-out services.
N1.65. Irrecoverable VAT is charged to the relevant expenditure category or, if appropriate, capitalised with additions to fixed assets. Where output tax is charged or input VAT is recoverable, the amounts are stated net of VAT.
Corporation Tax N1.66. The core department is not subject to Corporation Tax. However, NDPBs may incur
Corporation Tax on profits from activities considered as trading, for instance rental income from land and buildings acquired for regeneration purposes.
N1.67. The tax charge represents the sum of current tax and deferred tax. Both current and deferred Corporation Tax are recognised in the SoCNE except to the extent that they relate to items recognised directly in taxpayers’ equity, in which case they are recognised in taxpayers’ equity.
N1.68. Current tax is the expected tax payable on the taxable surplus for the year, based on tax rates that have been enacted or substantively enacted by the end of the reporting period, and any adjustment to tax payable in respect of previous years.
N1.69. Deferred tax is the tax expected to be payable or recoverable in the future arising from temporary differences between the carrying amounts of assets and liabilities for financial reporting purposes and the amounts used for income tax purposes. Deferred tax is calculated at the tax rates expected to apply in the period when the liability is settled or the asset realised, based on tax rates that have been enacted or substantively enacted by the end of the reporting period.
N1.70. A deferred tax asset is recognised only to the extent that it is probable that future taxable surpluses will be available against which the temporary differences can be utilised.
Foreign exchange N1.71. The departmental group functional and presentational currency is Sterling.

Department for Communities and Local Government Accounts 2011-12 Notes to the Departmental Accounts
117
N1.72. Transactions in foreign currencies are recorded in Sterling at the rate of exchange ruling at the date of the transaction. ERDF balances in the department’s SoFP which are Sterling equivalents of a Euro amount are translated at the accounting date at the spot rate in accordance with IAS 21. Translation differences are taken to the SoCNE.
Pensions and other employee benefits N1.73. Past and present employees of the core department and agency are covered by the
provisions of the Principal Civil Service Pension Scheme (PCSPS). This comprises several schemes which are unfunded defined benefit schemes with varying contribution rules and rates. The department recognises the expected cost of employers’ contributions on a systematic basis over the period during which it benefits from employees' services by payments to the PCSPS of amounts calculated on an accruals basis. Liability for payment of future benefits is a charge on the PCSPS and not recognised in these accounts. In respect of the defined contribution scheme, the department recognises the contributions payable for the year.
N1.74. Employees of NDPBs are generally members of funded defined benefit schemes shared with other employers. These schemes are valued and where separate shares of assets and liabilities can be identified the actuaries estimate the employer’s share of underlying assets and liabilities on a consistent and reasonable basis. For these schemes, plan assets are measured at fair value, and liabilities are measured on an actuarial basis and discounted to present value. The net obligation is recognised as a liability within provisions for pensions. The operating and financing costs of these schemes are recognised separately in the SoCNE. Service costs are spread over the working lives of employees and financing costs are recognised in the period in which they arise. Actuarial gains and losses are recognised directly in other comprehensive expenditure in full. More details of individual schemes are available in the annual accounts of the bodies concerned.
N1.75. The department accrues for short-term employee benefits (which fall due within twelve months of the period in which they are earned). The department is required to pay, as termination benefits, the additional cost of benefits, beyond the normal PCSPS benefits, in respect of employees who retire early, unless the retirements are on approved medical grounds. The department provides for the full cost of benefits (including pensions payable up to the normal retirement age and lump sums) when it becomes demonstrably committed to providing those benefits.
Grants payable N1.76. Grants made by the department are recorded as expenditure in the period that the
underlying event or activity giving entitlement to the grant occurs, or with unringfenced grants on the occurrence of such other event giving rise to entitlement.
N1.77. Grant in Aid payments from the department to NDPBs are paid only when the need for cash has been demonstrated by the body concerned. NDPBs treat receipts of Grant in Aid as financing. These transactions are eliminated on consolidation.
N1.78. Grant may need to be recovered from recipients for a variety of reasons depending on grant conditions. Where recoveries are made income is recognised at the point that the invoice, or other notice requiring repayment, has been issued.
N1.79. In 2011-12 a new grant – Local Services Support grant (LSSG) – was set up. The department manages this for other central departments in a similar way to Area Based Grant. Receipts from other departments and payments of the associated grants to Local Authorities are accounted for on an agency basis and are not taken through the department’s SoCNE.
N1.80. Under the Local Government Finance Act 1988, National Non-domestic Rates (NNDR) are to be paid to the Secretary of State who is then required to redistribute them to local authorities in accordance with the methodology set out each year in the Local Government

Department for Communities and Local Government Accounts 2011-12 Notes to the Departmental Accounts
118
Finance Report (England) made under section 78A of the Act. The non-domestic rates are thus, in effect, pooled and redistributed. The operation of the pool is governed by Schedule 8 to the 1988 Act and regulations made under section 141. A White Paper Account, published separately, shows the aggregate cash movements and demonstrates the working of the pool.
N1.81. The department acts as an agent for the Consolidated Fund in respect of NNDR receivable which is paid over to the Consolidated Fund. These receipts do not flow through the department’s Statement of Comprehensive Net Expenditure but instead are held on the Statement of Financial Position as a liability until paid over to the Consolidated Fund. Transactions and balances appear in a Trust Statement recording collections received and paid over to the Consolidated Fund account or in these accounts. This Trust Statement is included in pages 163 to 174 of these accounts.
N1.82. The department makes NNDR grant payments to local authorities in lieu of business rates according to a set formula. The amounts of grant payable are included in the department’s Consolidated Statement of Comprehensive Net Expenditure for the year, together with adjustments to the previous year’s grant which are recognised and payable only once the amounts due are calculated, audited and the entitlement established.
N1.83. The department acts as Managing Authority for ERDF in England. The 2000-06 programme is now complete and will be closed once the department has agreed the final position on each programme with the European Commission. Until this process is complete deferred income, accrued income and receivables balances relating to the 2000-06 programme remain on the department’s Statement of Financial Position. The 2007-13 programme is active and from 1 July 2011 the department took on the detailed management of the programme from the Regional Development Agencies. Expenditure is incurred on projects which submit grant claims to the department and these are paid after appropriate checks. However, the department does not recognise expenditure until the claims are certified as compliant with ERDF rules by the department’s Certifying Authority team. Prior to certification the amounts are held as work in progress (inventory – see N1.50). On certification the department recognises the ERDF expense and an equivalent amount of ERDF income.
N1.84. Until 1 April 2011 the department managed Area Based Grant (ABG) on behalf of a number of central government departments. Receipts from other departments and payments of the associated grants to Local Authorities were accounted for on an agency basis and were not taken through the department’s SoCNE. ABG was abolished from 31 March 2011.
Leases N1.85. The terms of all departmental leases are reviewed and, where the risks and rewards of
ownership rest with the department, leases are treated as finance leases. The capital values of finance leases, together with the current value of future capital repayments are held as assets and liabilities in the department’s Statement of Financial Position. Asset values are depreciated in accordance with the policy relating to the asset class to which they are classified. Leases other than finance leases are classified as operating leases. Operating leases are charged to the SoCNE on a straight-line basis over the term of the lease, taking account of any lease incentives in accordance with the terms of IAS 17.
N1.86. The department also reviews all service contracts (eg contracts for the supply of IT services) to determine whether the contracts include an embedded finance lease under the terms of IAS 17 as interpreted by IFRIC 4.
N1.87. Assets owned by the Group which are leased out under finance leases are recorded as disposals at the inception of the lease. Amounts due from lessees are recognised in the consolidated Statement of Financial Position as finance lease receivables at the amount of the net investment in the lease with the valuation reflecting the present value of the minimum future lease payments. Amounts received from finance leases are apportioned between

Department for Communities and Local Government Accounts 2011-12 Notes to the Departmental Accounts
119
finance income and a reduction in the remaining balance of the lease receivable so as to receive a constant rate of interest on the remaining balance of the receivable. Finance income is recognised in the consolidated Statement of Comprehensive Net Expenditure.
Provisions N1.88. Under the terms of IAS 37, the department provides for legal or constructive obligations,
which are of uncertain timing or amount but where it is considered probable that a liability exists at the year end date on the basis of the best estimate of the expenditure required in settling the obligation. Where the effect of the time value of money is significant, the estimated risk-adjusted cash flows are discounted using the real rate set by HM Treasury (currently 2.2% for general provisions and 2.8% for pension schemes).
N1.89. The department reports provisions due within 12 months under current liabilities and those due in more than 12 months under non-current liabilities in accordance with IAS 37. Full details are given in Note 23.
Contingent liabilities N1.90. In addition to contingent liabilities disclosed in accordance with IAS 37, Provisions,
Contingent Liabilities and Contingent Assets, the department discloses for Parliamentary reporting and accountability purposes certain statutory and non-statutory contingent liabilities where the likelihood of a transfer of economic benefit is remote, but which have been reported to Parliament in accordance with the requirements of Managing Public Money. These comprise:
• items over £250,000 (or lower, where required by specific statute) that do not arise in the normal course of business; and
• all items (whether or not they arise in the normal course of business) over £100,000 (or lower, where required by specific statute or where material in the context of these accounts) which are required by the FReM to be noted in these accounts.
N1.91. Contingent liabilities that are not required to be disclosed by IAS 37 are stated at the amounts reported to Parliament.
Third party assets N1.92. The department holds, as custodian or trustee, certain assets belonging to third parties.
These are not recognised in the accounts, since neither the department nor government more generally, has a direct beneficial interest in them. Further information is provided in Note 35.
Machinery of Government changes N1.93. As part of the transfer of responsibilities to local Fire and Rescue Authorities certain New
Dimension project assets were transferred under Machinery of Government (MoG) terms. The net book value of the assets transferred was £38.061m in 2010-11, this reduction in the department’s assets and the corresponding change to reserves has been shown in the SoFP and Note 9. 2009-10 comparative years’ balances have been restated. Further transfers with a net book value of £8.4m were made in 2011-12 via a Capital Grant in Kind transfer in accordance with treatment agreed with HM Treasury and the Fire and Rescue Authorities. The impact of this transfer is reflected in the SoFP with a change in reserves arising from reflecting the Capital Grant in Kind in Note 9. Final transfers are due to take place in 2012-12.
N1.94. During 2011-12 MoG transfers have occurred as follows
• Economic assets and associated administrative expenditure transferred from the Regional Development Agencies (RDAs) to the HCA;

Department for Communities and Local Government Accounts 2011-12 Notes to the Departmental Accounts
120
• The Residential Property Tribunal Service transferred from the core department to the Ministry of Justice;
• Sponsorship of the Ordnance Survey transferred from the core department to the Department for Business, Innovation and Skills, and
• Responsibility for Families with Multiple Problems programme transferred from the Department of Education as part of the Troubled Families initiative.
N1.95. Summary details of the impact of these changes on the financial statements are given in paragraphs 7.3 to 7.6 on pages 70 to 71.
N1.96. Other Changes: Transfers under acquisition accounting have taken place in respect of
• Management of ERDF programme transferred from Regional Development Agencies to the department
• London Development Agency was abolished under the Localism Act on 1 April 2012 and its functions and assets transferred to Greater London Authority. For the final 3 months of 2011-12, grant funding to the LDA was provided through DCLG rather than its previous sponsoring department BIS. In 2012-13, DCLG will provide grant funding to the GLA.
• Thurrock Thames Gateway Development Corporation transferred assets to Thurrock District Council
The impact of these transfers has been recognised in these financial statements. Acquisition accounting is applied from the date of acquisition and there is no requirement to restate prior year balances.

Department for Communities and Local Government Accounts 2011-12 Notes to the Departmental Accounts
121
Note 2. Net Outturn 2.1 Analysis of net resource outturn by section 2010-11restated
Outturn
Gross Income Net Gross Income Net Total Net Total Total
A Localism - - - 706,900 (26,602) 680,298 680,298 584,723 (95,575) 2,433,954B Neighbourhoods - - - 359,079 (2,425) 356,654 356,654 366,708 10,054 202,255
CLocal Economies, Regeneration & European Programmes
- - - 522,532 (177,806) 344,726 344,726 467,945 123,219 618,851
DResearch, Data & Trading Funds - - - 1,162 (1,127) 35 35 1,772 1,737 4,169
E DCLG staff, building and infrastructure costs
205,550 (11,426) 194,124 16,068 (782) 15,286 209,410 262,473 53,063 308,793
F Localism (NDPB) 964 - 964 - - - 964 1,718 754 1,217
G Neighbourhoods (NDPB) 126,571 (9,050) 117,521 1,416 - 1,416 118,937 177,917 58,980 199,232
HLocal Economies, Regeneration & European Programmes (NDPB)
26,370 - 26,370 84,007 - 84,007 110,377 86,915 (23,462) 76,853
359,455 (20,476) 338,979 1,691,164 (208,742) 1,482,422 1,821,401 1,950,171 128,770 3,845,324
I Revenue Support Grant - - - 5,905,455 - 5,905,455 5,905,455 5,905,455 - 3,167,008
JNon-Domestic Rate Payments - - - 19,000,000 - 19,000,000 19,000,000 19,000,000 - 21,500,000
K London Governance - - - 63,423 - 63,423 63,423 63,419 (4) 46,540
LOther Grants and Payments - - - 1,384,648 (1,373) 1,383,275 1,383,275 1,466,038 82,763 980,458
M Valuation Service - - - 152,000 - 152,000 152,000 152,000 - 150,196
NAudit Commission Disbanding - - - 12,081 - 12,081 12,081 20,090 8,009 517
O Local Government (NDPB) - - - 41,414 - 41,414 41,414 44,689 3,275 20,896
- - - 26,559,021 (1,373) 26,557,648 26,557,648 26,651,691 94,043 25,865,615
359,455 (20,476) 338,979 28,250,185 (210,115) 28,040,070 28,379,049 28,601,862 222,813 29,710,939
P Localism - - - 315,743 - 315,743 315,743 323,091 7,348 383,803Q Neighbourhoods - - - 7,290,882 (7,994,322) (703,440) (703,440) (642,593) 60,847 (581,415)
RLocal Economies, Regeneration & Eupropean Programmes
- - - (34,693) (26,745) (61,438) (61,438) (30,000) 31,438 (71,450)
S DCLG staff, building and infrastructure costs
- - - (20,337) - (20,337) (20,337) (20,000) 337 20,701
T NNDR Outturn Adjustment - - - 732,313 - 732,313 732,313 750,000 17,687 1,110,883
U Localism (NDPB) - - - - - - - 1 1
V Neighbourhoods (NDPB) - - - 64,190 - 64,190 64,190 35,840 (28,350) 11068
WLocal Economies, Regeneration & European Programmes (NDPB)
- - - 55,165 - 55,165 55,165 94,827 39,662 170,673
- - - 8,403,263 (8,021,067) 382,196 382,196 511,166 128,970 1,044,263
359,455 (20,476) 338,979 36,653,448 (8,231,182) 28,422,266 28,761,245 29,113,028 351,783 30,755,202
2011-12
Outturn EstimateAdministration Programme Net total
compared to Estimate
TOTAL (DEL & AME)
Voted expenditure
TOTAL spending in DEL
Total spending in DEL - DCLG Communities
Total spending in DEL - DCLG Local Government
Voted expenditure
Voted expenditure
Spending in Departmental Expenditure Limit (DEL) - DCLG Communities
Spending in DEL - DCLG Local Government
Spending in Annually Managed Expenditure (AME)
TOTAL spending in AME
-

Department for Communities and Local Government Accounts 2011-12 Notes to the Departmental Accounts
122
2.2 Analysis of net capital outturn by section
£’000 2010-11restated
Outturn
Gross Income Net NetNet Total
Compared with Estimate
Net
A Localism 157,299 (8,420) 148,879 249,149 100,270 92,288B Neighbourhoods 1,050,250 (52,363) 997,887 1,020,236 22,349 1,565,450
CLocal Economies, Regeneration & European Programmes 794,817 (204,937) 589,880 381,496 (208,384) 336,000
D Research, Data & Trading Funds - - - - - (1,418)E DCLG staff, building and infrastructure costs 1,702 (373) 1,329 4,441 3,112 3,117F Localism (NDPB) - - - - - 15,100G Neighbourhoods (NDPB) 1,935,184 (75,326) 1,859,858 1,879,228 19,370 3,561,378
HLocal Economies, Regeneration & European Programmes (NDPB) 223,094 - 223,094 320,447 97,353 498,169
4,162,346 (341,419) 3,820,927 3,854,997 34,070 6,070,084
K London Governance - - - - - 1,600L Other Grants and Payments (7,846) - (7,846) - 7,846 (69,109)O Local Government (NDPB) 134 (5) 129 50 (79) (197)
(7,712) (5) (7,717) 50 7,767 (67,706)
4,154,634 (341,424) 3,813,210 3,855,047 41,837 6,002,378
Q Neighbourhoods 152,824 - 152,824 370,000 217,176 842,972152,824 152,824 370,000 217,176 842,972
4,307,458 (341,424) 3,966,034 4,225,047 259,013 6,845,350
Voted:
TOTAL (AME)
TOTAL (DEL & AME)
Voted:
Total spending in DEL - DCLG Local Government
TOTAL spending in DELAnnually Managed Expenditure (AME)
Spending in Departmental Expenditure Limit (DEL) - DCLG CommunitiesVoted:
Total spending in DEL - DCLG CommunitiesSpending in DEL - DCLG Local Government
2011-12
Outturn Estimates

Department for Communities and Local Government Accounts 2011-12 Notes to the Departmental Accounts
123
Note 3. Reconciliation of outturn to net operating cost and against administration budget
3.1 Reconciliation of net resource outturn to net operating cost
£’000 2011-12 2010-11
Notes as reportedOutturn Outturn
Total resource outturn in Statement of Parliamentary Supply - 37,720,702
Less: Income payable to the Consolidated Fund - (1,114,196)
- 36,606,506
2011-12 2010-11restated
Total resource outturn in Statement of Parliamentary Supply 2.1 28,761,245 30,755,202
Add: Capital Grants 3,647,706 6,061,870Other (Grant in Aid) - 1,423
Less: Income payable to the Consolidated Fund 5 (6,479,414) (118,478)
25,929,537 36,700,017
Net Operating Costs in Consolidated Statement of Comprehensive Net Expenditure
Net Operating Costs in Consolidated Statement of Comprehensive Net Expenditure
2010-11 Data restated following Clear Line of Sight reclassifications and other changes
3.2 Outturn against final administration budget and Administration net
operating cost £’000 2010-11
Notes as reportedOutturn Outturn
Estimate - Administration Costs Limit 256,351
Outturn Gross Administration Costs - 292,068Outturn - Gross Income Relating to Administration Costs - (46,052)Outturn - Net Administration Costs - 246,016
2011-12 2010-112010-11 Data restated following Clear Line of Sight reclassifications and other changes restated
Estimate - Administration Costs Limit 377,046 450,913
Outturn Gross Administration Costs 2.1 359,455 500,134Outturn - Gross Income Relating to Administration Costs 2.1 (20,476) (80,501)
Outturn - Net Administration Costs 338,979 419,633
Reconciliation to Operating Costs:Plus: non supply income (CFERs) 11 - -Less: Net supported capital expenditure - -Plus expenditure classified as 'other current' in 2010-11 - 45,844Administration Net Operating Costs 338,979 465,477

Department for Communities and Local Government Accounts 2011-12 Notes to the Departmental Accounts
124
Note 4. Reconciliation of Net Cash Requirement to increase/(decrease) in cash
£’000
2011-12 2010-11restated
Outturn OutturnNet cash requirement - core department and agency (31,438,209) (36,797,932)From the Consolidated Fund (Supply) - current year 31,824,505 37,626,961From the Consolidated Fund (Supply) - prior year - -
Amounts due to the Consolidated Fund received and not paid over 38,818 222,213Amounts due to the Consolidated Fund received in prior year and paid over (222,213) (134,987)NNDR non supply funding - 9,322Other balances surrenderable to the Consolidated Fund - (902,866)Increase/(decrease) in cash held by core department and agency 202,901 22,712
Add - increase/(decrease) in cash held by Designated Bodies (228,510) 41,701
Net increase/(decrease) in cash held by Departmental Group (25,609) 64,413
Note 5. Income payable to the Consolidated Fund 5.1 Analysis of income payable to the Consolidated Fund In addition to Appropriation in Aid the following income relates to the department and is payable to the Consolidated Fund (cash receipts being shown in italics).
£’000
Income Receipts Income ReceiptsNotes
Operating Income collected on behalf of the Consolidated Fund 10,11 6,479,414 6,483,901 118,478 118,478
Other amounts collectable on behalf of the Consolidated Fund - - - -
Excess cash surrenderable to the Consolidated Fund 389 389 2,670 2,670
Total income payable to the Consolidated Fund 6,479,803 6,484,290 121,148 121,148
Outturn 2010-11restatedOutturn 2011-12
5.2 Consolidated Fund Income Consolidated Fund income shown in note 5.1 above does not include any amounts collected by the department where it was acting as agent of the Consolidated Fund rather than as principal. Full details of income collected as agent for the Consolidated Fund are in the department’s Trust Statement published separately from but alongside these finance statements. Note 6. Operating costs by operating segment The department’s activities are considered to represent three segments: Segment 1 Localism Segment 2 Neighbourhoods Segment 3 Local economies, regeneration and European programmes

Department for Communities and Local Government Accounts 2011-12 Notes to the Departmental Accounts
125
Net programme expenditure against these segments is shown in the following table. Programme expenditure on ‘Research, data and trading funds’ and ‘Audit Commission disbanding’ and all Administration expenditure is not allocated to segments.
£’000 2011-12 2010-11
RestatedNote Segment 1 Segment 2 Segment 3 Total Segment 1 Segment 2 Segment 3 Total
Gross Expenditure 2 28,443,170 10,746,574 1,768,689 40,958,433 29,876,123 6,747,602 1,764,224 38,387,949
Income 2 (33,437) (8,069,842) (492,246) (8,595,525) (39,711) (1,102,235) (308,362) (1,450,308)
Net Expenditure 28,409,733 2,676,732 1,276,443 32,362,908 29,836,412 5,645,367 1,455,862 36,937,641
The department does not consider that assets and liabilities can be meaningfully allocated to segments and therefore manages and reports on assets and liabilities as a single block. Therefore, in accordance with IFRS 8, no breakdown of assets and liabilities by segment is given.
6.1 Reconciliation between operating segments and SoCNE
£’000 2011-12 2010-11
RestatedNote Segment 1 Segment 2 Segment 3 Total Segment 1 Segment 2 Segment 3 Total
Total net expenditure per statement of comprehensive net expenditure by operating segment
6 28,409,733 2,676,732 1,276,443 32,362,908 29,836,412 5,645,367 1,455,862 36,937,641
Reconciling items:Income (6,541,674) (202,070)Expenditure 104,625 (42,366)
Total comprehensive expenditure per Statement of Comprehensive Net Expenditure
SoCNE 25,925,859 36,693,205
6.2 Reconciliation between operating segments and SoPS
£’000 2011-12 2010-11
RestatedNote Segment 1 Segment 2 Segment 3 Total Segment 1 Segment 2 Segment 3 Total
Total net expenditure per statement of comprehensive net expenditure by operating segment
6 28,409,733 2,676,732 1,276,443 32,362,908 29,836,412 5,645,367 1,455,862 36,937,641
Reconciling items:Income (249,423) (351,996)Expenditure 613,794 1,014,907
Net Outturn per Statement of Parliamentary Supply
SoPS 32,727,279 37,600,552

Department for Communities and Local Government Accounts 2011-12 Notes to the Departmental Accounts
126
Note 7. Staff numbers and related costs
7.1 Staff costs £’000
2011-12 2010-11restated
Permanently Employed Staff Ministers Special
Advisors Others Total Total
Wages & Salaries 168,571 255 129 8,265 177,220 260,932
Social Security Costs 15,575 25 15 23 15,638 20,940
Pension Costs 35,581 - 14 24 35,619 (5,534)Total Costs 219,727 280 158 8,312 228,477 276,338Less Recoveries in respect of outward secondments - - - (776) (776) (2,032)
Total Net Costs 219,727 280 158 7,536 227,701 274,306
Of which:Core Department 103,362 280 158 5,069 108,869 183,633
Agency 28,113 - - 32 28,145 33,177
Designated bodies 88,252 - - 3,211 91,463 59,528
The split of staff costs per body above includes the impact of intra-group eliminations.
7.2 Average number of persons employed The average number of whole-time equivalent persons during the year was as follows. These figures include those working in the department as well as in its Agency and other bodies included within the consolidated departmental accounts.
2010-11restated
Permanent staff Ministers Special Advisers Others Total Total
Core Department 1,944 6 2 62 2,014 3,081
Planning Inspectorate 614 - - - 614 692
Designated Bodies 1,530 - - 75 1,605 2,098
Total 4,088 6 2 137 4,233 5,871
2011-12
7.3 Civil service and other compensation schemes – exit packages In the core department and agency redundancy and other departure costs have been paid in accordance with the provisions of the Civil Service Compensation Scheme, a statutory scheme made under the Superannuation Act 1972. Exit costs are accounted for in full in the year of departure. Where the department has agreed early retirements, the additional costs are met by the department and not by the Civil Service pension scheme. Ill health retirement costs are met by the pension scheme and are not included in the table. Staff of other bodies in the departmental group are not civil servants and redundancy and other departure costs are paid in accordance with the rules applying to the bodies in question. Further details are contained in the accounts of the bodies concerned.

Department for Communities and Local Government Accounts 2011-12 Notes to the Departmental Accounts
127
£000
2010-11
Exit package cost band Number of compulsory redundancies
Number of other departures agreed
Total number of exit packages by cost band
Total number of exit packages by cost band
<£10,000 1 4 5 126£10,000 - £25,000 - 51 51 362£25,000 - £50,000 16 86 102 373£50,000 - £100,000 2 65 67 364£100,000 - £150,000 - 12 12 60£150,000 - £200,000 - 5 5£200,001 onwards - 3 3 -Total number of exit packages 19 226 245 1,301Total cost /£ 631 11,779 12,410 74,314
2011-12Core Department
16
2010-11
Exit package cost band Number of compulsory redundancies
Number of other departures agreed
Total number of exit packages by cost band
Total number of exit packages by cost band
<£10,000 1 5 6 130£10,000 - £25,000 - 60 60 392£25,000 - £50,000 16 90 106 403£50,000 - £100,000 2 68 70 374£100,000 - £150,000 - 12 12 66£150,000 - £200,000 - 5 5£200,001 onwards - 3 3Total number of exit packages 19 243 262 1,381Total cost /£ 631 12,201 12,832 77,301
2011-12Core Department and Agency
133
2010-11
Exit package cost band Number of compulsory redundancies
Number of other departures agreed
Total number of exit packages by cost band
Total number of exit packages by cost band
<£10,000 19 43 62 160£10,000 - £25,000 15 137 152 412£25,000 - £50,000 22 181 203 423£50,000 - £100,000 5 138 143 397£100,000 - £150,000 1 32 33 80£150,000 - £200,000 1 17 18 15£200,001 onwards - 4 4Total number of exit packages 63 552 615 1,495Total cost /£ 632 24,638 25,270 83,313
Consolidated2011-12
8
The information contained in the tables above includes accruals for assumed exists and is not a report of actual number of exits during the year. The tables do not contain exit data in respect of the former GO Network as these were fully accrued for in 2010-11.

Department for Communities and Local Government Accounts 2011-12 Notes to the Departmental Accounts
128
Note 8. Other administration costs
£’000 2011-12 2010-11
restated
Notes Core Department
Core Department &
Agency
Departmental Group
Core Department
Core Department &
Agency
Departmental Group
Non-Cash ItemsDepreciation 12 4,345 4,424 6,991 5,522 5,732 8,920Amortisation 13 5,978 6,083 7,944 6,328 6,751 9,153Loss on disposal of property, plant and equipment 73 73 5,539 1,878 1,878 2,276
Loss on disposal of intangible assets 298 298 319 502 502 590Loss on disposal of inventories - - - - - 532Impairment of inventories - - 6,723 - -Revaluation of non-current assets 12,13 295 295 295 (7,024) (7,038) (7,038)Impairment of non-current assets 7 7 4,568 4,892 4,892 6,394
Auditor's remuneration and expenses 620 663 663 414 455 455
Other write offs - - 5,217 - -Movement in provisions 23 - - - - - 175Provision for Doubtful Debts write off/(write back) (35) (35) (21) (24) (24) 11,268
Other non-cash charges 1,525 1,525 548Sub Total 11,581 11,808 38,238 14,013 14,673 33,273
Cash Items:Rentals under operating leases 239 341 716 414 588 1,056Research & development 246 246 587 248 248 2,497Accommodation including rentals under operating leases 47,654 51,293 63,238 48,442 52,186 68,471
IT expenditure 16,996 19,392 19,756 12,897 14,966 16,077Support Services 1,499 1,499 1,734 1,684 1,684 1,728Consultancy 5,077 5,077 5,774 1,671 1,680 3,592Legal and professional 2,482 2,482 4,667 3,718 3,718 9,176Marketing and communications 480 505 915 1,327 1,248 2,134Travel, subsistence and hospitality 1,710 3,112 6,834 2,580 4,283 8,837Training and conferences 408 584 1,092 3,169 3,393 4,060ERDF Exchange Rate Losses- realised 1 1 1 - -
Early Retirement Costs 7,574 7,574 10,526 64,972 64,972 66,359Corporation Tax Payable - - (16,727) - - 11,954Interest payable on pension scheme liabilities 24 - - 23,184 - - 24,706
Auditors' remuneration - - 445 - - 488Other cash items 4,415 9,770 32,745 14,297 18,733 33,885Sub Total 88,781 101,876 155,487 155,419 167,699 255,020
Total 100,362 113,684 193,725 169,432 182,372 288,293
-
-
-
Included within Auditors’ remuneration in Notes 8 and 9 is £540k which relates to external audit fees

Department for Communities and Local Government Accounts 2011-12 Notes to the Departmental Accounts
129
Note 9. Programme costs £’000
2011-12 2010-11restated
Notes Core Department
Core Department &
Agency
Departmental Group
Core Department
Core Department &
Agency
Departmental Group
Non-Cash ItemsDepreciation 12 8,710 8,710 9,455 8,841 8,841 9,877Amortisation 13 2,182 2,182 2,823 3,128 3,128 3,769Loss on disposal of property, plant and equipment 1 1 2 4,857 4,857 4,857
Loss on disposal of intangible assets
- - - 43,603 43,603 43,604
Loss on disposal of investments - - (792) - - 3,063Loss on disposal of inventories - - (976) - - 11,531Write down investments 1,400 1,400 1,400 - -Revaluation non-current assets 12,13 - - - - -Impairment of non-current assets 4,215 4,215 162,822 31,591 31,591 225,692ERDF Write off & disallowances 12,115 12,115 12,115 32,426 32,426 32,426ERDF Exchange rate losses
--
(unrealised)- - - 3,337 3,337 3,337
Movement in provisions 23 (36,015) (35,662) (8,272) (55,362) (55,115) (52,744)Provision for Doubtful Debts write off/(write back) 14,467 14,853 18,575 4,935 4,935 6,129
Other non-cash charges (19,125) (19,597) (78,480) (1,525) (1,525) 18,054Sub Total (12,050) (11,783) 118,672 75,831 76,078 309,595
Cash Items:Rentals under operating leases - - - 7 7 23Research & development 8,483 8,483 8,576 21,173 21,173 20,882Accommodation including rentals under operating leases 5,876 6,003 8,817 20,677 20,677 23,405
IT expenditure 18,054 18,093 18,586 3,121 3,121 4,531Support Services 3,247 3,247 4,204 35,483 35,483 35,483Consultancy 2,673 2,673 2,814 14,730 14,730 14,971Legal and professional 153,013 153,013 153,182 151,410 151,410 154,881Marketing and communications 1,187 1,187 1,786 1,668 1,668 2,026Travel, susbsistence and hospitality 91 91 480 726 726 1,234
Training and conferences 304 304 618 785 785 1,419Subsidies 7,302,043 7,302,043 7,302,043 428,212 428,212 428,212National non domestic rates 19,000,000 19,000,000 19,000,000 21,500,000 21,500,000 21,500,000National non domestic rates outturn adjustment
744,304 744,304 744,304 1,110,845 1,110,845 1,110,845
ERDF Grants 355,233 355,233 355,233 216,874 216,874 216,874Revenue support grant and PFI grant
5,976,461 5,976,461 5,976,461 4,074,885 4,074,885 4,074,885
Area based grant - - - 2,165,806 2,165,806 2,165,806Other local authority grants - 1,033,168 1,033,168 1,314,349 1,422,059 1,422,059 2,357,730Other local authority grants - 2,639,701 2,639,701 2,647,881 707,948 707,948 742,569Other grants - capital 595,320 595,320 2,426,757 884,052 884,052 3,942,359Other grants - revenue 380,380 380,380 383,781 551,965 551,965 567,931ERDF Financial Corrections 947 947 947 1,451 1,451 1,451ERDF Exchange Rate Losses - 5,814 5,814 5,814 3,004 3,004 3,004Early Retirement Costs 10,874 10,994 11,064 9,201 9,201 9,201Interest payable on pension scheme liabilities
24 104 104 6,172 - - 6,409
Interest payable 6,492 6,492 6,947 - - 2,318Auditors' remuneration - - 206 - - 244Other cash items 16,995 17,625 144,840 7,941 10,928 88,053
Sub Total 38,260,764 38,261,680 40,525,862 33,334,023 33,337,010 37,476,746
Total 38,248,714 38,249,897 40,644,534 33,409,854 33,413,088 37,786,341

Department for Communities and Local Government Accounts 2011-12 Notes to the Departmental Accounts
130
Note 10. Administration income £’000
2011-12 2010-11restated
Notes Core Department
Core Department &
Agency
Departmental Group
Core Department
Core Department &
Agency
Departmental Group
Non Cash ItemsGain on Sale of non-current assets - - - 30 30
Notional Income 53 - - 58 - -Total Non Cash Items 53 - - 88 30 30
Cash ItemsGoods and Services 4,092 6,277 5,244 5,017 7,526 7,486Accommodation 9,400 9,400 9,316 10,256 10,256 10,256Fees - 6,043 12,243 - 6,556 10,918Reimbursement of Expenditure - - - 190 190 17Interest and Dividends - - 65 - - 166Funded Defined Benefit Schemes
30
- - - 22,638 - - 20,962Grant Income - - 5,738 1,089 1,089 1,109Miscellaneous 892 1,676 5,106 27,796 28,218 29,557
Total Cash Items 14,384 23,396 60,350 44,348 53,835 80,471
Total 14,437 23,396 60,350 44,436 53,865 80,501
The following information relates to services for which a fee is charged and is not provided for the purposes of IFRS 8
Objectives Full Cost Income Surplus/ (Deficit)
PINS : Local development frameworks, compulsory purchase orders, major specialist and other casework
5,519 6,043 524
IHO : Subscription costs to meet full costs of service 3,351 3,900 549
LTGDC : Planning Application Fees - 435 435WNDC : Planning Fees - 407 407TTGDC : Planning Fees - 487 487IPC : Examination of infrastructure planning applications 7,309 971 (6,338)

Department for Communities and Local Government Accounts 2011-12 Notes to the Departmental Accounts
131
Note 11. Programme income
£’000 2011-12 2010-11
restated
Notes Core Department
Core Department &
Agency
Departmental Group
Core Department
Core Department &
Agency
Departmental Group
Non Cash ItemsERDF Exchange Gains 26,745 26,745 26,745 - - -Gain on sale of Non Current Assets
- - 78 - - -
Gain on Sale of Inventories - - - - - 1,009Unwinding of Discount on Advances
26,867 26,867 26,867 - - -
Total Non Cash Items 53,612 53,612 53,690 - - 1,009
Cash ItemsHousing Revenue Account 7,994,323 7,994,323 7,994,323 995,533 995,533 995,533CFER Income 6,479,414 6,479,414 6,479,414 118,478 118,478 118,478ERDF Grant Income 355,333 355,333 355,333 216,865 216,865 216,865Recovery of Grants 875 875 41,678 47,689 47,689 124,260Goods and Services 11,963 11,963 12,020 5,529 5,529 5,688Accommodation - - 19,361 - - 22,525Fees - - - - - 1,167Reimbursement of Expenditure - - - 8,028 8,006 7,801Interest and Dividends 6,223 6,223 32,003 1,853 1,853 29,433Funded Pension Schemes - Expected Return on Assets - - 5,078 - - 4,438
Grant Income - Current 2,000 2,000 2,017 - - 5,652Grant Income - Capital 52,363 52,363 52,656 - - 4,967Miscellaneous 11,913 11,913 29,276 22,724 22,724 34,061
Total Cash Items 14,914,407 14,914,407 15,023,159 1,416,699 1,416,677 1,570,868
Total 14,968,019 14,968,019 15,076,849 1,416,699 1,416,677 1,571,877

Department for Communities and Local Government Accounts 2011-12 Notes to the Departmental Accounts
132
Note 12. Property, plant and equipment
£’000
Land Buildings Information Technology
Plant & Machinery
Furniture & Fittings
Assets under Construction
Total
Cost or ValuationAt 1 April 2011 3,404 88,394 17,825 59,593 17,967 12,171 199,354Additions 3,037 13,643 780 35 592 1,122 19,209Impairments (253) (5,709) (4) - - - (5,966)Disposals (4,612) (1,716) (5,292) (22,228) (1,993) (5,473) (41,314)Revaluations - 1,048 - 476 (65) (203) 1,256Transfers - - 7 - - - 7At 31 March 2012 1,576 95,660 13,316 37,876 16,501 7,617 172,546
DepreciationAt 1 April 2011 - 9,160 11,381 29,969 10,986 - 61,496Charged in year - 5,201 2,635 5,926 2,684 - 16,446Impairments - (436) - - - - (436)Disposals - (1,709) (5,107) (13,826) (1,847) - (22,489)Revaluations - - - - (182) - (182)At 31 March 2012 - 12,216 8,909 22,069 11,641 - 54,835
Net book value:31 March 2012 1,576 83,444 4,407 15,807 4,860 7,617 117,71131 March 2011 3,404 79,234 6,444 29,624 6,981 12,171 137,858
Asset Financing:Owned 1,576 11,942 4,407 15,807 4,860 7,617 46,209Financed leased 0 71,502 - - - - 71,502Net book value at 31 March 2012 1,576 83,444 4,407 15,807 4,860 7,617 117,711
Of the total:Core Department 500 79,144 3,365 15,624 2,618 7,617 108,868Agency - - 136 - - - 136Designated bodies 1,076 4,300 906 183 2,242 - 8,707Net book value at 31 March 2012 1,576 83,444 4,407 15,807 4,860 7,617 117,711
31-Mar-12

Department for Communities and Local Government Accounts 2011-12 Notes to the Departmental Accounts
133
£’000
Land Buildings Information Technology
Plant & Machinery
Furniture & Fittings
Assets under Construction
Total
Cost or ValuationAt 1 April 2010 3,494 23,807 20,885 59,334 16,906 19,206 143,632Additions 5,670 99,337 731 654 583 7,718 114,693Impairments (10,717) (33,655) (303) (61) (35) (289) (45,060)Disposals - (991) (3,629) (2,609) (234) (5,893) (13,356)Revaluations - (231) (547) 1,230 11 (889) (426)Transfers - - 8 - 230 (238) -Reclassifications 4,957 6 680 1,045 506 (7,444) (250)At 31 March 2011 3,404 88,273 17,825 59,593 17,967 12,171 199,233
DepreciationAt 1 April 2010 - 4,450 10,775 25,508 8,070 - 48,803Charged in year - 5,358 3,524 6,828 3,090 - 18,800Impairments - (149) 6 - 55 - (88)Disposals - (620) (2,972) (2,367) (229) - (6,188)Revaluations - - 55 - - - 55Reclassifications - - (7) - - - (7)31 March 2011 - 9,039 11,381 29,969 10,986 - 61,375
Net book value:31 March 2011 3,404 79,234 6,444 29,624 6,981 12,171 137,85831 March 2010 3,494 19,357 10,110 33,826 8,836 19,206 94,829
Asset Financing:Owned 3,404 14,411 6,444 29,624 6,981 12,171 73,035Financed leased - 64,823 - - - - 64,823Net book value at 31 March 2011 3,404 79,234 6,444 29,624 6,981 12,171 137,858
Of the total:Core Department 500 73,492 4,572 29,363 3,832 6,698 118,457Agencies - - 204 - - - 204Designated bodies 2,904 5,742 1,668 261 3,149 5,473 19,197Net book value at 31 March 2011 3,404 79,234 6,444 29,624 6,981 12,171 137,858
31-Mar-11Restated
There are no donated assets within the department.
The department’s policy for revaluations is described in Notes 1.21 - 22.

Department for Communities and Local Government Accounts 2011-12 Notes to the Departmental Accounts
134
Note 13. Intangible assets £’000
31-Mar-12
Software Licences Systems Development Total
Cost or valuationAt 1 April 2011 75,443 10,816 306 86,565Additions 1,355 352 456 2,163Transfers 263 36 (306) (7)Disposals (4,044) (2,444) - (6,488)At 31 March 2012 73,017 8,760 456 82,233
AmortisationAt 1 April 2011 50,518 6,753 - 57,271Charged in year 9,110 1,657 - 10,767Disposals (3,525) (2,410) - (5,935)At 31 March 2012 56,103 6,000 - 62,103
Net book value:31 March 2012 16,914 2,760 456 20,13031 March 2011 24,925 4,063 306 29,294
Asset Financing:Owned 16,914 2,760 456 20,130Finance Leased - - - -
Net book value at 31 March 2012 16,914 2,760 456 20,130
Of Which:Core Department 15,294 972 456 16,722Agencies 110 - - 110Designated bodies 1,510 1,788 - 3,298
Net book value at 31 March 2012 16,914 2,760 456 20,130

Department for Communities and Local Government Accounts 2011-12 Notes to the Departmental Accounts
135
£’000 31-Mar-11Restated
Software Licences Systems Development Total
Cost or valuationAt 1 April 2010 78,256 11,158 45,307 134,721Additions 2,562 295 814 3,671Transfers - 288 (288) -Reclassifications 2,793 253 (2,835) 211Disposals (8,095) (1,095) (40,098) (49,288)Impairment (74) (82) (2,594) (2,750)At 31 March 2011 75,442 10,817 306 86,565
AmortisationAt 1 April 2010 44,409 5,022 - 49,431Charged in year 10,611 2,311 - 12,922Reclassifications 7 - - 7Disposals (4,510) (584) - (5,094)Impairment - 5 - 5At 31 March 2011 50,517 6,754 - 57,271
Net book value:31 March 2011 24,925 4,063 306 29,29431 March 2010 33,846 6,136 45,306 85,288
Asset Financing:Owned 24,925 4,063 306 29,294Finance Leased - - - -
Net book value at 31 March 2011 24,925 4,063 306 29,294
Of Which:Core Department 22,753 1,495 306 24,554
Agencies 171 9 - 180Designated bodies 2,001 2,559 - 4,560
Net book value at 31 March 2011 24,925 4,063 306 29,294
There are no donated assets within the department.

Department for Communities and Local Government Accounts 2011-12 Notes to the Departmental Accounts
136
Note 14. Financial instruments Liquidity Risk The cash requirements of the department for day-to-day operations and capital investments are met through the Estimates process and by the passing of the annual Appropriation Act. The Estimates process provides an opportunity, during the year (the Supplementary Estimate), to amend funding levels and purposes to reflect changing circumstances and unforeseen events. The department is therefore exposed to little liquidity risk and financial instruments play an insignificant part of the funding of the department and a more limited role in creating risk than would apply to a non-public sector body of a similar size.
Market Risk HCA is also exposed to market price risk in some of its available for sale financial assets. The financial assets include the Agency’s interests in housing units and private sector developments located in geographically diverse areas within the UK. As these assets are classified as available for sale, any market price movements are normally reflected in changes in equity, and have no effect on the reported net expenditure for the period unless an impairment is reported.
HCA has performed a sensitivity analysis that measures the change in fair value of the financial assets held for hypothetical changes in market prices. The sensitivity analysis is based on a proportional change to all prices applied to the relevant financial instrument balances existing at the year end.
At 31 March 2012, if UK house prices had been 10% higher/lower and all other variables were held constant, the effect on the Agency’s reserves arising from movements in investments in housing units, before the effects of tax, would have been an increase/decrease of £119.4m/£153.9m from that stated (2011: £31.4m/£52.9m, 2010: £38.2m/£65.9m increase/decrease).
At 31 March 2012, if development returns had been 10% higher/lower and all other variables were held constant, the effect on the Agency’s reserves arising from movements in investments in private sector developments, before the effects of tax, would have been an increase/decrease of £10.0m/£11.0m from that stated (2011: £4.2m/£3.8m, 2009: £3.6m/£3.6m increase/decrease).
Currency Risk A payables balance of £456.9m is the sterling equivalent of a liability of €548.3m translated at the accounting date. This relates to deposits from the European Union (EU) for the 2000-06 and 2007-13 European Regional Development Fund (ERDF) Programmes and the Sterling value is therefore recalculated at the end of each period with a consequential risk of unrealised loss or gain arising from fluctuations in rates. The deposits will be utilised as the programmes near completion, which in relation to the 2000-06 programme is expected to be during 2012-13 but for the 2007-13 programme is not expected before 2015-16. The level of balance, and associated level of risk, is therefore expected to diminish over the coming year.
Within accrued income there is a balance of £262,726m which is the sterling equivalent of an asset of €315,271m representing ERDF grant payments made but yet to be claimed from the EU. These balances are fixed in Euros being the Euro equivalent of the Sterling expenditure applying at the time the expenditure was incurred using the ‘Europa’ rate in accordance with the regulations. They are recalculated at the end of each accounting period with a consequential risk of unrealised loss or gain arising from fluctuations in rates. In addition, as ongoing funding for these programmes is processed through the EU, there are realised exchange rate gains and losses as the sterling equivalent of the Euro claims are settled. The Department is therefore exposed to currency risks which vary depending on the level of balances, the rate at which claims are submitted and the time taken for them to be processed by the EU.

Department for Communities and Local Government Accounts 2011-12 Notes to the Departmental Accounts
137
In 2011-12 there was an overall gain of around £21m arising from these risks compared with a loss of about £6m in 2010-11, £27m in 2009-10 and £4m in 2008-09.
The table below shows the assets and liabilities subject to translation from euros to sterling at the accounting date and in accordance with the Department’s policy on foreign exchange translations (Exchange rate at 31 March 2012 £1 = €1.2000 – source Bank of England spot rate) http://www.bankofengland.co.uk/mfsd/iadb/Rates.asp?
Currency Risks Floating rate financial liabilities
£’000 €’000 Assets At 31 Mar 2012: Receivables (ERDF) 0 0 Accrued income (ERDF) 262,726 315,271 Total assets at 31 March 2012 262,726 315,271 Total assets at 31 March 2011 250,692 283,206 Total assets at 31 March 2010 297,054 332,946 Total assets at 31 March 2009: 397,811 445,493 Liabilities At 31 March 2012: Deposit from EU (ERDF 2000-06 Programmes) (272,882) (327,459) Deposit from EU (ERDF 2007-13 Programmes) (184,018) (220,822) Total liabilities at 31 March 2012 (456,901) (548,281) Total liabilities at 31 March 2011 (498,236) (562,857) Total liabilities at 31 March 2010 529,759 593,767 Total liabilities at 31 March 2009 496,427 553,998
As can be noted from the above the department has significant assets and liabilities affected by the Sterling/Euro exchange rate. To an extent these balances act as a natural hedge whereby the loss that would arise on the liability balance from a weakening of Sterling would be offset by the gain on the asset balance. These effects are reversed from a strengthening of Sterling. This reduces but does not eliminate the risks. There are also variations in the levels of balances caused by differences in the values of quarterly declarations, the time taken for declarations to be paid by the EU and the rate in which the deposits on the 2000-06 programme are utilised. These variations are difficult to assess and, using a model of the likely impacts of variances in exchange rates, the department determined during 2009-10 that active mitigation of the risks, through for instance forward contracts or hedging, would not provide value for money. The department continues to monitor the position and expects to undertake further work on the topic, perhaps in partnership with other departments, during 2012-13. The following table illustrates the impact of changes in the sterling to Euro exchange rate and assumes the level of balances remains constant.
Category Balance at 31 Mar 12 €000
Rate at 30 Mar 12 Impact of rate change to
1:1.00 1:1.10 1:1.30 1:1.40 Assets 315,271 1:1.20 £52m gain £24m gain £20m loss £38m loss Liabilities (548,281) 1:1.20 £91m loss £42m loss £35m gain £65m gainNet gain/ loss £39m loss £18m loss £15m gain £28m gain
Apart from ERDF the department has no other risks arising from foreign exchange.

Department for Communities and Local Government Accounts 2011-12 Notes to the Departmental Accounts
138
Credit Risk
The Department has placed investments in a number of public-sector owned organisations, as shown in Note 15 Investments. As the organisations are within the public sector there is minimal need for the department to manage the risk of default.
Some of these investments have been financed on a statutory basis known as Public Dividend Capital (PDC). The Treasury has advised that PDC is not a financial instrument because financial instruments are contractual whereas PDC is statutory. Therefore these items are outside the scope of this section. See Note 15 for details of PDC investments.
Homes and Communities Agency has guaranteed the payments under loan obligations of other entities, as disclosed in Note 15 (and in Note 43 of HCAs statutory accounts). The total maximum exposure under these guarantees is £21.7m (2010: £21.7m, 2009: £27.3m), of which £21.7m (2010 and 2009: £21.7m) relates to Home Group. This guarantee is backed by the right of HCA to take a first legal charge over Home Group’s saleable assets.
The counterparties to other financial assets are generally major developers and housebuilders in the private sector and normally arise from disposals of development assets. However, available for sale financial assets relate mainly to amounts receivable individually from the private owners of housing units when their properties are sold, resulting in a broad spread of credit risk for these assets. Amounts receivable from the disposal of property are always secured by HCA’s right to retake possession of the disposed property in the event of a default by the buyer, and in appropriate cases are backed by financial guarantees. Amounts receivable from the owners of housing units are secured by a second charge over their property. Loans to water companies relate to only one receivable. There are no significant credit risks in HCA’s other financial instruments.
Interest rate risk The Department is not exposed to significant interest rate risk as its financial assets and financial liabilities carry nil or fixed rates of interest. No interest is receivable on balances held with the Government Banking Service. Any interest earned on balances with commercial banks is immaterial.
Interest rate profile The following table shows the interest rate profile of the department’s financial assets as at 31 March 2012. All balances are held in sterling.
Fair values The estimated fair values of the financial instruments held by the Department approximate to their book values at 31 March 2011 and 31 March 2012. The following criteria have been used to assess the fair value of the Department’s financial assets and liabilities.
• Current payables and receivables are based on their nominal amount
• Non-current payables and receivables are valued at discounted cost
• Cash at bank balances are at their book values
• PDC, being statutory, is valued at nominal value
• The investments in the Coalfields Enterprise Fund and the Coalfields Growth Fund are revalued every quarter by the fund managers and the year end valuations reflect the underlying valuations.

Department for Communities and Local Government Accounts 2011-12 Notes to the Departmental Accounts
139
Total Non-interest bearing
Floating rate
Fixed rate Weighted average interest
rate
Period for which rate
is fixed
Primary Financial Instruments: £’000 £’000 £’000 £’000 % yFinancial Assets:Cash at Office of Paymaster General 395,612 187,252 - - - -Cash held at commercial banks 45,070 45,070 - - -Fire Service College Loan 4,474 - - 4,474 8.30% 41 yearsCoalfields Enterprise Fund 9,332 9,332 - - - -HCA Loans 344,124 65,227 118,264 160,634 6.74% 20HCA Local Authority Loans 1,601 - 4.29% 18TSA loan with co-ownership society 28 - 28 - - -Balance at 31 March 2012 800,242 306,881 118,292 165,108 - -Balance at 31 March 2011 602,862 267,234 148,985 182,455 - -Balance at 31 March 2010 535,750 237,700 94,655 199,391 - -Balance at 1 April 2009 109,982 105,249 167 - - -
rs

Department for Communities and Local Government Accounts 2011-12 Notes to the Departmental Accounts
140
Note 15. Investments
£’000 Consolidated
Coalfields Enterprise
Coalfields Growth Fund
Queen Elizabeth II Conference
Centre
Shares/ Equity
(Note 16)
Loans within WGA
boundary
Loans - Private Sector
Total Investments for Consolidated
BodiesInvestment Investment PDC PDC Loan
Balance at 31 March 2010 6,901 5,000 821 16,721 4,566 25,028 1,728 339,788 400,553
Additions - - - - - - - 62,029 62,029Write down/ Impairment (559) (610) - - - (3,359) - (5,511) (10,039)
Loan repayments - - - - (73) - (61) (14,570) (14,704)
Disposal - - - - - 1,009 - - 1,0096,342 4,390 821 16,721 4,493 22,678 1,667 381,736 438,848
Transfer to current assets - - - - - - - (19,843) (19,843)
Balance at 31 March 2011 6,342 4,390 821 16,721 4,493 22,678 1,667 361,893 419,005
Additions - - - - - - - 12,127 12,127Write down/ Impairment (531) (869) - - - (9,899) - (31,034) (42,333)
Loan repayments - - - - (19) - (66) (34,536) (34,621)
Revaluation - - - - - - - 1,548 1,548
5,811 3,521 821 16,721 4,474 12,779 1,601 309,998 355,726
Transfer to current assets
- - - - - - - 434 434
Balance at 31 March 2012 5,811 3,521 821 16,721 4,474 12,779 1,601 310,432 356,160
Core Department Designated bodies
Fire Service College
PDC = Public Dividend Capital.
Share of net assets of associates and joint ventures as detailed below £’000
The aggregated movements in the share of net assets of associates are as follows: - 2011-122011-12
RestatedCost or Valuation: -Balance at 1 April 22,678 25,028Share of gains/(losses) of associates (9,899) (3,359)Net liabilities (added)/disposed - 1,009Balance at 31 March 12,779 22,678
Consolidated
£’000
The aggregated amount of the share of total assets and liabilities of associates are as follows: - 2011-122010-11
RestatedAssets 249,547 123,377Liabilities (236,768) (120,528)Total group share of net assets of associates 12,779 2,849

Department for Communities and Local Government Accounts 2011-12 Notes to the Departmental Accounts
141
Subsidiary undertakings as detailed below £’000
Subsidiary Undertakings 2011-122010-11
RestatedAggregate capital and reserves as at 31 March 15,222 15,184Profit / Loss for the reporting period ending March 8,246 -Total cost or valuation of subsidiary undertakings: -Balance at 1 April 15,184 25,000Movements in Year - (9,816)Balance at 31 March 15,184 15,184
Consolidated
Please refer to individual bodies annual accounts for information on subsidiary, associates and joint ventures undertakings.
Note 16. Available for sale financial assets £’000
2011-12 2010-11restated
Core Department
Core Department &
Agency
Departmental Group
Core Department
Core Department &
Agency
Departmental Group
Cost or valuationAt 1 April - - 556,556 - - 454,049Additions - - 114,534 - - 143,338Impairments - - (69,246) - - (35,774)Disposals - - (34,528) - - (19,423)Revaluations - - (17,108) - - 14,366At 31 March - - 550,208 - - 556,556
Available for sale financial assets are assets of the HCA representing their interests in housing developments.
Included in impairment of available for sale financial assets is a £52.6m charge (2010/11: £25.9m) arising on the write-down of certain of the Agency's investments in housing units under HomeBuy Direct and the First Time Buyers' Initiative. This write-down is based on analysis of actual profits and losses experienced on unit sales since the inception of the schemes, and is in addition to fair value changes arising from the factors described below.
Other impairments of available for sale financial assets arise from market movements in property prices in some geographical areas during the year, which are measured with reference to movements in the DCLG regional house price index, or from the reduction in forecast cashflows in the case of the Agency's investments in private sector developments under the Kickstart Housing Initiative.
Note 17. Investment properties £’000
Core Department
Core Department &
Agency
Departmental Group
Core Department
Core Department &
Agency
Departmental Group
Cost or valuationAt 1 April 28,806 28,806 28,806 21,782 21,782 21,782
Additions - - - - - -
Revaluations (295) (295) (295) 7,024 7,024 7,024
At 31 March 28,511 28,511 28,511 28,806 28,806 28,806
2011-12 2010-11

Department for Communities and Local Government Accounts 2011-12 Notes to the Departmental Accounts
142
As at the 31 March 2012 the following properties were revalued professionally, in accordance with RICS Valuation Standards, by GVA Grimley Limited – Commercial Property and Property Management Consultants.
Queen Elizabeth II Conference Centre, Broad Sanctuary, London was valued during March 2012 by GVA. The total valuation was reported at £29,000,000 but with a value of £27,196,000 in the department’s books because of a trading fund outside interest in the property.
Burlington House, Piccadilly, London was valued during March 2012 by GVA, at £1,315,000.
The department received rental income of £5,108 (£6,875, 2010-11) from tenants at Burlington House.
The department does not receive rental income from the Queen Elizabeth II Conference Centre as it receives income as dividend on the Public Dividend Capital investment.
Note 18. Assets held for sale £’000
2011-12 2010-11
Core Department
Core Department &
Agency
Departmental Group
Core Department
Core Department &
Agency
Departmental Group
Balance at 1 April - - - 5 5Disposals - - - (5) (5) (5)As at 31 March - - - - -
5
- Previous holdings in this category related to ‘Green Goddess’ fire tenders which were all sold in 2010-11. Currently no assets are classified as assets held for sale by the group.
Note 19. Inventories £’000
2011-12 2010-11restated
Core Department
Core Department &
Agency
Departmental Group
Core Department
Core Department &
Agency
Departmental Group
Land and buildings
Opening balance as at 1 April - - 1,109,489 102,209 102,209 1,425,765Additions - - 57,458 - - 78,976Disposals - - (98,794) (102,209) (102,209) (185,387)Write off - - (85,089) - - (167,683)Revaluation - - 72,023 - - (42,182)Closing balance as at 31 March - - 1,055,087 - - 1,109,489
ERDF Work in Progress
Opening balance as at 1 April - - - - -Additions 250,140 250,140 250,140 - - -Certified as expenditure (183,348) (183,348) (183,348) - - -Closing balance as at 31 March 66,792 66,792 66,792 - -
Closing balance as at 31 March 66,792 66,792 1,121,879 - - 1,109,489
-
-
Details regarding Work in Progress treatment and balances can be found in section 7 - Other Financial Information.

Department for Communities and Local Government Accounts 2011-12 Notes to the Departmental Accounts
143
Note 20. Trade and other receivables 20.1 Analysis by type
£’000
31-Mar-12 31-Mar-11restated
31-Mar-10restated
Core Department
Core Department
& Agency
Departmental Group
Core Department
Core Department
& Agency
Departmental Group
Departmental Group
Amount falling due within one year:
Trade receivables 1,463 1,833 83,312 457 907 79,426 70,128
Deposits and advances - - 61 - - 69 294VAT receivables 952 1,082 5,915 246 305 1,008 9,212Other receivables 173,879 175,100 208,803 244,569 246,436 284,117 279,951ERDF accrued income 174,368 174,368 174,368 123,954 123,954 123,954 211,528Prepayments and accrued income 11,226 14,412 23,879 197,832 201,181 214,411 44,188
Government grant receivables - - - - - 23,000 3
Taxation and duties due - - - - - 850Current asset investments - - 33,722 - - 34,197 -Sub Total 361,888 366,795 530,060 567,058 572,783 761,032 646,834
Amounts falling due after more that one year:
Trade receivables - - 81,402 - - 156,351 142,876
Other receivables - - 60,199 - - 66,128 88,241
ERDF Deposits 13,570 13,570 13,570 173,889 173,889 173,889 170,146Prepayments and accrued income 759 776 776 411 439 439 151
Sub Total 14,329 14,346 155,947 174,300 174,328 396,807 401,414
Total 376,217 381,141 686,007 741,358 747,111 1,157,839 1,048,248
1,000
533
Included in “other receivables” is an amount of £2k (£4,488k in 2010-11) which is payable to the Consolidated Fund when collected.

Department for Communities and Local Government Accounts 2011-12 Notes to the Departmental Accounts
144
20.2 Intra-government balances £’000
2011-12 2010-11 2011-12 2010-11 2011-12 2010-11 2011-12 2010-11 2011-12 2010-11 2011-12 2010-11Other Central Government bodies 180,645 16,520 8,630 173,889 181,705 18,164 8,630 173,889 185,846 47,988 8,630 173,889
Local authorities 173,420 104,444 1,738 - 175,441 106,503 1,738 - 181,838 114,949 8,973 7,235NHS bodies - 4 - - - 4 - - - 4 - -Public Corporations and Trading Funds 890 497 - - 891 497 - - 891 497 - -
Sub-total 354,955 121,465 10,368 173,889 358,037 125,168 10,368 173,889 368,575 163,438 17,603 181,124
Bodies external to Government 6,933 445,593 3,961 411 8,758 447,615 3,978 439 161,485 597,594 138,344 215,683
Total receivables at 31 March 361,888 567,058 14,329 174,300 366,795 572,783 14,346 174,328 530,060 761,032 155,947 396,807
Balances with:
Consolidated
Amounts falling due within one year
Amounts falling due after more than
one year
Amounts falling due within one
year
Amounts falling due after more than one year
Amounts falling due within one
year
Amounts falling due after more than one year
Core Department Core Department & Agency
Note 21. Cash and cash equivalents
£’000
Core Department
Core Department &
Agency
Departmental Group
Core Department
Core Department &
Agency
Departmental Group
Balance at 1 April 190,185 190,185 319,365 167,474 167,474 254,952Net change in cash and cash equivalent balances 202,901 202,901 121,317 22,711 22,711 64,413
Bank overdraft - - (146,926) - - -Balance at 31 March 393,086 393,086 293,756 190,185 190,185 319,365
The bank overdraft shown above is disclosed within Note 22.
Core Department
Core Department &
Agency
Departmental Group
Core Department
Core Department &
Agency
Departmental Group
Departmental Group
Other bank and cash - - 19,916 - - 18,601 24,994
Commercial banks and cash in hand 13 13 25,154 597 597 24,756 49,425
Government Banking Service 205,821 205,821 208,360 189,588 189,588 276,008 180,533
Government Banking Service (ERDF) 187,252 187,252 187,252 - - - -
Balance at 31 March 393,086 393,086 440,682 190,185 190,185 319,365 254,952
The following balances at 31 March were held at:
31-Mar-10Restated
2011-12 2010-11Restated
31-Mar-12 31-Mar-11

Department for Communities and Local Government Accounts 2011-12 Notes to the Departmental Accounts
145
Note 22. Trade and other payables 22.1 Analysis by type
£’000 31-Mar-12 31-Mar-11
restated31-Mar-10
restated
Core Department
Core Department &
Agency
Departmental Group
Core Department
Core Department &
Agency
Departmental Group
Departmental Group
Amounts falling due within one year:Vat Payable - 37 99 3,029 3,031 4,879 729
Taxation and Social Security 2,163 2,163 4,040 5,541 5,541 12,007 9,622
Trade payables (264) 220 37,626 3,212 3,450 222,872 270,709
Bank Overdraft - - 146,926 - - - -
Other payables 742,526 743,086 731,609 215,094 216,842 236,241 47,661
Accruals 315,360 317,206 375,535 308,053 311,714 395,928 567,310
Finance lease 1,497 1,497 2,251 1,457 1,457 2,354 861
Deferred income 697 742 71,538 60 63,959 26,080
Deferred income - ERDF 340,489 340,489 340,489 306,972 306,972 306,972 310,323Amount issued from the Consolidated Fund for supply but not spent
354,267 354,267 354,267 142,207 142,207 142,207 216,043
Consolidated fund extra receipts to be paid to the Consolidated Fund
- received 38,739 38,818 38,818 222,159 222,213 222,213 134,987
- receivable 2 2 2 4,488 4,488 4,488 1,066
Sub Total 1,795,476 1,798,527 2,103,200 1,212,212 1,217,975 1,614,120 1,585,391
Amounts falling due after more that one year:Finance lease 111,032 111,032 112,428 98,888 98,888 101,038 3,049
ERDF Deposits held 184,019 184,019 184,019 191,264 191,264 191,264 188,627
Other Payables - - - - - - 320
Accruals - - 376 - - 412 -
Deferred income 5,043 5,043 5,043 5,706 5,706 5,706 6,370
Sub Total 300,094 300,094 301,866 295,858 295,858 298,420 198,366
Total 2,095,570 2,098,621 2,405,066 1,508,070 1,513,833 1,912,540 1,783,757
Deferred Income of less than 1 year is made up of £272,882k in respect of 2000-06 programmes and £67,607k in respect of 2007-13 programmes.

Department for Communities and Local Government Accounts 2011-12 Notes to the Departmental Accounts
146
22.2 Intra-Government Balances
£’000
Balances with: 2011-12 2010-11 2011-12 2010-11 2011-12 2010-11 2011-12 2010-11 2011-12 2010-11 2011-12 2010-11Other Central Government bodies
274,281 394,560 - -274,194 394,789
- -244,740 422,220
- -
Local authorities 954,179 591,227 - - 954,184 591,227 - - 976,687 717,695 - -
NHS bodies 1 1 - - 1 1 - - 1 1 - -Public Corporations and Trading Funds
823 2,027 - -826 2,027
- -5,032 3,664
- -
Sub-total 1,229,284 987,815 - - 1,229,205 988,044 - - 1,226,460 1,143,580 - -
Bodies external to Government
566,192 224,397 300,094 295,858 569,322 229,931 300,094 295,858 876,740 470,540 301,866 298,420
Total payables at 31 March
1,795,476 1,212,212 300,094 295,858 1,798,527 1,217,975 300,094 295,858 2,103,200 1,614,120 301,866 298,420
Core Department Core Department & Agency Consolidated
Amounts falling due within one year
Amounts falling due after more than one year
Amounts falling due within one year
Amounts falling due after more than one
year
Amounts falling due within one year
Amounts falling due after more than one year
Note 23. Provisions for liabilities and charges (i) Early departure costs The department meets the additional costs of benefits beyond the normal Principal Civil Service Pension Scheme (PCSPS) benefit for employees who retire early. An amount is paid annually to the PCSPS for the period between early departure and the normal retirement date. The department provides for this in full when the early retirement becomes a binding liability. Each liability is based on the estimated payments discounted at the Treasury discount rate for provisions of 2.2% in real terms.
£’000
Core Department
Core Department & Agency
Departmental Group
Core Department
Core Department & Agency
Departmental Group
Open balance at 1 April 42,661 42,945 42,945 20,820 21,238 21,238Increase - - 523 29,613 29,627 29,627Utilisation (17,003) (17,123) (17,123) (2,344) (2,543) (2,543)Reversal (2,528) (2,528) (3,051) (4,219) (4,219) (4,219)Unwinding 1,041 1,058 1,058 (1,209) (1,158) (1,158)Balance at 31 March 24,171 24,352 24,352 42,661 42,945 42,945Comprising:Current liabilities 6,728 6,819 6,819 19,349 19,456 19,456Non-current liabilities 17,443 17,533 17,533 23,312 23,489 23,489Balance at 31 March 24,171 24,352 24,352 42,661 42,945 42,945
Early Retirement
2011-12 2010-11restated
(ii) ERDF ERDF is a major grant programme with significant assets and liabilities on the Statement of Financial Position. The department reviews outstanding issues monthly and, where it

Department for Communities and Local Government Accounts 2011-12 Notes to the Departmental Accounts
147
appears possible that grant related expenditure is likely to be disallowed and irrecoverable from grant recipients, raises accruals and provisions as necessary.
£’000
Core Department
Core Department & Agency
Departmental Group
Core Department
Core Department & Agency
Departmental Group
Open balance at 1 April 34,693 34,693 34,693 113,365 113,365 113,365Increase - - - 16,928 16,928 16,928Utilisation - - - - - -Reversal (34,693) (34,693) (34,693) (95,600) (95,600) (95,600)Unwinding - - - - - -Balance at 31 March - - - 34,693 34,693 34,693Comprising:Current liabilities - - - 34,693 34,693 34,693Non-current liabilities - - - - - -Balance at 31 March - - - 34,693 34,693 34,693
2011-12 2010-11restated
ERDF Financial Corrections
(iii) Other provisions: In the core department these provisions include claims made by staff and third parties against the department. The provision is calculated based on general experience of what the maximum for each type of claim is worth. Provisions are also made for dilapidations to comply with lease clauses for buildings which are occupied by the department. The department’s dilapidation provisions are calculated based on the estimated cost of meeting future expenditure, in order to settle obligations in respect of lease clauses. The cost is apportioned over the term of the lease so as to give a constant periodic charge, and so reflect the best estimate of the obligation at the accounting date. More details of provisions other than those of the core department can be found in the published accounts of each of the bodies concerned.
£’000
Core Department
Core Department & Agency
Departmental Group
Core Department
Core Department & Agency
Departmental Group
Open balance at 1 April 9,367 9,605 210,399 11,435 11,896 216,684Increase 2,282 2,702 32,421 3,209 3,476 25,327Utilisation (1,966) (2,318) (48,030) (1,364) (1,769) (27,533)Reversal (2,117) (2,201) (6,105) (3,913) (3,998) (4,093)Unwinding - - 1,575 - - 14Balance at 31 March 7,566 7,788 190,260 9,367 9,605 210,399Comprising:Current liabilities 3,020 3,242 30,877 3,143 3,381 34,337Non-current liabilities 4,546 4,546 159,383 6,224 6,224 176,062Balance at 31 March 7,566 7,788 190,260 9,367 9,605 210,399
Other Provisions
2011-12 2010-11restated

Department for Communities and Local Government Accounts 2011-12 Notes to the Departmental Accounts
148
(iv) Total provisions £’000
Core Department
Core Department & Agency
Departmental Group
Core Department
Core Department & Agency
Departmental Group
Open balance at 1 April 86,721 87,243 288,037 145,620 146,499 351,287Increase 2,282 2,702 32,944 49,750 50,031 71,882Utilisation (18,969) (19,441) (65,153) (3,708) (4,312) (30,076)Reversal (39,338) (39,422) (43,849) (103,732) (103,817) (103,912)Unwinding 1,041 1,058 2,633 (1,209) (1,158) (1,144)Balance at 31 March 31,737 32,140 214,612 86,721 87,243 288,037Comprising:Current liabilities 9,748 10,061 37,696 57,185 57,530 88,486Non-current liabilities 21,989 22,079 176,916 29,536 29,713 199,551Balance at 31 March 31,737 32,140 214,612 86,721 87,243 288,037
2011-12 2010-11restatedTotal Provisions and
Liabilities
£’000
Early Retirement and Pension
Costs
ERDF Financial Corrections Other Total
Not later than one year 19,456 34,693 3,602 57,751
Later than one year and not later than five yea 20,748 - 6,135 26,883Later than five years 2,741 - 4,098 6,839Balance at 31 March 2011 42,945 34,693 13,835 91,473Not later than one year 6,818 - 30,877 37,695Later than one year and not later than five yea 16,174 - 113,908 130,082Later than five years 1,359 - 43,636 44,995Balance at 31 March 2012 24,351 - 188,421 212,772
Note 24. Pensions Staff of the core department and PINS are civil servants and pensions are provided under the Principal Civil Service Pension Scheme (PCSPS). The department is also responsible for the Firefighters Pension Scheme (1992). The staff of NDPBs are members of a number of different pensions schemes and full details are available in the accounts of the bodies concerned. Pension liabilities at the end of the year for the relevant schemes are recognised in the Consolidated Statement of Financial Position as shown below.

Department for Communities and Local Government Accounts 2011-12 Notes to the Departmental Accounts
149
£’000
funded unfunded total funded unfunded total funded unfunded totalAnalysis of movement in scheme liabilitesat 31 March 2011 - 1,934 1,934 - 1,934 1,934 134,328 16,544 150,872Current service cost - - - - - - 12,988 - 12,988Past service cost - - - - - - - -Adjustment for contributions - - - - - - (69,484) (614) (70,098)Benefit paid - (156) (156) - (156) (156) (41,680) (497) (42,177)Actuarial (gain)/loss - 108 108 - 108 108 30,076 1,190 31,266Interest charges - 104 104 - 104 104 29,007 349 29,356Expected return on assets - - - - - - (27,716) - (27,716)Expected gains and losses on scheme liabilites - - - - - - 361 -
Other asset and liability changes - - - - - - 2,661 - 2,661at 31 March 2012 - 1,990 1,990 - 1,990 1,990 70,541 16,972 87,513of which:Non Current - 1,834 1,834 - 1,834 1,834 58,956 16,816 75,772Current - 156 156 - 156 156 11,585 156 11,741
Core department Core department & Agency Departmental Group
361
£’000
funded unfunded total funded unfunded total funded unfunded totalAnalysis of movement in scheme liabilitesat 31 March 2010 restated - 2,220 2,220 - 2,220 2,220 226,437 18,476 244,913Current service cost - - - - - - 17,131 - 17,131Past service cost - (263) (263) - (263) (263) (56,096) (724) (56,820)Adjustment for contributions - - - - - - (26,566) (560) (27,126)Benefit paid - (115) (115) - (115) (115) (5,992) (455) (6,447)Actuarial (gain)/loss - - - - - - (27,603) (549) (28,152)Interest charges - 92 92 - 92 92 31,605 356 31,961Expected return on assets - - - - - - (26,022) - (26,022)Expected gains and losses on scheme liabilites
- - - - - - (132) - (132)
Other asset and liability changes - - - - - - 1,566 - 1,566at 31 March 2011 restated - 1,934 1,934 - 1,934 1,934 134,328 16,544 150,872of which:Non Current - 1,778 1,778 - 1,778 1,778 132,329 16,388 148,717Current - 156 156 - 156 156 1,999 156 2,155
Core department Departmental GroupCore department & Agency
The Principal Civil Service Pension Scheme (PCSPS)
The PCSPS is an unfunded multi-employer defined benefit scheme, but the department is unable to identify its share of the underlying assets and liabilities. The scheme actuary valued the scheme as at 31 March 2007. Details can be found in the Resource Accounts of the Cabinet Office: Civil Superannuation (www.civilservice.gov.uk/pensions) For 2011-12, employers’ contributions of £21,280,141 (2010-11:£28,012,896) were payable to the PCSPS at one of four rates in the range 16.7% to 24.3% of pensionable pay, based on salary bands. The scheme’s actuary reviews employer contributions usually every four years following a full scheme valuation. The contribution rates are set to meet the cost of benefits accruing during 2011-12 to be paid when the member retires and not the benefits paid during this period to existing pensioners.

Department for Communities and Local Government Accounts 2011-12 Notes to the Departmental Accounts
150
Employees can opt to open a partnership pension account, a stakeholder pension with an employer contribution. Employers’ contributions of £42,936 (2010-11: £32,182) were paid to one or more of a panel of three appointed stakeholder pension providers. Employer contributions are age-related and range from 3% to 12.5% of pensionable pay. Employers also match employee contributions up to 3% of pensionable pay. In addition, employer contributions of £6,022 (2010-11: £2,980) 0.8% of pensionable pay, were payable to the PCSPS to cover the cost of the future provision of lump sum benefits on death in service and ill health retirement of these employees.
Contributions due to the partnership pension providers at the accounting sheet date were £1,584(2010-11: £600). Contributions prepaid at that date were nil.
Four staff (2010-11: nil) retired early on ill-health grounds; the additional accrued pension liabilities in the year amounted to £nil (2010-11: £nil).
The Firefighters’ Pension Scheme 1992 (FPS)
The Department recognises a liability under the FPS for certain individuals who were on secondment to central government at the time of their retirement. The benefits provided by the FPS are set out in the Firemen’s Pension Scheme Order 1992 (SI 1992/129) as amended. The scheme is unfunded. There is no surplus or deficit. Benefits are paid as they fall due and are guaranteed by the employer.
Reconciliation of movement of Firefighters’ Pension Scheme is shown below: £’000
Value at 31.03.2012 Value at 31.03.2011 Value at 31.03.2010
Liability in respect of:Active members - -Current pensioners 1,990 1,934 2,220Total value of scheme liabilities 1,990 1,934 2,220
Present Value of scheme liabilities
Note 25. Capital commitments Contracted capital commitments at 31 March 2012 not otherwise included in these financial statements:
£'000
Core Department
Core Department &
Agency
Departmental Group
Core Department
Core Department &
Agency
Departmental Group
Property, Plant and Equipment 211 211 211 2,283 2,283 2,283Intangible assets 266 266 354 172 172 172Development assets - - 7,785 - - 10,285Overall total 477 477 8,350 2,455 2,455 12,740
2011-122010-11
Restated

Department for Communities and Local Government Accounts 2011-12 Notes to the Departmental Accounts
151
Note 26. Commitments Under Leases 26.1 Operating Leases Total future minimum lease payments under operating leases are given in the table below for each of the following periods. £'000
Core Department
Core Department &
Agency
Departmental Group
Core Department
Core Department &
Agency
Departmental Group
Buildings:Payment due within 1 year 22,998 24,973 30,185 23,018 24,956 32,550Payment due after 1 year but not more than 5 years 74,849 82,749 89,956 87,793 95,544 113,234
Payment due thereafter 54,239 62,139 62,442 69,990 79,679 92,000Total value of obligations 152,086 169,861 182,583 180,801 200,179 237,784Other:Payment due within 1 year 8 35 769 46 107 1,366Payment due after 1 year but not more than 5 years 13 13 226 53 82 973
Payment due thereafter - - - - -Total value of obli
-gations 21 48 995 100 190 2,340
Core Department
Core Department &
Agency
Departmental Group
Core Department
Core Department &
Agency
Departmental Group
Buildings:Receipts due within 1 year - - 4,848 - - 2,340Receipts due after 1 year but not more than 5 years - - 11,740 - - 4,573
Receipts due thereafter - - 122,768 - - 12,097Total value of receivables - - 139,356 - - 19,010
Receipts under operating sub-leases comprise:
2011-12 2010-11Restated
2011-12 2010-11RestatedObligations under operating leases
comprise:

Department for Communities and Local Government Accounts 2011-12 Notes to the Departmental Accounts
152
26.2 Finance Leases Total future minimum lease payments under finance leases are given in the table below for each of the following periods
£'000
Core Department
Core Department &
Agency
Departmental Group
Core Department
Core Department &
Agency
Departmental Group
Buildings:Payment due within 1 year 8,092 8,092 8,940 6,624 6,624 7,667Payment due after 1 year but not more than 5 years 44,448 44,448 45,820 29,089 29,089 31,216
Payment due thereafter 149,985 149,985 150,322 139,828 139,828 140,257Less interest element (89,996) (89,996) (90,403) (75,197) (75,197) (75,197)Present value of obligations 112,529 112,529 114,679 100,344 100,344 103,943
Core Department
Core Department &
Agency
Departmental Group
Core Department
Core Department &
Agency
Departmental Group
Buildings:Lease liabilities due within 1 year 1,497 1,497 2,251 1,457 1,457 2,354Lease liabilities due after 1 year but not more than 5 years 13,519 13,519 14,784 9,107 9,107 11,044
Lease liabilities due thereafter 97,513 97,513 97,644 89,780 89,780 89,993Present value of obligations 112,529 112,529 114,679 100,344 100,344 103,391
Core Department
Core Department &
Agency
Departmental Group
Core Department
Core Department &
Agency
Departmental Group
Buildings:Receipts due within 1 year - - 223 - - 223Receipts due after 1 year but not more than 5 years - - 892 - - 892
Receipts due thereafter - - 2,329 - - 2,552Less interest element - - (1,587) - - (1,736)Present value of receivables - - 1,857 - - 1,931
Core Department
Core Department &
Agency
Departmental Group
Core Department
Core Department &
Agency
Departmental Group
Buildings:Lease entitlements due within 1 year - - 80 - -Lease entitlements due after 1 year but not more than 5
74
years - - 391 - - 361
Lease entitlements due thereafter - - 1,386 - - 1,496Present Value of receivables - - 1,857 - - 1,931
2011-12 2010-11RestatedReceivables under finance leases
comprise:
Present Value of receivables under finance leases comprise:
2011-12 2010-11Restated
2010-11Restated
2010-11RestatedPresent Value of payables under
finance leases comprise:
Obligations under finance leases comprise:
2011-12
2011-12
Note 27. Other financial commitments The department, its agencies and NDPBs have entered into non-cancellable contracts (which are not leases or PFI contracts). The payments to which the department, its agencies and NDPBs are committed, analysed by the period during which the commitment expires are as follows:

Department for Communities and Local Government Accounts 2011-12 Notes to the Departmental Accounts
153
£'000
Core Department
Core Department &
Agency
Departmental Group
Core Department
Core Department &
Agency
Departmental Group
Payment due within 1 year 42,625 42,987 43,026 71,525 71,525 85,183Payment due after 1 year but not more than 5 years 158,379 158,379 158,379 162,781 163,421 163,905
Payment due thereafter 29,921 29,921 29,921 63,843 63,843 63,843Total Obligations 230,925 231,287 231,326 298,148 298,788 312,930
Obligations under financial commitments:
2011-12 2010-11Restated
Note 28. Contingent liabilities disclosed under IAS 37 In accordance with Government policy, none of the properties included in non-current assets in the Statement of Financial Position is insured. Other contingent liabilities are set out below.
£'000 31-Mar-12 31-Mar-11
28.1 DCLG - The department has around 200 cases managed by Treasury Solicitors with associated potential adverse costs.
541
475
28.2 DCLG - The Department has made a commitment to fund pension deficits on certain Arms Length Bodies (ALBs). The timing and value of this payment are difficult to predict. The most significant deficit relates to the Audit Commission Pension Scheme. A Crown Guarantee has been provided to the scheme trustees to avoid early crystallisation of the liabilities as a result of the weakening of the employer covenant in the context of the Audit Commission's forth coming closure.
Unquantifiable
Unquantifiable
28.3 DCLG - Claim for repair or repurchase of defective Right To Buy homes sold by local authorities between 1980 and 1985.
250 to 750
250 to 750
28.4 DCLG - Potential contractual liability arising from the Tenant Deposit Protection Scheme. Unquantifiable Unquantifiable
28.5 DCLG - Potential liability for restitution claims in respect of local property enquiry searches. Unquantifiable n/a
28.6 DCLG - NewBuy - claims from mortgage lenders. Potential losses from the proposed NewBuy scheme to underwrite a % of mortgage lending risk. Unquantifiable but capped at £1bn.
Unquantifiable n/a
28.7 DCLG - Statutory Contingent Liability taken on under the provisions of the Banking Act 2009 in respect of Homeowners Support Scheme.
993 993
28.8 DCLG - Formal notice of infraction proceeding against the UK Government for failure to adequately implement the Energy Performance of Buildings Directive, in particular, provisions for ensuring effective compliance and enforcement with its requirements.
Unquantifiable n/a
28.9 DCLG - The Mayor of London expects to use Community Infrastructure Levy (CIL) to raise £301m between 2012/13 & 2018/19 for the Abbeywood Spur of cross rail through CIL. DCLG could potentially be called on to fund any annual shortfall.
10,000-300,000 10,000-300,000
28.10 LTGDC : Land at Broadway/Ferrylane - valued at £400k at 31 Mar 2011, if the site was developed in a manner(subject to planning approval), such that it can achieve a value above £560k then a claw back provision would apply. This claw back is on a 50:50 basis with the previous owner for any amounts over £560k. However, if 80% of the site is used for public open space, then the claw back provision is not enforceable.
Unquantifiable n/a
28.11 LTGDC : The total grant received under the agreement with the Greater London Authority (GLA) was £711,000 this is the figure that could be sought to be recovered by the GLA if the Lea River Park Phase 1 Walk project is not delivered.
711 n/a
28.12 PINS - Litigation costs which may possibly be incurred following unsuccessful attempts to resist a High Court challenge to an Inspector's decision. The timing and value of such awards are difficult to predict..
730 n/a

Department for Communities and Local Government Accounts 2011-12 Notes to the Departmental Accounts
154
31-Mar-12 31-Mar-11
28.13 HCA : The HCA, together with 19 other public sector bodies has jointly and severally guaranteed the payment of interest and capital in respect of up to £100m of 8.75% guaranteed loan stock of Home Group. The HCA’s currently assessed share of this contingent liability is 21.65%, and the repayment of capital is due in 2037. The guarantee was issued with the Secretary of State's consent. In the event of Home Group failing to make good any default within two months, the HCA and other guarantors are entitled to take a first legal charge on sufficient of Home Group’s saleable assets as represents adequate security for the debt.
21,650 21,650
28.14 HCA : The freeholds of several hundred properties on two estates in Washington were transferred to Sunderland City Council on 1 April 1997. The transfer was subject to a HCA indemnity valid for a period of 30 years against costs which may be incurred in remedying shale related defects. This indemnity was issued with the approval of DCLG. The extent of the potential liability is unquantifiable at this time.
Unquantifiable Unquantifiable
28.15 HCA : The HCA is potentially liable for miscellaneous claims by developers, contractors and individuals in respect of costs and claims not allowed for in development agreements, construction contracts, grants and claims such as Compulsory Purchase Orders. Payment, if any, against these claims may depend on lengthy and complex litigation and potential final settlements cannot be determined with any certainty at this time. As claims reach a more advanced stage they are considered in detail and specific provisions are made in respect of those liabilities to the extent payment is considered probable.
Unquantifiable n/a
28.16 LTGDC reported a contingent liability in 2010-11 in respect of two Compulsory Purchase Orders (CPOs) – Lea River Park and Bromley by Bow South. In the event neither CPO was completed in the manner expected so this contingent liability is not required to be reported in 2011-12.
n/a 5,300
28.17 Linked to 28.16 above LTGDC also reported a contingent liability in 2010-11 relating to the agreed Bromley by Bow South section 106 planning agreement. As the CPO did not proceed as expected this contingent liability is no longer required in 2011-12.
n/a 1,400
28.18 LTGDC reported a contingent liability in 2010-11 in relation to a site disposal at Dagenham Dock (London Sustainable Industries Park). In the event this disposal did not proceed and this contingent liability is therefore no longer required in 2011-12.
n/a 2,700
28.19 TTGDC - The Corporation reported a contingent liability in its 2010-11 accounts concerning a contractual liability to meet the relocation costs of the Royal Mail Group in relocating its Grays Sorting Office. This contingent liability is not reported in 2011-12 because TTGDC’s functional activities were transferred to Thurrock District Council on 31 March 2012 as part of the closure of the Corporation.
n/a Unquantifiable
28.20 WNDC - The Corporation held a specific provision for existing planning appeals but did not hold a general contingency for appeal costs. However, as part of the closure of the Corporation, the Corporation is no longer the Planning Authority so this contingent liability is not required in 2011-12.
n/a Unquantifiable
28.21 WNDC - The Corporation recognises that the VAT recovered on the land acquired in 2007-08 may be repayable to HM Revenue & Customs if sold, depending upon the VAT status of the subsequent purchaser.
Unquantifiable Unquantifiable

Department for Communities and Local Government Accounts 2011-12 Notes to the Departmental Accounts
155
Note 29. Contingent liabilities not required to be disclosed under IAS 37 but included for parliamentary reporting and accountability purposes
Quantifiable: The department has entered into the following quantifiable contingent liabilities by offering guarantees, indemnities or by giving letters of comfort. This is not a contingent liability within the meaning of IAS 37 since the likelihood of a transfer of economic benefit in settlement is too remote
£'000
01-Apr-11
Increase in year
Liabilities crystallised
in year
Obligation expired in
year
31-Mar-12
Amount reported to Parliament
by departmental
minute
Indemnities Core Department - - - - - -
Core Department & Agency - - - - - -
DCLG Consolidated - - - - - -
Unquantifiable: The department has entered into the following unquantifiable contingent liabilities by offering guarantees, indemnities or by giving letters of comfort. None of these is a contingent liability within the meaning of IAS 37 since the likelihood of a transfer of economic benefit in settlement is too remote.
• Indemnity given to the Fire and Rescue Services in respect of possible incidents as a result of mass decontamination.
• Letter of Comfort Provided to the Fire Service College to confirm that the department will act as funder of last resort for the College and will provide financial aid to the college should it be unable to fund its on-going operations from its own resources.
Note 30. Contingent assets disclosed under IAS 37 £'000
31-Mar-12 31-Mar-11 30.1 LTGDC's agreement with the London Development Agency relating to a substation at
Dagenham Dock (LSIP) on LTGDC owned land provides for a 50% overage payment. This would only occur when LTGDC are able to reserve demand capacity from the main electricity sub-station for non LSIP businesses.
Unquantifiable n/a
30.2 HCA has in certain instances disposed of land on the basis that if there is a subsequent change in use of the land, which materially increases the return to the purchaser, HCA has a right to participate in the returns achieved. The normal term during which this arrangement remains in force is 21 years. For social housing and other community related schemes the term is more usually 35 years. By its nature this income is variable and the timing of receipt is uncertain, therefore it is not possible to quantify the likely income which may ultimately be received by HCA.
Unquantifiable n/a
30.3 WNDC – the Corporation has entered into a grant funding agreement with Northamptonshire County Council in respect of the London Road Junction Improvements capital project which is due to complete in 2012. This agreement establishes potential income from a project management recharge, the recovery of which is anticipated might be in the next financial year but the timing and amount is uncertain.
n/a Unquantifiable

Department for Communities and Local Government Accounts 2011-12 Notes to the Departmental Accounts
156
Note 31. Losses, Special Payments and Gifts Managing Public Money and the FReM require a statement showing losses and special payments by value and by type to be shown where they exceed £250,000 in total and those which individually exceed £250,000. These relate to cash losses, stores, fruitless payments and claims abandoned as well as frauds. The amounts involved are as follows:
31-Mar-12 31-Mar-11
Core Department
Core Department &
Agency Consolidated Core
Department Core
Department & Agency
Consolidated
Cases £'000 Cases £'000 Cases £’000 Cases £'000 Cases £'000 Cases £'000 Losses 14 17 14 17 14 17 11 6 11 6 11 6 Claims abandoned 84 11,118 84 11,118 84 11,118 64 4,688 64 4,688 64 4,688 Fruitless payments 1 213 20 214 20 214 - - - - - - Constructive losses - - - - 10 104 20 211,825 20 211,825 20 211,825
In 2011-12 there were 8 individual claims abandoned of over £250,000 worth £8.774m detailed below:
£’000 Claims abandoned over £250k
ERDF write-off: Business Link Tyne & Wear 2,277
ERDF write-off: Business Link Tees Valley 1,781
ERDF write-off: Groundwork 1,696
ERDF write-off: Ennerdale 921
ERDF write-off: Nottingham City Council 884
ERDF write-off: Sheffield Community Enterprise 437
ERDF write-off: GOWM Automotive Supplier Diversification 410
ERDF write-off: Screen East 368
Special payments 2011-12 2010-11 Cases £’000 Cases £’000
59 1,769 115 2,718
No special payments recorded in the accounts for 2011-12 were over £250,000.
During the year the department gifted one item worth less than £1k. There were no individual items over £250,000.

Department for Communities and Local Government Accounts 2011-12 Notes to the Departmental Accounts
157
Note 32. Impact of Clear Line of Sight (CLoS) boundary and Machinery of Government transfers
As detailed in section 7 of these accounts, the impact of changes arising from CLoS boundary changes and Machinery of Government transfers is reflected below.
£’000
At 31 March 2011 As reported in DCLG accounts
Changes arising from inclusion of ALBs Eliminations Restated for
2011-12 Total assets 1,180,323 1,847,480 - 3,027,803Total liabilities 1,605,359 576,540 - 2,181,899Total assets less liabilities (425,036) 1,270,940 - 845,904 Total reserves (425,036) 1,270,940 - 845,904Comprising:
General reserves (443,511) 1,285,326 - 841,815Revaluation reserve 18,475 132,171 - 150,646Pension reserve - (146,557) - (146,557)
For 2010-11 Income (1,498,268) (138,653) 2,196 (1,634,725)Expenditure 33,868,454 4,252,970 (2,196) 38,119,228Grant in Aid 4,236,319 - (4,234,896) 1,423Net expenditure 36,606,506 4,114,317 (4,234,896) 36,485,927
£’000
At 31 March 2011 As restated for CloS – see above
Changes arising from MoGs Eliminations
Restatement in the 2011-12 DCLG group
accounts Total assets 3,027,803 730,409 - 3,758,212Total liabilities 2,181,899 169,550 - 2,351,449
Total assets less liabilities 845,904 560,859 - 1,406,763 Total reserves 845,904 560,859 - 1,406,763Comprising:
General reserves 841,815 531,323 - 1,373,138Revaluation reserve 150,646 29,536 - 180,182Pension reserve (146,557) - - (146,557)
For 2010-11 Income (1,634,725) (17,653) - (1,652,378)Expenditure 38,119,229 231,743 - 38,350,972Grant in Aid 1,423 158,381 (158,381) 1,423Net expenditure 36,485,927 372,471 (158,381) 36,700,017
The most significant element of the above was the transfer of regeneration assets from the RDAs into HCA, full details are in the HCA’s published accounts for 2011-12.

Department for Communities and Local Government Accounts 2011-12 Notes to the Departmental Accounts
158
Changes arising from prior period adjustments in respect of the de recognition of Government Grant and Donated Asset reserves have no impact on overall reserves and therefore are not separately identified in the tables above.
Comparative data in the SoPS has been restated to reflect the bringing into Estimates of supported Capital Expenditure – in Estimates in 2011-12 but not in Estimates in 2010-11
The impact on outturn of this is reflected below: £’000
2010-11 Outturn
2010-11Outturn Restated
Departmental Expenditure Limit:- Capital 5,380,187 6,002,378
Annually Managed Expenditure:- Capital 842,972 842,972
Total Capital 6,223,159 6,845,350
Note 33. Related Party Transactions The department is the parent department of the Planning Inspectorate and a number of sponsored bodies listed in Note 36. These bodies are regarded as related parties with which the department has had various material transactions during the year.
In addition, the department and its sponsored bodies have made a number of material transactions with other government departments, central government bodies and local government organisations.
Non-Executive Board members must declare to the Permanent Secretary any personal or business interest which may, or may be perceived to, influence their judgement as a Board member.
Stephen Park was employed as Interim Senior Finance Director until 30 June 2011 and owns shares in Ashley Interim Management Limited. Stephen’s services were provided through contracts between Ashley Interim Management Limited and Capita plc and between Capita plc and the department. The expenditure through this contract was £110,020 including VAT in 2011-12. There are no outstanding balances with Ashley Interim Management Limited. Shirley Pointer was a Non Executive Trustee of the Whitehall and Industry Group during 2011-12. This was an unpaid position. The department paid an annual subscription to this group of £3,950 in 2011-12.
During the year no board member, key manager or other related parties, other than those mentioned above, has undertaken any material transactions with the department. Departmental Ministers make specific disclosure of financial interests as required by the Ministerial Code of Conduct.
Note 34. Events after the reporting period The department’s financial statements are laid before the Houses of Commons by HM Treasury. IAS10 requires the department to disclose the date on which the accounts are authorised for issue. This is the date on which the certified accounts are dispatched by the department’s management to HM Treasury. The authorised date for issue is 27 June 2012.
On 1 April 2012, the Homes and Communities Agency took on certain regulatory functions from the Tenant Services Authority, and at the same time transferred its London functions to the Greater London Authority.

Department for Communities and Local Government Accounts 2011-12 Notes to the Departmental Accounts
159
On 1 April 2012, the Independent Planning Commissions functions were transferred to Planning Inspectorate via a Machinery of Government transfer.
London Thames Gateway transferred assets and liabilities to London Legacy Development Corporation on 01 April 2012 of £596k and to the Greater London Authority on 16 April 2012 of £24,358k.
The Queen Elizabeth II Conference Centre is a departmental executive agency with trading fund status; it is not within the consolidation boundary. Ministers announced on 23 April 2012 that the department would be undertaking pre-market engagement during this year to explore options for the future of the Queen Elizabeth II Conference Centre business. Following that, ministers would decide whether it should continue under existing arrangements, or be marketed to external providers. The announcement also stated that the department would retain the freehold of the building.
The Fire Service College is a departmental executive agency with trading fund status. On 10 April 2012, following a period of pre-market engagement, Ministers announced it was commencing the sale process for the Fire Service College and that it welcomed expressions of interest from potential bidders. This follows the Government's announcement in March 2012 that to secure the future of the College it intended to dispose of it as a going concern.
Note 35. Third Party Assets Twinning with EU Accession States Twinning projects involve the secondment of one or more experts (Resident Twinning Advisers - RTAs) from EU Member States to new Member States or pre-accession states (beneficiary countries) for a period usually of at least 12 months. The desired outcome is to improve institutional capacity for a particular country or region, managing significant levels of Structural Funds receipts under post-accession European programmes. This is achieved through training and expert advice provided by the successful Member State.
The projects are funded by the European Commission through a competitive bidding process between Member States department won eight Structural Fund Twinning projects between 2004-05 which were completed successfully during 2005-06. In 2006-07 two more twinning projects were won by the department, one in North East Romania and one in Turkey. Both of these projects are now closed.
The projects have bank accounts, which are managed by the department, but these are not departmental assets and are not included in the departmental accounts. The assets held at the accounting date comprised these monetary assets in the bank accounts. The bank accounts are denominated in euros and all transactions through the accounts are in euros. These values are set out in the table below, together with a translation to sterling at the accounts date using the €:£ exchange rate of 1.20:1.
Projects 1 April 2011
€000 Gross Inflows
€000
Gross Outflows
€000
31 March 2012 €000
31 March 2012 £000
General Twinning 624 - - 624 520

Department for Communities and Local Government Accounts 2011-12 Notes to the Departmental Accounts
160
Note 36. Entities within the departmental boundary The entities within the boundary during 2011-12 were as follows: Title
Role & Future Included in consolidation
Y/N Executive Agencies
Planning Inspectorate
To help shape well planned environments and deliver sustainable development through examination of local development plans, and processing appeals and other casework arising from planning and allied legislation. From 1 April 2012, to advise ministers on major infrastructure projects. http://www.planningportal.gov.uk/planning/planninginspectorate/
Y
Advisory Bodies - Advisory NDPBs are expert bodies normally established to advise Ministers and Officials on specific policy areas where the expertise does not exist within the department. Most members of such bodies are unpaid, although several bodies' chairpersons and members do receive a daily fee for attendance of meetings and other work. Building Regulations Advisory Committee
BRAC advises the relevant Secretary of State on the exercise of his/her power to make Building Regulations and on other related subjects in England and Wales.
Y
Tribunals
Rent Assessment Panels / Residential Property Tribunal Service.
An umbrella organisation for the five regional offices called Rent Assessment Panels set up to provide an independent, fair and accessible tribunal service in England for settling disputes involving private rented and leasehold property. This body transferred to the Ministry of Justice HM Courts and Tribunal Service – July 2011
N
Valuation Tribunal for England
An independent appeals tribunal, funded by Parliament, to handle council tax and rating appeals in England. Following the public bodies review It is proposed that jurisdiction be transferred to the Land, Property and Housing Chamber in the First-tier Tribunal – Ministry of Justice. Transfer date to be confirmed.
Y
Executive Non-Departmental Public Bodies (NDPBs)
Community Development Foundation
To promote effective participation of people in the decision-making processes which affect their lives. On 1 April 2011, the Community Development Foundation status as a departmental NDPB ceased - it is now a registered charity.
N
Firebuy Ltd To deliver English Fire and Rescue Service (FRS) procurement at a national level. Firebuy ceased trading on 13 July 2011.
Y
Homes and Communities Agency
To create opportunity for people to live in high-quality, sustainable places. To provide funding for affordable housing, bring land back into productive use and enable local authorities to achieve housing and regeneration ambitions for their own areas. On 1 April 2012 - Homes and Communities Agency took on regulation of social housing function from the abolished Tenant Services Authority and its London functions devolved to the Mayor of London. http://www.homesandcommunities.co.uk/
Y

Department for Communities and Local Government Accounts 2011-12 Notes to the Departmental Accounts
161
Title
Role & Future Included in consolidation
Y/N Independent Housing Ombudsman Ltd
To provide a free, independent and impartial service to review complaints about registered housing providers, including housing associations and other landlords, managers, and agents. http://www.housing-ombudsman.org.uk/
Y
Infrastructure Planning Commission
Independent body that examined applications for nationally significant infrastructure projects. Abolished 31 March 2012 and replaced by a new unit within the Planning Inspectorate, which will advise ministers on major infrastructure projects.
Y
The Leasehold Advisory Service
Provides free legal advice and information on all aspects of residential leasehold law in England and Wales. The future of this body is under consideration and the Department is looking at the appropriate way to provide its services. http://www.lease-advice.org/
Y
London Thames Gateway Development Corporation
To promote and deliver sustainable regeneration and growth of the London Thames Gateway. By April 2013 this body will no longer be an NDPB – functions to be devolved to local government or other London bodies. http://ltgdc.org.uk/
Y
Standards Board for England
To champion and promote high standards of conduct among local politicians. This body is no longer an NPDB – body and function was abolished on 31 March 2012.
Y
The Office for Tenants and Social Landlords
More commonly known as Tenant Services Authority. To raise the standards of services for affordable housing tenants. This body was abolished on 31 March 2012, with regulatory functions passed to the Homes and Communities Agency. http://www.homesandcommunities.co.uk/
Y
Thurrock Thames Gateway Development Corporation
To drive economic growth in Thurrock and create homes, jobs and opportunities. Following the public bodies review the Development Corporation ceased its functions on 31 March 2012 and final dissolution of the Corporation will be at the end of October 2012.
Y
Valuation Tribunal Service
To provide the administrative function for the Valuation Tribunal for England. Following the public bodies review It is proposed that this body be abolished and functions transferred to the Ministry of Justice HM Courts and Tribunal Service. Date to be confirmed. http://www.valuationtribunal.gov.uk/Home.aspx
Y
West Northamptonshire Development Corporation
To promote and deliver new jobs, homes and investment in the three towns of Northampton, Daventry and Towcester. Following the public bodies review it is proposed that this body will no longer be an NDPB. The functions are to be devolved to local government by March 2014. http://www.wndc.org.uk/
Y
Other Bodies Not Classed as NDPBs
Commission for Local Administration in England
More commonly known as the Local Government Ombudsman. Investigates complaints about councils (and some other bodies) in England on housing, planning, education, social services, council tax, housing benefit and highways. http://www.lgo.org.uk/
Y

Department for Communities and Local Government Accounts 2011-12 Notes to the Departmental Accounts
162
Title
Role & Future Included in consolidation
Y/N Trading Funds
Fire Service College
The national training college for the Fire and Rescue Service is a trading fund (ie it makes fees and charges to fund its activities). The department has announced a pre-market engagement with the view to selling the College as a going concern to the private sector by March 2013.
N
Ordnance Survey The national mapping agency for Great Britain. The body transferred to Department for Business Innovation and Skills in July 2011
N
Queen Elizabeth II Conference Centre
Located in Westminster, the Centre specialises in events for 40 to 1,300 delegates and is a trading fund. DCLG will explore options for the future of the Queen Elizabeth II Conference Centre business during summer 2012
N
Public Corporations
Architects Registration Board
Independent regulator of all UK-registered architects.
N
Audit Commission for Local Authorities and the National Health Service in England
Independent watchdog, driving economy, efficiency and effectiveness in local public services. From 1 September 2012 local public bodies will have a private sector auditor appointed by the Audit Commission. A much smaller Audit Commission will remain in place to oversee the contracts and other statutory functions until its closure.
N

Department for Communities and Local Government Accounts 2011-12 Trust Statement in respect of National non-Domestic Rates
163
TS1 Trust Statement in respect of National Non-Domestic Rates collected on behalf of the Consolidated Fund
Foreword Scope
1.1 This Trust Statement is produced by the Department for Communities and Local Government and is in accordance with the Accounts Direction issued by HM Treasury. This statement is prepared on an accruals basis.
1.2 The Trust Statement presents the results for the financial year 2011-12 in respect of the collection of National Non Domestic Rate receipts from local authorities and businesses and the payment to the Consolidated Fund of those receipts.
1.3 Costs incurred in the collection of National Non Domestic Rates are borne by local authorities and an assessed amount for collection is deducted from amounts remitted.
1.4 From 2012-13 the amount assessed for collection will be reflected as collection costs in the Trust Statement and the amounts collected from local authorities shown gross of the collection costs
Background 1.5 The department acts as an agent for the Consolidated Fund and receives cash in
respect of National Non-Domestic Rates which is paid over to the Consolidated Fund. These receipts do not flow through the department’s Statement of Comprehensive Net Expenditure but instead are held on the Statement of Financial Position as a liability until paid over to the Consolidated Fund. At the year end, all receipts recognised, for which the cash has been received, have been paid over to the Consolidated Fund. Any receipts recognised but for which the cash has not been received will be shown in the following Trust Statement as current liabilities.
Future events 1.6 The government intends to introduce a system of local business rates retention from
2013-14 onwards. Subject to the passage of legislation, this would mean that the year ending 2012-13 will be the last year that the Trust Statement appears in this format with the same being applicable for the NNDR White Paper account in 2013-14
Financial review 1.7 The results presented in this Trust Statement are limited to this Trust Statement and
are not also presented in the department’s Accounts although they flow through the department’s accounting system.
1.8 Any cash receipts or payments are presented through the Statement of Cash Flows in the Trust Statement only and are excluded from the department’s Consolidated Statement of Cash Flows.
Auditors 1.9 The Trust Statement is audited by the Comptroller and Auditor General under Section
7 of the Government Resources and Accounts Act 2000. The audit opinion is on pages

Department for Communities and Local Government Accounts 2011-12 Trust Statement in respect of National non-Domestic Rates
164
167 to 168. The auditor's notional remuneration of £36,000 for this is included in the department’s Accounts. There were no fees in respect of non-audit work. Basis for preparation
1.10 The HM Treasury Accounts Direction, issued under section 7(2) of the Government Resources and Accounts Act 2000, requires the Department for Communities and Local Government to prepare the Trust Statement to give a true and fair view of the position relating to the receipt and payover of National Non-Domestic Rates. Regard is given to all relevant accounting and disclosure requirements given in Managing Public Money and other guidance issued by HM Treasury.
Events after the reporting period 1.11 There were no events after the reporting period.
Sir Bob Kerslake 27 June 2012 Accounting Officer Department for Communities and Local Government

Department for Communities and Local Government Accounts 2011-12 Statement of the Accounting Officer’s Responsibilities in respect of the Trust Statement
165
TS2 Statement of the Accounting Officer’s Responsibilities in respect of the Trust Statement
2.1 Under section 7 of the Government Resources and Accounts Act 2000, HM Treasury has directed the Department for Communities and Local Government to prepare for each financial year a Trust Statement in the form and on the basis set out in the Accounts Direction. The Trust Statement is prepared on an accruals basis and must give a true and fair view of the state of affairs of National Non-Domestic Rates collected by the department, together with the net amounts surrendered to the Consolidated Fund.
2.2 In preparing the Trust Statement, the Accounting Officer is required to comply with the requirements of the Government Financial Reporting Manual prepared by HM Treasury and, in particular, to:
• observe the Accounts Direction issued by HM Treasury, including the relevant accounting and disclosure requirements, and apply suitable accounting policies on a consistent basis;
• make judgements and estimates on a reasonable basis; • state whether applicable accounting standards, as set out in the Government
Financial Reporting Manual have been followed, and disclose and explain any material departures in the account; and
• prepare the Trust Statement on a going concern basis.
2.3 HM Treasury appointed Sir Bob Kerslake, the permanent head of the department, as principal Accounting Officer of the department on 1 November 2010, and from 14 January 2011 HM Treasury appointed him as the sole Accounting Officer for the department.
2.4 The responsibilities of an Accounting Officer, including responsibility for the propriety and regularity of the public finances for which an Accounting Officer is answerable, for keeping proper records and for safeguarding the department's assets, are set out in the Accounting Officer’s Memorandum issued by HM Treasury and published in Managing Public Money.

Department for Communities and Local Government Accounts 2011-12 Governance Statement in respect of the Trust Statement
166
TS3 Governance Statement in respect of the Trust Statement 3.1 The Department for Communities and Local Government’s Governance Statement,
which covers both the department’s Accounts and the Trust Statement, is shown on pages 87 to 98 of this document.

Department for Communities and Local Government Accounts 2011-12 The Certificate and Report of the Comptroller and Auditor General to the House of Commons in
respect of the Trust Statement
167
TS4 The Certificate and Report of the Comptroller and Auditor General to the House of Commons
I certify that I have audited the financial statements of the National Non-Domestic Rates Trust Statement for the year ended 31 March 2012 under the Government Resources and Accounts Act 2000. The financial statements comprise the Statement of Revenue, Other Income and Expenditure, the Statement of Financial Position, the Statement of Cash Flows and the related notes. These financial statements have been prepared under the accounting policies set out within them.
Respective responsibilities of the Accounting Officer and auditor As explained more fully in the Statement of Accounting Officer’s Responsibilities, the Accounting Officer is responsible for the preparation of the financial statements and for being satisfied that they give a true and fair view. My responsibility is to audit, certify and report on the financial statements in accordance with the Government Resources and Accounts Act 2000. I conducted my audit in accordance with International Standards on Auditing (UK and Ireland). Those standards require me and my staff to comply with the Auditing Practices Board’s Ethical Standards for Auditors.
Scope of the audit of the financial statements An audit involves obtaining evidence about the amounts and disclosures in the financial statements sufficient to give reasonable assurance that the financial statements are free from material misstatement, whether caused by fraud or error. This includes an assessment of: whether the accounting policies are appropriate to the circumstances of the National Non-Domestic Rates Trust Statement and have been consistently applied and adequately disclosed; the reasonableness of significant accounting estimates made by the Department for Communities and Local Government in preparing the Trust Statement; and the overall presentation of the financial statements. In addition I read all the financial and non-financial information in the Department for Communities and Local Government’s Annual Report and the Trust Statement’s Foreword to identify material inconsistencies with the audited financial statements. If I become aware of any apparent material misstatements or inconsistencies I consider the implications for my certificate.
I am required to obtain evidence sufficient to give reasonable assurance that the expenditure and income recorded in the financial statements have been applied to the purposes intended by Parliament and the financial transactions recorded in the financial statements conform to the authorities which govern them.
Opinion on regularity In my opinion, in all material respects:
• the expenditure and income recorded in the financial statements have been applied to the purposes intended by Parliament and the financial transactions recorded in the financial statements conform to the authorities which govern them.

Department for Communities and Local Government Accounts 2011-12 The Certificate and Report of the Comptroller and Auditor General to the House of Commons in
respect of the Trust Statement
168
Opinion on financial statements In my opinion:
• the National Non-Domestic Rates Trust Statement gives a true and fair view of the state of affairs of National Non-Domestic Rates collected by the Department for Communities and Local Government on behalf of the Consolidated Fund at 31 March 2012 and of the total revenue for the year then ended; and
• the financial statements have been properly prepared in accordance with the Government Resources and Accounts Act 2000 and HM Treasury directions issued thereunder.
Opinion on other matters In my opinion:
• the information given in the Department for Communities and Local Government’s Directors’ Report and Management Commentary, and the Trust Statement’s Foreword for the financial year for which the financial statements are prepared is consistent with the financial statements.
Matters on which I report by exception I have nothing to report in respect of the following matters which I report to you if, in my opinion:
• adequate accounting records have not been kept or returns adequate for my audit have not been received from branches not visited by my staff; or
• the financial statements are not in agreement with the accounting records and returns; or
• I have not received all of the information and explanations I require for my audit; or • the Governance Statement does not reflect compliance with HM Treasury’s
guidance.
Report I have no observations to make on these financial statements. Amyas C E Morse 27 June 2012 Comptroller and Auditor General National Audit Office 157-197 Buckingham Palace Road London SW1W 9SP

Department for Communities and Local Government Accounts 2011-12 Trust Statement - Statement of Revenue, Other Income and Expenditure
169
TS5 Statement of Revenue, Other Income and Expenditure
For the period ended 31 March 2012
£000 Note
IncomeLicence Fees and Taxes - -National Non Domestic Rates 3 21,528,638 20,841,879
Total 21,528,638 20,841,879
Total Revenue 21,528,638 20,841,879
2011-12 2010-11
There were no recognised gains or losses accounted for outside the above Statement of Revenue, Other Income and Expenditure. Collection costs in respect of National Non Domestic Rates are borne by local authorities. The notes at pages 172 to 173 form part of this statement.

Department for Communities and Local Government Accounts 2011-12 Trust Statement – Statement of Financial Position
170
TS6 Statement of Financial Position
as at 31 March 2012
£000 Note 31-Mar-12 31-Mar-11
Current assetsReceivables 4 418 -Cash and cash equivalents CfS - -
Total current assets 418 -
Current liabilitiesPayables - -Total current liabilities - -
Total assets less current liabilities 418 -Represented by:Balance on Consolidated Fund 2 418 -
Sir Bob Kerslake 27 June 2012 Accounting Officer Department for Communities and Local Government The notes at pages 172 to 173 form part of this statement

Department for Communities and Local Government Accounts 2011-12 Trust Statement – Statement of Cash Flows
TS7 Statement of Cash Flows
for the period ended 31 March 2012
£000 Note 2011-12 2010-11
Cash flows from operating activities 3 21,528,220 20,841,879Cash paid to the Consolidated Fund (21,528,220) (20,832,556)
Increase/(decrease) in cash in this period - 9,323A: Reconciliation of Net Cash Flow to Movement in Net FundsNet Revenue for the Consolidated Fund 3 21,528,638 20,841,879Increase in receivables 4 (418)
Net Cash Flow from Operating Activities 21,528,220 20,841,879
B: Analysis of Changes in Net FundsIncrease/(decrease) in Cash in this Period - 9,323Net funds at 1 April 2 - (9,323)Net funds at 31 March 2 - -
The notes at pages 172 to 173 form part of this statement .
171

Department for Communities and Local Government Accounts 2011-12 Notes to the Trust Statement
172
TS8 Notes to the Trust Statement
Trust Statement Note 1 Statement of accounting policies Basis of accounting
1.1 The Trust Statement is prepared in accordance with the Accounts Direction issued by HM Treasury under section 7 (2) of the Government Resources and Accounts Act 2000 and is prepared in accordance with the accounting policies detailed below. These have been agreed between the Department for Communities and Local Government and HM Treasury and have been developed with reference to International Financial Reporting Standards and other relevant guidance. The accounting policies have been applied consistently in dealing with items considered material in relation to these statements.
1.2 The revenue and associated expenditure contained in these statements are those flows of funds which Department for Communities and Local Government handles on behalf of the Consolidated Fund and where it is acting as agent rather than as principal.
1.3 The financial information contained in the statements and in the notes is rounded to the nearest £000.
Accounting convention 1.4 The Trust Statement has been prepared in accordance with the historical cost
convention.
Revenue recognition 1.5 Revenue detailed in this Statement is collected on behalf of the Consolidated Fund in
respect of National Non Domestic Rates. Revenue is measured in accordance with IAS 18 and recognised when the underlying event giving rise to the liability to the Consolidated Fund has occurred, can be measured reliably and it is probable that that the economic benefits will flow to the Exchequer. Any adjustments to the amounts to be collected for the Consolidated Fund are not agreed, due or received until the year following the accounting period and are therefore not recognised until that point
Receivables 1.6 Receivables, where applicable, are shown net of impairments in accordance with the
requirements of IAS 39.
Costs of collection 1.7 Collection costs are borne by local authorities. An annual allowance is assessed and
provided to local authorities via a Statutory Instrument. Local Authorities then deduct this allowance from the amount due to the Consolidated Fund.

Department for Communities and Local Government Accounts 2011-12 Notes to the Trust Statement
173
Trust Statement Note 2 Balance on the Consolidated Fund £000
31-Mar-12 31-Mar-11
Balance on Consolidated Fund Account as at 1 April - (9,323)
Net Revenue for the Consolidated Fund 21,528,638 20,841,879Less amount paid to the Consolidated Fund (21,528,220) (20,832,556)
Balance on Consolidated Fund Account as at 31 March 418 -
Trust Statement Note 3 Revenue collected on behalf of the Consolidated Fund £000
2011-12 2010-11
NNDR revenue collectable on behalf of the Consolidated Fund 21,528,638 20,841,879
Total Revenue 21,528,638 20,841,879
Trust Statement Note 4 Receivables £000
31-Mar-12 31-Mar-11
Accrued revenue receivable 418 -
Total receivables 418 -
Accrued revenue receivable represents the amount of revenue from Central List bodies which relate to the financial year but for which invoices had not been issued. All balances are from bodies external to Government

Department for Communities and Local Government Accounts 2011-12 Trust Statement Accounts Direction
174
TS9 Accounts Direction given by HM Treasury in accordance with section 7
(2) of the Government Resources and Accounts Act 2000 1. The department shall prepare a Trust Statement (“the Statement”) for the financial year
ended 31 March 2012 for the revenue and other income, as directed by the Treasury, collected by the department as an agent for others, in compliance with the accounting principles and disclosure requirements of the edition of the Government Financial Reporting Manual by HM Treasury (“FReM”) which is in force for 2011-12.
2. The Statement shall be prepared, as prescribed in appendix 1, so as to give a true and fair view of (a) the state of affairs relating to the collection and allocation of taxes, licence fees, fines and penalties and other income by the department as agent and of the expenses incurred in the collection of those taxes, licence fees, fines and penalties insofar as they can properly be met from that revenue and other income; (b) the revenue and expenditure; and (c) the cash flows for the year then ended.
3. The statement shall also be prepared so as to provide disclosure of any material expenditure or income that has not been applied to the purposes intended by Parliament or material transactions that have not conformed to the authorities which govern them.
4. When preparing the Statement, the department shall comply with the guidance given in the FReM (Chapter 13). The department shall also agree with HM Treasury the format of the Principal Accounting Officer’s Foreword to the Statement, and the supporting notes, and the accounting policies to be adopted, particularly in relation to revenue recognition. Regard shall also be given to all relevant accounting and disclosure requirements in Managing Public Money and other guidance issued by HM Treasury, and to the principles underlying International Financial Reporting Standards.
5. Compliance with the requirements of the FReM will, in all but exceptional circumstances, be necessary for the accounts to give a true and fair view. If, in these exceptional circumstances, compliance with the requirements of the FReM is inconsistent with the requirement to give a true and fair view, the requirements of the FReM should be departed from only to the extent necessary to give a true and fair view. In such cases, informed and unbiased judgement should be used to devise an appropriate alternative treatment which should be consistent with both the economic characteristics of the circumstances concerned and the spirit of the FReM. Any material departure from the FReM should be discussed in the first instance with HM Treasury.
6. The Statement shall be transmitted to the Comptroller and Auditor General for the purpose of his examination and report by a date agreed with the Comptroller and Auditor General and HM Treasury to enable compliance with the administrative deadline for laying the audited accounts before Parliament before the Summer Recess.
7. The Trust Statement, together with this direction (but with the exception of the related appendices) and the Report produced by the Comptroller and Auditor General under section 7(2) of the Government Resources and Accounts Act 2000 shall be laid before Parliament at the same time as the department’s Resource Accounts for the year unless the Treasury have agreed that the Trust Statement may be laid at a later date.
Chris Wobschall Deputy Director, Assurance and Financial Reporting Policy HM Treasury 20 December 2011

Department for Communities and Local Government Accounts 2011-12 Indicators measurements
ANNEX A: Indicator measurements
Affordable Rent payment per dwelling by the HCA This measures the average actual payment per Affordable Rent dwelling by the Homes and Communities Agency (HCA). Affordable Rent is the principal product of the HCAs 2011-15 Affordable Homes Programme. The payment per dwelling represents the capital cost to Government of the supply of new affordable homes and will indicate the level of consistency with the rate of funding agreed with providers at the onset of the 2011-15 programme.
Percentage of local authority revenue expenditure funded by central government grants, broken down by class of authority This indicator demonstrates of the proportion of local government expenditure accounted for by grants from central government (from DCLG and other departments) rather than from authority-raised expenditure such as council taxes and, from 2013-14, business rate retention. As such, a decrease in the percentage will indicate greater decentralisation of funding.
Expenditure per head on the Fire and Rescue Service This demonstrates the cost per head of providing the Fire and Rescue Service and will indicate over time whether the cost is going up or down. This indicator is of total revenue expenditure because the funding from the Department cannot be disaggregated from the total Fire and Rescue funding, which also includes locally raised funds, such as council tax.
Average New Homes Bonus grant payable per dwelling per year to different classes of authority Total New Homes Bonus grant payable for a financial year, divided by number of dwellings rewarded, calculated separately for shire areas, metropolitan areas and London. This indicator measures the average financial reward for housing growth provided through the New Homes Bonus: a key DCLG policy.
Formula Grant per head as a percentage of England average A measure of changes over time in the distribution of Formula Grant across England. Does not include police services. Shire counties include their shire districts. Formula grant is per head of projected population.
Total number of housing starts and completions The seasonally-adjusted numbers of housing starts and completions are lead indicators of overall housing supply and therefore key components of housing delivery estimates. An increase in house building starts and completions will provide a timely measure of the success of house-supply related policies in the Government's Housing Strategy.
Number of net additions to the housing stock These figures measure the increase in the total housing stock (including but not only through new build) to give the overall increase in the supply of housing. Changes over time will help to assess the impact, among other factors, of government policies to increase housing supply.
Number of affordable housing starts and completions delivered through the Homes and Communities Agency This measures number of affordable housing starts and completions delivered through the Homes and Communities Agency, and is likely to include delivery through the Greater London Authority from 2012, when it is due to take on HCA's role in London. These will be lead indicators of a key component of affordable housing delivery. Initially we will expect to see an increase in starts and completions of affordable homes by the HCA in the second six months of 2011/12 which will reflects the break in programmes as we move into the new Affordable Homes Programme. This indicator measures progress on the HCA’s contribution to the additional 170,000 affordable homes that the Department expects to provide by 2015 through the Affordable Homes Programme and existing commitments.
175

Department for Communities and Local Government Accounts 2011-12 Indicators measurements
Energy efficiency of new build housing (average Standard Assessment Procedure energy rating score) Average Standard Assessment Procedure (SAP) energy rating score for new homes. The SAP rating for a home is based on the energy costs associated with space heating, water heating, ventilation and lighting, less cost savings from energy generation technologies. It is expressed on a scale of 1 to 100 - the higher the number, the lower the running costs. Therefore an increase in the SAP rate will show improvements in the average energy efficiency of new homes.
Households in temporary accommodation This demonstrates the number of homeless households in temporary accommodation awaiting a settled home and is seasonally adjusted to remove seasonal fluctuations. Changes to the homelessness duty will allow councils to bring their homelessness duty to an end with offers of suitable private sector accommodation, without requiring the agreement of the person owed the duty. A decrease in the number of households in temporary accommodation will measure the success of this and other housing policies.
Fire-related casualties An indicator of the number of fire-related casualties, including fatalities and 'first aid' cases but excluding precautionary checks (where no obvious injury, but a check-up recommended). It is expressed per 100,000 resident population. Changes in the number of fire-related casualties have been driven by factors including: prevention and community safety interventions by local Fire and Rescue Authorities, the national Fire Kills media campaign promoting smoke alarm ownership and testing, and regulatory measures such as fire safety, building, and furniture and furnishing regulations.
Decentralisation of central government funding through percentage of un-ring fenced grants This demonstrates the percentage of government grants to local authorities which are unringfenced as a proxy to show the level of power being decentralised and devolved to local authorities; An increase in this would reflect increasing devolvement in financial decisions to a local level.
The number of planning permissions granted as a percentage of all applications for major and minor schemes The number of planning permissions granted as a percentage of all applications for major and minor schemes on which a decision was made in the same period. An increase in the number of planning permissions granted will be one measure of success of the Government's Growth Review. It covers the types of development (i.e. major and minor schemes) that are most closely associated with growth.
176

Department for Communities and Local Government Accounts 2011-12 Glossary
ANNEX B: Glossary
Accounting Date: The date at which the accounts were drawn up, in this case 31 March 2012 (previously commonly referred to as balance sheet date).
Accounting Officer: In accordance with section 5(6) of the Government Resources and Accounts Act 2000, the Treasury appoints an Accounting Officer for each department which is obliged, by section 5(1) of that Act, to prepare the Resource Accounts. The permanent head is appointed as the Principal Accounting Officer. Under the Minister, it is the Principal Accounting Officer who has personal responsibility for the overall organisation, management and staffing of the department, and is the principal witness on behalf of the department before the Public Accounts Committee to deal with questions arising from these accounts.
Administration Costs: The amount of budget a department may spend on running itself. This excludes the costs of running front line services delivered directly by the department.
Annually Managed Expenditure (AME): Expenditure which cannot reasonably be subject to departmental control. Arms Length Body/Bodies (ALB): organisations sponsored by the department – in the case of this document applies to NDPBs, the agency and the Commission for Local Administration – see Note 35
Boundary: The term to describe which entities are included in the consolidated resource accounts of the department. The boundary is based upon in-year budgetary control rather than on control of financial and operating policies.
Consolidated Fund: The central fund into which the produce of taxation, other public revenues and receipts are paid, and out of which Government expenditure is met.
Consolidated Fund Extra Receipt (CFER): Receipts related to expenditure in the Supply Estimates which Parliament has not authorised to be used as appropriations-in-aid and are therefore surrendered to the Consolidated Fund.
Designation Order: The Designation Order is drawn up by way of SI by Office for National Statistics and is a record of those bodies deemed to be in Central Government Control (whether by SI or Ministerial powers) and therefore part of the departmental group and in the accounting boundary with a requirement for inclusion into these consolidated accounts.
Estimates: Annual statements prepared by Government departments, containing the Government’s proposals for expenditure on the Supply Services for the coming financial year.
Departmental Expenditure Limit (DEL): Spending which is planned and controlled by departments.
Designated Body: a body included in the annual Statutory Instrument designating bodies for inclusion in the departmental boundary for consolidation purposes – see Note 35.
European Regional Development Fund (ERDF): Established in 1975 to stimulate economic development in the least prosperous regions of the European Union.
Financial Reporting Manual (FReM): The Financial Reporting Manual is the technical accounting guide that complements guidance on the handling of public funds. It applies International Financial Reporting Standards to the public sector.
Grant: Money voted (i.e. granted) by Parliament to meet the services shown in Supply Estimates.
Grant-in-aid: A grant from voted money to a particular body usually a Non-Departmental Public Body, where certain unexpended balances of the sums issued will not be liable for surrender to the Consolidated Fund at the end of the financial year.
IAS: International Accounting Standard
IFRS: International Financial Reporting Standard
Local Strategic Partnerships: Local Strategic Partnerships (LSPs) are non-statutory, multi-agency partnerships, which match local authority boundaries. LSPs bring together at a local level the different parts
177

Department for Communities and Local Government Accounts 2011-12 Glossary
of the public, private, community and voluntary sectors; allowing different initiatives and services to support one another so that they can work together more effectively.
Machinery of Government (MoG) changes: Where Government functions are being transferred from one Government department to another.
Managing Public Money: Managing Public Money provides guidance on a wide variety of issues relating mainly, but not exclusively, to the proper handling and reporting of public money. The advice it contains falls into three broad categories: Parliamentary requirements; Treasury administrative controls; and best practice.
National Loans Fund: The Government’s account with the Bank of England through which all Government borrowing transactions (including payment of debt interest) and most lending transactions are handled.
National Non-Domestic Rates (NNDR): Sometimes called Business Rates, are the means by which local businesses contribute to the cost of providing Local Authority services. All business rates are paid into a central pool. The pool is then divided between all authorities based on a number of factors including demographic, physical and social characteristics of each area. The total amount is set out in Section 3 of the Local Government Finance Report published as a House of Commons Paper and available from the Stationery Office.
Non-Departmental Public Body (NDPB): An entity that has a role in the process of Government, but is not a Government department, nor forms part of a department. It can incur expenditure on its own account and is usually financed at least in part from grant in aid from the department – see Note 35.
Outturn: Actual expenditure.
Permanent Secretary: The permanent head of a department.
Programme Boards: Manage the development of strategy and the delivery of the department's priorities.
Programme Costs: Cost of providing services directly to the public.
Propriety: This is a requirement that expenditure and receipts should be dealt with in accordance with Parliament’s intentions and the principles of Parliamentary control, including the conventions agreed with Parliament and, in particular, the Public Accounts Committee.
Public Accounts Committee: An all-party Select Committee of the House of Commons which is empowered to inquire into the financial administration of Government departments and examine their accounts. The Committee reports on its findings to Parliament.
Public Body: The following provides definitions of the different types of public body within the department:
• Executive Agency: is a public institution that delivers Government services for Government. An Agency does not set the policy required to carry out its functions, these are determined by the department that oversees the Agency. Agencies are headed by Chief Executives, who are personally responsible for day-to-day operations. They are normally directly accountable to the responsible Minister in the department;
• Executive NDPB: established in statute and carrying out administrative, regulatory and commercial functions, they employ their own staff and are allocated their own budgets;
• Advisory NDPB: provides independent and expert advice to Ministers on particular topics of interest. They do not usually have staff, but are supported by staff from the department. They do not usually have their own budget, as costs incurred come within the department's expenditure;
• Public Corporation: a publicly owned trading body with day to day operating independence; • Trading Fund: part of Government which has been established under the Government
Trading Fund Act 1973. Typically, Trading Funds operate in very specialised fields and rely on their ability to derive income from their activities in order to cover their costs, and provide a return to their sponsoring department; and
• Tribunal: an independent body that remains impartial when dealing with disputes.
178

Department for Communities and Local Government Accounts 2011-12 Glossary
Public Dividend Capital (PDC): Given to Trading Funds and Public Corporations which are expected to be both fully viable and subject to cyclical fluctuations in their returns as a result of their trading conditions operating in highly competitive markets.
Quarterly Data Summary (QDS): Cross government data reports published quarterly – see http://www.communities.gov.uk/publications/corporate/quarterlydatasummaryapr12
Regularity: This is a requirement for all items of expenditure and receipts to be dealt with in accordance with the legislation authorising them, any applicable delegated authority and the rules of Managing Public Money.
Revenue Support Grant (RSG): Along with redistributed National Non Domestic Rate payments, Revenue Support Grant (and principal formula Police Grant) makes up formula grant which is paid to local government without restriction or targets on what it can be spent on. It is distributed on the same basis as NNDR payments. The total amount is set out in Section 2 of the Local Government Finance Report published as a House of Commons Paper and available from the Stationery Office.
Spending Review: Sets departmental spending plans for future years.
Strategic Priorities: A small number of high level key, medium to long-term, objectives setting the overall direction of the department.
Subsidy: A grant (i.e. an unrequited payment) to a producer or trader which is deemed to benefit the consumer by reducing the selling price of the products. Also see ‘Grant’.
Supplementary Estimate: A supplementary Estimate is presented to Parliament during the course of the financial year to obtain additional money either for a new service or to make good an under-provision for existing services.
Supply Expenditure: Expenditure by Central Government voted by Parliament in the Supply Estimates.
Supply Grants: Grants covering the financial year 1 April to 31 March, approved annually by Parliament for the Supply Services and based on the Estimates. They are accounted for in the annual Accounts.
Trading Fund: These are bodies established under the Government Trading Funds Act 1973 as amended by the Government Trading Act 1990. Organisations that are so designated normally earn their income from fees and charges, with more than 50% coming from trading activities.
179

Published by TSO (The Stationery Office) and available from: Online www.tsoshop.co.uk
Mail, telephone, fax and email TSO PO Box 29, Norwich NR3 1GN Telephone orders/general enquiries: 0870 600 5522 Order through the Parliamentary Hotline Lo-Call 0845 7 023474 Fax orders: 0870 600 5533 Email: [email protected] Textphone: 0870 240 3701
The Parliamentary Bookshop 12 Bridge Street, Parliament Square, London SW1A 2JX
9 780102 978704
ISBN 978-0-10-297870-4
Telephone orders/general enquiries: 020 7219 3890 Fax orders: 020 7219 3866 Email: [email protected] Internet: http://www.bookshop.parliament.uk TSO@Blackwell and other accredited agents