denver water 2007 budget · march 7, 2007 board of water commissioners city and county of denver...
TRANSCRIPT

March 7, 2007
Board of Water Commissioners City and County of Denver
Denver, Colorado 80204-3412
Re: Denver Water 2007 Budget Chips Barry, Manager To Our Customers and Other Interested Readers: Denver Water's proposed budget for 2007 and our operations during 2006 reflect our two chief commitments to customers—providing an adequate, reliable supply of high-quality water and ensuring ample future supplies as our customer base continues to grow. We were able to avoid supply shortages in 2006, despite the absence of drought-related water restrictions, because peak storage levels in our reservoirs were 6 percent higher than historical averages and demand was 7 percent below normal. Above-average snowmelt filled the reservoirs to 98.9 percent of capacity in the spring, and customers who carried over some of the water-saving practices mandated during the dry years of 2002–2004 helped us maintain higher-than-average reservoir levels throughout the summer. Water use efficiency is stretching supplies by treating reclaimed wastewater for non-potable uses. As part of our efforts in this area, we began several capital construction projects in 2006 to expand the reach of our Recycled Water Distribution System. When these projects are completed, recycled water will be available to irrigate parks and golf courses in the Stapleton and Lowry developments in northeast Denver. We are working with the U.S. Army Corps of Engineers to determine the best method for ensuring adequate capacity in our Moffat Collection System northwest of Denver. In other efforts to protect the reliability of supplies in the north end of our service area, we purchased 7,400 acre-feet of storage capacity at the Lupton Lakes gravel pit property in Fort Lupton, Colo., in 2006. Providing water of the highest quality continues to be one of Denver Water's prime priorities. In addition to our ongoing programs for pipe rehabilitation and other distribution system improvements, we took several steps in 2006 to make sure we comply with recently issued federal regulations related to disinfection. A new chlorine contact basin is being designed for our Foothills Treatment Plant, and we are updating our Geographic Information System database so we can more effectively track disinfection effects throughout our potable water distribution system. As part of our leadership role with respect to all Front Range water issues, Denver Water continues to work closely with its neighbors in the metropolitan area and the communities where our watersheds are located to identify mutually beneficial solutions to water quality and water supply challenges. Some of the most significant actions aimed at meeting future challenges are outlined in the following section, which summarizes Denver Water's 2007 goals and objectives.
1

2007 Goals and Objectives
Implement a New Conservation Program to Accelerate Customer Water Savings Denver Water's Accelerated Conservation Program (ACP) is a 10-year plan to be launched in 2007. After complying with mandatory water-efficiency measures during recent water-short years, area residents have become more aware of the need to use water wisely, and Denver Water's conservation staff has shifted its focus from implementing short-term drought-response measures to instilling permanent water efficiency practices among the utility's customers. The accelerated program builds on the most successful conservation measures of the past few years, allocates staff and funds to help City & County of Denver departments improve their water use efficiency, and introduces a proven public outreach model known as Community-Based Social Marketing (CBSM). The CBSM approach to changing behavior involves providing information to targeted individuals, asking them to make a commitment in light of that information, providing prompts to remind them to do what they have promised, and then checking to see if they have done what they agreed to and asking them to do more. Garnering the support of local government, business, and community leaders will be a key component of the outreach program. In keeping with the long-term conservation goals articulated in Denver Water's current Integrated Resources Plan, we will keep buffer supplies in storage reservoirs for use during supply or demand uncertainties. This practice is comparable to earmarking cash reserves for use during unforeseen financial circumstances.
Pursue Water Supply Enhancements for Our Moffat Collection System
Three water collection systems comprise Denver Water's major sources of supply: the Moffat Collection System, northwest of the city, the South Platte and Roberts Tunnel collection systems to the southwest. According to the Integrated Resource Plan, which includes an analysis of future supply and demand, the Moffat Collection System is at risk of running out of water in a single severely dry year. The analysis concluded that the Moffat Collection System needs to provide an additional 18,000 acre-feet of firm yield to mitigate supply vulnerabilities and add reliability and balance to our water supply system. Instead of proposing a specific project to add this extra capacity to the Moffat Collection System, Denver Water entered into the regulatory process with the U.S. Army Corps of Engineers to identify options for meeting this need. The Corps is preparing an Environmental Impact Statement (EIS) to evaluate the potential effects of these options and is expected to release a draft EIS for public review in the fall of 2007. The final EIS will follow in late 2007 or early 2008.
Continue to Strengthen Denver Water's Fiscal Health In accordance with Denver Water's charter directive to provide high-quality water at rates as low as good service permits, we are implementing a number of changes in 2007 that will contribute to Denver Water's sound financial health. Adjustments in water rates, the administration of capital projects, and cost-sharing for employee healthcare insurance premiums will form the basis of these changes and will contribute to Denver Water’s sound financial health in 2007. The new rate structure that is effective January 1, 2007, uses a fixed service charge rather than a meter charge and communicates our water efficiency goals to customers by raising
2

rates for defined blocks of increased water use. The bimonthly service charge, no longer based on the size of the customer's meter, will be $5.98, lower than the $9.76 currently paid by most residential customers. By relating water bills directly to actual consumption, the inclining-block rate structure allows customers to better control their costs by reducing water use. The new rates will also bolster cash reserves, helping us handle large unforeseen expenses such as the need to mitigate watershed damage inflicted by the Hayman fire in 2002 and sudden increases in the cost of construction materials after Hurricane Katrina. After several years of shouldering much of the cost of steadily rising employee healthcare insurance premiums, Denver Water will shift a greater share of these expenses to employees in 2007. We will continue to educate employees about the cost of all employee benefits as we evaluate these programs and consider modifications as appropriate. In addition, we will complete a comprehensive assessment of current staffing patterns and alter them as necessary to ensure optimal organization structure. We are also fine-tuning our capital improvement and budgeting processes to achieve greater fiscal accountability. The consultants hired to assess our bidding and construction management practices found no basic flaws in our procedures but have recommended several refinements. Among the modifications we will implement in 2007 are involving Operations & Maintenance Division staff early in the design of capital projects, applying experience from previous projects to minimize change orders, refining the review approval process and procedures for change orders in construction contracts, and training designated staff members in negotiating strategies and understanding the construction project scheduling software used by contractors. We are also committed to providing better financial information to decision makers, including Board members, to ensure transparency in our processes and further Board confidence in our construction management program.
Implement Technology Systems to Improve Customer Service In 2007 we will continue our multi-year effort to procure new software systems to advance our ongoing objectives of streamlining operating procedures and enhancing our ability to respond to customer needs. A Mobile Workforce Tracking System will permit real-time management of our field operations, speeding up customer service response times and increasing productivity. An up-to-date Customer Information System, also aimed at improving customer service, will boost our ability to track customer account information, analyze water savings more specifically, and enable us to administer alternative rate designs that may be necessary to achieve our demand-management and revenue goals.
Monitor Legislative and Regulatory Issues Affecting Water Utilities In addition to staying up to date on developments at the state capitol, Denver Water's legislative liaison will continue to work with other water utility representatives to educate Colorado legislators about water issues and help them draft laws that take into account the needs of water providers across the state. One piece of legislation expected to be re-introduced in 2007 will likely raise the cost of participating in the Utility Notification Center of Colorado, a one-call system through which property owners notify utilities before excavating. The law creating this system was passed in the early 1990s to help prevent damage to underground facilities such as water distribution service lines. Denver Water supports the concept of increased charges and is working to keep the higher price tag reasonable. We are also helping to craft legislation containing stronger enforcement provisions related to accidental damage caused by citizens or other excavators who dig without notification. In the regulatory arena, the U.S. Environmental Protection agency promulgated new water quality standards related to disinfection practices in January 2006. Among the actions Denver
3

Water is taking to comply with these standards by the required deadline are installing a new chlorine contact basin at the Foothills Treatment Plant and updating our Geographic Information System database to improve our ability to measure water quality parameters throughout our water distribution system. At the state level, Denver Water will continue collaborating with other utilities and a state Water Quality Control Division work group in 2007 to create more realistic regulations governing the temperature of lakes and rivers in various regions of the state. Past regulations specified temperature criteria for bodies of water in the state's cold mountain region and on the warmer plains but did not stipulate temperature criteria for water in the transitional areas along the foothills. These criteria can affect water utilities that use one watercourse to convey supplies from another source. The state is also likely to consider criteria regulating the nutrient content of lakes and rivers in 2007. Collaborate with Other Agencies to Address Statewide and Metropolitan Water
Supply Issues Water providers across Colorado face the same fundamental challenge: balancing the state's limited, fluctuating water supplies with the diverse needs of a growing population. Both East Slope and West Slope municipalities are expected to experience continued growth in 2007, and we will support the Board of Water Commissioners in leading comprehensive negotiations to resolve ongoing points of conflict between Denver Water and its western Colorado neighbors. The metropolitan area south of Denver faces particularly difficult water supply challenges. One of the fastest-growing areas in the state, it is seeking ways to decrease its dependence on finite groundwater supplies and find more sustainable sources. In 2007 Denver Water will continue discussions with the South Metro Water Supply Authority, a group of Douglas County water providers, to help them identify better supply solutions. We will explore the feasibility of selling the Authority excess South Platte water and reusable effluent when these sources are available in Denver Water's system. We will also assess the conservation programs of Authority members and work in partnership with them to help shift the water use culture of the entire metropolitan region toward more efficient use.
2007 Budget - Receipts
Denver Water's total receipts for 2007 are budgeted at $292.4 million, an increase of $39.8 million, or almost 15 percent, over budgeted receipts for 2006. Water Sales are expected to yield $189.8 million, surpassing budgeted sales for 2006 by $25.5 million, or more than 15 percent. Although water demand in 2007 is projected to be 16.7 percent below historical norms, a rate increase averaging 7 percent will offset the decrease in volume of sales as well as relate charges more directly to the amount of water a customer uses. As in 2006, the sale of water is expected to account for approximately 65 percent of total receipts in 2007. Hydropower Revenues will also rise in 2007 once construction of the new hydroelectric power generation facility at Gross Reservoir is completed. Scheduled to become operational in July, the facility is expected to raise revenues from hydropower sales by $1.1 million more than budgeted sales in 2006. System Development Charges (SDCs), the fees builders pay to connect new or expanded developments to Denver Water's distribution system, are expected to climb to $27.8 million in 2007, a 20 percent increase over budgeted SDCs for 2006. The increase is being driven by a 9.8% average SDC rate increase as well as several special SDC contracts anticipated in 2007.
4

Debt Service Proceeds are budgeted at $50 million. Although $100 million of debt is expected to be issued during the second quarter of 2007, about half this amount will be used immediately to reimburse the Board for prior capital spending; the remaining $50 million will be placed in a construction fund to be used for capital spending in 2007, 2008 and the first quarter of 2009.
Expenditures Operations and Maintenance (O&M) costs for 2007 are budgeted at $136.8 million, approximately $8.0 million, or 6 percent, more than budgeted O&M expenditures for 2006. Launching Denver Water's new Accelerated Conservation Program will account for a substantial portion of the increase. The 10-year plan, designed to carry out the Board's directive to escalate water savings among Denver Water's customers, will require a budget of $7.6 million in 2007, $4.8 million more than the 2006 conservation budget. The new program expands on the most successful water-efficiency measures of the past, adds some new measures gleaned from other water providers across the globe, and incorporates a public outreach program known as community-based social marketing. Payroll expenditures for 2007 are projected to be $67.6 million, supporting 1,085 regular full-time employees and various temporary workers representing the equivalent of 32 full-time positions. Of the total amount budgeted for payroll, 82 percent is allocated to employees working in operations, and 18 percent is assigned to staff involved with capital projects. One component of the O&M budget will decrease in 2007—Board spending for employee healthcare insurance premiums. After several years of steadily rising healthcare premiums for workers across the nation, Denver Water is shifting more of the cost-sharing burden for healthcare insurance to its employees. A new plan design that becomes effective in January 2007 will reduce the Board's share of these costs by $2.2 million compared with what it would have paid under the old design. The $12.5 million budgeted for employee healthcare insurance premiums in 2007 is $1.1 million less than the amount budgeted in 2006 and brings Board spending for this budget item back to 2005 levels. Capital Projects are expected to cost $99.1 million in 2007. This figure, representing a $13.4 million increase over the 2006 budget for capital spending, includes funding for several large capital projects that are currently under construction—the new hydroelectric power installation at Gross Reservoir and a storage tank, pump station, and conduits to extend our Recycled Water Distribution System. Five projects budgeted at more than $5 million each account for a quarter of the 2007 capital budget. Debt Service and related costs are budgeted at $54.4 million.
Investment Balance Based on projected receipts and expenditures for 2007, Denver Water's cash reserves are expected remain relatively stable at $151.4 million by the end of 2007, excluding unspent bond proceeds restricted for future capital projects.
2006 Budget Performance
Receipts
Total receipts for 2006 were budgeted at $252.6 million. Although current projections indicate that Denver Water will end the year with $5.6 million less than that amount, the shortfall results from the decision not to issue debt in 2006 and will be partially offset by higher-than-anticipated water sales.
5

The 2006 water sales budget of $164.3 million was based on a projection that demand for water would be 19 percent below the historical norm. Actual water consumption, however, turned out to be only 7 percent below normal. This greater-than-expected demand produced corresponding increases in revenue. Total receipts from water sales are $195.1 million, or $30.7 million above the budgeted amount. System Development Charges were $3.3 million less than the budgeted amount of $25.7 million as a result of a large payment from East Cherry Creek Valley that was originally planned for 2006, but is now expected to be received in early 2007. Denver Water had planned to receive $40 million in debt proceeds in 2006, but unexpectedly high water sales and delays associated with several capital projects allowed us to postpone issuing debt until 2007. Expenditures Operating expenses in 2006 were $127.1 million, slightly less than the budgeted amount. The reduced expenditures resulted from higher-than-expected vacancies in staff positions and lower spending on items such as training, conference attendance, and professional services. Capital spending in 2006 was also lower than anticipated. Total spending on capital projects was $83.8 million, approximately $1.8 million less than the amount budgeted. This includes a $12.3 million unbudgeted expenditure to purchase water storage capacity at the Lupton Lakes gravel pit property in Fort Lupton, Colo., north of Denver. The reductions in spending were due to the delay in procuring a new Customer Information System as well as delays in several projects related to the delivery of treated and recycled water. These expenditures have been carried forward into the 2007 budget for capital projects. Debt service expenditures were less than the budgeted amount because of the decision not to issue $40 million in planned debt in 2006. The end-of-the-year investment balance was $149.2 million, $1.0 million less than the budgeted amount. This means Denver Water only used $1.0 million more of its cash reserves in 2006 than originally planned despite the absence of $40 million in anticipated debt proceeds.
Financial Overview
Denver Water's strong financial status is projected to prevail over our planning horizon of 10 years. Ratings of our revenue bonds by Moody's, Fitch Ratings, and Standard & Poor's are Aa2, AA+, and AA, respectively. We will continue to monitor water rates, capital expenditures, debt levels, and investment balances to minimize rate increases while providing reliable service to customers and maintaining Denver Water's financial well-being. I am confident that the 2007 budget provides a responsible plan for both fiscal and physical operations as well as the continued development of the Denver Water system during the coming year.
6

Charter Directives, Mission, Values and Strategic Plan
Charter Directives
Denver Water was established in 1918 by the people of Denver as an independent agency with duties and responsibilities specifically spelled out in the City Charter. Since that time, the Denver Board of Water Commissioners has supplied water to Denver and contract distributors adjacent to Denver in accordance with the following charter directives:
The Board shall “…have complete charge and control of a water works system and plant for supplying the City and County of Denver and its inhabitants with water for all uses and purposes.” Charter of the City and County of Denver, Section 10.1.1.
The Board shall fix rates which “…shall be as low as good service will permit.. “and”.. may be sufficient to pay
for operation, maintenance, reserves, debt service, additions, extensions, betterments, including those reasonably required for the anticipated growth of the Denver Metropolitan area and to provide for Denver’s general welfare.” Charter of the City and County of Denver, Section 10.1.9.
Mission
Denver Water will provide our customers with high quality water and excellent service through responsible and creative stewards of the assets we manage. We will do this with a productive and diverse work force. We will actively participate in and be a responsible member of the water community.
Values
Our values describe the guiding principles and beliefs of Denver Water. We recognize it is every employee’s responsibility to uphold these values in order to carry out and align the mission with the vision of the organization. These values provide the framework and guidance for decision making, daily performance, ensuring consistency and excellence throughout Denver Water.
CUSTOMER VALUES
Customer Satisfaction We exist for the purpose of serving our customers and are constantly working to meet their needs.
Quality Providing a high quality product and excellent service at a reasonable cost to allow us to improve our customer relationship.
EMPLOYEE VALUES
Accountability We expect accountability from Management in accomplishing the goals of the organization and how they reach them.
Respect We strive to show respect and courtesy in our relationship with others, acknowledging their ideas and contributions.
Workforce Diversity We strive to have a work force that reflects the diversity of the community we serve; acknowledging that a diverse workforce is an enriched workforce.
Innovation
We want to be progressive, creative and open to new ideas and technologies to meet the challenges of the future, realizing new ideas create value for our customers.
Support Employee Excellence We believe in our employees and enlist their contributions in operating, planning and policy matters.
Professional Growth We encourage employees’ management of their career development and participating in career planning.
HEALTH, SAFETY AND ENVIRONMENTAL VALUES
Safety and Health
We support the safety of our customers and public and promote the highest level of health and safety for our employees by encouraging workplace wellness.
Responsibility We strive to be responsible and accountable stewards in our use of public land and water, and environmental and financial resources recognizing our obligation to the community we serve.
Commitment to the Future We manage water supply based on a long-term perspective on water issues in order to help ensure quality water for future generations.
7

Strategic Plan Vision The Strategic Plan is the basis for setting priorities and determining Denver Water's future direction.
Leadership • We will maintain the Denver Water system as one of the best in the country. • We will respect the natural environment. • We will be a leader in water conservation. • We will participate and provide leadership in all major Front Rangew water supply and water
quality issues • We will encourage and create cooperative projects with others. • We will possess credibility and influence with public, regulatory community, media and decision-
makers at all levels of government. Products & Services • We will provide drinking water that is always safe and meets our customers’ expectations of
quality and reliability. • Our customers will be pleased with our service, responsiveness and courtesy. • Our customers will believe that they receive high value for the cost of their water. • Our facilities will be well-maintained, running efficiently and reliably. • We will provide non-potable water for irrigation and industrial purposes. • We will take increasing advantage of technology to meet our goals. • We will anticipate new markets in order to provide ancillary products and services. We will accommodate the recreational interests of the public, where practicable.
Organization • We will recognize and value the contributions of employees at every level. • We will remain a municipal organization that serves an increasing customer base without
significant increases in numbers of employees. • Our Management and Staff will be worthy of the Board’s trust and confidence. • Our entire organization will work diligently as a team, committed to the goals of the organization. • Our organizational culture will encourage open communication, creativity, risk taking and
learning at all levels for the continual improvement of our products and services. • Our organization will accommodate a changing work force, including differing technological
skills, languages, backgrounds and family demands. • Our employees and distributors will take pride in the professionalism of Denver Water. • We will emphasize the safety and health of employees. • All of our employees will be familiar with events and procedures at Denver Water and will be able
to explain them to others. • All of our employees will possess the skills and accept the reponsibility to manage their own
careers.
8

Financial Policies The Board has established financial policies that constitute the basic framework for the financial management of Denver Water. These policies are intended to assist members of the Board and Denver Water’s staff in evaluating current activities and proposals for future programs and are reviewed on an annual basis and modified to accommodate changing circumstances or conditions. Pursuant to the Charter, the Board maintains a single fund, the Water Works Fund. This fund is required to be the depository for all revenues received from the operation of the System and all moneys received by the Board from other sources. Basis of Accounting and Financial Reporting Denver Water prepares it financial reports in accordance with accounting principles generally accepted in the United States of America. Following the conclusion of the Fiscal Year, the Accounting Section publishes a Comprehensive Annual Financial Report (CAFR). The CAFR includes the audited financial statements, including the opinion of an independent certified public accounting firm. The Accounting Section analyzes and issues quarterly reports comparing financial results for the quarter and year to date with the same periods for prior years. Denver Water operates using the full accrual method of accounting. Revenues The Denver Water System is completely funded through rates, fees and charges for services provided by Denver Water. There are no transfers to or from the City’s general fund. Water rates pay for operation and maintenance expenses, repair, capital replacements and modifications to existing facilities, debt service; and a portion of the costs of new facilities and water supply. Expenditures In planning expenditures, Denver Water follows the City Charter’s mandate to keep rates as low as good service will permit. In general, this means that Denver Water will properly maintain its facilities and continuously seek ways to operate more efficiently. Balanced Budget Denver Water balances its budget by the planned use of or contribution to investment balances. The designated balances are maintained to provide for financial impacts to operation and maintenance, capital replacement, debt service and self-insurance. This approach is in accordance with the City Charter, which allows the accumulation of funds for improvements of such magnitude that they cannot be acquired from the surplus revenues of a single year. Long Term Financial Plans Denver Water’s annually prepares a capital improvement plan that identifies all capital improvements likely to be needed during the next ten years to satisfy projected growth in demand for water and to maintain existing capacity to provide water. Each year a ten-year Operations and Maintenance Plan that identifies expenses for normal operations, including significant changes to current operations and expenses arising out of planned capital projects is prepared. Using the 10-year capital improvement and operating plans, Denver Water develops a ten-year Financial Plan which is used to develop one or more scenarios for financing projected
9

The Budget Process
Overview The long-range plans are the financial expressions over a ten-year period. The annual budget is the definition of needs and allocations of available resources to accomplish the first year of the long-range plans. Long Range Planning Denver Water maintains long-range (10 years) capital, operation and maintenance and financial plans that are updated annually. The Ten-Year Capital Plan projects additions, improvements and replacements to water system facilities, based on projected demands for water (Integrated Resource Plan), Federal and State regulations and ongoing system requirements. It is used as the basis for projecting the annual Capital Work Plan. The Ten-Year Operation and Maintenance Plan includes the ongoing costs of operating and maintaining the water system and the impact of the Ten-Year Capital Plan on operations. The financial plan projects compliance with debt covenants and the year-end targeted investment balance. Alternative financial plans that address estimated revenue shortfalls are also projected as a part of the long-range planning effort. Annual Work Plan Budgets The detailed annual work plan budgets for operation and maintenance activities, debt and capital projects are developed during the budget process each year. These budgets are substantially based on the budget year projections provided by the long-range plans. These work plans itemize the cost of activities and projects within each program Annual Budget Preparation The annual budget is prepared on a program budget basis that follows the flow of water from the sources of raw water to customers’ taps and cuts across organizational boundaries. The focus is first on what Denver Water as a whole is doing (what our resources are used for), then on organizational structure (the divisions and sections expending the resources), and then by type of expenditures (what types of resources – payroll, services, etc., are being used). The intent of this particular format is to facilitate the reader's understanding of how we are accomplishing our mission to serve our customers needs in the present and future. Each Cost Control Centers prepares its budgets on a capital project, operations and maintenance activity, by type of expenditure, by month basis. Budget development, monitoring and control reports are then available to budgeters and managers from project, cost control center, and type of expenditure perspectives at summary and detail levels. The annual Capital Work Plan budget consists of 212 specific projects. The Operation and Maintenance Work Plan budget includes 244 specific activities. While some Cost Control Centers may budget to as few as four or five projects and activities, others may budget to 50 or more. This method provides the detailed "working" budget and reporting mechanism for in-house purposes. Each Cost Control Centers enters its budget into a centralized computer system. This system is able to provide budget and actual information for combinations of cost control center, master plan item (projects and activities) and types of expenditures for any month or year-to-date of months.
10

Budget Basis The annual budget is prepared on a modified accrual basis in which receipts are budgeted and recorded when received and expenditures are recorded when incurred, regardless of when payment is made. This differs from the basis of accounting, which uses the full accrual method in accordance with the Generally Accepted Accounting Principles (GAAP). Historically this difference in the budget and accounting methods has been useful in modeling cash flow projections. However, Denver Water will be looking at alternatives to the basis of budgeting in the coming year. Budget Schedule The 2007 budget development schedule on the following page shows the process from the Integrated Resource Plan to Long Range Planning process to development of the annual budget and resulting budget approval by the Board of Water Commissioners. Budgeting Units Denver Water is divided into eight operating divisions totaling ninety-three budgeting units or cost control centers. Eighty-two of these cost control centers are comprised of groups of employees based on organizational structure. The remaining eleven are used to budget and control office furniture and equipment, personal computers, related expenditures and adjustments. Amending the Budget Amounts budgeted for specific projects and activities may be revised through the issuance of a special authorization. A special authorization request showing the budget code, cost control center(s) involved, reason for variance, amount of variance, revised estimate and schedule is prepared by the requesting Division. It may be approved by that Division Director and, if needed, the Manager, who will determine if Board approval is also required. Budget Presentation and Approval Denver Water is not required by City Charter or state law to make its draft budget available to the public prior to its adoption by the Board of Water Commissioners. The preliminary 2007 budget was reviewed by the Board's Budget Committee, presented in summary at a public Board meeting and presented in draft to the entire Board prior to its approval.
11

DENVER WATER IRP, 2007 LONG RANGE PLANS, 2008 BUDGET PROCESS
and RATES ADJUSTMENT SCHEDULE
DEC2006 JAN FEB MAR APR MAY JUN JUL AUG SEP OCT NOV DEC
INTEGRATED RESOURCE PLANNING
2007 LONG RANGE PLANS
10 Year Capital Plan
10 Year Operating Plan
10 Year Financial Plan
2008 BUDGET DEVELOPMENT PROCESS
Receipt Sources
Capital Projects
Personnel & Payroll Budget
Operating Budget
Draft Budget Document
Board Action 2008 Budget
RATES ADJUSTMENT SCHEDULE
12

Distinguished Budget Presentation Award
The Government Finance Officers Association of the United States and Canada (GFOA) presented an Award of Distinguished Budget Presentation to Denver Water, Colorado for its annual budget for the fiscal year beginning January 1, 2006. In order to receive this award, a governmental unit must publish a budget document that meets program criteria as a policy document, as an operations guide, as a financial plan, and as a communications device. This award is valid for a period of one year only. We believe our current budget continues to conform to program requirements, and we are submitting it to GFOA to determine its eligibility for another award.
13

Budget Controls and Updates
Periodic reports are provided to the Board of Water Commissioners, Manager, Division Directors, Cost Control Center Managers and Budget Coordinators. Key reports include: Monthly Budget Status Summary - Provided to the Board, Manager and Division Directors. Compares receipts to related capital and operating expenditures for the year-to-date, broken down by type of expenditure. Budgeted and actual billed revenues are graphically compared to receipts from water sales by month-end and year to date. Monthly Budget Status Report - Provides the Manager and Division Directors with graphs and summary tabulations of actual and budgeted receipts and expenditures for the month and year to date. Also included are explanations of major receipt, expenditure and investment balance variances and graphs showing each division’s budget performance. Divisional Budget Coordinators also receive this information plus a detailed Receipt and Expenditure Budget report and a Gross Payroll Budget report by Division and Cost Control Center. Monthly Cost Control Center Budget Report - Each Cost Control Center is provided with a comparison of month and year-to-date actual and budgeted expenditures by type of expenditure (Payroll, Materials, etc.). Annual budget amounts are also shown for comparative purposes. Monthly Cost Control Center by Master Plan Item Report - This is a summary level report. Focus is on the capital projects and operation and maintenance activities that a cost control center has budgeted and/or charged during the year. Monthly Budget Variance Explanation Report - Each month, cost control centers are required to explain significant variances between budgeted and actual expenditures. Intranet Expenditures Budget Reports – Flexible budget reporting is available to all budgeters through the Intranet. Budgeters are able to make budget to actual comparisons for projects, cost control centers and type of expenditure combination, and “drill-down” to detail levels to obtain additional information as desired. Additional Reporting – Additional reports can be created by the budgeters in the format and levels of detail required from the budget system.
14

How to Read the 2007 Budget From Summary to Detail The 2007 Budget is arranged for easy reference. An overall summary is provided at the beginning of the budget. Summary level information is also presented at the beginning of each section within the budget document. Additionally, the narratives include references to related information found elsewhere in the document. Components Furthermore, each section of this budget booklet describes a particular component of the budget, as follows: For a summary overview of the entire 2007 Budget - Read Section One. This section provides an overview of 2007 budgeted receipts, expenditures, designated balances and number of employees. It also includes a brief history of Denver Water maps showing the area served and location of major facilities. For a receipt forecasts - Read Section Two. This section provides information on all types of receipts. For expenditures by program - Read Section Three. This section categorizes expenditures by program. Each major component of the process of providing water to our customers; raw water, recycled water, treatment, delivery to customers, and general operations are considered as programs. Each program is then further broken down into operation and maintenance and capital components. This format allows evaluation of the cost of each component of providing water from source to customer, down to detailed operation and maintenance activities and capital projects. It indicates why (for what activity or project) the expenditures are made. Information on both operation and maintenance activities as well as capital improvement and replacement projects is also provided. For expenditures by type - Read Section Four. This section classifies total expenditures according to what was purchased, without regard to the activity or whether the expenditure was operation and maintenance or capital in nature. This section has information on the expenditures for labor, purchases of materials, services, equipment, construction contract payments, debt service and refunds. For information on Denver Water's organizational structure and performance measures - Read Section Five. This section shows detailed number of employees, table of organization, activities by division and key performance measures for the organization. For information on debt - Read Section Six. This section includes Denver Water's debt policy, debt service schedules and description of Certificate of Participation projects. For information on cash flow - Read Section Seven. This section shows the impact of the 2007 budgeted receipts and expenditures on the designated balances and describes how these balances are to be used. For terms used in the budget document - Read Section Eight. This section contains a glossary of terms.
15

THIS PAGE INTENTIONALLY LEFT BLANK
16

Section 1 - 2007 Budget Summary 2007 Beginning Investment Balance Denver Water will begin 2007 with an Investment Balance of $149.2 million.
Receipts Total receipts for 2007 are projected to be $292.5 million, including $189.8 million from the sale of water. This projection is based on the assumption that demand for water will be 16.7% below historical norms. Please see Section 2-Receipts for more details on how this forecast was developed. Non-operating, interest, hydropower and other receipts total $17.2 million. Receipts used for the construction of new facilities include $5.0 million from participation receipts (payments to the Board for capacity in specific facilities to serve specific groups of customers) and $27.8 million from System Development Charge receipts (tap fees). Reimbursements total $2.7 million. This includes $1.7 million from S. Adams County, $300,000 from Arvada for the Moffat Collection System Project and $700,000 from numerous smaller projects based on historical trend. Proceeds from debt issues for 2007 are budgeted at $50.0 million. Expenditures Total 2007 expenditures are budgeted at $290.3 million. Operation and maintenance expenditures are budgeted to be $136.8 million. Capital expenditures are budgeted at $99.1 million. Debt service and related costs are budgeted to be $54.4 million.
Major capital projects, which are discussed in detail in Section 3 include projects related to the distribution and storage of recycled water ($19.2 million), acquisition and construction of gravel pit storage facilities ($10.7 million), and treatment plant upgrades ($9.6 million).
2007 Ending Investment Balance
The 2007 budgeted expenditures of $290.3 million are $2.2 million less than projected receipts of $292.5 million resulting in a projected ending investment balance of $151.4 million. The investment balances for system operations and capital are maintained to cover a portion of: (1) operation and maintenance, (2) non-expansion capital, (3) debt service, (4) self-insurance and (5) future capital projects. For more details, see Section 7, Investment Balance.
Receipts from the sale of water are
projected to be $189.9 million.
Capital Projects are projected to
be $99.1 million
Section 1- Summary
17

Summary of Receiptsand Expenditures
2006 2006 2007Budget Actual Budget
Beginning Investment Balance $ 159,276,000 $ 159,276,000 $ 149,198,000Receipts from: Sale of Water $ 164,333,000 $ 195,054,000 $ 189,814,000 Non-Operating, Hydropower, Interest, & Other 14,976,000 25,254,000 17,166,000 System Development Charges 25,654,000 22,389,000 27,842,000 Participation 4,978,000 2,735,000 5,014,000 Reimbursements & Grants 2,705,000 1,586,000 2,658,000 Subtotal $ 212,646,000 $ 247,018,000 $ 242,494,000
Debt Proceeds 40,000,000 0 50,000,000
Total Receipts $ 252,646,000 $ 247,018,000 $ 292,494,000
Less Expenditures for: Operation & Maintenance Programs: Raw Water $ 7,327,000 $ 6,855,000 $ 7,675,000 Recycled Water 2,298,000 2,176,000 2,393,000 Water Treatment 12,453,000 13,174,000 13,082,000 Delivery 15,250,000 15,755,000 16,671,000 Conservation 2,786,000 2,832,000 7,613,000 Customer Service 7,174,000 7,143,000 7,484,000 General Plant 7,117,000 6,448,000 7,186,000 Administration 74,356,000 72,688,000 74,705,000 Total Operation & Maintenance Expenditures $ 128,761,000 $ 127,071,000 $ 136,809,000
Capital Programs: Raw Water $ 24,022,000 $ 32,976,000 $ 24,731,000 Recycled Water 17,435,000 22,086,000 19,873,000 Water Treatment 4,979,000 2,570,000 11,717,000 Delivery 18,609,000 13,973,000 22,265,000 Conservation 2,025,000 2,111,000 2,414,000 Customer Service 1,300,000 1,474,000 0 General Plant 17,171,000 8,571,000 18,063,000 Total Capital Expenditures $ 85,541,000 $ 83,761,000 $ 99,063,000
Debt Service, Related Costs and $ 47,398,000 $ 46,264,000 $ 54,392,000Interest on Reserve Funds Total Expenditures $ 261,700,000 $ 257,096,000 $ 290,264,000
Ending Investment Balance $ 150,222,000 $ 149,198,000 $ 151,428,000
2006 - 2007
Section 1- Summary
18

2007 PROGRAM BUDGET(Thousands of Dollars)
Administration, $32,178
Raw Water, $7,675 Recycled Water, $2,393
Water Treatment, $13,082
Delivery, $16,671
General Plant, $7,186
Customer Service, $7,484
Indirect Costs, $42,527
Conservation, $7,613
Operation & Maintenance
Total $136,809
Recycled Water, $19,873
Raw Water, $24,731
Conservation, $2,414
General Plant, $18,063
Delivery, $22,265
Water Treatment $11,717
Capital Total$99,063
Capital, $99,063
Debt Service, $54,392
Operation & Maintenance,
$136,809
Total Program BudgetExpenditures
$290,264
Section 1- Summary
19

The Denver Water Service Area, Population, & Demand
Denver Water’s Combined Service Area, totals approximately 335.5 square miles. The Combined Service Area is composed of the City and County of Denver and 69 treated water distributor contracts (see Table 1). In addition, Denver Water serves several special contracts with fixed contract amounts and two major raw water contracts.
Denver Water Service Area Square Miles
The table below shows the total square miles served both inside and outside the City and County of Denver. The total square miles in the Inside the City service area have not changed materially since 1988 when the City and County of Denver annexed 43.3 square miles for the Denver International Airport. The old Stapleton Airport, within Denver, is being redeveloped with housing, office, and retail facilities. Although the development does not add square miles to the Denver Water service area, it will increase the number of customers we serve over the next 20 years. Outside the city, Denver Water executes three main types of distributor contracts: Total Service, Read and Bill, and Master Meter. In Total Service districts, Denver Water operates and maintains the district’s facilities, including customer billing, at a level equivalent to the service provided within the Denver City Limits. In Read and Bill districts, Denver Water reads the meters and bills the customers, but does not operate the distribution system. Master Meter districts are those in which Denver Water sells the water wholesale directly to the district. Denver Water also maintains several contracts that receive a fixed amount of water and are not included in the figures below. Table 1
Denver
City and County 154.6
Outside Denver
Total Service Distributors 40.8 Read and Bill Distributors 49.8 Master Meter Distributors 90.3 Subtotal 180.9
TOTAL 335.5
Source: 2004 Denver Water Directory of Distributors, Section 4. Figures exclude fixed special contracts and approximately 2.9 square miles presently not under contract.
Section 1- Summary
20

STATISTICAL SUMMARY: 2000 - 2005
2005 2004 2003 2002 2001 2000Operating Information:Population Served1 1,115,000 1,104,000 1,081,000 1,076,000 1,052,000 1,036,000
Total Treated Water Consumption in Million Gallons 68,473.70 60,578.77 65,399.47 75,221.18 81,054.72 83,585.25Average Daily Consumption in Million Gallons 187.60 165.52 179.18 206.09 222.07 228.38Average Daily Consumption per Capita in Gallons 168 150 166 192 211 220Maximum Daily Consumption in Million Gallons 424.80 340.92 370.05 419.20 488.71 478.19Maximum Hour Treated Water Use Rate in MGD2 725.27 567.52 775.23 788.09 716.86 751.47Treated Water Pumped in Million Gallons 41,890.71 39,105.07 46,030.79 51,205.33 54,161.28 47,953.92
Raw Water Storage Capacity in Acre-Feet 561,883 561,883 561,883 561,883 561,883 545,476Replacement Reservoir Storage Capacity in Acre-Feet 122,432 122,432 122,432 122,432 122,432 96,822
Supply from South Platte River in Acre-Feet3 154,750 119,978 144,982 58,856 129,926 133,912Supply from Blue River/Roberts Tunnel System in Acre-Feet 94,470 75,984 164,294 56,848 102,282 102,750Supply from Moffat System in Acre-Feet 63,872 59,344 84,072 33,116 71,296 59,811
Treated Water Pumping Capacity in MGD2 1,096.3 1,077.1 1,077.1 1,070.6 1,052.5 1,052.5Raw Water Pumping Capacity in MGD2 92.2 92.2 92.2 92.2 92.2 92.2Treatment Plant Capacity in MGD2 715.0 715.0 715.0 645.0 645.0 645.0Treated Water Reservoir Capacity in Million Gallons 368.65 376.65 376.65 406.45 378.45 378.75
Supply Mains in Miles (Mountain Collection System) 77.5 77.6 77.6 77.6 77.6 77.6Supply Mains in Miles (Metropolitan Denver Area) 40.7 40.7 40.7 40.7 40.7 40.7T&D Mains in Miles (Inside Denver and Total Service Contract Distributors) 2,631 2,608 2,574 2,552 2,508 2,474Nonpotable T&D Mains in Miles 31.3 31.3 23.5 17.6 17.3 17.3
Total Active Taps-End of Year1 304,483 301,565 299,157 295,841 286,051 282,985Fire Hydrants Operated & Maintained 15,459 14,956 14,648 14,380 14,173 13,991Fire Hydrants Tested and Repaired 32,474 32,045 32,407 26,047 29,604 23,875Breaks in Mains - Denver 242 219 231 287 261 243Service Leaks 1,452 1,204 1,117 1,034 794 907
Additions to Capital Assets 81,877$ 71,669$ 164,363$ 128,479$ 104,721$ 87,493$ Total Long-Term Debt4 375,917$ 372,876$ 379,478$ 300,695$ 308,879$ 289,681$
1Population estimates based on treated water customers only. Beginning in 1996, population served and active taps exclude the City of Broomfield. Revised data through 2000 are interpolated from analysis of the 2000 Census and adjusted for tap growth. 2MGD = Million Gallons per Day.3Supply includes effluent exchanges.4Current and long-term portions of bonds payable and obligations under capital lease, net of discounts, premiums and deferred losses on advance refundings.
Section 1- Summary
21
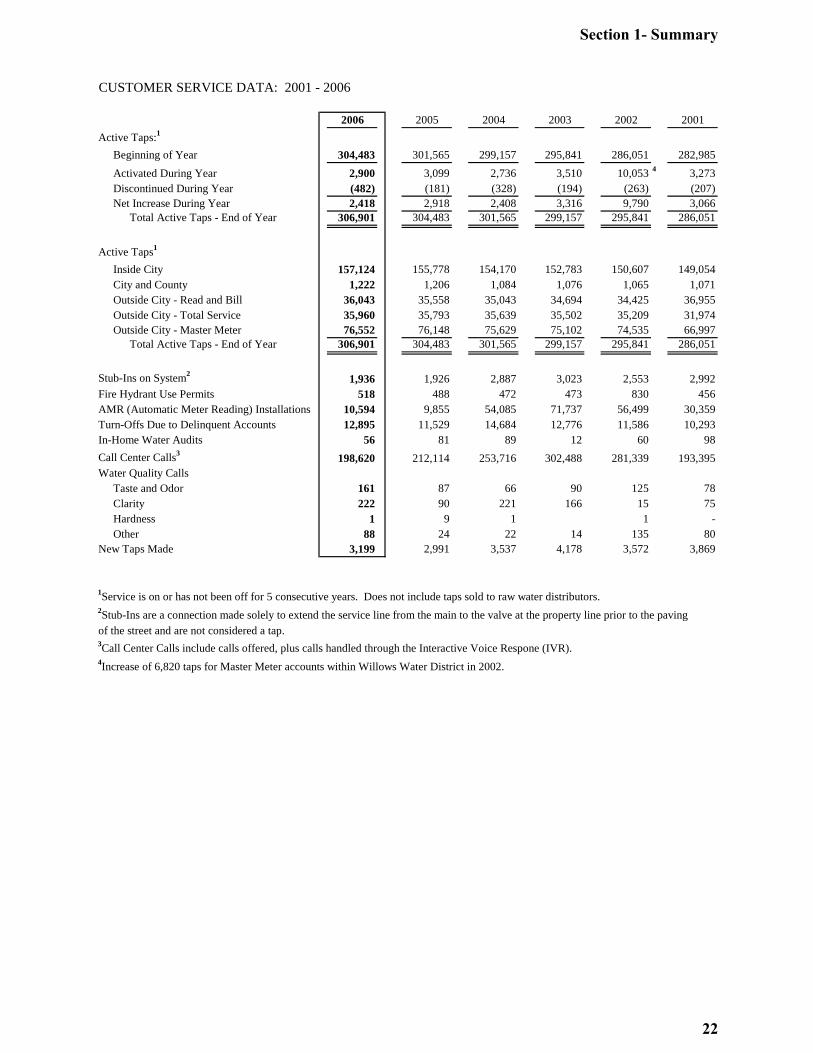
CUSTOMER SERVICE DATA: 2001 - 2006
2006 2005 2004 2003 2002 2001Active Taps:1
Beginning of Year 304,483 301,565 299,157 295,841 286,051 282,985Activated During Year 2,900 3,099 2,736 3,510 10,053 4 3,273Discontinued During Year (482) (181) (328) (194) (263) (207)Net Increase During Year 2,418 2,918 2,408 3,316 9,790 3,066
Total Active Taps - End of Year 306,901 304,483 301,565 299,157 295,841 286,051
Active Taps1 Inside City 157,124 155,778 154,170 152,783 150,607 149,054City and County 1,222 1,206 1,084 1,076 1,065 1,071Outside City - Read and Bill 36,043 35,558 35,043 34,694 34,425 36,955Outside City - Total Service 35,960 35,793 35,639 35,502 35,209 31,974Outside City - Master Meter 76,552 76,148 75,629 75,102 74,535 66,997
Total Active Taps - End of Year 306,901 304,483 301,565 299,157 295,841 286,051
Stub-Ins on System2 1,936 1,926 2,887 3,023 2,553 2,992Fire Hydrant Use Permits 518 488 472 473 830 456AMR (Automatic Meter Reading) Installations 10,594 9,855 54,085 71,737 56,499 30,359Turn-Offs Due to Delinquent Accounts 12,895 11,529 14,684 12,776 11,586 10,293In-Home Water Audits 56 81 89 12 60 98Call Center Calls3 198,620 212,114 253,716 302,488 281,339 193,395Water Quality Calls
Taste and Odor 161 87 66 90 125 78Clarity 222 90 221 166 15 75Hardness 1 9 1 1 -Other 88 24 22 14 135 80
New Taps Made 3,199 2,991 3,537 4,178 3,572 3,869
1Service is on or has not been off for 5 consecutive years. Does not include taps sold to raw water distributors.2Stub-Ins are a connection made solely to extend the service line from the main to the valve at the property line prior to the pavingof the street and are not considered a tap.3Call Center Calls include calls offered, plus calls handled through the Interactive Voice Respone (IVR).4Increase of 6,820 taps for Master Meter accounts within Willows Water District in 2002.
Section 1- Summary
22

Demographic & Economic Overview of the Denver Metropolitan Area* The following is selected information concerning the economic and demographic conditions in the City and County of Denver (“Denver” or the “City”) and the immediate vicinity. The statistics presented below have been obtained from the sources indicated and represent the most current information available from such sources. The statistics have not been adjusted to reflect economic trends, notably inflation. Prior to 2004, Denver was the population center for a statistical area defined by the federal Office of Management and Budget (“OMB”) as the Denver Metropolitan Statistical Area (the “Denver MSA”) and comprising the counties of Adams, Arapahoe, Broomfield (formerly the City of Broomfield), Denver, Douglas and Jefferson. In June 2003, the OMB updated its statistical area definitions based on new standards and the results of the 2000 Census. The general concept of a metropolitan statistical area is that of a core area containing a substantial population nucleus, together with adjacent communities having a high degree of social and economic integration with that core. Metropolitan statistical areas comprise one or more entire counties. Following this definitional change, the City is now within the newly-created Denver-Aurora Metropolitan Statistical Area (the “Denver-Aurora MSA”), comprising the former Denver MSA and the counties of Clear Creek, Elbert, Gilpin and Park. The following provides information for the area comprising the Denver-Aurora MSA unless otherwise stated. Population The following table sets forth population statistics for the City, the Denver-Aurora MSA and the State of Colorado (the “State”).
Population Estimates
Year
Denver
Denver-Aurora MSA
State of Colorado
Denver Water Service Area
1960 493,887 868,943 1,753,947 612,000 1970 514,678 1,118,563 2,209,596 768,000 1980 492,694 1,450,768 2,889,735 846,000 1990 467,610 1,666,883 3,294,473 891,000 2000 554,636 2,157,756 4,301,261 1,036,000 2001 560,365 2,247,319 4,446,928 1,052,000 2002 560,882 2,288,616 4,521,824 1,076,000 2003 566,173 2,323,494 4,586,761 1,081,000 2004 568,913 2,360,678 4,653,023 1,104,000
2005* 572,116 2,392,163 4,720,772 1,115,000 *Forecast as of November 2005 Source: Colorado Department of Local Affairs, Division of Local Government, Demographic Section
Section 1- Summary
23

Income The following table set forth median household effective buying income (“EBI”) for Denver, the Denver-Aurora MSA, the State, and the United States for the past seven years. EBI is defined as money income less personal tax and non-tax payments, resulting in a figure often referred to as “disposable” or “after-tax” income. EBI for 2002 through 2004 is computed as a derivative of household income, with the correspondence between before-tax and after-tax income based on a three-year combination of Current Population Survey data. Income and all income-related fields for 2000 and 2001 are benchmarked to the 1990 Census.
Median Household Effective Buying Income
As of
January 1
Denver Denver-
Aurora MSAState of
Colorado United States
1999 $29,010 $39,275 $35,247 $35,377 2000 30,572 41,581 37,335 37,234 2001 32,877 44,312 39,742 39,130 2002 42,540 49,109 44,050 38,365 2003 37,261 46,878 43,510 38,035 2004 37,383 47,275 43,544 38,201 2005 38,523 48,239 44,489 39,324
Source: Trade Dimensions International, Inc., Demographics USA8 - County Edition, 2001-2005
The following table sets forth recent annual per capita personal income levels of the City, the Denver-Aurora MSA, the State and the United States.
Per Capita Personal Income in Current Dollars1
Year
Denver Denver-
Aurora MSA State of
Colorado United States
1996 $29,573 $28,616 $25,570 24,176 1997 30,291 29,907 26,846 25,334 1998 33,005 32,221 28,784 26,880 1999 35,068 34,230 30,492 27,933 2000 39,152 37,847 33,371 29,847 2001 41,913 39,432 34,493 30,571 2002 42,212 38,923 34,027 30,813 2003 43,117 39,203 34,528 31,497 2004 Not available 36,113 33,046 2005 Not available 37,946 34,544
1 The Denver and Denver-Aurora MSA figures are as of April 2005, and the Colorado and United States figures are as of March 2006. Source: U.S. Department of Commerce, Bureau of Economic Analysis Employment The following tables set forth the number of individuals employed within selected industries covered by unemployment insurance in the City and the Denver MSA for the period 1996 through 2004. Annual data for 2005 is not yet available. Beginning in 2001, such data has been published only under the North American Industrial Classification System (“NAICS”) codes and is not directly comparable to prior year data, which was classified by the Standard Industrial Classification System (“SIC”) codes.
Section 1- Summary
24

Average Number of Employees within Selected Industries in the Denver MSA Subject to State Unemployment Laws - SIC Classifications
Industry 1996 1997 1998 1999 2000
Agriculture, Forestry and Fisheries 8,585 9,302 10,206 11,273 12,215 Mining 6,840 6,895 6,756 5,949 5,749 Construction 57,402 61,474 68,691 77,980 87,748 Manufacturing 89,631 92,675 93,005 90,413 90,485 Transportation, Communication and Public Utilities 81,492 82,947 89,288 97,023 99,095 Wholesale Trade 66,929 69,762 70,441 71,243 74,137 Retail Trade 181,408 186,866 190,165 198,268 204,633 Finance, Insurance and Real Estate 75,426 80,760 86,356 88,604 89,442 Services 289,520 308,276 322,162 335,349 351,896 Government 138,884 141,574 144,346 146,703 149,953 Nonclassifiable 62 58 47 25 21 Total 996,179 1,040,589 1,081,463 1,122,830 1,165,374
Source: Colorado Department of Labor and Employment
Average Number of Employees Within Selected Industries in the Denver MSA Subject to State Unemployment Laws - NAICS Classifications
Industry 2001 2002 2003 2004
Agriculture, Forestry, Fishing, Hunting 2,151 2,024 1,855 1,715Mining 5,261 5,127 4,977 5,141Utilities 3,752 3,758 3,588 3,627Construction 90,603 86,775 79,659 79,282Manufacturing 78,108 74,956 70,821 71,684Wholesale Trade 68,124 65,068 62,673 61,982Retail Trade 120,285 122,675 120,298 120,474Transportation and Warehousing 46,787 44,090 43,112 43,674Information 67,300 60,094 54,470 51,314Finance and Insurance 69,011 68,357 69,124 69,498Real Estate, Rental and Leasing 26,037 25,830 26,095 26,167Professional and Technical Services 89,819 86,505 83,527 85,268Management of Companies and Enterprises 12,998 14,889 16,167 17,652Administrative and Waste Services 85,584 79,912 77,318 79,613Educational Services 13,540 13,976 14,320 15,007Health Care and Social Assistance 91,730 94,987 97,297 99,445Arts, Entertainment and Recreation 14,672 15,014 15,006 16,325Accommodation and Food Services 92,467 94,076 93,785 95,880Other Services 35,558 36,027 35,276 35,324Nonclassifiable 27 23 23 59Government 153,826 160,443 160,755 159,994 Total 1,167,640 1,154,606 1,130,147 1,139,124
Source: Colorado Department of Labor and Employment
Section 1- Summary
25

Civilian Labor Force Averages (labor force expressed thousands and not seasonally adjusted)1
Denver Denver-Aurora MSA State of Colorado
Year Labor Force
Percent Chang
e
Percent Unemploye
d
Labor Force
Percent Change
Percent Unemployed
Labor Force
Percent Change
Percent Unemployed
2000 298.8 -- 2.8% 1,235.9 -- 2.2% 2,359.3 -- 2.6% 2001 290.4 (2.8)% 4.7 1,247.8 1.0% 3.7 2,394.9 1.5% 3.9 2002 294.2 1.3 7.2 1,263.5 1.3 6.0 2,443.3 2.0 5.9 2003 303.1 3.0 7.6 1,287.8 1.9 6.4 2,479.8 1.5 6.2 2004 308.9 1.9 6.7 1,313.2 2.0 5.6 2,522.2 1.7 5.5 1 Data as of April 8, 2005. Source: U. S. Department of Labor, Bureau of Labor Statistics
20 Largest Private Sector Employers in the Denver Metropolitan Area (May 2005)
Company
Business
Employment Qwest Communications International Telecommunications 13,200 King Soopers Inc. Grocery retail 7,800 Lockheed Martin Aerospace 7,700 Wal-Mart Stores, Inc. General merchandise retail 7,100 United Airlines Airline 7,000 HCA-HealthONE, LLC Health care services 6,800 IBM Data processing 6,100 Safeway, Inc. Grocery retail 6,000 University of Denver Education 5,700 Exempla Healthcare Health care 5,100 EchoStar Communications Corp. Satellite television 5,000 Centura Health Health care 5,000 Kaiser Permanente Health care 4,100 Ball Corporation Aerospace, containers 3,800 University of Colorado Hospital Health care services 3,800 Frontier Airlines Airline 3,600 Coors Brewing Co. Beverage manufacturer 3,500 Denver Health and Hospital Authority Health care 3,500 Wells Fargo Bank West, N.A. Financial services 3,500 Great-West Life & Annuity Insurance Co. Insurance 3,400
Source: Metro Denver Economic Development Corporation; compiled from various business lists by Development Research Partners
Section 1- Summary
26

Construction
Building Permit Activity in Denver - New Structures
Residential1
Other
Year
Permits2
Value (000's)
Permits
Value (000's)
1999 2,245 $312,171 985 $126,571 2000 1,794 332,601 1,146 183,287 2001 1,474 364,732 926 166,556 2002 2,049 401,106 1,374 175,390 2003 1,846 358,601 1,371 111,833 2004 1,831 414,728 1,088 93,089 2005 2,228 539,584 1,481 195,536
1 Includes single family and two family dwellings, apartment buildings, hotels and motels. 2 Number of permits issued, which is not equivalent to the number of units. Source: City of Denver Building Department
Building Permit Activity in the Denver MSA (values in millions and rounded)
Residential
Commercial
Industrial
Public/Nonprofit
Year Permits Value Permits Value Permits Value Permits Value 1999 18,529 $2,679.7 1,234 $916.6 68 $51.1 30 $29.3 2000 16,669 2,717.0 1,032 840.0 55 27.8 42 102.8 2001 15,619 2,678.8 898 1,058.3 140 85.6 44 91.8 2002 15,451 2,701.3 886 562.7 176 144.1 111 91.0 2003 15,255 2,252.0 534 415.1 108 71.8 48 53.0 2004 16,687 3,608.4 655 569.9 137 81.5 45 75.7
Source: Metro Denver Economic Development Corporation
New Residential Units in Denver and the Denver MSA
Denver
Denver MSA
Year
Single Family
Two Family
Multi- Famil
y
Total Units
Single Famil
y
Two Family
Multi- Famil
y
Total Units
1999 2,171 49 250 2,470 18,080 157 4,563 22,800 2000 1,544 255 1,053 2,852 14,074 2,691 8,996 25,761 2001 1,106 1,148 1,810 4,064 12,896 4,066 8,405 25,367 2002 1,475 1,244 1,336 4,055 12,549 4,022 4,085 20,656 2003 1,482 1,035 987 3,504 11,369 3,149 1,832 16,350 2004 1,419 1,087 1,174 3,680 12,736 4,315 2,319 19,370 2005 1,842 735 140 2,717 15,168 4,257 459 19,884 Source: Home Builders Association of Metropolitan Denver
Section 1- Summary
27

Foreclosure Activity
The following table sets forth recent foreclosures filed in the Denver-Aurora MSA. Foreclosures Filed in the Denver-Aurora MSA
County 2001 2002 2003 2004 2005 Adams 799 1,313 1,899 2,499 3,281 Arapahoe 1,000 1,575 2,250 3,125 3,600 Broomfield1 3 73 110 132 124 Clear Creek 41 44 59 59 58 Denver 1,134 1,752 2,500 3,351 3,713 Douglas 270 415 652 800 912 Elbert 72 124 151 126 145 Gilpin 32 31 35 52 35 Jefferson 731 1,130 1,532 1,880 2,120 Park 92 147 139 155 200 Totals 4,174 6,604 9,327 12,179 14,188 Annual change
--
58.2%
41.2%
30.6%
16.5%
1The City of Broomfield became the City and County of Broomfield effective in the fall of 2001. The former City of Broomfield encompassed portions
of the counties of Adams, Boulder, Jefferson and Weld. Source: County Public Trustees’ Offices
Section 1- Summary
28

2007 BILLED OPERATING REVENUE (SALE OF WATER) BUDGET $189,814
(Thousands of Dollars)
Revenue OutsideThe City$107,776
57%
Revenue InsideThe City$82,038
43%
Approximately 57% of the operating revenue will be from outside the City of Denver...
Section 2 - Receipts Receipts Summary Denver Water practices the full accrual method to account for annual revenues, we use a modified cash basis for budgeting. Receipts are budgeted based on when we expect to receive the payment. Receipts are comprised of operating receipts from the sale of water to customers, participation receipts (payments for capacity in specific facilities to serve specific groups of customers), system development charge receipts (tap fees), receipts from bond proceeds, as well as small amounts of non-operating and other receipts. Total 2007 receipts are forecast to be $292.5 million.
Operating Receipts (Sale of water to customers) Operating receipts are generated from sales of water to customers. They are used to pay for normal operation and maintenance, replacement of facilities, and plant additions as well as debt service. In 2006, total receipts from the sale of water to customers were $30.7 million higher than budgeted. The forecast used to develop the 2006 operating receipts budget assumed that customer demand for water would be 19% below the historical norm. In reality, demand was approximately 4.2% below the average in the 10 years preceding the drought.
In the past, receipts were forecasted and budgeted using historical trend information. However, the recent drought (2001-2004) added uncertainty to this forecasting process. Based on the experience from other water utilities, consumption of water drops drastically during a drought and gradually increases as climate conditions return to normal, finally leveling out somewhere below pre-drought historical norms. As a result, we base our forecast on this “drought shadow”. Although our experience in 2006 might indicate that our drought shadow demand forecast is lower than actual, Board guidance has been that we continue to be conservative in our forecasting method.
The 2007 budget of $189.8 million reflects an average rate increase of 7.0% effective January 1, 2007 as well as a demand forecast at 16.7% below pre-drought historical averages. Approximately 57% of the 2007 billed water sales revenue is projected to be from outside the City of Denver, while only 49% of customers are located outside the City. Water provided to outside City customers is billed at a higher rate than water provided to inside City customers.
Denver Water does not depend on any one customer or any group of customers for a major portion of its revenue. The 25 largest customers (excluding the City and County of Denver) accounted for less than 5% of treated water revenue received in 2006.
Total 2007 receipts
forecast $292.5 million.
Operating Receipts 2006
actual: $195.1 million.
Operating Receipts 2007
Budget: $189.8 million.
Section 2- Receipts
29

Non-Operating Receipts These receipts are obtained from payments for services that Denver Water renders such as ditch assessments for delivery of non-potable water for irrigation, main inspections, installation of taps, the calculating and mailing of sewer bills, rents on Denver Water facilities and other such services. Based on historical trends, total non-operating receipts for 2007 are projected to be $2.8 million. Actual 2006 non-operating receipts of $2.7 million were $185,000, or 6.5%, less than budget.
Hydropower Receipts Hydropower receipts are generated from the sale of power provided by generating facilities at the Dillon, Strontia Springs and Williams Fork dams, Roberts Tunnel, Foothills Treatment Plant and Conduit 27 at Hillcrest. The budget for Hydropower receipts is based on certain assumptions about hydrological and weather conditions and varies as these conditions vary each year. Total Hydropower receipts in 2006 were $2.5 million, 37% above budget, due to favorable conditions that left many of our reservoirs at or near capacity. Hydropower receipts for 2007 are anticipated to be $2.9 million. This higher projection is based on the anticipated completion of a new hydro facility at Gross Reservoir, which will generate approximately $750,000 in 2007 and $1.5 million annually in future years.
System Development Charges (SDC) SDCs are tap fees for new connections to the Denver Water system that represent the value of the capacity used by the new customer. System development charge receipts are projected to total $27.8 million for 2007, based on anticipated building trends. Actual 2006 receipts of $22.4 million were $3.3 million less than budgeted due to a late-year slowdown in new housing starts in the Denver areas.
Participation Receipts Participation receipts are payments for capacity in specific facilities to serve specific groups of customers. For example, another water district may pay Denver Water for capacity in certain conduits that we are building. Participation receipts for 2007 are projected to be $5.0 million. The largest item in the 2007 budget is $2.7 million from Valley Water and Sanitation District for work on Conduits 158 and 159.
Actual 2006 receipts of $2.7 million were $2.2 million lower than budgeted due to delays in the completion of several participation projects.
Reimbursements and Grants Reimbursements of $2.7 million are anticipated for 2007. This includes $1.7 million from the South Adams County Water & Sanitation District for our gravel pit storage project and $300,000 from the City of Arvada for the Moffat Collection System project. Total 2006 reimbursements of $1.6 million were $1.1 million less than budgeted. The shortage was largely a result of timing for both the gravel pit projects and Moffat Collection System project.
Interest on Investments Until March 2007, the Board maintained two investment portfolios, a liquidity portfolio designed to provide funds to meet the Boards obligations when they come due and an investment portfolio designed to attain a market average rate of return over a full interest rate cycle. Under the terms of an investment policy adopted by the Board on March 14, the two portfolios will be combined into a single portfolio with guidelines that are not materially different from the aggregate of the tow separate portfolios.
System Development Charges are
projected to be $27.8 million.
Section 2- Receipts
30

The investment guidelines limit investments to treasury securities, federal agency securities, top-rated commercial paper, corporate bonds rated Aa or better, and money market mutual funds. The maximum maturity of corporate securities is 3 years, agency securities are 4 years, and treasury securities is 5 years. The investment policy also imposes concentration limits both by issuer and by type of security. The portfolio is accounted for on a fair market value basis. The combined interest paid to Denver Water on both investment portfolios in 2007 is budgeted at $5.9 million. Actual 2006 interest receipts of $6.9 million were $1.4 million above budget because balances in investment portfolios were higher than anticipated and shorter term interest rates have been increasing.
Other These receipts consist of reimbursements for the relocation of mains and fire hydrants, proceeds from the sale of surplus assets, employee payments for health and dental insurance and minor items not included elsewhere. Other receipts are projected to be $5.4 million in 2007. Included in this total is $2.4 million for employee payments for health and dental insurance. This is a substantial increase due to a change in health care plan design intended to bring Denver Water’s health insurance benefits in line with industry averages.
Actual 2006 receipts of $13.2 million were $8.3 million over budget partially due to the unanticipated sale of several properties; Hugh M. Woods, ($2.7 million), Highline Canal, ($575,000) and Cherry Creek Galleries, ($86,000). This category also includes our timing adjustment that we use to reconcile our cash receipts and payments method with the accrual method of reporting expenditures. In 2006 we had an unusually high payment timing adjustment of $4.4 million for construction work completed in December but paid in January.
Debt Proceeds Denver Water has budgeted cash receipts of $50.0 million from the sale of revenue bonds in 2007. In 2006, Denver Water did not issue revenue bonds as anticipated in 2006 due to a mid-year assessment of our financial condition, and a desire to spend time evaluating future debt policy and strategy, and incorporating needed changes into the legal structure of the Board’s bond resolutions. This activity will continue in 2007 although bonds were sold in March 2007 for capital expenditures made, or to be made in 2006-2008.
Section 2- Receipts
31

2004 2005 2006 2006 2007Actual Actual Budget Actual Budget
Receipts:
Operating $ 130,838 $ 157,902 $ 164,333 $ 195,054 $ 189,814
Drought Surcharge/Rebate 12,425 68 0 0 0
Non-Operating 2,598 2,794 2,846 2,661 2,846
Hydropower 1,188 2,942 1,827 2,496 2,931
System Development Charges 24,917 26,280 25,654 22,389 27,842
Tap Surcharge 1,195 0 0 0 0
Participation 2,241 1,850 4,978 2,735 5,014
Reimbursements & Grants 3,646 762 2,705 1,586 2,658
Interest on Investments 3,942 2,092 5,490 6,937 5,974
Other 11,320 3,777 4,813 13,160 5,415
Subtotal Receipts $ 194,310 $ 198,467 $ 212,646 $ 247,018 $ 242,494
Debt Proceeds 14,300 30,500 40,000 0 50,000
Total Receipts $ 208,610 $ 228,967 $ 252,646 $ 247,018 $ 292,494
(Thousands of Dollars)
Comparison of Receipts 2004 - 2007
ooppaa
Section 2- Receipts
32

2004 2005 2006 2006 2007Actual Actual Budget Actual Budget
Operating Receipts (Water Sales) Billed Operating Revenue: Metered General $ 85,423 $ 108,294 $ 106,819 $ 129,182 $ 125,552
Private Fire Protection 757 796 766 962 848
Public Authority 4,518 6,168 6,506 9,141 7,632
Sales for Resale-Treated 30,981 37,825 39,194 45,111 44,746
Other Sales of Water-Raw 312 347 445 400 370
Sales for Resale-Raw 2,891 3,924 6,309 8,054 5,367
Other Operating Revenue 3,231 4,386 2,250 3,893 3,624
Recycled Water 384 779 1,366 854 1,246 Total Billed Operating Revenue $ 128,497 $ 162,519 $ 163,655 $ 197,597 $ 189,385
Cash Flow Adjustment* 2,341 (4,617) 678 (2,543) 429
Total Operating Receipts $ 130,838 $ 157,902 $ 164,333 $ 195,054 $ 189,814
% Receipts to Billed Revenue 101.80% 97.20% 100.40% 98.70% 100.20% * Cash Flow Adjustment is the difference between amounts billed to customers and payments received in a year due to delays between billings and payments over the budget year.
Non-Operating Receipts Merchandising, Jobbing & Contract Work $ 1,289 $ 1,523 $ 1,342 $ 1,379 $ 1,418
Canals, Ditches and Ranches 212 227 299 181 299
Sewer Billing Charges 528 549 605 513 630
Other Non-Operating 569 495 600 588 499
Total Non-Operating Receipts $ 2,598 $ 2,794 $ 2,846 $ 2,661 $ 2,846
Comparison of Operating and Non-Operating Receipts
(Thousands of Dollars)2004 - 2007
Section 2- Receipts
33

Water Rates The Board of Water Commissioners is authorized by Section 10.1.9 of the Charter to set rates for water service. Since its inception, the Board has set rates at a level sufficient to service its debt and to meet its expenses of operation and maintenance. The Board has never required ad valorem taxes to meet its obligations.
Rate increases are implemented from time to time in order to offset the impact of inflation and other operating financial requirements.
Water Rate Levels The Board continually reviews its structure of water rates, adjusting them as may be necessary to provide adequate levels of revenue. In view of the operational and capital needs of the system and the impact of inflation, the Board conducts ongoing rate studies to determine required rate levels.
On September 27, 2006, the Board adopted new rates and service charges to take effect for water bills dated on and after January 1, 2007. The new water rates are designed to increase revenue from water sales, under normal weather conditions, by 7.0%.
History of Rate Increases
The following statistics show effective dates of past actions by the Board in setting adequate rates and the proposed incremental increases in revenues for the past 10 years.
Effective Date Increase in Revenues January 1, 1997 4.5% January 1, 1998 3.1% January 4, 1999 0.5% March 6, 2000 2.5% January 1, 2001 2.4% January 1, 2002 2.5% January 1, 2003 3.1% January 1, 2004 5.0% September 7, 2004 5.0% January 1, 2005 8.0% January 1, 2006 8.0% January 1, 2007 7.0%*
*On February 14, 2007, the Board elected to create a new rate class for irrigation accounts that have traditionally been required to pay single family
residential rates. This was done in response to the concerns expressed by homeowner’s associations (“HOAs”) regarding the rates they must pay to
irrigate common area for landscaping in single family residential developments. The new rates, which are based on a seasonal winter/summer rate
design, will equitable water bill impacts. Rates for this new customer classification will be effective on May 1, 2007.
2007 CUSTOMERS ESTIMATED 304,570
Customers Inside
The City 155,579
51%
Customers Outside The
City148,991
49%
... while an estimated 49% of the customers are outside the City of Denver
Section 2- Receipts
34
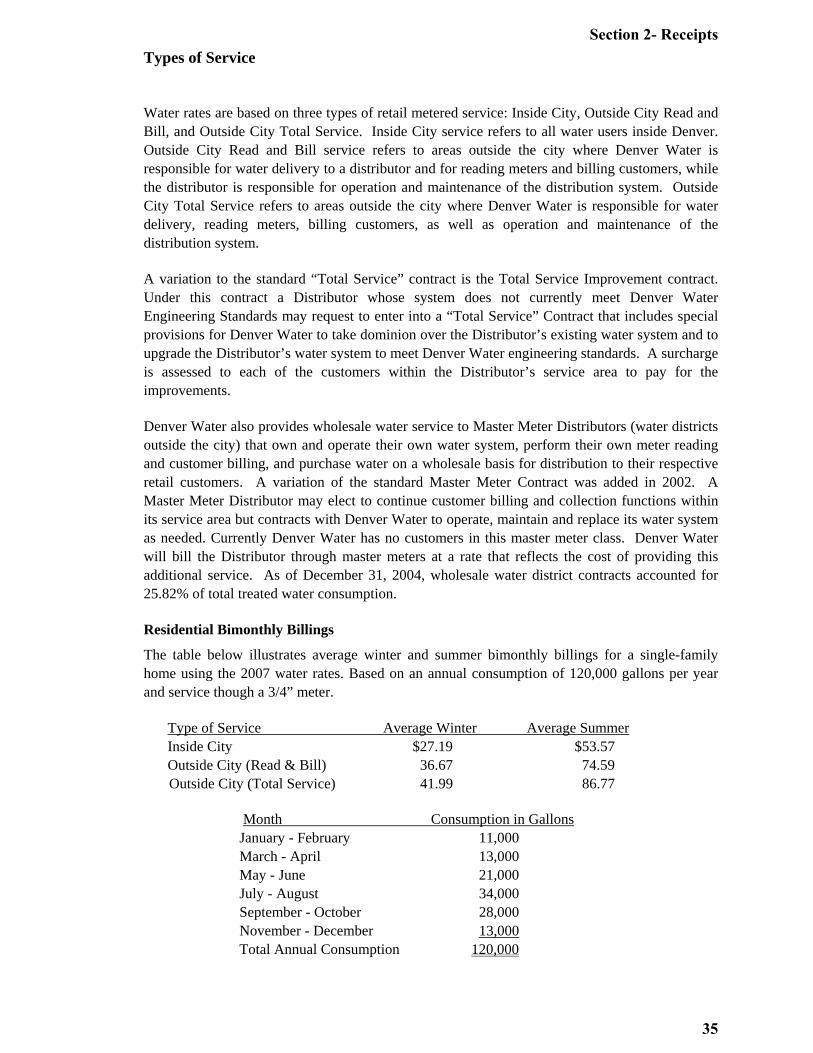
Types of Service
Water rates are based on three types of retail metered service: Inside City, Outside City Read and Bill, and Outside City Total Service. Inside City service refers to all water users inside Denver. Outside City Read and Bill service refers to areas outside the city where Denver Water is responsible for water delivery to a distributor and for reading meters and billing customers, while the distributor is responsible for operation and maintenance of the distribution system. Outside City Total Service refers to areas outside the city where Denver Water is responsible for water delivery, reading meters, billing customers, as well as operation and maintenance of the distribution system.
A variation to the standard “Total Service” contract is the Total Service Improvement contract. Under this contract a Distributor whose system does not currently meet Denver Water Engineering Standards may request to enter into a “Total Service” Contract that includes special provisions for Denver Water to take dominion over the Distributor’s existing water system and to upgrade the Distributor’s water system to meet Denver Water engineering standards. A surcharge is assessed to each of the customers within the Distributor’s service area to pay for the improvements.
Denver Water also provides wholesale water service to Master Meter Distributors (water districts outside the city) that own and operate their own water system, perform their own meter reading and customer billing, and purchase water on a wholesale basis for distribution to their respective retail customers. A variation of the standard Master Meter Contract was added in 2002. A Master Meter Distributor may elect to continue customer billing and collection functions within its service area but contracts with Denver Water to operate, maintain and replace its water system as needed. Currently Denver Water has no customers in this master meter class. Denver Water will bill the Distributor through master meters at a rate that reflects the cost of providing this additional service. As of December 31, 2004, wholesale water district contracts accounted for 25.82% of total treated water consumption.
Residential Bimonthly Billings
The table below illustrates average winter and summer bimonthly billings for a single-family home using the 2007 water rates. Based on an annual consumption of 120,000 gallons per year and service though a 3/4” meter.
Type of Service Average Winter Average Summer Inside City $27.19 $53.57 Outside City (Read & Bill) 36.67 74.59 Outside City (Total Service) 41.99 86.77 Month Consumption in Gallons January - February 11,000 March - April 13,000 May - June 21,000 July - August 34,000 September - October 28,000 November - December 13,000 Total Annual Consumption 120,000
Section 2- Receipts
35

Survey of Comparative Water Bills This table compares Denver's annual residential water bills with those of other independent suppliers in the Denver Metropolitan area for a representative residential customer based on usage of 120,000 gallons per year. This information is for comparison purposes only.
ANNUAL RESIDENTIAL WATER CHARGES DENVER AND OTHER WATER DISTRIBUTORS
IN THE DENVER METROPOLITAN AREA 2006 Percent of Annual Water Denver Inside City City Service Charge Customer Charges Golden (outside) $973 345.04% Arvada (outside) 641 227.30% Colorado Springs (outside) 624 221.28% Thornton (outside) 601 213.12% Louisville (outside) 583 206.74% Aurora 536 190.07% Westminster (outside) 496 175.89% Boulder (outside) 470 166.67% Highlands Ranch 426 151.06% Broomfield 421 149.29% Englewood (outside) 417 147.87% Denver (outside) – 2006 416 147.52% Pueblo (outside) 392 139.01% Northglenn City 386 136.88% Denver (outside) – 20071 344 121.99% Denver (inside) – 2006 282 100.00% Denver (inside) - 20071 273 96.81% Pueblo (outside) 392 139.01% 1Despite the general water rate increases in 2007 compared to 2006, Denver Water’s 2007 annual average residential water charges based on usage of
120,000 gallons of water per year are lower than in 2006 because residential consumption rates for Block 2, 3, and 4 were increased but the rate for
consumption Block 1 was reduced as a means of encouraging water conservation. Customers who use 120,000 gallons of treated water annually fall
primarily in the Block 1 category. In addition, in 2007 the meter charge was replaced with a service charge that is approximately $4 less than the 2006
meter charge for residential customers.
Source: Denver Water and individual water suppliers
Section 2- Receipts
36

System Development Charges and Participation Receipts
In addition to operating revenues and bond proceeds, funds are generated from (1) system development charges (“SDCs”), which are fees received for new connections to Denver Water’s system, and (2) participation receipts, which are payments for capacity in specific facilities to serve specific groups of customers.
The system development charge (“SDC”), instituted in 1973, and has provided a major source of funds for capital expenditures. Since 1973, Denver Water has collected approximately $531.6 million in SDCs. This charge applies to any applicant who is granted a license to take water through Denver Water’s system or through a system deriving its supply from Denver Water. The charge is assessed upon application for a new tap and is based upon the (1) gross square footage of the single family residential lot or, (2) the number of units in a multiplex building served through a single tap or, (3) the size of the connection required. (See table on the following page.)
Since 1974, developers have been required to participate in the front-end financing of facilities necessary to meet their specific needs. Total participation receipts of $125.4 million have been collected since inception.
The Denver Board of Water Commissioners approved an average 9.8% increase for all SDCs within Denver Water’s Combined Service Area effective January 7, 2007.
System Development Charges and Participation Receipts Collected (Cash Basis - net of amounts refunded)
1973 - 2006 SDCs Participation
Receipts 1973-86 $ 149,473,600 $ 43,647,100 1987 8,544,400 4,561,300 1988 6,084,600 3,067,700 1989 6,251,400 4,965,200 1990 6,615,100 1,838,700 1991 7,530,400 2,330,700 1992 10,920,300 1,198,800 1993 12,181,800 1,343,600 1994 13,535,700 2,881,800 1995 15,527,600 3,927,400 1996 15,137,300 2,913,102 1997 45,058,104 3,732,524 1998 33,155,890 8,411,534 1999 24,223,691 11,963,951 2000 25,525,391 6,392,360 2001 22,186,342 7,026,906 2002 36,590,914 5,567,014 2003 19,614,948 2,831,285 2004 24,833,961 2,228,550 2005 26,256,752 1,849,613 2006 22,305,207 2,730,141 Total $ 531,553,400 $ 125,409,280
Section 2- Receipts
37

History of Systemevelopment Charge Increases and Water Rate Structure
History of Increases
System Development Charges (First Implemented July 1973)
Effective Date Incremental Increase July 1, 1973 100.0% April 1, 1975 50.0% April 16, 1976 50.0% January 1, 1980 50.0% February 1, 1982 50.0% January 1, 1986 7.0% January 1, 1998 5.0% January 4, 1999 5.0% January 1, 2001 9.0% April 1, 2003 9.2% October 22, 2003 20.0% January 30, 2006 9.0% April 10, 2006 7.8% January 8, 2007 9.8%
Section 2- Receipts
38

Water Rate Structure
(Effective January 8, 2007)
Customers are billed a charge plus a consumption charge as follows:
RESIDENTIAL CHARGE: Monthly Bimonthly All Customers $3.87 $5.98
RESIDENTIAL CONSUMPTION CHARGE (Bimonthly)
Rate Per 1,000 Gallons Residential: Outside City Outside City Single Family Inside City Read and Bill Total Service First 22,000 Gallons $ 1.72 $ 2.13 $ 2.23 Next 38,000 Gallons 3.44 4.26 4.46 Next 20,000 Gallons 5.16 6.39 6.69
All over 80,000 Gallons 6.88 8.52 8.92
Small Multi-Family duplex with single meter* First 30,000 Gallons 1.95 2.13 2.77 Over 30,000 Gallons 2.34 2.56 3.32
All Other Retail: Winter 1.89 2.42 2.89 Summer 2.27 2.90 3.47
WHOLESALE RATE OUTSIDE CITY ONLY (Master Meter) Rate Per 1,000 Gallons Consumption Charge: All Consumption $ 2.55
WHOLESALE with Maintenance (Master Meter Maintenance) Rate Per 1,000 Gallons
All Consumption $ 3.72 System Development Charge Schedule *Small Multi-family is 2 – 5 plex. The blocks increase with the number of units. See rate schedule for more details.
Section 2- Receipts
39

Tap Size ($/Tap) Inside Denver Outside Denver3/4 5,450$ 7,625$
1 16,350 22,875 1 1/2 32,700 45,750
2 49,050 68,625 3 119,900 167,750 4 212,550 297,375 6 365,150 510,875 8 490,500 686,250
10 621,300 869,250 12 757,550 1,059,875
Non-Potable
Tap Size ($/Tap) Inside Denver Outside Denver3/4 3,625$ 5,100$
1 10,950 15,300 1 1/2 29,200 40,800
2 47,450 66,300 3 80,300 112,200 4 120,450 168,300 6 248,200 346,800 8 321,200 448,800
10 412,450 576,300 12 587,650 821,100
Inside Denver Outside Denver Inside Denver Outside DenverAcre Foot Conversion ($/AF) $11,850 $16,575 $7,925 $11,100Inside the Combined Service Area $17,000 $11,100Outside the Combined Service Area
System Development Charge Schedule(Effective January 8, 2007)
Single FamilyInside Denver
$2,000 + $0.43 per Sq. Ft. Outside Denver
$2,800 + $0.60 per Sq. Ft.
Multifamily
$10,280 + $2,340 for each unit over 2Outside DenverInside Denver
$7,350 + $1,675 for each unit over 2
All Other
Treated Water Non-Potable Water
Treated Water
Section 2- Receipts
40

Section 3 - Expenditures By Program Program Summary Denver Water engages in specific activities to carry out Strategic and Integrated Resource Plan policies aimed at delivering high quality water at the lowest possible cost. These activities have been grouped into five broad categories or programs that follow the flow of water from raw water source to the customers tap. Each program is further broken down into operation and maintenance and capital expenditure components. The programs are:
Raw Water Program - Provision of an adequate raw water supply. Includes collection and impounding reservoirs, collection systems, ditches and canals and raw water supply mains.
Recycled Water Program - Includes studies, engineering, construction and operation of facilities for successive use of water for non-potable purposes such as irrigation.
Water Treatment Program – Contains expenditures related to the construction, operation and maintenance of facilities for the treatment of water prior to delivery to customers. This program includes both three potable water treatment plants as well as a Water Quality Laboratory.
Delivery Program - Providing treated water to customers and distributors. Includes pumping stations, treated water reservoirs, transmission and distribution mains, fire hydrants, and decentralization stations.
Conservation Program – Includes funds for capital conservation programs such as lake lining and Xeriscaping as well as education, advertising and rebate programs designed to assist our customers with water conservation.
Customer Service Program – This program supplies staff and operating expenditures for meter reading, customer billing, call center, meter testing and repair and other customer related services.
General Plant Program - Includes Capital and Operating expenditures for all activities not directly related to the above programs. Operation and maintenance or our administrative facilities, security, computer support and administration are included in this program.
Total 2007 program budget expenditures of $290.3 million include $136.8 million for operation and maintenance; $99.1 million for capital for new additions, replacements and improvements and equipment as well as $54.4 million for debt service and related costs.
Operation and Maintenance The Operation and Maintenance budget for 2007 is an increase of 6.6% over 2006 expenditures. Average annual growth in Operation and Maintenance expenditures has been under 5 percent for the last ten years. As expected, inflation and growth in the number of customers we serve have increased our expenditure levels. As demand grows, so do our costs for water treatment chemicals, power, and other items related to the treatment and delivery of water.
Total 2007 Expenditures $290.3 million
Section 3- Expenditures by Program
41

Over the past several years, Denver Water has experienced several unanticipated events which have impacted operations. Security measures implemented following the September 11, 2001 terrorist attacks have resulted in permanent increases in operating costs. In addition, we experienced several major forest fires in 2002 and as a result have increased our expenditures for re-vegetation and sediment removal in our water shed.
As the Denver area has emerged from the drought of the past several years, we have become aware of the need to focus our day to day operations on permanent water efficiency and wise water use. To achieve this the Board has directed Denver Water to accelerate water saving conservation measures so that we achieve a 20 year level of savings by 2016. To this end the Board has approved $7.6 million for these conservation programs in 2007. As with most employers, Denver Water has been impacted by the rising cost of health care in recent years. In order to mitigate some of the impact, a consultant was hired to assess our health plan and benchmark us against comparable employers. As a result, Denver Water implemented plan design changes in 2007 that bring us inline with our peers. As a result, the 2007 budget for health care is $12.5 million, $2.2 million lower than projected without the changes.
Major Capital Project Impact on Operations Completion of capital projects continues to impact our operating costs. Capital projects having the most significant impact on operations are described below.
Redevelopment of Stapleton Airport and Lowry Air Force Base continues to have a substantial impact on capital and operation and maintenance budgets. Stapleton Airport was closed in 1995 upon the opening of the new Denver International Airport. Lowry was decommissioned and the former base made available for redevelopment in September 1994. Both areas are now being developed as mixed-use communities featuring residential, office and retail facilities. As development occurs and new customers are connected to our system, costs for water treatment, delivery and maintenance of mains and lines will increase accordingly.
Additionally, the Board periodically receives requests from Read and Bill Distributors to convert to Total Service Distributors. Although the cost for capital upgrades are borne by the customers of that distributor, the conversion changes the system from one in which the distributor was responsible for system operation and maintenance to one in which Denver Water is directly responsible for such activities.
Our new recycled water plant became operational in 2004. As we began delivering recycled water to customers, our operating costs increased and now total $2.4 million annually. The Capital Work Plan for 2007 includes several distribution and storage projects that, when complete, will expand the number of customers we are serving with non-potable water. In addition, a significant expansion of the plant is planned to begin in 2012. We currently anticipate that expansion of the recycled water system and the associated costs for chemicals and power will result in annual operating expenses of $3.7 million by 2016.
Completion of the hydropower facility at Gross Reservoir, currently scheduled for June of 2007, will impact both revenue and expenditures. The facility is expected to generate approximately $1.5 million annually in revenue. The exact amount of revenue generated will be dependent on hydrological and weather conditions each year. Although no additional staff will be required, current staff needs to undergo training and certification in hydropower operation. Operating costs for our Hydropower facilities are anticipated to increase about $100,000 in 2007 from 2006 levels.
The Board has approved $7.6
million for conservation programs in
2007.
Operating costs for our
Hydropower facilities are
anticipated to increase about
$100,000.
Section 3- Expenditures by Program
42

The selection and implementation of a new Customer Information System (CIS) will also impact operations. The current schedule is for the CIS vendor to be selected in 2007 and implementation completed by 2009. The Information Technology Division will require two additional staff to support the system. In addition, annual costs for software support and maintenance will increase. The exact cost of the increase will not be known until the solution is selected, but a current estimate is approximately $200,000 annually. Also, Mobile Workforce Automation will transition from design to implementation in 2007. The overall results of putting computers in certain vehicles will be improved information at the fingertips of our employees, greater efficiency in responding to customers and system emergencies, and increased productivity. However, there will be costs associated with maintaining the additional electronics and some vehicle specifications may need to be changed so that airbag deployment does not interfere with equipment and result in injury to employees.
Finally, completion of gravel pits will result in additional operation and maintenance costs at those facilities. In 2006, an employee was transferred from the High Line Canal to a residence at Miller Gravel Pit in order to begin maintenance activities there (fencing, weed control, demolition of old structures, security, mowing, etc.) in preparation for completion of that facility in late 2007 or early 2008. Additional staff and equipment will be needed in future years.
Capital The Denver Water Capital Improvement Plan (CIP) budget for 2007 is $99.1 million. Although this is a significant increase (15.8%) over the 2006 CIP, the budget includes significant funding for large capital projects that are currently in the construction phase. There are 5 projects in the budget over $5.0 million and these projects account for $33.8 million or 34% of the total CIP budget. A list of major 2007 capital projects is shown in the Expenditures by Program Section.
Capital projects are financed through a mixture of participation receipts, system development charges and reimbursements for relocations of water facilities as a result of construction, debt, reserves and other sources.
Approximately $32.9 million of 2007 capital expenditures are shared with water distributors and others in the metropolitan area through participation contracts and system development charges, see Section 2 for further discussion of SDC and Participation Receipts.
Section 3- Expenditures by Program
43

2007 Contingency Planning
Given the financial impacts of the drought years, we have implemented a Capital Contingency Plan for 2007. This plan will allow us to be ready to move quickly to delay capital projects if water supply projections indicate a possible drought risk this spring. The projects included in the contingency plan have been budgeted to begin after April 1st. If water supply indicators show a potential water shortage, these $13.0 million in capital projects will not go forward in 2007.
Jan Feb Mar Apr May Jun Jul Aug Sep Oct Nov Dec TotalContingency Plan -$ -$ -$ 1,646$ 1,814$ 1,541$ 1,717$ 1,333$ 1,153$ 1,961$ 933$ 951$ 13,049$ Core Capital 11,990$ 9,156$ 9,477$ 8,647$ 9,122$ 8,054$ 6,401$ 5,524$ 5,528$ 4,412$ 3,818$ 3,886$ 86,014$ Total 2007 Capital Plan 11,990$ 9,156$ 9,477$ 10,293$ 10,936$ 9,594$ 8,118$ 6,857$ 6,681$ 6,373$ 4,752$ 4,837$ 99,063$
$-
$2,000
$4,000
$6,000
$8,000
$10,000
$12,000
Jan Feb Mar Apr May Jun Jul Aug Sep Oct Nov DecMonth
Core Capital Projects Contingency Projects
2007 Capital Contingency Budget
Section 3- Expenditures by Program
44

Supporting Activities Each of the major programs contains a program element called supporting activities. This is an allocation of general and administrative expenditures that are not directly related to a particular program. These supporting activities can be characterized as indirect expenditures. A detailed listing of all of the supporting activities and their subsequent allocation to capital and operation and maintenance categories, along with further allocation to each of the major programs, is contained below.
Total2007 Allocated To
Budget O & M CapitalAdministration
Administration 28,147 23,720 4,427
Warehouse - Yards 806 680 126
Maintenance Shops 2,031 1,830 201
Other* 1,194 1,007 187
Total Administration 32,178 27,237 4,941
Benefits
Employee Benefits 41,777 34,841 6,936
Gen. Liability & Other Ins. 750 620 130
Total Benefits 42,527 35,461 7,066
Total Allocation of Administration & Indirect Costs 74,705 62,698 12,007 * Includes Stores Issue and other adjustments including refunds to customers.
Raw Recycled Water Customer General 2007 Water Water Treatment Delivery Conser. Service Plant Total
Operation and Maintenance 7,452 2,323 12,700 16,184 7,390 7,266 9,382 62,698
Capital 2,997 2,409 1,420 2,699 293 0 2,189 12,007
Total 10,449 4,732 14,120 18,883 7,683 7,266 11,572 74,705
Program Element: Administration & Distributed Indirects2007
Summary of Allocation Of Administration & Indirect Costs to Programs
(Thousands of Dollars)
Section 3- Expenditures by Program
45

MAJOR 2007 CAPITAL PROJECTS(Thousands of Dollars)
2007Capital Budget
PROGRAM: RAW WATER
Gross Dam Hydroelectric Project - Construction of a hydroelectric powerhouse with a generating $ 5,343capacity of 7.6 megawatts began in 2005. The project will produce clean renewable power and produce income. Commercial operation is planned for 2007.
Cheesman Reservoir - New Inlet Control on Dam - Provide new upstream control on two existing tunnel inlets. $ 1,499Design and equipment procurement will be completed in 2007. Construction will begin in 2008.
Moffat Collection System Project - The Planning Division, through its PACSM water resource $ 1,802model, has determined that a water supply shortage will occur at the Moffat Treatment Plant during somedrought years. This water supply shortage increases as build-out of the Combined Service Area isapproached. If the Moffat Treatment Plant does not have enough water during a drought, Denver will notbe able to meet its customer's water supply needs from the remaining two treatment plants. Therefore, development of additional water supply for the Moffat Treatment Plant is a high priority.
Gravel Pit Storage Below Metro Wastewater - This project will develop storage using gravel pits $ 10,737downstream from Metro Wastewater outfall to recapture water released to supplement metro reach flows in average and above average years. In dry years, the project will recapture reusable return flow when no exchange potential exists at S. Platte intakes and release water in late spring/early summer whenexchange potential does exist for new yield and to augment the Recycled Water Project supply requirements.
PROGRAM: RECYCLED WATER
Recycled Water Project - Capitol Hill Storage, Montclair Storage & Pumping - This project replaces an $ 9,390aging potable water storage tank located adjacent to Congress Park with a smaller recycled water tank. Demolition of the existing tank began in January 2006 and construction of the new tank will be completed by March 2007.Construction of the Montclair Pump Station started in July 2006 and will be completed in Winter 2007. This pump station allows the delivery of recycled water to the Lowry and Stapleton development areas.
Recycled Distribution System - Conduits 303, 306, and 307 are under construction. Conduits 303 and 306 are $ 9,858scheduled for completion in June 2007 and Conduit 307 is expected to finish in April 2007.
PROGRAM: WATER TREATMENT
Foothills Treatment Plant Water Improvements - This project is the construction of a chlorine contact basin $ 9,552that allows compliance with future regulations on the control of disinfection by-products. The basin will be designed to house future state-of-the-art UV disinfection equipment. The design will be completed in Spring 2007and anticipated construction will begin in early 2007. The project should be complete in July 2008.
PROGRAM: DELIVERY
Colorow Reservoir Drain Line - Furnish and install approximately 6,300 ft of 30 inch pipe ( Conduit 129) from $ 1,559Colorow Reservoir to W. Belleview Ave. and Quincy St. and 1,060 ft of 24 inch (drain line) pipe from ColorowReservoir east to the Bergen Ditch. Construction will start in Spring 2007 and is scheduled to be completedby the end of 2007.
Section 3- Expenditures by Program
46

MAJOR 2007 CAPITAL PROJECTS(Thousands of Dollars)
2007Capital Budget
PROGRAM: DELIVERY (Continued)
Conduit 154, 158, and 159 - Conduit 154 will provide a 1,350 ft inerconnection between Conduit 3 and Conduit 12 $ 3,687in Vassar Ave. between S. Federal. Conduit 158 includes 1,025 ft of 30 inch steel pipeline which will connect Conduit 21 to Conduit 119. Conduit 159 will connect Conduit 94 to Conduit 119 and the Valley Water Distribution system with 8,150 lineal feet of 30 inch steel pipeline. Construction began in March 2006 and anticipated completion is December 2007.
Main Improvements and Replacements - Includes installation of new mains for $ 6,265looping and other systems improvements and replacement of deteriorated, obsolete and leaking mains under 24" in diameter. Continuous program.
PROGRAM: GENERAL PLANT
Motor Vehicles & Heavy Equipment - 32 replacement vehicles and 11 replacement heavy equipment purchases. $ 2,574
Capitalized Computer Systems and Equipment - Centralized computer hardware is budgeted $ 12,440at $570,000, Enterprise Communications $750,000, PCs and related equipment at $458,000, andcapitalized computer systems at $10.7 million, including $6.7 million for the Customer Care System.
ALL OTHER CAPITAL EXPENDITURES $ 24,357
TOTAL 2007 CAPITAL BUDGET $ 99,063
(1)Note: There are 212 projects in the 2007 Capital Work Plan. The 12 projects shown constitute 75% of the budget.
Section 3- Expenditures by Program
47

$0$20,000$40,000$60,000$80,000
$100,000$120,000
$140,000
TOTAL PROGRAM BUDGET 2004 - 2007(Thousands of Dollars)
O&M 117,512 122,352 128,761 127,071 136,809
CAPITAL 60,432 58,233 85,541 83,761 99,063
DEBT SERVICE 38,445 44,732 47,398 46,264 54,392
2004 Act 2005 Act 2006 Bud 2006 Act 2007 Bud
Program Budget Expenditures Summary The graph below shows the historical trend of operation and maintenance, capital and debt service expenditures summarized by program. Increases in operation and maintenance expenditures for 2007 reflects the accelerated conservation initiative as well as increases in chemical, fuel and utility costs. Cost impacts for prior years reflect the new Recycled Water Plant that began operation in the spring of 2004, drought response activities and the rising cost of employee health care.
The increase in anticipated CIP expenditures in 2007 are described in detail earlier in the section and include $19.2 million for Recycled Water Projects, $9.6 million for treatment plant upgrades, and $10.7 million for the acquisition and construction of gravel pit storage facilities.
Section 3- Expenditures by Program
48

2004 2005 2006 2006 2007Program Elements Actual Actual Budget Actual Budget
Operation and Maintenance Programs: Raw Water $ 6,326 $ 6,929 $ 7,327 $ 6,854 $ 7,675 Recycled Water 2,000 2,440 2,298 2,176 2,393 Water Treatment 10,932 12,416 12,453 13,173 13,082 Delivery 15,243 16,250 15,250 15,756 16,671 Conservation 3,645 1,653 2,786 2,832 7,613 Customer Service 6,410 6,375 7,174 7,143 7,484 General Plant 6,656 6,848 7,117 6,448 7,186Administration 25,742 27,359 30,194 29,589 32,178Distributed Indirect Costs 40,558 42,082 44,162 43,100 42,527
Total Operation & Maintenance $ 117,512 $ 122,352 $ 128,761 $ 127,071 $ 136,809
Capital Programs: Raw Water $ 8,155 $ 11,758 $ 24,022 $ 32,976 $ 24,731 Recycled Water 13,428 3,496 17,435 22,086 19,873 Water Treatment 6,472 5,512 4,979 2,570 11,717 Delivery 14,542 22,609 18,609 13,973 22,265 Conservation 2,811 2,607 2,025 2,111 2,414 Customer Service 5,860 2,873 1,300 1,474 0 General Plant 9,164 9,378 17,171 8,571 18,063
Total Capital $ 60,432 $ 58,233 $ 85,541 $ 83,761 $ 99,063
Debt Service, Related Costs and Interest on Reserve Funds $ 38,445 $ 44,732 $ 47,398 $ 46,264 $ 54,392
Total Expenditures $ 216,389 $ 225,317 $ 261,700 $ 257,096 $ 290,264
Program Expenditures Summary2004 - 2007
(Thousands of Dollars)
Section 3- Expenditures by Program
49

$0
$5,000
$10,000
$15,000
$20,000
$25,000
$30,000
$35,000
$40,000
TOTAL RAW WATER PROGRAM 2004 - 2007(Thousands of Dollars)
O&M 6,326 6,929 7,327 6,854 7,675
CAPITAL 8,155 11,758 24,022 32,976 24,731
2004 Act 2005 Act 2006 Bud 2006 Act 2007 Bud
Raw Water Program This program contains all of the expenditures related to the operation and maintenance of raw water facilities from source to treatment such as collection systems, storage reservoirs, intakes, wells, ditches and canals. It also includes capital expenditures related to hydropower development, water rights acquisitions, dam safety, and related activities. Total expenditures budgeted in 2007 for the Raw Water Program are $32.4 million, comprised of $7.7 million for operation and maintenance and $24.7 million for capital.
Major 2007 capital initiatives include the completion of the Gross Dam Hydro-electric facility and gravel pit storage projects. The graph shows the historical trend of these expenditures.
Raw Water Program 2007
budget: $32.4 million.
Section 3- Expenditures by Program
50
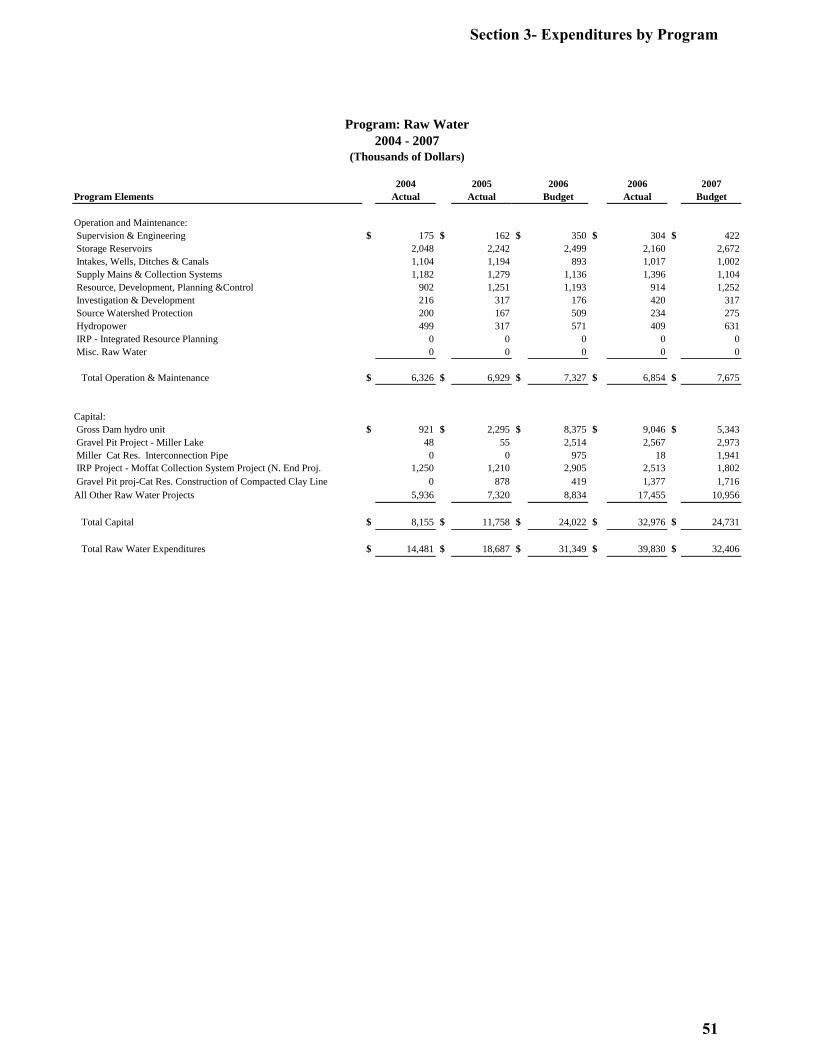
2004 2005 2006 2006 2007Program Elements Actual Actual Budget Actual Budget
Operation and Maintenance: Supervision & Engineering $ 175 $ 162 $ 350 $ 304 $ 422 Storage Reservoirs 2,048 2,242 2,499 2,160 2,672 Intakes, Wells, Ditches & Canals 1,104 1,194 893 1,017 1,002 Supply Mains & Collection Systems 1,182 1,279 1,136 1,396 1,104 Resource, Development, Planning &Control 902 1,251 1,193 914 1,252 Investigation & Development 216 317 176 420 317 Source Watershed Protection 200 167 509 234 275 Hydropower 499 317 571 409 631 IRP - Integrated Resource Planning 0 0 0 0 0 Misc. Raw Water 0 0 0 0 0
Total Operation & Maintenance $ 6,326 $ 6,929 $ 7,327 $ 6,854 $ 7,675
Capital: Gross Dam hydro unit $ 921 $ 2,295 $ 8,375 $ 9,046 $ 5,343 Gravel Pit Project - Miller Lake 48 55 2,514 2,567 2,973 Miller Cat Res. Interconnection Pipe 0 0 975 18 1,941 IRP Project - Moffat Collection System Project (N. End Proj. 1,250 1,210 2,905 2,513 1,802 Gravel Pit proj-Cat Res. Construction of Compacted Clay Line 0 878 419 1,377 1,716All Other Raw Water Projects 5,936 7,320 8,834 17,455 10,956
Total Capital $ 8,155 $ 11,758 $ 24,022 $ 32,976 $ 24,731 Total Raw Water Expenditures $ 14,481 $ 18,687 $ 31,349 $ 39,830 $ 32,406
Program: Raw Water2004 - 2007
(Thousands of Dollars)
Section 3- Expenditures by Program
51

$0
$5,000
$10,000
$15,000
$20,000
$25,000
$30,000
TOTAL RECYCLED WATER PROGRAM 2004 - 2007(Thousands of Dollars)
O&M 2,000 2,440 2,298 2,176 2,393
CAPITAL 13,428 3,496 17,435 22,086 19,873
2004 Act 2005 Act 2006 Bud 2006 Act 2007 Bud
Recycled Water Program This program includes the operation and maintenance and capital expenditures related to the recycling of water and distribution of that water for non-potable uses such as irrigation. Total 2007 expenditures for the Recycled Water Program are budgeted at $22.3 million, comprised of $2.4 million for Operation and Maintenance and $19.9 million for capital construction.
Capital expenditures are for the design, engineering and construction of system enhancements to expand the number of customers receiving potable water. These facilities will serve recycled water to customers for irrigation, cooling systems and similar purposes.
The 2006 expenditures included $22.1 million for the Recycled Water Distribution System and facilities which are anticipated to be complete by 2007. This expansion will enable service to the southern portion of Stapleton, Lowry, and nearby customers. Distribution facilities will be completed to serve northern portions of Stapleton, Rocky Mountain Arsenal, and adjacent customers by 2011. Further service to DIA, Gateway, and the northeast is anticipated to be provided by 2013.
Recycled Water
Program 2007 Budget:
$22.3 million.
Section 3- Expenditures by Program
52

2004 2005 2006 2006 2007Program Elements Actual Actual Budget Actual Budget
Recycled Water Treatment PLant $ 1,902 $ 2,068 $ 2,165 $ 2,062 $ 2,279 Recycled Solids Handling 77 335 104 110 114 Recycled Water-Service Lines 3 2 0 0 0 Recycled Water Service Lines DIA 0 0 0 0 0 Recycled Water T&D System mains 0 0 0 0 0 Recycled Water Mains DIA 18 35 29 4 0
Total Operation & Maintenance $ 2,000 $ 2,440 $ 2,298 $ 2,176 $ 2,393
Capital: Recycled Water Proj.-Capitol Hill Storage, $ 0 380 $ 7,805 9,291 2,250 Conduit 307- Capitol Hill to Montclair 265 377 5,182 9,833 5,093 Recycled Distribution Sys - Cond. 303 Montclair to Stapleton 0 61 1,906 277 3,498 Conduit 306 - Montclair to Lowry 24 $ 45 1,014 $ 117 $ 1,263 Recycled Plt - Improve Drainage, Corridor & Future Drainage 0 0 221 552 434All Other Recycled Water Projects 13,139 2,633 1,307 2,016 7,335 Total Capital $ 13,428 $ 3,496 $ 17,435 $ 22,086 $ 19,873
Total Recycled Water Expenditures $ 15,428 $ 5,936 $ 19,733 $ 24,262 $ 22,266
Program: Recycled Water2004 - 2007
(Thousands of Dollars)
Section 3- Expenditures by Program
53

$0
$5,000
$10,000
$15,000
$20,000
TOTAL WATER TREATMENT PROGRAM 2004 - 2007(Thousands of Dollars)
O&M 10,932 12,416 12,453 13,173 13,082
CAPITAL 6,472 5,512 4,979 2,570 11,717
2004 Act 2005 Act 2006 Bud 2006 Act 2007 Bud
Water Treatment Program This program contains all expenditures related to the treatment of water for potable use, including operation and maintenance of the Moffat, Marston and Foothills water treatment plants, solids handling facilities and the Quality Control Laboratory, as well as capital expenditures for improvements, modifications and replacements to existing treatment facilities. Total 2007 expenditures for the Water Treatment Program are budgeted at $24.8 million, comprised of $13.1 million for operation and maintenance and $11.7 million for capital.
The 2007 capital expenditures reflect modifications and improvements to the Foothills and Moffat Treatment Plants. Increase in operations and maintenance in 2006 reflects higher chemicals and utility costs due to both higher per unit costs and an increase treated water consumption.
The cost of treatment chemicals has been rising significantly in the past few years. The reasons for the increase include higher demand for the chemicals, particularly in China, the impact of Hurricane Katrina on production facilities, and higher energy and transportation costs for manufacturers. The price of two chemicals used in the treatment process, aluminum sulfate and caustic soda, have increased 20% and 30% respectively since 2004.
Water Treatment
Program 2007 Budget:
$24.8 million.
Section 3- Expenditures by Program
54

2004 2005 2006 2006 2007Program Elements Actual Actual Budget Actual Budget
Supervision & Engineering $ 243 $ 233 $ 290 $ 224 $ 274 Filter Plants 9,064 10,443 10,292 11,066 10,678 Laboratory 1,597 1,724 1,864 1,864 2,112 Treatment Facilities 28 16 7 19 18
Total Operation & Maintenance $ 10,932 $ 12,416 $ 12,453 $ 13,173 $ 13,082
Capital: Foothills TP - Disinfection Modifications $ 0 $ 0 $ 505 $ 529 $ 9,552
Moffat TP Install Influent Gates on Flocculation Sedimentat 0 0 147 25 274 Moffat TP - Replace 2 evaporators & 6 Chlorinators 0 0 0 0 208 Moffat TP- Replace Main Backwash Pumps 0 3 176 1 193 Moffat TP Replace Hydraulic Waste Gates w Electric Actuated 0 0 616 0 190All Other Recycled Water Projects 6,472 5,509 3,535 2,015 1,300 Subtotal $ 6,472 $ 5,512 $ 4,979 $ 2,570 $ 11,717
Total Capital $ 6,472 $ 5,512 $ 4,979 $ 2,570 $ 11,717
Total Water Treatment Expenditures $ 17,404 $ 17,928 $ 17,432 $ 15,743 $ 24,799
2004 - 2007Program: Water Treatment
(Thousands of Dollars)
Section 3- Expenditures by Program
55

$0
$5,000
$10,000
$15,000
$20,000
$25,000
$30,000
TOTAL DELIVERY PROGRAM 2004 - 2007(Thousands of Dollars)
O&M 15,243 16,250 15,250 15,756 16,671
CAPITAL 14,542 22,609 18,609 13,973 22,265
2004 Act 2005 Act 2006 Bud 2006 Act 2007 Bud
Delivery Program This program contains all expenditures relating to the delivery of water from the treatment plants to customers, including capital and operating expenses related to pumping facilities, treated water storage facilities, transmission and distribution mains, service lines, and fire hydrants, Total 2007 budgeted expenditures are $38.9 million, comprised of $16.7 million for operation and maintenance and $22.3 million for capital. Participation projects will reimburse Denver Water for $5.0 million of the capital expenditures.
Major 2007 capital expenditures include $1.5 million for installation of a drain line from Colorow Reservoir to W. Belleview and Quincy St., Diesel Engine & Variable Frequency Motor installations, $3.7 million for conduit construction and $6.3 million for transmission and distribution improvements and replacements.
Delivery Program
2007 Budget: $38.9
million.
Section 3- Expenditures by Program
56

2004 2005 2006 2006 2007Program Elements Actual Actual Budget Actual Budget
Operation and Maintenance: Supervision & Engineering $ 2,983 $ 3,001 $ 4,088 $ 2,899 $ 3,956 Pumping & Storage 4,106 5,005 3,996 4,554 4,606 Transmission & Distribution 5,218 5,521 4,421 5,558 5,683 Fire Hydrants 645 598 563 634 488 Service Lines 822 994 773 1,121 846 Contr Work Sprinkl DomSvs Conn & Rel 1,279 992 1,230 878 984 Other 190 139 179 112 108
Total Operation & Maintenance $ 15,243 $ 16,250 $ 15,250 $ 15,756 $ 16,671
Capital: Main Replacements $ 2,244 $ 2,257 $ 1,916 $ 3,449 $ 3,769 Main Improvements 3,084 3,344 1,929 2,339 2,496 Pumping and Storage Colorow Res Drain Line (Element) 30 10 477 32 1,559
Conduit & Main Rehabilitation Program 1,915 2,151 1,343 1,292 1,476 Fire Hydrant Replacement $ 512 $ 643 $ 436 $ 733 $ 1,196All Other Delivery Projects 6,757 14,204 12,508 6,128 11,769 Subtotal $ 14,542 $ 22,609 $ 18,609 $ 13,973 $ 22,265
Total Capital $ 14,542 $ 22,609 $ 18,609 $ 13,973 $ 22,265
Total Delivery Expenditures $ 29,785 $ 38,859 $ 33,859 $ 29,729 $ 38,936
(Thousands of Dollars)
Program: Delivery2004 - 2007
Section 3- Expenditures by Program
57

$0
$2,000
$4,000
$6,000
$8,000
$10,000
TOTAL CONSERVATION PROGRAM 2004 - 2007(Thousands of Dollars)
O&M 3,645 1,653 2,786 2,832 7,613
CAPITAL 2,811 2,607 2,025 2,111 2,414
2004 Act 2005 Act 2006 Bud 2006 Act 2007 Bud
Conservation Program This program contains all expenditures relating to conservation programs and activities. Total 2007 budgeted expenditures are $10.0 million, comprised of $7.6 million for operation and maintenance and $2.4 million for capital.
Major 2007 capital expenditures include $2.1 million for lake lining projects intended to stop leakage in several City lakes, and $400,000 for Xeriscaping projects at our properties.
Major operation and maintenance expenditures for 2007 are $7.6 million for conservation programs designed to accelerate water savings. These programs include education and outreach, research, and incentive programs.
Conservation Program is budgeted at
$10.0 million.
Section 3- Expenditures by Program
58

2004 2005 2006 2006 2007Program Elements Actual Actual Budget Actual Budget
Operation and Maintenance: Accelerated Savings $ 0 $ 0 $ 0 $ 0 $ 2,513 Incentives 709 475 1,328 1,380 1,739 2016 Conservation Plan C&C of Denver 0 0 0 19 970 Conservation-Open Space 14 19 361 21 869 Retrofits and Water Audits 173 323 211 130 580All Other Conservation 2,749 836 886 1,282 942
Total Operation & Maintenance $ 3,645 $ 1,653 $ 2,786 $ 2,832 $ 7,613
Capital: Grassmere Lake - Lake Lining 49 0 572 18 42 Cherry Hills PS - Landscape & Irrigation 0 0 10 7 200 Capitol Hill Res - Landscape Design 0 0 45 5 100 Feril Lake 0 0 0 3 2,072All Other Conservation 2,762 2,607 1,398 2,078 0 Total Capital $ 2,811 $ 2,607 $ 2,025 $ 2,111 $ 2,414
Total Conservation Expenditures $ 6,456 $ 4,260 $ 4,811 $ 4,943 $ 10,027
Program: Conservation2004 - 2007
(Thousands of Dollars)
Section 3- Expenditures by Program
59
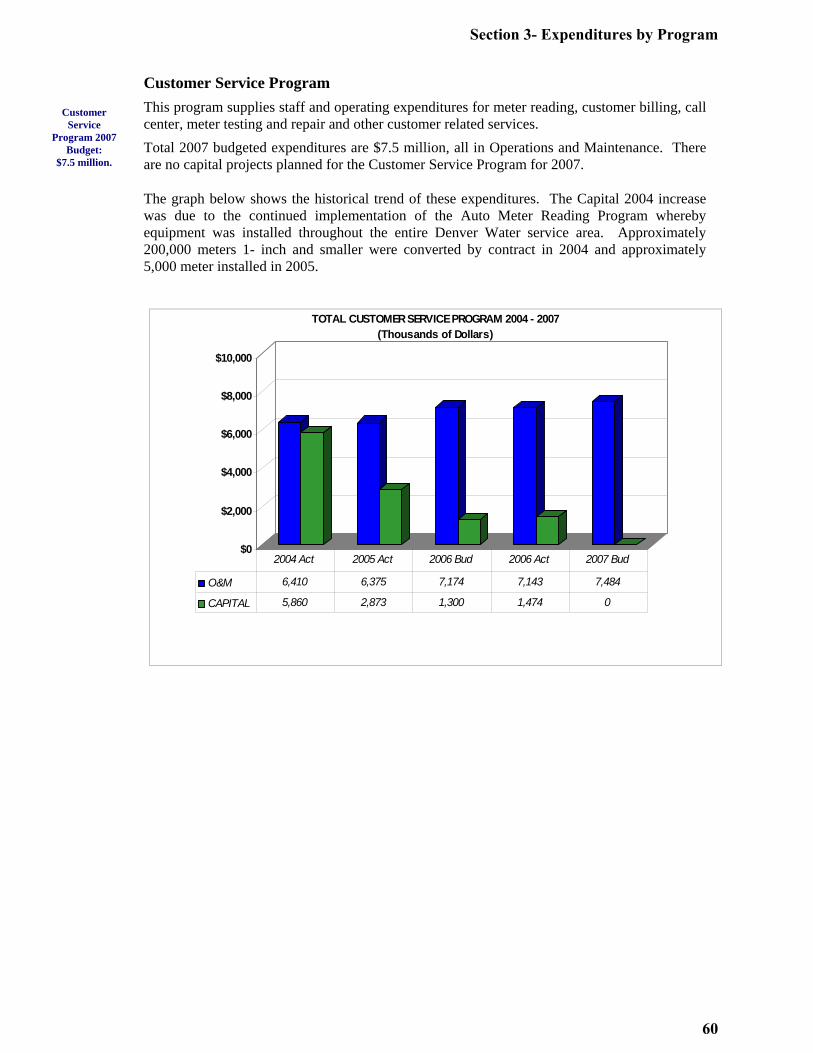
$0
$2,000
$4,000
$6,000
$8,000
$10,000
TOTAL CUSTOMER SERVICE PROGRAM 2004 - 2007(Thousands of Dollars)
O&M 6,410 6,375 7,174 7,143 7,484
CAPITAL 5,860 2,873 1,300 1,474 0
2004 Act 2005 Act 2006 Bud 2006 Act 2007 Bud
Customer Service Program This program supplies staff and operating expenditures for meter reading, customer billing, call center, meter testing and repair and other customer related services. Total 2007 budgeted expenditures are $7.5 million, all in Operations and Maintenance. There are no capital projects planned for the Customer Service Program for 2007.
The graph below shows the historical trend of these expenditures. The Capital 2004 increase was due to the continued implementation of the Auto Meter Reading Program whereby equipment was installed throughout the entire Denver Water service area. Approximately 200,000 meters 1- inch and smaller were converted by contract in 2004 and approximately 5,000 meter installed in 2005.
Customer Service
Program 2007 Budget:
$7.5 million.
Section 3- Expenditures by Program
60
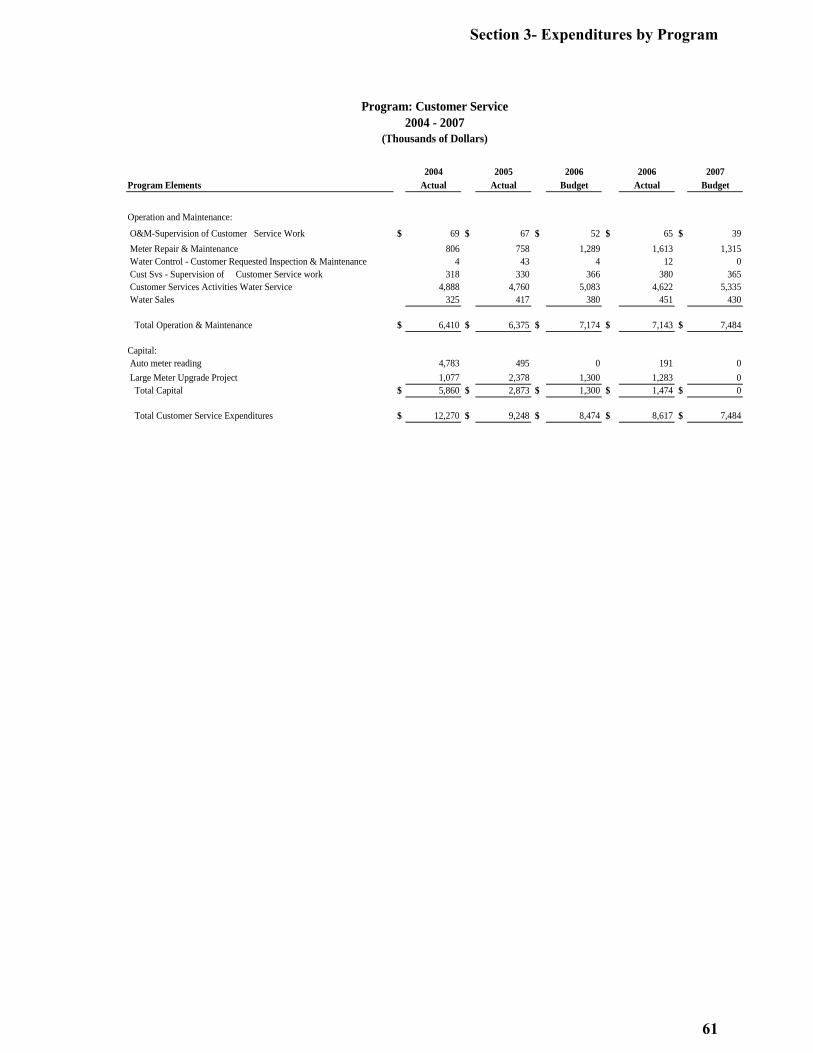
2004 2005 2006 2006 2007Program Elements Actual Actual Budget Actual Budget
Operation and Maintenance:
O&M-Supervision of Customer Service Work $ 69 $ 67 $ 52 $ 65 $ 39 Meter Repair & Maintenance 806 758 1,289 1,613 1,315 Water Control - Customer Requested Inspection & Maintenance 4 43 4 12 0 Cust Svs - Supervision of Customer Service work 318 330 366 380 365 Customer Services Activities Water Service 4,888 4,760 5,083 4,622 5,335 Water Sales 325 417 380 451 430
Total Operation & Maintenance $ 6,410 $ 6,375 $ 7,174 $ 7,143 $ 7,484
Capital: Auto meter reading 4,783 495 0 191 0 Large Meter Upgrade Project 1,077 2,378 1,300 1,283 0 Total Capital $ 5,860 $ 2,873 $ 1,300 $ 1,474 $ 0
Total Customer Service Expenditures $ 12,270 $ 9,248 $ 8,474 $ 8,617 $ 7,484
2004 - 2007(Thousands of Dollars)
Program: Customer Service
Section 3- Expenditures by Program
61

$0
$5,000
$10,000
$15,000
$20,000
TOTAL GENERAL PLANT PROGRAM 2004 - 2007(Thousands of Dollars)
O&M 6,656 6,848 7,117 6,448 7,186
CAPITAL 9,164 9,378 17,171 8,571 18,063
2004 Act 2005 Act 2006 Bud 2006 Act 2007 Bud
General Plant Program This program contains all expenditures related to the operation and maintenance, construction and acquisition of general plant and equipment, including the Administration Building, West Side buildings and grounds, vehicles, heavy equipment, telemetering and computer-related items. Total 2007 expenditures budgeted for General Plant are $25.2 million comprised of $7.2 million for operation and maintenance and $18.0 million for capital.
Major 2007 capital expenditures include $2.6 million for the purchase of motor vehicles and heavy equipment, $2.3 million for security upgrades and other facility modifications and $12.4 million for computer and network equipment and major software acquisitions such as the Customer Information and Workforce Automation. The graph below shows the historical trend of these expenditures.
m: cycled Water 2002
- 2005
General Plant Program 2007
Budget: $25.3 million.
Section 3- Expenditures by Program
62

2004 2005 2006 2006 2007Program Elements Actual Actual Budget Actual Budget
Operation and Maintenance: Modifications to Westside & other locati $ 1,717 $ 1,865 $ 2,044 $ 1,471 $ 1,978 Various Locations 94 91 83 90 110 Security upgrades at various locations 141 121 149 121 162 Process Control 1,024 924 723 684 808 Hazard Waste Mgmt 307 278 427 334 463 General Plant Admin Items 651 665 600 596 605 Vehicles Hvy Equip Radios 2,722 2,904 3,091 3,152 3,060
Total Operation & Maintenance $ 6,656 $ 6,848 $ 7,117 $ 6,448 $ 7,186
Capital: Customer Care $ 830 $ 3,179 $ 6,706 $ 1,568 $ 6,715 Operational Asset Management 723 319 200 318 2,089 Vehicles, &Comm. Motor Vehicles - Replacements & A 1,591 565 599 791 924 Add TWOPS Facility @ Highlands KC Bldg 1 23 1,017 6 1,165 Heavy Equip & Comm Heavy Equipment -Replacements & 943 565 1,006 1,046 1,650All Other General Plant 5,076 4,727 7,643 4,842 5,520
Total Capital $ 9,164 $ 9,378 $ 17,171 $ 8,571 $ 18,063
Total General Plant Expenditures $ 15,820 $ 16,226 $ 24,288 $ 15,019 $ 25,249
(Thousands of Dollars)2004 - 2007
Program: General Plant
Section 3- Expenditures by Program
63

THIS PAGE INTENTIONALLY LEFT BLANK
64

Section 4 - Expenditures by Type of Expenditure Type of Expenditure Summary In this section, total 2007 budgeted expenditures of $290.3 million have been placed into categories that describe what these expenditures purchase. Each category accumulates expenditures for the particular type of purchase regardless of program or whether the expenditure is for operation and maintenance or for capital.
Gross Payroll Total budgeted payroll for 2007 is $67.6 million, an increase of $4.7 million over 2006 actual payroll. Payroll expenses in 2006 were 3.8% below the budgeted level which already assumed a 3.5% vacancy rate. A robust job market and difficulty filling jobs requiring specialized training resulted in an overall position vacancy rate of 7.3% in 2006. The increase in payroll reflects an average overall wage and salary increase of 2.2% that went into effect January 2007, and an anticipated return to a more normal vacancy rate of 3.5%.
The authorized 2007 number of employees of 1,085 is 4.7 more than authorized for 2006. Information Technology, Public Affairs, and Engineering added positions to support our new Customer Information System, implement and manage our accelerated conservation initiatives, and enhance our ability to complete capital projects, respectively.
Employee Benefits Employee benefits for 2007 are budgeted at $30.9 million, a decrease of $252,000 from 2006 expenditures. In 2006, at the Board’s direction, Denver Water retained a benefits consultant to assess the appropriateness of our benefits program. A comparison of Denver Water’s employee and retiree health insurance programs indicated that our plans, while generous, were not in line with similar entities. As a result, the plan design was altered so that a greater share of employee benefits costs are paid by the employees both through premiums and at the point of service (POS). It is anticipated that the plan changes will save Denver Water $2.5 million in 2007.
Distribution of Total Health Care Costs 2004-2007(Thousands of Dollars)
$0
$2,000
$4,000
$6,000
$8,000
$10,000
$12,000
$14,000
$16,000
$18,000
($00
0)
Net Board Cost Empl Payroll Cont POS
POS $1,045 $1,080 $1,148 $3,067Empl Payroll Cont $1,009 $1,297 $1,519 $2,368Net Board Cost $10,483 $11,487 $12,156 $11,603
2004 2005 2006 2007
Net Board Cost 68.1%
Net Board Cost 82.8%
Net Board Cost 82.0%
Net Board Cost 83.6%
2007 budgeted expenditures are $290.3 million.
Budgeted 2007 payroll is $67.6
million.
Authorized number of
employees is 1,085.
Section 4- Expenditures by Type
65

Materials and Supplies Budgeted 2007 materials and supplies are $19.6 million; a increase of $2.2 million from 2006 which primarily a result of higher chemical costs. Chemical costs for the treatment of water have been steadily rising in recent years. The table below shows recent increases in the per unit cost of the major chemicals used for water treartment. In addition to increases in the per unit cost for water treatment chemicals, the 2007 Budget also includes an anticipated increase in demand for treated water due to growth in the number of customers.
Chemical Costs per Ton 2004 2006 Increase % Increase Avg. % Increase Chlorine $347.50 502.40 154.90 44.6% 20.24
Caustic $342.89 582.50 239.61 69.9% 30.33
Alum $143.00 207.25 64.25 44.9% 20.38
Outside Services The Outside Services budget for 2007 is $44.5 million, including utilities and power for pumping, and contract dollars for professional (consultant), and other services such as rental of barricades for job sites. The 2007 budget includes $7.6 million for utilities and pumping power an increase of $85,000 from 2006. The professional services budget of $13.5 million is a $1.6 million increase over 2006. This increase is due to public outreach, advertising and other costs related to our focus on conservation initiatives.
General Equipment Purchases of equipment for 2007 are budgeted at $3.8 million, mainly for purchasing vehicles, heavy equipment and computer equipment. This is a $1.4 million increase over 2006 as we make vehicle purchases that had been delayed in previous years.
Construction Contract Payments This category includes payments for construction work and major material purchases under contract, purchase of water rights and acquisition of right-of-way. These payments are budgeted at $60.1 million for 2007; an increase of $6.1 million over 2006. There are currently several large capital projects under construction and payments for the completion of this work comprises the majority of this increase.
Refunds Refunds consist primarily of system development charge and customer account refunds. The 2007 budget projects refunds of $473,000, which is in line with actual expenditures from 2006.
Debt Service Debt service includes principal and interest payments for general obligation bonds, revenue bonds, certificates of participation and capital leases. Debt service for 2007 is budgeted to be $53.7 million. See section 6 for additional information. In the past, Denver Water relied on General Obligation Bonds. However, in 2002 the City Charter was changed to remove Denver Water’s authority to issue General Obligation Bonds.
Other Other includes such items as legal and insurance claims, taxes collected on meter and materials sales, adjustments and expenditures not included in the above categories. The 2007 budgeted amount for other is $2.0 million; this is a $872,000 decrease from 2006.
Construction contract
payments are budgeted at
$60.1 million.
Debt service is budgeted to be $53.7 million.
Section 4- Expenditures by Type
66

2004 2005 2006 2006 2007Actual Actual Budget Actual Budget
Gross Payroll $ 62,228 $ 62,401 $ 65,509 $ 62,922 $ 67,575
Employee Benefits 28,568 30,652 32,195 31,138 30,886
Materials and Supplies 17,527 18,437 17,951 17,396 19,607
Utilities & Pumping Power 6,540 7,938 6,096 7,511 7,596
Professional and 30,100 28,102 38,176 32,137 44,549Other Services
General Equipment 3,188 2,011 3,245 2,355 3,755
Construction Contract Payments 27,536 29,230 49,257 54,007 60,085
Refunds 760 1,193 523 472 473
Debt Service 38,146 44,486 47,137 46,237 53,689
Other 1,796 867 1,611 2,921 2,049
Total Expenditures $ 216,389 $ 225,317 $ 261,700 $ 257,096 $ 290,264
Comparison of Expenditures by Type of Expenditure2004 - 2007
(Thousands of Dollars)
22000055
Section 4- Expenditures by Type
67

THIS PAGE INTENTIONALLY LEFT BLANK
68

Denver Water Highlights Who We Are & What We Do Established in 1918 Denver Water is Colorado’s oldest and largest water utility. In general we ensure a continuous supply of water to the City and County of Denver and are responsible for the collection, storage, quality control and distribution of drinking water to nearly one fourth of all Coloradoans. The leadership of Denver Water consists of a five-member Board of Water Commissioners which is appointed by the Mayor of Denver to a staggered six-year term. The Board appoints a Manager who is chief executive officer of day-to-day operations; the Manager also serves as Secretary to the Board. Accomplishments During 2006 1. We were able to avoid supply shortages in 2006, despite the absence of drought-related water restrictions,
because peak storage levels in our reservoirs were 6% higher than historical averages and demand was 7% below normal.
2. In addition to our ongoing programs for pipe rehabilitation and other distribution system improvements,
we took several steps in 2006 to ensure we complied with recently issued federal regulations related to disinfection.
3. We began several capital construction projects in 2006 to expand the reach of our Recycled Water
Distribution System. Goals for 2007 1. Implement a new conservation program to accelerate customer water savings. 2. Pursue water supply enhancements for our Moffat Collection System. 3. Continue to strengthen Denver Water’s fiscal health. 4. Implement technology systems to improve customer service. 5. Monitor legislative and regulatory issues affecting water utilities. 6. Collaborate with other agencies to address statewide and metropolitan water supply issues.
12/31/2006 2006 2007 Change inActual T.O. T.O. T.O.s
Manager & Staff 38.8 41.8 38.8 (3.0)Information Technology 58.8 66.0 68.0 2.0Public Affairs 139.8 144.0 156.5 12.5Legal 13.3 13.6 13.6 0.0Finance 57.0 58.0 58.0 0.0Engineering 126.0 132.0 137.0 5.0Planning 42.3 45.1 45.1 0.0Operations & Maintenance 528.8 579.8 568.0 (11.8)
Total Denver Water 1,004.8 1,080.3 1,085.0 4.7
2007 Budget Table of Organization(Comparison with 2006)
Section 5- Organization
69

FINANCIAL
DE
NV
ER
WA
TE
R
O
BJE
CT
IVE
S
Prov
ide
Rel
iabl
e Se
rvic
e
Prov
ide
Hig
h Q
ualit
y W
ater
Prov
ide
Exce
llent
Ser
vice
Exer
cise
Res
pons
ible
Fi
nanc
ial S
tew
ards
hip
Prom
ote
Wat
er E
ffic
ienc
y &
W
ise
Wat
er U
se
Dev
elop
Add
ition
al S
uppl
ies
for t
he F
utur
e
Com
mun
icat
ion
Prom
ote
Acc
ount
abili
ty
Impr
ove
Effic
ienc
ies
GOALS
Implement a new conservation program to accelerate customer water savings. ●
Pursue water supply enhancements for our Moffat Collection System. ● ●
Continue to strengthen Denver Water's fiscal health. ●
Implement technology systems to improve customer service. ● ● ●
Monitor legislative and regulatory issues affecting water utilities. ●
Collaborate with other agencies to address statewide and metropolitan water supply. ● ●
ORGANIZATIONPUBLIC
RESPONSIBILITYCUSTOMER
Section 5- Organization
70

DENVER WATER
Regular & Introductory Employees (At End of Year)
2004 2005 2006 2006 2007Section Actual Actual Budget Actual Budget
Manager & Staff 41.8 41.8 41.8 38.8 38.8Public Affairs 143.6 137.6 144.0 139.8 156.5Engineering 130.0 127.0 132.0 126.0 137.0Finance 54.0 54.0 58.0 57.0 58.0Information Technology* N/A 57.8 66.0 58.8 68.0Planning 41.4 42.4 45.1 42.3 45.1Operations & Maintenance 553.8 539.8 579.8 528.8 568.0Legal 13.5 12.3 13.6 13.3 13.6
Total 978.1 1,012.7 1,080.3 1,004.8 1,085.0 *IT position became a separate division in 2005
Expenditure History (Thousands of Dollars)
2004 2005 2006 2006 2007Actual Actual Budget Actual Budget
Payroll $ 62,228 62,401 65,509 62,922 67,575 Employee Benefits 28,568 30,652 32,195 31,140 30,886 Materials & Supplies / Plant Equip 17,649 18,242 17,967 18,252 19,623 Utility & Pumping 6,540 7,938 6,096 7,511 7,596 Prof & Other Services 30,100 28,090 38,176 32,157 44,550 General Equipment 3,188 2,011 3,245 2,355 3,755 Contract Payments 27,536 29,230 49,257 54,007 60,086 Refunds, Debt & Misc 40,708 46,546 49,271 49,630 56,209
Subtotal 216,517 225,110 261,716 257,974 290,280
Warehouse Purchases & Issues (122) 195 (16) (876) (16) Cash Flow (6) 12 - (2) -
Total $ 216,389 225,317 261,700 257,096 290,264
Board of Water Commissioners
ManagerHamlet J. Barry
Internal AuditorIntergovernmental Affairs Coordinator
Human Resources
LegalPatricia Wells
Operations & MaintenanceBrian Good
PlanningEdward Pokorney
Information TechnologyChris Dermody
FinanceDavid LaFrance
EngineeringRobert Mahoney
Public AffairsMarie Bassett
Rate Payers
Section 5- Organization
71

Manager and Staff Divisions Summary The Manager represents the Board in ongoing relationships with all levels of government, community organizations, and the public served and recommends to the Board a rate structure and other income producing procedures that will assure adequate revenues to meet operating and maintenance costs, finance of ongoing capital improvement programs and the principal and interest payments on long-term debts. Reporting directly to the Manager are the six Division Directors, the General Counsel, the Internal Auditor, and Manager of Human Resources. Accomplishments During 2006 1. Participated in a comprehensive evaluation of Denver Water’s employee’s benefits programs. 2. Completion of changes in the HRIS for every employee in his or her medical benefit selections. 3. Human Resources worked with the Manger and O&M to prepare the organization for possible avian flu
epidemic and other disasters that may occur. Goals for 2007 1. Oversee the development, implementation and monitoring of Water Conservation programs, with special
emphasis on the Mayor’s Greenprint Denver. 2. Remain alert to the timing of creative rate design alternatives that further our goals of wise water use and
conservation. 3. Complete assessment of staffing levels including reviewing current staffing patterns and altering as
necessary to ensure optimal organizational structure.
FINANCIAL
DE
NV
ER
WA
TE
R
OB
JEC
TIV
ES
Prov
ide
Rel
iabl
e Se
rvic
e
Prov
ide
Hig
h Q
ualit
y W
ater
Prov
ide
Exce
llent
Ser
vice
Exer
cise
Res
pons
ible
Fi
nanc
ial S
tew
ards
hip
Prom
ote
Wat
er E
ffic
ienc
y &
W
ise
Wat
er U
se
Dev
elop
Add
ition
al S
uppl
ies
for t
he F
utur
e
Com
mun
icat
ion
Prom
ote
Acc
ount
abili
ty
Impr
ove
Effic
ienc
ies
DIVISION GOALS
Oversee the development, implementation and monitoring of Water Conservation programs, with special emphasis on the Mayor's Greenprint Denver.
●
Remain alert to the timing of creative rate design alternatives that further our goals of wise water use and conservation.
● ● ●
Complete assessment of staffing levels including reviewing current staffing patterns and altering as necessary to ensure optimal organizational structure.
● ● ●
ORGANIZATIONRESPONSIBILITY
CUSTOMER PUBLIC
12/31/2006 2006 2007 Change inActual T.O. T.O. T.O.s
Manager & Staff 14.0 14.0 14.0 - Human Resources 24.8 27.8 24.8 (3.0)
Total Manager & Staff Division 38.8 41.8 38.8 (3.0)
2007 Budget Table of Organization(Comparison with 2006)
Section 5- Organization
72
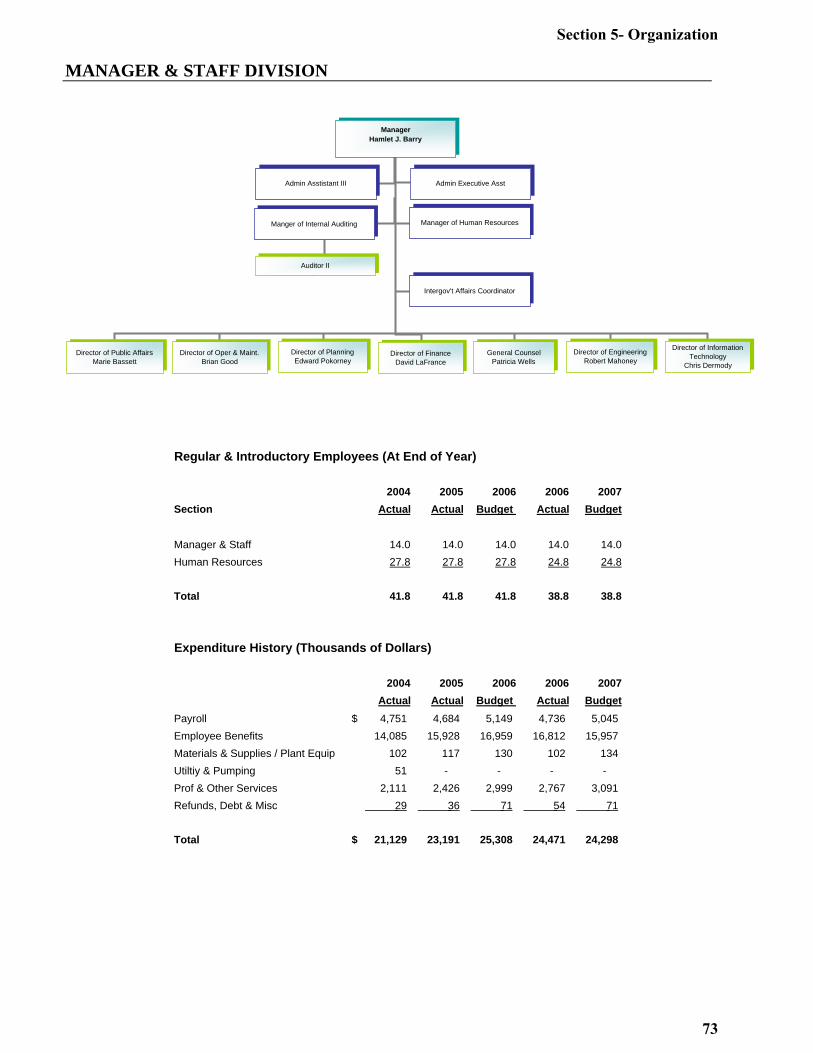
MANAGER & STAFF DIVISION
Regular & Introductory Employees (At End of Year)
2004 2005 2006 2006 2007Section Actual Actual Budget Actual Budget
Manager & Staff 14.0 14.0 14.0 14.0 14.0Human Resources 27.8 27.8 27.8 24.8 24.8
Total 41.8 41.8 41.8 38.8 38.8
Expenditure History (Thousands of Dollars)
2004 2005 2006 2006 2007Actual Actual Budget Actual Budget
Payroll $ 4,751 4,684 5,149 4,736 5,045 Employee Benefits 14,085 15,928 16,959 16,812 15,957 Materials & Supplies / Plant Equip 102 117 130 102 134 Utiltiy & Pumping 51 - - - - Prof & Other Services 2,111 2,426 2,999 2,767 3,091 Refunds, Debt & Misc 29 36 71 54 71
Total $ 21,129 23,191 25,308 24,471 24,298
ManagerHamlet J. Barry
Admin Asstistant III Admin Executive Asst
Manager of Human Resources
Intergov't Affairs Coordinator
Manger of Internal Auditing
Auditor II
Director of Information Technology
Chris Dermody
Director of EngineeringRobert Mahoney
General CounselPatricia Wells
Director of FinanceDavid LaFrance
Director of PlanningEdward Pokorney
Director of Oper & Maint.Brian Good
Director of Public AffairsMarie Bassett
Section 5- Organization
73

Public Affairs Highlights Division Summary Under the direction of the Manager, the Public Affairs Division facilitates relationships with issues, persons and entities outside of Denver Water. In that capacity, the division responds to customer concerns and manages customer relations, maintains cooperative relationships with Denver City administration and governmental agencies whose sphere of operation affects Denver Water, coordinates the administration of distributor contracts, and facilitates Denver Water’s relations with its various publics. The major sections of the Public Affairs Division include Community Relations, Water Conservation, Customer Care, Customer Service Field, and Sales Administration. Accomplishments During 2006 1. Completed AMR project for all customers. Redesigned routes to evenly mange workflow and prepared
for monthly billing. 2. Secured Board approval for a three-year Communications Plan that will provide detailed and continuous
outreach to customers, employees, the West Slope and decision-makers. 3. Completed a large portion of data scrubbing for the new CIS. Goals for 2007 1. Provide positive customer contact. 2. Provide excellent and reliable service for our customers. 3. Communicate wise water use to our customers.
FINANCIAL
DE
NV
ER
WA
TE
R
OB
JEC
TIV
ES
Prov
ide
Rel
iabl
e Se
rvic
e
Prov
ide
Hig
h Q
ualit
y W
ater
Prov
ide
Exce
llent
Ser
vice
Exer
cise
Res
pons
ible
Fi
nanc
ial S
tew
ards
hip
Prom
ote
Wat
er E
ffic
ienc
y &
W
ise
Wat
er U
se
Dev
elop
Add
ition
al S
uppl
ies
for t
he F
utur
e
Com
mun
icat
ion
Prom
ote
Acc
ount
abili
ty
Impr
ove
Effic
ienc
ies
DIVISION GOALS
Provide positive customer contact. ●
Provide excellent and reliable service for our customers. ● ●
Communicate wise water use to our customers. ● ●
ORGANIZATIONRESPONSIBILITY
CUSTOMER PUBLIC
1 2 /3 1 /2 0 0 6 2 0 0 6 2 0 0 7 C h a n g e inA ctu a l T .O . T .O . T .O .s
D irec to r o f P ub lic A ffa irs 6 .0 7 .0 8 .0 1 .0 C o m m un ity R e la tio ns 4 .2 4 .4 5 .4 1 .0 C o n se rva tio n 1 0 .0 1 1 .0 1 6 .5 5 .5 C en tra l S e rv ice s 3 .0 3 .0 3 .0 - C usto m er C are 3 7 .0 4 0 .0 4 0 .0 - C usto m er S e rv ices - F ie ld 6 3 .0 6 2 .0 6 5 .0 3 .0 M e te r In sp ec tio n S ho p 5 .0 5 .0 7 .0 2 .0 S a le s A d m in is tra tio n 1 1 .6 1 1 .6 1 1 .6 -
T o ta l P u b lic A ffa irs D iv is io n 1 3 9 .8 1 4 4 .0 1 5 6 .5 1 2 .5
2 0 0 7 B u d g et T a b le o f O rg a n iza tio n(C o m p a r iso n w ith 2 0 0 6 )
Section 5- Organization
74

PUBLIC AFFAIRS DIVISION
Regular & Introductory Employees (At End of Year)
2004 2005 2006 2006 2007Section Actual Actual Budget Actual Budget
Director of Public Affairs 7.0 7.0 7.0 6.0 8.0Community Relations 4.0 4.2 4.4 4.2 5.4Conservation 12.0 9.8 11.0 10.0 16.5Customer Care 107.0 105.0 110.0 108.0 115.0Sales Aministration 13.6 11.6 11.6 11.6 11.6
Total 143.6 137.6 144.0 139.8 156.5
Expenditure History (Thousands of Dollars)
2004 2005 2006 2006 2007Actual Actual Budget Actual Budget
Payroll $ 6,960 6,822 7,082 6,812 7,437 Materials & Supplies / Plant Equip 4,327 2,694 2,227 2,353 1,748 Prof & Other Services 4,552 2,612 4,658 3,296 6,513 General Equipment - 33 190 17 - Contract Payments - - - - - Refunds 547 544 420 405 370 Other 1,165 398 1,210 1,901 1,353
Total $ 17,551 13,103 15,787 14,784 17,421
Director of Public Affairs Marie Bassett
Local Gov't Water Conservation Coordinator
Donna Pacetti
Sales AdministratorG. Malmberg Jr
Office ManagerPatti Miller
Executive Assistant Mgr. of Media RelationsTrina McGuire-Collier
Mgr. of Water ConservationElizabeth V Gardener
Field Mgr.Robert P Blauvelt
Mgr of Community Relations
Trina McGuire-Collier
Section 5- Organization
75

Legal Highlights Division Summary The Legal Division represents and gives legal advice to the Board of Water Commissioners, the Manager and the various Divisions of Denver Water and handles all of its litigation. The types of litigation include water rights cases and diligence proceedings before State and Federal Agencies, contract, civil rights and negligence cases, property suits and condemnations, and actions to recover Board charges and damages for injury to Board property and rights. In addition, the Legal Division represents Board interests in administrative hearings and appeals within Denver Water relating to personnel problems and customer complaints, reviews and advises upon matters of pending litigation, and prepares and reviews contract documents of all kinds. Accomplishments During 2006 1. Provided legal analysis of FERC regulations that enabled Denver Water to obtain an exemption for the
Williams Fork hydropower project, rather than facing the expense and risk of future re-licensing. 2. Completed negotiations with Xcel Energy on contracts that retained the benefits of a net-metering concept
for energy supply and achieved and agreement to relax the Shoshone call during drought. 3. Interpreted and implemented new immigration legislation, which unexpectedly required modifications to
numerous Denver Water documents and procedures. Goals for 2007 1. Continue to provide legal advice and assistance regarding real estate, water rights, operation needs,
claims, lawsuits, employee disputes, personnel policies, benefits, contracts, negotiations, environmental permitting, legislation, and regulatory proceedings.
2. Resolve through negotiation or litigation the various claims and lawsuits brought against Denver Water.
3. Participate in revision of general conditions for construction contracts and revise other standard contracts as necessary.
12/31/2006 2006 2007 Change inActual T.O. T.O. T.O.s
Legal Division 13.3 13.6 13.6 -
Total Legal Division 13.3 13.6 13.6 -
2007 Budget Table of Organization(Comparison with 2006)
FINANCIAL
DENVER W
ATER
OBJE
CTIV
ES
Prov
ide Rel
iabl
e Se
rvice
Prov
ide H
igh
Qua
lity
Wat
er
Prov
ide Ex
celle
nt S
ervi
ce
Exer
cise
Res
pons
ible
Fina
ncia
l Ste
war
dshi
p
Prom
ote W
ater
Effic
ienc
y &
Wise W
ater
Use
Dev
elop
Add
ition
al S
uppl
ies
for t
he F
utur
e
Com
mun
icat
ion
Prom
ote A
ccou
ntab
ility
Impr
ove Ef
ficie
ncie
s
DIVISION GOALS
Continue to provide legal analysis of FERC regulations that enabled Denver Water to obtain an exemption for the Williams Fork hydropower project, rather than facing the expense and risk of future re-licensing.
●
Resolve through negotiation or litigation the various claims and lawsuits brought against Denver Water.
●
Participate in revision of general conditions for construction contracts and revise other standard contracts as necessary.
●
ORGANIZATIONRESPONSIBILITY
CUSTOMER PUBLIC
Section 5- Organization
76

LEGAL DIVISION
Regular & Introductory Employees (At End of Year)
2004 2005 2006 2006 2007Section Actual Actual Budget Actual Budget
Legal 13.5 12.3 13.6 13.3 13.6
Total 13.5 12.3 13.6 13.3 13.6
Expenditure History (Thousands of Dollars)
2004 2005 2006 2006 2007Actual Actual Budget Actual Budget
Payroll $ 1,001 987 1,024 1,038 1,081 Materials & Supplies / Plant Equip 9 2 17 2 2 Prof & Other Services 262 271 691 553 460 Other 594 397 550 927 603
Total $ 1,866 1,657 2,282 2,520 2,146
General CounselPatricia Wells
Office Management Assistant IIKris Bates
Attorney VMichael Walker
Section 5- Organization
77

Finance Highlights Division Summary The Finance Division is responsible for the planning, management and budgeting of Denver Water’s financial resources, including acting as the disbursing authority for the Manager and custodian of the Department’s documents and records. Major functional areas include accounting, treasury, long range financial planning, annual budgeting, water rate administration, purchasing and records and documentation management. Accomplishments During 2006 1. Successfully developed a more aggressive conservation rate structure for single family residential
customers. 2. Continued to investigate and implement procedures and business processes to improve the flow of data
through out the department. Not only including data entry but end user reporting for various systems.
3. Implemented paying supplier invoices with a p-card for materials and services which were purchased throughout the Purchase Order System.
Goals for 2007 1. Provide leadership in the development of budgets and long-range plans that represent responsible
stewardship of our financial assets and transparency and accountability to our rate payers. 2. Facilitate updates of debt and cash balance policies to improve the way we manage Denver Water’s debt. 3. Compilation of the Annual Report for the Water Department in a timely manner.
12/31/2006 2006 2007 Change inActual T.O. T.O. T.O.s
Director of Finance 10.0 10.0 10.0 - Treasury Operations 7.0 6.0 7.0 1.0 Budget 4.0 4.0 4.0 - Purchasing 9.0 9.0 9.0 - Accounting 17.0 19.0 18.0 (1.0) Rate Administration 2.0 2.0 2.0 - Records & Documentation Admin 8.0 8.0 8.0 -
Total Finance Division 57.0 58.0 58.0 -
2007 Budget Table of Organization(Comparison with 2006)
FINANCIAL
DE
NV
ER
WA
TE
R
OB
JEC
TIV
ES
Prov
ide
Rel
iabl
e Se
rvic
e
Prov
ide
Hig
h Q
ualit
y W
ater
Prov
ide
Exce
llent
Ser
vice
Exer
cise
Res
pons
ible
Fi
nanc
ial S
tew
ards
hip
Prom
ote
Wat
er E
ffic
ienc
y &
W
ise
Wat
er U
se
Dev
elop
Add
ition
al S
uppl
ies
for t
he F
utur
e
Com
mun
icat
ion
Prom
ote
Acc
ount
abili
ty
Impr
ove
Effic
ienc
ies
DIVISION GOALS
Provide leadership in the development of budgets and long-range plans that represent responsible stewardship of our financial assets and transparency and accountability to our rate payers.
● ●
Facilitate updates of debt and cash balance policies to improve the way we manage Denver Water's debt.
●
Compilation of the Annual Report for the Water Department in a timely manner. ● ●
ORGANIZATIONRESPONSIBILITY
CUSTOMER PUBLIC
Section 5- Organization
78
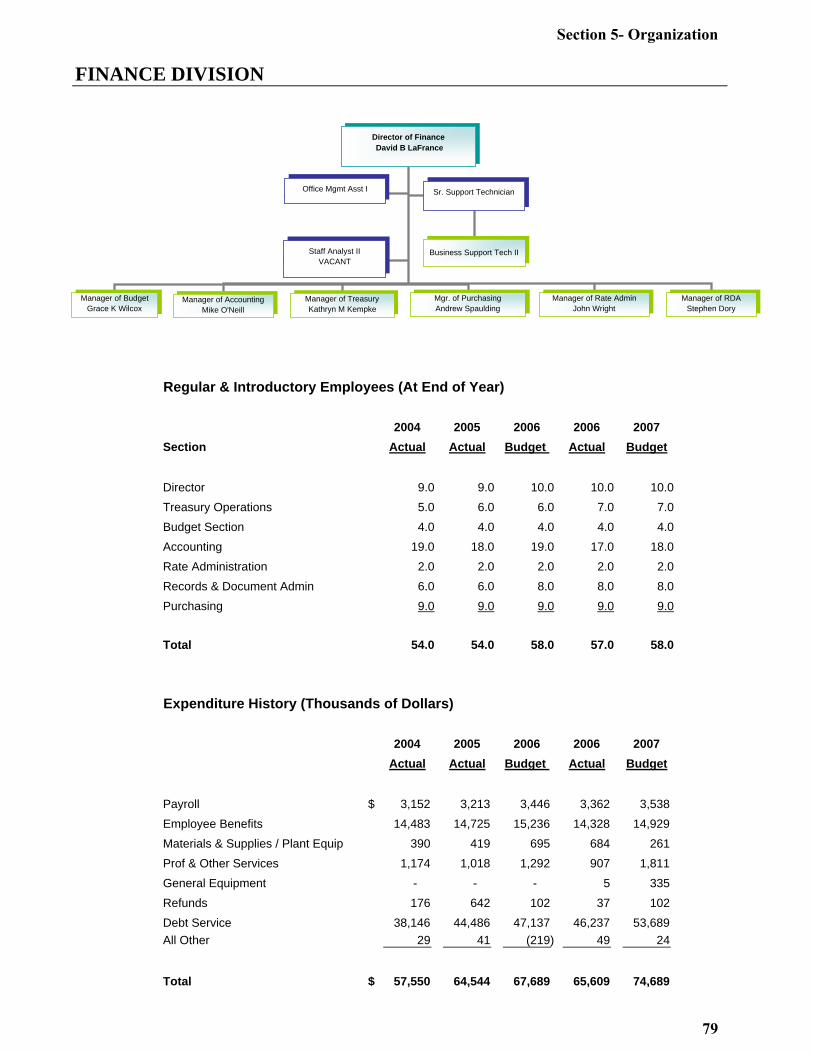
FINANCE DIVISION
Regular & Introductory Employees (At End of Year)
2004 2005 2006 2006 2007Section Actual Actual Budget Actual Budget
Director 9.0 9.0 10.0 10.0 10.0Treasury Operations 5.0 6.0 6.0 7.0 7.0Budget Section 4.0 4.0 4.0 4.0 4.0Accounting 19.0 18.0 19.0 17.0 18.0Rate Administration 2.0 2.0 2.0 2.0 2.0Records & Document Admin 6.0 6.0 8.0 8.0 8.0Purchasing 9.0 9.0 9.0 9.0 9.0
Total 54.0 54.0 58.0 57.0 58.0
Expenditure History (Thousands of Dollars)
2004 2005 2006 2006 2007Actual Actual Budget Actual Budget
Payroll $ 3,152 3,213 3,446 3,362 3,538 Employee Benefits 14,483 14,725 15,236 14,328 14,929 Materials & Supplies / Plant Equip 390 419 695 684 261 Prof & Other Services 1,174 1,018 1,292 907 1,811 General Equipment - - - 5 335 Refunds 176 642 102 37 102 Debt Service 38,146 44,486 47,137 46,237 53,689 All Other 29 41 (219) 49 24
Total $ 57,550 64,544 67,689 65,609 74,689
Director of Finance David B LaFrance
Manager of Budget Grace K Wilcox
Manager of Accounting Mike O'Neill
Manager of TreasuryKathryn M Kempke
Office Mgmt Asst I Sr. Support Technician
Staff Analyst IIVACANT
Mgr. of PurchasingAndrew Spaulding
Manager of Rate AdminJohn Wright
Manager of RDA Stephen Dory
Business Support Tech II
Section 5- Organization
79

Information Technology Highlights Division Summary The Information Technology Division partners with all other divisions within Denver Water to develop, implement and support IT based business solutions and tools aimed at improving customer service, operations and organizational efficiencies. This involves identifying and implementing appropriate technologies to meet the business needs of Denver Water, providing appropriate resources to support the use of the technologies that are implemented, providing availability of these technologies on a 24/7 basis and providing appropriate network and data security measures. Accomplishments During 2006 1. Developed & implemented monthly meter reading and consumption reporting for a subset of residential
customers.
2. Developed and implemented automated email notifications to delinquent customers.
3. Developed and implemented a new Annual Budget & Ten Year Planning system.
Goals for 2007 1. Implement a secured web portal for customers and business partners to interact with Denver Water over
the Internet.
2. Develop a strategy for implementing improved enterprise content management capabilities.
3. Implement short-term disaster recovery capabilities.
FINANCIAL
DE
NV
ER
WA
TE
R
OB
JEC
TIV
ES
Prov
ide
Rel
iabl
e Se
rvic
e
Prov
ide
Hig
h Q
ualit
y W
ater
Prov
ide
Exce
llent
Ser
vice
Exer
cise
Res
pons
ible
Fi
nanc
ial S
tew
ards
hip
Prom
ote
Wat
er E
ffic
ienc
y &
W
ise
Wat
er U
se
Dev
elop
Add
ition
al S
uppl
ies
for t
he F
utur
e
Com
mun
icat
ion
Prom
ote
Acc
ount
abili
ty
Impr
ove
Effic
ienc
ies
DIVISION GOALS
Implement a secured web portal for customers and business partners to interact with Denver Water over the Internet.
● ●
Develop a strategy for implementing improved enterprise content management capabilities.
●
Implement short-term disaster recovery capabilities. ●
ORGANIZATIONRESPONSIBILITY
CUSTOMER PUBLIC
12/31/2006 2006 2007 Change inActual T.O. T.O. T.O.s
Information Technology Division 58.8 66.0 68.0 2.0
Total Information Technology Division 58.8 66.0 68.0 2.0
2007 Budget Table of Organization(Comparison with 2006)
Section 5- Organization
80

INFORMATION TECHNOLOGY DIVISION
Regular & Introductory Employees (At End of Year)
2004 2005 2006 2006 2007Section Actual Actual Budget Actual Budget
Information Technology 59.8 57.8 66.0 58.8 68.0
Total 59.8 57.8 66.0 58.8 68.0
Expenditure History (Thousands of Dollars)
2004 2005 2006 2006 2007Actual Actual Budget Actual Budget
Payroll $ 4,936 5,152 5,645 5,179 5,702 Materials & Supplies / Plant Equip 814 977 709 789 1,818 Utility & Pumping 1,246 1,146 1,205 1,375 1,205 Prof & Other Services 5,190 6,497 11,424 5,134 12,719 General Equipment 476 441 1,064 628 457
Total $ 12,662 14,213 20,047 13,105 21,901
Director of Information TechnologyChris Dermody
IT Security Analyst Carlon Latson
Tier III SupportIT Manager New Business Sol. Dev.
Bob Riggs
Infrastructure SupportIT Manager of Enterprise Infra
Gayle Heazlett
Tier II SupportIT Manager of Appl Dev
Jerri Griffin
Tier I SupportIT Manager of Support Services
John Nelson
Section 5- Organization
81

Engineering Highlights Division Summary The Engineering Division is responsible for the engineering, construction, and property related support activities for Denver Water’s infrastructure, in addition to oversight of geospacial information and technology. Specific engineering disciplines include: Engineering, Drafting, Survey, Real Estate, Easements, Property License Agreements, Contract Administration, Plan Review, Inspection, Material Testing, Corrosion, Geologic Evaluation, Recreation, and Dam Safety. Accomplishments During 2006 1. Design was completed on many potable conduit projects including Conduit Numbers 129, 154, 158, and
159. These same conduit projects should be under construction by the end of 2006.
2. The Dam Safety Program completed the renovation of the Eleven Mile Outlet Works, preliminary design of Williams Fork Outlet Works, and finished the (FERC) required Part 12 Dam Safety Inspections at Strontia Springs and Dillon Dams.
3. The Property Section managed to secure a large gravel pit land purchase insuring possible future storage as we continued construction on our existing gravel pits.
Goals for 2007 1. Effectively manage budgeted design project workload while balancing requests for emergency and
unanticipated projects.
2. Develop a focused approach to completing as-built drawings and posting (GIS) information.
3. Develop ultimate visions for Denver Water’s Vault, Recycle, Gravel Pit, and Treatment Plant Programs.
12/31/2006 2006 2007 Change inActual T.O. T.O. T.O.s
Administration 8.0 9.0 9.0 - Programs & Projects 36.0 37.0 39.0 2.0 Survey 26.0 26.0 26.0 - Distribution 37.0 39.0 41.0 2.0 Construction Management 19.0 21.0 22.0 1.0
Total Engineering Division 126.0 132.0 137.0 5.0
2007 Budget Table of Organization(Comparison with 2006)
FINANCIAL
DE
NV
ER
WA
TE
R
OB
JEC
TIV
ES
Prov
ide
Rel
iabl
e Se
rvic
e
Prov
ide
Hig
h Q
ualit
y W
ater
Prov
ide
Exce
llent
Ser
vice
Exer
cise
Res
pons
ible
Fi
nanc
ial S
tew
ards
hip
Prom
ote
Wat
er E
ffic
ienc
y &
W
ise
Wat
er U
se
Dev
elop
Add
ition
al S
uppl
ies
for t
he F
utur
e
Com
mun
icat
ion
Prom
ote
Acc
ount
abili
ty
Impr
ove
Effic
ienc
ies
DIVISION GOALS
Effectively manage budgeted design project workload while balancing requests for emergency and unanticipated projects.
● ● ● ●
Develop a focused approach to completing as-built drawings and posting (GIS) information. ● ●
Develop ultimate visions for Denver Water's Vault, Recycle, Gravel Pit, and Treatment Plant Programs.
●
ORGANIZATIONRESPONSIBILITY
CUSTOMER PUBLIC
Section 5- Organization
82

ENGINEERING DIVISION
Regular & Introductory Employees (At End of Year)
2004 2005 2006 2006 2007Section Actual Actual Budget Actual Budget
Director of Engineering 9.0 9.0 9.0 8.0 9.0Programs & Projects 37.0 35.0 37.0 36.0 39.0Survey 24.0 25.0 26.0 26.0 26.0Asset Recording N/A N/A N/A N/A 6.0Distribution 38.0 38.0 39.0 37.0 41.0Construction Management 22.0 20.0 21.0 19.0 22.0
Total 130.0 127.0 132.0 126.0 143.0
Expenditure History (Thousands of Dollars)
2004 2005 2006 2006 2007Actual Actual Budget Actual Budget
Payroll $ 8,255 8,406 8,720 8,542 9,222 Materials & Supplies / Plant Equip 437 744 590 661 3,062 Utility & Pumping 141 54 24 90 24 Prof & Other Services 4,091 2,881 3,868 5,395 4,835 General Equipment 6 - 85 132 210 Contract Payments 27,517 29,211 49,225 54,005 60,069 Refunds 22 3 - 28 - Other (1) - - (3) -
Total $ 40,468 41,299 62,512 68,850 77,422
Director of EngineeringRobert Mahoney
Chief of Dist & Property Mgmt
Henry Teigen
Construction MgmtMichael Leister
Mngr of SurveyDaniel Thompson
Staff Analyst IIDebra Valdez
Chief of EngineeringJohn Bambei
Section 5- Organization
83

Planning Highlights Division Summary The Planning Division is responsible for identifying and integrating the future water and facility needs and resources of Denver Water and determining and protecting options to meet those needs and resources. The division administers and coordinates outside consulting services and pertinent activities with local, state, and federal agencies. In implementing this change, the major sections of the Planning Division are General Planning and Water Resources. Accomplishments During 2006 1. Continued efforts to resolve the reliability and vulnerability concerns on the north-end of Denver Water’s
system through the combined efforts of Denver Water and the U.S. Army Corps of Engineers on the Moffat Collection System Project Environmental Impact Statement (EIS).
2. Preserved Denver Water’s ability to use its water resources by successfully addressing water rights issues,
endangered species studies, and other environmental concerns. 3. Coordinated pertinent activities with local, state, and federal agencies, including the Federal Regulatory
Energy Commission (FERC), the Environmental Protection Agency, Denver Water distributors, west slope interests, and various other outside entities.
Goals for 2007 1. Complete the draft EIS for the Moffat Collection System Project.
2. Acquire an exemption for the Williams Fork Dam Hydroelectric Project from FERC.
3. Complete the 2007 update of Denver Water’s Integrated Resource Plan (IRP).
12/31/2006 2006 2007 Change inActual T.O. T.O. T.O.s
Director of Planning 2.0 2.0 2.0 - Environmental Planning 5.6 5.6 5.6 - Raw Water Supply 6.0 6.0 6.0 - Water Rights 7.0 8.5 8.5 - Water Resource Analysis 10.7 11.0 11.0 - General Planning 4.0 5.0 5.0 - Hydraulics 7.0 7.0 7.0 -
Total Planning Division 42.3 45.1 45.1 -
(Comparison with 2006)2007 Budget Table of Organization
FINANCIAL
DE
NV
ER
WA
TE
R
OB
JEC
TIV
ES
Prov
ide
Rel
iabl
e Se
rvic
e
Prov
ide
Hig
h Q
ualit
y W
ater
Prov
ide
Exce
llent
Ser
vice
Exer
cise
Res
pons
ible
Fi
nanc
ial S
tew
ards
hip
Prom
ote
Wat
er E
ffic
ienc
y &
W
ise
Wat
er U
se
Dev
elop
Add
ition
al S
uppl
ies
for t
he F
utur
e
Com
mun
icat
ion
Prom
ote
Acc
ount
abili
ty
Impr
ove
Effic
ienc
ies
DIVISION GOALS
Complete the draft EIS for the Moffat Collection Project. ● ●
Acquire an exemption for the Williams Fork Dam Hydroelectric Project from FERC. ●
Complete the 2007 update of Denver Water's Integrated Resource Plan (IRP). ● ●
ORGANIZATIONRESPONSIBILITY
PUBLIC CUSTOMER
Section 5- Organization
84

PLANNING DIVISION
Regular & Introductory Employees (At End of Year)
2004 2005 2006 2006 2007
Section Actual Actual Budget Actual Budget
Director of Planning 2.0 2.0 2.0 2.0 2.0Environmental Planning 5.6 5.6 5.6 5.6 5.6Raw Water Supply 6.0 6.0 6.0 6.0 6.0Water Rights 7.0 7.0 8.5 7.0 8.5Raw Water Planning 10.8 10.8 11.0 10.7 11.0General Planning 3.0 4.0 5.0 4.0 5.0Hydraulics 7.0 7.0 7.0 7.0 7.0
Total 41.4 42.4 45.1 42.3 45.1
Expenditure History (Thousands of Dollars)
2004 2005 2006 2006 2007Actual Actual Budget Actual Budget
Payroll $ 3,111 3,108 3,322 3,317 3,585 Materials & Supplies / Plant Equip 72 33 54 29 54 Utility & Pumping 130 70 57 80 213 Prof & Other Services 2,286 2,619 4,060 3,294 3,708 Contract Payments 18 17 24 - 16 General Equipment - 5 - - -
Total $ 5,617 5,852 7,517 6,720 7,576
Director of Planning Edward Pokorney
Mgr. of Water Resources of General Planning
David Little
Admin Assistant IIAdmin Assistant IV
Water Resource Eng VMarc Waage
Chief of Water Resource Analysis
Steven Schmitzer
Enviornmental Planning
Water Resource Eng VWilliam Bates
Chief PlannerGreg Fisher
Hydraulics EngMary Hoddinott
Section 5- Organization
85

Operations and Maintenance Highlights Division Summary The Operations and Maintenance Division is responsible for the collection, treatment, and distribution of potable and recycled water. The Division operates and maintains nine major dams and reservoirs, six hydro power generating facilities, multiple raw water tunnels and canals, four treatment plants, 34 finished water reservoirs with 18 pump stations, and nearly 2,700 miles of water mains throughout Denver and its Total Service area. Water Quality, Environmental Compliance, Safety, Fleet, Warehousing, and Maintenance are also performed within the Operations and Maintenance Division. Accomplishments During 2006 1. Submitted an Initial Distribution System Evaluation (IDSE) Plan to the US Environmental Protection
Agency (EPA) in accordance with EPA’s new Stage 2 Disinfectants and Disinfection Byproducts Rule. This required extensive work with Denver Water Distributors and the Colorado Department of Public Health and Environment to petition EPA to allow one comprehensive evaluation of the entire service area (as opposed to 72 evaluations, as originally required).
2. Met or exceeded all water quality goals, and continued critical maintenance activities including hydrant
flushing and inspection, main rehabilitation and replacement, canal repair and replacement, dam safety improvements, and leak detection (though a little short of our quantity target).
3. Continued emergency planning activities including alternative water delivery, pandemic preparedness,
review of the 2003 Vulnerability Assessment, and collaboration with outside emergency and security agencies.
Goals for 2007 1. Develop a new asset management program, in conjunction with other Denver Water Divisions, which will
allow for methodical evaluation and assessment of major assets and better integration of asset replacement into the new budgeting process.
2. Evaluate existing training programs and standard operating procedures. Revise as needed to update for
current materials and construction methods, ensure employee training on skills needed to safely complete their jobs, and provide adequate preparation for employees preparing to take certification exams.
3. Continue implementation of physical and cyber security hardware and procedures.
12/31/2006 2006 2007 Change inActual T.O. T.O. T.O.s
Plant Office 3.0 4.0 3.0 (1.0) Water Quality & Compliance 31.8 32.8 33.0 0.2 Safety & Loss Control 13.0 15.0 15.0 - Source of Supply 56.0 63.0 62.0 (1.0) Water Treatment 86.0 95.0 94.0 (1.0) Transmission & Distribution 154.0 167.0 167.0 - Water Control 55.0 61.0 61.0 - Instrumentation & Ctrl Sys. 6.0 8.0 8.0 - Maintenance & Warehouse 124.0 134.0 125.0 (9.0)
Total Operations & Maintenance Division 528.8 579.8 568.0 (11.8)
2007 Budget Table of Organization(Comparison with 2006)
Section 5- Organization
86

FINANCIAL
DEN
VER
WA
TER
O
BJE
CTI
VES
Pro
vide
Rel
iabl
e S
ervi
ce
Pro
vide
Hig
h Q
ualit
y W
ater
Pro
vide
Exc
elle
nt S
ervi
ce
Exe
rcis
e R
espo
nsib
le
Fina
ncia
l Ste
war
dshi
p
Pro
mot
e W
ater
Effi
cien
cy
&
Wis
e W
ater
U
se
Dev
elop
Add
ition
al
Sup
plie
s
for t
he F
utur
e
Com
mun
icat
ion
Pro
mot
e A
ccou
ntab
ility
Impr
ove
Effic
ienc
ies
DIVISION GOALS
Develop a new asset management program, in conjunction with other Denver Water Divisions, which will allow for methodical evaluation and assessment of major assets and better integration of asset replacement into the new budgeting process.
● ● ●
Evaluate existing training programs and standard operating procedures. Revise as needed to update for current materials and construction methods, ensure employee training on skills needed to safely complete their jobs, and provide adequate preparation for employees preparing to take certification exams.
●
Continue implementation of physical and cyber security hardware procedures. ●
ORGANIZATIONRESPONSIBILITY
CUSTOMER PUBLIC
Section 5- Organization
87

OPERATIONS & MAINTENANCE DIVISION
Regular & Introductory Employees (At End of Year)
2004 2005 2006 2006 2007Section Actual Actual Budget Actual Budget
Plant Office 4.0 4.0 4.0 3.0 3.0Water Quality & Compliance 31.8 31.8 32.8 31.8 33.0Safety & Loss Control 15.0 14.0 15.0 13.0 15.0Source of Supply 56.0 59.0 63.0 56.0 62.0Water Treatment 83.0 88.0 95.0 86.0 94.0Water Control 57.0 57.0 61.0 55.0 61.0Transmission & Distribution 157.0 156.0 167.0 154.0 167.0Instrumentation & Control 19.0 7.0 8.0 6.0 8.0Maintenance and Warehouse 131.0 123.0 134.0 124.0 125.0
Total 553.8 539.8 579.8 528.8 568.0
Expenditure History (Thousands of Dollars)
2004 2005 2006 2006 2007Actual Actual Budget Actual Budget
Payroll $ 30,063 30,030 31,121 29,938 31,964 Materials & Supplies / Plant Equip 11,499 13,256 13,539 13,629 12,544 Utility & Pumping 4,972 6,669 4,810 5,966 6,154 Prof & Other Services 10,434 9,765 9,190 10,804 11,413 General Equipment 2,706 1,532 1,906 1,576 2,752 Contract Payments 1 2 8 2 - Refunds 1 3 - - - Other (2) (6) - - -
Total $ 59,674 61,251 60,574 61,915 64,827
Director of Operations & MaintenanceBrian Good
Staff Analyst IIII
Admin Asst.III
Mngr of Safety & Security Craig Austin
Supt of Water Treatment Kenneth Pollock
Supt of Water ControlMichael Ranger
Supt of Transmission & DistributionEdwin Hernandez
Supt of Source of SupplyKevin Keefe
Mgr of Water QualityStephen Lohman
Supt of Instrumentation & Control SystemsAmy Beth
Supt of MaintenanceEmmitt Weeams
Section 5- Organization
88

THIS PAGE INTENTIONALLY LEFT BLANK
90
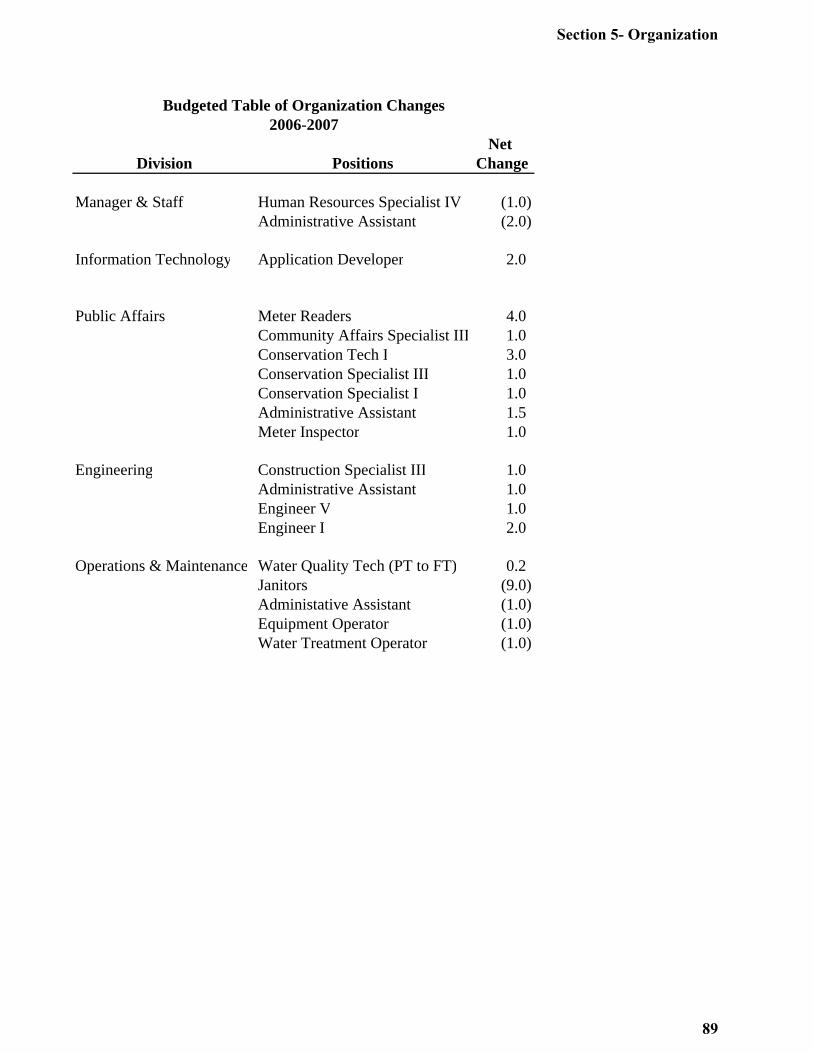
Net Division Positions Change
Manager & Staff Human Resources Specialist IV (1.0)Administrative Assistant (2.0)
Information Technology Application Developer 2.0
Public Affairs Meter Readers 4.0Community Affairs Specialist III 1.0Conservation Tech I 3.0Conservation Specialist III 1.0Conservation Specialist I 1.0Administrative Assistant 1.5Meter Inspector 1.0
Engineering Construction Specialist III 1.0Administrative Assistant 1.0Engineer V 1.0Engineer I 2.0
Operations & Maintenance Water Quality Tech (PT to FT) 0.2Janitors (9.0)Administative Assistant (1.0)Equipment Operator (1.0)Water Treatment Operator (1.0)
Budgeted Table of Organization Changes2006-2007
Section 5- Organization
89

Section 6 – Debt Service and Obligations under Capital Leases Debt Policy
During March 2007 the Board closed the senior revenue bond lien and adopted a master resolution for bonds to be sold in and after 2007. It also plans to complete a review of the debt guidelines that was begun in 2006. As a part of the review, the Board is examining its prior practice of issuing only fixed rate obligations, and is evaluating its capital structure.
Current debt guidelines include the Board’s long-standing policy of using debt financing for system expansion and improvements and prohibiting its use for payment of operating and maintenance expenses. This underlying philosophy is not expected to change. Reliance on revenue bonds as a financing mechanism is not expected to change, but alternatives such as capital leases will continue to be examined for specific projects when appropriate.
From time to time, the Board has entered into capital leases to finance capital improvements. For example, certain improvements at the Marston and Moffat Treatment plants were financed with capital leases, as was capacity in the Wolford Mountain Reservoir. The treatment plant leases were securitized using a certificate of participation structure.
Outstanding Bonds and Obligations under Capital Leases The table below summarizes information about the outstanding amounts as of December 31, 2006. A schedule of outstanding bonds and obligations under capital leases appears in this section.
Type of Par Value Coupon Weighted Weighted Obligation Outstanding Range Average Average (in millions) Coupon YTM(a) Bonds General Obligation Bonds $ 86.3 2.75 - 6.00% 4.821% 4.323% Revenue Bonds 182.8 2.50 - 5.50% 4.656% 3.734% Sub-total bonds $269.1 4.709% 3.923% Capital Leases Marston & Moffat $ 44.8(b) 4.00 – 5.50% 4.715% 4.362% Wolford Mountain 26.3(b) 6.75%(c) 6.750%(c) 6.750%(c) Sub-total leases $ 71.1 5.468% 5.246% Total outstanding bonds and capital lease obligations $ 340.2 4.867% 4.199% (a)Yield to Matruity at time of sale (b)Present value of future obligation for financial reporting purposes (c)Contractual rate
Section 6- Debt Services
91

Payment Schedule
The Board's debt guidelines provide that the year-end balance in the water works fund should exceed the amount needed to service its outstanding debt and meet all obligations under capital leases during the following year by at least $5 million. The Board has been in compliance with this guideline each year since it was first adopted in 1995. Both the resolution under which the revenue bonds outstanding at year end were issued and the 2007 Master Resolution, require debt service coverage of 1.1 times. The Board has never failed to meet that rate maintenance test. The total principal and interest payment obligations for the years 2007-2011 on bonds outstanding at year end are as follows:
2007 $48.59 million
2008 45.40 million
2009 45.15 million
2010 44.56 million
2011 34.81 million
With the current payment schedule, 44% of the principal amount of outstanding bonds and capital lease obligations will be retired by the end of 2011; approximately 74% will be retired by the end of 2016 and 88% will be retired by the end of 2021. All marketable securities mature or may be called prior to December 31, 2015. The final stated maturity of all outstanding bonds and capital lease obligations occurs on October 1, 2029.
Section 6- Debt Services
92

Par amount of outstanding bonds Coupon Rate Par amount of
outstanding bonds Coupon Rate
General Oblligation Bonds Revenue BondsSeries 1997 - Callable on 10/1/07 @ 100.0
10/1/07 1,550,000.00 5.500% Series 2003A - Callable on 6/1/13 @ 100.010/1/08 275,000.00 4.800% 12/1/07 100,000.00 4.000%10/1/09 325,000.00 4.900% 12/1/08 100,000.00 4.000%10/1/10 405,000.00 5.050% 12/1/09 100,000.00 2.500%10/1/11 460,000.00 5.100% 12/1/10 100,000.00 2.750%10/1/12 475,000.00 5.150% 12/1/11 200,000.00 3.000%
12/1/12 1,000,000.00 5.000%Series 1999 - Callable on 10/1/13 @ 100.0 12/1/13 1,145,000.00 5.000%
10/1/10 1,820,000.00 6.000% 12/1/14 1,540,000.00 3.500%10/1/11 660,000.00 5.500% 12/1/15 1,550,000.00 3.500%10/1/13 500,000.00 5.500% 12/1/16 2,110,000.00 4.000%10/1/29 11,550,000.00 5.600% 12/1/17 3,570,000.00 4.750%
12/1/18 3,885,000.00 4.750%Series 2000 - Callable on 10/1/11 @ 100.0 12/1/19 4,110,000.00 4.750%
10/1/11 2,290,000.00 5.500% 12/1/20 6,160,000.00 4.750%10/1/12 225,000.00 4.800% 12/1/21 7,355,000.00 4.750%10/1/13 230,000.00 4.875% 12/1/22 7,720,000.00 4.750%10/1/14 245,000.00 5.000% 12/1/23 8,955,000.00 4.250%10/1/15 255,000.00 5.000%
Series 2003B - Callable on 6/1/13 @ 100.0Series 2001A - Callable on 9/1/11 @ 100.0 12/1/07 100,000.00 2.500%
9/1/07 670,000.00 4.000% 12/1/08 100,000.00 5.000%9/1/08 700,000.00 4.000% 12/1/09 7,830,000.00 5.000%9/1/09 730,000.00 4.000% 12/1/10 10,725,000.00 5.000%9/1/10 760,000.00 4.125% 12/1/11 400,000.00 3.750%9/1/11 795,000.00 4.200% 12/1/12 5,150,000.00 4.000%9/1/12 830,000.00 4.300% 12/1/13 8,025,000.00 4.000%9/1/13 700,000.00 4.400% 12/1/14 8,400,000.00 5.000%9/1/14 900,000.00 4.500% 12/1/15 8,825,000.00 5.000%9/1/15 980,000.00 4.600% 12/1/16 11,860,000.00 5.000%9/1/16 900,000.00 4.700%
Series 2004 - Callable on 12/01/2014 @100.0Series 2001B - Not subject to optional redemption prior to maturity 12/1/07 1,540,000.00 3.000%
9/1/07 20,145,000.00 5.000% 12/1/08 3,015,000.00 5.000%9/1/08 17,655,000.00 5.000% 12/1/09 3,320,000.00 5.000%9/1/09 10,340,000.00 4.000% 12/1/10 9,285,000.00 5.500%
BONDS
Section 6- Debt Services
93

Par amount of outstanding bonds Coupon Rate Par amount of
outstanding bonds Coupon Rate
General Oblligation Bonds Revenue Bonds12/1/11 4,215,000.00 5.500%
Series 2002 - Callable on 10/1/12 @ 100.0 12/1/12 5,045,000.00 5.000%10/1/07 450,000.00 2.750% 12/1/13 2,755,000.00 5.000%10/1/08 465,000.00 3.000% 12/1/14 2,900,000.00 5.000%10/1/09 485,000.00 3.125% 12/1/15 3,050,000.00 5.000%10/1/10 500,000.00 3.250% 12/1/16 705,000.00 4.250%10/1/11 520,000.00 3.500% 12/1/17 735,000.00 4.500%10/1/12 540,000.00 3.500% 12/1/18 770,000.00 4.500%10/1/13 565,000.00 3.500% 12/1/19 805,000.00 4.500%10/1/14 590,000.00 3.700% 12/1/20 840,000.00 4.500%10/1/15 615,000.00 3.875% 12/1/21 875,000.00 4.125%10/1/16 640,000.00 4.000% 12/1/22 915,000.00 4.125%10/1/17 670,000.00 4.000% 12/1/23 950,000.00 4.250%10/1/18 525,000.00 4.100% 12/1/24 990,000.00 4.300%10/1/19 515,000.00 4.200%10/1/20 190,000.00 4.300% Series 2005 - Callable on 12/01/[email protected]/1/21 810,000.00 4.400% 12/1/07 1,020,000.00 3.250%10/1/22 850,000.00 4.500% 12/1/08 1,055,000.00 3.250%
12/1/09 1,095,000.00 3.250%GO Bonds 86,300,000.00 12/1/10 1,130,000.00 3.250%
12/1/11 1,170,000.00 3.500%12/1/12 1,215,000.00 3.500%12/1/13 1,260,000.00 3.625%12/1/14 1,325,000.00 3.750%12/1/15 1,390,000.00 4.000%12/1/16 1,460,000.00 5.000%12/1/17 1,530,000.00 5.250%12/1/18 1,610,000.00 4.000%12/1/19 1,690,000.00 4.250%12/1/20 1,775,000.00 4.250%12/1/21 1,860,000.00 4.000%12/1/22 1,955,000.00 5.000%12/1/23 2,055,000.00 5.000%12/1/24 2,155,000.00 4.250%12/1/25 2,265,000.00 4.250%
Revenue Bonds 182,840,000.00
Par amount outstanding of
outstanding certificates
Coupon Rate Annual principal portion of lease payment Discount rate
Marston & Moffat Treatment Plant Leases Wolford Mountain Lease 1998 Lease - certificates non callable
11/15/07 2,450,000.00 4.200%11/15/08 4,230,000.00 4.250% 2007 1,245,001.10 6.750%11/15/09 4,430,000.00 4.300% 2008 1,330,456.61 6.750%11/15/10 4,605,000.00 4.400% 2009 1,421,778.11 6.750%11/15/11 750,000.00 5.000% 2010 1,519,367.63 6.750%
2011 1,623,655.60 6.750%2012 1,735,101.80 6.750%
2001 Lease - certificates callable on 11/15/11at par 2013 1,854,197.56 6.750%11/15/07 2,785,000.00 5.000% 2014 1,981,467.94 6.750%11/15/08 1,480,000.00 4.000% 2015 2,117,474.04 6.750%11/15/09 1,540,000.00 4.000% 2016 2,262,815.48 6.750%11/15/10 1,600,000.00 4.125% 2017 2,418,133.02 6.750%11/15/11 11,255,000.00 5.500% 2018 2,584,111.40 6.750%11/15/12 1,760,000.00 4.375% 2019 2,761,482.39 6.750%11/15/13 1,835,000.00 4.500% 2020 1,451,025.90 6.750%11/15/14 1,920,000.00 4.500%11/15/15 2,005,000.00 5.000% Wolford 26,306,068.58 11/15/16 2,105,000.00 5.000%
Certificates 44,750,000.00
Lease not subject to prepayment
BONDS
CAPITAL LEASES
Section 6- Debt Services
94

2007 2008 2009 2010 2011 2012-2016 2017-2021 2022-2026 2027-2029 TotalPrincipalBonds
General Obligation 22,815 19,095 11,880 3,485 4,725 9,190 2,710 850 11,550 86,300 Revenue 2,760 4,270 12,345 21,240 5,985 70,710 37,570 27,960 - 182,840
Sub-total bonds 25,575 23,365 24,225 24,725 10,710 79,900 40,280 28,810 11,550 269,140 Capital Leases
Treatment Plants 5,235 5,710 5,970 6,205 12,005 9,625 - - - 44,750 Wolford Mountain 1,245 1,330 1,422 1,519 1,624 9,951 9,215 - - 26,306
Sub-total leases 6,480 7,040 7,392 7,724 13,629 19,576 9,215 - - 71,056
Total Principal 32,055 30,405 31,617 32,449 24,339 99,476 49,495 28,810 11,550 340,196 as Percentage of total 9.4% 8.9% 9.3% 9.5% 7.2% 29.2% 14.5% 8.5% 3.4% 100.0%Cumulative % 9.4% 18.4% 27.7% 37.2% 44.3% 73.6% 88.1% 96.6% 100.0%
InterestBonds
General Obligation 4,160 3,028 2,091 1,617 1,439 5,152 3,774 3,272 1,938 26,471 Revenue 8,513 8,427 8,233 7,637 6,551 25,355 11,964 2,336 - 79,016
Sub-total bonds 12,673 11,455 10,324 9,254 7,990 30,507 15,738 5,608 1,938 105,487 Capital Leases
Treatment Plants 2,110 1,868 1,629 1,376 1,108 1,428 - - - 9,519 Wolford Mountain 1,755 1,670 1,578 1,481 1,376 5,049 1,285 - - 14,194
Sub-total leases 3,865 3,538 3,207 2,857 2,484 6,477 1,285 - - 23,713
Total Interest 16,538 14,993 13,531 12,111 10,474 36,984 17,023 5,608 1,938 129,200
Total Scheduled PaymentsBonds
General Obligation 26,975 22,123 13,971 5,102 6,164 14,342 6,484 4,122 13,488 112,771 Revenue 11,273 12,697 20,578 28,877 12,536 96,065 49,534 30,296 - 261,856
Sub-total bonds 38,248 34,820 34,549 33,979 18,700 110,407 56,018 34,418 13,488 374,627 Capital Leases
Treatment Plants 7,345 7,578 7,599 7,581 13,113 11,053 - - - 54,269 Wolford Mountain 3,000 3,000 3,000 3,000 3,000 15,000 10,500 - - 40,500
Sub-total leases 10,345 10,578 10,599 10,581 16,113 26,053 10,500 - - 94,769
Total Payments 48,593 45,398 45,148 44,560 34,813 136,460 66,518 34,418 13,488 469,396
Schedule of Payments Due on Outstanding Bonds and Obligations Under Capital Leases(Thousands of Dollars)
Total Payments due on Bonds and Leasesas of December 31, 2006
General Obligation
Bonds24%
Wolford Reservoir Lease
9%Treatment Plant
Leases12%
Revenue Bonds55%
Section 6- Debt Services
95

THIS PAGE INTENTIONALLY LEFT BLANK
96

Section 7 - Investment Balance
Investment Balance Summary Denver Water began 2007 with an actual Investment Balance of $ 149.2. The 2007 budget projects this balance to increase by receipts of $292.5 million and decrease by expenditures of $290.3 million, resulting in a total 2007 Ending Balance of $151.4 million. Historically Denver Water has allocated the Investment Balance as shown in the chart below. However, the optimal capital structure and reserve allocation is currently under review and will likely be altered in 2007. Currently the investment balance is allocated as follows: 1. Three months of the next year’s operation and maintenance. 2. 50% of the next year’s non-expansion capital (normal replacements and improvements). 3. One year of debt service. 4. Self-Insurance at 5% of the next year’s operating receipts. 5. Temporary drought and tap surcharges to encourage water conservation during drought conditions.
This allocation does not occur in years when drought and tap surcharges are not assessed. 6. The remainder to Future Capital.
bbbbbb
2004 Actual
2005 Actual
2006 Budget
2006 Actual
2007 Budget
Operations & Maintenance (3 Months)* $ 29,669 $ 32,190 $ 33,272 $ 34,202 $ 34,617
Non-expansion Capital (50% of normal replacements and improvements)* 16,976 2,899 18,236 19,025 20,525
Debt Service (1 year)* 44,428 47,398 62,020 53,689 48,534
Self Insurance (5% of Operating Receipts)* 8,475 8,217 9,120 9,491 10,074
Drought & Fire Related 13,620 68 0 0 0
Future Capital:Supply 14,330 25,879 7,224 12,879 12,566Water Treatment 3,450 4,060 188 425 3,046Transmission & Distribution 8,757 20,805 1,970 849 3,428Other 15,921 17,760 18,192 18,638 18,638
Total Investment Balance $ 155,626 $ 159,276 $ 150,222 $ 149,198 $ 151,428
Investment Balance2004-2007
(Thousands of dollars)
Section 7- Investment Balances
97

Section 7- Investment Balances
98

Section 8 - Glossary of Terms Acronyms ACP GAD Accelerated Conservation Program Gallons Per Account Per Day AAFF GGIISS AAccrree FFoooott GGeeooggrraapphhiicc IInnffoorrmmaattiioonn SSyysstteemm AMWA G.O. Bonds Association of Metropolitan Water Agencies General Obligation Bonds AWWA IRP American Water Works Association Integrated Resource Planning CAFR MGD Comprehensive Annual Financial Report Millions of Gallons Per Day CBSM NRCS Community Based Social Marketing Natural Resources Conservation Services CCOOPP NNWWRRSS Certificate of Participation National Water Resource Association CIP RCRA Capital Improvement Plan Resource Conservaton and Recovery Act CIS PACSM Customer Information System Platte and Colorado Simulation Model CWA POS Clean Water Act Point of Service DIA WUWC Denver International Airport Western Urban Water Coalition DW Denver Water EIS Environmental Impact Statement EPA Environmental Protection Agency ERT Encoder Receiver Transmitter FERC Federal Regulatory Energy Commission GAAP Generally Accepted Accounting Principles
Section 8- Glossary
99

Definitions Annual Yield Maximum basic demand the water supply could meet throughout a period of historical or synthesized hydrological conditions.
Bonds Debt instruments. According to the Charter, the Board may issue revenue bonds which are secured solely by it’s revenue. In the past it was able to issue general obligation bonds that were secured by the full faith and credit of the City of Denver.
Budget A financial plan for a specified period of time (fiscal year) that assigns resources to each activity in suffi-cient amounts so as to reasonably expect accomplishment of the objectives in the most cost effective manner.
Capital Expenditure Expenditures having a depreciable life of over one year and a cost of over $5,000. Capital Work Plan A category of Master Plan items that are considered to be of a capital nature. Includes projects having a depreciation life of over one year and tends to benefit future periods, or has the effect of increasing the capacity, efficiency span of life or economy of an existing fixed asset. Example: the construction of a new conduit.
Capital Leases A lease having essentially the same economic consequences as if the lessee had secured a loan and purchased the leased asset.
Cash Flow Adjustment
The cash flow adjustment is the difference between expenditures as booked and disbursed. Expenditures are budgeted and reported on a modified accrual basis (as booked). Total expenditures are then converted to a cash basis (disbursed) for purposes of determining year-end designated balances.
Certificate of Participation Evidence of assignment of proportionate interests in rights to receive certain revenues pursuant to a lease purchase agreement.
Chart of Accounts Listing of account numbers and their descriptions.
Contract Payments Consists of contract payments for construction, materials purchased for contractor installation, acquisi-tion of land and land rights and water rights.
Corporate Culture Values that set a pattern for a company's activities, opinions and actions.
Section 8- Glossary
100

Cost Control Center A term used to denote a responsibility center. It is an organizational unit that has been placed in charge of accomplishing certain specified tasks. Example: Water Control Section.
Customer Information System A computer system that tracks and bills customer’s water consumption
Customer Taps A physical connection to a distribution main that, together with appropriate license affects water service to a licensed premise.
Debt Guidelines A statement from the Board with respect to appropriate uses of external financing.
Debt Service Principal and interest on debt and payments under capital leases.
Demand Side Management Term used to describe policies aimed at increasing long-term supply by decreasing customer demand for water, typically through conservation programs.
Direct Materials Includes materials and supplies purchased for direct use and fuel and oil for vehicles and equipment (non-stores issues only).
Disbursements Money paid out for expenses, liabilities or assets.
Discretionary Employee The charter of the City and County of Denver allows the Board to establish a classification of employees who have "executive discretion”, who shall number no more than 2% of all persons employed, and shall serve solely at the pleasure of the Board.
Diversity Training Objective of providing skills for managing and working with people of all races, genders and cultures.
Division Largest organizational unit reporting to the Manager.
Employee Benefits Employee Benefits are expenditures paid by Denver Water for Worker's Compensation, Social Security, Retirement, Employee Assistance Program, Health and other insurances. It does not include employee withholdings or unemployment insurance.
Endangered Species Act The federal law that sets forth how the United States will protect and recover animal and plant species whose populations are in dangerous decline or close to extinction. The law protects not only threatened and endangered species but also the habitat upon which species depend.
Section 8- Glossary
101

Enterprise Fund A type of propriety fund or a governmental unit that carries on activities in a manner similar to a private business.
EPA Section 319 Environmental Protection Agency Program to provide funds to agencies to assist in clean water protec-tion.
Encoder Receiver Transmitter (ERT) An electronic device that receives a signal from a water meter, encodes the current reading into a digital signal, and transmits it to a meter reader
Federal Statutes Statutes enacted by Congress relating to matters within authority delegated to federal government by the U.S. Constitution.
Fund An accounting entity with a set of self-balancing accounts that is used to account for financial transac-tions for specific activities or government functions. By Charter, Denver Water is reflected in the City’s financial statement in a single fund-The Water Works Fund.
General Equipment Computer equipment, office furniture and equipment, transportation equipment, storehouse equipment, construction and maintenance tools and equipment, chemical laboratory equipment, power operated equipment, communication equipment, garage and shops equipment and miscellaneous equipment.
General Obligation Bonds (GO Bonds) A security representing the promise to repay borrowed money secured by the full faith and credit of the governmental borrower.
Goals Overall end toward which effort is directed.
Governmental Accounting Standards Board (GASB) A board which establishes the generally accepted accounting principles for state and local governmental units.
Gross Revenue All income and revenues, from whatever source, including system development charges and participa-tion payments, excluding only money borrowed and used for providing capital improvements or other receipts legally restricted to capital expenditures.
Historical Timing Adjustment Estimate of budget variances primarily due to changes in capital construction schedules and the timing of obtaining permits and acquiring rights-of-way.
Hydropower Hydroelectric power of/or relating to production of electricity by water power.
Section 8- Glossary
102

Infill Undeveloped areas within the combined service area that Denver Water would be expected to serve in the future.
Integrated Resource Planning (IRP) A method for looking ahead using environmental, engineering, social, financial and economic consider-ations; includes using the same criteria to evaluate both supply and demand options while involving customers and other stakeholders in the process.
Interest Requirements As used in the debt guidelines, scheduled interest payments during the 12 month period following the date of calculation. Introductory Employee An employee who is newly appointed to a position and is serving an introductory period, generally of six month's duration.
Investment Balance The total sum held in cash and investments net of uncleared warrants.
Lease Payments Periodic payments made in order to obtain use of a facility or piece of equipment.
Long-Term Debt Debt with a maturity of more than one year from date reported.
Master Plan Expenditures identified by projects and activities that are necessary to accomplish the Department's overall operating goals and objectives. The Master Plan, or Program Budget, is divided into a Capital Work Plan and an O&M Work Plan.
Master Plan Item A specific activity or project that is identified in the Master Plan.
Modified Accrual Basis Accounting method in which basis in which receipts are budgeted and recorded when received and expenditures are recorded when incurred, regardless of when payment is made.
Municipal Water Utilities
Public entities whose responsibility is to deliver water to the customers.
Net Revenues Gross Revenue less Operating and Maintenance Expenses.
Non-Operating Revenue As used in this document, revenue received from payments for services such as main inspections, installation of taps, calculating and mailing of sewer bills and other such services.
Section 8- Glossary
103

Non-Potable Water not suitable for drinking. (See also Potable)
Objectives Something toward which effort is directed - an aim, goal or end of action.
Operating Reserves and Restricted Funds The amount of cash and invested funds available at any point in time. The balance is the Water Works Fund as defined in this glossary.
Operating Revenue Revenue obtained from the sale of water.
Operation and Maintenance (O&M) Work Plan A category of Master Plan items not capital in nature, that are normally ongoing activities and pertain to the general operations of Denver Water.
Other Expenditures for items such as payroll deductions, sales tax, insurance claims, cash over and short, and budget adjustments.
Other Services Expenditures for items such as training, employee expenses, rents and leases, ditch assessments, convention and conference expenses, subscriptions, maintenance and repair agreements and memberships.
Participation Agreement An agreement in which a distributor or developer pays for the cost of the distribution facilities such as conduits, treated water reservoirs or pump stations required to provide service within that district from the nearest existing available source.
Potable Water that does not contain pollution, contamination, objectionable minerals or infective agents and is considered safe for domestic consumption; drinkable. (See also Nonpotable)
Principal and Interest Requirements As used in the debt guidelines, interest requirements plus the current portion of long-term debt. (Includes general obligation bonds, certificates of participation, and capital leases.)
Professional Services Consists of consultant payments for consultants to provide services such as facility design, legal work and auditors.
Program An organized group of activities and the resources to carry them out, aimed at achieving related goals.
Program Budget A method of budgeting in which the focus is on the project and activities that are required to accomplish Denver Water's mission, goals and objectives. It provides for consideration of alternative means to accomplish these criteria. It also provides a control device for higher level management and cuts across organizational lines. Resources are allocated along program lines and across organizational
Section 8- Glossary
104

lines.
Program Element Series of smaller categories of activities contained in the program such as raw water, water treatment, etc.
Project Employee A contract worker assigned to a project of more than one year's duration and receiving a limited benefits package.
Refunds Includes System Development Charge Refunds and Customer Refunds.
Regular Employee An employee who has satisfactorily completed an introductory period and has been approved by the Board to receive the rights and privileges of a tenured employee.
Regular Pay Includes all straight-time salaries and wages earned, leaves, tuition refunds, suggestion awards, swing and graveyard shift payrolls, and safety equipment allowances. Regular pay consists of all payroll items except for overtime pay.
Safe Drinking Water Act (SDWA) Federal legislation passed in 1974 that regulates the treatment of water for human consumption and requires testing for and elimination of contaminants that might be present in the water.
Stores Issues Includes materials and supplies issued from inventory and fuel and oil for vehicles and equipment .
Strategic Plan Process that is a practical method used by organizations identifying goals and resources that are important to the long-term well being of its future.
System Development Charges A one-time connection charge that provides a means for financing a portion of the source of supply, raw water transmission facilities, treatment plants and backbone treated water transmission facilities required to provide service to a new customer. Sometimes called a tap fee.
Temporary Employee An employee hired as an interim replacement or temporary supplement of the work force. Assignments in this category can be of limited duration or indefinite duration, but generally do not exceed one year.
Type of Expenditure A classification of resources or commodities that will be budgeted and charged to projects and activities by Cost Control Centers.
Utilities & Pumping Consists of gas, electric and telephone, electricity wheeling charges, replacement power purchased and power purchased for pumping.
Section 8- Glossary
105

Warehouse Purchases
Adjustments related to the timing of purchases and issues of warehouse stock. Denver Water maintains a warehousing operation that purchases materials and supplies into stock. These items are then issued and charged to jobs as needed. The warehouse purchases and issues adjusment is required to insure that the total of materials as issued balances to the amount of purchases made for the warehouse stock.
Water Conservation Obtaining the benefits of water more efficiently, resulting in reduced demand for water. Sometimes called “end-use efficiency” or “demand management.”
Water Revenues Revenues generated through billing process from the sale of water.
Water Works Fund A fund into which are placed all revenues received for the operation of the water works system and plant together with all monies coming into said fund from other sources. The City Charter creates, the Water Works Fund, in which all activities of Denver Water are reported in the City’s financial statements. All receipts and expenditures of Denver Water flow through the Water Works Fund. The balance of the Water Works Fund is referred to in this budget document as the Designated Balances, Capital and Land Sales Account.
Section 8- Glossary
106

Budget Staff, Divisional Budget Coordinators and Others Budget Staff:
Grace Wilcox
Antoinette Chavez Tim Lowe
Tatum Kaul Isa Rueda
Divisional Budget Coordinators:
Edith Carlson Manager and Staff Alice Montez Human Resources Susan Zimmerman Public Affairs/Finance Kris Bates Legal Marilyn Hampton Information Technology Gregg Moore Engineering Tom Clark Planning Charlene Gregg Operations and Maintenance
Budget Information Services Support:
Jim Roper – TM1 (non value Issues) James Hite - Business Intelligence
107