denver public schools · denver public schools | strategic regional analysis | fall 2019 13 in...
TRANSCRIPT

DRAFT
Executive Summary
Recent changes in the city of Denver have influenced the landscape of Denver Public
Schools (DPS). The population boom has led to a more affluent population and greater
housing demand, resulting in rapidly rising housing costs throughout the city. The
population has also gotten younger, as young adults, who are less likely to have children,
have flocked to the city. Additionally, lower birth rates have impacted city demographics,
following the trend of the United States overall.
For DPS, the implications are numerous. This year’s Strategic Regional Analysis (SRA)
explores these implications at the district and regional levels through the lenses of
enrollment, capacity, performance, and equity. It also uses current and historical trends to
forecast where these dynamics may take DPS over the next 5 years. The data throughout
the report this year tells a story of a district on the cusp of change, and the details are vital
for strategic planning. Of these stories, the following are the most prevalent:
• Continued elementary enrollment declines in the Southwest, Northwest,
and Central regions of the city will put increased pressure on schools, and
may impact the ability of schools to provide programs, specials, and support
services.
• Continued enrollment growth in the Near Northeast and Far Northeast
regions will necessitate strategies for managing capacity.
• Students of color and FRL students attend high-performing schools at a
lower rate than White and non-FRL students.
Our communities, schools, and district leaders have the ability to determine how these
stories will unfold over the coming years. The details in this report can help inform policies
that will ensure the stories develop in a way that is beneficial for every student.

DRAFT
Geographic Organization
The SRA provides a district-wide overview followed by an in-depth analysis of the 6
planning regions shown on the map below. These regions correspond with the Regional
Networks created in 2019.
Denver Public Schools | Strategic Regional Analysis | Fall 2019 2
Denver Public Schools Planning Regions and Regional Networks
Far Northeast = FNE
Near Northeast = NNE
Central = CEN
Northwest = NW
Southwest = SW
Southeast = SE
DRAFT
Geographic Organization
Denver Public Schools | Strategic Regional Analysis | Fall 2019 3
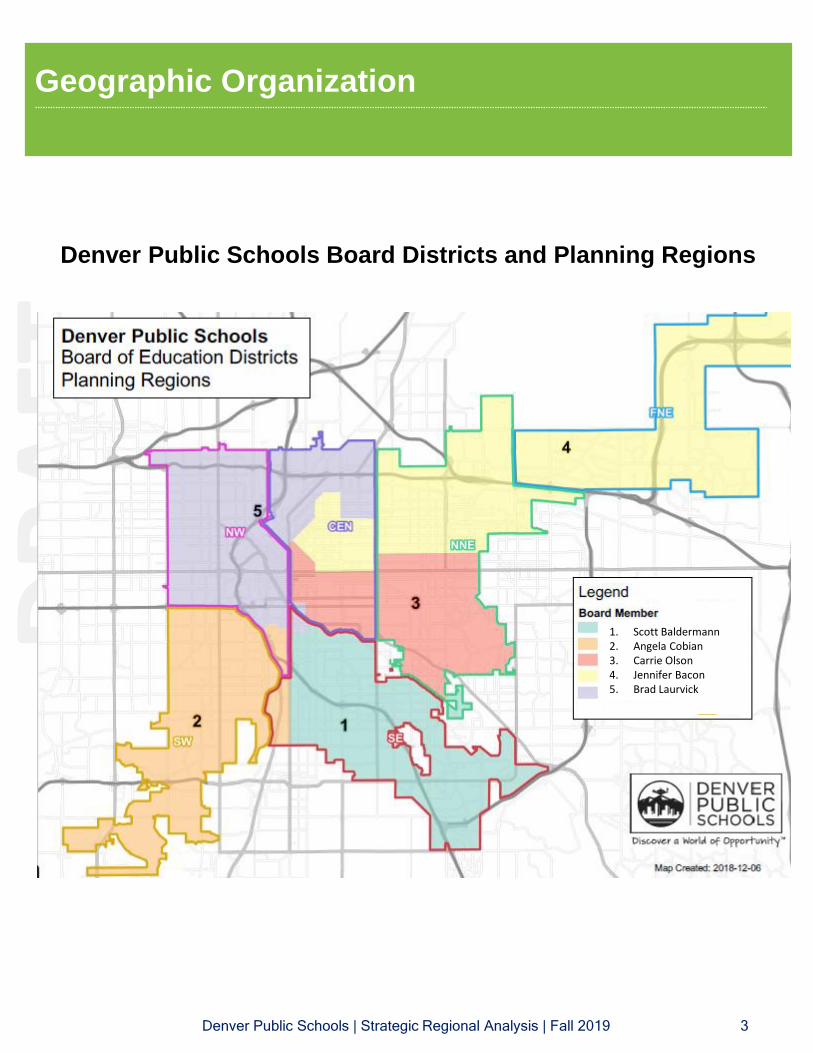
Denver Public Schools Board Districts and Planning Regions
1. Scott Baldermann2. Angela Cobian3. Carrie Olson4. Jennifer Bacon5. Brad Laurvick
DRAFT
Geographic Organization
Denver Public Schools | Strategic Regional Analysis | Fall 2019 4
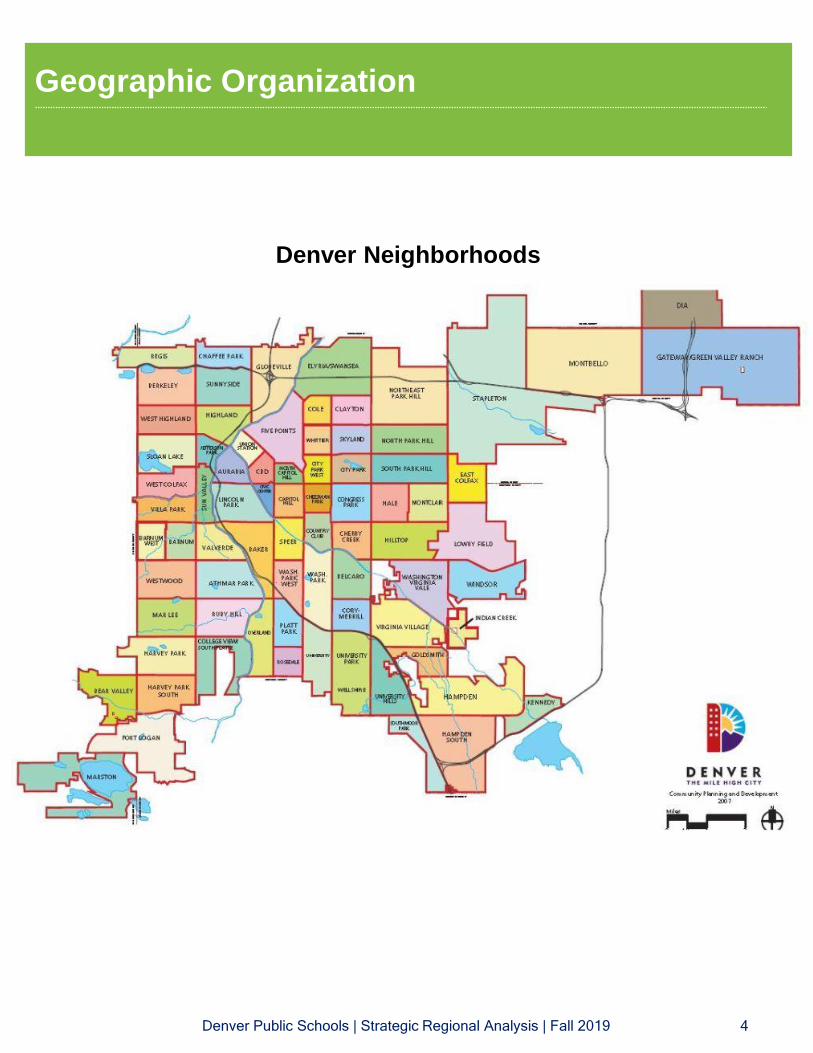
Denver Neighborhoods

DRAFT
Historical Enrollment
Overall DPS enrollment increased marginally from 2018 to 2019, primarily due to new
growth in ECE. However, elementary declines and slowing middle school growth are likely
to lead to overall enrollment declines in the next few years.
Denver Public Schools | Strategic Regional Analysis | Fall 2019 5
3.53.1
1.41.0
0.70.4 0.5
2013 2014 2015 2016 2017 2018 2019
DPS ECE-12 Enrollment Percent Growth
5,576 5,627 5,850 6,320 6,212 6,180 6,161 6,088 6,428 6,866
39,296 40,470 41,448 42,768 43,851 43,721 43,329 42,619 41,729 40,766
15,662 16,343 17,049 17,640 18,557 18,887 19,341 19,677 19,978 20,263
18,889 19,430 20,077 20,670 21,530 22,641 23,500 24,600 25,221 25,92079,423 81,870 84,424
87,398 90,150 91,429 92,331 92,984 93,356 93,815
0
10,000
20,000
30,000
40,000
50,000
60,000
70,000
80,000
90,000
100,000
2010 2011 2012 2013 2014 2015 2016 2017 2018 2019
Total DPS ECE-12 Enrollment
ECE Elementary Middle High
• DPS has nearly 1,000 fewer elementary
students in 2019 than it did in 2018
• The rate of elementary decline has
doubled in the past few years.
• Middle and high school are still growing,
but the rate of growth has halved in the
past 5 years.
• Much of the growth this year comes
from ECE growth (driven by additional community partner seats).
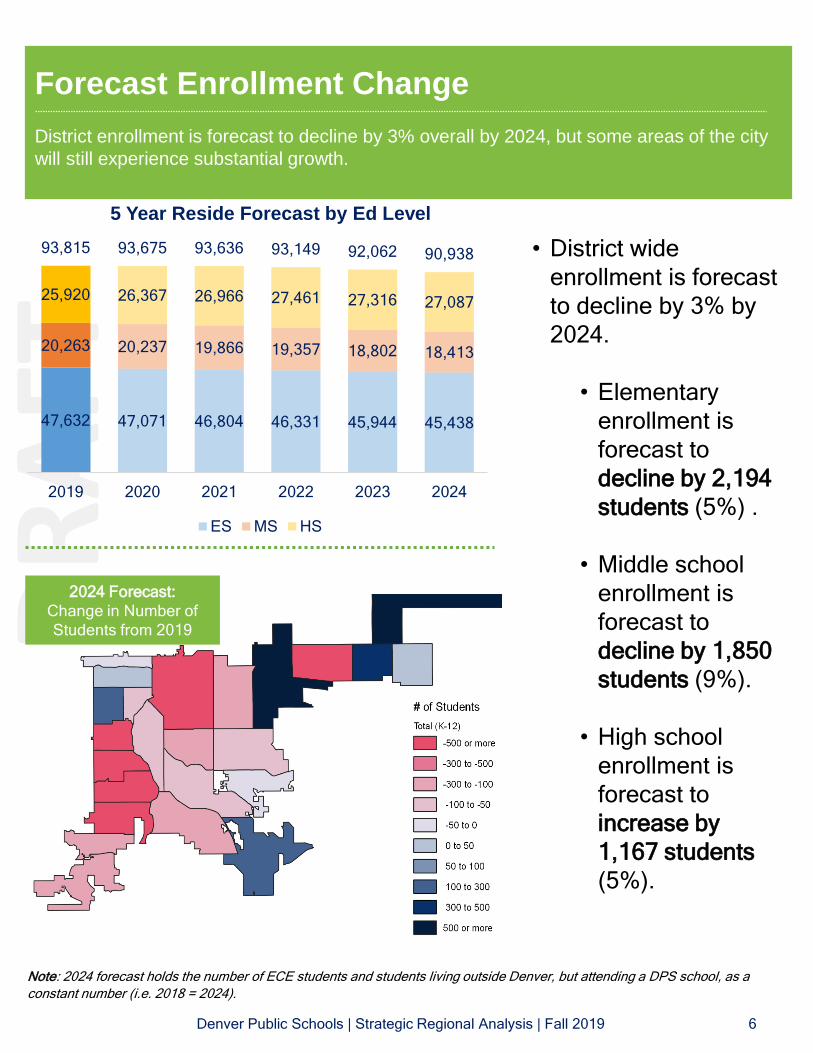
DRAFT47,632 47,071 46,804 46,331 45,944 45,438
20,263 20,237 19,866 19,357 18,802 18,413
25,920 26,367 26,966 27,461 27,316 27,087
93,815 93,675 93,636 93,149 92,062 90,938
2019 2020 2021 2022 2023 2024
5 Year Reside Forecast by Ed Level
ES MS HS
Note: 2024 forecast holds the number of ECE students and students living outside Denver, but attending a DPS school, as a
constant number (i.e. 2018 = 2024).
Forecast Enrollment Change
District enrollment is forecast to decline by 3% overall by 2024, but some areas of the city
will still experience substantial growth.
Denver Public Schools | Strategic Regional Analysis | Fall 2019 6
2024 Forecast:
Change in Number of
Students from 2019
• District wide
enrollment is forecast
to decline by 3% by
2024.
• Elementary
enrollment is
forecast to
decline by 2,194
students (5%) .
• Middle school
enrollment is
forecast to
decline by 1,850
students (9%).
• High school
enrollment is
forecast to
increase by
1,167 students
(5%).

DRAFT
Regional Growth by Education Level
Enrollment growth at all education levels is forecast to be primarily in Stapleton, Gateway,
and DIA.
Denver Public Schools | Strategic Regional Analysis | Fall 2019 7
2024 Forecast:
ELEMENTARY
2024 Forecast:
MIDDLE
2024 Forecast:
HIGH
• Stapleton, DIA, and
Gateway are forecast to
have the most growth at
all ed levels through
2024.
• The Southwest and
Central regions and the
Montbello neighborhood
are forecast to have the
most significant
declines.
DRAFT
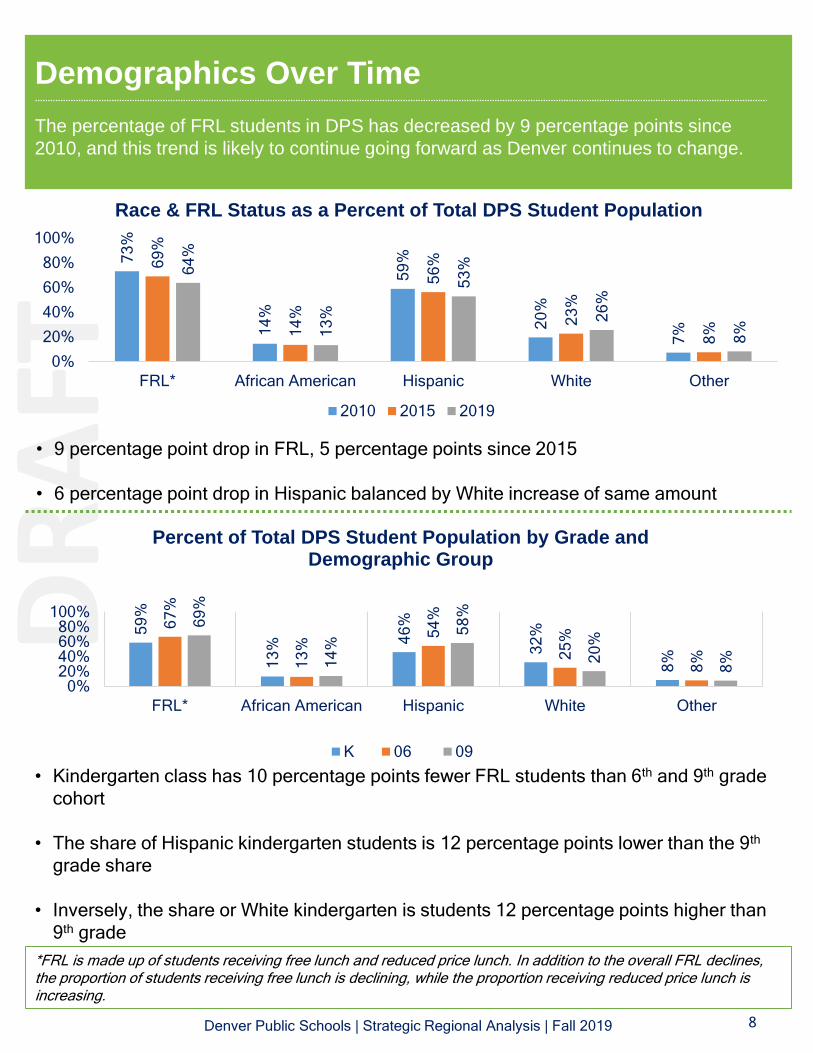
Demographics Over Time
The percentage of FRL students in DPS has decreased by 9 percentage points since
2010, and this trend is likely to continue going forward as Denver continues to change.
Denver Public Schools | Strategic Regional Analysis | Fall 2019 8
• 9 percentage point drop in FRL, 5 percentage points since 2015
• 6 percentage point drop in Hispanic balanced by White increase of same amount
73
%
14
%
59
%
20
%
7%
69
%
14
%
56
%
23
%
8%
64
%
13
%
53
%
26
%
8%
0%
20%
40%
60%
80%
100%
FRL* African American Hispanic White Other
Race & FRL Status as a Percent of Total DPS Student Population
2010 2015 2019
• Kindergarten class has 10 percentage points fewer FRL students than 6th and 9th grade
cohort
• The share of Hispanic kindergarten students is 12 percentage points lower than the 9th
grade share
• Inversely, the share or White kindergarten is students 12 percentage points higher than
9th grade
59
%
13
% 46
%
32
%
8%
67
%
13
%
54
%
25
%
8%
69
%
14
%
58
%
20
%
8%
0%20%40%60%80%
100%
FRL* African American Hispanic White Other
Percent of Total DPS Student Population by Grade and Demographic Group
K 06 09
*FRL is made up of students receiving free lunch and reduced price lunch. In addition to the overall FRL declines, the proportion of students receiving free lunch is declining, while the proportion receiving reduced price lunch is increasing.

DRAFT
80%
73%
67%
62%
32%
64%
20%
27%
33%
38%
68%
36%
0% 10% 20% 30% 40% 50% 60% 70% 80% 90% 100%
Accredited on Probation
Accredited on Priority Watch
Accredited on Watch
Meets Expectations
Distinguished
Overall FRL Distribution
District Wide Utilization of ECE-12 Seats Based on SPF Rating and FRL
FRL Non-FRL
Demographics & Performance
Demographic discrepancies in the percentage of students by race that attend a high-
performing school highlight inequities across the district.
Denver Public Schools | Strategic Regional Analysis | Fall 2019 9
• Hispanic students attend red and orange schools at a considerably higher rate than their
expected share
• White students attend blue schools at more than double what would be expected in
equal distribution
• African American and other minority groups, however, are closer to equal distribution at
the district level.
• FRL students make up 64% of the student population, only 32% attend a high-
performing school
53%
26%
53%
53%
62%
69%
26%
54%
27%
24%
15%
12%
13%
10%
12%
14%
15%
14%
8%
10%
8%
8%
8%
6%
0% 20% 40% 60% 80% 100%
District Demographic Distribution
Distinguished
Meets Expectations
Accredited on Watch
Accredited on Priority Watch
Accredited on Probation
District Utilization of ECE-12 Seats Based on SPF Rating and Demographics
Hispanic White African American Other
Note: Blue and green schools are classified as high-performing. Yellow, orange, and red schools are classified as low performing.
(18 schools)
(63)
(31)
(80)
(29)
(29)
(31)
(63)
(80)
(18 schools)
DRAFT
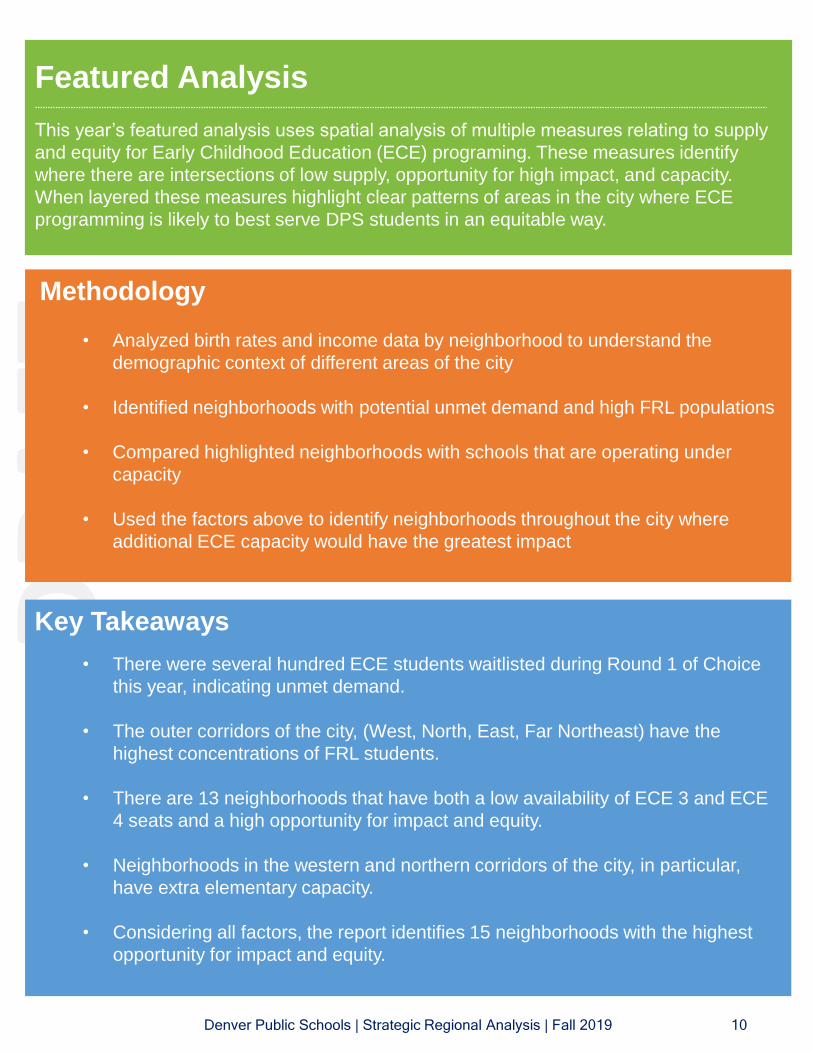
Featured Analysis
This year’s featured analysis uses spatial analysis of multiple measures relating to supply
and equity for Early Childhood Education (ECE) programing. These measures identify
where there are intersections of low supply, opportunity for high impact, and capacity.
When layered these measures highlight clear patterns of areas in the city where ECE
programming is likely to best serve DPS students in an equitable way.
Denver Public Schools | Strategic Regional Analysis | Fall 2019 10
Methodology
• Analyzed birth rates and income data by neighborhood to understand the
demographic context of different areas of the city
• Identified neighborhoods with potential unmet demand and high FRL populations
• Compared highlighted neighborhoods with schools that are operating under
capacity
• Used the factors above to identify neighborhoods throughout the city where
additional ECE capacity would have the greatest impact
Key Takeaways
• There were several hundred ECE students waitlisted during Round 1 of Choice
this year, indicating unmet demand.
• The outer corridors of the city, (West, North, East, Far Northeast) have the
highest concentrations of FRL students.
• There are 13 neighborhoods that have both a low availability of ECE 3 and ECE
4 seats and a high opportunity for impact and equity.
• Neighborhoods in the western and northern corridors of the city, in particular,
have extra elementary capacity.
• Considering all factors, the report identifies 15 neighborhoods with the highest
opportunity for impact and equity.
DRAFT
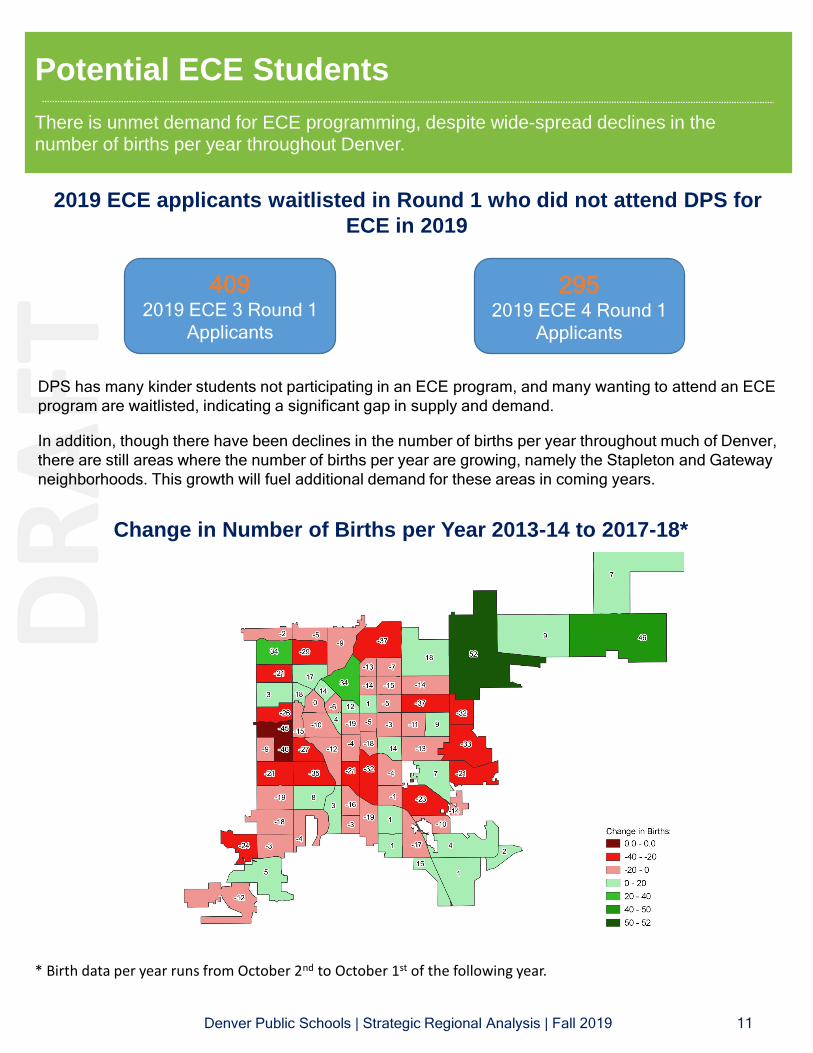
Potential ECE Students
There is unmet demand for ECE programming, despite wide-spread declines in the number of births per year throughout Denver.
Denver Public Schools | Strategic Regional Analysis | Fall 2019 11
* Birth data per year runs from October 2nd to October 1st of the following year.
DPS has many kinder students not participating in an ECE program, and many wanting to attend an ECE
program are waitlisted, indicating a significant gap in supply and demand.
In addition, though there have been declines in the number of births per year throughout much of Denver,
there are still areas where the number of births per year are growing, namely the Stapleton and Gateway
neighborhoods. This growth will fuel additional demand for these areas in coming years.
4092019 ECE 3 Round 1
Applicants
2952019 ECE 4 Round 1
Applicants
2019 ECE applicants waitlisted in Round 1 who did not attend DPS for
ECE in 2019
Change in Number of Births per Year 2013-14 to 2017-18*

DRAFT
Kindergarten FRL
Based on the percent of FRL Kinder students, the areas where children face the largest
obstacles to success are predominately the western corridor, northern corridor (including
the far northeast), and, to a lesser degree, the eastern corridor (including the far southeast)
of Denver.
Denver Public Schools | Strategic Regional Analysis | Fall 2019 12
Percent of FRL Kinder Students
There are 8 neighborhoods where 90 percent or more of kinder students qualify for FRL: Montbello, Elyria
Swansea, Globeville, Sun Valley, Barnum, Barnum West, Valverde, and Westwood.

DRAFT
Building Utilization
There are several neighborhoods with schools that have extra capacity that could
potentially accommodate new ECE seats, which overlap with neighborhoods where there
is low supply of ECE seats and high percentages of FRL students.
Denver Public Schools | Strategic Regional Analysis | Fall 2019 13
In particular, there is a lot of overlap for neighborhoods in the western and northern corridors of the city
and some overlap in the eastern corridor and the Far Southeast.
Utilization of Elementary School Buildings by Neighborhood
Darker = Lower Utilization
* Utilization = School Capacity compared to October Count Enrollment
DRAFT
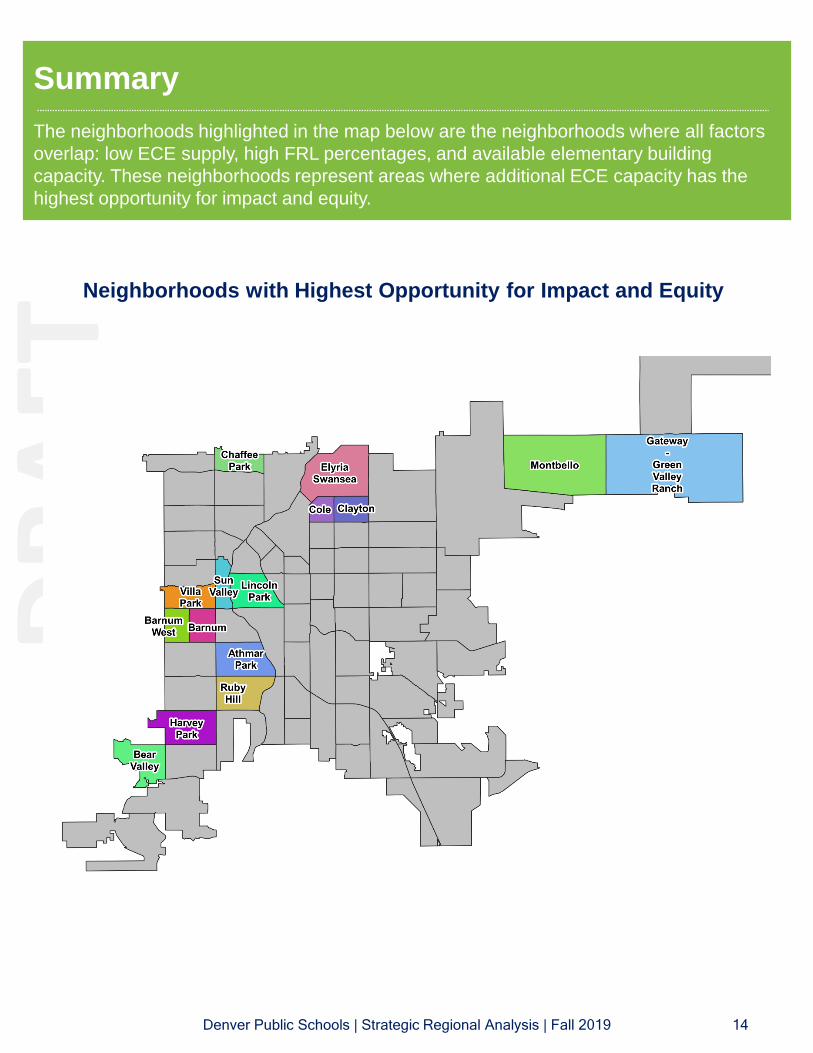
Summary
The neighborhoods highlighted in the map below are the neighborhoods where all factors
overlap: low ECE supply, high FRL percentages, and available elementary building
capacity. These neighborhoods represent areas where additional ECE capacity has the
highest opportunity for impact and equity.
Denver Public Schools | Strategic Regional Analysis | Fall 2019 14
Neighborhoods with Highest Opportunity for Impact and Equity
DRAFT
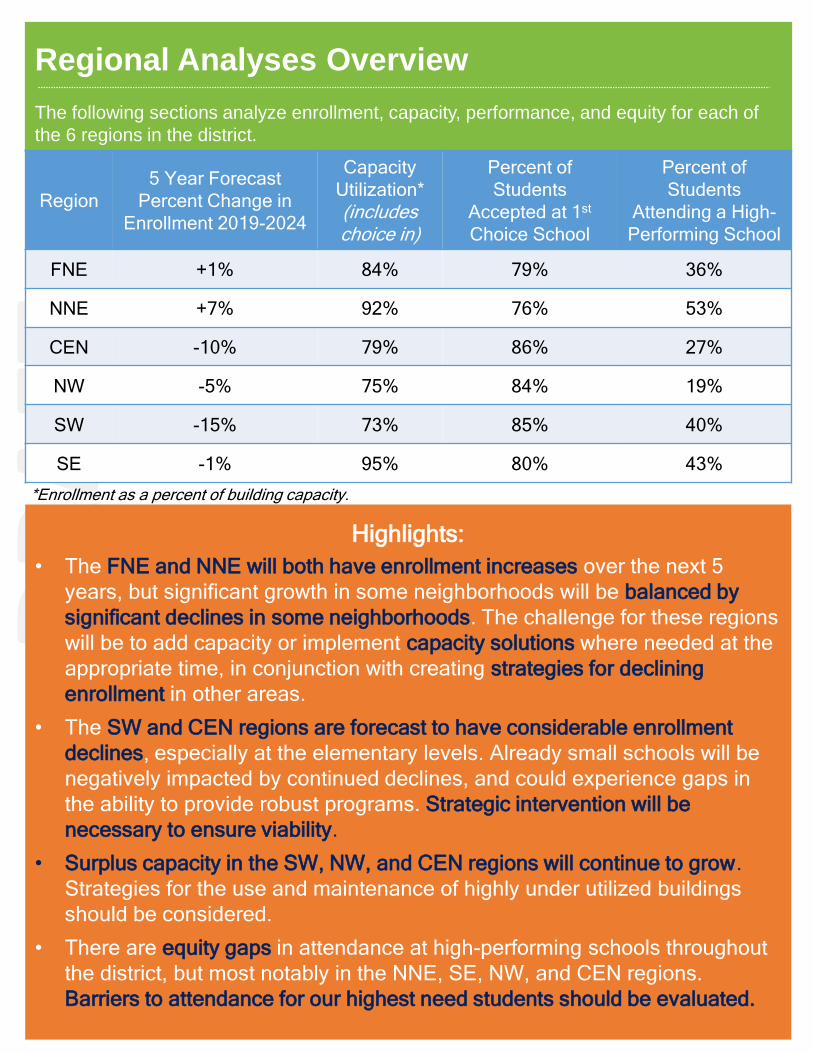
Regional Analyses Overview
The following sections analyze enrollment, capacity, performance, and equity for each of
the 6 regions in the district.
Denver Public Schools | Strategic Regional Analysis | Fall 2019 15
Region
5 Year Forecast
Percent Change in
Enrollment 2019-2024
Capacity
Utilization*
(includes choice in)
Percent of
Students
Accepted at 1st
Choice School
Percent of
Students
Attending a High-
Performing School
FNE +1% 84% 79% 36%
NNE +7% 92% 76% 53%
CEN -10% 79% 86% 27%
NW -5% 75% 84% 19%
SW -15% 73% 85% 40%
SE -1% 95% 80% 43%
Highlights:
• The FNE and NNE will both have enrollment increases over the next 5
years, but significant growth in some neighborhoods will be balanced by
significant declines in some neighborhoods. The challenge for these regions
will be to add capacity or implement capacity solutions where needed at the
appropriate time, in conjunction with creating strategies for declining
enrollment in other areas.
• The SW and CEN regions are forecast to have considerable enrollment
declines, especially at the elementary levels. Already small schools will be
negatively impacted by continued declines, and could experience gaps in
the ability to provide robust programs. Strategic intervention will be
necessary to ensure viability.
• Surplus capacity in the SW, NW, and CEN regions will continue to grow.
Strategies for the use and maintenance of highly under utilized buildings
should be considered.
• There are equity gaps in attendance at high-performing schools throughout
the district, but most notably in the NNE, SE, NW, and CEN regions.
Barriers to attendance for our highest need students should be evaluated.
*Enrollment as a percent of building capacity.