density fluctuation studies in nstx using reflectometry and gas puff imaging by na crocker*, wa...
TRANSCRIPT

Density fluctuation studies in NSTX using reflectometry and gas puff imaging
by NA Crocker*, WA Peebles*, S Kubota*, XV Nguyen*; S Zweben**, T Munsat**, E
Fredrickson**, NSTX team**; RJ Maqueda†
*University of California – Los Angeles**Princeton Plasma Physics Laboratory
† Nova Photonics
Presented at the 46th Annual
APS Division of Plasma Physics Meeting
Savannah, GA Nov 15-19, 2004

Abstract (Revised)
Density fluctuation studies in NSTX using reflectometry and gas puff imaging1
NA Crocker, WA Peebles, S Kubota, XV Nguyen (UCLA); S Zweben, T Munsat, E Fredrickson, NSTX team (PPPL); RJ Maqueda (Nova Photonics)Reflectometry and Gas Puff Imaging (GPI) are complementary, non-intrusive techniques for observing density fluctuations in fusion plasmas. GPI provides 2–D images of turbulence, whereas reflectometry generates local turbulence measurements from the edge to deep in the core plasma. They have recently been used to obtain simultaneous measurements in NSTX of edge turbulence during L to H mode transitions. Additionally, in conjunction with arrays of Mirnov coils outside a plasma, reflectometry may be used to probe the structure of density perturbations associated with global MHD inside the plasma (e.g. compressional and toroidal Alfvén eigenmodes). Recently, just such global MHD activity has been observed by reflectometry in NSTX. Three quadrature reflectometers that reflect at densities of approximately 1, 2 and 3 x 1013 cm3 allow determination of local fluctuation levels and spectra in NSTX. GPI provides high-speed imaging of a 20 cm x 20 cm region centered just inside the separatrix near the outer midplane in NSTX. Preliminary results from reflectometry at 1 x 1013 cm3 show that the reflectometer phase fluctuation level undergoes a significant reduction at the L-H transition. GPI also shows a large reduction that occurs nearly simultaneously over a comparable timescale. Reflectometer phase shows peaks in coherence at a variety of frequencies with signals from Mirnov coils in a toroidal array outside the plasma. Variation of the cross-phase at each of these frequencies with coil position allows identification of the toroidal mode number of the associated global mode.1Supported by U.S. DoE Grant DE-FG03-99ER54527

Motivation
• Reflectometry and Gas Puff Imaging (GPI) are complementary, non-intrusive techniques for observing turbulence in fusion plasmas.
• GPI provides 2–D images of edge line emission, which may be interpreted as turbulence images
• Reflectometry generates local density fluctuation measurements from the edge to deep in the core plasma.
• In conjunction with arrays of Mirnov coils outside a plasma, reflectometry may probe the structure of density perturbations associated with global MHD inside the plasma.

Main Points
• Reflectometry and Gas Puff Imaging have obtained measurements simultaneously of substantial changes in turbulence during an L-H transition• Abrupt change observed in reflectometer phase fluctuations.• Fast (but slower) changes seen in GPI images and fast chord measurements of turbulence
• Change in density fluctuation level (n/n0) thru L-H transition difficult to determine from reflectometer measurement• Determination of n/n0 in H-mode may be possible. Requires testing of reflectometry models.
• Determination of n/n0 in L-mode not possible due to interference effects,† but measurement nonetheless suggests it is larger than in H-mode.
†Problem not intrinsic to L-mode. L-mode-only shots exist where n/n0 can be determined.
• Similar fluctuation spectra, featuring both turbulence and global MHD, seen by reflectometer and GPI
• Toroidal mode number of global MHD modes identified. Internal structure of associated density perturbation may be determined with future work.

• Device parameters:• R = 95 cm• A = 62 cm• Ip = 0.58 - 0.85 MA• BT = 0.32 - 0.44 T• = 1.9• = 0.45
• Array of microwave reflectometer horns aligned perpendicular to flux surfaces.
• Three quadrature reflectometers in use: • 30 GHz, 42 GHz and 50 GHz• cutoff densities of ~ 1, 2 and 3 x 10¹⁹ m-3, respectively.
Experiments Performed in NSTXThree quadrature reflectometers in use: 30 GHz, 42 GHz and 50 GHz
with cutoff densities of ~ 1, 2 and 3 x 10¹⁹ m-3, respectively.

Microwaves can be used to probe density fluctuations in plasma
• Microwaves with low enough frequency ( < p) will reflect from “cutoff” layer in plasma• p
2 is proportional to density: p2 = e2n0/0me
• Dispersion relation for “ordinary mode” (“O-mode”) microwaves: 2 = p2 +
c2k2
• k 0 as p
• Microwaves reflect at “cutoff” surface, where = p, k = 0
• Wave propagation controlled by density reflected microwaves carry information about density fluctuations
electric field
Microwave (“O-mode”) propagation

Quadrature reflectometer probes density fluctuations in NSTX plasma
• Quadrature reflectometer detects amplitude, A(t), and phase-shift, (t) of microwaves reflected from plasma.
• Reflectometer has two outputs:• “In-Phase”: I(t) = A(t)cos[(t)]• “Quadrature”: Q(t) = A(t)sin[(t)]
• Fluctuations in output caused by density fluctuations in plasma
Quadrature
Mixer
Isolators
I output
Q output
Isolator
Gunn Oscillator
Signal Amplifiers
Launch Receive
Signal Amplifiers
To Plasma

How do density fluctuations perturb the microwaves detected by the reflectometer?
• There are at least three ways in which density fluctuations perturb the microwaves detected by the reflectometer:
• May cause “Rigid” motion of the cutoff (i.e. reflecting) surface: causes change in path length from launch to receive horns change in phase of reflected microwaves
• May cause scattering: incoming microwaves may scatter off density fluctuations anywhere Bragg condition, kin + kn = kscattered, may be satisfied
• May ripple or roughen cutoff surface when kn B, n0: causes interference effects, possibly incoherence in reflected microwaves
• The exact way in which these effects contribute to the reflectometer measurement is an active area of research

Many models have been proposed to interpret reflectometry measurements
• 1-D models which neglect scattering indicate n/n0. Proportionality depends on (see e.g. R Nazikian, et al.; PoP, May 2001):• wave number of density fluctuation, kn (where kn || n0)
• equilibrium density gradient scale, Ln = n0/|n0|
• vacuum wavelength of microwaves, kvac
• if fluctuation wavelength long, knLn ≤ 1 (i.e. |n|/n ≤ |n0|/n0):
n/n0 ~ /(2kvacLn)
• if fluctuation wavelength short, knLn > 1 (i.e. |n|/n > |n0|/n0):
n/n0 ~ (knLn)1/2/(2kvacLn)
• For 1-D which models which include scattering, depends on spatial structure of n/n0 (see e.g. BB Afeyan, et al.; PPCF 1995):
• Scattering occurs for 2kin = kn, since kout = -kin

Many models have been proposed to interpret reflectometry measurements
(cont.)• 2-D models account for important effects not included in 1-D
models:• curvature of cutoff surface
• roughening or rippling of surface
• Propagation effects, beam width effects.
• Examples of 2-D models include “random phase screen model” and “distorted mirror model”
• Random phase screen model (see e.g. R Nazikian, et al.; PoP, May 2001) predicts:• n/n0 . Proportionality depends on Ln and kn||, the component of kn || to n0
• Severe interference when > ~ 2 radians at cutoff surface or path length from cutoff to receiver > “diffraction length”, D.• D = 2kvac/{(1+2)(kn)2}, where kn is width of the density fluctuation spectrum for kn B,
n0
• Distorted mirror model (see e.g. GD Conway, et al.; PPCF 1996):• relates amplitude and poloidal correlation length of cutoff surface distortions to “coherent” and “incoherent” reflection coefficients and path length to cutoff surface.
• UCLA plans to compare reflectometer measurement with alternate
n/n0 measurements (e.g. BES in DIII-D) to assess various models

Interference effects can prevent interpretation of reflectometer
measurement• Microwaves reflected from plasma may be
incoherent due to:• Interference from strong random rippling or roughness of cutoff surface• Long distance propagation of angularly scattered microwaves
• When reflected microwaves incoherent
(top)• Phaser, given by A(t)ei(t) = I(t)+iQ(I), is randomly distributed around zero amplitude• Proportionality between phase and density fluctuations breaks down
• When reflected microwaves coherent
(bottom):• phaser exhibits strong phase fluctuations, weak amplitude fluctuations• Phase fluctuations proportional to density fluctuation level n/n0.
Coherent
Incoherent

viewing area≈ 20x25 cm
Gas Puff Imaging diagnostic images turbulence in NSTX edge
• Looks at D or HeI light from gas puff:
I nonef(ne,Te)
• View ≈ along B field line to see 2-D structure B
• Image coupled to camera with 800 x 1000 fiber bundle

Gas Puff Imaging system has two complementary subsystems
• High spatial resolution, short time records:
• PSI-5 Camera (300 frames/shot): ≤ 250,000 frames/sec with 64 x 64 pixels per frame
• Limited spatial resolution, long time records:
• Fast Chords (13 channels/shot): 2 cm spots into PM tubes with 200 kHz bandwidth
Z (
cm)
H1
T7
H7
T1
H4,T4
R (cm)
Chord locations with respect to lab coordinates
H1
T7
H7
T1
H4,T4
Chord locations with respect to PSI-5 Image

L-H transition observed in neutral beam driven NSTX shot
• NSTX Shot 113732 has plasma parameters:• Peak plasma current, Ip = 900 kAmp
• Neutral beam power, PNBI ~ 1/4 – 1/2 MW
• Peak line avg. density, <ne> = 4.1x1013 cm-3
• Peal line avg. temperature, <Te> = 0.56 keV
• Sudden drop in D at t ~ 0.1835 sec corresponds to L-H transition

Reflectometry and Gas Puff Imaging obtain simultaneous, complementary measurements
during L-H Transition•Simultaneous measurements of L-H transition:
• Fast D (top right): Sudden drop indicates transition
• Center and Inner fast chords (upper and lower middle right): large D intensity changes. Chord arrays provide long-time, multi-point spectra
• 30 GHz reflectometer phase fluctuations (bottom right): sudden amplitude change, faster than Dintensity change.
• Fast 2-D imaging of transition (left and right below): can provide short-time, high spatial resolution spectra
L-mode H-mode
H-modeL-modeShot 113732

Reflectometer Phase Fluctuations Decrease Abruptly (≤ 100 µsec) at L–H
Transition
• Sharp drop in D indicates L-H
transition (top right)
• Fluctuations in 30GHz reflectometer phase decrease abruptly at L-H transition (top right)
• changes from ~ 6.1 radians to ~ 1.8 radians
• received microwaves incoherent before transition (bottom left), coherent after transition (bottom right)
• Phase spectrum changes abruptly, as well (middle right), For instance, various coherent modes appear.
• Reflectometer phase sensitive to Ln and
density fluctuation level, as well as 2-D effects
L-mode H-mode
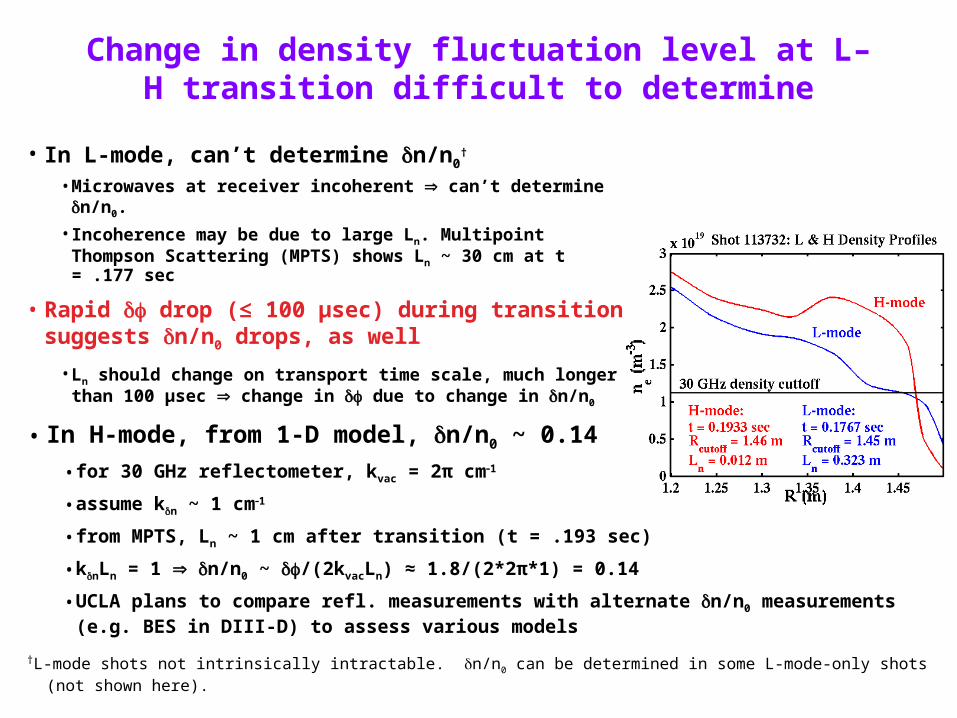
Change in density fluctuation level at L–H transition difficult to determine
• In L-mode, can’t determine n/n0†
• Microwaves at receiver incoherent can’t determine n/n0.
• Incoherence may be due to large Ln. Multipoint Thompson Scattering (MPTS) shows Ln ~ 30 cm at t = .177 sec
• Rapid drop (≤ 100 µsec) during transition suggests n/n0 drops, as well
• Ln should change on transport time scale, much longerthan 100 µsec change in due to change in n/n0
• In H-mode, from 1-D model, n/n0 ~ 0.14
• for 30 GHz reflectometer, kvac = 2π cm1
• assume kn ~ 1 cm1
• from MPTS, Ln ~ 1 cm after transition (t = .193 sec)
• knLn = 1 n/n0 ~ /(2kvacLn) ≈ 1.8/(2*2π*1) = 0.14
• UCLA plans to compare refl. measurements with alternate n/n0 measurements (e.g. BES in DIII-D) to assess various models
†L-mode shots not intrinsically intractable. n/n0 can be determined in some L-mode-only shots (not shown here).

Global MHD modes typically observed in neutral beam driven plasmas in NSTX
TAE
CAEs
• Compressional Alfvén Eigenmodes (CAEs) (see right)• Driven by neutral beam ions• Multiple coherent modes at resonant frequencies• Range of frequencies, f, controlled by ion cyclotron frequency, fci : ~1/5 ≤ f/fci ≤ ~1
• Toroidal Alfvén Eigenmodes (TAEs) (see right)• Driven by fast ions energized by neutral beams• Low toroidal mode numbers: n = 1 - 5• Frequencies in range 50 - 150 kHz
• Energetic Particle Modes (EPMs) (not shown): • Also called “fishbone instabilities”• frequencies in range ~ 10 kHz - ~ 100 kHz• frequency “chirps”: sensitive to energetic particle distribution• related to shear Alfvén waves

Reflectometer and GPI see similar fluctuation spectra, featuring both turbulence and global
MHD• Simultaneous fluctuation
measurements (top right) obtained just after L-H transition for:• inner fast GPI chord emission intensity
• 30 GHz reflectometer phase fluctuation
• Both signals show spectra with similar shapes (middle right)• expected if simplest interpretation of signals as density fluctuations applicable.
• Both signals strongly coherent at ~ 90 kHz (bottom right)• Indicates that both signals affected by global MHD fluctuation (TAE).
• Both signals not coherent elsewhere:• Indicates spectra mostly represent local turbulence
TAE

TAECAEs
Reflectometers are sensitive to global MHD fluctuations
• Reflectometer phase coherent with global MHD modes• B spectrum from Mirnov coil and 30 GHz refl. phase spectrum show similar peaks (top right)• Strong coherence at peaks (bottom right).
• cross-phase of reflectometer phase and coil signals in toroidal array obtained (below)• may identify toroidal Fourier mode number of global MHD modes
• Radial structure of n/n0 associated with global MHD mode may be obtained:• requires simultaneous measurements with reflectometers at different microwave frequencies.

Conclusions
• Reflectometry and Gas Puff Imaging have obtained measurements simultaneously of substantial changes in turbulence during an L-H transition• Abrupt change observed in reflectometer phase fluctuations.• Fast (but slower) changes seen in GPI images and fast chord measurements of turbulence
• Change in density fluctuation level (n/n0) thru L-H transition difficult to determine from reflectometer measurement• Determination of n/n0 in H-mode may be possible. Requires testing of reflectometry models.
• Determination of n/n0 in L-mode not possible due to interference effects,† but measurement nonetheless suggests it is larger than in H-mode.
†Problem not intrinsic to L-mode. L-mode-only shots exist where n/n0 can be determined.
• Similar fluctuation spectra, featuring both turbulence and global MHD, seen by reflectometer and GPI
• Toroidal mode number of global MHD modes identified. Internal structure of associated density perturbation may be determined with future work.

Future Work
• Compare density fluctuation levels determined from reflectometer phase with alternate n/n0 measurements (e.g. BES in DIII-D) to assess various models
• Find conditions where density fluctuation levels can be determined both before and after L-H transition. Compare GPI with reflectometry
• L-mode shots not intrinsically intractable. Density fluctuation levels can be determined in some L-mode-only shots (not shown here).
• Measure internal structure of global MHD mode density perturbations:
• Use different microwaves frequencies simultaneously for radial structure
• Use toroidal array of Mirnov coils to identify toroidal mode number
• Explore use of poloidal arrays to determine poloidal structure

Requests For Electronic Copies(please provide e-mail address)