densities and refractive indexes of binary mixtures in the system methyl isobutyl ketone-2-butanol....
TRANSCRIPT
318 J. Chem. Eng. Data 1980, 25, 318-320
Kidnay (73) for the N2 + CH, + C02 system.
Glossary equation of state parameter equation of state parameter equation of state parameter total pressure gas constant temperature molar volume liquid-phase mole fraction vapor-phase mole fraction
Literature Cited
(1) Cosway, H. F., Katz, D. L., AICM J., 5, 46 (1959). (2) Chang, S.D., Lu, B. C.-Y., Chem. Eng. Prog., Symp. Ser., 63, (el),
18 (1987). (3) Lu, B. C.-Y., Yu, P., Poon, D. P. L. Nstufe(London), 222(5195), 768
(1969). (4) Yu, P., Elsheyal, I. M., Lu, B. C.-Y., Can. J. Chem. Em., 47,495 (1969). (5) Barsuk, S. D., Benyaminovich, 0. A., *ow. Promst., 12, 36 (1973). (6) Hka, M. J., Kidnay, A. J., Miller, R. C., "Equilibrium Properties of Fluid
Mixtures: A Bibliography of Data on Fluids of Cryogenic Interest", NSRDS Bibllographic Series, IFI/Plen;m, New York, 1975.
(7) Wichterie, I., Linek, J., Haia, E., Vapor-Liquid Equilibrium Data Bibliography", Elsevier, New York, 1973; Supplement I, 1976.
(8) Oeiklch, L. R., Plkker, U. J., Knapp, H., "Vaporliquid Equilibria, A Bibliography of Published Data of Multicomponent Systems Containing
Components with Normal Bollhrg Points Lower Than 350 K', Institute of Thermodynamics. Technical University of Berlin, Internal Publicatbn, Sept 1977.
(9) Hka, M. J., Miller, R. C., Kidnay, A. J., J. phys. Chem. Ret. Date, 6, 799 (1979).
(IO) Soeve, G., Chem. Eng. Scl., 27, 1197 (1972). (11) Redllch, O., Kwong. J. N. S., Chem. Rev., 44, 233 (1949). (12) Peng, D., Robinson, D. B., Ind. Eng. Chem. fundem., 15, 59 (1976). (13) Somalt, F., Kidnay, A. J., J. Chem. Eng. Date, 23, 301 (1978). (14) (3wdwin, R. D., Roder. H. M., Straty, 0. C., ABS Tech. hMe(U.S.), No.
684, (1976). (15) Meyers, C. H., Van Dusen, M. S., J. Res. Ne#. Bu. Stend. (U.S.), 10,
381 (1933). (18) Qralrs0, L., Fredensiund, A.. Moilerup, J.. Nuid phese Equillb., 1, 13
(1977). (17) Stryjek, R., Chappeiear, P. S., Kobayashi, R., J . Chem. Eng. mte, IS, ' 59 (1976). (18) Ellington, R. T., Eakh, B. E., Parent, J. D., Gami, D. C., Bloomer, 0. T.,
"Thermodynamic Propecties of Gases, Liquids, and Solids", American Society of Mechanical Engineers, Heat Transfer DMsbn, McQrawHIII, New York, 1959, p 180.
(19) Qraboski, M. S., Daubert, T. E., Ind. Eng. Chem. Process Des. Dew., 17, 443, 448 (1978).
(20) Elshayal. I. M., Lu, B. C Y , Can. J. Chem. Eng., 51, 76 (1973). (21) Hamam, S. E. M., Lu, B. CY. , Chem. Eng. J. (Leusanne), 15, 121
(22) Stryjsk, R., Chappelear, P., KobayasH, R., J. Chem. Em. Bta, IS , 334
(23) Kidnay, A. J., Miller, R. C., Parrish, W. R., Him, M. J., C r y q e n b , 15,
(1978).
(1974).
531 (1975).
Received for review October 3, 1979. Accepted May 23, 1960. The authors wish to acknowledge the financial assistance of the National Science Fouk dation.
Densities and Refractive Indexes of Binary Mixtures in the System Methyl Isobutyl Ketone-2-Butanol. Mat hema t ical Relations Obtained
Roque Riggio," Marlana Hernandez Ubeda, Juan F. Ramos, and Hector E. Martlnez Departamento de Ciencias Exactas, Universidad Nacional de Salta, 44OO-Salta, Argentina
Densities and refractive indexes were determined for binary mixtures of methyl isobutyl ketone-2-butanol at temperatures of 20, 25, 30, and 35 OC and at atmospheric pressure. An empirical relation between density, composition, and temperature and, on the other hand, an empirical relation between refractive index, cornposition, and temperature of the mixture were obtained. The properties of the mixtures predicted through empirical relations were found to be in fairly good agreement with the experimental data and to have validity over the temperature range 20-35 OC.
One need of much importance is the measurement of prop- erties of binary mixtures at different temperatures. To facilitate the interpolation of the data, we derived equations in which the effects of temperature and composition were incorporated.
Materials. Methyl isobutyl ketone (analytical reagent, Merck, Darmstadt) was distilled, refluxed, and fractionated. The fraction boiling between 115 and 116 O C was collected and used in the experimental measurements (2). 2-Butanol (analytical reagent, Merck, Darmstadt) was used without further purification and drying (2). The physical properties of the substances used were compared with corresponding data reported in the literature (Table I).
Experimental Section
Solutions of different composition of the binary system methyl isobutyl ketone-2-butanol were prepared by weight in ground- glass-joint conical flasks by using a Mettler balance K311 with
0021-9568/80/1725-0318$01 .OO/O
Table I. Roperties of Methyl Isobutj Ketone and 2-Butanol density, g ~ m ' ~ refractive index
present present temp, work work
material "C (exptl) lit (exptl) lit
methyl 20 isobutyl ketone
25 30 35
2-butmol 20 25 30 35
0.8010 0.8008 (I, 2) 1.395 76 1.3962 (4)
0.7963 0.7961 (2) 1.393 61 1.3933 (2) 0.7920 1.391 45 0.7868 1.389 29 0.8066 0.8063 (4) 1.397 06 1.3974 (4) 0.8025 0.8026 (2) 1.395 30 1.3950 (2) 0.7987 1.393 42 0.7938 1.391 55
an accuracy of f0.0005 g. The densities were obtained with a Robertson specific gravity bottle (3) with an accuracy of fO.OOO1 g cm3. In making determinations, we maintained the pycnometer in a bath until two consecutive measurements of the liquid height in the capillary indicated that the sample had reached the temperature of the bath.
Refracthre indexes for the sodium D line of the pure compo- nents and mixtures were measured with a Jena dipping re- fractometer with an accuracy of f0.00002. In both cases, a thermostatically controlied bath, constant to 0.01 O C , was used.
Results and Discusslon
The density data at 20, 25, 30, and 35 OC for the system methyl isobutyl ketone-2-butanol are given in Table 11. The
0 1980 American Chemical Society
Journal of Chemical and Engineering Data, Vol. 25, No. 4, 1980 310
4 -\o 0 : 0 0 0 0 0
o : o i a o g
x : 0 2 0 1 s 0 : 0 3 0 0 0 A : 0 4 0 1 4
: 0 S 0 5 2
Ln f
: 0 6 0 i a
: 0 . 3 0 0 2
- 022 0
-0230 -
- 0 . 2 2 5 -
- 0 2 4 0 - - 1 1
2 0 25 30 3; t ( O C 1
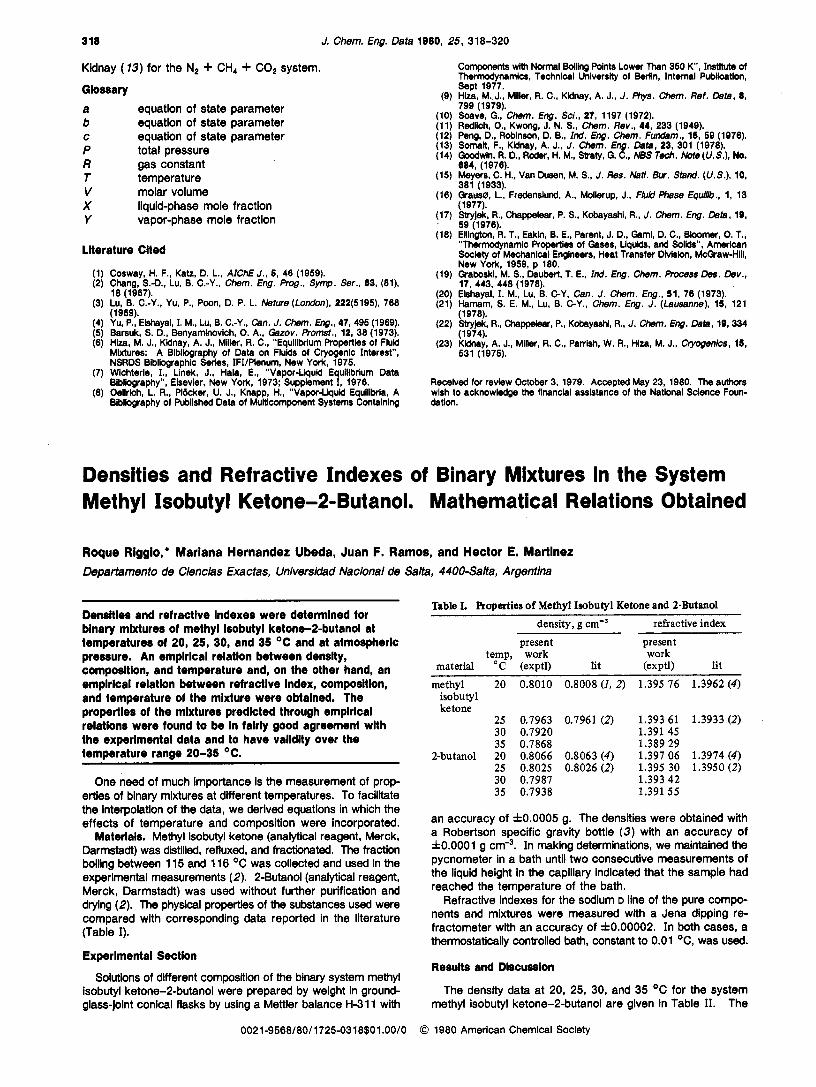
Flguro 1. Mixture densities vs. temperature.
Table 11. Density Data for the Mixtures at 20,25,30, and 35 "C 20 "C 25 "C
XMik Pexptl Pcalcd 10zE% Pexptl Pcalcd 10'E% 0.0000 0.8066 0.8069 3.71 0.8025 0.8026 1.2 0.1009 0.8048 0.8046 2.5 0.8005 0.8001 5.0 0.2015 0.8034 0.8030 5.0 0.7992 0.7984 10.0 0.3000 0.8025 0..8019 7.5 0.7981 0.7973 10.0 0.4014 0.8018 0,,8012 7.5 0.7970 0.7965 6.3 0.5052 0.8012 0.8009 3.7 0.7964 0.7962 8.8 0.6018 0.8006 0..8008 2.5 0.7962 0.7961 1.3 0.7031 0.8004 0.8009 6.3 0.7959 0.7961 2.5 0.8002 0.8006 0.8009 3.7 0.7956 0.7962 7.5 0.9079 0.8008 0.8009 1.2 0.7960 0.7962 2.5 1.0000 0.8010 0.8007 3.7 0.7963 0.7959 5.0
30°C 35 "C
XMik PexDtl P d c d 1O2E% PexDtl Pcalcd 10zE% 0.0000 0.1009 0.201 5 0.3000 0.4014 0.5052 0.6018 0.7031 0.8002 0.9079 1 .oooo
0.7987 0.7966 0.7949 0.7938 0.7930 0.7924 0.7917 0.7916 0.7915 0.7917 0.7920
0.7983 0.7957 0.7938 0.7926 0.7918 0.7915 0.7914 0.7914 0.7915 0.7915 0.'7912
5.0 11.3 13.8 15.1 11.3 13.3 3.8 2.5 0 .o 2.5
10.1
0.7938 0.7910 0.7897 0.7884 0.7875 0.7868 0.7866 0.7862 0.7860 0.7864 0.7868
0.7941 0.7913 0.7893 0.7880 0.7871 0.7868 0.7867 0.7867 0.7868 0.7868 0.7865
3.8 3.8 5.1 5.1 5.1 0.0 1.3 6.3
10.2 5.1 3.8
Table III. Refractive Index Data for the Mktures at 20,25,30, and 35 C
20 "C 25 "C
xMi k
0.0000 0.1028 0.21 31 0.2934 0.4034 0.5008 0.601 3 0.6991 0.7979 0.8998 1 .oooo
"Dexptl
1.39706 1.39654 1.39611 1.39594 1.39579 1.39559 1.39544 1.39546 1.39543 1.39560 1.39576
10ZE - " h l c d % "Dexptl
1.39703 0.5 1.39530 1.39632 1.6 1.39450 1.39605 0.4 1.39395 1.39583 0.8 1.39374 1.39565 1.0 1.39345 1.39563 0.3 1.39336 1.39553 0.6 1.39330 1.39564 1.3 1.39321 1.39570 1.9 1.39330 1.39577 1.2 1.39343 1.39579 0.2 1.39361
102E "Dcalcd % 1.39530 0.0 1.39428 1.6 1.39396 0.1 1.39368 0.4 1.39346 0.1 1.39343 0.5 1.39333 0.2 1.39345 1.7 1.39353 1.6 1.39360 1.2 1.39364 0.2
XMik
0.0000 0.1028 0.2131 0.2934 0.4034 0.5008 0.6013 0.6991 0.7979 0.8998 1.0000
30 "C 35 "C
"Dexptl
1.39342 1.39259 1.39194 1.39164 1.39132 1.39114 1.39108 1.391 06 1.39117 1.391 31 1.39145
10ZE nIlcal& % - 1.39347 0.4 1.39226 2.4 1.39187 0.5 1.39154 0.7 1.39127 0.4 1.39122 0.6 1.39113 0.4 1.39126 1.4 1.39135 1.3 1.39145 1.0 1.39149 0.3
"Dexptl
1.39155
1.38987 1.38943 1.38912 1.38901 1.38885 1.38886 1.38891 1.38906 1.38929
1.39063
10'E "Dcdcd % 1.39165 0.7 1.39024 2.8 1.38979 0.6 1.38940 0.2 1.38909 0.2 1.38902 0.1 1.38893 0.6 1.38901 1.1 1.38918 1.9 1.38929 1.6 1.38934 0.4
refractive index data for this system are given in Table 111. The following functional relationship between densities of the mixtures and temperature was assumed:
p = A b
Density data of the mixture are plotted against t in Figure 1, keeping the molar fraction of methyl isobutyl ketone as a pa-
X
0 1 0 2 0 3 04 0 5 0.6 a7 nu 09 1.0
X Mik
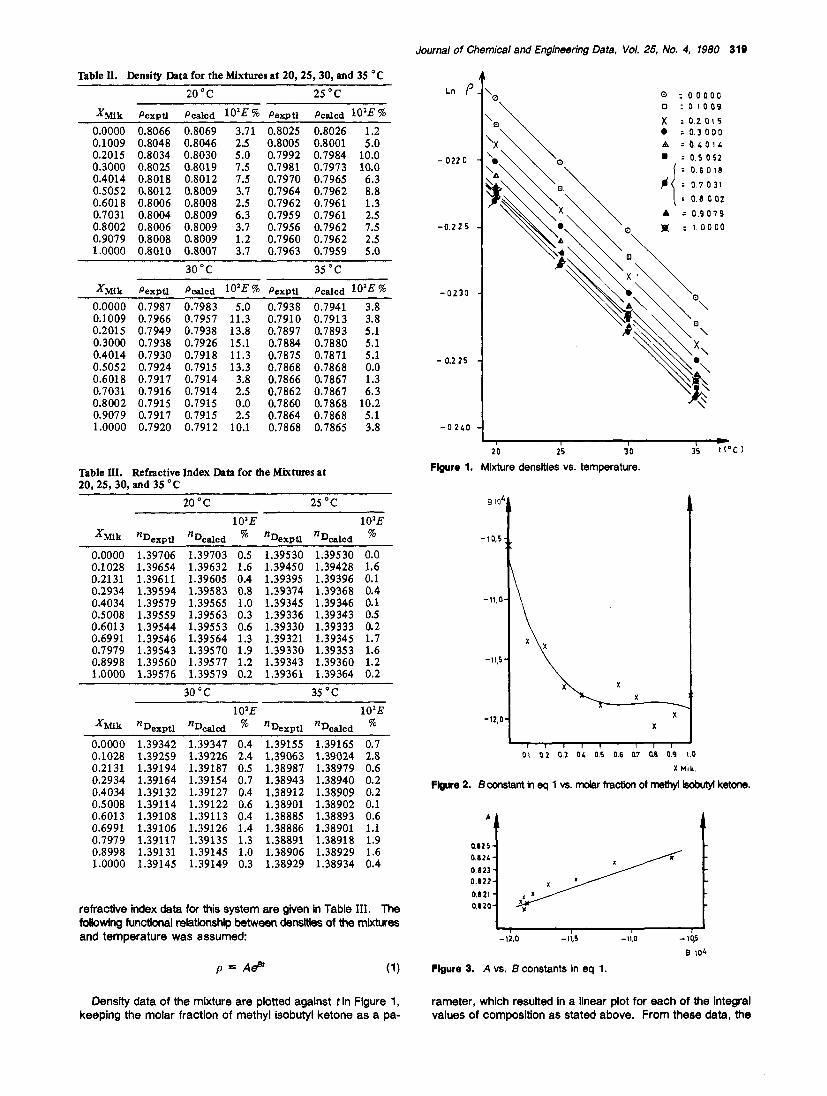
Flgure 2. B constant in eq 1 vs. molar fraction of methyl isobutyl ketone.
0.825 0.824 0 .823 0 .822 0.821 0.820
-11.0 -11.5 -11,0 - lO,5
B 104
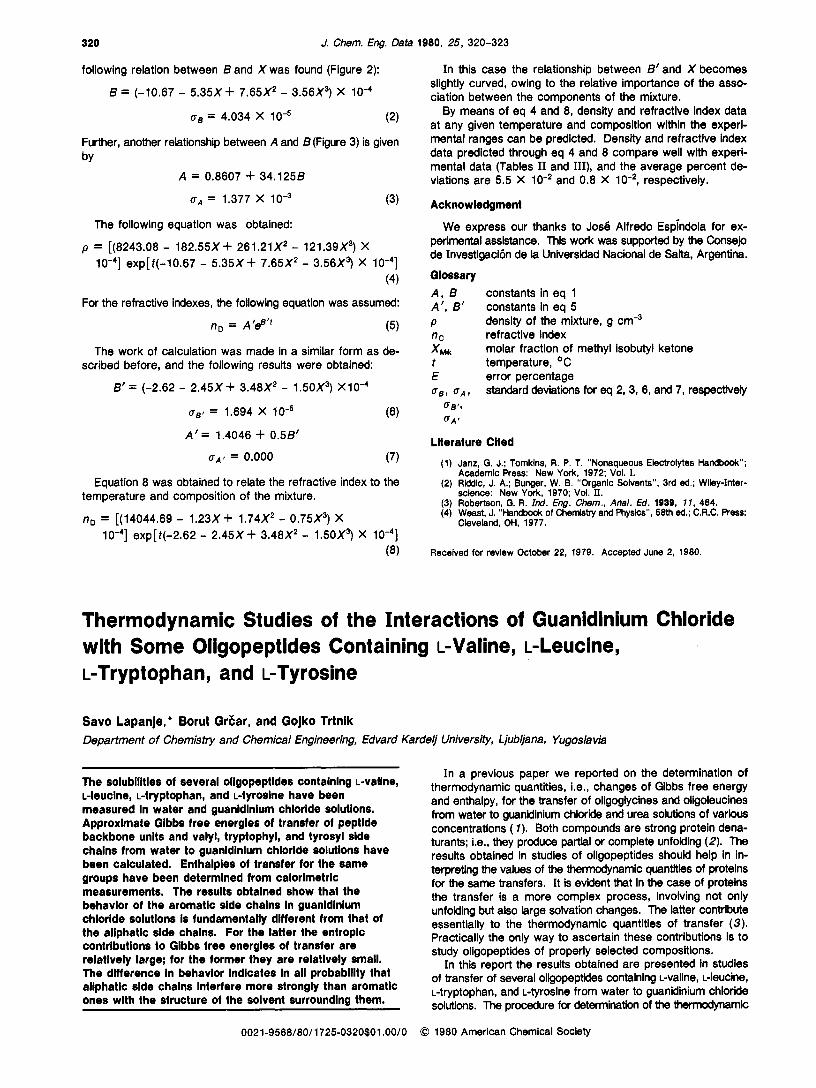
Flgure 3. A vs. B constants in eq 1.
rameter, which resulted in a linear plot for each of the integral values of composition as stated above. From these data, the
320
following relation between B and X was found (Figure 2):
J. Chern. Eng. Data 1980, 25, 320-323
In this case the relationship between B'and X becomes
B = (-10.67 - 5.35X+ 7.65X2 - 3.56X3) X lo-'
oB = 4.034 X (2)
Further, another relationship between A and B (Figure 3) is given
A = 0.8607 + 34.1258 by
bA = 1.377 x 10⁻³ (3)
The following equation was obtained:
p = [(8243.08 - 182.55X+ 261.21X2 - 121.39X3) X exp[t(-10.67 - 5.35X+ 7.65X2 - 3.56X3) X
(4)
For the refractive indexes, the following equation was assumed:
nD = A'#'' (5)
The work of calculation was made in a similar form as de- scribed before, and the following results were obtained:
B'= (-2.62 - 2.45X+ 3.48X2 - 1.50X3) XlO-'
UBt = 1.694 x 10⁻⁵ (6)
A ' = 1.4046 + 0.58'
UAl = 0.000 (7)
Equation 8 was obtained to relate the refractive index to the temperature and composition of the mixture.
nD = [(14044.69 - 1.23X+ 1.74X2 - 0.75X3) X exp[t(-2.62 - 2.45X+ 3.48X2 - 1.50X3) X
(8)
slightly curved, owing to the relative importance of the asso- ciation between the components of the mixture.
By means of eq 4 and 8, density and refractive index data at any given temperature and composition within the experi- mental ranges can be predicted. Density and refractive index data predicted through eq 4 and 8 compare well with experi- mental data (Tables I1 and HI), and the average percent de- viations are 5.5 X and 0.8 X respectively.
Acknowledgment
We express our thanks to Jose Alfredo Esphdola for ex- perimental assistance. This work was supported by the Consejo de Investigacidn de la Universidad Nacional de Salk, Argentina.
Glossary constants in eq 1 constants in eq 5 density of the mixture, g ~ m - ~ refractive index molar fraction of methyl isobutyl ketone temperature, O C
error percentage standard deviations for eq 2,3,6, and 7, respectively
Literature Cited
(1) Janr, 0. J.; Tomkins, R. P. T. "Nonaqueous Electrolytes Handbook";
(2) Rlddlc, J. A.; Bunger, W. B. "Organic Solvents", 3rd ed.; Wlley-lnter-
(3) Robertson, G. R. Ind. €ng. Cbem., Anal. Ed. 1939, 7 7 , 464. (4) Weast, J. "Handbook of Chemistry and Physlcs", 58th ed.; C.R.C. Press:
Academic Press: New York, 1972; Vol. 1.
science: New York, 1970; Voi. 11.
Cleveland, OH, 1977.
Received for revlew October 22, 1979. Accepted June 2, 1980.
Thermodynamic Studies of the Interactions of Guanidinium Chloride with Some Oligopeptides Containing L-Valine, L-Leucine, L-Tryptophan, and L-Tyrosine
Savo Lapanje," Borut GrEar, and Gojko Trtnik Department of Chemistry and Chemical Engineering, Edvard Kardelj University, Ljubljana, Yugoslavia
The solubllltles of several oligopeptides contalnlng L-vallne, L-leucine, L-tryptophan, and L-tyroslne have been measured In water and guanldlnium chloride solutlons. Approxlmate Glbbs free energles of transfer of peptlde backbone units and valyl, tryptophyl, and tyrosyl slde chains from water to guanldlnium chloride solutlons have been calculated. Enthalpies of transfer for the same groups have been determined from calorlmetrlc measurements. The results obtalned show that the behavior of the aromatic slde chalns in guanldlnlum chlorlde solutlons is fundamentally different from that of the aliphatic slde chalns. For the latter the entropic contrlbutlons to Gibbs free energles of transfer are reiatlvely large; for the former they are relatively small. The difference In behavior indicates In ail probability that allphatic side chains Interfere more strongly than aromatic ones with the structure of the solvent surrounding them.
In a previous paper we reported on the determination of thermodynamic quantities, Le., changes of Gibbs free energy and enthalpy, for the transfer of oligoglycines and oligoleucines from water to guanidinium chloride and urea solutions of various concentrations ( 7). Both compounds are strong protein dena- turants; i.e., they produce partial or complete unfolding (2). The results obtained in studies of ollgopeptides should help in in- terpreting the values of the thermodynamic quantities of proteins for the same transfers. It is evident that in the case of proteins the transfer is a more complex process, involving not only unfolding but also large solvation changes. The latter contribute essentially to the thermodynamic quantities of transfer (3). Practically the only way to ascertain these contributions Is to study ollgopeptides of properly selected compositions.
In this report the results obtained are presented in studies of transfer of several oligopeptides containing L-valine, L-leucine, L-tryptophan, and L-tyrosine from water to guanidinium chloride solutions. The procedure for determination of the thermodynamic
0021-9568/80/1725-0320$01.00/0 0 1980 American Chemical Society