dense molecular gas tracers in the outflow of the
TRANSCRIPT

Dense Molecular Gas Tracers in the Outflow of the Starburst Galaxy NGC 253
Fabian Walter1,2,3, Alberto D. Bolatto4,5, Adam K. Leroy6, Sylvain Veilleux4, Steven R. Warren4,7, Jacqueline Hodge8,Rebecca C. Levy4, David S. Meier2,9, Eve C. Ostriker10, Jürgen Ott2, Erik Rosolowsky11, Nick Scoville3, Axel Weiss12,
Laura Zschaechner1, and Martin Zwaan131 Max Planck Institute für Astronomie, Königstuhl 17, D-69117, Heidelberg, Germany
2 National Radio Astronomy Observatory, P.O. Box O, 1003 Lopezville Road, Socorro, New Mexico 87801, USA3 Astronomy Department, California Institute of Technology, MC105-24, Pasadena, California 91125, USA
4 Department of Astronomy, Laboratory for Millimeter-wave Astronomy, and Joint Space Institute, University of Maryland, College Park, Maryland 20742, USA5 Visiting, Max-Planck Institute for Astronomy, Heidelberg, Germany
6 Department of Astronomy, Ohio State University, 100 W 18th Avenue, Columbus, OH 43210, USA7 Cray, Inc., 380 Jackson Street, Suite 210, St. Paul, MN 55101, USA8 Leiden Observatory, Niels Bohrweg 2, 2333 CA Leiden, Netherlands
9 New Mexico Institute of Mining & Technology, 801 Leroy Place, Socorro, NM 87801, USA10 Department of Astrophysical Sciences, Princeton University, Princeton, New Jersey 08544, USA
11 Department of Physics, University of Alberta, Edmonton, AB, Canada12 Max-Planck-Institut für Radioastronomie, Auf dem Hügel 69, Bonn, Germany
13 European Southern Observatory, Karl-Schwarzschild-Strasse 2, D-85748 Garching, GermanyReceived 2016 August 8; revised 2016 December 16; accepted 2016 December 28; published 2017 February 1
Abstract
We present a detailed study of a molecular outflow feature in the nearby starburst galaxy NGC 253 using ALMA.We find that this feature is clearly associated with the edge of NGC 253ʼs prominent ionized outflow, has aprojected length of ∼300 pc, with a width of ∼50 pc, and a velocity dispersion of ∼40 km s−1, which isconsistentwith an ejection from the disk about 1 Myr ago. The kinematics of the molecular gas in this feature can beinterpreted (albeit not uniquely) as accelerating at a rate of 1 km s−1 pc−1. In this scenario, the gas is approachingan escape velocity at the last measured point. Strikingly, bright tracers of dense molecular gas (HCN, CN, HCO+,CS) are also detected in the molecular outflow: we measure an HCN(1–0)/CO(1–0) line ratio of 1 10 in theoutflow, similar to that in the central starburst region of NGC 253 and other starburst galaxies. By contrast, theHCN/CO line ratio in the NGC 253 disk is significantly lower ( 1 30), similar to other nearby galaxy disks. Thisstrongly suggests that the streamer gas originates from the starburst, and that its physical state does not changesignificantly over timescales of ∼1Myr during its entrainment in the outflow. Simple calculations indicate thatradiation pressure is not the main mechanism for driving the outflow. The presence of such dense material inmolecular outflows needs to be accounted for in simulations of galactic outflows.
Key words: galaxies: individual (NGC 253) – galaxies: ISM – galaxies: starburst – ISM: jets and outflows
1. Introduction
Galactic-scale winds are aubiquitous phenomenon in bothstarburst galaxies and galaxies that host active galactic nuclei(e.g., Veilleux et al. 2013). They are thought to be especiallyimportant at high redshift, where strongly star-forming galaxieson the so-called galaxy “main-sequence” dominate the starformation budget, and the number density of active galacticnuclei is greater. Winds provide negative mechanical feed-backand have been invoked to resolve a number of importantissues in cosmology and galaxy evolution (see,e.g., Veilleuxet al. 2005 for a review). Although galactic winds have beendetected in galaxies out to high redshift, only in the nearbyuniverse can they be observed panchromatically in emission tounderstand the mechanisms responsible for ejecting the gas.Steadily expanding observations and simulations show thatwinds include cold (neutral atomic and molecular) gascomponents, both in starburst-driven as well as AGN-drivenoutflows (e.g., in the case of M82: Walter et al. 2002;Engelbracht et al. 2006; Roussel et al. 2010; Leroy et al. 2015a,other galaxies: e.g., Rupke et al. 2002; Alatalo et al. 2011;Aalto et al. 2012; Meier & Turner 2012; Rupke &Veilleux 2013), possibly through the entrainment of ambientmaterial. This cold gas is very difficult to measure, but likelyconstitutes the mass-dominant phase in galactic winds.
Mechanisms that have been proposed to drive cool windsinclude direct radiation forces (e.g., Murray et al. 2011),cosmic-ray pressure gradients (e.g., Uhlig et al. 2012), pressuredue to supernovae-driven superbubbles (Fujita et al. 2009;Bolatto et al. 2013), and progressive entrainment into theionized flow facilitated by Kelvin–Helmholtz instabilities(Heckman et al. 2000). Recent models suggest that the coldgas could also be emerging from condensations of the hotionized gas phase through runaway thermal instabilities (e.g.,Faucher-Giguère & Quataert 2012; Nayakshin & Zubovas2012; Zubovas & King 2012; Bustard et al. 2016; Thompsonet al. 2016). The latter predictions imply a small spatial offsetbetween the hot burst and the emergence of cold materialcondensing out of the wind. In most cases, observationalconstraints on the velocity of the outflowing gas, both neutraland ionized, indicate that the gas does not reach the escapevelocity (above references), i.e., that the currently outflowinggas may be re-accreted at later cosmic times.NGC 253 is one of the best laboratories to study starburst-
driven galactic-scale winds in detail due to its proximity(D=3.5Mpc, Rekola et al. 2005). It is known for the galacticwind emerging from its central ∼200 pc (e.g., Sharp & Bland-Hawthorn 2010). The wind is seen in Hα and X-ray emission(Strickland et al. 2000, 2002; Westmoquette et al. 2011), inneutral gas (Heckman et al. 2000), warm H2 (Veilleux et al.
The Astrophysical Journal, 835:265 (10pp), 2017 February 1 doi:10.3847/1538-4357/835/2/265© 2017. The American Astronomical Society. All rights reserved.
1

2009), and in OH emission and absorption (Turner 1985; Sturmet al. 2011). HST imaging reveals the entrained dust emissionin optical broadband imaging, already suggesting that the windalso carries significant amounts of molecular gas.
ALMA cycle0 imaging revealed the molecular wind inNGC 253 in CO(1–0) emission (Bolatto et al. 2013). Thismolecular wind carries enough mass to substantially shortenthe current star formation episode in this galaxy, or todefinitively quench star formation over a much longer periodif a substantial fraction of the gas were to reach escape velocity.In the interferometer imaging, the wind breaks up intomolecular filaments or “streamers” emerging from the centralstarburst area. The brightest of these streamers is west of thecentral starburst and points to the south outlining an edge of theapproaching side of the approximately conical ionized outflow(Westmoquette et al. 2011); we hereafter refer to it as the(southwest) SW streamer. In Meier et al. (2015),we present acartoon of the central starburst region of NGC 253and discussother tracers of the molecular gas found in the central starburstregion of NGC 253, while in Leroy et al. (2015b) we focus onthe properties of the giant molecular clouds and the structure ofthe starburst itself.
In this study, we present and discuss the properties of thisbrightest outflowing molecular gas streamer, as obtained fromthe combined cycle0 and1 ALMA observations together withnew IRAM single-dish data. This paper is structured asfollows.Section 2 summarizes the interferometric, single-dish,and Hubble Space Telescope observations, and Section 3shows the results. In Section 3, we present a discussion of ourfindings, and Section 4 summarizes our conclusions. Weassume a distance to NGC 253 of D=3.5 Mpc (Rekola et al.2005), leading to a linear (projected) scale of 1″=17 pc.
2. Observations
2.1. ALMA Observations
The data presented here are based on ALMA cycle 0 and 1observations and include IRAM 30 m and Mopra single dishobservations to account for the missing short spacings in theinterferometric ALMA imaging.
Two frequency setups were observed in ALMA band 3, onehigh-frequency setup (LSB: 99.8–103.7 GHz; USB:111.8–115.7 GHz), that covers the (redshifted) CO(1–0) andCN lines, and one low-frequency setup (LSB: 85.6–89.6 GHz;USB: 97.4–101.4 GHz) that covers key high-density tracermolecules, such as HCN, HNC, and HCO+ (see Meier et al.2015 for a full overview of all transitions covered by theobservations). Additional details about the ALMA observationsand reduction can be found in Bolatto et al. (2013), Leroy et al.(2015b), and Meier et al. (2015). The ALMA band 3interferometric observations include the following.
ALMA high-frequency setup:aseven-point mosaic targetingthe CO(1–0) line to map the central 1 kpc (∼1′) of NGC 253 inthe CO(1–0) transition. These observations used the followingcalibrators: J0038-2459 (phase), J2357-5311 (bandpass), andUranus (amplitude). Cycle 1 observations were obtained on2013 November 19, 2013 December 01, and (twice) on 2013December 02. The total on-source integration time was 2.5 hr,using typically 36 antennas. These observations were com-plemented by a 2.6 hr, seven-pointing mosaic with the ALMAcompact array (ACA) covering ∼2′× 2′ (2× 2 kpc) at 75 pcresolution (cycle 1). These ACA observations used the
following calibrators: J0038-2459 (phase), J2258-2758 (band-pass),and Neptune (amplitude). The ACA observations wereexecuted on 2013 October 07, twice on 2013 November 01,three times on 2013 November 05, three times on 2013November 06, and onceon 2013 November 14. The ACAobservations were obtained using nineantennas.ALMA Low-frequency setup:athree-pointing mosaic at
90 GHz along the NGC 253 bar (cycle 1), targeting the high-dipole molecules CS(2–1), HCN(1–0), HCO+(1–0), and a hostof other molecules contained in the band (Meier et al. 2015).These observations used the following calibrators: J0038-2459(phase), J2258-2758 (bandpass), and Neptune (amplitude).Observations were done on 2014 August 31, with a total of27.5 minutes on-source using 32 antennas.The cycle1 data were combined with the cycle0 data
published in Bolatto et al. (2013) and Meier et al. (2015), andthe combined data were used in the analysis by Leroy et al.(2015b). Because the continuum in the NGC 253 starburst isvery bright, it is possible to self-calibrate on it. We applied self-calibration to remove residual phase and flux calibration errorsinherent to the data and attain a dynamic range higher thanotherwise possible. Phase information using the continuumwere self-calibrated first followed by amplitude self-calibration.Natural and Briggs robust-weighted, continuum-subtracted,
cubes were created at 5 km s−1 velocity resolution. All valueswere primary beam corrected for all quantitative analyses. As afinal step, for all comparisons, we convolve the low- and high-frequency setups to a common beam size of 1 9 (32 pc). Thefinal robust-weighed CO(1–0) cube has an rms of1.6 mJy beam−1 in 5 km s−1 channels and a beam size of1 6×1 2 with PA of 71 .5. In velocity ranges where asignalis present, deconvolution artefacts dominate the noise (despiteself-calibration and careful cleaning the data is dynamic-rangelimited), and the practical noise floor is closer to6.5 mJy beam−1. For the HCN, CN, CS, and HCO+ lines, therms is 1 mJy beam−1 for a 1 9×1 9 beam.
2.2. Single Dish Observations
In the absence of ALMA total power measurements, we havecorrected the ALMA interferometric imaging for zero spacingsusing the following single dish telescopes.Mopra: We use measurements obtained by the Mopra
telescope to correct the ALMA CO(1–0) observations (high-frequency setup), as discussed in Bolatto et al. (2013),Meieret al. (2015), and Leroy et al. (2015b).IRAM 30 m: We use new IRAM 30 m telescope measure-
ments to correct the high-density tracer molecules (low-frequency setup). These observations cover all relevant tracermolecules, e.g., HCN, HCO+, andCS (project 209-14 during2015 March 4–9). NGC 253 was above 20° for ∼4.5 hr eachday, resulting in a total of 12.6 hr of on-source time withexceptional observing conditions. To map a 2 2 fieldaround the center of NGC 253 with uniform sensitivity, weobtained 36 back and forth on-the-fly scan-maps with 4″spacing, alternating both R.A. and decl. We used the E090HIGHDENS receiver setup spanning 81.335–89.335 GHz inthe LSB and 97.335–105.335 GHz in the USB, allowing forsimultaneous observations of high-density tracers includingHCO+, HCN, and CS. We observed Mars for pointing, focus,and calibration. The map has a sensitivity of 4 mK in a3 km s−1 channel at 89 GHz. The frequency-dependent beamsize ranges from 26″ to 29″.
2
The Astrophysical Journal, 835:265 (10pp), 2017 February 1 Walter et al.
In the case of CO(1–0), we combined the ALMA cube withthe Mopra single dish data using the feathering Miriad taskimmerge with a gain of 16.2 Jy/K. The resulting cube wasused as the model input in the CASA clean task on theALMA-only data. We combined zero-spacings for the high-density tracer observations from the IRAM 30 m telescope withthe ALMA cubes using the CASA task feather. For theALMA-IRAM30 m combination, prior to feathering, weapplied a gain factor of 6.15 Jy/K on the 30 m cubes. As inthe CO(1− 0) combination, the final cubes were created usingthe feathered cubes as models for the inversion of the ALMAdata. This was done by including the feathered cubes as modelsin the ALMA data set using setjy, followed by clean usingthe same parameters as those used to create the original ALMAcubes. In both cases, this zero spacing correction significantlyimproved the negative bowls in the original (ALMA 12 monly) data cubes.
2.3. Hubble Space Telescope Observations
We compare our ALMA observations to the ionized gasoutflow, traced by Hubble Space Telescope imaging ofhydrogen recombination lines. We use a WFPC2 Hα imagefrom Proposal ID 5211, first presented in Watson et al. (1996).That project observed NGC 253 in the F656N (on) and F675W(off) filters. We pair this with Paschen-β imaging from twoprojects (Proposal IDs 12206 and 13730), which observed thenuclear region in the F128N (on) and F130N (off) filters. Inboth cases, we use the Hubble legacy archive enhanced dataproducts, beginning with the drizzled images. For the Hα,wefound it necessary to combine the two visits to reject cosmic-ray artifacts. Then, for both sets of images, we aligned the on-and off-line filters and fit a median scaling between the two in aregion near but not in the nucleus. The scaling factor derivedwas 0.0241 and 0.95 for F675W and F130N, respectively. Weused this scaling to subtract the stellar contamination from the
narrow-band online image. We then converted the resultingcontinuum-subtracted image to have units of erg s−1 cm−2 sr−1
using the observatory supplied counts-to-flux conversion(PHOTFLAM keyword) and bandpass width (PHOTBW key-word). The values employed for Hα and Paschen-β were1.461 10 16 and 4.278 10 19 for PHOTFLAM, and 53.768and 357.438 for PHOTBW, respectively. Finally, both imageswere convolved to 1 5 resolution and aligned to the ALMAastrometric grid.
3. Results and Discussion
3.1. CO(1–0) Map of the Full FOV
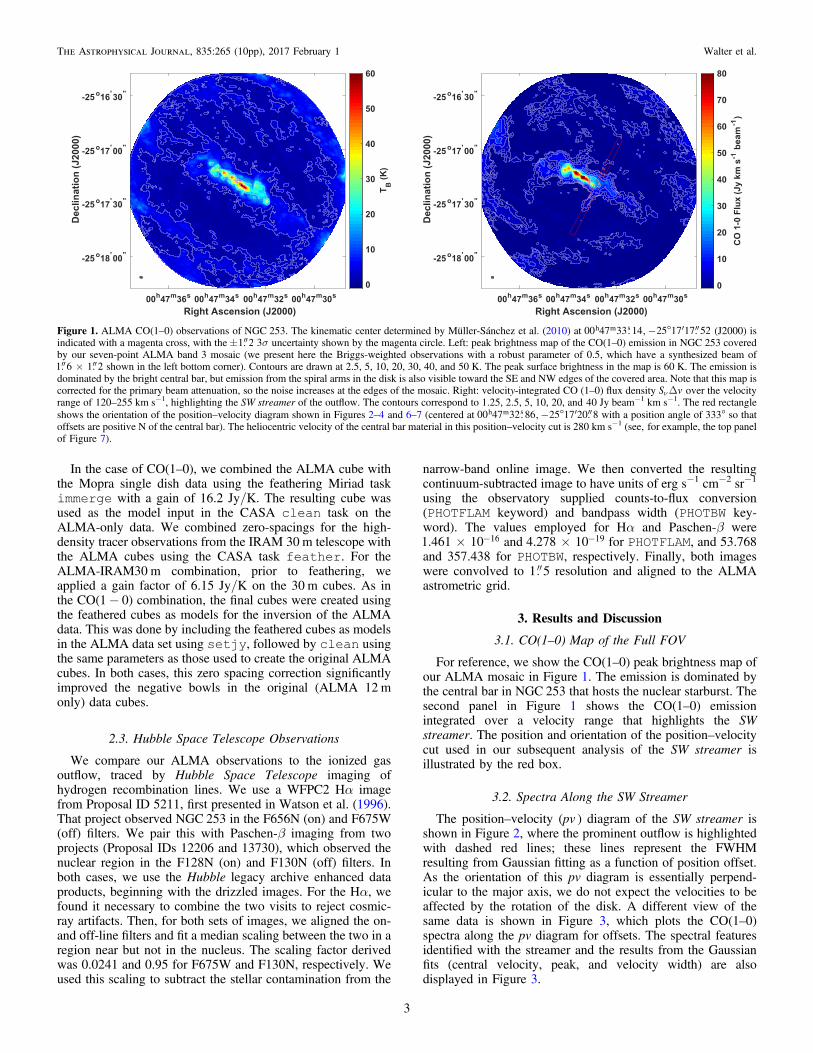
For reference, we show the CO(1–0) peak brightness map ofour ALMA mosaic in Figure 1. The emission is dominated bythe central bar in NGC 253 that hosts the nuclear starburst. Thesecond panel in Figure 1 shows the CO(1–0) emissionintegrated over a velocity range that highlights the SWstreamer. The position and orientation of the position–velocitycut used in our subsequent analysis of the SW streamer isillustrated by the red box.
3.2. Spectra Along the SW Streamer
The position–velocity (pv ) diagram of the SW streamer isshown in Figure 2, where the prominent outflow is highlightedwith dashed red lines; these lines represent the FWHMresulting from Gaussian fitting as a function of position offset.As the orientation of this pv diagram is essentially perpend-icular to the major axis, we do not expect the velocities to beaffected by the rotation of the disk. A different view of thesame data is shown in Figure 3, which plots the CO(1–0)spectra along the pv diagram for offsets. The spectral featuresidentified with the streamer and the results from the Gaussianfits (central velocity, peak, and velocity width) are alsodisplayed in Figure 3.
Figure 1. ALMA CO(1–0) observations of NGC 253. The kinematic center determined by Müller-Sánchez et al. (2010) at 00 47 33. 14h m s , 25 17 17. 52 (J2000) isindicated with a magenta cross, with the 1. 2 3 uncertainty shown by the magenta circle. Left: peak brightness map of the CO(1–0) emission in NGC 253 coveredby our seven-point ALMA band3 mosaic (we present here the Briggs-weighted observations with a robust parameter of 0.5, which have a synthesized beam of1. 6 1. 2 shown in the left bottom corner). Contours are drawn at 2.5, 5, 10, 20, 30, 40, and 50 K. The peak surface brightness in the map is 60 K. The emission isdominated by the bright central bar, but emission from the spiral arms in the disk is also visible toward the SE and NW edges of the covered area. Note that this map iscorrected for the primary beam attenuation, so the noise increases at the edges of the mosaic. Right: velocity-integrated CO (1–0) flux density S v over the velocityrange of120–255 km s−1, highlighting the SW streamer of the outflow. The contours correspond to 1.25, 2.5, 5, 10, 20, and40 Jy beam−1 km s−1. The red rectangleshows the orientation of the position–velocity diagram shown in Figures 2–4and 6–7 (centered at 00 47 32. 86h m s , 25 17 20. 8 with a position angle of 333° so thatoffsets are positive N of the central bar). The heliocentric velocity of the central bar material in this position–velocity cut is 280 km s−1 (see,for example, the top panelof Figure 7).
3
The Astrophysical Journal, 835:265 (10pp), 2017 February 1 Walter et al.

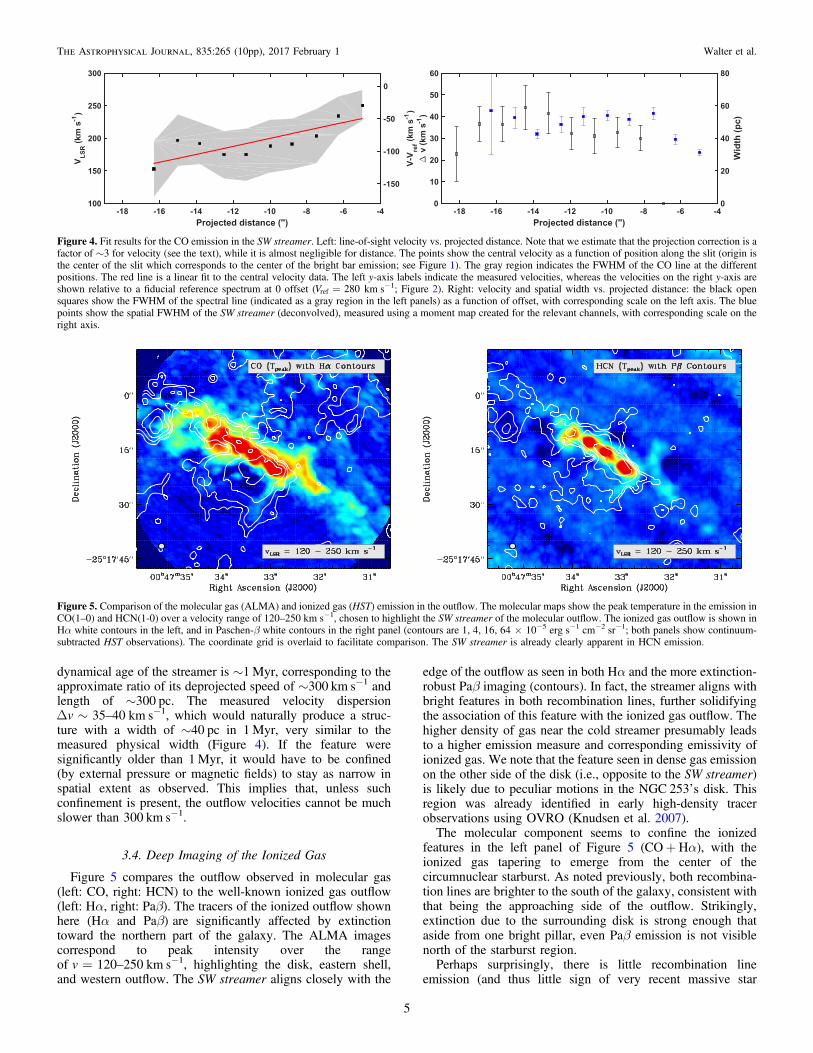
The Gaussian fitting results are summarized in Figure 4. Theleft panel shows the central velocity and FWHM velocity width( v) of the emission as a function of position along the pv
diagram. A first-order polynomial fit to the central velocity as afunction of position is overplotted as a red line. The right panelshows the velocity and deconvolved (by subtracting the beamsize in quadrature) FWHM spatial width as a function ofposition: the outflow has a deconvolved FWHM width ofapproximately 40–50 pc. The reference velocity is indicated bya dashed white line in Figure 2. It corresponds to theapproximate gas velocity of the bar at the base of the outflow.
3.3. Is the Molecular Outflow Accelerating?
The SW streamer is blueshifted with respect to the referencevelocity, implying that the material is approaching us. Thisblueshift gets larger with increasing distance from the galaxyplane, which can be interpreted as an accelerating continuousoutflow. This interpretation of the data is, however, not unique.If the original ejection occurred over a short period of time andhad a distribution of velocities, the fast ejecta would havegotten farther away than the slower ejecta, giving rise to avelocity gradient along the streamer. The apparent projectedvelocity gradient could also be due to a gradient in theinclination of the outflow cone, with the (more or less) constantvelocity of CO gas becoming increasingly aligned with the lineof sight at farther distances from the central bar. Such geometryhas been reported in the ionized gas of the bubble of NGC 3079(e.g., Veilleux et al. 1994; Cecil et al. 2001). The ionizedoutflow of NGC 253, however, seems more like an open-endedcone than a bubble (Westmoquette et al. 2011), suggesting thatthis explanation is probably less likely.The translation of observed line-of-sight velocities into
actual velocities is crucial to determine the mass outflow rateand whether the material escapes the galaxy or not. Theinclination of the galaxy is 78° (Westmoquette et al. 2011), sothe projected edge of the southern outflow cone will have aninclination of –78 90 12 , where the negative signindicates thatit is pointing toward us, resulting in blueshiftedemission. If the emission originates precisely from thisprojected edge, the isin correction would be very large (afactor of ∼5). Based on the median of the distribution of itanfor the surface of a cone with the opening angle and orientationas determined by Westmoquette et al. (2011) for the ionizedgas outflow, Bolatto et al. (2013) argue that a correction factorof approximately threeis more likely, and we adopt that valuehere. Note that, in practice, the actual factor can range from ∼1to so the projection correction has large uncertainties.We measure a gradient of dv/dr=6.1 km s−1/[″] or
∼36 km s−1/[100 pc] from the polynomial fitting shown inFigure 4 (the symmetric ordinary-least-squares bisector yields a25% higher value). Adopting the aforementioned projectioncorrection factor of three,which includes both the correctionsfor distances and velocities, we derive an actual velocitygradient of ∼100 km s−1/[100 pc], or ∼1 km s−1/[pc]. Towardthe end of the detected outflow, we measure a line-of-sightoutflow speed, relative to our reference disk velocity, of120 km s−1. With the projection correction, this translates intoan actual outflow speed of ∼360 km s−1. The escape velocityof NGC 253 can be approximated using Equation (16) inRupke et al. (2002), and the circular velocity by Hlavacek-Larrondo et al. (2011). This yields an escape velocity of∼500 km s−1 (with significant error bars), i.e., the measuredoutflow velocity is approaching the escape velocity.The velocity dispersion and width of the SW streamer are
consistent with the dynamical age of the feature. The
Figure 2. Position–velocity CO(1–0) diagram along the slit shown in Figure 1(equivalent to a long-slit spectrum). The emission is dominated by the intenseemission from the central starburst region. The narrow features at offsetsof∼±20″ are due to molecular clouds in the galaxy’s rotating disk (labeleddisk cloud). The CO (1–0) outflow SW streamer (negative offsets) is alsolabeled. The white dashed line shows the adopted reference velocity foremission in the central bar at this location in the galaxy, of 280 km s−1. Thecontours indicate S of 0.09, 0.25, 0.49, 0.81, and 1.21 Jy beam−1. The colorscale uses a square root stretch, and the noise in the data is 1.6 mJy beam−1 inemission-free velocity ranges. A typical brightness for streamer materialbetween the dashed lines is 40–60 mJy beam−1.
Figure 3. CO(1–0) spectra along the southern part of the position–velocity cutin Figures 1 and 2, following the SW streamer. The colors indicate offsets fromthe plane, as indicated by the color bar to the right (spectra are offset verticallyby 0.05 Jy for display purposes). At small offsets, the emission is dominated bythe starburst in the central bar, and line splitting is observed for intermediateoffsets (–4″ to –10″). The diffuse molecular outflow is then picked up at vlsr200 km s−1, and can be traced out to offsets of –18″ (the horizontal and verticalbars indicate the Gaussian-fit FWHM, central velocity, and amplitudes in thestreamer). Given the low S/N of the three spectra at the largest offsets, we donot use their fits in our subsequent analysis. The narrow CO(1–0) featurearound vlsr 350 km s−1 is due to molecular gas emission from a GMC in thedisk of NGC 253, labeled in Figure 2 as “disk cloud.”
4
The Astrophysical Journal, 835:265 (10pp), 2017 February 1 Walter et al.
dynamical age of the streamer is ∼1Myr, corresponding to theapproximate ratio of its deprojected speed of ∼300 km s−1 andlength of ∼300 pc. The measured velocity dispersion
–v 35 40 km s−1, which would naturally produce a struc-ture with a width of ∼40 pc in 1Myr, very similar to themeasured physical width (Figure 4). If the feature weresignificantly older than 1Myr, it would have to be confined(by external pressure or magnetic fields) to stay as narrow inspatial extent as observed. This implies that, unless suchconfinement is present, the outflow velocities cannot be muchslower than 300 km s−1.
3.4. Deep Imaging of the Ionized Gas
Figure 5 compares the outflow observed in molecular gas(left: CO, right: HCN) to the well-known ionized gas outflow(left: Hα, right: Paβ). The tracers of the ionized outflow shownhere (Hα and Paβ)are significantly affected by extinctiontoward the northern part of the galaxy. The ALMA imagescorrespond to peak intensity over the rangeof –v 120 250 km s−1, highlighting the disk, eastern shell,and western outflow. The SW streamer aligns closely with the
edge of the outflow as seen in both Hα and the more extinction-robust Paβ imaging (contours). In fact, the streamer aligns withbright features in both recombination lines, further solidifyingthe association of this feature with the ionized gas outflow. Thehigher density of gas near the cold streamer presumably leadsto a higher emission measure and corresponding emissivity ofionized gas. We note that the feature seen in dense gas emissionon the other side of the disk (i.e., opposite to the SW streamer)is likely due to peculiar motions in the NGC 253ʼs disk. Thisregion was already identified in early high-density tracerobservations using OVRO (Knudsen et al. 2007).The molecular component seems to confine the ionized
features in the left panel of Figure 5 (CO+Hα), with theionized gas tapering to emerge from the center of thecircumnuclear starburst. As noted previously, both recombina-tion lines are brighter to the south of the galaxy, consistent withthat being the approaching side of the outflow. Strikingly,extinction due to the surrounding disk is strong enough thataside from one bright pillar, even Paβ emission is not visiblenorth of the starburst region.Perhaps surprisingly, there is little recombination line
emission (and thus little sign of very recent massive star
Figure 4. Fit results for the CO emission in the SW streamer. Left: line-of-sight velocity vs. projected distance. Note that we estimate that the projection correction is afactor of ∼3 for velocity (see thetext), while it is almost negligible for distance. The points show the central velocity as a function of position along the slit (origin isthe center of the slit which corresponds to the center of the bright bar emission; seeFigure 1). The gray region indicates the FWHM of the CO line at the differentpositions. The red line is a linear fit to the central velocity data. The left y-axis labels indicate the measured velocities, whereas the velocities on the right y-axis areshown relative to a fiducial reference spectrum at 0 offset (V 280ref km s−1; Figure 2). Right: velocity and spatial width vs. projected distance: the black opensquares show the FWHM of the spectral line (indicated as a gray region in the left panels) as a function of offset, with corresponding scale on the left axis. The bluepoints show the spatial FWHM of the SW streamer (deconvolved), measured using a moment map created for the relevant channels, with corresponding scale on theright axis.
Figure 5. Comparison of the molecular gas (ALMA) and ionized gas (HST) emission in the outflow. The molecular maps show the peak temperature in the emission inCO(1–0) and HCN(1-0) over a velocity range of 120–250 km s−1, chosen to highlight the SW streamer of the molecular outflow. The ionized gas outflow is shown inHα white contours in the left, and in Paschen-β white contours in the right panel (contours are 1, 4, 16, 64×10−5 erg s−1 cm−2 sr−1; both panels show continuum-subtracted HST observations). The coordinate grid is overlaid to facilitate comparison. The SW streamer is already clearly apparent in HCN emission.
5
The Astrophysical Journal, 835:265 (10pp), 2017 February 1 Walter et al.
formation) in the far western part of the disk. Also, we do notsee strong emission centered on the putative expandingmolecular shells identified in Sakamoto et al. (2006). Bolattoet al. (2013) argued that these shells are associated with themolecular streamers in the outflow and are presumably drivenby young stellar clusters of *M 105 M . If the shells aredriven by stellar feedback, the population driving them must beeither older than ∼5Myr or so embedded as to remaininconspicuous in the Paβ image.
3.5. Dense Gas in the Outflow
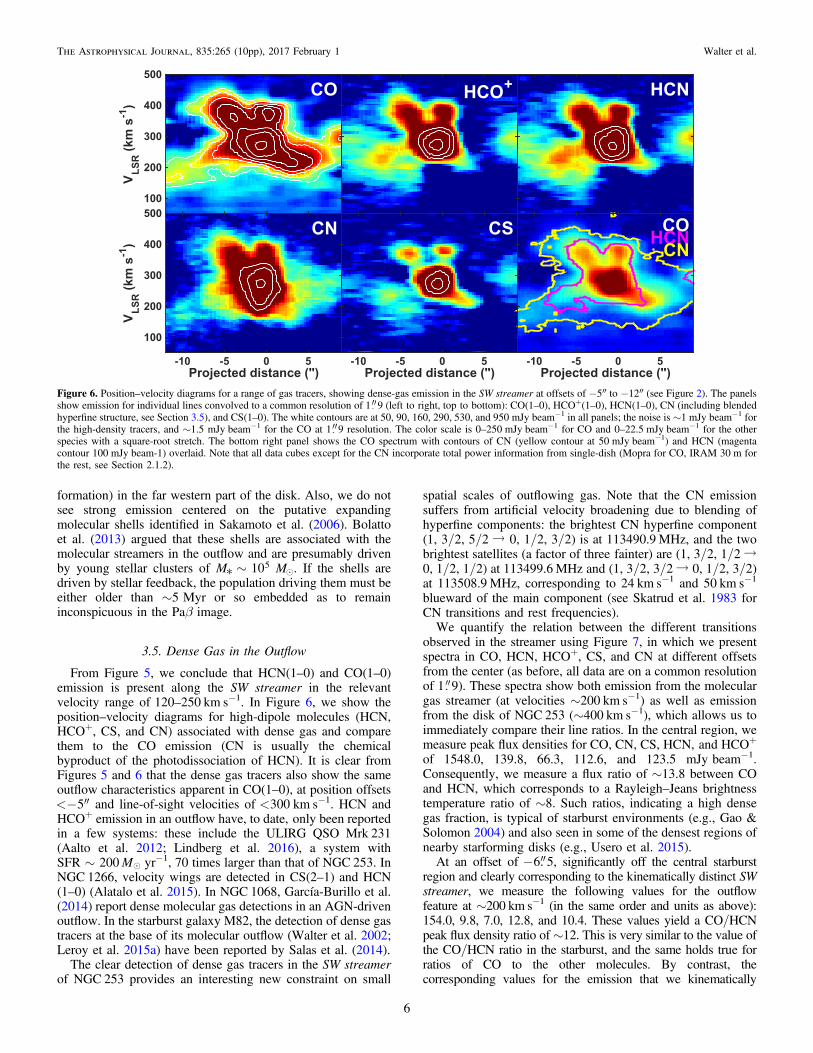
From Figure 5, we conclude that HCN(1–0) and CO(1–0)emission is present along the SW streamer in the relevantvelocity range of120–250 km s−1. In Figure 6, we show theposition–velocity diagrams for high-dipole molecules (HCN,HCO+, CS, and CN) associated with dense gas and comparethem to the CO emission (CN is usually the chemicalbyproduct of the photodissociation of HCN). It is clear fromFigures 5 and 6 that the dense gas tracers also show the sameoutflow characteristics apparent in CO(1–0), at position offsets
5 and line-of-sight velocities of 300 km s−1. HCN andHCO+ emission in an outflow have, to date,only been reportedin a few systems: these include the ULIRG QSO Mrk 231(Aalto et al. 2012; Lindberg et al. 2016), a system withSFR∼200M yr−1, 70 times larger than that of NGC 253. InNGC 1266, velocity wings are detected in CS(2–1) and HCN(1–0) (Alatalo et al. 2015). In NGC 1068, García-Burillo et al.(2014) report dense molecular gas detections in an AGN-drivenoutflow. In the starburst galaxy M82, the detection of dense gastracers at the base of its molecular outflow (Walter et al. 2002;Leroy et al. 2015a) have been reported by Salas et al. (2014).
The clear detection of dense gas tracers in the SW streamerof NGC 253 provides an interesting new constraint on small
spatial scales of outflowing gas. Note that the CN emissionsuffers from artificial velocity broadening due to blending ofhyperfine components: the brightest CN hyperfine component(1, 3/2, 5/2 0, 1/2, 3/2) is at 113490.9 MHz, and the twobrightest satellites (a factor of threefainter) are (1, 3/2, 1/20, 1/2, 1/2) at 113499.6 MHz and (1, 3/2, 3/2 0, 1/2, 3/2)at 113508.9 MHz, corresponding to 24 km s−1 and 50 km s−1
blueward of the main component (see Skatrud et al. 1983 forCN transitions and rest frequencies).We quantify the relation between the different transitions
observed in the streamer using Figure 7, in which we presentspectra in CO, HCN, HCO+, CS, and CN at different offsetsfrom the center (as before, all data are on a common resolutionof 1 9). These spectra show both emission from the moleculargas streamer (at velocities ∼200 km s−1) as well as emissionfrom the disk of NGC 253 (∼400 km s−1), which allows us toimmediately compare their line ratios. In the central region, wemeasure peak flux densities for CO, CN, CS, HCN,and HCO+
of 1548.0, 139.8, 66.3, 112.6, and 123.5 mJybeam−1.Consequently, we measure a flux ratio of ∼13.8 between COand HCN, which corresponds to a Rayleigh–Jeans brightnesstemperature ratio of ∼8. Such ratios, indicating a high densegas fraction, is typical of starburst environments (e.g., Gao &Solomon 2004) and also seen in some of the densest regions ofnearby starforming disks (e.g., Usero et al. 2015).At an offset of 6. 5, significantly off the central starburst
region and clearly corresponding to the kinematically distinct SWstreamer, we measure the following values for the outflowfeature at ∼200 km s−1 (in the same order and units as above):154.0, 9.8, 7.0, 12.8, and 10.4. These values yield a CO/HCNpeak flux density ratio of ∼12. This is very similar to the value ofthe CO/HCN ratio in the starburst, and the same holds true forratios of CO to the other molecules. By contrast, thecorresponding values for the emission that we kinematically
Figure 6. Position–velocity diagrams for a range of gas tracers, showing dense-gas emission in the SW streamer at offsets of −5″ to −12″ (see Figure 2). The panelsshow emission for individual lines convolved to a common resolution of 1 9 (lefttoright, toptobottom): CO(1–0), HCO+(1–0), HCN(1–0), CN (including blendedhyperfine structure, see Section 3.5), and CS(1–0). The white contours are at 50, 90, 160, 290, 530, and 950 mJy beam−1 in all panels; the noise is ∼1 mJy beam−1 forthe high-density tracers, and ∼1.5 mJy beam−1 for the CO at 1 9 resolution. The color scale is 0–250 mJy beam−1 for CO and 0–22.5 mJy beam−1 for the otherspecies with a square-root stretch. The bottom right panel shows the CO spectrum with contours of CN (yellow contour at 50 mJy beam−1) and HCN (magentacontour 100 mJy beam-1) overlaid. Note that all data cubes except for the CN incorporate total power information from single-dish (Mopra for CO, IRAM 30 m forthe rest, see Section 2.1.2).
6
The Astrophysical Journal, 835:265 (10pp), 2017 February 1 Walter et al.

identify with the background rotating disk component of thegalaxy (visible at a velocity of ∼400 km s−1 in Figure 7) are 193,8.4, 1.9, 5.6, and6.4 (same order and units as above). These yielda CO/HCN peak flux density ratio ∼35, a factor of threehigherthan the starburst or the streamer. Such a value for the CO/HCNratio is in excellent agreement with typical measurements in thedisks of nearby galaxies (Usero et al. 2015). We conclude that thefraction of dense molecular gas in the SW streamer of the outflowis high and stays high throughout the region where we detectemission. Moreover, the material in the molecular streamerdisplays a dense gas fraction that is similar to that of the starburstregion and significantly higher than that of the main disk ofNGC 253, strongly suggesting a starburst origin for the gas in thestreamer.
3.6. Mass and Density of the SW Streamer
A key result in the study of Meier et al. (2015) is that theCO(1–0), HCN(1–0), and HCO+(1–0) transitions are opticallythick (and, in fact, have similar optical depths, 5) in thecentral region of NGC 253. The fact that the line ratios wemeasure do not change from those in the central regionsuggests that their emission is also optically thick in the SWstreamer. This has important potential consequences for the
molecular gas mass in the outflow. The CO(1–0) luminosity ofthe streamer is L 2.8 10CO
6 K km s−1 pc2, with anapproximate area of 1.1 104 pc2 and an integrated surfacebrightness of T v 250CO K km s−1. In order to obtain a firmlower limit for its mass,Bolatto et al. (2013) used a CO-to-H2conversion factor of 0.34CO M (K km s−1 pc2)−1 basedon optically thin CO(1–0) emission. This leads to a “minimummass” of the streamer of ∼106M (∼13 times lower than whatone would derive with the typically assumed Galacticconversion factor).
3.6.1. Inferred Volume Densities and Implicationsfor Dense Gas Excitation
The projected area of the streamer is ∼240×60 pc2 (or∼1041 cm2), leading to an average H2 column density of
( )N H 4 10221 cm−2 in the plane of the sky. If we
assume that the feature has cylindrical geometry(depth∼width) this results in an average volume density of40 cm−3. This is completely insufficient to excite the detecteddense gas tracers through collisions: for example, the criticaldensity (defined as the density at which the rate of thecollisional depopulation of a quantum level equals thespontaneous radiative decay rate) for the HCN(1–0) emissionis 2.6 106 cm−3. As is frequently pointed out, however, whatis more relevant to the excitation is the “effective excitationdensity,” which includes the summation of all collisionaltransitions to the lower level and the effect of radiative trappingin an optically thick environment (e.g., Stacey 2011; Shirley2015). The effective excitation density can be one totwoorders of magnitude lower than the critical density evenfor HCN, particularly in environments of high optical depth(Shirley 2015). Nonetheless, even after taking these effects intoaccount, our derived average gas density would be still two tothreeorders of magnitudetoo low to explain the presence ofbright emission from HCN and other high-dipole molecules.Note also that the line-widths are large (Figure 7), which lowersthe effect of radiative trapping.There are a number of factors that could bring these numbers
in agreement. First of all is the clumping—the molecular gas islikely not distributed smoothly. The observed surface brightnessin the SW streamer at 32 pc resolution is –T 1.5 2b
obs K.Assuming an intrinsic brightness of T 100b K (not unreason-able since the gas in the streamer is likely warm), the resultingarea clumping factor would be ∼Tb T –50 70b
obs , corresp-onding to a clumping factor in volume of –50 350 6003 2 .This implies that our bulk density of 40 cm−3 is physically closerto 2×104 cm−3, with typical column densities of N(H2)∼1022 cm−2. Note that these estimates come from the“minimum mass” yielded by the assumption of an optically thinCO-to-H2 conversion factor. Depending on the optical depth ofthe CO(1–0) transition, the actual conversion factor (and,consequently, the derived molecular mass and resulting massoutflow rate) could be factors of a few to several times higher. Toproduce bright HCN emission it would be more comfortable toraise the mass in the streamer by a factor of a few, which wouldraise the physical volume density to 105 cm−3 and reachconditionswhere HCN(1–0) would be efficiently excited.Following this line of reasoning, the bright HCN emission inthe streamer suggests that the minimum molecular outflow rate of3M yr−1 is probably an underestimate by factors of a few(Bolatto et al. 2013).
Figure 7. Spectra along the southern outflow at different offsets from the center(shown in the top right of each panel in arcsec, “0” offset corresponds to theplane of the disk). The black lines indicate the CO emission (scaled down by afactor of 10 for display purposes), and the CN, CS, HCN, andHCO+ spectraare shown in blue, red, green, and magenta, respectively (all data have beenconvolved to the same beam of 1 9). Note that the CN line is artificiallybroadened by the blended hyperfine structure (see Section 3.5). The feature at∼ 200 km s−1 is associated with the SW streamer, and the emission at∼ 400 km s−1 is from the disk. Note how the ratio of CO/(dense gas tracer) ismuch lower in the outflow (and similar there to the central starburst region atoffsets –1 5) than in the disk, suggesting that dense clumps with propertiessimilar to the dense gas in the starburst (and of much larger density than gas intypical disk GMCs) survive in the outflow.
7
The Astrophysical Journal, 835:265 (10pp), 2017 February 1 Walter et al.

3.6.2. Excitation by Electrons?
Collisions with electrons are also an effective way ofexciting polar molecules (Dickinson et al. 1977). In fact, theyare the main mechanism for HCN excitation in comets (Lovellet al. 2004). Calculations show that the rate coefficient forexcitation of HCN(1–0) by collisions with electrons is 105times larger than for collisions with H2 (Saha et al. 1981; Faureet al. 2007). The reason why electrons are usually notconsidered as important collisional partners for HCN is thatthe electron fraction, xe, in dark molecular clouds is thought tobe x 10e
8 or lower, controlled by cosmic-ray ionization(e.g., Flower et al. 2007). However,for x 10e
6 excitationby collisions with electrons will be important and likelydominant. The SW streamer is close to and probably embeddedin the ionized flow, so it is possible that it possesses a higherionization fraction than a typical dark cloud, and HCN(1–0) ismostly excited by electrons. This could also be the case if, forexample, the outflow is cosmic-ray driven. We note, however,that the line ratios in the SW streamer are very similar to theline ratios observed in the starburst (Figure 7), which makes itunlikely that the excitation mechanisms that dominate in oneregion do not also dominate in the other.
3.6.3. Constraints to Mass and Surface Density from Extinction
We can use the extinction inferred for the SW streamer fromthe observed Hα to Paβ line ratio to independently constrain itsmolecular mass. The typical Hα/Paβ ratio in the streamer is
–R 4.5 5obs , while the expected intrinsic line ratio in a 104 Kplasma is R 17.5int for case Brecombination (Osterbrock &Ferland 2006). For a Cardelli et al. (1989) extinction curve, theratio of extinction at 1.28 μm to extinction at 0.66 μmis r A A 1 3P H Pa H . Thus explaining the observed lineratio with a single screen of extinction in front of the ionizedgas requires [ ] ( )A R R r2.5 log 1 PH obs int H–2 2.2, which results in A 2.5V . For the Milky Way, thisimplies a molecular column density in the plane of the sky of
( )N H 2.5 10221 cm−2 (Bohlin et al. 1978). The screen
geometry is a lower limit to the column density, since anyunextincted ionized gas emission in front of the screen leads toan increase in Robs, while conversely any extinction on the backside of the ionized emission would remain undetected. Toaccount for some of these effects a “double screen” geometry isusually preferred, leading to ( )N H 5 102
21 cm−2. Wewould reach a 20% higher value if we assumed that the dustwas mixed with the gas. These numbers are consistent with the“lower limit” mass estimate from CO inferred above. Opticallythin CO emission, however, is somewhat surprising given therelatively low CO/HCN ratio in the streamer, reminiscent ofthe central starburst region. Thus it is likely that there issignificant ionized gas in front of the streamer. ALMAobservations of higher-J CO lines will help to constrain theproperties of the SW streamer and the conditions in themolecular outflow further.
3.7. The Driving of the SW Streamer
The mechanisms to impart momentum and accelerate coldgas in a galactic outflow are not well understood. The presenceof molecular material 300 pc away from the central bar,particularly in the form of dense gas as traced by HCN, HCO+,and CS, already provides strong constraints on the stability ofwind-entrained clouds against photo and thermal evaporation,
Kelvin–Helmoltz instabilities, and shedding due to ablation(e.g., Marcolini et al. 2005). Simulations of radiative cloudsembedded in a supersonic flow show that radiative coolingstabilizes clouds against destruction (Cooper et al. 2009).Radiative clouds undergo a lower acceleration and have ahigher Mach number relative to the flow than adiabatic (energy-conserving) clouds. They do experience fragmentation due toKelvin–Helmholtz instability, but the resulting cloudlets aredenser and are more resistent to destruction than adiabaticclouds, and they are drawn into the flow creating filaments.Additionally, magnetized clouds entrained in a hot wind havealso been shown to be more stable than unmagnetized ones,even for very moderate initial internal magnetic fields, whilealso leading to filamentary structures (McCourt et al. 2015). Ina set of recent calculations, Scannapieco & Brüggen (2015)show that supersonic flows suppress the Kelvin–Helmholtzinstability, thus allowing cooling clouds to survive longer, butthe compression of the cloud also makes its acceleration lessefficient so that they only reach 15% of the hot flow velocitybefore being disrupted. The inclusion of cloud evaporationinduces further compression and naturally produces highlyelongated, filamentary clouds similar to the streamers weobserve, but,though it can help the clouds survive even longer,it also makes the momentum transfer less efficient, resulting ineven lower final velocities before disruption (Brüggen &Scannapieco 2016). Very recent simulations by McCourt et al.(2016), however, suggest that crushed clouds shatter into tiny,dense, cloudlets that do no disappear and can be much moreeasily accelerated by the hot wind, making the entrainmentprocess efficient. In this scenario,the SW streamer could becomposed of a collection of dense molecular clumps embeddedin the much hotter outflow.Notably, a feature corresponding to the molecular gas
streamer is also seen in radio continuum maps obtained at20 cm (Figure 9 in Ulvestad & Antonucci 1997, see alsoHeesen et al. 2009), implying that synchrotron emission isassociated with the outflowing molecular gas. This suggeststhat magnetic fields, and possibly cosmic rays, are associatedwith the outflow. Cosmic rays have been suggested as animportant mechanism for driving outflows in galaxies (e.g.,Booth et al. 2013; Salem & Bryan 2014; Girichidis et al. 2016;Simpson et al. 2016), although observationally constrainingtheir importance remains elusive.To impart momentum to the cold gas, an alternative to
entrainment in a hot flow is acceleration by radiation pressure.In order to explore the viability of radiation pressure to explainthe observations, we perform a rough calculation. The radiationflux at a distance r along its axis from the center of a uniform-brightness disk of radius Rsrc and luminosity Lsrc is
[ ( )]F L R r2src src2 2 . Only the photons absorbed by the
dusty cold gas can impart momentum, so the force due toradiation pressure experienced by a cloud that subtends a solidangle Ω and has an optical depth τ is frad
( )F r e c12 . The resulting velocity is then simplyv f M dr2cloud2
rad cloud . For the purposes of the calculationsbelow, we will assume that the SW streamer is exposed toradiation from the “naked” starburst, which would be mostlyfar-ultraviolet and easily absorbed ( 1). There is thepotential for the momentum imparted by the radiation to beboosted by a factor of the order of IR, the mean infrared opticaldepth of the streamer (e.g., Thompson et al. 2015; Zhang &Davis 2016). Given our column density estimates, the SW
8
The Astrophysical Journal, 835:265 (10pp), 2017 February 1 Walter et al.
streamer does not have a large enough column to possesssubstantial optical depth to its own reradiated IR photons( 0.2IR for the most favorable geometry), so we assume thatthis boosting is unimportant.
NGC 253 has a total infrared luminosity of LTIR1.4 1044 erg s−1, about half of which originates within adiameter of ∼200 pc from its center (Leroy et al. 2015b), i.e.,Rsrc=100 pc. The SW streamer has a “minimum mass”M 10cloud
6 M , a projected size on the sky of 60 240pc2, and a typical distance to the center of theorder of r 100pc. If we assume thatthe geometry corresponds to a cylinder60 pc in diameter ( ( )r 30 pc2 2) illuminated byL 10src
44 erg s−1, the force due to radiation pressure appliedat the base of the streamer would be f 7.5 10rad
31 dyn,resulting in an estimated acceleration of arad4 10 8 cm s−2. In the absence of gravity, the resultingvelocity at r 100 pc would be v 60cloud km s−1, lowerthan the observed velocity before projection correction(Figure 4). If we instead assume that the radiation is exertingpressure on the long side of the cylinder (the geometry with themaximum area), frad would be five times larger, with acorresponding v 135cloud km s−1. Note, however, that theratio of gravity to radiation pressure for stars is
( )f f G c4grav rad cloud , where 2000 erg s−1 g fora fully sampled IMF containing young stars, and cloud is thesurface density of the cloud (Ψ is the light-to-mass ratio of thestellar population, e.g., Equation (33) in Kim et al. 2016). Forthe end-on geometry 0.075cloud g cm−2, while for the side-on geometry 0.015cloud g cm−2, resulting in
f f0.94 0.19grav rad . So,for our assumed geometry andmass, the net acceleration ( )a a a a1net rad grav rad isbetween 6% and 81% of arad, which would resultin v15 120cloud km s−1.
From the above estimates, it appears that radiation cancontribute maybe up to a few tens of percent of the momentum,but it is extremely unlikely to completely explain theobservations. Doing so would require using the most favorablegeometric assumption (maximal cloud area, which maximizesfrad and minimizes f fgrav rad) and also assuming that there isalmost no projection correction to the measured velocity(which requires a contrived geometry). This suggests thatradiation pressure is not the dominant mechanism foraccelerating the streamer,though it is non-negligible. Notealso that any increase in the mass of the streamer over itsminimum mass (see discussion in Section 3.6.1), or accountingfor the old stars in the galaxy disk outside the starburst (whichwould increase gravity), would also reduce the importance ofradiation pressure. Much higher resolution observations of theSW streamer may help further elucidate these questions, inparticular, which mechanisms are driving the molecular gas inthe outflow.
4. Summary
Our new ALMA band 3 observations (COand dense gastracers) of the central starburst region of NGC 253 give newinsights on the properties of the molecular outflowing gasoriginally discussed in Bolatto et al. (2013). The mostprominent outflow feature toward the south, which is the mainsubject of this paper, possesses a large intrinsic velocitydispersion. Its extent and dispersion are consistent with anejection from the disk starting about ∼1Myr ago.
It is currently unclear whether or not the molecular massentrained in the outflow will escape the galaxyor be recycledto fuel later episodes of star formation. For most of the gas inthe observed outflow to escape the galaxy,it would need to beaccelerated as it moves away from the disk. The kinematics ofthe molecular gas are consistent with accelerating with avelocity gradient of 1 km s−1 pc−1, and at its last measurablepoint it approaches the escape velocity. As discussed, thisinterpretation is not unique: the kinematics couldalso beconsistent with an outflow with a range of speeds, where thematerial farther from the disk is there because it is the fastest. Inthat scenario, only the fastest fraction of the outflowing gasmay escape the galaxy. Approved, more sensitive ALMAobservations will trace the outflow even further outand willshed light on whether or not part of the ejected molecularmaterial will escape the galaxy.Strikingly, tracers of the dense gas phase of the molecular
medium (HCN, HCO+, CS, andCN) are also spatiallycoincident with the SW streamer of the molecular outflow.The line ratios HCN/CO of 1 10 measured in the outfloware high and consistent with ratios observed in the centralstarburst region of NGC 253 and in other starbursts. The HCN/CO line ratio in the disk, on the other hand, is significantlylower ( 1 30), typical of gas in the disks of nearby galaxies.In principle, this is indicative ofthe dense molecular gas beingejected from the central regions into the outflow, whileretaining its properties in this process. It also suggests thatthe CO(1–0) and HCN(1–0) emission are alsooptically thick inthe streamer, implying that the estimated mass loadingparameter 3 (Bolatto et al. 2013) is likely a lower limit.Note that electron excitation of polar molecules is an often-ignored mechanism that could play an important role atexciting HCN, HCO+, and CS emission in outflows, though thefact that we see the same ratios of these transitions to CO(1–0)in the starburst and the streamer suggests similar excitationmechanisms in both regions, implying dense gas is the mostlikely cause. Simple calculations indicate that radiationpressure is not the main mechanism for driving the outflow.The presence of a dense gas phase in molecular outflows (withvolume densities >104 cm−3 and probably ∼105 cm−3) willhave to be accounted for in numerical simulations of galacticwinds, both at low and high redshift.
We thank the referee for excellent comments that improvedthe paper. D.S.M. acknowledges partial support by the NationalScience Foundation through grant AST-1009620. S.V.acknowledges NSF grant AST-1009583. A.D.B. acknowledgesvisiting support by the Alexander von Humboldt Foundation,and support by the National Science Foundation through aCAREER grant AST-0955836 and AST-1412419. E.C.O. issupported by the National Science Foundation through grantAST-1312006. This paper makes use of the following ALMAdata: ADS/JAO.ALMA #2011.0.00172.S, #2012.1.00108.S.ALMA is a partnership of ESO (representing its memberstates), NSF (USA), and NINS (Japan), together with NRC(Canada), and NSC and ASIAA (Taiwan), in cooperation withthe Republic of Chile. The Joint ALMA Observatory isoperated by ESO, AUI/NRAO, and NAOJ. The NRAO is afacility of the National Science Foundation operated undercooperative agreement by Associated Universities, Inc. Basedon observations made with the NASA/ESA Hubble SpaceTelescope, obtained from the data archive at the Space
9
The Astrophysical Journal, 835:265 (10pp), 2017 February 1 Walter et al.

Telescope Science Institute (STScI). Some of the HST datapresentedin this paper were obtained from the MikulskiArchive for Space Telescopes (MAST), others were acquiredunder program HST-GO-13730 with support provided byNASA through a grant from the STScI. STScI is operated bythe Association of Universities for Research in Astronomy,Inc., under NASA contract NAS5-26555. The Mopra radiotelescope is part of the Australia Telescope National Facility,which is funded by the Australian Government for operation asa National Facility managed by CSIRO. Based on observationscarried out under project number 209-14 with the IRAM 30 mTelescope. IRAM is supported by INSU/CNRS (France),MPG (Germany), and IGN (Spain).
References
Aalto, S., Garcia-Burillo, S., Muller, S., et al. 2012, A&A, 537, A44Alatalo, K., Blitz, L., Young, L. M., et al. 2011, ApJ, 735, 88Alatalo, K., Lacy, M., Lanz, L., et al. 2015, ApJ, 798, 31Bohlin, R. C., Savage, B. D., & Drake, J. F. 1978, ApJ, 224, 132Bolatto, A. D., Warren, S. R., Leroy, A. K., et al. 2013, Natur, 499, 450Booth, C. M., Agertz, O., Kravtsov, A. V., & Gnedin, N. Y. 2013, ApJL,
777, L16Brüggen, M., & Scannapieco, E. 2016, ApJ, 822, 31Bustard, C., Zweibel, E. G., & D’Onghia, E. 2016, ApJ, 819, 29Cardelli, J. A., Clayton, G. C., & Mathis, J. S. 1989, ApJ, 345, 245Cecil, G., Bland-Hawthorn, J., Veilleux, S., & Filippenko, A. V. 2001, ApJ,
555, 338Cooper, J. L., Bicknell, G. V., Sutherland, R. S., & Bland-Hawthorn, J. 2009,
ApJ, 703, 330Dickinson, A. S., Phillips, T. G., Goldsmith, P. F., Percival, I. C., &
Richards, D. 1977, A&A, 54, 645Engelbracht, C. W., Kundurthy, P., Gordon, K. D., et al. 2006, ApJL,
642, L127Faucher-Giguère, C.-A., & Quataert, E. 2012, MNRAS, 425, 605Faure, A., Varambhia, H. N., Stoecklin, T., & Tennyson, J. 2007, MNRAS,
382, 840Flower, D. R., Pineau Des Forêts, G., & Walmsley, C. M. 2007, A&A,
474, 923Fujita, A., Martin, C. L., Mac Low, M.-M., New, K. C. B., & Weaver, R. 2009,
ApJ, 698, 693Gao, Y., & Solomon, P. M. 2004, ApJS, 152, 63García-Burillo, S., Combes, F., Usero, A., et al. 2014, A&A, 567, A125Girichidis, P., Naab, T., Walch, S., et al. 2016, ApJL, 816, L19Heckman, T. M., Lehnert, M. D., Strickland, D. K., & Armus, L. 2000, ApJS,
129, 493Heesen, V., Beck, R., Krause, M., & Dettmar, R.-J. 2009, A&A, 494, 563Hlavacek-Larrondo, J., Carignan, C., Daigle, O., et al. 2011, MNRAS, 411, 71Kim, J.-G., Kim, W.-T., & Ostriker, E. C. 2016, ApJ, 819, 137Knudsen, K. K., Walter, F., Weiss, A., et al. 2007, ApJ, 666, 156Leroy, A. K., Bolatto, A. D., Ostriker, E. C., et al. 2015b, ApJ, 801, 25Leroy, A. K., Walter, F., Martini, P., et al. 2015a, ApJ, 814, 83
Lindberg, J. E., Aalto, S., Muller, S., et al. 2016, A&A, 587, A15Lovell, A. J., Kallivayalil, N., Schloerb, F. P., et al. 2004, ApJ, 613, 615Marcolini, A., Strickland, D. K., D’Ercole, A., Heckman, T. M., &
Hoopes, C. G. 2005, MNRAS, 362, 626McCourt, M., O’Leary, R. M., Madigan, A.-M., & Quataert, E. 2015, MNRAS,
449, 2McCourt, M., Oh, S. P., OLeary, R. M., & Madigan, A.-M. 2016, arXiv:1610.
01164Meier, D. S., & Turner, J. L. 2012, ApJ, 755, 104Meier, D. S., Walter, F., Bolatto, A. D., et al. 2015, ApJ, 801, 63Müller-Sánchez, F., González-Martín, O., Fernández-Ontiveros, J. A.,
Acosta-Pulido, J. A., & Prieto, M. A. 2010, ApJ, 716, 1166Murray, N., Ménard, B., & Thompson, T. A. 2011, ApJ, 735, 66Nayakshin, S., & Zubovas, K. 2012, MNRAS, 427, 372Osterbrock, D. E., & Ferland, G. J. 2006, Astrophysics of Gaseous Nebulae
and Active Galactic Nuclei (2nd ed.; Sausalito, CA: Univ. Science Books)Rekola, R., Richer, M. G., McCall, M. L., et al. 2005, MNRAS, 361, 330Roussel, H., Wilson, C. D., Vigroux, L., et al. 2010, A&A, 518, L66Rupke, D. S., Veilleux, S., & Sanders, D. B. 2002, ApJ, 570, 588Rupke, D. S. N., & Veilleux, S. 2013, ApJL, 775, L15Saha, S., Ray, S., Bhattacharyya, B., & Barua, A. K. 1981, PhRvA, 23, 2926Sakamoto, K., Ho, P. T. P., Iono, D., et al. 2006, ApJ, 636, 685Salas, P., Galaz, G., Salter, D., et al. 2014, ApJ, 797, 134Salem, M., & Bryan, G. L. 2014, MNRAS, 437, 3312Scannapieco, E., & Brüggen, M. 2015, ApJ, 805, 158Sharp, R. G., & Bland-Hawthorn, J. 2010, ApJ, 711, 818Shirley, Y. L. 2015, PASP, 127, 299Simpson, C. M., Pakmor, R., Marinacci, F., et al. 2016, ApJL, 827, L29Skatrud, D. D., De Lucia, F. C., Blake, G. A., & Sastry, K. V. L. N. 1983,
JMoSp, 99, 35Stacey, G. J. 2011, ITTST, 1, 241Strickland, D. K., Heckman, T. M., Weaver, K. A., & Dahlem, M. 2000, AJ,
120, 2965Strickland, D. K., Heckman, T. M., Weaver, K. A., Hoopes, C. G., &
Dahlem, M. 2002, ApJ, 568, 689Sturm, E., González-Alfonso, E., Veilleux, S., et al. 2011, ApJL, 733, L16Thompson, T. A., Fabian, A. C., Quataert, E., & Murray, N. 2015, MNRAS,
449, 147Thompson, T. A., Quataert, E., Zhang, D., & Weinberg, D. H. 2016, MNRAS,
455, 1830Turner, B. E. 1985, ApJ, 299, 312Uhlig, M., Pfrommer, C., Sharma, M., et al. 2012, MNRAS, 423, 2374Ulvestad, J. S., & Antonucci, R. R. J. 1997, ApJ, 488, 621Usero, A., Leroy, A. K., Walter, F., et al. 2015, AJ, 150, 115Veilleux, S., Cecil, G., Bland-Hawthorn, J., et al. 1994, ApJ, 433, 48Veilleux, S., Cecil, G., & Bland-Hawthorn, J. 2005, ARA&A, 43, 769Veilleux, S., Meléndez, M., Sturm, E., et al. 2013, ApJ, 776, 27Veilleux, S., Rupke, D. S. N., & Swaters, R. 2009, ApJL, 700, L149Walter, F., Weiss, A., & Scoville, N. 2002, ApJL, 580, L21Watson, A. M., Gallagher, J. S., III, Holtzman, J. A., et al. 1996, AJ, 112,
534Westmoquette, M. S., Smith, L. J., & Gallagher, J. S., III 2011, MNRAS,
414, 3719Zhang, D., & Davis, S. W. 2016, arXiv:1612.00022Zubovas, K., & King, A. 2012, ApJL, 745, L34
10
The Astrophysical Journal, 835:265 (10pp), 2017 February 1 Walter et al.