denny’s annual...
TRANSCRIPT

DE
NN
Y’S
AN
NU
AL
RE
PO
RT
2
018
ANNUAL REPORT
P!.hlfY.j •
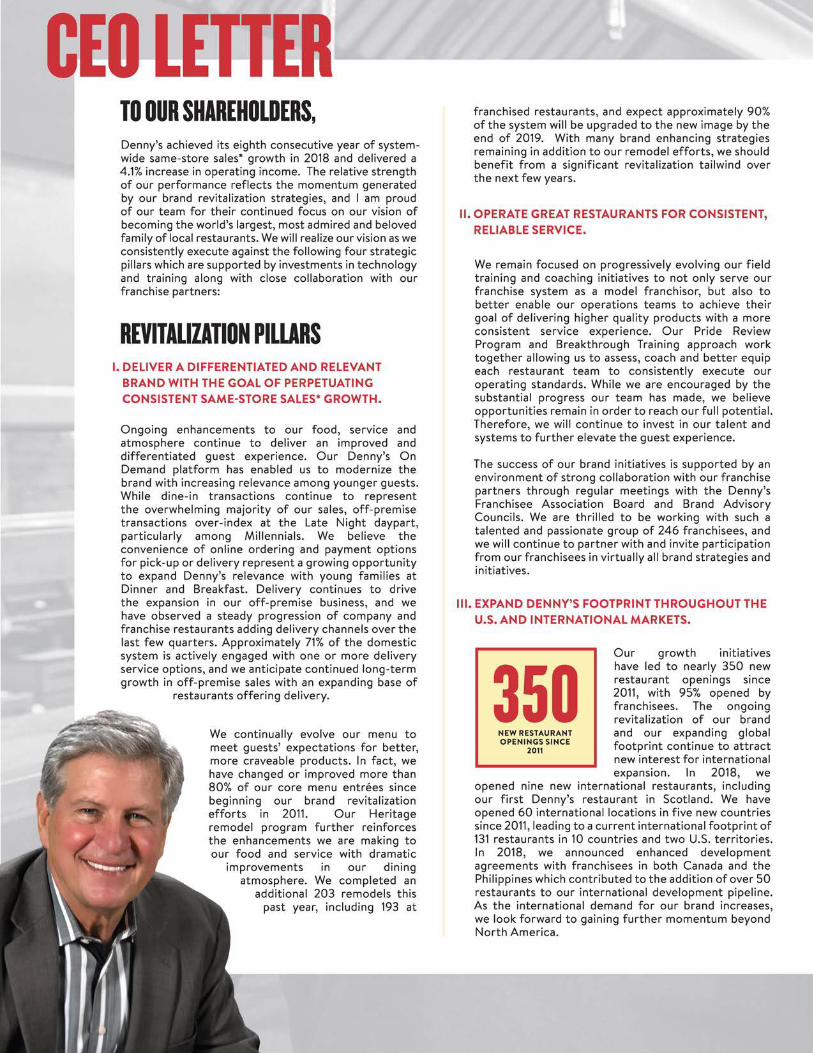
CEO LETTER---TO OUR SHAREHOLDERS, Denny's achieved its eighth consecutive year of systemwide same-store sales* growth in 2018 and delivered a 4.1% increase in operating income. The relative strength of our performance reflects the momentum generated by our brand revitalization strategies, and I am proud of our team for their continued focus on our vision of becoming the world's largest, most admired and beloved family of local restaurants. We will realize our vision as we consistently execute against the following four strategic pillars which are supported by investments in technology and training along with close collaboration with our franchise partners :
REVITALIZATION PILLARS I. DELIVER A DIFFERENTIATED AND RELEVANT
BRAND WITH THE GOAL OF PERPETUATING CONSISTENT SAME-STORE SALES* GROWTH.
Ongoing enhancements to our food, service and atmosphere continue to deliver an improved and differentiated guest experience. Our Denny's On Demand platform has enabled us to modernize the brand with increasing relevance among younger guests . While dine-in transactions continue to represent the overwhelming majority of our sales, off-premise transactions over-index at the Late Night daypart, particularly among Millennials. We believe the convenience of online ordering and payment options for pick-up or delivery represent a growing opportunity to expand Denny's relevance with young families at Dinner and Breakfast. Delivery continues to drive the expansion in our off-premise business, and we have observed a steady progression of company and franchise restaurants adding delivery channels over the last few quarters . Approximately 71% of the domestic system is actively engaged with one or more delivery service options, and we anticipate continued long-term growth in off-premise sales with an expanding base of
restaurants offering delivery.
We continually evolve our menu to meet guests' expectations for better, more craveable products. In fact, we have changed or improved more than 80% of our core menu entrees since beginning our brand revitalization efforts in 2011. Our Heritage remodel program further reinforces the enhancements we are making to our food and service with dramatic
improvements in our dining atmosphere. We completed an
additional 203 remodels this past year, including 193 at
franchised restaurants, and expect approximately 90% of the system will be upgraded to the new image by the end of 2019. With many brand enhancing strategies remaining in addition to our remodel efforts, we should benefit from a significant revitalization tailwind over the next few years.
II. OPERATE GREAT RESTAURANTS FOR CONSISTENT, RELIABLE SERVICE.
We remain focused on progressively evolving our field training and coaching initiatives to not only serve our franchise system as a model franchisor, but also to better enable our operations teams to achieve their goal of delivering higher quality products with a more consistent service experience. Our Pride Review Program and Breakthrough Training approach work together allowing us to assess, coach and better equip each restaurant team to consistently execute our operating standards. While we are encouraged by the substantial progress our team has made, we believe opportunities remain in order to reach our full potential. Therefore, we will continue to invest in our talent and systems to further elevate the guest experience .
The success of our brand initiatives is supported by an environment of strong collaboration with our franchise partners through regular meetings with the Denny's Franchisee Association Board and Brand Advisory Councils . We are thrilled to be working with such a talented and passionate group of 246 franchisees, and we will continue to partner with and invite participation from our franchisees in virtually all brand strategies and initiatives.
Ill. EXPAND DENNY'S FOOTPRINT THROUGHOUT THE U.S. AND INTERNATIONAL MARKETS.
350 NEW RESTAURANT OPENINGS SINCE
2011
Our growth initiatives have led to nearly 350 new restaurant openings since 2011, with 95% opened by franchisees. The ongoing revitalization of our brand and our expanding global footprint continue to attract new interest for international expansion. In 2018, we
opened nine new international restaurants, including our first Denny's restaurant in Scotland . We have opened 60 international locations in five new countries since 2011, leading to a current international footprint of 131 restaurants in 10 countries and two U.S. territories . In 2018 , we announced enhanced development agreements with franchisees in both Canada and the Philippines which contributed to the addition of over 50 restaurants to our international development pipeline. As the international demand for our brand increases, we look forward to gaining further momentum beyond North America .

FOCUS ON COSTS AND CAPITAL ALLOCATION, FOR THE BENEFIT OF OUR EMPLOYEES, FRANCHISEES AND SHAREHOLDERS.
In October 2018, we announced a plan to migrate from a 90% franchised business model to one that is between 95% and 97% franchised over a period of 18 months. The anticipated sale of between 90 and 125 company operated restaurants with attached development commitments will create an opportunity for development-focused franchisees to expand their businesses, while also attracting and welcoming new, well-capitalized franch isees. The sale of eight company restaurants in Texas during the fourth quarter of 2018 marked the start of our refranchising transactions. Through our transition, Denny's will further evolve as a franchisor of choice that provides more focused support services. In addition to refranchising, we will upgrade the quality of our real estate portfolio through a series of like-kind exchanges. Refranchising proceeds, a reduction in maintenance capital and a moderate increase in leverage will be used to generate more compelling returns for shareholders, including the return of capital. Since the beginning of our brand revitalization strategy, we have grown Adjusted Net Income per Share** by approximately 240% to $0.68 per share in 2018 from $0.20 per share in 2011. We have also increased Ad"usted EBITDA** by approximately 29% to $105.3 million from $81.7 million during the same period.
INCREASE IN ADJUSTED NET INCOME PER SHARE ..
SINCE 2011
Over the last eight years, we have generated nearly $390 million in Adjusted Free Cash Flow** after capital expenditures, cash interest and cash taxes. Since launching our share repurchase program in late 2010, we have allocated approximately $424 million to share repurchases, including approximately $68 million in
8424 MILLION
ALLOCATED TO SHARE REPURCHASES
' we announced a $25 million Accelerated Share Repurchase program. To date, we have reduced our total share count by over 38%, and we had approximately $128 million remaining in our share repurchase authorization at year end.
The results we have achieved and the strength of our brand are derived from the diversity of our guests, employees, franchisees, suppliers and other partners. Approximately 14% of Denny's purchases are already coming from diverse suppliers who share our values of exceptional quality, excellent customer service, innovative ideas and competitive pricing. As America's Diner, we will ensure we are an inclusive company that reflects our diverse customer base. I am thrilled Denny's is a participating company in CEO Action for Diversity & Inclusion and is starting to incorporate related training into our culture . This commitment involves taking action to advance diversity and foster inclusion such that all members of the Denny's family can bring their best selves to work and unleash their full potential.
In closing, Denny's is reinvigorated today and better positioned to successfully navigate a challenging competitive environment and to outperform. While we are just entering the middle stages of our revitalization, we remain focused on continuing the transformation of the Denny's brand to grow around the world. I want to personally thank our guests, franchisees, shareholders, suppliers and team members for their continued support as we build upon the current momentum taking place at Denny's.
John C. Miller Chief Execut ive Offi cer & President
Marc h 2019
•same·store sales include sales at company restaurants and non-consolidated franchised and licensed restaurants that were open the same period in the prior year. Total operating revenue is limited to company restaurant sales and royalties. fees and occupancy revenue from franchised and licensed restaurants. Accordingly. domestic franchise same-store sales and domestic system-wide same-store sales should be considered as a supplement to. not a substitute for. our results as reported under GAAP .
.. Please refer to the historical reconciliation of Net Income to Adjusted Net Income. Adjusted Net Income per Share. Adjusted EBITOA and Adjusted Free Cash Flow set forth in the Appendix to our 1019 Proxy Statement.


UNITED STATESSECURITIES AND EXCHANGE COMMISSION
Washington, D.C. 20549 Form 10-K
ANNUAL REPORT PURSUANT TO SECTION 13 OR 15(d) OF THE SECURITIES EXCHANGE ACT OF 1934 For the Fiscal Year Ended December 26, 2018
TRANSITION REPORT PURSUANT TO SECTION 13 OR 15(d) OF THE SECURITIES EXCHANGE ACT OF 1934For the transition period from to
Commission file number 0-18051
DENNY’S CORPORATION(Exact name of registrant as specified in its charter)
Delaware 13-3487402(State or other jurisdiction of incorporation or organization) (I.R.S. employer identification number)
203 East Main Street, Spartanburg, South Carolina 29319-9966(Address of principal executive offices) (Zip Code)
(864) 597-8000(Registrant’s telephone number, including area code)
Securities registered pursuant to Section 12(b) of the Act:
Title of each class Name of each exchange on which registered
$.01 Par Value, Common Stock The Nasdaq Stock Market
Securities registered pursuant to Section 12(g) of the Act: NoneIndicate by check mark if the registrant is a well-known seasoned issuer, as defined in Rule 405 of the Securities Act. Yes No Indicate by check mark if the registrant is not required to file reports pursuant to Section 13 or Section 15(d) of the Act. Yes No Indicate by check mark whether the registrant (1) has filed all reports required to be filed by Section 13 or 15(d) of the Securities Exchange Act of
1934 during the preceding 12 months (or for such shorter period that the registrant was required to file such reports), and (2) has been subject to such filing requirements for the past 90 days. Yes No
Indicate by check mark whether the registrant has submitted electronically every Interactive Data File required to be submitted pursuant to Rule 405 of Regulation S-T (§232.405 of this chapter) during the preceding 12 months (or for such shorter period that the registrant was required to submit such files). Yes No
Indicate by check mark if disclosure of delinquent filers pursuant to Item 405 of Regulation S-K (§ 229.405 of this chapter) is not contained herein, and will not be contained, to the best of the registrant’s knowledge, in definitive proxy or information statements incorporated by reference in Part III of this Form 10-K or any amendment to this Form 10-K.
Indicate by check mark whether the registrant is a large accelerated filer, an accelerated filer, a non-accelerated filer, a smaller reporting company or emerging growth company. See the definitions of “large accelerated filer,” “accelerated filer,” “smaller reporting company” and “emerging growth company” in Rule 12b-2 of the Exchange Act.
Large accelerated filer Accelerated filer Non-accelerated filer Smaller reporting company Emerging growth company If an emerging growth company, indicate by check mark if the registrant has elected not to use the extended transition period for complying with
any new or revised financial accounting standards provided pursuant to Section 13(a) of the Exchange Act. Indicate by check mark whether the registrant is a shell company (as defined in Rule 12b-2 of the Exchange Act). Yes No The aggregate market value of the voting and non-voting common stock held by non-affiliates of the registrant was approximately $829.7 million as
of June 27, 2018, the last business day of the registrant’s most recently completed second fiscal quarter, based upon the closing sales price of the registrant’s common stock on that date of $16.09 per share and, for purposes of this computation only, the assumption that all of the registrant’s directors, executive officers and beneficial owners of 10% or more of the registrant’s common stock are affiliates.
As of February 20, 2019, 61,680,873 shares of the registrant’s common stock, $.01 par value per share, were outstanding.Documents incorporated by reference:
Portions of the registrant’s definitive Proxy Statement for the 2019 Annual Meeting of Stockholders are incorporated by reference into Part III of this Form 10-K.
□
0 □
0 □
□ □ □
□ □
□ 0
□ 0
□

TABLE OF CONTENTS
PagePART I
Item 1. Business
Item 1A. Risk Factors
Item 1B. Unresolved Staff Comments
Item 2. Properties
Item 3. Legal Proceedings
Item 4. Mine Safety Disclosures PART II
Item 5. Market for Registrant’s Common Equity, Related Stockholder Matters and Issuer Purchases of Equity Securities
Item 6. Selected Financial Data
Item 7. Management’s Discussion and Analysis of Financial Condition and Results of Operations
Item 7A. Quantitative and Qualitative Disclosures About Market Risk
Item 8. Financial Statements and Supplementary Data
Item 9. Changes in and Disagreements with Accountants on Accounting and Financial Disclosure
Item 9A. Controls and Procedures
Item 9B. Other Information PART III
Item 10. Directors, Executive Officers and Corporate Governance
Item 11. Executive Compensation
Item 12. Security Ownership of Certain Beneficial Owners and Management and Related Stockholder Matters
Item 13. Certain Relationships and Related Transactions, and Director Independence
Item 14. Principal Accounting Fees and Services PART IV
Item 15. Exhibits and Financial Statement Schedules
Item 16. Form 10-K Summary Index to Consolidated Financial Statements
Signatures
FORWARD-LOOKING STATEMENTS
The forward-looking statements included in the “Business,” “Risk Factors,” “Legal Proceedings,” “Management’s
Discussion and Analysis of Financial Condition and Results of Operations,” and “Quantitative and Qualitative Disclosures About Market Risk” sections and elsewhere herein, which reflect our best judgment based on factors currently known, involve risks and uncertainties. Words such as “expect,” “anticipate,” “believe,” “intend,” “plan,” “hope,” and variations of such words and similar expressions are intended to identify such forward-looking statements. Such statements speak only as to the date thereof. Except as may be required by law, we expressly disclaim any obligation to update these forward-looking statements to reflect events or circumstances after the date of this Form 10-K or to reflect the occurrence of unanticipated events. Actual results could differ materially from those anticipated in these forward-looking statements as a result of a number of factors including, but not limited to, the factors discussed in such sections and, in particular, those set forth in the cautionary statements contained in “Risk Factors.” The forward-looking information we have provided in this Form 10-K pursuant to the safe harbor established under the Private Securities Litigation Reform Act of 1995 should be evaluated in the context of these factors.
1
8
14
14
16
16
17
19
19
31
32
32
32
35
35
35
35
36
36
3639
F - 1

1
PART I
Item 1. Business Description of Business Denny’s Corporation (Denny’s), a Delaware corporation, is one of America’s largest franchised full-service restaurant chains based on the number of restaurants. Denny’s, through its wholly-owned subsidiary, Denny’s, Inc., owns and operates the Denny’s brand. At December 26, 2018, the Denny’s brand consisted of 1,709 franchised, licensed and company operated restaurants around the world with combined sales of $2.9 billion, including 1,578 restaurants in the United States and 131 international locations. As of December 26, 2018, 1,536 of our restaurants were franchised or licensed, representing 90% of the total restaurants, and 173 were company operated.
Denny’s is known as America’s Diner, or in the case of our international locations, “the local diner.” Open 24/7 in most locations, we provide our guests quality food that emphasizes everyday value and new products through our compelling limited time only offerings, delivered in a warm, friendly “come as you are” atmosphere. Denny’s has been serving guests for 65 years and is best known for its breakfast fare, which is available around the clock. The Build Your Own Grand Slam, one of our most popular menu items, traces its origin back to the Original Grand Slam which was first introduced in 1977. In addition to our breakfast-all-day items, Denny’s offers a wide selection of lunch and dinner items including burgers, sandwiches, salads and skillet entrées, along with an assortment of beverages, appetizers and desserts.
In 2018, Denny’s average annual restaurant sales were $2.3 million for company restaurants and $1.6 million for domestic franchised restaurants. At our company restaurants, the guest check average was $10.38 with an approximate average of 4,300 guests served per week. Because our restaurants are open 24 hours, we have four dayparts (breakfast, lunch, dinner and late night), accounting for 26%, 35%, 21% and 18%, respectively, of average daily sales at company restaurants. Due to the launch of Denny’s On Demand in May 2017, average off-premise sales across all dayparts grew from 6.6% of total sales in December 2016 to 11.7% of total sales in December 2018. Weekends have traditionally been the most popular time for guests to visit our restaurants. In 2018, 36% of an average week of sales at company restaurants occurred from Friday late night through Sunday lunch.
References to “Denny’s,” the “Company,” “we,” “us,” and “our” in this Form 10-K are references to Denny’s Corporation and its subsidiaries. Financial information about our operations, including our revenues and net income for the fiscal years endedDecember 26, 2018, December 27, 2017, and December 28, 2016, and our total assets as of December 26, 2018 and December 27, 2017, is included in our Consolidated Financial Statements set forth in Part II, Item 8 of this report. Restaurant Development
Franchising Our criteria to become a Denny’s franchisee include minimum liquidity and net worth requirements and appropriate operational experience. We believe that Denny’s is an attractive financial proposition for current and potential franchisees and that our fee structure is competitive with other full-service brands. Traditional twenty-year Denny’s franchise agreements have an initial fee of up to $30,000 and a royalty payment of up to 4.5% of gross sales. Additionally, our franchisees are required to contribute up to 3.25% of gross sales for marketing and may make additional advertising contributions as part of a local marketing co-operative. Franchise agreements for nontraditional locations, such as university campuses, may contain higher royalty and lower advertising contribution rates than the traditional franchise agreements. Our domestic royalty rate averaged approximately 4.17% during 2018.
We work closely with our franchisees to plan and execute many aspects of the business. The Denny’s Franchisee Association (“DFA”) was created to promote communication among our franchisees and between the Company and our franchise community. DFA board members and Company management primarily work together through Brand Advisory Councils relating to Development, Marketing, Operations and Technology matters, as well as through a Supply Chain Oversight Committee for procurement and distribution matters.

2
Site Selection
The success of any restaurant is significantly influenced by its location. Our development team works closely with franchisees and real estate brokers to identify sites which meet specific standards. Sites are evaluated on the basis of a variety of factors, including but not limited to:
• demographics;• traffic patterns;• visibility;• building constraints;• competition;• environmental restrictions; and• proximity to high-traffic consumer activities.
Domestic Development To accelerate the growth of the brand in specific under-penetrated markets, we offer certain incentive programs. These programs provide significant incentives for franchisees to develop locations in areas where Denny’s does not have the top market share. The benefits to franchisees include reduced franchise fees, lower royalties for a limited time period and credits towards certain development services, such as training fees.
In addition to these incentive programs, we plan to increase our domestic development pipeline by approximately 40 to 70 restaurants through our recently announced refranchising and development strategy. These commitments will be attached to the sale of between 90 and 125 company operated restaurants which we expect to complete over the next 12 to 15 months. While we anticipate the majority of the restaurants to be opened under these agreements, generally as scheduled, from time to time some of our franchisees’ ability to grow and meet their development commitments may be hampered by the economy, the lending environment or other circumstances.
International Development In addition to the development agreements signed for domestic restaurants, as of December 26, 2018, we had the potential to develop over 85 international franchised restaurants with our current development partners in various countries including Aruba, Canada, Central America, Mexico, the Philippines and the United Kingdom. These development commitments include our recently announced enhanced development agreements with Canada and the Philippines. The majority of these restaurants are expected to open over the next ten years. During 2018, we opened nine international franchised locations, including three in Canada, two in the Philippines and one each in Honduras, Mexico, Puerto Rico and the United Kingdom.
During 2019, we expect to open a total of 35 to 45 restaurants in domestic and international markets, resulting in approximately flat net restaurant growth.
Franchise Focused Business Model
Through our development and refranchising efforts we have achieved a restaurant portfolio mix of 90% franchised and 10% company operated. The majority of our future restaurant openings and growth of the brand will come primarily from the development of franchised restaurants. The following table summarizes the changes in the number of company restaurants and franchised and licensed restaurants during the past five years (excluding relocations):

3
2018 2017 2016 2015 2014Company restaurants, beginning of period 178 169 164 161 163Units opened 1 3 1 3 1Units acquired from franchisees 6 10 10 3 —Units sold to franchisees (8) (4) (6) (1) —Units closed (4) — — (2) (3)
End of period 173 178 169 164 161
Franchised and licensed restaurants, beginning of period 1,557 1,564 1,546 1,541 1,537Units opened 29 36 49 42 37Units purchased from Company 8 4 6 1 —Units acquired by Company (6) (10) (10) (3) —Units closed (52) (37) (27) (35) (33)
End of period 1,536 1,557 1,564 1,546 1,541Total restaurants, end of period 1,709 1,735 1,733 1,710 1,702
The table below sets forth information regarding the distribution of single-store and multi-store franchisees as of December 26, 2018:
Number of Restaurants Owned FranchiseesPercentage ofFranchisees Restaurants
Percentage ofRestaurants
One 84 34.1% 84 5.5%Two to five 92 37.4% 255 16.6%Six to ten 35 14.2% 268 17.4%Eleven to fifteen 12 4.9% 149 9.7%Sixteen to thirty 13 5.3% 277 18.0%Thirty-one and over 10 4.1% 503 32.8%
Total 246 100.0% 1,536 100.0%
Restaurant Operations We believe that the consistent and reliable execution of basic restaurant operations in each Denny’s restaurant, whether it is company or franchised, is critical to our success. To meet and exceed our guests’ expectations, we require both our company and our franchised restaurants to maintain the same strict brand standards. These standards relate to the preparation and efficient serving of quality food and the maintenance, repair and cleanliness of each restaurant.
We devote significant effort to ensuring all restaurants offer quality food served by friendly, knowledgeable and attentive employees in a clean and well-maintained restaurant. We seek to ensure that our company restaurants meet our high standards through a network of Directors of Company Operations, Company District Managers and restaurant level managers, all of whom spend the majority of their time in the restaurants. A network of Regional Directors of Franchise Operations and Franchise Business Coaches provide oversight of our franchised restaurants to ensure compliance with brand standards, promote operational excellence and provide general support to our franchisees.
A principal feature of our restaurant operations is the consistent focus on improving operations at the restaurant level. Our Pride Review Program, executed by the Franchise Business Coaches and District Managers, is designed to continuously improve the execution of our brand standards and shift management at each company and franchised restaurant. In addition, Denny’s maintains training programs for hourly employees and restaurant management. Hourly employee training programs (including online learning) are position-specific and focus on skills and tasks necessary to successfully fulfill the responsibilities assigned to them, while continually enhancing guest satisfaction. Denny’s Manager In Training (“MIT”) program provides managers with the knowledge and leadership skills needed to successfully operate a Denny’s restaurant. The MIT program is required for all new managers of company restaurants and is also available to Denny’s franchisees to train their managers.

4
Product Development and Marketing
Menu Offerings
The Denny’s menu offers a large selection of high-quality, reasonably priced products designed to appeal to all types of guests. We offer a wide variety of entrées for breakfast, lunch, dinner and late night dining, in addition to appetizers, desserts and beverages. Most Denny’s restaurants offer special items for children and seniors at reduced prices. Our “America’s Diner” brand positioning, which provides the promise of Everyday Value with craveable, indulgent products served in a friendly and welcoming atmosphere, establishes the framework for our primary marketing strategies. These strategies focus on optimizing our product offering to further align with consumer needs, which includes enhancing our core “breakfast all day” platform while providing everyday affordability, primarily through our $2 $4 $6 $8 Value Menu® and delivering compelling core menu and limited-time-only products.
Product Development Denny’s is a consumer-driven brand focusing on hospitality, menu choices and the overall guest experience. Our Product Development team works closely with consumer insights obtained through primary and secondary qualitative and quantitative studies. Input and ideas from our franchisees, vendors and operators are also integrated into this process. These insights form the strategic foundation for menu architecture, pricing, promotion and advertising. Before a new menu item can be brought to market, it is rigorously tested against consumer expectations, standards of culinary discipline, food science and technology, nutritional analysis, financial benefit and operational execution. This testing process ensures that new menu items are not only appealing, competitive, profitable and marketable, but can be prepared and delivered with excellence in our restaurants.
The added value of these insights and strategic understandings also assists our Restaurant Operations and Information Technology staff in the evaluation and development of new restaurant processes and upgraded restaurant equipment that may enhance our speed of service, food quality and order accuracy. We continually evolve our menu through new additions, deletions or improvements to meet the needs of a changing consumer and market place.
Product Sources and Availability Our Purchasing department administers programs for the procurement of food and non-food products. Our franchisees also purchase food and non-food products directly from our vendors under these programs. Our centralized purchasing program is designed to ensure uniform product quality as well as to minimize food, beverage and supply costs. The size of our brand provides significant purchasing power, which often enables us to obtain products at favorable prices from nationally recognized suppliers. While our Purchasing department negotiates contracts for nearly all products used in our restaurants, the majority of such products are purchased and distributed through McLane Company, Inc. (“McLane”) under a long-term distribution contract. McLane distributes restaurant products and supplies to the Denny’s system from approximately 200 vendors, representing approximately 90% of our restaurant product and supply purchases. We believe that satisfactory alternative sources of supplies are generally available for all of the items regularly used by our restaurants. We have not experienced any material shortages of food, equipment, or other products which are necessary to our restaurant operations.
Marketing and Advertising Our Marketing team employs integrated marketing and advertising strategies that promote the Denny’s brand. Brand and communications strategy, advertising, brand engagement, broadcast media, social media, digital media, menu management, product innovation and development, consumer insights, multicultural marketing, public relations, reputation management, customer relationship management, field marketing and national/local promotions and partnerships all fall under the marketing umbrella. We focus our marketing campaigns on amplifying Denny’s brand strengths as America’s Diner, promoting the various breakfast, lunch, dinner and late night menu offerings in addition to both value and premium limited time only offerings, and promoting the convenience of online ordering and payment for pick-up or delivery. Denny’s deploys comprehensive marketing strategies on a national level and through local co-operatives, targeting customers through network, cable and local television, radio, online, digital, social, outdoor and print media.

5
Information Technology
The mission of our Information Technology department is to align our technology strategy in support of our business strategies. We focus on leveraging technology to drive efficiencies, simplify and standardize operations, and streamline the guest experience. We also deliver solutions that support financial and regulatory needs in addition to necessary business improvements.
We rely on information technology systems in all aspects of our operations. At the restaurant level, systems include point-of-sale platforms along with systems and tools for kitchen operations, labor scheduling, inventory management, cash management and credit card transaction processing. Our technology platform includes industry-standard market solutions as well as proprietary software and integration yielding tools and information managers need to run efficient and effective restaurants. We invest in new technologies and R&D efforts to improve operations and enhance the guest experience through innovative solutions like online ordering and payment for pick-up and delivery.
At the corporate level, we have a robust Enterprise Resource Planning (ERP) platform that supports finance, accounting, human resources and payroll functions. Our ERP is a cloud-based market solution, enabling us to take advantage of continual software improvements aligned with industry best practices. We also have systems that consolidate and report on data from our franchised and company restaurants, including transaction-level detail. In 2018, we continued to invest in technology to improve reporting and analytics as well as to optimize business processes. These systems are collectively supported by an enterprise network that facilitates seamless connectivity for applications and data throughout our business infrastructure.
Our information technology systems have been designed to protect against unauthorized access and data loss. We are continuously focused on enhancing our cybersecurity capabilities. We are required to maintain the highest level of Payment Card Industry (PCI) Data Security Standard (DSS) compliance and protect critical and sensitive data for our employees, customers, and the Company. These standards are set by a consortium of major credit card companies and require certain levels of system security and procedures to protect our customers’ credit card and other personal information. We have deployed payment technologies that are EMV (Europay, Mastercard, Visa) certified, and we employ point-to-point encryption to ensure no credit card data is stored within our restaurants. Further, we monitor franchisees’ compliance with PCI standards.
See “Risk Factors” for further information regarding Information Technology.
Brand Protection, Quality & Regulatory Compliance
Denny’s will only serve our guests food that is safe, wholesome and meets our quality standards. Our systems, from “farm to fork,” are based on Hazard Analysis and Critical Control Points (“HACCP”), whereby we prevent, eliminate or reduce hazards to a safe level to protect the health of our employees and guests. To ensure this basic expectation of our guests, Denny’s also has risk-based systems in place to validate only approved vendors and distributors which meet and follow our product specifications and food handling procedures. Vendors, distributors and restaurant employees follow regulatory requirements (federal, state and local), industry “best practices” and Denny’s Brand Standards.
The Current Good Manufacturing Practice, Hazard Analysis, and Risk-based Preventive Controls for Human Food regulation (referred to as the Preventive Controls for Human Food Regulation) is intended to ensure safe manufacturing/processing, packing and holding of food products for human consumption in the United States. The regulation requires that certain activities must be completed by a “preventive controls qualified individual” who has “successfully completed training in the development and application of risk-based preventive controls.” Our Chief Food Safety Officer and our Food Safety and Quality Assurance teams have all been certified.
We use multiple approaches to ensure food safety and quality generally including quarterly third-party unannounced restaurant inspections (utilizing Denny’s Brand Protection Reviews), health department reviews, guest complaints and employee/manager training in their respective roles. It is a brand standard that all regulatory reviews/inspections be submitted to the Brand Protection, Quality & Regulatory Compliance department within 24 hours. We follow-up on all inspections received and assist operations personnel, facilities personnel and franchisees, where applicable, to bring resolution to regulatory issues or concerns. If operational brand standard expectations are not met, a remediation process is immediately initiated. Our Food Safety/HACCP program uses nationally recognized food safety training courses and American National Standards Institute accredited certification programs.

6
All Denny’s restaurants are required to have a person certified in food protection on duty for all hours of operation. Our Food Safety/HACCP program has been recognized nationally by regulatory departments, the restaurant industry and our peers. We continuously work toward improving our processes and procedures. We are advocates for the advancement of food safety within the industry’s organizations, such as the National Council of Chain Restaurants (“NCCR”), NCCR Food Safety Task Force, the National Restaurant Association (“NRA”) (member of the Steering Committee for the October 2018 - October 2020 term) and the NRA’s Quality Assurance Executive Study Group.
Seasonality Restaurant sales are generally higher in the second and third calendar quarters (April through September) than in the first and fourth calendar quarters (October through March). Additionally, severe weather, storms and similar conditions may impact sales volumes seasonally in some operating regions. Trademarks and Service Marks Through our wholly-owned subsidiaries, we have certain trademarks and service marks registered with the United States Patent and Trademark Office and in international jurisdictions, including “Denny’s®,” “Grand Slam®,” and “$2 $4 $6 $8 Value Menu®.” We consider our trademarks and service marks important to the identification of our restaurants and believe they are of material importance to the conduct of our business. In addition, we have registered various domain names on the internet that incorporate certain of our trademarks and service marks. We believe these domain name registrations are an integral part of our identity. From time to time, we may resort to legal measures to defend and protect the use of our intellectual property. Generally, with appropriate renewal and use, the registration of our service marks and trademarks will continue indefinitely. Competition
The restaurant industry is highly competitive. Restaurants compete on the basis of name recognition and advertising; the price, quality, variety and perceived value of their food offerings; the quality and speed of their guest service; the location and attractiveness of their facilities; and the convenience of to-go ordering and delivery options. Denny’s direct competition in the full-service category includes a collection of national and regional chains, as well as thousands of independent operators. We also compete with quick service restaurants as they attempt to upgrade their menus with premium sandwiches, entrée salads, new breakfast offerings and extended hours. We believe that Denny’s has a number of competitive strengths, including strong brand recognition, well-located restaurants and market penetration. We benefit from economies of scale in a variety of areas, including advertising, purchasing and distribution. Additionally, we believe that Denny’s has competitive strengths in the value, variety and quality of our food products, and in the quality and training of our employees. See “Risk Factors” for additional factors relating to our competition in the restaurant industry. Economic, Market and Other Conditions The restaurant industry is affected by many factors, including changes in national, regional and local economic conditions affecting consumer spending; the political environment (including acts of war and terrorism); changes in customer travel patterns including changes in the price of gasoline; changes in socio-demographic characteristics of areas where restaurants are located; changes in consumer tastes and preferences; food safety and health concerns; outbreaks of flu viruses (such as avian flu) or other diseases; increases in the number of restaurants; and unfavorable trends affecting restaurant operations, such as rising wage rates, health care costs, utilities expenses and unfavorable weather. See “Risk Factors” for additional information. Government Regulations We and our franchisees are subject to local, state, federal and international laws and regulations governing various aspects of the restaurant business, such as compliance with various minimum wage, overtime, health care, food safety, citizenship, and fair labor standards. We are subject to a variety of federal, state, and international laws governing franchise sales and the franchise relationship.

7
We believe we are in material compliance with applicable laws and regulations, but we cannot predict the effect on operations of the enactment of additional regulations in the future.
See “Risk Factors” for a discussion of risks related to governmental regulation of our business.
Executive Officers of the Registrant
The following table sets forth information with respect to each executive officer of both Denny’s Corporation and Denny’s Inc.:
Name Age PositionsChristopher D. Bode 56 Senior Vice President and Chief Operating Officer
John W. Dillon 47 Senior Vice President and Chief Brand Officer
Stephen C. Dunn 54 Senior Vice President and Chief Global Development Officer
Timothy E. Flemming 58 Senior Vice President, General Counsel and Chief Legal Officer
Michael L. Furlow 61 Senior Vice President and Chief Information Officer
John C. Miller 63 Chief Executive Officer and President
Jill A. Van Pelt 50 Senior Vice President and Chief People Officer
Robert P. Verostek 47 Senior Vice President, Finance
F. Mark Wolfinger 63 Executive Vice President, Chief Administrative Officer and Chief Financial Officer
Mr. Bode has been Senior Vice President and Chief Operating Officer since October 2014. He previously served as Senior Vice President, Operations from January 2013 to October 2014, as Divisional Vice President, Franchise Operations from January 2012 to January 2013 and as Vice President, Operations Initiatives from March 2011 to January 2012.
Mr. Dillon has been Senior Vice President and Chief Brand Officer since December 2018. He previously served as Senior Vice President and Chief Marketing Officer from October 2014 to December 2018, as Vice President, Brand and Field Marketing from June 2013 to October 2014 and as Vice President, Marketing from July 2008 to June 2013.
Mr. Dunn has been Senior Vice President and Chief Global Development Officer since July 2015. He previously served as Senior Vice President, Global Development from April 2011 to July 2015 and Vice President, Company and Franchise Development from September 2005 to April 2011.
Mr. Flemming has been Senior Vice President, General Counsel and Chief Legal Officer since March 2009. He previously served as Vice President, General Counsel and Chief Legal Officer from June 2008 to March 2009.
Mr. Furlow has been Senior Vice President and Chief Information Officer since April 2017. Prior to joining the Company, he served as Chief Information Officer and Senior Vice President of IT at Red Robin Gourmet Burgers, Inc. from October 2015 to April 2017 and Chief Information Officer and Senior Vice President of IT of CEC Entertainment, Inc. (an operator and franchisor of Chuck E. Cheese’s and Peter Piper Pizza) from May 2011 to February 2015.
Mr. Miller has been Chief Executive Officer and President since February 2011. Prior to joining the Company, he served as Chief Executive Officer and President of Taco Bueno Restaurants, Inc. (an operator and franchisor of quick service Mexican eateries) from 2005 to February 2011.
Ms. Van Pelt has been Senior Vice President and Chief People Officer since October 2014. She previously served as Vice President, Human Resources from October 2008 to October 2014.
Mr. Verostek has been Senior Vice President, Finance since October 2016. He previously served as Vice President, Financial Planning & Analysis and Investor Relations from January 2012 to October 2016.

8
Mr. Wolfinger has been Executive Vice President and Chief Administrative Officer since April 2008 and Chief Financial Officer since September 2005. He previously served as Executive Vice President, Growth Initiatives from October 2006 to April 2008.
Employees At December 26, 2018, we had approximately 9,000 employees, of whom approximately 8,600 were restaurant employees, approximately 100 were field support employees and approximately 300 were corporate personnel. None of our employees are subject to collective bargaining agreements. Many of our restaurant employees work part-time, and all are paid at or above minimum wage levels. As is characteristic of the restaurant industry, we experience a high level of turnover among our restaurant employees. We have experienced no significant work stoppages, and we consider relations with our employees to be satisfactory.
The staff for a typical restaurant consists of one General Manager, two or three Restaurant Managers and approximately 45 hourly employees. The Chief Operating Officer, along with the VP of Franchise Operations, the Sr. Director of Franchise Operations, the VP of Training, the VP of Operations Services and the Sr. Director of Company Operations, establish the strategic direction and key initiatives for the Operations Teams. In addition, we employ two Directors of Company Operations, four Regional Directors of Franchise Operations and a team of Company District Managers and Franchise Business Coaches to guide and support the franchisees and in-restaurant teams. The duties of the Directors of Operations, District Managers and Franchise Business Coaches include regular restaurant visits and inspections, as well as frequent interactions with our franchisees, employees and guests, which ensure the ongoing adherence to our standards of quality, service, cleanliness, value and hospitality. Available Information We make available free of charge through our website at investor.dennys.com (in the SEC Filings section) copies of materials that we file with, or furnish to, the Securities and Exchange Commission (“SEC”), including our Annual Reports on Form 10-K, Quarterly Reports on Form 10-Q, Current Reports on Form 8-K and amendments to those reports, as soon as reasonably practicable after we electronically file such materials with, or furnish them to, the SEC. The SEC also maintains an internet website at www.sec.gov that contains reports, proxy and information statements and other information regarding issuers that file electronically with the SEC. In addition, we have made available on our website (in the Corporate Governance - Code of Conduct section) our code of ethics entitled “Denny’s Code of Conduct” which is applicable to the Company’s Chief Executive Officer, Chief Financial Officer, Chief Accounting Officer and Corporate Controller, all other executive officers and key financial and accounting personnel as well as each salaried employee of the Company.
We will post on our website any amendments to, or waivers from, a provision of the Denny’s Code of Conduct that applies to the Chief Executive Officer, Chief Financial Officer, Chief Accounting Officer and Corporate Controller or persons performing similar functions, and that relates to (i) honest and ethical conduct, including the ethical handling of actual or apparent conflicts of interest between personal and professional relationships; (ii) full, fair, accurate, timely, and understandable disclosure in reports and documents that we file with, or submit to, the SEC and in other public communications made by us; (iii) compliance with applicable governmental laws, rules and regulations; (iv) the prompt internal reporting of violations of Denny’s Code of Conduct to an appropriate person or persons identified in the code; or (v) accountability to adherence to the code.
Item 1A. Risk Factors Various risks and uncertainties could affect our business. Any of the risk factors described below or elsewhere in this report or our other filings with the SEC could have a material and adverse impact on our business, financial condition and results of operations. In any such event, the trading price of our common stock could decline. It is not possible to predict or identify all risk factors. Additional risks and uncertainties not presently known to us or that we currently believe to be immaterial may also impair our business operations.

9
A decline in general economic conditions could adversely affect our financial results. Consumer spending habits, including discretionary spending on dining at restaurants such as ours, are affected by many factors including:
• prevailing economic conditions, including interest rates;• energy costs, especially gasoline prices;• levels of employment;• salaries and wage rates, including tax rates; and• consumer confidence.
Weakness or uncertainty regarding the United States economy, as a result of reactions to consumer credit availability, increasing energy prices, inflation, increasing interest rates, unemployment, war, terrorist activity or other unforeseen events could adversely affect consumer spending habits, which may result in lower restaurant sales.
The restaurant business is highly competitive, and if we are unable to compete effectively, our business will be adversely affected. Each of our restaurants competes with a wide variety of restaurants ranging from national and regional restaurant chains to locally owned restaurants. The following are important aspects of competition:
• restaurant location;• advantageous commercial real estate suitable for restaurants;• number and location of competing restaurants;• attractiveness and repair and maintenance of facilities;• ability to develop and support evolving technology to deliver a consistent and compelling guest experience;• food quality, new product development and value;• dietary trends, including nutritional content;• training, courtesy and hospitality standards;• ability to attract and retain high quality staff;• quality and speed of service; and• the effectiveness of marketing and advertising programs, including the effective use of social media platforms and digital
marketing initiatives
The returns and profitability of our restaurants may be negatively impacted by a number of factors, including those described below. Food service businesses and the performance of our individual restaurants may be materially and adversely affected by factors such as:
• consumer preferences, including nutritional and dietary concerns;• consumer spending habits;• global, national, regional and local economic conditions;• demographic trends; • traffic patterns;• the type, number and location of competing restaurants; and• the ability to renew leased properties on commercially acceptable terms, if at all.
Dependence on frequent deliveries of fresh produce and other food products subjects food service businesses to the risk that shortages or interruptions in supply caused by adverse weather, food safety warnings, animal disease outbreak or other conditions beyond our control could adversely affect the availability, quality and cost of ingredients. Our inability to effectively manage supply chain risk could increase our costs and limit the availability of products critical to our restaurant operations.
In addition, the food service industry in general, and our results of operations and financial condition in particular, may be adversely affected by unfavorable trends or developments such as:
• inflation;• volatility in certain commodity markets;• increased food costs;

10
• health concerns arising from food safety issues and other food-related pandemics, outbreaks of flu viruses, such as avian flu, or other diseases;
• increased energy costs;• labor and employee benefits costs (including increases in minimum hourly wage, employment tax rates, health care costs
and workers’ compensation costs);• regional weather conditions; and• the availability of experienced management and hourly employees.
Operating results that are lower than our current estimates may cause us to incur impairment charges on certain long-lived assets and potentially close certain restaurants.
The financial performance of our franchisees can negatively impact our business.
As we are heavily franchised, our financial results are contingent upon the operational and financial success of our franchisees. We receive royalties, advertising contributions and, in some cases, lease payments from our franchisees. While our franchise agreements are designed to require our franchisees to maintain brand consistency, the significant percentage of franchise-operated restaurants may expose us to risks not otherwise encountered if we maintained ownership and control of the restaurants. If our franchisees do not successfully operate their restaurants in a manner consistent with our standards, or if customers have negative experiences due to issues with food quality or operational execution at our franchised locations, our brand could be harmed, which in turn could negatively impact our business. Additional risks include franchisee defaults on their obligations to us arising from financial or other difficulties encountered by them, such as the inability to pay financial obligations including royalties, rent on leases on which we retain contingent liability, and certain loans on which we have guarantees; limitations on enforcement of franchise obligations due to bankruptcy or insolvency proceedings; the inability to participate in business strategy changes due to financial constraints; and failure to operate restaurants in accordance with required standards, including food quality and safety. If a significant number of franchisees become financially distressed, it could harm our operating results. For 2018, our ten largest franchisees accounted for 30% of our franchise revenue. The balance of our franchise revenue is derived from the remaining 236 franchisees.
Our growth strategy depends on our ability and that of our franchisees to open new restaurants. Delays or failures in opening new restaurants could adversely affect our planned growth and operating results. The development of new restaurants may be adversely affected by risks such as:
• inability to identify suitable franchisees;• costs and availability of capital for the Company and/or franchisees;• competition for restaurant sites;• negotiation of favorable purchase or lease terms for restaurant sites;• inability to obtain all required governmental approvals and permits;• delays in completion of construction;• challenge of identifying, recruiting and training qualified restaurant managers;• developed restaurants not achieving the expected revenue or cash flow once opened; • challenges specific to the growth of international operations that are different from domestic development; and• general economic conditions.
Our recently announced refranchising and development strategy could impact the comparability of our financial results and will be contingent upon factors including the following:
• franchisee interest in acquiring company operated restaurants and access to capital;• identification and qualification of potential new franchisees;• our ability to successfully negotiate acceptable restaurant transaction prices;• number and timing of restaurants sold to franchisees;• historical financial performance of restaurants sold to franchisees, as well as those that will remain company operated
restaurants; and• our ability to rationalize certain business costs, including the nature, timing and extent thereof.

11
The locations where we have restaurants may cease to be attractive as demographic patterns change. The success of our owned and franchised restaurants is significantly influenced by location. Current locations may not continue to be attractive as demographic patterns change. It is possible that the neighborhood or economic conditions where our restaurants are located could decline in the future, potentially resulting in reduced sales at those locations.
Our expansion into international markets may present increased risks due to lower customer awareness of our brand, our unfamiliarity with those markets and other factors.
The international markets in which our franchisees currently operate, and any additional markets our franchisees may enter outside of the United States, have many differences compared to our domestic markets. There may be lower consumer familiarity with the Denny’s brand in these markets, as well as different competitive conditions, consumer tastes and economic, political and health conditions. Additionally, there are risks associated with sourcing quality ingredients and other commodities in a cost-effective and timely manner. As a result, our franchised international restaurants may take longer to reach expected sales and profit levels, or may never do so, thereby affecting the brand’s overall growth and profitability. Building brand awareness may take longer than expected, which could negatively impact our profitability in those markets.
We are subject to governmental regulations in our international markets impacting the way we do business with our international franchisees. These include antitrust and tax requirements, anti-boycott regulations, import/export/customs and other international trade regulations, the USA Patriot Act and the Foreign Corrupt Practices Act. Failure to comply with any such legal requirements could subject us to monetary liabilities and other sanctions, which could adversely impact our results of operations and financial condition.
Failure of computer systems, information technology, or the ability to provide a continuously secure network, could result in material harm to our reputation and business.
We and our franchisees rely heavily on computer systems and information technology to conduct our business and operate efficiently. We have instituted monitoring controls intended to protect our computer systems, our point-of-sale systems and our information technology platforms and networks against external threats. Those controls include an annual proactive risk assessment, advanced comprehensive analysis of data threats, identification of business email compromise and proper security awareness education. The Audit & Finance Committee of our Board of Directors has oversight responsibility related to our cybersecurity risk management programs and periodically reviews reports on cybersecurity metrics, data privacy and other information technology risks.
We receive and maintain certain personal information about our guests, employees and franchisees. Our use of this information is subject to federal and state regulations, as well as conditions included in certain third-party contracts. If our cybersecurity is compromised and this information is obtained by unauthorized persons or used inappropriately, it could adversely affect our reputation, operations, results of operations and financial condition, and could result in litigation against us or the imposition of penalties. As privacy and information security laws and regulations change or cyber risks evolve, we may incur additional costs to ensure we remain compliant.
A material system failure or interruption, a breach in the security of our information technology systems caused by a cyber attack, or other failure to maintain a secure cyber network could result in reduced efficiency in our operations, loss or misappropriation of data, business interruptions, or could impact delivery of food to restaurants or financial functions such as vendor payment or employee payroll. We have disaster recovery and business continuity plans that are designed to anticipate and mitigate such failures, but it is possible that significant capital investment could be required to rectify these problems, or more likely that cash flows could be impacted, in the shorter term.

12
Numerous government regulations impact our business, and our failure to comply with them could adversely affect our business. We and our franchisees are subject to federal, state and local laws and regulations governing, among other things:
• preparation, labeling, advertising and sale of food;• sanitation;• health and fire safety;• land use, sign restrictions and environmental matters;• employee health care requirements, including the implementation and uncertain legal, regulatory and cost implications of
the health care reform law;• management and protection of the personnel data of our guests, employees and franchisees;• payment card regulation and related industry rules;• the sale of alcoholic beverages; • hiring and employment practices, including minimum wage and tip credit laws and fair labor standards; and• Americans with Disabilities Act.
A substantial number of our employees are paid the minimum wage. Accordingly, increases in the minimum wage or decreases in the allowable tip credit (which reduces wages deemed to be paid to tipped employees in certain states) increase our labor costs. We have attempted to offset increases in the minimum wage through pricing and various cost control efforts, however, there can be no assurance that we will be successful in these efforts in the future.
The operation of our franchisee system is also subject to regulations enacted by a number of states and rules promulgated by the Federal Trade Commission. Due to our international franchising, we are subject to governmental regulations throughout the world impacting the way we do business with our international franchisees. These include antitrust and tax requirements, anti-boycott regulations, import/export/customs and other international trade regulations, the USA Patriot Act and the Foreign Corrupt Practices Act. Additionally, given our significant concentration of restaurants in California, changes in regulations in that state could have a disproportionate impact on our operations. If we or our franchisees fail to comply with these laws and regulations, we or our franchisees could be subjected to restaurant closure, fines, penalties and litigation, which may be costly and could adversely affect our results of operations and financial condition. In addition, the future enactment of additional legislation regulating the franchise relationship could adversely affect our operations.
We have implemented various aspects of The Patient Protection and Affordable Care Act and the Health Care and Education Affordability Reconciliation Act. However, the law or other related requirements may change. Additionally, the health care reform laws require restaurant companies such as ours to disclose calorie information on their menus effective May 4, 2018. We early adopted this requirement during 2015 and did not incur any material costs from compliance with this provision of the law.
We are also subject to federal, state and international laws regulating the offer and sale of franchises. Such laws impose registration and disclosure requirements on franchisors in the offer and sale of franchises, and may contain provisions that supersede the terms of franchise agreements, including limitations on the ability of franchisors to terminate franchises and alter franchise arrangements.
We are subject to federal, state and local environmental laws and regulations, but these rules have not historically had a material impact on our operations. However, we cannot predict the effect of possible future environmental legislation or regulations on our operations.

13
Litigation may adversely affect our business, financial condition and results of operations.
We are subject to the risk of, or are involved in from time to time, complaints or litigation brought by former, current or prospective employees, customers, franchisees, vendors, landlords, shareholders or others. We assess contingencies to determine the degree of probability and range of possible loss for potential accrual in our financial statements. An estimated loss contingency is accrued if it is probable that a liability has been incurred and the amount of loss can be reasonably estimated. Because lawsuits are inherently unpredictable and unfavorable resolutions could occur, assessing contingencies is highly subjective and requires judgments about future events. We regularly review contingencies to determine the adequacy of the accruals and related disclosures. However, the amount of ultimate loss may differ from these estimates. A judgment that is not covered by insurance or that is significantly in excess of our insurance coverage for any claims could materially adversely affect our financial condition or results of operations. In addition, regardless of whether any claims against us are valid or whether we are found to be liable, claims may be expensive to defend, and may divert management’s attention away from operations and hurt our performance. Further, adverse publicity resulting from claims may harm our business or that of our franchisees.
Food safety and quality concerns may negatively impact our business and profitability. Incidents or reports of food- or water-borne illness, or other food safety issues, food contamination or tampering, employee hygiene and cleanliness failures, improper employee conduct, or presence of communicable disease at our restaurants or suppliers could lead to product liability or other claims. Such incidents or reports could negatively affect our brand and reputation, and a decrease in customer traffic resulting from these reports could negatively impact our revenues and profits. Similar incidents or reports occurring at other restaurant brands unrelated to us could likewise create negative publicity, which could negatively impact consumer behavior towards us. In addition, if a regional or global health pandemic occurs, depending upon its location, duration and severity, our business could be severely affected. We rely on our domestic and international vendors, as do our franchisees, to provide quality ingredients and to comply with applicable laws and industry standards. A failure of one of our domestic or international vendors to meet our quality standards, or meet domestic or international food industry standards, could result in a disruption in our supply chain and negatively impact our brand and our business and profitability. Our inability to manage an event such as a product recall or product related litigation could also cause our results to suffer.
Unfavorable publicity, or a failure to respond effectively to adverse publicity, could harm our brand’s reputation.
Multi-unit food service businesses such as ours can be materially and adversely affected by widespread negative publicity of any type, including food safety, outbreak of flu viruses (such as avian flu) or other health concerns, criminal activity, guest discrimination, harassment, employee relations or other operating issues. The increasing use of social media platforms has increased the speed and scope of unfavorable publicity and could hinder our ability to quickly and effectively respond to such reports. Regardless of whether the allegations or complaints are accurate or valid, negative publicity relating to a particular restaurant or a limited number of restaurants could adversely affect public perception of the entire brand.
If we fail to recruit, develop and retain talented employees, our business could suffer. Our future success significantly depends on the continued services and performance of our key management personnel. Our future performance will depend on our ability to attract, motivate and retain these and other key officers and key team members, particularly regional and area managers and restaurant general managers. Competition for these employees is intense.
If our internal controls are ineffective, we may not be able to accurately report our financial results or prevent fraud. Our management is responsible for establishing and maintaining effective internal control over financial reporting. Internal control over financial reporting is a process to provide reasonable assurance regarding the reliability of financial reporting for external purposes in accordance with accounting principles generally accepted in the United States. We maintain a documented system of internal controls which is reviewed and tested by the Company’s full time Internal Audit department. The Internal Audit department reports directly to the Audit and Finance Committee of the Board of Directors. Because of its inherent limitations, internal control over financial reporting is not intended to provide absolute assurance that we would prevent or detect a misstatement of our financial statements or fraud. Any failure to maintain an effective system of internal control over financial reporting could limit our ability to report our financial results accurately and timely or to detect and prevent fraud. A significant financial reporting failure or material weakness in internal control over financial reporting could cause a loss of investor confidence and decline in the market price of our common stock.

14
A change in accounting standards can have a significant effect on our reported financial results. New pronouncements and varying interpretations of pronouncements have occurred and may occur in the future. Changes to existing accounting rules or the questioning of current accounting practices may adversely affect our reporting financial results. Additionally, generally accepted accounting principles and related accounting pronouncements, implementation guidelines and interpretations are highly complex and involve many subjective assumptions, estimates and judgments by us. Changes in these principles or their interpretations or changes in underlying assumptions, estimates and judgments by us could significantly change our reported or expected financial performance.
Many factors, including those over which we have no control, affect the trading price of our common stock. Factors such as reports on the economy or the price of commodities, as well as negative or positive announcements by competitors, regardless of whether the report directly relates to our business, could have an impact on the trading price of our common stock. In addition to investor expectations about our prospects, trading activity in our common stock can reflect the portfolio strategies and investment allocation changes of institutional holders, as well as non-operating initiatives such as our share repurchase programs. Any failure to meet market expectations whether for same-store sales, restaurant unit growth, earnings per share or other metrics could cause our share price to decline.
Changes in the method used to determine LIBOR rates and the potential phasing out of LIBOR after 2021 may affect our financial results.
Borrowings under our credit facility bear interest at variable rates based on LIBOR. In addition, we have interest rate swaps designated as cash flow hedges of our exposure to variability in future cash flows attributable to payments of LIBOR due on forecasted notional debt obligations. LIBOR and certain other interest “benchmarks” may be subject to regulatory guidance and/or reform that could cause interest rates under our current or future debt agreements and interest rate swaps to perform differently than in the past or cause other unanticipated consequences. The United Kingdom’s Financial Conduct Authority, which regulates LIBOR, has announced that it intends to stop encouraging or requiring banks to submit rates for the calculation of LIBOR rates after 2021, and it is unclear if LIBOR will cease to exist or if new methods of calculating LIBOR will evolve. If LIBOR ceases to exist or if the methods of calculating LIBOR change from their current form, interest rates on our current or future debt obligations and interest rate swaps may be adversely affected.
Our indebtedness could have an adverse effect on our financial condition and operations. As of December 26, 2018, we had total indebtedness of $317.1 million, including capital leases. Although we believe that our existing cash balances, funds from operations and amounts available under our credit facility will be adequate to cover our cash flow and liquidity needs, we could seek additional sources of funds, including incurring additional debt, to maintain sufficient cash flow to fund our ongoing operating needs, pay interest and scheduled debt amortization and fund anticipated capital expenditures. We have no material debt maturities scheduled until October 2022. The credit agreement governing most of our indebtedness contains various covenants that could have an adverse effect on our business by limiting our ability to take advantage of financing, merger, acquisition or other corporate opportunities and to fund our operations. Though we currently participate in a share repurchase program, it is subject to restrictions under our credit agreement and there can be no assurance that we will repurchase our common stock pursuant to the program. If we incur additional debt in the future, covenant limitations on our activities and risks associated with such increased debt levels generally could increase. If we are unable to satisfy or refinance our current debt as it comes due, we may default on our debt obligations and lenders could elect to declare all amounts outstanding to be immediately due and payable and terminate all commitments to extend further credit. For additional information concerning our indebtedness see “Management’s Discussion and Analysis of Financial Condition and Results of Operations - Liquidity and Capital Resources.” Item 1B. Unresolved Staff Comments None.
Item 2. Properties Most Denny’s restaurants are free-standing facilities with property sizes averaging approximately one acre. The restaurant buildings average between 3,800 - 5,000 square feet, allowing them to accommodate an average of 110-170 guests. The number and location of our restaurants as of December 26, 2018 are presented below:

15
United States CompanyFranchised /
Licensed TotalAlabama — 6 6Alaska — 2 2Arizona 10 74 84Arkansas — 8 8California 61 330 391Colorado — 19 19Connecticut — 11 11Delaware — 1 1District of Columbia — 2 2Florida 19 112 131Georgia 1 19 20Hawaii 2 4 6Idaho — 10 10Illinois 7 51 58Indiana — 36 36Iowa — 3 3Kansas — 8 8Kentucky 1 14 15Louisiana 1 4 5Maine — 5 5Maryland 4 21 25Massachusetts 2 4 6Michigan 4 16 20Minnesota — 19 19Mississippi — 4 4Missouri 4 34 38Montana — 4 4Nebraska — 3 3Nevada 7 29 36New Hampshire 2 — 2New Jersey — 8 8New Mexico — 29 29New York 1 53 54North Carolina — 30 30North Dakota — 4 4Ohio 4 37 41Oklahoma — 14 14Oregon — 23 23Pennsylvania 13 26 39Rhode Island — 5 5South Carolina 3 12 15South Dakota — 3 3Tennessee — 7 7Texas 16 180 196Utah — 30 30Vermont 2 — 2Virginia 9 18 27Washington — 42 42West Virginia — 3 3Wisconsin — 24 24Wyoming — 4 4Total Domestic 173 1,405 1,578

16
International CompanyFranchised /
Licensed TotalCanada — 74 74Costa Rica — 3 3El Salvador — 1 1Guam — 2 2Guatemala — 1 1Honduras — 6 6Mexico — 11 11New Zealand — 7 7Philippines — 7 7Puerto Rico — 14 14United Arab Emirates — 3 3United Kingdom — 2 2
Total International — 131 131Total Domestic 173 1,405 1,578
Total 173 1,536 1,709
Of the total 1,709 restaurants in the Denny’s brand, our interest in restaurant properties consists of the following:
Company
RestaurantsFranchisedRestaurants Total
Owned properties 36 55 91Leased properties 137 188 325 173 243 416
We have generally been able to renew our restaurant leases as they expire at then-current market rates. The remaining terms of leases range from less than one to approximately 44 years, including optional renewal periods. In addition to the restaurant properties, we own an 18-story, 187,000 square foot office building in Spartanburg, South Carolina, which serves as our corporate headquarters. Our corporate offices currently occupy 17 floors of the building, with a portion of the building leased to others. See Note 12 to our Consolidated Financial Statements for information concerning encumbrances on substantially all of our properties. Item 3. Legal Proceedings
There are various claims and pending legal actions against or indirectly involving us, incidental to and arising out of the ordinary course of the business. In the opinion of management, based upon information currently available, the ultimate liability with respect to these proceedings and claims will not materially affect the Company’s consolidated results of operations or financial position. We record legal settlement costs as other operating expenses in our Consolidated Statements of Income as those costs are incurred. Item 4. Mine Safety Disclosures Not applicable.

17
PART II Item 5. Market for Registrant’s Common Equity, Related Stockholder Matters and Issuer Purchases of Equity Securities Market Information Our common stock is listed under the symbol “DENN” and trades on the NASDAQ Capital Market (“NASDAQ”). As of February 20, 2019, there were 61,680,873 shares of our common stock outstanding and approximately 11,765 record and beneficial holders of our common stock. Dividends and Share Repurchases Our credit facility allows for the payment of cash dividends and/or the repurchase of our common stock, subject to certain limitations and continued maintenance of all relevant covenants before and after any such payment of any dividend or stock purchase. An aggregate amount is available for such dividends or stock repurchases as follows:
• an amount not to exceed $50.0 million if the Consolidated Leverage Ratio (as defined in the credit agreement, as amended) is 3.5x or greater and an unlimited amount if the Consolidated Leverage Ratio is below 3.5x, provided that, in each case, at least $20.0 million of availability is maintained under the revolving credit facility after such payment; and
• an additional annual aggregate amount equal to $0.05 times the number of outstanding shares of our common stock, as of September 27, 2017, plus each additional share of our common stock that is issued after such date.
Though we have not historically paid cash dividends, we have in recent years undertaken share repurchases. The table below provides information concerning repurchases of shares of our common stock during the quarter ended December 26, 2018.
Period
Total Number
of Shares Purchased
Average Price Paid
Per Share (1)
Total Number of Shares
Purchased as Part of
Publicly Announced Programs (2)
Approximate Dollar Value of
Shares that May Yet be Purchased Under the
Programs (2)
(In thousands, except per share amounts) September 27, 2018 – October 24, 2018 318 $ 14.22 318 $ 154,378October 25, 2018 – November 21, 2018 1,138 (3) 16.79 (3) 1,138 (3) $ 128,511 (4)
November 22, 2018 – December 26, 2018 7 15.96 7 $ 128,392Total 1,463 $ 16.22 1,463
(1) Average price paid per share excludes commissions.(2) On October 31, 2017, we announced that our Board of Directors approved a new share repurchase program, authorizing
us to repurchase up to an additional $200 million of our common stock (in addition to prior authorizations). Such repurchases are to be made in a manner similar to, and will be in addition to, authorizations under the May 26, 2016 repurchase program. During the quarter ended December 26, 2018, we purchased 1,463,378 shares of our common stock for an aggregate consideration of approximately $23.8 million pursuant to this share repurchase program.
(3) Includes the initial delivery of approximately 1.1 million shares of our common stock received under the variable term, capped accelerated share repurchase (the “ASR”) agreement we entered into in November 2018 to repurchase an aggregate of $25 million of our common stock. These shares were recorded at the Hedge Period Reference Price, as defined by the ASR agreement, and represent the minimum shares to be delivered based on the cap price. The total aggregate number of shares of our common stock repurchased pursuant to the ASR agreement will be based generally on the average of the daily volume-weighted average prices of our common stock, less a fixed discount, over the term of the ASR agreement, subject to a minimum number of shares.
(4) Includes the full $25 million payment related to the ASR agreement, consisting of $18.2 million for the initial delivery of approximately 1.1 million shares of our common stock and $6.8 million for the equity forward contract related to the settlement of the ASR agreement.

18
Performance Graph The following graph compares the cumulative total shareholders’ return on our common stock for the five fiscal years ended December 26, 2018 (December 25, 2013 to December 26, 2018) against the cumulative total return of the Russell 2000® Index and a peer group. The graph and table assume that $100 was invested on December 25, 2013 (the last day of fiscal year 2013) in each of the Company’s common stock, the Russell 2000® Index and the peer group and that all dividends were reinvested.
COMPARISON OF FIVE-YEAR CUMULATIVE TOTAL RETURN ASSUMES $100 INVESTED ON DECEMBER 25, 2013
ASSUMES DIVIDENDS REINVESTEDFISCAL YEAR ENDED DECEMBER 26, 2018
Russell 2000®
Index (1) Peer Group (2)Denny’s
CorporationDecember 25, 2013 $ 100.00 $ 100.00 $ 100.00December 31, 2014 $ 105.11 $ 115.98 $ 139.32December 30, 2015 $ 101.69 $ 115.84 $ 135.00December 28, 2016 $ 122.21 $ 137.39 $ 173.92December 27, 2017 $ 140.41 $ 149.07 $ 181.08December 26, 2018 $ 122.53 $ 149.98 $ 219.73
(1) The Russell 2000 Index is a broad equity market index of 2,000 companies that measures the performance of the
small-cap segment of the U.S. equity universe. As of December 26, 2018, the weighted average market capitalization of companies within the index was approximately $2.0 billion with the median market capitalization being approximately $0.7 billion.
(2) The peer group consists of 16 public companies that operate in the restaurant industry. The peer group includes the following companies: BJ’s Restaurants, Inc. (BJRI), Bloomin’ Brands, Inc. (BLMN), Brinker International, Inc. (EAT), Chuy’s Holdings, Inc. (CHUY), Cracker Barrel Old Country Store, Inc. (CBRL), DineEquity, Inc. (DIN), Darden Restaurants, Inc. (DRI), Dave & Buster’s Entertainment, Inc. (PLAY), Del Frisco’s Restaurant Group, Inc. (DFRG), J. Alexander’s Holdings, Inc. (JAX), Kona Grill, Inc. (KONA), Red Robin Gourmet Burgers, Inc. (RRGB), Ruth’s Hospitality Group, Inc. (RUTH), Texas Roadhouse, Inc. (TXRH), The Cheesecake Factory Incorporated (CAKE) and The ONE Group Hospitality, Inc. (STKS).
300
250
200
150
100
50
0
2013 2014 2015 2016 2017 2018
----- Denny's Corporation -a- Russell 2000 Index ___.,_ Peer Group

19
Item 6. Selected Financial Data The following table provides selected financial data that was extracted or derived from our audited financial statements. The data set forth below should be read in conjunction with “Management’s Discussion and Analysis of Financial Condition and Results of Operations” and our Consolidated Financial Statements and related notes included elsewhere in this report.
Fiscal Year Ended
December 26,
2018 (a)December 27,
2017December 28,
2016 (b)December 30,
2015December 31,
2014 (c) (In millions, except ratios and per share amounts)Statement of Income Data: Operating revenue $ 630.2 $ 529.2 $ 506.9 $ 491.3 $ 472.3Operating income $ 73.6 $ 70.7 $ 47.0 $ 63.2 $ 57.3Net income $ 43.7 $ 39.6 $ 19.4 $ 36.0 $ 32.7Basic net income per share: $ 0.69 $ 0.58 $ 0.26 $ 0.44 $ 0.38Diluted net income per share: $ 0.67 $ 0.56 $ 0.25 $ 0.42 $ 0.37
Cash dividends per common share (d) — — — — —
Balance Sheet Data (at end of period): Current assets (e) $ 47.6 $ 41.3 $ 35.9 $ 36.4 $ 56.1Working capital deficit (f) $ (47.1) $ (53.6) $ (57.5) $ (65.1) $ (24.3)Net property and equipment $ 140.0 $ 139.9 $ 133.1 $ 124.8 $ 109.8Total assets $ 335.3 $ 323.8 $ 306.2 $ 297.0 $ 289.9Long-term debt and capital lease
obligations, excluding current portion $ 313.7 $ 286.1 $ 242.3 $ 212.5 $ 151.1
(a) During 2018, we adopted ASU 2014-09, which clarifies the principles used to recognize revenue. We elected to apply the
modified retrospective method of adoption; therefore, results for reporting periods after December 28, 2017 are presented under the new guidance and prior period amounts have not been adjusted. The increase in operating revenue was primarily the result of recognizing advertising revenue on a gross basis versus recording it on a net basis as previously reported. See Note 3 to our Consolidated Financial Statements for details.
(b) During 2016, we completed the liquidation of the Advantica Pension Plan (the “Pension Plan”). Accordingly, we made a final contribution of $9.5 million to the Pension Plan and recognized a settlement loss of $24.3 million, reflecting the recognition of unamortized actuarial losses that were recorded in accumulated other comprehensive income.
(c) The fiscal year ended December 31, 2014 includes 53 weeks of operations compared with 52 weeks for all other years presented. We estimate that the additional operating week added approximately $10.7 million of operating revenue in 2014.
(d) Our credit facility allows for the payment of cash dividends and/or the purchase of our common stock subject to certain limitations. See Part II Item 5.
(e) During 2015, we early adopted ASU 2015-17, which simplifies the presentation of deferred taxes by requiring that deferred tax assets and liabilities be classified as noncurrent in a classified statement of financial position. We chose to prospectively apply the guidance. Therefore, as a result of our early adoption, all deferred taxes are reported as noncurrent in our Consolidated Balance Sheet as of December 30, 2015. Prior periods were not retrospectively adjusted.
(f) A negative working capital position is not unusual for a restaurant operating company.
Item 7. Management’s Discussion and Analysis of Financial Condition and Results of Operations The following discussion should be read in conjunction with “Selected Financial Data” and our Consolidated Financial Statements and the notes thereto.

20
Overview
Nature of Our Business
Denny’s Corporation (Denny’s) is one of America’s largest franchised full-service restaurant chains based on the number of restaurants. Denny’s, through its wholly-owned subsidiary, Denny’s, Inc., owns and operates the Denny’s brand. At December 26, 2018, the Denny’s brand consisted of 1,709 franchised, licensed and company operated restaurants. Of this amount, 1,536 of our restaurants were franchised or licensed, representing 90% of the total restaurants, and 173 were company operated.
Our revenues are derived primarily from two sales channels, which we operate as one segment: company restaurants and franchised and licensed restaurants. The primary sources of revenues are the sale of food and beverages at our company restaurants and the collection of royalties, advertising and fee income from restaurants operated by our franchisees under the Denny’s name. Sales and customer traffic at both company and franchised restaurants are affected by the success of our marketing campaigns, new product introductions, product quality enhancements, customer service and menu pricing, as well as external factors including competition, economic conditions affecting consumer spending and changes in guests’ tastes and preferences. Sales at company restaurants and royalty, advertising and fee income from franchised restaurants are also impacted by the opening of new restaurants, the closing of existing restaurants, the sale of company restaurants to franchisees and the acquisition of restaurants from franchisees.
Costs of company restaurant sales are exposed to volatility in two main areas: payroll and benefit costs and product costs. The volatility of payroll and benefit costs results primarily from changes in wage rates and increases in labor related expenses, such as medical benefit costs and workers’ compensation costs. Additionally, changes in guest counts and investments in store-level labor impact payroll and benefit costs as a percentage of sales. Many of the products sold in our restaurants are affected by commodity pricing and are, therefore, subject to price volatility. This volatility is caused by factors that are fundamentally outside of our control and are often unpredictable. In general, we purchase food products based on market prices or we set firm prices in purchase agreements with our vendors. In an inflationary commodity environment, our ability to lock in prices on certain key commodities is imperative to controlling food costs. In addition, our continued success with menu management helps us offer menu items that provide a compelling value to our customers while maintaining attractive product costs and profitability.
Over the next several quarters, the Company intends to migrate from a 90% franchised business model to one that is between 95% and 97% franchised. The anticipated sale of between 90 and 125 company operated restaurants with attached development commitments will create an opportunity for development-focused franchisees to expand their businesses, while also attracting and welcoming new, well-capitalized franchisees. In addition to stimulating domestic restaurant development, this transition will yield a smaller portfolio of higher volume company operated restaurants in more desirable trade areas. The smaller number of company restaurants will require lower maintenance-related capital expenditures and general and administrative support costs. Further, reduced exposure to volatility in costs of company restaurant sales and greater stability in royalties and fees from restaurants operated by our franchisees are expected to enhance our quality of earnings.
2018 Summary of Operations
During 2018, we achieved domestic system-wide same-stores sales growth of 0.8%, comprised of a 1.8% increase at company restaurants and a 0.6% increase at domestic franchised restaurants, marking the eighth consecutive year of positive system-wide same-store sales.
A total of 203 remodels were completed during 2018, comprised of 193 at franchised restaurants and ten at company restaurants. These remodels were in our Heritage image, which we launched in late 2013. This updated look reflects a more contemporary diner feel to further reinforce our America’s Diner positioning. By the end of 2019, we expect approximately 90% of the system will have been remodeled to the most current image.
Our current franchise agreement includes a royalty rate of up to 4.5%. Approximately 50% of our franchised restaurants were operating under this agreement as of December 26, 2018, and we expect approximately 60% to be operating under this agreement by the end of 2019. We anticipate that existing franchisees will elect to migrate to the new fee structure over the next decade as incentives under previous franchise agreements expire. Due to the long-term migration of existing franchisees, we will not see the full benefit of the higher royalty rate for some time. For 2018, our average domestic royalty rate was approximately 4.17%, compared to 4.14% for 2017 and 4.11% for 2016.

21
Growing the Brand
Over the last five years our growth initiatives have led to 202 new restaurant openings. During 2018, we opened 30 restaurants including nine international franchised locations with three in Canada, two in the Philippines and one each in Honduras, Mexico, Puerto Rico and the United Kingdom. Our goal is to increase net restaurant growth through both domestic and international avenues. Domestic growth will focus on markets in which we have modest penetration. Development agreements related to the sale of 90 to 125 of our company operated restaurants and recently announced enhanced development agreements in Canada and the Philippines are expected to stimulate domestic and international growth over the next several years.
Balancing the Use of Cash
We are focused on balancing the use of cash between reinvesting in our base of company restaurants, growing and strengthening the brand and returning cash to shareholders. During 2018, cash capital expenditures were $32.4 million, comprised of $22.0 million in capital expenditures and restaurant and real estate acquisition costs of $10.4 million. Cash flows for acquisitions included $8.1 million for the reacquisition of six franchised restaurants, $1.8 million for real estate and $0.5 million related to a prior year acquisition.
In November 2018, as part of our previously authorized share repurchase programs, we entered into a variable term, capped accelerated share repurchase (the “ASR”) agreement with MUFG Securities EMEA plc (“MUFG”) to repurchase an aggregate of $25 million of our common stock. Pursuant to the terms of the ASR agreement, we paid $25 million in cash, received approximately 1.1 million shares of our common stock (which represents the minimum shares to be delivered based on the cap price) and recorded $18.2 million of treasury stock related to these shares. The remaining balance of $6.8 million is included as additional paid-in capital in shareholders' equity as of December 26, 2018 as an equity forward contract. The total aggregate number of shares of our common stock repurchased pursuant to the ASR agreement will be based generally on the average of the daily volume-weighted average prices of our common stock, less a fixed discount, over the term of the ASR agreement, subject to a minimum number of shares.
During 2018, including shares repurchased under the ASR, we repurchased a total of 3.9 million shares of our common stock for $61.2 million. Since initiating our share repurchase programs in November 2010, we have repurchased a total of 47.1 million shares of our common stock for $416.8 million. As of December 26, 2018, there was $128.4 million remaining under the current repurchase program.
Factors Impacting Comparability
Transition to New Revenue Recognition Accounting Standard
Effective December 28, 2017, the first day of fiscal 2018, we adopted Accounting Standards Update 2014-09, “Revenue from Contracts with Customers (Topic 606),” and all subsequent ASUs that modified Topic 606 on a modified retrospective basis. Results for reporting periods beginning after December 28, 2017 are presented under Topic 606. Prior period amounts are not adjusted and continue to be reported in accordance with our historical accounting under Topic 605 “Revenue Recognition.”
The adoption of Topic 606 did not impact the recognition of company restaurant sales or royalties from franchised restaurants. The most significant effects of the new guidance on the comparability of our results of operations between 2018, 2017 and 2016 include the following:
• Under Topic 606, advertising revenues and expenditures are recorded on a gross basis within the Consolidated Statements of Income. Under the previous guidance of Topic 605, we recorded franchise advertising expense net of contributions from franchisees to our advertising programs, including local co-operatives. While this change materially impacts the gross amount of reported franchise and license revenue and costs of franchise and license revenue, the impact is generally an offsetting increase to both revenue and expense with little, if any, impact on operating income and net income. Similarly, upon adoption, other franchise services fees are recorded on a gross basis within the Consolidated Statements of Income, whereas, under previous guidance, they were netted against the related expenses.

22
• Under Topic 606, recognition of initial franchise fees is deferred until the commencement date of the agreement and occurs over time based on the term of the underlying franchise agreement. In the event a franchise agreement is terminated, any remaining deferred fees are recognized in the period of termination. Under the previous guidance, initial franchise fees were recognized upon the opening of a franchise restaurant. The effect of the required deferral of initial franchise fees received in a given year is mitigated by the recognition of revenue from fees received in prior periods. Upon adoption, we recorded deferred franchise revenue of $21.0 million, and increases of $15.6 million to opening deficit and $5.4 million to deferred tax assets. The deferred franchise revenue will be amortized over the term of the individual franchise agreements.
• Under previous guidance, we recorded gift card breakage when the likelihood of redemption was remote. Breakage was recorded as a benefit to our advertising fund or reduction to other operating expenses, depending on where the gift cards were sold. Under Topic 606, gift card breakage is recognized proportionally as redemptions occur. Our gift card breakage primarily relates to cards sold by third parties. Breakage revenue related to third party sales is recorded as advertising revenue (included as a component of franchise and license revenue) with an offsetting amount recorded as advertising expense (included as a component of costs of franchise and license revenue).
Please refer to Note 3 to our Consolidated Financial Statements for further details of our adoption of Topic 606 and our policies for recognition of revenue from contracts with customers.
Other Factors Impacting Comparability:
For 2018, 2017 and 2016, in addition to impacts from the transition to the new revenue recognition accounting standard, the following items impacted the comparability of our results:
• Company restaurant sales have increased from $367.3 million in 2016 to $411.9 million in 2018, primarily as a result of an increase in equivalent units resulting from acquisitions of franchised restaurants and the increase in same-store sales.
• Royalty income, which is included as a component of franchise and license revenue, has increased from $98.4 million in 2016 to $101.6 million in 2018, primarily as a result of the increase in same-store sales and a higher average royalty rate.
• Occupancy revenues, included as a component of franchise and license revenue, result from leasing or subleasing restaurants to franchisees. When restaurants are sold and leased or subleased to franchisees, the occupancy costs related to these restaurants move from costs of company restaurant sales to costs of franchise and license revenue to match the related occupancy revenue. However, as a result of the upcoming adoption of ASU 2016-02, “Leases (Topic 842),” in fiscal 2019, we expect that there could be additional impacts to comparability as a result of restaurants being sold to franchisees as we migrate to a more franchised business model. Additionally, as leases or subleases with franchisees expire, franchise occupancy revenue and costs could decrease if franchisees enter into direct leases with landlords. Occupancy revenue has decreased from $38.5 million in 2016 to $32.0 million in 2018, primarily as a result of lease expirations. At the end of 2018, we had 243 franchised restaurants that are leased or subleased from Denny’s, compared to 294 at the end of 2016.
• During 2014, our Board of Directors approved the termination and liquidation of the Advantica Pension Plan (the “Pension Plan”). During 2016, we completed the liquidation of the Pension Plan. Accordingly, we made a final contribution of $9.5 million to the Pension Plan and recognized a pre-tax settlement loss of $24.3 million, reflecting the recognition of unamortized actuarial losses that were recorded in accumulated other comprehensive income.

23
Statements of Income
Fiscal Year Ended December 26, 2018 December 27, 2017 December 28, 2016 (Dollars in thousands)Revenue:
Company restaurant sales $ 411,932 65.4% $ 390,352 73.8 % $ 367,310 72.5 %Franchise and license revenue 218,247 34.6% 138,817 26.2 % 139,638 27.5 %
Total operating revenue 630,179 100.0% 529,169 100.0 % 506,948 100.0 %Costs of company restaurant sales (a):
Product costs 100,532 24.4% 97,825 25.1 % 90,487 24.6 %Payroll and benefits 164,314 39.9% 153,037 39.2 % 142,823 38.9 %Occupancy 23,228 5.6% 20,802 5.3 % 19,557 5.3 %Other operating expenses 60,708 14.7% 53,049 13.6 % 49,229 13.4 %
Total costs of company restaurant sales 348,782 84.7% 324,713 83.2 % 302,096 82.2 %Costs of franchise and license revenue (a) 114,296 52.4% 39,294 28.3 % 40,805 29.2 %General and administrative expenses 63,828 10.1% 66,415 12.6 % 67,960 13.4 %Depreciation and amortization 27,039 4.3% 23,720 4.5 % 22,178 4.4 %Operating (gains), losses and other charges, net 2,620 0.4% 4,329 0.8 % 26,910 5.3 %
Total operating costs and expenses, net 556,565 88.3% 458,471 86.6 % 459,949 90.7 %Operating income 73,614 11.7% 70,698 13.4 % 46,999 9.3 %Interest expense, net 20,745 3.3% 15,640 3.0 % 12,232 2.4 %Other nonoperating (income) expense, net 619 0.1% (1,743) (0.3)% (1,109) (0.2)%Net income before income taxes 52,250 8.3% 56,801 10.7 % 35,876 7.1 %Provision for income taxes 8,557 1.4% 17,207 3.3 % 16,474 3.2 %Net income $ 43,693 6.9% $ 39,594 7.5 % $ 19,402 3.8 %
Other Data: Company average unit sales $ 2,300 $ 2,278 $ 2,254 Franchise average unit sales $ 1,615 $ 1,590 $ 1,563 Company equivalent units (b) 179 171 163 Franchise equivalent units (b) 1,538 1,556 1,556 Company same-store sales increase (c)(d) 1.8 % 1.0 % 1.1 % Domestic franchised same-store sales increase (c) 0.6 % 1.1 % 0.8 %
(a) Costs of company restaurant sales percentages are as a percentage of company restaurant sales. Costs of franchise and
license revenue percentages are as a percentage of franchise and license revenue. All other percentages are as a percentage of total operating revenue.
(b) Equivalent units are calculated as the weighted average number of units outstanding during a defined time period.(c) Same-store sales include sales from restaurants that were open the same period in the prior year.(d) Prior year amounts have not been restated for 2018 comparable restaurants.

24
Unit Activity
Fiscal Year Ended December 26, 2018 December 27, 2017 December 28, 2016Company restaurants, beginning of period 178 169 164Units opened 1 3 1Units acquired from franchisees 6 10 10Units sold to franchisees (8) (4) (6)Units closed (4) — —
End of period 173 178 169
Franchised and licensed restaurants, beginning ofperiod 1,557 1,564 1,546
Units opened 29 36 49Units purchased from Company 8 4 6Units acquired by Company (6) (10) (10)Units closed (52) (37) (27)
End of period 1,536 1,557 1,564Total restaurants, end of period 1,709 1,735 1,733
Company Restaurant Operations
Company same-store sales increased 1.8% in 2018 and 1.0% in 2017 compared with the respective prior year. Company restaurant sales for 2018 increased $21.6 million, or 5.5%, primarily resulting from an eight equivalent unit increase in company restaurants and the increase in same-store sales. Company restaurant sales for 2017 increased $23.0 million, or 6.3%, primarily resulting from the increase in same-store sales and an eight equivalent unit increase in company restaurants.
Total costs of company restaurant sales as a percentage of company restaurant sales were 84.7% in 2018, 83.2% in 2017 and 82.2% in 2016.
Product costs were 24.4% in 2018, 25.1% in 2017 and 24.6% in 2016. The decrease for 2018 was primarily due to leverage gained from increased pricing and lower commodity costs. The increase for 2017 was primarily due to higher commodity costs.
Payroll and benefits were 39.9% in 2018, 39.2% in 2017 and 38.9% in 2016. The increase in 2018 was primarily due to a 0.4 percentage point increase in labor costs due to minimum wage rate increases and a 0.3 percentage point increase in incentive compensation. The increase in 2017 was primarily due to a 0.8 percentage point increase in labor costs, partially offset by a 0.2 percentage point decrease in incentive compensation and a 0.2 percentage point decrease in workers’ compensation costs.
Occupancy costs were 5.6% in 2018, 5.3% in 2017 and 5.3% in 2016. The 2018 increase is primarily related to a 0.3 percentage point increase in general liability costs, as 2018 included unfavorable claims development of $0.8 million and 2017 included favorable claims development of $0.4 million.
Other operating expenses were comprised of the following amounts and percentages of company restaurant sales:
Fiscal Year Ended December 26, 2018 December 27, 2017 December 28, 2016 (Dollars in thousands)Utilities $ 14,347 3.5% $ 13,263 3.4% $ 12,426 3.4%Repairs and maintenance 7,761 1.9% 6,738 1.7% 6,406 1.7%Marketing 15,008 3.6% 14,315 3.7% 13,112 3.6%Other direct costs 23,592 5.7% 18,733 4.8% 17,285 4.7%
Other operating expenses $ 60,708 14.7% $ 53,049 13.6% $ 49,229 13.4%

25
The increase in other direct costs for 2018 primarily resulted from higher third party delivery fees of $2.9 million related to increased delivery sales.
Franchise Operations
Franchise and license revenue and costs of franchise and license revenue were comprised of the following amounts and percentages of franchise and license revenue for the periods indicated:
Fiscal Year Ended December 26, 2018 December 27, 2017 December 28, 2016 (Dollars in thousands)Royalties $ 101,557 46.5% $ 100,631 72.5% $ 98,416 70.5%Advertising revenue 78,308 35.9% — —% — —%Initial and other fees 6,422 2.9% 2,466 1.8% 2,717 1.9%Occupancy revenue 31,960 14.6% 35,720 25.7% 38,505 27.6%
Franchise and license revenue $ 218,247 100.0% $ 138,817 100.0% $ 139,638 100.0%
Advertising costs $ 78,309 35.9% $ 1,921 1.4% $ 1,860 1.3%Occupancy costs $ 22,285 10.2% $ 25,466 18.3% $ 28,062 20.1%Other direct costs 13,702 6.3% 11,907 8.6% 10,883 7.8%
Costs of franchise and license revenue $ 114,296 52.4% $ 39,294 28.3% $ 40,805 29.2%
Royalties increased by $0.9 million, or 0.9%, in 2018 primarily resulting from a higher average royalty rate as compared to 2017 and an increase in domestic same-store sales of 0.6%, partially offset by equivalent unit decreases in franchised and licensed restaurants. Royalties increased by $2.2 million, or 2.3%, in 2017 primarily resulting from a 1.1% increase in domestic same-store sales and a higher average royalty rate as compared to 2016. Equivalent units remained flat for 2017 as compared to 2016. The higher average royalty rates for both periods resulted as certain restaurants transitioned to a higher rate structure. The average domestic royalty rate was 4.17%, 4.14% and 4.11% for 2018, 2017 and 2016, respectively.
The 2018 increases in advertising revenue and initial and other fees primarily resulted from the implementation of Topic 606 related to revenue recognition. Advertising revenue and costs are now required to be presented on a gross basis, instead of a net basis as previously presented. We recognized additional franchise and license revenue of $1.5 million resulting from the timing of recognition of initial franchise fees under the new guidance. In addition, we recognized other franchise fees of $3.0 million resulting from the recording of other franchise service fees on a gross basis under the new guidance versus recording these amounts on a net basis as previously presented. Initial and other fees decreased by $0.3 million, or 9.2%, in 2017 as a higher number of restaurants were opened by franchisees during the prior year period. Occupancy revenue decreased by $3.8 million, or 10.5%, in 2018 and by $2.8 million, or 7.2%, in 2017 primarily resulting from lease expirations.
Costs of franchise and license revenue increased $75.0 million, or 190.9% in 2018. This increase was primarily related to the increase in advertising costs related to the implementation of Topic 606, as advertising revenue is no longer netted with advertising expense. Occupancy costs decreased by $3.2 million, or 12.5%, in 2018 and by $2.6 million, or 9.3%, in 2017 primarily resulting from scheduled lease expirations. Other direct costs increased by $1.8 million, or 15.1%, in 2018 primarily due to the implementation of Topic 606, as certain other franchise expenses are no longer netted with the related fees received from franchisees. Other direct costs increased by $1.0 million, or 9.4%, in 2017 due to increased franchise administrative costs. As a result, costs of franchise and license revenue as a percentage of franchise and license revenue increased to 52.4% for 2018 from 28.3% in 2017.
Other Operating Costs and Expenses Other operating costs and expenses such as general and administrative expenses and depreciation and amortization expense relate to both company and franchise operations.

26
General and administrative expenses are comprised of the following:
Fiscal Year Ended December 26, 2018 December 27, 2017 December 28, 2016
(In thousands)Share-based compensation $ 6,038 $ 8,541 $ 7,610Other general and administrative expenses 57,790 57,874 60,350
Total general and administrative expenses $ 63,828 $ 66,415 $ 67,960
General and administrative expenses decreased by $2.6 million in 2018 primarily resulting from a $2.5 million decrease in share-based compensation related to decreases in the expected performance of certain share-based compensation awards. Other general and administrative expenses decreased by $0.1 million as a $2.7 million decrease related to market valuation changes in our non-qualified deferred compensation plan liabilities was mostly offset by a $1.4 million increase in investments in personnel and a $1.0 million increase in incentive compensation. Offsetting losses on the underlying nonqualified deferred plan investments are included as a component of other non-operating income, net.
General and administrative expenses decreased by $1.5 million in 2017 primarily resulting from a $2.6 million decrease in incentive compensation and a $1.3 million reduction in professional fees. These decreases were partially offset by a $0.9 million increase in investments in personnel and a $0.8 million increase related to market valuation changes in our non-qualified deferred compensation plan liabilities. Share-based compensation increased by $0.9 million due in part to the cancellation and re-issuance of certain equity awards to non-employee members of our Board of Directors in the 2016 period. Additionally, share-based compensation was impacted by the election to account for forfeitures as they occur, which was effective beginning in fiscal 2017. There were no actual forfeitures during fiscal 2017.
Depreciation and amortization is comprised of the following:
Fiscal Year Ended December 26, 2018 December 27, 2017 December 28, 2016 (In thousands)Depreciation of property and equipment $ 18,506 $ 17,121 $ 17,012Amortization of capital lease assets 4,451 4,087 3,630Amortization of intangible and other assets 4,082 2,512 1,536
Total depreciation and amortization expense $ 27,039 $ 23,720 $ 22,178
The increases in depreciation of property and equipment and amortization of intangible and other assets are primarily the result of our acquisitions of franchised restaurants and investments in company unit remodels during the past three years.
Operating (gains), losses and other charges, net are comprised of the following:
Fiscal Year Ended December 26, 2018 December 27, 2017 December 28, 2016 (In thousands)Pension settlement loss $ — $ — $ 24,297Software implementation costs — 5,247 —(Gains) losses on sales of assets and other, net (513) (1,729) 29Restructuring charges and exit costs 1,575 485 1,486Impairment charges 1,558 326 1,098
Operating (gains), losses and other charges, net $ 2,620 $ 4,329 $ 26,910

27
Gains on sales of assets and other, net of $0.5 million for 2018 primarily related to $1.2 million of insurance settlement gains on fire-damaged and hurricane-damaged restaurants, partially offset by $0.7 million of losses on sales of company owned units to franchisees. See Note 4 to our Consolidated Financial Statements for details on refranchisings. Gains on the sales of assets and other, net of $1.7 million for 2017 primarily related to real estate sold to franchisees. Software implementation costs of $5.2 million for 2017 were the result of our investment in a new cloud-based Enterprise Resource Planning system. The pre-tax pension settlement loss of $24.3 million related to the completion of the liquidation of the Advantica Pension Plan during 2016. See Note 13 to our Consolidated Financial Statements set forth in Part II, Item 8 of this report for details on the Pension Plan liquidation.
Restructuring charges and exit costs were comprised of the following:
Fiscal Year Ended December 26, 2018 December 27, 2017 December 28, 2016 (In thousands)Exit costs $ 518 $ 385 $ 591Severance and other restructuring charges 1,057 100 895
Total restructuring and exit costs $ 1,575 $ 485 $ 1,486
The increase in severance and other restructuring charges for 2018 is primarily the result of positions eliminated as part of our refranchising and development strategy announced during the fourth quarter.
Impairment charges of $1.6 million for 2018 primarily related to the impairment of an underperforming unit. Impairment charges of $0.3 million for 2017 related to the relocation of two high-performing company restaurants due to the loss of property control. Impairment charges of $1.1 million for 2016 resulted primarily from the impairment of restaurants identified as assets held for sale. Operating income was $73.6 million in 2018, $70.7 million in 2017 and $47.0 million in 2016. Interest expense, net is comprised of the following:
Fiscal Year Ended December 26, 2018 December 27, 2017 December 28, 2016 (In thousands)Interest on credit facilities $ 11,792 $ 7,586 $ 4,606Interest on interest rate swaps 307 73 789Interest on capital lease liabilities 6,354 5,797 4,768Letters of credit and other fees 1,288 1,216 1,185Interest income (146) (106) (116)
Total cash interest 19,595 14,566 11,232Amortization of deferred financing costs 607 596 593Interest accretion on other liabilities 543 478 407
Total interest expense, net $ 20,745 $ 15,640 $ 12,232
Interest expense, net increased during 2018 and 2017 primarily due to increases in the balance of our credit facility and related interest rates, as well as an increase in capital leases.
Other nonoperating (income) expense, net was expense of $0.6 million for 2018, income of $1.7 million for 2017 and income of $1.1 million for 2016. The expense for 2018 was primarily the results of losses on deferred compensation plan investments, partially offset by gains on lease terminations. The income for 2017 and 2016 was primarily the result of gains on deferred compensation plan investments.

28
The provision for income taxes was $8.6 million for 2018, $17.2 million for 2017 and $16.5 million for 2016. The effective tax rate was 16.4% for 2018, 30.3% for 2017 and 45.9% for 2016. The 2018 rate was primarily impacted by the statutory tax rate reduction under the Tax Cuts and Jobs Act of 2017 (the “Tax Act”). For 2018, the difference in the overall effective rate from the U.S. statutory rate was primarily due to state taxes and the generation of employment and foreign tax credits. In addition, the 2018 rate benefited $1.4 million related to share-based compensation.
For 2017, the difference in the overall effective rate from the U.S. statutory rate was primarily due to state taxes and the generation of employment and foreign tax credits. The 2017 rates also benefited $1.7 million from share-based compensation and $1.6 million from the revaluing of deferred tax assets and liabilities required under the Tax Act. Refer to Note 2 to our Consolidated Financial Statements set forth in Part II, Item 8 of this report for the impact of the adoption of ASU 2016-09.
For 2016, the difference in the overall effective rate from the U.S. statutory rate was primarily due to state taxes, the generation of employment tax credits, the Pension Plan liquidation, and foreign tax credits generated with the filings of federal amended tax returns. The 2016 rates were impacted by the recognition of a $2.1 million tax benefit related to the $24.3 million pre-tax settlement loss on the Pension Plan liquidation. This benefit was at a rate lower than the effective tax rate due to the previous recognition of an approximate $7.2 million tax benefit recognized with the reversal of our valuation allowance in 2011. In addition, we amended prior years’ U.S. tax returns in order to maximize a foreign tax credit in lieu of a foreign tax deduction, resulting in a net tax benefit of approximately $3.7 million during the year.
Net income was $43.7 million for 2018, $39.6 million for 2017 and $19.4 million for 2016.
Liquidity and Capital Resources
Summary of Cash Flows
Our primary sources of liquidity and capital resources are cash generated from operations and borrowings under our credit facility (as described below). Principal uses of cash are operating expenses, capital expenditures and the repurchase of shares of our common stock. The following table presents a summary of our sources and uses of cash and cash equivalents for the periods indicated:
Fiscal Year Ended December 26, 2018 December 27, 2017 December 28, 2016 (In thousands)Net cash provided by operating activities $ 73,690 $ 78,269 $ 71,162Net cash used in investing activities (32,017) (27,147) (32,656)Net cash used in financing activities (41,630) (48,731) (37,585)
Increase in cash and cash equivalents $ 43 $ 2,391 $ 921
Net cash flows provided by operating activities were $73.7 million for the year ended December 26, 2018 compared to $78.3 million for the year ended December 27, 2017. The decrease in cash flows provided by operating activities was primarily due to the timing of receiving credit card receivables. Net cash flows provided by operating activities were $78.3 million for the year ended December 27, 2017 compared to $71.2 million for the year ended December 28, 2016. The increase in cash flows provided by operating activities was primarily due to the funding of our pension liability during 2016, partially offset by increased interest and tax payments during 2017. We believe that our estimated cash flows from operations for 2019, combined with our capacity for additional borrowings under our credit facility, will enable us to meet our anticipated cash requirements and fund capital expenditures over the next twelve months. Net cash flows used in investing activities were $32.0 million for the year ended December 26, 2018. These cash flows are primarily comprised of capital expenditures of $22.0 million and acquisitions of restaurants and real estate of $10.4 million. Cash flows for acquisitions include $8.1 million for the reacquisition of six franchised restaurants, $1.8 million for real estate and $0.5 million related to a prior year acquisition. Net cash flows used in investing activities were $27.1 million for the year ended December 27, 2017. These cash flows are primarily comprised of capital expenditures of $18.8 million and acquisitions of restaurants and real estate of $12.4 million. Net cash flows used in investing activities were $32.7 million for the year ended December 28, 2016. These cash flows are primarily comprised of capital expenditures of $19.7 million and restaurant acquisition costs of $14.3 million.
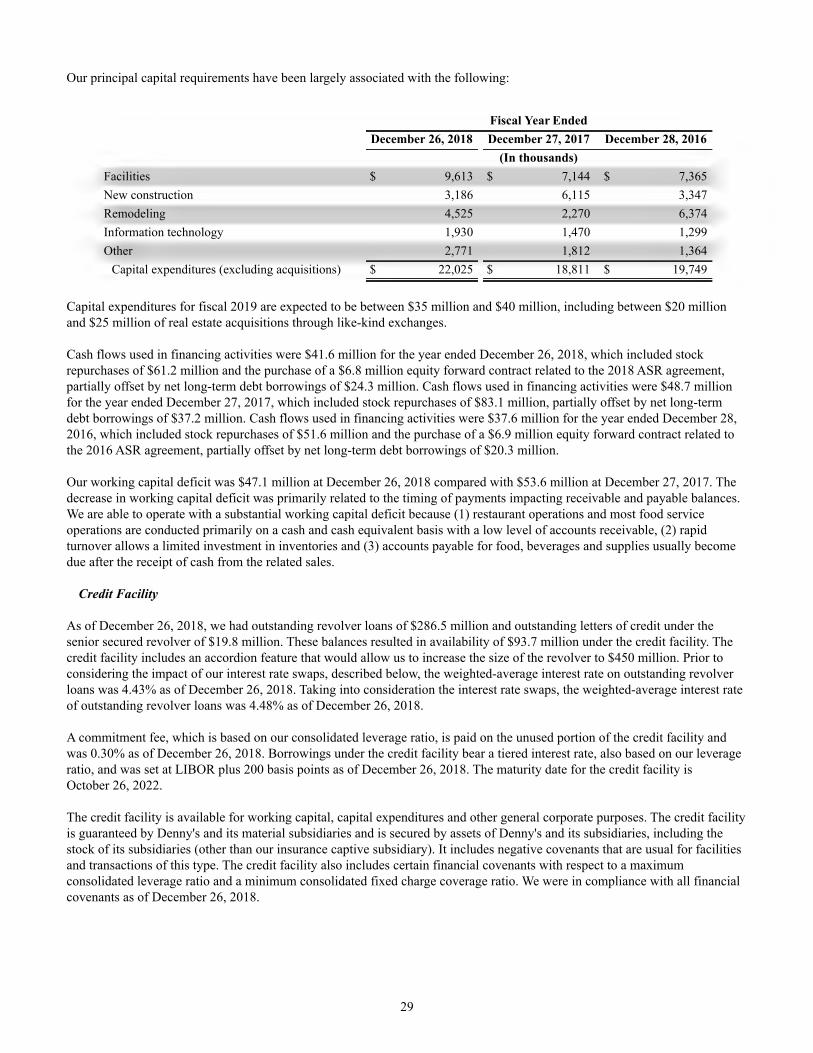
29
Our principal capital requirements have been largely associated with the following:
Fiscal Year Ended December 26, 2018 December 27, 2017 December 28, 2016 (In thousands)Facilities $ 9,613 $ 7,144 $ 7,365New construction 3,186 6,115 3,347Remodeling 4,525 2,270 6,374Information technology 1,930 1,470 1,299Other 2,771 1,812 1,364
Capital expenditures (excluding acquisitions) $ 22,025 $ 18,811 $ 19,749
Capital expenditures for fiscal 2019 are expected to be between $35 million and $40 million, including between $20 million and $25 million of real estate acquisitions through like-kind exchanges. Cash flows used in financing activities were $41.6 million for the year ended December 26, 2018, which included stock repurchases of $61.2 million and the purchase of a $6.8 million equity forward contract related to the 2018 ASR agreement, partially offset by net long-term debt borrowings of $24.3 million. Cash flows used in financing activities were $48.7 million for the year ended December 27, 2017, which included stock repurchases of $83.1 million, partially offset by net long-term debt borrowings of $37.2 million. Cash flows used in financing activities were $37.6 million for the year ended December 28, 2016, which included stock repurchases of $51.6 million and the purchase of a $6.9 million equity forward contract related to the 2016 ASR agreement, partially offset by net long-term debt borrowings of $20.3 million.
Our working capital deficit was $47.1 million at December 26, 2018 compared with $53.6 million at December 27, 2017. The decrease in working capital deficit was primarily related to the timing of payments impacting receivable and payable balances. We are able to operate with a substantial working capital deficit because (1) restaurant operations and most food service operations are conducted primarily on a cash and cash equivalent basis with a low level of accounts receivable, (2) rapid turnover allows a limited investment in inventories and (3) accounts payable for food, beverages and supplies usually become due after the receipt of cash from the related sales.
Credit Facility
As of December 26, 2018, we had outstanding revolver loans of $286.5 million and outstanding letters of credit under the senior secured revolver of $19.8 million. These balances resulted in availability of $93.7 million under the credit facility. The credit facility includes an accordion feature that would allow us to increase the size of the revolver to $450 million. Prior to considering the impact of our interest rate swaps, described below, the weighted-average interest rate on outstanding revolver loans was 4.43% as of December 26, 2018. Taking into consideration the interest rate swaps, the weighted-average interest rate of outstanding revolver loans was 4.48% as of December 26, 2018.
A commitment fee, which is based on our consolidated leverage ratio, is paid on the unused portion of the credit facility and was 0.30% as of December 26, 2018. Borrowings under the credit facility bear a tiered interest rate, also based on our leverage ratio, and was set at LIBOR plus 200 basis points as of December 26, 2018. The maturity date for the credit facility is October 26, 2022.
The credit facility is available for working capital, capital expenditures and other general corporate purposes. The credit facility is guaranteed by Denny's and its material subsidiaries and is secured by assets of Denny's and its subsidiaries, including the stock of its subsidiaries (other than our insurance captive subsidiary). It includes negative covenants that are usual for facilities and transactions of this type. The credit facility also includes certain financial covenants with respect to a maximum consolidated leverage ratio and a minimum consolidated fixed charge coverage ratio. We were in compliance with all financial covenants as of December 26, 2018.

30
Interest Rate Hedges
We have interest rate swaps to hedge a portion of the forecasted cash flows of our floating rate debt. See Part II Item 7A. Quantitative and Qualitative Disclosures About Market Risk for details on our interest rate swaps.
Contractual Obligations
Our future contractual obligations and commitments at December 26, 2018 consisted of the following:
Payments Due by Period
TotalLess than 1
Year 1-2 Years 3-4 Years5 Years andThereafter
(In thousands)Long-term debt $ 286,500 $ — $ — $ 286,500 $ —Capital lease obligations (a) 73,386 9,271 16,674 13,771 33,670Operating lease obligations 136,512 23,504 37,477 26,527 49,004Interest obligations (a) 49,200 12,835 25,670 10,695 —Defined benefit plan obligations 2,500 584 499 693 724Purchase obligations (b) 202,165 202,165 — — —Unrecognized tax benefits (c) 2,940 2,940 — — —
Total $ 753,203 $ 251,299 $ 80,320 $ 338,186 $ 83,398
(a) Interest obligations represent payments related to our long-term debt outstanding at December 26, 2018. For long-
term debt with variable rates, we have used the rate applicable at December 26, 2018 to project interest over the periods presented in the table above, taking into consideration the impact of the interest rate swaps for the applicable periods. The capital lease obligation amounts above are inclusive of interest.
(b) Purchase obligations include amounts payable under purchase contracts for food and non-food products. Many of these agreements do not obligate us to purchase any specific volumes and include provisions that would allow us to cancel such agreements with appropriate notice. For agreements with cancellation provisions, amounts included in the table above represent our estimate of purchase obligations during the periods presented if we were to cancel these contracts with appropriate notice.
(c) Unrecognized tax benefits are related to uncertain tax positions. As we are not able to reasonably estimate the timing or amount of these payments, the related balances have not been reflected in the “Payments Due by Period” section of the table.
Off-Balance Sheet Arrangements
Except for operating leases entered into during the normal course of business, we do not have any off-balance sheet arrangements. Critical Accounting Policies and Estimates Our discussion and analysis of our financial condition and results of operations are based upon our Consolidated Financial Statements, which have been prepared in accordance with U.S. generally accepted accounting principles. The preparation of these financial statements requires us to make estimates and judgments that affect the reported amounts of assets, liabilities, revenues and expenses, and related disclosure of contingent assets and liabilities. On an ongoing basis, we evaluate our estimates, including those related to self-insurance liabilities, impairment of long-lived assets, restructuring and exit costs and income taxes. We base our estimates on historical experience and on various other assumptions that we believe to be reasonable under the circumstances, the results of which form the basis for making judgments about the carrying values of assets and liabilities that are not readily apparent from other sources. Actual results may differ from these estimates under different assumptions or conditions; however, we believe that our estimates, including those for the above-described items, are reasonable.
Our significant accounting policies, including the critical accounting policies listed below, are fully described in Note 2 to our Consolidated Financial Statements included in Part II, Item 8 of this report. We believe the following critical accounting policies affect our more significant judgments and estimates used in the preparation of our Consolidated Financial Statements:

31
Self-insurance liabilities. We are self-insured for a portion of our losses related to certain medical plans, workers’ compensation, general, product and automobile insurance liability. In estimating these liabilities, we utilize independent actuarial estimates of expected losses, which are based on statistical analysis of historical data. Our estimates of expected losses are adjusted over time based on changes to the actual costs of the underlying claims, which could result in additional expense or reversal of expense previously recorded.
Impairment of long-lived assets. We evaluate our long-lived assets for impairment at the restaurant level on a quarterly basis, when assets are identified as held for sale or whenever changes or events indicate that the carrying value may not be recoverable. For assets identified as held for sale, we use the market approach and consider proceeds from similar asset sales. We assess impairment of restaurant-level assets based on the operating cash flows of the restaurant, expected proceeds from the sale of assets and our plans for restaurant closings. Generally, all restaurants with negative cash flows from operations for the most recent twelve months at each quarter end are included in our assessment. For underperforming assets, we use the income approach to determine both the recoverability and estimated fair value of the assets. To estimate future cash flows, we make certain assumptions about expected future operating performance, such as revenue growth, operating margins, risk-adjusted discount rates, and future economic and market conditions. If the long-lived assets of a restaurant are not recoverable based upon estimated future, undiscounted cash flows, we write the assets down to their fair value. If these estimates or their related assumptions change in the future, we may be required to record additional impairment charges. Income taxes. We make certain estimates and judgments in the calculation of our provision for income taxes, in the resulting tax liabilities, and in the recoverability of deferred tax assets. We record valuation allowances against our deferred tax assets, when necessary. Realization of deferred tax assets is dependent on future taxable earnings and is therefore uncertain. We assess the likelihood that our deferred tax assets in each of the jurisdictions in which we operate will be recovered from future taxable income. Deferred tax assets do not include future tax benefits that we deem likely not to be realized.
We record a liability for unrecognized tax benefits resulting from tax positions taken, or expected to be taken, in an income tax return. We recognize any interest and penalties related to unrecognized tax benefits in income tax expense. Assessment of uncertain tax positions requires judgments relating to the amounts, timing and likelihood of resolution.
Recent Accounting Pronouncements See the Accounting Standards to be Adopted section of Note 2 to our Consolidated Financial Statements included in Part II, Item 8 of this report for further details of recent accounting pronouncements. Item 7A. Quantitative and Qualitative Disclosures About Market Risk Interest Rate Risk We have exposure to interest rate risk related to certain instruments entered into for other than trading purposes. Specifically, as of December 26, 2018, borrowings under our credit facility bore interest at variable rates based on LIBOR plus a spread of 200 basis points per annum.
We have interest rate swaps to hedge a portion of the forecasted cash flows of our floating rate debt. We designated these interest rate swaps as cash flow hedges of our exposure to variability in future cash flows attributable to payments of LIBOR due on forecasted notional debt obligations. Under the interest rate swaps, we pay a fixed rate on the notional amount in addition to the current interest rate as determined by our consolidated leverage ratio in effect at the time. A summary of our interest rate swaps as of December 26, 2018 is as follows:
Trade Date Effective Date Maturity Date Notional Amount Fixed Rate
(In thousands)
March 20, 2015 March 29, 2018 March 31, 2025 $ 120,000 2.44%
October 1, 2015 March 29, 2018 March 31, 2026 50,000 2.46%
February 15, 2018 March 31, 2020 December 31, 2033 80,000 (1) 3.19%
(1) The notional amount of the swaps entered into on February 15, 2018 increases annually beginning September 30, 2020 until they reach the maximum notional amount of $425.0 million on September 28, 2029.

32
As of December 26, 2018, the fair value of the interest rate swaps was a net liability of $4.5 million, which is comprised of assets of $1.8 million recorded as a component of other noncurrent assets and liabilities of $6.2 million recorded as a component of other noncurrent liabilities in our Consolidated Balance Sheets.
As of December 26, 2018, the interest rate swaps effectively increased our ratio of fixed rate debt from approximately 10% of total debt to approximately 63% of total debt. We expect to reclassify approximately $0.2 million from accumulated other comprehensive loss related to our interest rate swaps during the next twelve months. This amount will be included as a component of interest expense in our Consolidated Statements of Income. See Note 12 to our Consolidated Financial Statements included in Part II, Item 8 of this report for additional details.
Based on the levels of borrowings under the credit facility at December 26, 2018, if interest rates changed by 100 basis points, our annual cash flow and income before taxes would change by approximately $1.2 million. This computation is determined by considering the impact of hypothetical interest rates on the credit facility at December 26, 2018, taking into consideration the interest rate swaps that will be in effect during the annual period. However, the nature and amount of our borrowings may vary as a result of future business requirements, market conditions and other factors. Commodity Price Risk We purchase certain food products, such as beef, poultry, pork, eggs and coffee, and utilities such as gas and electricity, that are affected by commodity pricing and are, therefore, subject to price volatility caused by weather, production problems, delivery difficulties and other factors that are outside our control and which are generally unpredictable. Changes in commodity prices affect us and our competitors generally and often simultaneously. In general, we purchase food products and utilities based upon market prices established with vendors. Although many of the items purchased are subject to changes in commodity prices, the majority of our purchasing arrangements are structured to contain features that minimize price volatility by establishing fixed pricing and/or price ceilings and floors. We use these types of purchase arrangements to control costs as an alternative to using financial instruments to hedge commodity prices. In many cases, we believe we will be able to address commodity cost increases which are significant and appear to be long-term in nature by adjusting our menu pricing or changing our product delivery strategy. However, competitive circumstances could limit such actions and, in those circumstances, increases in commodity prices could lower our margins. Because of the often short-term nature of commodity pricing aberrations and our ability to change menu pricing or product delivery strategies in response to commodity price increases, we believe that the impact of commodity price risk is not significant. We have established a process to identify, control and manage market risks which may arise from changes in interest rates, commodity prices and other relevant rates and prices. We do not use derivative instruments for trading purposes.
Item 8. Financial Statements and Supplementary Data See Index to Financial Statements which appears on page F-1 herein. Item 9. Changes in and Disagreements with Accountants on Accounting and Financial Disclosure None.
Item 9A. Controls and Procedures Evaluation of Disclosure Controls and Procedures
Our management, with the participation of our principal executive and financial officers, including the Chief Executive Officer (the “CEO”) and Chief Financial Officer (the “CFO”), evaluated the effectiveness of our design and operation of our disclosure controls and procedures pursuant to and as defined in Rules 13a-15(e) and 15d-15(e) under the Exchange Act of 1934, as amended (the “Exchange Act”), as of the end of the period covered by this report.
Based on their assessment as of December 26, 2018, our CEO and CFO have concluded that our disclosure controls and procedures were effective at the reasonable assurance level.

33
Changes in Internal Control over Financial Reporting
During the first quarter of 2018, we implemented new controls in connection with our adoption of the Accounting Standards Updates related to Topic 606, Revenue from Contracts with Customers. There were no significant changes to our internal control over financial reporting due to the adoption of the new standards.
There were no other changes in our internal control over financial reporting identified in connection with the evaluation required by Rule 13a-15(d) of the Exchange Act that occurred during our last fiscal quarter that have materially affected, or are reasonably likely to materially affect, our internal control over financial reporting.
Management’s Report on Internal Control Over Financial Reporting
Our management is responsible for establishing and maintaining adequate internal control over financial reporting, as defined in Exchange Act Rules 13a-15(f) and 15d-15(f). Our internal control system is designed to provide reasonable assurance to our management and Board of Directors regarding the reliability of financial reporting and the preparation and fair presentation of financial statements for external purposes in accordance with generally accepted accounting principles. Because of its inherent limitations, internal control over financial reporting may not prevent or detect misstatements. Also, projections of any evaluation of effectiveness to future periods are subject to the risk that controls may become inadequate because of changes in conditions, or that the degree of compliance with the policies or procedures may deteriorate.
Under the supervision and with the participation of our management, including our CEO and CFO, we conducted an evaluation of the effectiveness of our internal control over financial reporting as of December 26, 2018 based on the framework in Internal Control-Integrated Framework (2013) issued by the Committee of Sponsoring Organizations of the Treadway Commission. Based on that evaluation, our management concluded that our internal control over financial reporting was effective as of December 26, 2018.
The effectiveness of our internal control over financial reporting as of December 26, 2018 has also been audited by KPMG LLP, an independent registered public accounting firm, as stated in their report that appears herein.

34
Report of Independent Registered Public Accounting Firm To the Shareholders and Board of DirectorsDenny’s Corporation:
Opinion on Internal Control Over Financial Reporting
We have audited Denny’s Corporation and subsidiaries’ (the Company) internal control over financial reporting as of December 26, 2018, based on criteria established in Internal Control - Integrated Framework (2013) issued by the Committee of Sponsoring Organizations of the Treadway Commission. In our opinion, the Company maintained, in all material respects, effective internal control over financial reporting as of December 26, 2018, based on criteria established in Internal Control - Integrated Framework (2013) issued by the Committee of Sponsoring Organizations of the Treadway Commission.
We also have audited, in accordance with the standards of the Public Company Accounting Oversight Board (United States) (PCAOB), the consolidated balance sheets of the Company as of December 26, 2018 and December 27, 2017, the related consolidated statements of income, comprehensive income, shareholders’ deficit, and cash flows for each of the years in the three-year period ended December 26, 2018, and the related notes (collectively, the consolidated financial statements), and our report dated February 25, 2019 expressed an unqualified opinion on those consolidated financial statements.
Basis for Opinion
The Company’s management is responsible for maintaining effective internal control over financial reporting and for its assessment of the effectiveness of internal control over financial reporting, included in the accompanying Management’s Report on Internal Control Over Financial Reporting (Item 9A). Our responsibility is to express an opinion on the Company’s internal control over financial reporting based on our audit. We are a public accounting firm registered with the PCAOB and are required to be independent with respect to the Company in accordance with the U.S. federal securities laws and the applicable rules and regulations of the Securities and Exchange Commission and the PCAOB.
We conducted our audit in accordance with the standards of the PCAOB. Those standards require that we plan and perform the audit to obtain reasonable assurance about whether effective internal control over financial reporting was maintained in all material respects. Our audit of internal control over financial reporting included obtaining an understanding of internal control over financial reporting, assessing the risk that a material weakness exists, and testing and evaluating the design and operating effectiveness of internal control based on the assessed risk. Our audit also included performing such other procedures as we considered necessary in the circumstances. We believe that our audit provides a reasonable basis for our opinion.
Definition and Limitations of Internal Control Over Financial Reporting
A company’s internal control over financial reporting is a process designed to provide reasonable assurance regarding the reliability of financial reporting and the preparation of financial statements for external purposes in accordance with generally accepted accounting principles. A company’s internal control over financial reporting includes those policies and procedures that (1) pertain to the maintenance of records that, in reasonable detail, accurately and fairly reflect the transactions and dispositions of the assets of the company; (2) provide reasonable assurance that transactions are recorded as necessary to permit preparation of financial statements in accordance with generally accepted accounting principles, and that receipts and expenditures of the company are being made only in accordance with authorizations of management and directors of the company; and (3) provide reasonable assurance regarding prevention or timely detection of unauthorized acquisition, use, or disposition of the company’s assets that could have a material effect on the financial statements.
Because of its inherent limitations, internal control over financial reporting may not prevent or detect misstatements. Also, projections of any evaluation of effectiveness to future periods are subject to the risk that controls may become inadequate because of changes in conditions, or that the degree of compliance with the policies or procedures may deteriorate.
/s/ KPMG LLP
Greenville, South CarolinaFebruary 25, 2019

35
Item 9B. Other Information None. PART III Item 10. Directors, Executive Officers and Corporate Governance Information required by this item with respect to our executive officers and directors; compliance by our directors, executive officers and certain beneficial owners of our common stock with Section 16(a) of the Exchange Act; the committees of our Board of Directors; our Audit Committee Financial Expert; and our Code of Ethics is furnished by incorporation by reference to information under the captions entitled “General-Equity Security Ownership,” “Election of Directors,” “Executive Compensation,” “Section 16(a) Beneficial Ownership Reporting Compliance,” “Related Party Transactions” and “Code of Ethics” in the proxy statement (to be filed hereafter) in connection with Denny’s Corporation’s 2019 Annual Meeting of Stockholders (the “proxy statement”) and possibly elsewhere in the proxy statement (or will be filed by amendment to this report). Additional information required by this item related to our executive officers appears in Item 1 of Part I of this report under the caption “Executive Officers of the Registrant.” Item 11. Executive Compensation The information required by this item is furnished by incorporation by reference to information under the captions entitled “Executive Compensation” and “Election of Directors” in the proxy statement and possibly elsewhere in the proxy statement (or will be filed by amendment to this report). Item 12. Security Ownership of Certain Beneficial Owners and Management and Related Stockholder Matters The security ownership of certain beneficial owners information required by this item is furnished by incorporation by reference to information under the caption “Equity Security Ownership” in the proxy statement and possibly elsewhere in the proxy statement (or will be filed by amendment to this report).
Securities Authorized for Issuance Under Equity Compensation Plans The following table sets forth information as of December 26, 2018 with respect to our compensation plans under which equity securities of Denny’s Corporation are authorized for issuance.
Plan category
Number of securitiesto be issued upon
exercise ofoutstanding options,warrants and rights
Weighted averageexercise price of
outstandingoptions, warrants
and rights (2)
Number of securitiesremaining availablefor future issuance
under equitycompensation plans
Equity compensation plans approvedby security holders 4,112,605 (1) $ 3.02 3,565,335 (3)
Equity compensation plans not approvedby security holders — — 704,166 (4)
Total 4,112,605 $ 3.02 4,269,501
(1) Includes shares issuable in connection with our outstanding stock options, performance share awards and restricted stock
units awards. (2) Includes the weighted-average exercise price of stock options only.(3) Includes shares of our common stock available for issuance as awards of stock options, restricted stock, restricted stock
units, deferred stock units and performance awards under the Denny’s Corporation 2017 Omnibus Incentive Plan.(4) Includes shares of our common stock available for issuance as awards of stock options and restricted stock units outside
of the Denny’s Incentive Plans in accordance with NASDAQ Listing Rule 5635(c)(4).

36
Item 13. Certain Relationships and Related Transactions, and Director Independence The information required by this item is furnished by incorporation by reference to information under the captions “Related Party Transactions” and “Election of Directors” in the proxy statement and possibly elsewhere in the proxy statement (or will be filed by amendment to this report). Item 14. Principal Accounting Fees and Services The information required by this item is furnished by incorporation by reference to information under the caption entitled “Selection of Independent Registered Public Accounting Firm” in the proxy statement and possibly elsewhere in the proxy statement (or will be filed by amendment to this report). PART IV Item 15. Exhibits and Financial Statement Schedules (a)(1) Financial Statements: See the Index to Financial Statements which appears on page F-1 hereof. (a)(2) Financial Statement Schedules: No schedules are filed herewith because of the absence of conditions under which they are required or because the information called for is in our Consolidated Financial Statements or notes thereto appearing elsewhere herein. (a)(3) Exhibits: Certain of the exhibits to this Report, indicated by an asterisk, are hereby incorporated by reference from other documents on file with the Commission with which they are electronically filed, under File No. 001-18051, to be a part hereof as of their respective dates.

37
Exhibit No. Description
*3.1 Restated Certificate of Incorporation of Denny's Corporation dated March 3, 2003, as amended by Certificate of Amendment to Restated Certificate of Incorporation to Increase Authorized Capitalization dated August 25, 2004 (incorporated by reference to Exhibit 3.1 to the Annual Report on Form 10-K of Denny's Corporation for the year ended December 29, 2004).
*3.2 Amended and Restated By-laws of Denny’s Corporation, amended and restated as of November 7, 2018 (incorporated by reference to Exhibit 3.1 to the Current Report on Form 8-K of Denny’s Corporation filed with the Commission on November 13, 2018).
+*10.1 Form of deferred stock unit award certificate to be used under the Denny's Corporation 2004 Omnibus Incentive Plan (incorporated by reference to Exhibit 10.27 to the Annual Report on Form 10-K of Denny's Corporation for the year ended December 29, 2004).
+*10.2 Employment Offer Letter dated August 16, 2005 between Denny's Corporation and F. Mark Wolfinger (incorporated by reference to Exhibit 10.1 to the Quarterly Report on Form 10-Q of Denny's Corporation for the quarter ended September 28, 2005).
+*10.3 Employment Offer Letter dated January 6, 2011 between Denny's Corporation and John C. Miller (incorporated by reference to Exhibit 10.3 to the Quarterly Report on Form 10-Q of Denny's Corporation for the quarter ended March 30, 2011).
*10.4 Third Amended and Restated Credit Agreement dated as of October 26, 2017 among Denny's, Inc., as the Borrower, Denny's Corporation, as Parent, and Certain Subsidiaries of Parent, as Guarantors, Wells Fargo Bank, National Association, as Administrative Agent and L/C Issuer, Regions Bank and Citizens Bank, National Association, as Co-Syndication Agents, Cadence Bank, N.A. and Fifth Third Bank, as Co-Documentation Agents, and The Other Lenders Party Hereto, Wells Fargo Securities, LLC, Regions Capital Markets, a Division of Regions Bank and Citizens Bank, National Association, as Joint Lead Arrangers and Joint Bookrunners (incorporated by reference to Exhibit 99.1 to the Current Report on Form 8-K of Denny's Corporation filed with the Commission on October 31, 2017).
*10.5 Third Amended and Restated Guarantee and Collateral Agreement dated as of October 26, 2017 among Denny's, Inc., Denny's Realty, LLC, Denny's Corporation, DFO, LLC, the other Subsidiaries of Parent from time to time party hereto, and Wells Fargo Bank, National Association, as Administrative Agent (incorporated by reference to Exhibit 99.2 to the Current Report on Form 8-K of Denny's Corporation filed with the Commission on October 31, 2017).
*10.6 First Amendment to Third Amended and Restated Credit Agreement dated June 26, 2018 among Denny's Inc., as the Borrower, Denny's Corporation, as Parent, and each of the Subsidiaries of Parent party thereto, as Guarantors, and Wells Fargo Bank, National Association, as Administrative Agent on behalf of the Lenders (incorporated by reference to Exhibit 10.2 to the Quarterly Report on Form 10-Q of Denny's Corporation for the quarter ended September 26, 2018).
+*10.7 Denny's Corporation Amended and Restated Executive and Key Employee Severance Pay Plan (incorporated by reference to Exhibit 10.1 to the Quarterly Report on Form 10-Q of Denny's Corporation for the quarter ended September 26, 2018).
+*10.8 Denny's Inc. Deferred Compensation Plan, as amended and restated effective March 1, 2017 (incorporated by reference to Exhibit 99.1 to the Registration Statement on Form S-8 of Denny's Corporation (Commission File No. 333-216655) filed with the Commission on March 13, 2017).
+*10.9 Denny's Corporation 2017 Omnibus Incentive Plan (incorporated by reference to Exhibit 99.1 to the Registration Statement on Form S-8 of Denny's Corporation (Commission File No. 333-217843) filed with the Commission on May 10, 2017).

38
Exhibit No. Description
+*10.10 Denny's Corporation 2012 Omnibus Incentive Plan (incorporated by reference to Appendix A of the Definitive Proxy Statement of Denny's Corporation filed with the Commission on April 5, 2012).
+*10.11 Denny's Corporation 2008 Omnibus Incentive Plan (incorporated by reference to Exhibit 99.1 to the Current Report on Form 8-K of Denny's Corporation filed with the Commission on May 27, 2008).
+*10.12 Amendment to the Denny's Corporation 2008 Omnibus Incentive Plan (incorporated by reference to Exhibit 10.3 to the Quarterly Report on Form 10-Q of Denny's Corporation for the quarter ended April 1, 2009).
+*10.13 Denny's Corporation Amended and Restated 2004 Omnibus Incentive Plan (incorporated by reference to Exhibit 10.2 to the Quarterly Report on Form 10-Q of Denny's Corporation for the quarter ended June 25, 2008).
+*10.14 Form of the 2014 Long-Term Performance Incentive Program Performance Shares and Target Cash Opportunity Award Certificate (incorporated by reference to Exhibit 10.1 to the Quarterly Report on Form 10-Q of Denny's Corporation for the quarter ended March 26, 2014).
+*10.15 Written Description of the Denny's 2014 Long-Term Performance Incentive Program (incorporated by reference to Exhibit 10.2 to the Quarterly Report on Form 10-Q of Denny's Corporation for the quarter ended March 26, 2014).
+*10.16 Form of Long-Term Incentive Program Award Certificate (incorporated by reference to Exhibit 10.1 to the Quarterly Report on Form 10-Q of Denny's Corporation for the quarter ended April 1, 2015).
+*10.17 Form of the Written Description of the Denny’s Long-Term Incentive Program (incorporated by reference to Exhibit 10.2 to the Quarterly Report on Form 10-Q of Denny’s Corporation for the quarter ended April 1, 2015).
+*10.18 Form of Stock Option Award Agreement (incorporated by reference to Exhibit 10.28 to the Annual Report on Form 10-K of Denny's Corporation for the year ended December 29, 2010).
+*10.19 Denny's Corporate Incentive Plan (incorporated by reference to Exhibit 10.30 to the Annual Report on Form 10-K of Denny's Corporation for the year ended December 30, 2009).
+10.20 Form of deferred stock unit award certificate to be used under the Denny's Corporation 2012 Omnibus Incentive Plan (incorporated by reference to Exhibit 10.27 to the Annual Report on From 10-K of Denny's Corporation for the year ended December 31, 2014).
+10.21 Form of deferred stock unit award certificate to be used under the Denny’s Corporation 2017 Omnibus Incentive Plan (incorporated by reference to Exhibit 10.26 to the Annual Report on Form 10-K of Denny’s Corporation for the year ended December 27, 2017).
+*10.22 2018 Long-Term Incentive Program Performance Share Unit Award Certificate (Executive Officers) (incorporated by reference to Exhibit 10.1 to the Quarterly Report on Form 10-Q of Denny's Corporation for the quarter ended March 28, 2018).
+*10.23 2018 Long-Term Incentive Program Performance Share Unit Award Certificate (Executive Officers with Special Retirement Vesting) (incorporated by reference to Exhibit 10.2 to the Quarterly Report on Form 10-Q of Denny's Corporation for the quarter ended March 28, 2018).

39
Exhibit No. Description
+*10.24 Summary of Non-Employee Director Compensation as of November 9, 2017 (incorporated by reference to Exhibit 10.29 to the Annual Report on Form 10-K of Denny’s Corporation for the year ended December 27, 2017).
21.1 Subsidiaries of Denny’s Corporation.
23.1 Consent of KPMG LLP.
31.1 Certification of John C. Miller, President and Chief Executive Officer of Denny’s Corporation, pursuant to Rule 13a-14(a), as adopted pursuant to Section 302 of the Sarbanes-Oxley Act of 2002.
31.2 Certification of F. Mark Wolfinger, Executive Vice President, Chief Administrative Officer and Chief Financial Officer of Denny’s Corporation, pursuant to Rule 13a-14(a), as adopted pursuant to Section 302 of the Sarbanes-Oxley Act of 2002.
32.1 Statement of John C. Miller, President and Chief Executive Officer of Denny’s Corporation, and F. Mark Wolfinger, Executive Vice President, Chief Administrative Officer and Chief Financial Officer of Denny’s Corporation, pursuant to 18 U.S.C. Section 1350, as adopted pursuant to Section 906 of the Sarbanes-Oxley Act of 2002.
101.INS XBRL Instance Document
101.SCH XBRL Taxonomy Extension Schema Document
101.CAL XBRL Taxonomy Extension Calculation Linkbase Document
101.LAB XBRL Taxonomy Extension Label Linkbase Document
101.PRE XBRL Taxonomy Extension Presentation Linkbase Document
101.DEF XBRL Taxonomy Extension Definition Linkbase Document
+ Denotes management contracts or compensatory plans or arrangements.* Incorporated by reference.
Item 16. Form 10-K Summary None.
F - 1
DENNY’S CORPORATION AND SUBSIDIARIES
INDEX TO CONSOLIDATED FINANCIAL STATEMENTS
PageReport of Independent Registered Public Accounting Firm on Consolidated Financial Statements F-2Consolidated Balance Sheets F-3Consolidated Statements of Income F-4Consolidated Statements of Comprehensive Income F-5Consolidated Statements of Shareholders’ Deficit F-6Consolidated Statements of Cash Flows F-7Notes to Consolidated Financial Statements F-8
-

F - 2
Report of Independent Registered Public Accounting Firm To the Shareholders and Board of DirectorsDenny’s Corporation.
Opinion on the Consolidated Financial Statements
We have audited the accompanying consolidated balance sheets of Denny’s Corporation and subsidiaries (the Company) as of December 26, 2018 and December 27, 2017, the related consolidated statements of income, comprehensive income, shareholders’ deficit, and cash flows for each of the years in the three-year period ended December 26, 2018, and the related notes (collectively, the consolidated financial statements). In our opinion, the consolidated financial statements present fairly, in all material respects, the financial position of the Company as of December 26, 2018 and December 27, 2017, and the results of its operations and its cash flows for each of the years in the three-year period ended December 26, 2018, in conformity with U.S. generally accepted accounting principles.
We also have audited, in accordance with the standards of the Public Company Accounting Oversight Board (United States) (PCAOB), the Company’s internal control over financial reporting as of December 26, 2018, based on criteria established in Internal Control - Integrated Framework (2013) issued by the Committee of Sponsoring Organizations of the Treadway Commission, and our report dated February 25, 2019 expressed an unqualified opinion on the effectiveness of the Company’s internal control over financial reporting on the effectiveness of the Company’s internal control over financial reporting.
Change in Accounting Principle
As discussed in Note 2 to the consolidated financial statements, the Company has changed its method of accounting for revenue from contracts with customers effective December 28, 2017 due to the adoption of Accounting Standards Update (“ASU”) 2014-09, “Revenue from Contracts with Customers (Topic 606)” and all subsequent ASUs that modified Topic 606.
Basis for Opinion
These consolidated financial statements are the responsibility of the Company’s management. Our responsibility is to express an opinion on these consolidated financial statements based on our audits. We are a public accounting firm registered with the PCAOB and are required to be independent with respect to the Company in accordance with the U.S. federal securities laws and the applicable rules and regulations of the Securities and Exchange Commission and the PCAOB.
We conducted our audits in accordance with the standards of the PCAOB. Those standards require that we plan and perform the audit to obtain reasonable assurance about whether the consolidated financial statements are free of material misstatement, whether due to error or fraud. Our audits included performing procedures to assess the risks of material misstatement of the consolidated financial statements, whether due to error or fraud, and performing procedures that respond to those risks. Such procedures included examining, on a test basis, evidence regarding the amounts and disclosures in the consolidated financial statements. Our audits also included evaluating the accounting principles used and significant estimates made by management, as well as evaluating the overall presentation of the consolidated financial statements. We believe that our audits provide a reasonable basis for our opinion.
/s/ KPMG LLP
We have served as the Company’s auditor since 2003.
Greenville, South CarolinaFebruary 25, 2019

F - 3
Denny’s Corporation and SubsidiariesConsolidated Balance Sheets
December 26, 2018 December 27, 2017 (In thousands)Assets Current assets:
Cash and cash equivalents $ 5,026 $ 4,983Investments 1,709 —Receivables, net 26,283 21,384Inventories 2,993 3,134Assets held for sale 723 —Prepaid and other current assets 10,866 11,788
Total current assets 47,600 41,289Property, net 140,004 139,856Goodwill 39,781 38,269Intangible assets, net 59,067 57,109Deferred financing costs, net 2,335 2,942Deferred income taxes 17,333 16,945Other noncurrent assets 29,229 27,372
Total assets $ 335,349 $ 323,782
Liabilities Current liabilities:
Current maturities of capital lease obligations 3,410 3,168Accounts payable 29,527 32,487Other current liabilities 61,790 59,246
Total current liabilities 94,727 94,901Long-term liabilities:
Long-term debt, less current maturities 286,500 259,000Capital lease obligations, less current maturities 27,181 27,054Liability for insurance claims, less current portion 12,199 12,236Other noncurrent liabilities 48,087 27,951
Total long-term liabilities 373,967 326,241Total liabilities 468,694 421,142
Commitments and contingencies
Shareholders’ equity (deficit) Common stock $0.01 par value; shares authorized - 135,000; December 26, 2018:
108,585 shares issued and 61,533 shares outstanding; December 27, 2017: 107,740shares issued and 64,589 shares outstanding 1,086 1,077
Paid-in capital 592,944 594,166Deficit (306,414) (334,661)Accumulated other comprehensive loss, net of tax (4,146) (2,316)
Shareholders’ equity before treasury stock 283,470 258,266Treasury stock, at cost, 47,052 and 43,151 shares, respectively (416,815) (355,626)
Total shareholders’ deficit (133,345) (97,360)Total liabilities and shareholders’ deficit $ 335,349 $ 323,782
See accompanying notes to consolidated financial statements.

F - 4
Denny’s Corporation and SubsidiariesConsolidated Statements of Income
Fiscal Year Ended December 26, 2018 December 27, 2017 December 28, 2016 (In thousands, except per share amounts)Revenue:
Company restaurant sales $ 411,932 $ 390,352 $ 367,310Franchise and license revenue 218,247 138,817 139,638
Total operating revenue 630,179 529,169 506,948Costs of company restaurant sales:
Product costs 100,532 97,825 90,487Payroll and benefits 164,314 153,037 142,823Occupancy 23,228 20,802 19,557Other operating expenses 60,708 53,049 49,229
Total costs of company restaurant sales 348,782 324,713 302,096Costs of franchise and license revenue 114,296 39,294 40,805General and administrative expenses 63,828 66,415 67,960Depreciation and amortization 27,039 23,720 22,178Operating (gains), losses and other charges, net 2,620 4,329 26,910
Total operating costs and expenses, net 556,565 458,471 459,949Operating income 73,614 70,698 46,999Interest expense, net 20,745 15,640 12,232Other nonoperating expense (income), net 619 (1,743) (1,109)Net income before income taxes 52,250 56,801 35,876Provision for income taxes 8,557 17,207 16,474Net income $ 43,693 $ 39,594 $ 19,402
Basic net income per share $ 0.69 $ 0.58 $ 0.26Diluted net income per share $ 0.67 $ 0.56 $ 0.25
Basic weighted average shares outstanding 63,364 68,077 75,325Diluted weighted average shares outstanding 65,562 70,403 77,206
See accompanying notes to consolidated financial statements.

F - 5
Denny’s Corporation and SubsidiariesConsolidated Statements of Comprehensive Income
Fiscal Year Ended December 26, 2018 December 27, 2017 December 28, 2016 (In thousands)Net income $ 43,693 $ 39,594 $ 19,402Other comprehensive (loss) income, net of tax:
Minimum pension liability adjustment, net of tax of $53, $(22)and $2,148 155 (37) 21,819
Recognition of unrealized (loss) gain on hedge transactions,net of tax of $(303), $(559) and $353 (1,985) (872) 551
Other comprehensive (loss) income (1,830) (909) 22,370Total comprehensive income $ 41,863 $ 38,685 $ 41,772
See accompanying notes to consolidated financial statements.

F -
6
Den
ny’s
Cor
pora
tion
and
Subs
idia
ries
Con
solid
ated
Sta
tem
ents
of S
hare
hold
ers’
Def
icit
C
omm
on S
tock
Trea
sury
Sto
ckPa
id-in
Acc
umul
ated
Oth
erC
ompr
ehen
sive
Tota
lSh
areh
olde
rs’
Equ
ity /
Sh
ares
Am
ount
Shar
esA
mou
ntC
apita
l(D
efic
it)L
oss,
Net
(Def
icit)
(I
n th
ousa
nds)
Bal
ance
, Dec
embe
r 30,
201
510
6,52
1$
1,06
5(2
9,65
9)$
(201
,002
)$
565,
364
$(4
02,2
45)
$(2
3,77
7)$
(60,
595)
Net
inco
me
——
——
—19
,402
—19
,402
Oth
er c
ompr
ehen
sive
inco
me
——
——
——
22,3
7022
,370
Shar
e-ba
sed
com
pens
atio
n on
equ
ity c
lass
ified
aw
ards
——
——
5,59
0—
—5,
590
Purc
hase
of t
reas
ury
stoc
k—
—(4
,580
)(5
1,77
1)—
——
(51,
771)
Equi
ty fo
rwar
d co
ntra
ct se
ttlem
ent
——
(1,5
18)
(13,
111)
13,1
11—
——
Equi
ty fo
rwar
d co
ntra
ct is
suan
ce—
——
—(6
,884
)—
—(6
,884
)Is
suan
ce o
f com
mon
stoc
k fo
r sha
re-b
ased
com
pens
atio
n38
34
——
(4)
——
—Ex
erci
se o
f com
mon
stoc
k op
tions
211
2—
—88
7—
—88
9Ta
x be
nefit
from
shar
e-ba
sed
com
pens
atio
n—
——
—(1
13)
——
(113
)B
alan
ce, D
ecem
ber 2
8, 2
016
107,
115
$1,
071
(35,
757)
$(2
65,8
84)
$57
7,95
1$
(382
,843
)$
(1,4
07)
$(7
1,11
2)C
umul
ativ
e ef
fect
adj
ustm
ent
——
——
551
8,58
8—
9,13
9N
et in
com
e—
——
——
39,5
94—
39,5
94O
ther
com
preh
ensi
ve lo
ss—
——
——
—(9
09)
(909
)Sh
are-
base
d co
mpe
nsat
ion
on e
quity
cla
ssifi
ed a
war
ds—
——
—8,
131
——
8,13
1Pu
rcha
se o
f tre
asur
y st
ock
——
(6,8
40)
(82,
858)
——
—(8
2,85
8)Eq
uity
forw
ard
cont
ract
settl
emen
t—
—(5
54)
(6,8
84)
6,88
4—
——
Issu
ance
of c
omm
on st
ock
for s
hare
-bas
ed c
ompe
nsat
ion
398
4—
—(4
)—
——
Exer
cise
of c
omm
on st
ock
optio
ns22
72
——
653
——
655
Bal
ance
, Dec
embe
r 27,
201
710
7,74
0$
1,07
7(4
3,15
1)$
(355
,626
)$
594,
166
$(3
34,6
61)
$(2
,316
)$
(97,
360)
Cum
ulat
ive
effe
ct a
djus
tmen
t—
——
——
(15,
446)
—(1
5,44
6)N
et in
com
e—
——
——
43,6
93—
43,6
93O
ther
com
preh
ensi
ve lo
ss—
——
——
—(1
,830
)(1
,830
)Sh
are-
base
d co
mpe
nsat
ion
on e
quity
cla
ssifi
ed a
war
ds—
——
—4,
325
——
4,32
5Pu
rcha
se o
f tre
asur
y st
ock
——
(3,9
01)
(61,
189)
——
—(6
1,18
9)Eq
uity
forw
ard
cont
ract
issu
ance
——
——
(6,7
63)
——
(6,7
63)
Issu
ance
of c
omm
on st
ock
for s
hare
-bas
ed c
ompe
nsat
ion
447
5—
—(5
)—
——
Exer
cise
of c
omm
on st
ock
optio
ns39
84
——
1,22
1—
—1,
225
Bal
ance
, Dec
embe
r 26,
201
810
8,58
5$
1,08
6(4
7,05
2)$
(416
,815
)$
592,
944
$(3
06,4
14)
$(4
,146
)$
(133
,345
)
Se
e ac
com
pany
ing
note
s to
cons
olid
ated
fina
ncia
l sta
tem
ents
.
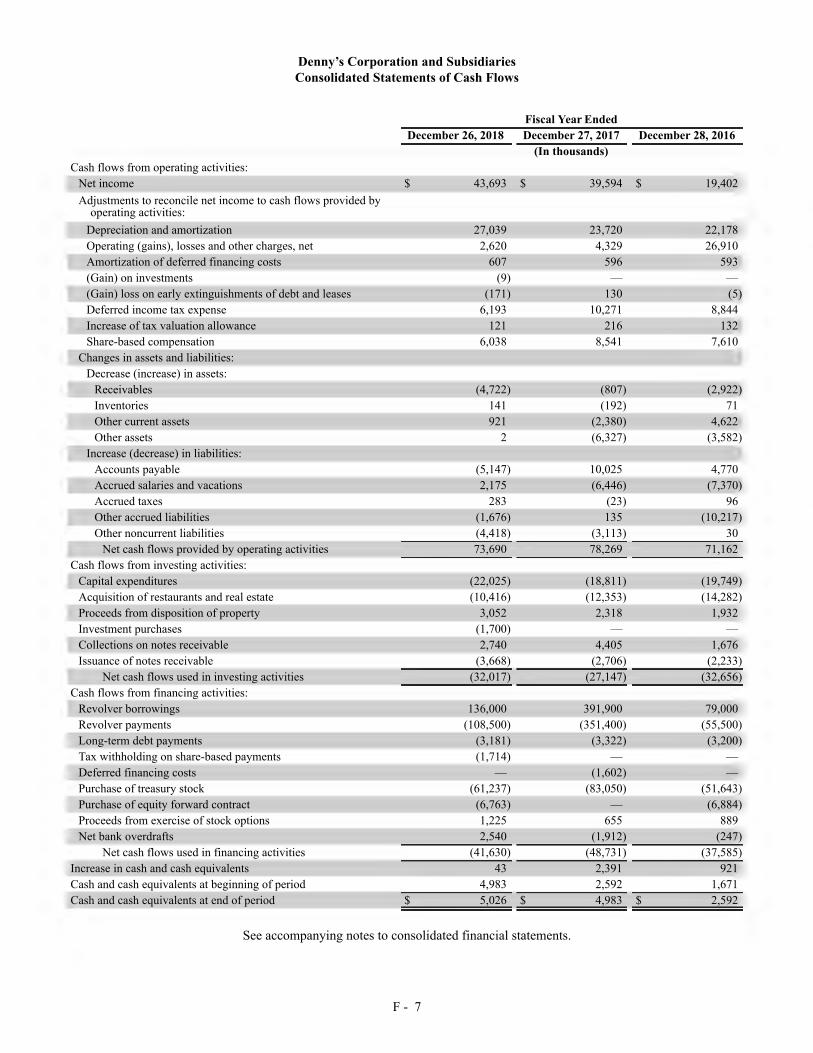
F - 7
Denny’s Corporation and SubsidiariesConsolidated Statements of Cash Flows
Fiscal Year Ended December 26, 2018 December 27, 2017 December 28, 2016 (In thousands)Cash flows from operating activities:
Net income $ 43,693 $ 39,594 $ 19,402Adjustments to reconcile net income to cash flows provided by
operating activities: Depreciation and amortization 27,039 23,720 22,178Operating (gains), losses and other charges, net 2,620 4,329 26,910Amortization of deferred financing costs 607 596 593(Gain) on investments (9) — —(Gain) loss on early extinguishments of debt and leases (171) 130 (5)Deferred income tax expense 6,193 10,271 8,844Increase of tax valuation allowance 121 216 132Share-based compensation 6,038 8,541 7,610
Changes in assets and liabilities: Decrease (increase) in assets:
Receivables (4,722) (807) (2,922)Inventories 141 (192) 71Other current assets 921 (2,380) 4,622Other assets 2 (6,327) (3,582)
Increase (decrease) in liabilities: Accounts payable (5,147) 10,025 4,770Accrued salaries and vacations 2,175 (6,446) (7,370)Accrued taxes 283 (23) 96Other accrued liabilities (1,676) 135 (10,217)Other noncurrent liabilities (4,418) (3,113) 30
Net cash flows provided by operating activities 73,690 78,269 71,162Cash flows from investing activities:
Capital expenditures (22,025) (18,811) (19,749)Acquisition of restaurants and real estate (10,416) (12,353) (14,282)Proceeds from disposition of property 3,052 2,318 1,932Investment purchases (1,700) — —Collections on notes receivable 2,740 4,405 1,676Issuance of notes receivable (3,668) (2,706) (2,233)
Net cash flows used in investing activities (32,017) (27,147) (32,656)Cash flows from financing activities:
Revolver borrowings 136,000 391,900 79,000Revolver payments (108,500) (351,400) (55,500)Long-term debt payments (3,181) (3,322) (3,200)Tax withholding on share-based payments (1,714) — —Deferred financing costs — (1,602) —Purchase of treasury stock (61,237) (83,050) (51,643)Purchase of equity forward contract (6,763) — (6,884)Proceeds from exercise of stock options 1,225 655 889Net bank overdrafts 2,540 (1,912) (247)
Net cash flows used in financing activities (41,630) (48,731) (37,585)Increase in cash and cash equivalents 43 2,391 921Cash and cash equivalents at beginning of period 4,983 2,592 1,671Cash and cash equivalents at end of period $ 5,026 $ 4,983 $ 2,592
See accompanying notes to consolidated financial statements.

F - 8
Denny’s Corporation and SubsidiariesNotes to Consolidated Financial Statements
Note 1. Introduction and Basis of Reporting Denny’s Corporation, or Denny’s, is one of America’s largest franchised full-service restaurant chains based on number of restaurants. Denny’s restaurants are operated in all 50 states, the District of Columbia, two U.S. territories and 10 foreign countries with principal concentrations in California (23% of total restaurants), Texas (11%) and Florida (8%).
At December 26, 2018, the Denny’s brand consisted of 1,709 restaurants, 1,536 of which were franchised/licensed restaurants and 173 of which were company operated. Note 2. Summary of Significant Accounting Policies The following accounting policies significantly affect the preparation of our Consolidated Financial Statements: Use of Estimates. In preparing our Consolidated Financial Statements in conformity with U.S. generally accepted accounting principles, management is required to make certain assumptions and estimates that affect reported amounts of assets, liabilities, revenues, expenses and the disclosure of contingencies. In making these assumptions and estimates, management may from time to time seek advice and consider information provided by actuaries and other experts in a particular area. Actual amounts could differ materially from these estimates.
Consolidation Policy. Our Consolidated Financial Statements include the financial statements of Denny’s Corporation and its wholly-owned subsidiaries: Denny’s, Inc., DFO, LLC, Denny’s Realty, LLC and East Main Insurance Company. All significant intercompany balances and transactions have been eliminated in consolidation. Fiscal Year. Our fiscal year ends on the last Wednesday in December. As a result, a fifty-third week is added to a fiscal year every five or six years. Fiscal 2018, 2017 and 2016 each included 52 weeks of operations. Our next 53 week year will be fiscal 2020.
Cash and Cash Equivalents. Our policy is to invest cash in excess of operating requirements in short-term highly liquid investments with an original maturity of three months or less, which we consider to be cash equivalents. Cash and cash equivalents include short-term investments of $0.4 million and $1.9 million at December 26, 2018 and December 27, 2017, respectively. Receivables. Receivables, which are recorded at net realizable value, primarily consist of trade accounts receivables and financing receivables from franchisees, vendor receivables and credit card receivables. Trade accounts receivables from franchisees consist of royalties, advertising and rent. Financing receivables from franchisees primarily consist of notes from franchisees related to the roll-out of equipment. We accrue interest on notes receivable based on the contractual terms. The allowance for doubtful accounts is based on pre-defined criteria and management’s judgment of existing receivables. Receivables that are ultimately deemed to be uncollectible, and for which collection efforts have been exhausted, are written off against the allowance for doubtful accounts. Inventories. Inventories consist of food and beverages and are valued primarily at the lower of cost and net realizable value.
Property and Depreciation. Owned property is stated at cost. Property under capital leases is stated at the lesser of its fair value or the net present value of the related minimum lease payments at the lease inception. Maintenance and repairs are expensed as incurred. We depreciate owned property over its estimated useful life using the straight-line method. We amortize property held under capital leases (at capitalized value) over the lesser of its estimated useful life or the initial lease term. In certain situations, one or more option periods may be used in determining the depreciable life of certain leasehold improvements under operating lease agreements, if we deem that an economic penalty will be incurred and exercise of such option periods is reasonably assured. In either circumstance, our policy requires lease term consistency when calculating the depreciation period, in classifying the lease and in computing rent expense. Building assets are assigned estimated useful lives that range from five to 30 years. Equipment assets are assigned lives that range from two to ten years. Leasehold improvements are generally assigned lives between five and 15 years limited by the expected lease term.

F - 9
Goodwill. Amounts recorded as goodwill primarily represent excess reorganization value recognized as a result of our 1998 bankruptcy. We also record goodwill in connection with the acquisition of restaurants from franchisees. Likewise, upon the sale of restaurant operations to franchisees, goodwill is decremented. We test goodwill for impairment at each fiscal year end and more frequently if circumstances indicate impairment may exist. Such indicators include, but are not limited to, a significant decline in our expected future cash flows, a significant adverse decline in our stock price, significantly adverse legal developments and a significant change in the business climate. Intangible Assets. Intangible assets consist primarily of trade names and reacquired franchise rights. Trade names are considered indefinite-lived intangible assets and are not amortized. Reacquired franchise rights are amortized using the straight-line basis over the term of the related franchise agreement. Reacquired franchise rights resulting from acquisitions are accounted for using the purchase method of accounting and are estimated by management based on the fair value of the assets received.
We test trade name assets for impairment at each fiscal year end, and more frequently if circumstances indicate impairment may exist. We assess impairment of reacquired franchise rights whenever changes or events indicate that the carrying value may not be recoverable. Costs incurred to renew or extend the term of recognized intangible assets are recorded in general and administrative expenses in our Consolidated Statements of Income. Marketable Securities. Marketable securities include debt and equity mutual funds that are considered trading securities and are included at fair value as a component of investments and other noncurrent assets in our Consolidated Balance Sheets. Marketable securities included in other noncurrent assets represent the plan assets of our nonqualified deferred compensation plan (the “plan assets”). The plan assets are held in a rabbi trust. Each plan participant’s account is comprised of their contribution, our matching contribution (made prior to 2016) and each participant’s share of earnings or losses in the plan. We have recorded offsetting deferred compensation liabilities as a component of other noncurrent liabilities in our Consolidated Balance Sheets.
The realized and unrealized holding gains and losses related to marketable securities are recorded in other income (expense) with an offsetting amount recorded in general and administrative expenses related to deferred compensation plan liabilities. During 2018, 2017 and 2016, we incurred a net loss of $1.0 million and net gains of $1.6 million and $0.9 million, respectively, related to marketable securities. Deferred Financing Costs. Costs related to the issuance of debt are deferred and amortized as a component of interest expense using the effective interest method over the terms of the respective debt issuances. Self-insurance Liabilities. We record liabilities for insurance claims during periods in which we have been insured under large deductible programs or have been self-insured for our medical claims and workers’ compensation, general, product and automobile insurance liabilities. The liabilities for prior and current estimated incurred losses are discounted to their present value based on expected loss payment patterns determined by independent actuaries using our actual historical payments. These estimates include assumptions regarding claims frequency and severity as well as changes in our business environment, medical costs and the regulatory environment that could impact our overall self-insurance costs.
Total discounted workers’ compensation, general, product and automobile insurance liabilities at December 26, 2018 and December 27, 2017 were $17.0 million, reflecting a 2.5% discount rate, and $16.9 million, reflecting a 2.0% discount rate, respectively. The related undiscounted amounts at such dates were $18.2 million and $18.1 million, respectively.
Income Taxes. We account for income taxes under the asset and liability method. Deferred tax assets and liabilities are recognized for the future tax consequences attributable to differences between the financial statement carrying amounts of existing assets and liabilities and their respective tax bases and operating loss and tax credit carryforwards. All deferred taxes are reported as noncurrent in our Consolidated Balance Sheets. A valuation allowance reduces our net deferred tax asset to the amount that is more likely than not to be realized. We make certain estimates and judgments in the calculation of our provision for incomes taxes, in the resulting tax liabilities, and in the recoverability of deferred tax assets.
We record a liability for unrecognized tax benefits resulting from tax positions taken, or expected to be taken, in an income tax return. We recognize any interest and penalties related to unrecognized tax benefits in income tax expense. Assessment of uncertain tax positions requires judgments relating to the amounts, timing and likelihood of resolution.

F - 10
Leases and Subleases. Our policy requires the use of a consistent lease term for calculating the depreciation period for related buildings and leasehold improvements, classifying the lease and computing periodic rent expense where the lease terms include escalations in rent over the lease term. The lease term commences on the date we gain access to and control over the leased property. We account for rent escalations in leases on a straight-line basis over the expected lease term. Any rent holidays after lease commencement are recognized on a straight-line basis over the expected lease term, which includes the rent holiday period. Leasehold improvements that have been funded by lessors have historically been insignificant. Any leasehold improvements we make that are funded by lessor incentives or allowances under operating leases are recorded as leasehold improvement assets and amortized over the expected lease term. Such incentives are also recorded as deferred rent and amortized as reductions to lease expense over the expected lease term. We record contingent rent expense based on estimated sales for respective restaurants over the contingency period. Contingent rental income is recognized when earned. Fair Value Measurements. The carrying amounts of cash and cash equivalents, accounts receivables, accounts payable and accrued expenses are deemed to approximate fair value due to the immediate or short-term maturity of these instruments. The fair value of notes receivable approximates the carrying value after consideration of recorded allowances and related risk-based interest rates. The liabilities under our credit facility are carried at historical cost, which approximates fair value. The fair value of our long-term debt is determined based on market prices or, if market prices are not available, the present value of the underlying cash flows discounted at market rates.
Employee Benefit Plans. Each year we measure and recognize the funded status of our defined benefit plans in our Consolidated Balance Sheets as of December 31. That date represents the month-end that is closest to our fiscal year-end. The funded status is adjusted for any contributions or significant events (such as a plan amendment, settlement, or curtailment that calls for a remeasurement) that occurs between our fiscal year-end and December 31.
Derivative Instruments. We use derivative financial instruments to manage our exposure to interest rate risk. We do not enter into derivative instruments for trading or speculative purposes. All derivatives are recognized on our Consolidated Balance Sheets at fair value based upon quoted market prices. Changes in the fair values of derivatives are recorded in earnings or other comprehensive income (“OCI”), based on whether the instrument is designated as a hedge transaction. Gains or losses on derivative instruments reported in OCI are classified to earnings in the period the hedged item affects earnings. If the underlying hedge transaction ceases to exist, any associated amounts reported in OCI are reclassified to earnings at that time. Any ineffectiveness is recognized in earnings in the current period. By entering into derivative instruments, we are exposed to counterparty credit risk. When the fair value of a derivative instrument is in an asset position, the counterparty has a liability to us, which creates credit risk for us. We manage our exposure to this risk by selecting counterparties with investment grade credit ratings and regularly monitoring our market position with each counterparty. Contingencies and Litigation. We are subject to legal proceedings involving ordinary and routine claims incidental to our business, as well as legal proceedings that are nonroutine and include compensatory or punitive damage claims. Our ultimate legal and financial liability with respect to such matters cannot be estimated with certainty and requires the use of estimates in recording liabilities for potential litigation settlements. When the reasonable estimate is a range, the recorded loss will be the best estimate within the range. We record legal settlement costs as other operating expenses in our Consolidated Statements of Income as those costs are incurred. Comprehensive Income. Comprehensive income includes net income and OCI items that are excluded from net income under U.S. generally accepted accounting principles. OCI items include additional minimum pension liability adjustments and the effective unrealized portion of changes in the fair value of cash flow hedges.
Segment. Denny’s operates in only one segment. All significant revenues and pre-tax earnings relate to retail sales of food and beverages to the general public through either company or franchised restaurants.
Revenues. Effective December 28, 2017, the first day of fiscal 2018, we adopted Accounting Standards Update (“ASU”) 2014-09, “Revenue from Contracts with Customers (Topic 606)” and all subsequent ASUs that modified Topic 606. See the “Newly Adopted Accounting Standards” section of this Note 2 for further information on our adoption and Note 3 for further information about our transition to Topic 606 and the newly required disclosures.
Company Restaurant Revenue. Company restaurant revenue is recognized at the point in time when food and beverage products are sold at company restaurants. We present company restaurant sales net of sales-related taxes collected from customers and remitted to governmental taxing authorities. The adoption of Topic 606 did not impact the recognition of company restaurant sales.

F - 11
Franchise Revenue. Franchise and license revenues consist primarily of royalties, advertising revenue, initial and other fees and occupancy revenue.
Under franchise agreements we provide franchisees with a license of our brand’s symbolic intellectual property, administration of advertising programs (including local co-operatives), and other ongoing support functions. These services are highly interrelated so we do not consider them to be individually distinct performance obligations, and therefore account for them under Topic 606 as a single performance obligation. Revenue from franchise agreements is recognized evenly over the term of the agreement with the exception of sales-based royalties.
Royalty and advertising revenues represent sales-based royalties that are recognized in the period in which the sales occur. Sales-based royalties are variable consideration related to our performance obligation to our franchisees to maintain the intellectual property being licensed. Under our franchise agreements, franchisee advertising contributions must be spent on marketing and related activities. The adoption of Topic 606 did not impact the recognition of royalties. Upon adoption of Topic 606, advertising revenues and expenditures are recorded on a gross basis within the Consolidated Statements of Income. Under the previous guidance of Topic 605, we recorded franchise advertising expense net of contributions from franchisees to our advertising programs, including local co-operatives. While this change materially impacts the gross amount of reported franchise and license revenue and costs of franchise and license revenue, the impact is generally an offsetting increase to both revenue and expense with little, if any, impact on operating income and net income.
Initial and other fees consist of initial, successor and assignment franchise fees (“initial franchise fees”). Initial franchise fees are billed and received upon the signing of the franchise agreement. Under Topic 606, recognition of these fees is deferred until the commencement date of the agreement and occurs over time based on the term of the underlying franchise agreement. In the event a franchise agreement is terminated, any remaining deferred fees are recognized in the period of termination. Under the previous guidance, initial franchise fees were recognized upon the opening of a franchise restaurant.
Initial and other fees also includes revenue that are distinct from the franchise agreement and are separate performance obligations. Training and other franchise services fees are billed and recognized at a point in time as services are rendered. Similar to advertising revenue, upon adoption of Topic 606, other franchise services fees are recorded on a gross basis within the Consolidated Statements of Income, whereas, under previous guidance, they were netted against the related expenses.
Occupancy revenue results from leasing or subleasing restaurants to franchisees and is recognized over the term of the lease agreement.
With the exception of initial and other franchise fees, revenues are typically billed and collected on a weekly basis. For 2018, 2017 and 2016, our ten largest franchisees accounted for 30%, 31% and 29% of our franchise revenues, respectively.
Gift cards. We sell gift cards which have no stated expiration dates in our company restaurants, franchised restaurants and at certain third party retailers. We recognize revenue when a gift card is redeemed in one of our company restaurants. We maintain a gift card liability for cards sold in our company restaurants and for cards sold by third parties. Upon adoption of Topic 606, gift card breakage is recognized proportionally as redemptions occur. Our gift card breakage primarily relates to cards sold by third parties and is recorded as advertising revenue (included as a component of franchise and license revenue). Under previous guidance, we recorded gift card breakage when the likelihood of redemption was remote. Breakage was recorded as a benefit to our advertising fund or reduction to other operating expenses, depending on where the gift cards were sold.
Advertising Costs. We expense production costs for radio and television advertising in the year in which the commercials are initially aired. Advertising costs for company restaurants are recorded as a component of other operating expenses in our Consolidated Statements of Income and were $15.0 million, $14.3 million and $13.1 million for 2018, 2017 and 2016, respectively. Advertising costs related to franchised restaurants are recorded as a component of franchise and license costs and were $78.3 million in 2018. Prior to the adoption of Topic 606, franchise advertising expense was recorded net of contributions from franchisees to our advertising programs, including local co-operatives. Advertising costs were $1.9 million (net of franchise contributions of $79.7 million) and $1.9 million (net of franchise contributions of $76.5 million) for 2017 and 2016, respectively. Restructuring and Exit Costs. Restructuring and exit costs consist primarily of the costs of future obligations related to closed restaurants, severance and other restructuring charges for terminated employees, and are included as a component of operating (gains), losses and other charges, net in our Consolidated Statements of Income.

F - 12
Discounted liabilities for future lease costs and the fair value of related subleases of closed restaurants are recorded when the restaurants are closed. All other costs related to closed restaurants are expensed as incurred. In assessing the discounted liabilities for future costs of obligations related to closed restaurants, we make assumptions regarding amounts of future assumed subleases. If these assumptions or their related estimates change in the future, we may be required to record additional exit costs or reduce exit costs previously recorded. Exit costs recorded for each of the periods presented include the effect of such changes in estimates. Disposal or Impairment of Long-lived Assets. We evaluate our long-lived assets for impairment at the restaurant level on a quarterly basis, when assets are identified as held for sale or whenever changes or events indicate that the carrying value may not be recoverable. For assets identified as held for sale, we use the market approach and consider proceeds from similar asset sales. We assess impairment of restaurant-level assets based on the operating cash flows of the restaurant, expected proceeds from the sale of assets and our plans for restaurant closings. Generally, all restaurants with negative cash flows from operations for the most recent twelve months at each quarter end are included in our assessment. For underperforming assets, we use the income approach to determine both the recoverability and estimated fair value of the assets. To estimate future cash flows, we make certain assumptions about expected future operating performance, such as revenue growth, operating margins, risk-adjusted discount rates, and future economic and market conditions. If the long-lived assets of a restaurant are not recoverable based upon estimated future, undiscounted cash flows, we write the assets down to their fair value. If these estimates or their related assumptions change in the future, we may be required to record additional impairment charges. These charges are included as a component of operating (gains), losses and other charges, net in our Consolidated Statements of Income.
Assets held for sale consist of real estate properties and/or restaurant operations that we expect to sell within the next year. The assets are reported at the lower of carrying amount or fair value less costs to sell. We cease recording depreciation on assets that are classified as held for sale. If the determination is made that we no longer expect to sell an asset within the next year, the asset is reclassified out of held for sale.
Discontinued Operations. We evaluate restaurant closures and assets reclassified to assets held for sale for potential disclosure as discontinued operations. Only disposals resulting in a strategic shift that will have a major effect on our operations and financial results are reported as discontinued operations. There were no such disposals, nor any disposals of individually significant components. The gains and losses related to restaurant closures and assets reclassified to assets held for sale are included as a component of operating (gain), losses and other charges, net in our Consolidated Statements of Income. Gains and Losses on Sales of Restaurants Operations to Franchisees, Real Estate and Other Assets. Generally, gains and losses on sales of restaurant operations to franchisees (which may include real estate), real estate properties and other assets are recognized when the sales are consummated and certain other gain recognition criteria are met. Total gains and losses are included as a component of operating (gains), losses and other charges, net in our Consolidated Statements of Income. Share-based Compensation. Share-based compensation cost is measured at the grant date, based on the fair value of the award, and is recognized as an expense over the requisite service period. Share-based compensation expense is included as a component of general and administrative expenses in our Consolidated Statements of Income. Starting in fiscal 2017, in accordance with the adoption of Accounting Standards Update (“ASU”) 2016-09, we elected to account for forfeitures as they occur. Previously, we estimated potential forfeitures of share-based awards and adjusted the forfeiture rate over the requisite service period to the extent that actual forfeitures differed from such estimates. The cumulative-effect adjustment to retained earnings from previously estimated forfeitures resulted in a $0.4 million increase to opening deficit in fiscal 2017, a $0.2 million increase in deferred tax assets and a $0.6 million increase to additional paid-in capital. Also in accordance with ASU 2016-09, starting in 2017, excess tax benefits recognized related to share-based compensation are included as a component of provision for income taxes in our Consolidated Statements of Income and are classified as operating activities in our Consolidated Statements of Cash Flows. The cumulative-effect adjustment to retained earnings from previously unrecognized excess tax benefits resulted in a $9.0 million increase in deferred tax assets and a decrease to opening deficit in fiscal 2017.
Generally, compensation expense related to restricted stock units, performance shares, performance units and board deferred stock units is based on the number of shares and units expected to vest, the period over which they are expected to vest and the fair market value of our common stock on the date of the grant. For restricted stock units and performance shares that contain a market condition, compensation expense is based on the Monte Carlo valuation method, which utilizes multiple input variables to determine the probability of the Company achieving the market condition and the fair value of the award. The key assumptions used include expected volatility and risk-free interest rates over the term of the award. The amount of certain cash-settled awards is determined based on the date of payment. Therefore, compensation expense related to these cash-settled awards is adjusted to fair value at each balance sheet date. Compensation expense for options is recognized on a straight-line basis over the requisite service period for the entire award.

F - 13
Subsequent to the vesting period, earned stock-settled restricted stock units and performance shares (both of which are equity classified) are paid to the holder in shares of our common stock, and the cash-settled restricted stock units and performance units (both of which are liability classified) are paid to the holder in cash, provided the holder was still employed with Denny’s or an affiliate as of the vesting date. Earnings Per Share. Basic earnings per share is calculated by dividing net income by the weighted average number of common shares outstanding during the period. Diluted earnings per share is calculated by dividing net income by the weighted average number of common shares and potential common shares outstanding during the period.
Newly Adopted Accounting Standards
Effective December 28, 2017, the first day of fiscal 2018, we adopted Accounting Standards Update (“ASU”) 2014-09, “Revenue from Contracts with Customers (Topic 606)” and all subsequent ASUs that modified Topic 606. The new guidance clarifies the principles used to recognize revenue for all entities and requires a company to recognize revenue when it transfers goods or services to a customer in an amount that reflects the consideration to which a company expects to be entitled. We elected to apply the modified retrospective method of adoption to those contracts which were not completed as of December 28, 2017. In doing so, we applied the practical expedient to aggregate all contract modifications that occurred before December 28, 2017 in determining the satisfied and unsatisfied performance obligations, the transaction price and the allocation of the transaction price to the satisfied and unsatisfied performance obligations. Results for reporting periods beginning after December 28, 2017 are presented under Topic 606. Prior period amounts are not adjusted and continue to be reported in accordance with our historical accounting under Topic 605 “Revenue Recognition.” Our transition to Topic 606 represents a change in accounting principle. See Note 3 for further information about our transition to Topic 606 and the newly required disclosures.
Effective December 28, 2017, we adopted ASU 2016-01, “Financial Instruments—Overall (Subtopic 825-10): Recognition and Measurement of Financial Assets and Financial Liabilities.” The new guidance requires equity investments (except those accounted for under the equity method of accounting, or those that result in consolidation of the investee) to be measured at fair value with changes in fair value recognized in net income, requires public business entities to use the exit price notion when measuring the fair value of financial instruments for disclosure purposes, requires separate presentation of financial assets and financial liabilities by measurement category and form of financial asset, and eliminates the requirement for public business entities to disclose the method(s) and significant assumptions used to estimate the fair value that is required to be disclosed for financial instruments measured at amortized cost. The adoption of this guidance did not have any impact on our Consolidated Financial Statements.
Effective December 28, 2017, we adopted ASU 2017-07, “Compensation—Retirement Benefits (Topic 715): Improving the Presentation of Net Periodic Pension Cost and Net Periodic Postretirement Benefit Cost.” The new guidance requires an entity to report the service cost component in the same line on the income statement as other compensation costs arising from services rendered by the pertinent employees during the period. The other components of net benefit cost are required to be presented in the income statement separately from the service cost component and outside the subtotal of income from operations, if one is presented. If a separate line item is not used, the line item used in the income statement must be disclosed. The adoption of this guidance did not have any impact on our Consolidated Financial Statements.
Effective December 28, 2017, we early adopted ASU 2018-02, “Income Statement—Reporting Comprehensive Income (Topic 220): Reclassification of Certain Tax Effects from Accumulated Other Comprehensive Income.” The new guidance allows a reclassification from accumulated other comprehensive income to retained earnings for stranded tax effects resulting from the Tax Cuts and Jobs Act of 2017 (the “Tax Act”) and requires certain disclosures about stranded tax effects. Due to the immateriality of the stranded tax effects resulting from the implementation of the Tax Act, we have elected not to reclassify these amounts from accumulated other comprehensive income to retained earnings. Therefore the adoption of this guidance did not have any impact on our Consolidated Financial Statements.
Effective December 28, 2017, we early adopted ASU 2017-12, “Derivatives and Hedging (Topic 815): Targeted Improvements to Accounting for Hedging Activities.” The new update better aligns an entity’s risk management activities and financial reporting for hedging relationships, simplifies the hedge accounting requirements, and improves the disclosures of hedging arrangements. The amended presentation and disclosure guidance has been applied on a prospective basis. The adoption of this guidance did not have any impact on our Consolidated Financial Statements.
Effective September 26, 2018, we early adopted ASU 2018-13, “Fair Value Measurement (Topic 820): Disclosure Framework—Changes to the Disclosure Requirements for Fair Value Measurement,” which modifies the disclosure requirements on fair value measurements. The adoption of this guidance did not have any impact on our disclosures.

F - 14
Effective September 26, 2018, we early adopted ASU 2018-14, “Compensation—Retirement Benefits—Defined Benefit Plans—General (Topic 715-20): Disclosure Framework—Changes to the Disclosure Requirements for Defined Benefit Plans,” which modifies the disclosure requirements for defined benefit pension plans and other postretirement plans. The adoption of this guidance had an immaterial impact on our annual disclosures.
Effective September 26, 2018, we early adopted ASU 2018-15, “Intangibles—Goodwill and Other—Internal-Use Software (Subtopic 350-40): Customer’s Accounting for Implementation Costs Incurred in a Cloud Computing Arrangement That Is a Service Contract (a consensus of the FASB Emerging Issues Task Force),” which aligns the requirements for capitalizing implementation costs incurred in a hosting arrangement that is a service contract with the requirements for capitalizing implementation costs incurred to develop or obtain internal-use software. The guidance was adopted on a prospective basis and did not have a material impact on our Consolidated Financial Statements.
Additional new accounting guidance became effective for us as of December 28, 2017 that we reviewed and concluded was either not applicable to our operations or had no material effect on the our Consolidated Financial Statements and related disclosures.
Accounting Standards to be Adopted
In February 2016, the Financial Accounting Standards Board (“FASB”) issued ASU 2016-02, “Leases (Topic 842),” which provides guidance for accounting for leases and disclosure of key information about leasing arrangements. The new guidance established a right-of-use model (“ROU”) that requires lessees to recognize a ROU asset and a lease liability for all leases with terms greater than 12 months. Lessees will classify leases as financing or operating, which affects the pattern and classification of expense recognition in the income statement. The guidance requires lessors to classify leases as sales-type, direct financing or operating. The FASB has subsequently amended this guidance by issuing additional ASUs to provide a land easement practical expedient, clarification and further guidance around areas identified as potential implementation issues and to allow an alternative transition method.
The new guidance requires either a modified retrospective transition approach with initial application at the beginning of the earliest period presented in the financial statements or an effective date approach with initial application at the adoption date and recognition of a cumulative effect adjustment to the opening balance of retained earnings. All of the standards are effective for annual and interim periods beginning after December 15, 2018 (our fiscal 2019) with early adoption permitted. We will adopt the guidance as of December 27, 2018 (the first day of fiscal 2019) using the effective date method. Consequently, financial information will not be updated and the disclosures required under the new guidance will not be provided for dates and periods before our adoption date.
The new guidance provides a number of optional practical expedients in transition. We expect to elect the “package of practical expedients,” which permits us to not reassess prior conclusions about lease identification, lease classification and initial direct costs. In addition, we do not expect to elect the use of the hindsight practical expedient, which would allow us to reassess lease terms and impairment of the ROU assets, or the land easement practical expedient. In preparation for adoption, we have completed the implementation of a new lease management system. We expect to use the portfolio approach in applying the discount rate.
As a lessee, the adoption of ASU 2016-02 will have a material impact on our Consolidated Balance Sheet resulting from the recognition of operating lease ROU assets and lease liabilities primarily relating to real estate leases. Although the new guidance is also expected to impact the measurement and presentation of certain expenses and cash flows related to leasing arrangements, we do not believe there will be a material impact to our Consolidated Statements of Comprehensive Income or Consolidated Statements of Cash Flows. We do not expect the recognition of the additional lessee operating lease liabilities will impact any credit facility debt covenants as these liabilities are not considered to be debt. As a lessor, we currently do not expect the new guidance to have a material effect on our Consolidated Financial Statements, as we believe substantially all of our existing leases will continue to be classified as operating leases. We also expect to add significant new disclosures about our leasing activities, both as lessee and lessor.
On adoption, as a lessee, we currently expect to recognize operating lease liabilities, ranging from $100 million to $105 million and ROU assets ranging from $91 million to $96 million based on the present value of the remaining minimum rental payments under current leasing standards for existing operating leases primarily relating to real estate leases.

F - 15
The new guidance also provides practical expedients and accounting elections for our ongoing accounting. We expect to elect the short-term lease recognition exemption for all leases that qualify, and therefore will not recognize ROU assets or lease liabilities for these leases. We also expect to elect both the lessee and lessor practical expedients in regards to all leases, and therefore will not separate nonlease components, such as common area maintenance, from lease components in these leases. We expect to use the portfolio approach in applying the discount rate to our real estate leases.
We continue to evaluate certain aspects of the new guidance, including those still being revised by the FASB.
In June 2016, the FASB issued ASU 2016-13, “Financial Instruments—Credit Losses (Topic 326): Measurement of Credit Losses on Financial Instruments.” The new guidance replaces the incurred loss impairment methodology in current GAAP with a methodology that reflects expected credit losses and requires consideration of a broader range of reasonable and supportable information to inform financial statement users of credit loss estimates. ASU 2016-13 is effective for annual and interim periods beginning after December 15, 2019 (our fiscal 2020) with early adoption permitted for annual and interim periods beginning after December 15, 2018 (our fiscal 2019). We do not expect the adoption of this guidance to have a material impact on our Consolidated Financial Statements.
We reviewed all other newly issued accounting pronouncements and concluded that they are either not applicable to our business or are not expected to have a material effect on our Consolidated Financial Statements as a result of future adoption.
Note 3. Revenues
Our revenues are derived primarily from two sales channels, which we operate as one segment: company restaurants and franchised and licensed restaurants. The following table disaggregates our revenue by sales channels and types of goods or services.
Fiscal Year Ended
December 26, 2018 December 27, 2017 (1) December 28, 2016 (1)
Company restaurant sales $ 411,932 $ 390,352 $ 367,310Franchise and license
revenue:Royalties 101,557 100,631 98,416Advertising revenue 78,308 — —Initial and other fees 6,422 2,466 2,717Occupancy revenue 31,960 35,720 38,505Franchise and license
revenue 218,247 138,817 139,638Total operating revenue $ 630,179 $ 529,169 $ 506,948
(1) As disclosed in Note 2, prior period amounts have not been adjusted under the modified retrospective method of adoption of Topic 606.
Financial Statement Impact of Adoption
The following tables summarize the impact of adopting Topic 606 on our financial statement line items as of December 26, 2018 and for the quarter and year ended December 26, 2018.

F - 16
Year ended December 26, 2018
Consolidated Balance SheetAs
Reported Adjustments
Amountswithout
adoption ofTopic 606
(In thousands)Prepaid and other current assets $ 10,866 $ 509 $ 11,375Deferred income taxes 17,333 (4,988) 12,345Other current liabilities 61,790 (407) 61,383Other noncurrent liabilities 48,087 (18,370) 29,717Deficit (306,414) 14,298 (292,116)
Quarter ended December 26, 2018 Year ended December 26, 2018
Consolidated Statementof Income
AsReported Adjustments
Amountswithout
adoption ofTopic 606
AsReported Adjustments
Amountswithout
adoption ofTopic 606
(In thousands, except per share amounts)Franchise and license
revenue $ 55,160 $ (21,162) $ 33,998 $ 218,247 $ (82,815) $ 135,432Costs of franchise and
license revenue 28,517 (20,962) 7,555 114,296 (81,268) 33,028
Provision for income taxes 1,340 (52) 1,288 8,557 (400) 8,157
Net income 11,503 (148) 11,355 43,693 (1,147) 42,546
Basic net income per share $ 0.19 $ (0.01) $ 0.18 $ 0.69 $ (0.02) $ 0.67Diluted net income per
share $ 0.18 $ — $ 0.18 $ 0.67 $ (0.02) $ 0.65
Quarter ended December 26, 2018 Year ended December 26, 2018
Consolidated Statementof ComprehensiveIncome
AsReported Adjustments
Amountswithout
adoption ofTopic 606
AsReported Adjustments
Amountswithout
adoption ofTopic 606
(In thousands)Net income $ 11,503 $ (148) $ 11,355 $ 43,693 $ (1,147) $ 42,546Total comprehensive
income 4,816 (148) 4,668 41,863 (1,147) 40,716
Year ended December 26, 2018
Consolidated Statement of Cash FlowAs
Reported Adjustments
Amountswithout
adoption ofTopic 606
(In thousands)
Net income $ 43,693 $ (1,147) $ 42,546
Deferred income tax expense 6,193 (400) 5,793
Changes in assets and liabilities:
Other current assets 921 (509) 412
Other accrued liabilities (1,676) 573 (1,103)
Other noncurrent liabilities (4,418) 1,483 (2,935)
Net cash flows provided by operating activities 73,690 — 73,690

F - 17
The following significant changes impacted our financial statement line items as of December 26, 2018 and for the quarter and year ended December 26, 2018:
• Upon adoption of Topic 606, we recorded a cumulative effect adjustment related to previously recognized initial franchise fees resulting in a $21.0 million increase to deferred franchise revenue, a $15.6 million increase to opening deficit and a $5.4 million increase to deferred tax assets. The deferred franchise revenue resulting from the cumulative effect adjustment will be amortized over the remaining lives of the individual franchise agreements. Also upon adoption, we recorded a cumulative effect adjustment to recognize breakage in proportion to redemptions that occurred prior to December 28, 2017 resulting in a decrease of $0.6 million to gift card liability (a component of other current liabilities), a $0.5 million increase to accrued advertising (a component of other current liabilities) and a $0.1 million decrease to opening deficit.
• We recognized franchise and license revenue and costs of franchise and license revenue of $19.9 million for the quarter and $78.3 million year-to-date resulting from the recording of advertising revenues and expenditures on a gross basis under Topic 606 versus recording these amounts on a net basis under Topic 605.
• We recognized additional franchise and license revenue of $0.2 million for the quarter and $1.5 million year-to-date under Topic 606 than we would have recognized under Topic 605, resulting from the timing of recognition of initial franchise fees.
• We recognized franchise and license revenue and costs of franchise and license revenue of $1.0 million for the quarter and $3.0 million year-to-date resulting from the recording of other franchise services fees on a gross basis under Topic 606 versus recording these amount on a net basis under Topic 605.
Contract Balances
Contract balances related to contracts with customers consists of receivables, deferred franchise revenue and deferred gift card revenue. See Note 5 for details on our receivables.
Deferred franchise revenue consists primarily of the unamortized portion of initial franchise fees that are currently being amortized into revenue and amounts related to development agreements and unopened restaurants that will begin amortizing into revenue when the related restaurants are opened. Deferred franchise revenue represents our remaining performance obligations to our franchisees, excluding amounts of variable consideration related to sales-based royalties and advertising. The components of the change in deferred franchise revenue are as follows:

F - 18
(In thousands)Balance, December 27, 2017 $ 1,643Cumulative effect adjustment recognized upon adoption of Topic 606 20,976Fees received from franchisees 1,256Revenue recognized (1) (3,337)
Balance, December 26, 2018 20,538Less current portion included in other current liabilities 2,124
Deferred franchise revenue included in other noncurrent liabilities $ 18,414
(1) Of this amount $3.3 million was included in either the deferred franchise revenue balance as of December 27, 2017 or the cumulative effect adjustment.
As of December 26, 2018, the deferred franchise revenue expected to be recognized in the future is as follows:
(In thousands)2019 $ 2,1242020 1,9772021 1,7962022 1,6872023 1,608Thereafter 11,346
Deferred franchise revenue $ 20,538
Deferred gift card liabilities consist of the unredeemed portion of gift cards sold in company restaurants and at third party locations. The balance of deferred gift card liabilities represents our remaining performance obligations to our customers. The balance of deferred gift card liabilities as of both December 26, 2018 and December 27, 2017 was $6.5 million. During the year ended December 26, 2018, we recognized revenue of $1.9 million from gift card redemptions at company restaurants.
Note 4. Refranchisings and Acquisitions Refranchisings
During the years ended December 26, 2018, December 27, 2017 and December 28, 2016 we sold eight, four and six restaurants to franchisees and recognized related losses of $0.7 million and $0.3 million and a gain of $0.6 million, respectively. The 2018 sales were part of the refranchising and development strategy announced during the fourth quarter of 2018. Gains (losses) on the sale of company owned restaurants are included as a component of operating (gains), losses and other charges, net. See Note 9.
As of December 26, 2018, we have recorded assets held for sale at their carrying amount of $0.7 million related to three company owned restaurants and one piece of real estate. There were no assets held for sale as of December 27, 2017. The fair value of assets held for sale is based upon Level 2 inputs, which include sales agreements.
Acquisitions
We account for the acquisition of franchised restaurants using the acquisition method of accounting for business combinations. The purchase price allocations were based on Level 3 fair value estimates. The following table summarizes our acquisition activity.

F - 19
December 26, 2018 December 27, 2017 December 28, 2016
(Dollars in thousands)
Restaurants acquired from franchisees (1) 6 11 10
Purchase price allocation:
Reacquired franchise rights $ 5,434 $ 4,476 $ 9,544
Property 1,121 1,293 2,277
Goodwill 1,574 3,022 1,827
Intangibles — — 40
Total purchase price $ 8,129 $ 8,791 $ 13,688
Capital leases recorded $ 2,409 $ 2,321 $ 3,441
(1) 2017 includes one restaurant acquired from a former franchisee.
Note 5. Receivables Receivables, net were comprised of the following:
December 26, 2018 December 27, 2017 (In thousands)Receivables, net:
Trade accounts receivable from franchisees $ 11,459 $ 10,688Financing receivables from franchisees 3,211 5,084Vendor receivables 4,016 3,256Credit card receivables 5,955 1,870Other 1,942 762Allowance for doubtful accounts (300) (276)
Total receivables, net $ 26,283 $ 21,384
Other noncurrent assets: Financing receivables from franchisees $ 1,528 $ 427
During the year ended December 26, 2018, we recorded an allowance for doubtful accounts of $0.2 million of financing receivables from a franchisee. Also, as of December 26, 2018, there were $1.0 million of insurance receivables, which are included as a component of other receivables in the above table, that primarily related to hurricane damages incurred during the prior year and other property damage incurred during the current year.

F - 20
Note 6. Property Property, net consisted of the following:
December 26, 2018 December 27, 2017 (In thousands)Land $ 33,566 $ 32,506Buildings and leasehold improvements 241,990 243,872Other property and equipment 68,315 67,786
Total property owned 343,871 344,164Less accumulated depreciation 226,620 227,959
Property owned, net 117,251 116,205Buildings, vehicles and other equipment held under capital leases 38,279 39,017Less accumulated amortization 15,526 15,366
Property held under capital leases, net 22,753 23,651Total property, net $ 140,004 $ 139,856
The following table reflects the property assets, included in the table above, which were leased to franchisees:
December 26, 2018 December 27, 2017 (In thousands)Land $ 16,730 $ 15,490Buildings and leasehold improvements 53,790 54,948
Total property owned, leased to franchisees 70,520 70,438Less accumulated depreciation 46,354 48,225
Property owned, leased to franchisees, net 24,166 22,213Buildings held under capital leases, leased to franchisees 5,776 6,060Less accumulated amortization 2,746 3,300
Property held under capital leases, leased to franchisees, net 3,030 2,760Total property leased to franchisees, net $ 27,196 $ 24,973
Depreciation expense, including amortization of property under capital leases, for 2018, 2017 and 2016 was $23.0 million, $21.2 million and $20.6 million, respectively. Substantially all owned property is pledged as collateral for our Credit Facility. See Note 12. Note 7. Goodwill and Intangible Assets The following table reflects the changes in carrying amounts of goodwill:
December 26, 2018 December 27, 2017 (In thousands)Balance, beginning of year $ 38,269 $ 35,233Additions related to acquisitions 1,574 3,022Adjustments related to the sale of restaurants (62) 14
Balance, end of year $ 39,781 $ 38,269

F - 21
Intangible assets were comprised of the following:
December 26, 2018 December 27, 2017
GrossCarryingAmount
AccumulatedAmortization
GrossCarryingAmount
AccumulatedAmortization
(In thousands)Intangible assets with indefinite lives:
Trade names $ 44,087 $ — $ 44,080 $ —Liquor licenses 166 — 166 —
Intangible assets with definite lives: Reacquired franchise rights 19,933 5,119 15,252 2,389Intangible assets $ 64,186 $ 5,119 $ 59,498 $ 2,389
The weighted-average life of the reacquired franchise rights is approximately eight years. The amortization expense for definite-lived intangibles and other assets for 2018, 2017 and 2016 was $4.1 million, $2.5 million and $1.5 million, respectively. Estimated amortization expense for intangible assets with definite lives in the next five years is as follows:
(In thousands)2019 $ 3,1852020 2,6672021 1,6482022 1,4952023 1,105
We performed an annual impairment test as of December 26, 2018 and determined that none of the recorded goodwill or other intangible assets with indefinite lives were impaired. Note 8. Other Current Liabilities Other current liabilities consisted of the following:
December 26, 2018 December 27, 2017 (In thousands)Accrued payroll $ 23,395 $ 20,998Accrued insurance, primarily current portion of liability for insurance claims 7,323 6,922Accrued taxes 7,667 7,384Accrued advertising 7,413 8,417Gift cards 6,546 6,480Other 9,446 9,045
Other current liabilities $ 61,790 $ 59,246

F - 22
Note 9. Operating (Gains), Losses and Other Charges, Net
Operating (gains), losses and other charges, net were comprised of the following:
Fiscal Year Ended
December 26, 2018 December 27, 2017 December 28, 2016
(In thousands)
Pension settlement loss $ — $ — $ 24,297
Software implementation costs — 5,247 —
(Gains) losses on sales of assets and other, net (513) (1,729) 29
Restructuring charges and exit costs 1,575 485 1,486
Impairment charges 1,558 326 1,098Operating (gains), losses and other charges, net $ 2,620 $ 4,329 $ 26,910
Gains on sales of assets and other, net of $0.5 million for the year ended December 26, 2018 primarily related to gains of $1.2 million of insurance settlements on fire-damaged and hurricane-damaged restaurants, partially offset by $0.7 million of losses on sales of company owned units to franchisees. See Note 4 for details on refranchisings. Gains on the sales of assets and other, net of $1.7 million for the year ended December 27, 2017 primarily related to real estate sold to franchisees. Software implementation costs of $5.2 million for the year ended December 27, 2017 were the result of our investment in a new cloud-based Enterprise Resource Planning system. The pre-tax pension settlement loss of $24.3 million related to the completion of the liquidation of the Advantica Pension Plan during the year ended December 28, 2016. See Note 13 for details on the Pension Plan liquidation.
Restructuring charges and exit costs were comprised of the following:
Fiscal Year Ended December 26, 2018 December 27, 2017 December 28, 2016 (In thousands)Exit costs $ 518 $ 385 $ 591Severance and other restructuring charges 1,057 100 895
Total restructuring charges and exit costs $ 1,575 $ 485 $ 1,486
Exit costs are primarily comprised of lease costs related to closed restaurants. The components of the change in accrued exit cost liabilities were as follows:
December 26, 2018 December 27, 2017 (In thousands)Balance, beginning of year $ 1,180 $ 1,896Exit costs (1) 518 385Payments, net of sublease receipts (615) (1,189)Interest accretion 72 88
Balance, end of year 1,155 1,180Less current portion included in other current liabilities 546 345
Long-term portion included in other noncurrent liabilities $ 609 $ 835
(1) Included as a component of operating (gains), losses and other charges, net.
The increase in severance and other restructuring charges for the year ended December 26, 2018, was primarily the result of positions eliminated as part of our refranchising and development strategy announced during the fourth quarter. As of December 26, 2018 and December 27, 2017, we had accrued severance and other restructuring charges of $0.6 million and less than $0.1 million, respectively. The balance as of December 26, 2018 is expected to be paid during the next 12 months.

F - 23
Estimated net cash payments related to exit cost liabilities in the next five years are as follows:
(In thousands)2019 $ 5322020 1772021 1782022 1782023 166Thereafter —
Total 1,231Less imputed interest 76
Present value of exit cost liabilities $ 1,155
The present value of exit cost liabilities is net of $1.2 million of subleases. See Note 10 for a schedule of future minimum lease commitments and amounts to be received as lessor or sub-lessor for both open and closed restaurants.
Impairment charges of $1.6 million for the year ended December 26, 2018 primarily related to the impairment of an underperforming unit. Impairment charges of $0.3 million for the year ended December 27, 2017 related to the relocation of two high-performing company restaurants due to the loss of property control. Impairment charges of $1.1 million for the year ended December 28, 2016 resulted primarily from the impairment of restaurants identified as assets held for sale. Note 10. Leases Our operations utilize property, facilities and equipment leased from others. Buildings and facilities are primarily used for restaurants and support facilities. Many of our restaurants are operated under lease arrangements which generally provide for a fixed base rent, and, in many instances, contingent rent based on a percentage of gross revenues. Initial terms of land and restaurant building leases generally range from 10 to 15 years, exclusive of options to renew, which are typically for five year periods. Leases of other equipment consist primarily of restaurant equipment, computer systems and vehicles. Minimum future lease commitments and amounts to be received as lessor or sublessor under non-cancelable leases, including leases for both open and closed restaurants and optional renewal periods that have been included in the lease term, at December 26, 2018 were as follows:
Commitments Lease Receipts Capital Operating Operating (In thousands)2019 $ 9,271 $ 23,504 $ 21,0012020 8,664 20,161 18,4932021 8,010 17,316 16,5732022 7,320 14,646 14,8872023 6,451 11,881 12,932Thereafter 33,670 49,004 65,273
Total 73,386 $ 136,512 $ 149,159Less imputed interest 42,795
Present value of capital lease obligations $ 30,591

F - 24
Rent expense is a component of both occupancy expense and costs of franchise and license revenue in our Consolidated Statements of Income. Lease and sublease rental income is a component of franchise and license revenue in our Consolidated Statements of Income. Rental expense and income were comprised of the following:
Fiscal Year Ended December 26, 2018 December 27, 2017 December 28, 2016 (In thousands)Rental expense:
Included as a component of occupancy:Base rents $ 10,272 $ 9,315 $ 8,602Contingent rents 3,074 3,168 3,351
Included as a component of costs of franchise andlicense expense:Base rents $ 15,108 $ 17,674 $ 19,883Contingent rents $ 2,629 $ 2,864 $ 3,077
Total rental expense $ 31,083 $ 33,021 $ 34,913
Rental income: Included as a component of franchise and license
revenue:Base rents $ 22,831 $ 25,781 $ 28,183Contingent rents 4,662 5,042 5,337
Total rental income $ 27,493 $ 30,823 $ 33,520
Note 11. Fair Value of Financial Instruments
Fair Value of Assets and Liabilities Measured on a Recurring and Nonrecurring Basis Financial assets and liabilities measured at fair value on a recurring basis are summarized below:
Total
Quoted Prices in Active Markets
for Identical Assets/Liabilities
(Level 1)
Significant Other
Observable Inputs
(Level 2)
Significant Unobservable
Inputs(Level 3)
(In thousands)Fair value measurements as of December 26, 2018:
Deferred compensation plan investments (1) $ 11,235 $ 11,235 $ — $ —Interest rate swaps, net (2) (4,475) — (4,475) —Investments (3) 1,709 — 1,709 —
Total $ 8,469 $ 11,235 $ (2,766) $ —
Fair value measurements as of December 27, 2017:Deferred compensation plan investments (1) $ 12,663 $ 12,663 $ — $ —Interest rate swaps (2) $ (2,187) $ — $ (2,187) $ —
Total $ 10,476 $ 12,663 $ (2,187) $ —
(1) The fair values of our deferred compensation plan investments are based on the closing market prices of the elected investments.(2) The fair values of our interest rate swaps are based upon Level 2 inputs, which include valuation models as reported by our counterparties. The key
inputs for the valuation models are quoted market prices, interest rates and forward yield curves. See Note 12 for details on the interest rate swaps.(3) The fair value of investments is valued using a readily determinable net asset value per share based on the fair value of the underlying securities.
There are no significant redemption restrictions associated with these investments. See Note 4 for the disclosures related to the fair value of assets held for sale and acquired franchised restaurants.

F - 25
Note 12. Long-Term Debt Long-term debt consisted of the following:
December 26, 2018 December 27, 2017 (In thousands)Revolving loans $ 286,500 $ 259,000Capital lease obligations 30,591 30,222
Total long-term debt 317,091 289,222Less current maturities 3,410 3,168
Noncurrent portion of long-term debt $ 313,681 $ 286,054
There are no future maturities of long-term debt due in 2019 through 2021. The $286.5 million of revolving loans are due October 26, 2022.
Denny’s Corporation and certain of its subsidiaries have a credit facility consisting of a five-year $400 million senior secured revolver (with a $30 million letter of credit sublimit). The credit facility includes an accordion feature that would allow us to increase the size of the revolver to $450 million. As of December 26, 2018, we had outstanding revolver loans of $286.5 million and outstanding letters of credit under the senior secured revolver of $19.8 million. These balances resulted in availability of $93.7 million under the credit facility. Prior to considering the impact of our interest rate swaps, described below, the weighted-average interest rate on outstanding revolver loans was 4.43% and 3.42% as of December 26, 2018 and December 27, 2017, respectively. Taking into consideration the interest rate swaps, the weighted-average interest rate of outstanding revolver loans was 4.48% and 3.32% as of December 26, 2018 and December 27, 2017, respectively.
A commitment fee, which is based on our consolidated leverage ratio, is paid on the unused portion of the credit facility and was 0.30% as of December 26, 2018. Borrowings under the credit facility bear a tiered interest rate, also based on our leverage ratio, and was set at LIBOR plus 200 basis points as of December 26, 2018.
The credit facility is available for working capital, capital expenditures and other general corporate purposes. The credit facility is guaranteed by Denny's and its material subsidiaries and is secured by assets of Denny's and its subsidiaries, including the stock of its subsidiaries (other than our insurance captive subsidiary). It includes negative covenants that are usual for facilities and transactions of this type. The credit facility also includes certain financial covenants with respect to a maximum consolidated leverage ratio and a minimum consolidated fixed charge coverage ratio. We were in compliance with all financial covenants as of December 26, 2018.
Interest Rate Hedges
We have interest rate swaps to hedge a portion of the forecasted cash flows of our floating rate debt. We designated these interest rate swaps as cash flow hedges of our exposure to variability in future cash flows attributable to payments of LIBOR due on forecasted notional debt obligations.
Under the interest rate swaps, we pay a fixed rate on the notional amount in addition to the current interest rate as determined by our consolidated leverage ratio in effect at the time. A summary of our interest rate swaps as of December 26, 2018 is as follows:
Trade Date Effective Date Maturity Date Notional Amount Fixed Rate
(In thousands)
March 20, 2015 March 29, 2018 March 31, 2025 $ 120,000 2.44%
October 1, 2015 March 29, 2018 March 31, 2026 50,000 2.46%
February 15, 2018 March 31, 2020 December 31, 2033 80,000 (1) 3.19%
(1) The notional amount of the swaps entered into on February 15, 2018 increases annually beginning September 30, 2020 until they reach the maximum notional amount of $425.0 million on September 28, 2029.

F - 26
As of December 26, 2018, the fair value of the interest rate swaps was a net liability of $4.5 million, which is comprised of assets of $1.8 million recorded as a component of other noncurrent assets and liabilities of $6.2 million recorded as a component of other noncurrent liabilities in our Consolidated Balance Sheets. See Note 17 for the amounts recorded in accumulated other comprehensive loss related to the interest rate swaps.
Note 13. Employee Benefit Plans We maintain several defined contribution plans and defined benefit plans which cover a substantial number of employees.
Defined Contribution Plans
Eligible employees can elect to contribute up to 25% of their compensation to our 401(k) plan. Effective January 1, 2016, the plan was amended and restated to incorporate Safe Harbor Plan design features which included changes to participant eligibility, company contribution amounts and vesting. As a result, we match up to a maximum of 4% of compensation deferred by the participant.
In addition, a non-qualified deferred compensation plan is offered to certain employees. This plan allows participants to defer up to 50% of annual salary and up to 100% of bonuses and incentive compensation awards, on a pre-tax basis. There are no matching contributions made under this plan.
We made total contributions of $2.2 million, $2.0 million and $2.2 million for 2018, 2017 and 2016, respectively, under these plans.

F - 27
Defined Benefit Plans Benefits under our defined benefit plans are based upon each employee’s years of service and average salary. The following table provides a reconciliation of the changes in the benefit obligations, plan assets, and funded status of our defined benefit plans:
December 26, 2018 December 27, 2017 (In thousands)Change in Benefit Obligation:
Benefit obligation at beginning of year $ 2,608 $ 2,639Interest cost 76 83Actuarial (gains) losses (96) 172Benefits paid (195) (195)Settlements — (91)
Benefit obligation at end of year $ 2,393 $ 2,608Accumulated benefit obligation $ 2,393 $ 2,608Change in Plan Assets:
Fair value of plan assets at beginning of year $ — $ —Employer contributions 195 286Benefits paid (195) (195)Settlements — (91)
Fair value of plan assets at end of year $ — $ —Funded status at end of year $ (2,393) $ (2,608)Amounts recognized on the balance sheet:
Other current liabilities $ (584) $ (280)Other noncurrent liabilities (1,809) (2,328)
Net amount recognized $ (2,393) $ (2,608)Amounts in accumulated other comprehensive loss not yet reflected in net
period benefit cost:Unamortized actuarial losses, net $ (885) $ (1,093)
Other changes in plan assets and benefit obligations recognized inaccumulated other comprehensive loss:
Benefit obligation actuarial gain (loss) $ 96 $ (172)Amortization of net loss 112 92Settlement loss recognized — 21
Other comprehensive income (loss) $ 208 $ (59)
The components of net periodic benefit cost were as follows:
Fiscal Year Ended December 26, 2018 December 27, 2017 December 28, 2016 (In thousands)
Interest cost $ 76 $ 83 $ 91Amortization of net loss 112 92 85Settlement loss recognized — 21 —
Net periodic benefit cost $ 188 $ 196 $ 176

F - 28
Assumptions
The discount rates used to determine the benefit obligations as of December 26, 2018 and December 27, 2017 were 3.83% and 3.08%, respectively. The discount rates used to determine net period pension costs for 2018, 2017 and 2016 were 3.08%, 3.31% and 3.62%, respectively. In determining the discount rate, we have considered long-term bond indices of bonds having similar timing and amounts of cash flows as our estimated defined benefit payments. We use a yield curve based on high quality, long-term corporate bonds to calculate the single equivalent discount rate that results in the same present value as the sum of each of the plan’s estimated benefit payments discounted at their respective spot rates.
Contributions and Expected Future Benefit Payments
We made contributions of $0.2 million and $0.3 million to our defined benefit plans during the years ended December 26, 2018 and December 27, 2017, respectively. We expect to contribute $0.6 million to our defined benefit plans during 2019.
Benefits expected to be paid for each of the next five years and in the aggregate for the five fiscal years from 2023 through 2027 are as follows:
Defined Benefit Plans (In thousands)2019 $ 5842020 2632021 2362022 3002023 3932024 through 2028 724
Terminated Pension Plan
During 2014, our Board of Directors approved the termination and liquidation of the Advantica Pension Plan (the “Pension Plan”) as of December 31, 2014. During the year ended December 28, 2016, we completed the liquidation of the Pension Plan. Accordingly, we made a final contribution of $9.5 million to the Pension Plan. The resulting $67.7 million in Pension Plan assets were used to make lump sum payments and purchase annuity contracts, which are administered by a third-party provider. In addition, during the year ended December 28, 2016, we recognized a $0.1 million of service cost and pre-tax settlement loss of $24.3 million related to the liquidation (included as a component of operating (gains), losses and other charges), reflecting the recognition of unamortized actuarial losses that were recorded in accumulated other comprehensive income. See Note 9 and Note 17. Note 14. Share-Based Compensation Share-Based Compensation Plans
We maintain four share-based compensation plans under which stock options and other awards granted to our employees and directors are outstanding. Currently, the Denny’s Corporation 2017 Omnibus Incentive Plan (the “2017 Omnibus Plan”) is used to grant share-based compensation to selected employees, officers and directors of Denny’s and its affiliates. However, we reserve the right to pay discretionary bonuses, or other types of compensation, outside of this plan. At December 26, 2018, there were 3.6 million shares available for grant under the 2017 Omnibus Plan. In addition, we have 0.7 million shares available to be issued outside of the 2017 Omnibus Plan pursuant to the grant or exercise of employment inducement awards of stock options and restricted stock units in accordance with NASDAQ Listing Rule 5635(c)(4).

F - 29
Share-Based Compensation Expense Total share-based compensation expense included as a component of net income was as follows:
Fiscal Year Ended December 26, 2018 December 27, 2017 December 28, 2016
(In thousands)Performance share awards $ 5,039 $ 7,838 $ 7,236Restricted stock units for board members 999 703 374
Total share-based compensation $ 6,038 $ 8,541 $ 7,610
The income tax benefits recognized as a component of the provision for income taxes in our Consolidated Statements of Income related to share-based compensation expense were approximately $1.6 million, $3.3 million and $3.0 million during the years ended December 26, 2018, December 27, 2017 and December 28, 2016, respectively.
Performance Share Units
We primarily grant performance share units containing a market condition based on the total shareholder return of our stock compared with the returns of a group of peer companies and performance share units containing a performance condition based on the Company’s achievement of certain operating metrics. The number of shares that are ultimately issued is dependent upon the level of obtainment of the market and performance conditions. The following table summarizes the performance share units activity during the year ended December 26, 2018:
Units
Weighted Average Grant
DateFair Value
(In thousands)Outstanding, beginning of year 1,737 $ 11.11Granted 471 $ 16.97Vested (489) $ 11.43Forfeited (31) $ 11.65
Outstanding, end of year 1,688 $ 12.65Convertible, end of year 630 $ 9.47
During the year ended December 26, 2018, and included in the performance share units activity table above, we granted certain employees approximately 0.2 million performance shares that vest based on the total shareholder return (“TSR”) of our common stock compared to the TSRs of a group of peer companies and 0.3 million performance shares that vest based on our Adjusted EPS growth rate, as defined under the terms of the award. As the TSR based performance shares contain a market condition, a Monte Carlo valuation was used to determine the grant date fair value of $18.17 per share. The performance shares based on the Adjusted EPS growth rate have a grant date fair value of $15.93 per share, the market value of our stock on the date of grant. The awards granted to our named executive officers also contain a performance condition based on the attainment of an operating measure for the fiscal year ended December 26, 2018. The performance period for these performance shares is the three year fiscal period beginning December 28, 2017 and ending December 30, 2020. The performance shares will vest and be earned (from 0% to 150% of the target award for each such increment) at the end of the performance period. For 2018, 2017 and 2016, the weighted average grant date fair value of awards granted was $16.97, $12.59 and $9.47, respectively.
We made payments of $0.2 million, $3.9 million and $2.5 million in cash during 2018, 2017 and 2016, respectively, related to converted performance share units. The intrinsic value of units converted was $9.8 million, $5.0 million and $3.5 million during 2018, 2017 and 2016, respectively. As of December 26, 2018 and December 27, 2017, we had accrued compensation of $0.4 million and $0.4 million, respectively, included as a component of other current liabilities and $0.2 million and $0.4 million, respectively, included as a component of other noncurrent liabilities in our Consolidated Balance Sheets, which represents future estimated payroll taxes. As of December 26, 2018, we had $8.6 million of unrecognized compensation cost related to unvested performance share unit awards granted, which is expected to be recognized over a weighted average of 1.9 years.

F - 30
Restricted Stock Units During the year ended December 26, 2018, we granted approximately 0.1 million restricted stock units (which are equity classified) with a weighted average grant date fair value of $15.46 per unit to non-employee members of our Board of Directors. The restricted stock units vest after a one year service period. A director may elect to convert these awards into shares of common stock on a specific date in the future (while still serving as a member of our Board of Directors) or upon termination as a member of our Board of Directors. During the year ended December 26, 2018, 0.2 million restricted stock units were converted into shares of common stock.
There were 0.8 million and 0.9 million restricted stock units outstanding as of December 26, 2018 and December 27, 2017, respectively. As of December 26, 2018, we had approximately $0.4 million of unrecognized compensation cost related to all unvested restricted stock unit awards outstanding, which is expected to be recognized over a weighted average of 0.4 years.
Stock Options
Prior to 2012, stock options were granted that vest evenly over three years, have a 10-year contractual life and are issued at the market value at the date of grant. There were no options granted in 2018, 2017 or 2016.
The following table summarizes information about stock options outstanding and exercisable at December 26, 2018:
Options
WeightedAverage
Exercise Price
Weighted AverageRemaining
Contractual Life
AggregateIntrinsic
Value (In thousands, except per share amounts)Outstanding, beginning of year 900 $ 3.04 Exercised (398) $ 3.08
Outstanding, end of year 502 $ 3.02 1.50 $ 6,649Exercisable, end of year 502 $ 3.02 1.50 $ 6,649
The total intrinsic value of the options exercised was $4.9 million, $2.3 million and $1.4 million during the years ended December 26, 2018, December 27, 2017 and December 28, 2016, respectively.
Note 15. Income Taxes The provisions for income taxes were as follows:
Fiscal Year Ended December 26, 2018 December 27, 2017 December 28, 2016 (In thousands)Current:
Federal $ (632) $ 3,688 $ 4,270State and local 1,833 2,071 2,316Foreign 1,042 961 912
Deferred: Federal 5,432 10,075 8,225State and local 761 196 619
Increase of valuation allowance 121 216 132Total provision for income taxes $ 8,557 $ 17,207 $ 16,474

F - 31
The reconciliation of income taxes at the U.S. federal statutory tax rate to our effective tax rate was as follows:
December 26, 2018 December 27, 2017 December 28, 2016Statutory provision rate 21% 35% 35%State and local taxes, net of federal income tax benefit 6 5 9Wage addback on income tax credits earned — 2 3General business credits generated (5) (5) (9)Foreign tax credits generated (2) (2) (12)Pension plan liquidation — — 18Share-based compensation (3) (3) —Impact of tax reform — (3) —Other (1) 1 2
Effective tax rate 16% 30% 46%
On December 22, 2017, The Tax Cut and Jobs Act of 2017 (the “Tax Act”) was signed into law. The Tax Act reduces the U.S. statutory tax rate from 35% to 21% for years after 2017. Accordingly, we revalued our deferred taxes as of December 27, 2017 to reflect the reduced rate that will apply in future periods when these deferred taxes are realized. The net tax benefit recognized in 2017 related to the Tax Act was $1.6 million.
The 2018 rate was primarily impacted by the Tax Act statutory tax rate reduction, state taxes and the generation of employment and foreign tax credits. In addition, the 2018 rate benefited $1.4 million from items related to share-based compensation. For the 2017 period, the difference in the overall effective rate from the U.S. statutory rate was primarily due to state taxes and the generation of employment and foreign tax credits. The 2017 rate also benefited $1.7 million from share-based compensation and $1.6 million from the revaluing of deferred tax assets and liabilities required under the Tax Act. For the 2016 period, the difference in the overall effective rate from the U.S. statutory rate was primarily due to state taxes, the generation of employment tax credits, the Pension Plan liquidation, and foreign tax credits generated with the filings of federal amended tax returns. The 2016 rate was impacted by the recognition of a $2.1 million tax benefit related to the $24.3 million pre-tax settlement loss on the Pension Plan liquidation. This benefit was at a rate lower than the effective tax rate due to the previous recognition of an approximate $7.2 million tax benefit recognized with the reversal of our valuation allowance in 2011. In addition, we amended prior years’ U.S. tax returns in order to maximize a foreign tax credit in lieu of a foreign tax deduction, resulting in a net tax benefit of approximately $3.7 million during the year.

F - 32
The following table represents the approximate tax effect of each significant type of temporary difference that resulted in deferred income tax assets or liabilities.
December 26, 2018 December 27, 2017 (In thousands)Deferred tax assets:
Self-insurance accruals $ 4,647 $ 4,364Capitalized leases 2,045 1,718Accrued exit cost 445 487Interest rate swaps 1,157 566Pension, other retirement and compensation plans 10,568 10,328Deferred income 5,099 609Other accruals 633 —Alternative minimum tax credit carryforwards 928 3,534General business and foreign tax credit carryforwards - state and federal 11,061 13,355Net operating loss carryforwards - state 13,899 14,096
Total deferred tax assets before valuation allowance 50,482 49,057Less: valuation allowance (13,199) (13,078)Total deferred tax assets 37,283 35,979
Deferred tax liabilities: Intangible assets (14,631) (14,578)Deferred finance costs (286) (111)Fixed assets (5,033) (4,179)Other accruals — (166)
Total deferred tax liabilities (19,950) (19,034)Net deferred tax asset $ 17,333 $ 16,945
At December 26, 2018, we had available, on a consolidated basis, federal general business credit carryforwards of approximately $7.4 million, most of which expire between years 2036 and 2038. We also had available alternative minimum tax (“AMT”) credit carryforwards of approximately $0.9 million, which under the Tax Act are now considered refundable credits estimated to be fully received by 2019. We will continue to include the AMT credits in our deferred tax assets until they are fully refunded or utilized.
It is more likely than not that we will be able to utilize our credit carryforwards prior to expiration. In addition, it is more likely than not we will be able to utilize all of our existing temporary differences and a portion of our state tax net operating losses and state tax credit carryforwards prior to their expiration. Of the $13.2 million of remaining valuation allowance, approximately $11.8 million represents South Carolina net operating loss carryforwards that will never be utilized. Prior to 2005, Denny’s had ownership changes within the meaning of Section 382 of the Internal Revenue Code. In general, Section 382 places annual limitations on the use of certain tax attributes, such as AMT tax credit carryforwards, in existence at the ownership change date. It is our position that any pre-2005 AMT tax credits can be utilized as of December 26, 2018. The occurrence of an additional ownership change could limit our ability to utilize our current income tax credits generated after 2004.

F - 33
The following table provides a reconciliation of the beginning and ending amount of unrecognized tax benefits:
December 26, 2018 December 27, 2017 (In thousands)
Balance, beginning of year $ 1,469 $ 1,180
Increases related to current-year tax positions 941 —
Increases related to prior-year tax positions 530 289
Balance, end of year $ 2,940 $ 1,469
There was no interest expense associated with unrecognized tax benefits for the year ended December 26, 2018 and less than $0.1 million of interest expense associated with unrecognized tax benefits for the year ended December 27, 2017. We file income tax returns in the U.S. federal jurisdictions and various state jurisdictions. With few exceptions, we are no longer subject to U.S. federal, state and local, or non-U.S. income tax examinations by tax authorities for years before 2015. We are currently under federal audit by the Internal Revenue Service for tax year 2016. We remain subject to examination for U.S. federal taxes for 2015, 2017 and 2018 and in the following major state jurisdictions: California (2014-2018), Florida (2015-2018) and Texas (2014-2018).
Note 16. Net Income Per Share The amounts used for the basic and diluted net income per share calculations are summarized below:
Fiscal Year Ended December 26, 2018 December 27, 2017 December 28, 2016 (In thousands, except per share amounts)Net income $ 43,693 $ 39,594 $ 19,402
Weighted average shares outstanding - basic 63,364 68,077 75,325Effect of dilutive share-based compensation awards 2,198 2,326 1,881Weighted average shares outstanding - diluted 65,562 70,403 77,206
Basic net income per share $ 0.69 $ 0.58 $ 0.26Diluted net income per share $ 0.67 $ 0.56 $ 0.25
Anti-dilutive share-based compensation awards — 606 —
Note 17. Shareholders’ Equity
Share Repurchases
Our credit facility permits the purchase of Denny’s stock and the payment of cash dividends subject to certain limitations. Over the past several years, our Board of Directors has approved share repurchase programs authorizing us to repurchase up to a set amount of shares or dollar amount of our common stock. Under the programs, we may, from time to time, purchase shares in the open market (including pre-arranged stock trading plans in accordance with guidelines specified in Rule 10b5-1 under the Securities Exchange Act of 1934, as amended) or in privately negotiated transactions, subject to market and business conditions. During 2017 and 2016, the Board approved share repurchase programs for $200 million and $100 million of our common stock, respectively.
F - 34
In recent years, as part of our previously authorized share repurchase programs, we have entered into variable term, capped accelerated share repurchase (“ASR”) agreements to repurchase our common stock. Pursuant to the terms of these ASR agreements, we pay cash, receive an initial delivery of shares of our common stock (which represents the minimum shares to be delivered based on the cap price) and record treasury stock related to these shares. The remaining balance is recorded as an equity forward contract. When settled, the final delivery of shares is received and treasury stock is recorded related to the additional shares. The total number of shares repurchased is based on a combined discounted volume-weighted average price (“VWAP”) per share, which is determined based on the average of the daily VWAP of our common stock, less a fixed discount, over the term of the ASR agreement.
During 2016, we settled the $50 million ASR agreement with Wells Fargo Bank, National Association that we entered into during 2015 (the “2015 ASR”), recording $13.1 million of treasury stock related to the final delivery of an additional 1.5 million shares of our common stock based on a combined discounted VWAP of $9.90 per share.
In November 2016, we entered into a $25 million ASR agreement with MUFG Securities EMEA plc (“MUFG”) (the “2016 ASR”). We paid $25 million in cash and received approximately 1.5 million shares of our common stock (which represents the minimum shares to be delivered based on the cap price) and recorded $18.1 million of treasury stock related to these shares. The remaining balance of $6.9 million was recorded as additional paid-in capital in shareholders’ equity as of December 28, 2016 as an equity forward contract. During 2017, we settled the 2016 ASR agreement, recording $6.9 million of treasury stock related to the final delivery of an additional 0.5 million shares of our common stock based on a combined discounted VWAP of $12.36 per share.
In November 2018, we entered into a $25 million ASR agreement with MUFG (the “2018 ASR”). We paid $25 million in cash and received approximately 1.1 million shares of our common stock (which represents the minimum shares to be delivered based on the cap price) and recorded $18.2 million of treasury stock related to these shares. The remaining balance of $6.8 million was recorded as additional paid-in capital in shareholders’ equity as of December 26, 2018 as an equity forward contract.
During 2018, including shares repurchased under the 2018 ASR, we repurchased a total of 3.9 million shares of our common stock for $61.2 million. In addition to the settlement of the 2016 ASR agreement, during 2017, we repurchased a total of 6.8 million shares for $82.9 million, thus completing the 2016 repurchase program. In addition to the settlement of the 2015 ASR agreement, during 2016, we repurchased 4.6 million shares for $51.8 million, thus completing the 2015 repurchase program. As of December 26, 2018, there was $128.4 million remaining under the 2017 repurchase program.
Repurchased shares are included as treasury stock in our Consolidated Balance Sheets and our Consolidated Statements of Shareholders’ Deficit.

F - 35
Accumulated Other Comprehensive Loss
The components of the change in accumulated other comprehensive loss were as follows:
Pensions Derivatives
AccumulatedOther
ComprehensiveLoss
(In thousands)Balance as of December 30, 2015 $ (22,764) $ (1,013) $ (23,777)
Benefit obligation actuarial loss (1,018) — (1,018)Net gain 603 — 603Amortization of net loss (1) 85 — 85Settlement loss recognized 24,297 — 24,297Net change in fair value of derivatives — 1,693 1,693Reclassification of derivatives to interest expense (2) — (789) (789)Income tax expense (2,148) (353) (2,501)
Balance as of December 28, 2016 $ (945) $ (462) $ (1,407)Benefit obligation actuarial loss (172) — (172)Amortization of net loss (1) 92 — 92Settlement loss recognized 21 — 21Net change in fair value of derivatives — (1,359) (1,359)Reclassification of derivatives to interest expense (2) — (72) (72)Income tax benefit 22 559 581
Balance as of December 27, 2017 $ (982) $ (1,334) $ (2,316)Benefit obligation actuarial gain 96 — 96Amortization of net loss (1) 112 — 112Net change in fair value of derivatives — (2,595) (2,595)Reclassification of derivatives to interest expense (2) — 307 307Income tax (expense) benefit (53) 303 250Balance as of December 26, 2018 $ (827) $ (3,319) $ (4,146)
(1) Before-tax amount that was reclassified from accumulated other comprehensive loss and included as a component of pension expense within general and administrative expenses in our Consolidated Statements of Income. See Note 13 for additional details.
(2) Amounts reclassified from accumulated other comprehensive loss into income represent payments made to the counterparty for the effective portions of the interest rate swaps. These amounts are included as a component of interest expense in our Consolidated Statements of Income. We expect to reclassify approximately $0.2 million from accumulated other comprehensive loss related to our interest rate swaps during the next twelve months. See Note 12 for additional details.
Note 18. Commitments and Contingencies We have guarantees related to certain franchisee loans with terms extending from one to less than three years. Payments under these guarantees would result from the inability of a franchisee to fund required payments when due. Through December 26, 2018, no events had occurred that caused us to make payments under the guarantees. There were $2.5 million and $5.1 million of loans outstanding under these programs as of December 26, 2018 and December 27, 2017, respectively. As of December 26, 2018, the maximum amount payable under the loan guarantees was $0.9 million. As a result of these guarantees, we have recorded liabilities of less than $0.1 million as of December 26, 2018 and December 27, 2017, which are included as a component of other noncurrent liabilities in our Consolidated Balance Sheets and other nonoperating expense in our Consolidated Statements of Income.
There are various claims and pending legal actions against or indirectly involving us, incidental to and arising out of the ordinary course of the business. In the opinion of management, based upon information currently available, the ultimate liability with respect to these proceedings and claims will not materially affect the Company’s consolidated results of operations or financial position.

F - 36
We have amounts payable under purchase contracts for food and non-food products. Many of these agreements do not obligate us to purchase any specific volumes and include provisions that would allow us to cancel such agreements with appropriate notice. Our future purchase obligation payments due by period for both company and franchised restaurants at December 26, 2018 consist of the following:
(In thousands)Less than 1 year $ 202,1651-2 years —3-4 years —5 years and thereafter —
Total $ 202,165
For agreements with cancellation provisions, amounts included in the table above represent our estimate of purchase obligations during the periods presented if we were to cancel these contracts with appropriate notice. We would likely take delivery of goods under such circumstances. Note 19. Supplemental Cash Flow Information
Fiscal Year Ended December 26, 2018 December 27, 2017 December 28, 2016 (In thousands)Income taxes paid, net $ 3,254 $ 6,367 $ 3,012Interest paid $ 19,447 $ 14,636 $ 11,288
Noncash investing and financing activities: Notes received in connection with disposition
of property $ — $ 1,750 $ —Property acquisition payable $ — $ 500 $ —Accrued purchase of property $ 178 $ 531 $ 1,445Insurance proceeds receivable $ 653 $ 364 $ —Issuance of common stock, pursuant to share-based
compensation plans $ 4,671 $ 4,961 $ 3,597Execution of capital leases $ 3,623 $ 6,573 $ 9,597Treasury stock payable $ 72 $ 120 $ 313
Note 20. Quarterly Data (Unaudited) The results for each quarter include all adjustments which, in our opinion, are necessary for a fair presentation of the results for interim periods. All adjustments are of a normal and recurring nature.
Selected consolidated financial data for each quarter of fiscal 2018 and 2017 are set forth below:
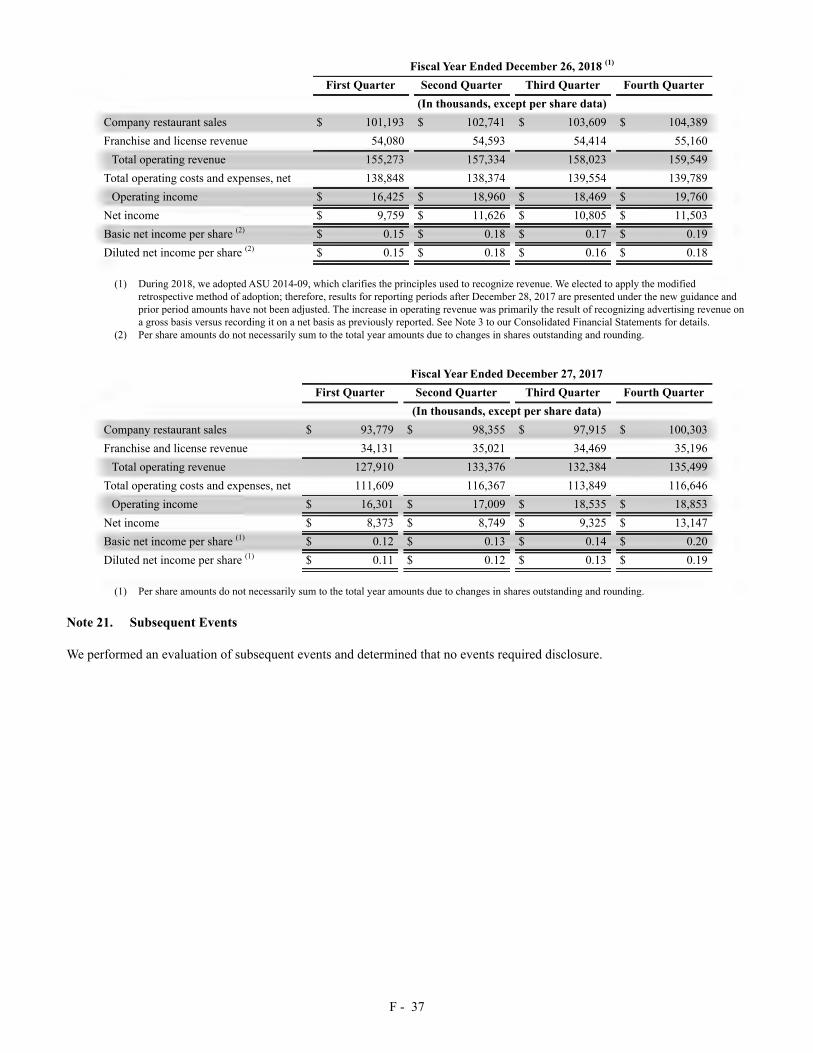
F - 37
Fiscal Year Ended December 26, 2018 (1)
First Quarter Second Quarter Third Quarter Fourth Quarter (In thousands, except per share data)Company restaurant sales $ 101,193 $ 102,741 $ 103,609 $ 104,389Franchise and license revenue 54,080 54,593 54,414 55,160
Total operating revenue 155,273 157,334 158,023 159,549Total operating costs and expenses, net 138,848 138,374 139,554 139,789
Operating income $ 16,425 $ 18,960 $ 18,469 $ 19,760Net income $ 9,759 $ 11,626 $ 10,805 $ 11,503Basic net income per share (2) $ 0.15 $ 0.18 $ 0.17 $ 0.19Diluted net income per share (2) $ 0.15 $ 0.18 $ 0.16 $ 0.18
(1) During 2018, we adopted ASU 2014-09, which clarifies the principles used to recognize revenue. We elected to apply the modified retrospective method of adoption; therefore, results for reporting periods after December 28, 2017 are presented under the new guidance and prior period amounts have not been adjusted. The increase in operating revenue was primarily the result of recognizing advertising revenue on a gross basis versus recording it on a net basis as previously reported. See Note 3 to our Consolidated Financial Statements for details.
(2) Per share amounts do not necessarily sum to the total year amounts due to changes in shares outstanding and rounding.
Fiscal Year Ended December 27, 2017 First Quarter Second Quarter Third Quarter Fourth Quarter (In thousands, except per share data)Company restaurant sales $ 93,779 $ 98,355 $ 97,915 $ 100,303Franchise and license revenue 34,131 35,021 34,469 35,196
Total operating revenue 127,910 133,376 132,384 135,499Total operating costs and expenses, net 111,609 116,367 113,849 116,646
Operating income $ 16,301 $ 17,009 $ 18,535 $ 18,853Net income $ 8,373 $ 8,749 $ 9,325 $ 13,147Basic net income per share (1) $ 0.12 $ 0.13 $ 0.14 $ 0.20Diluted net income per share (1) $ 0.11 $ 0.12 $ 0.13 $ 0.19
(1) Per share amounts do not necessarily sum to the total year amounts due to changes in shares outstanding and rounding.
Note 21. Subsequent Events
We performed an evaluation of subsequent events and determined that no events required disclosure.

SIGNATURES
Pursuant to the requirements of Section 13 or 15(d) of the Securities and Exchange Act of 1934, the registrant has duly caused this report to be signed on its behalf by the undersigned, thereunto duly authorized. Date: February 25, 2019
DENNY’S CORPORATION
BY: /s/ F. Mark Wolfinger F. Mark Wolfinger
Executive Vice President,Chief Administrative Officer andChief Financial Officer
Pursuant to the requirements of the Securities Exchange Act of 1934, this report has been signed below by the following
persons on behalf of the registrant and in the capacities and on the dates indicated.
Signature Title Date
/s/ John C. Miller Chief Executive Officer, President and Director February 25, 2019(John C. Miller) (Principal Executive Officer)
/s/ F. Mark WolfingerExecutive Vice President, Chief Administrative Officer,
Chief Financial Officer and DirectorFebruary 25, 2019
(F. Mark Wolfinger) (Principal Financial Officer)
/s/ Jay C. Gilmore Vice President, Chief Accounting Officer and Corporate Controller February 25, 2019(Jay C. Gilmore) (Principal Accounting Officer)
/s/ Brenda J. Lauderback Director and Chair of the Board of Directors February 25, 2019(Brenda J. Lauderback)
/s/ Bernadette S. Aulestia Director February 25, 2019(Bernadette S. Aulestia)
/s/ Gregg R. Dedrick Director February 25, 2019(Gregg R. Dedrick)
/s/ José M. Gutiérrez Director February 25, 2019(José M. Gutiérrez)
/s/ George W. Haywood Director February 25, 2019(George W. Haywood)
/s/ Robert E. Marks Director February 25, 2019(Robert E. Marks)
/s/ Donald C. Robinson Director February 25, 2019(Donald C. Robinson)
/s/ Laysha Ward Director February 25, 2019(Laysha Ward)


NON-GAAP RECONCILIATIONS The Company believes that, in addition to GAAP measures, certain other non-GAAP financial measures are appropriate indicators to assist in the evaluation of operating performance on a period-to-period basis. The Company uses Adjusted Income Before Taxes, Adjusted EBITDA, Adjusted Free Cash Flow and Adjusted Net Income inte rnally as performance measures for planning purposes, including t he preparation of annual operating budgets, and for compensation purposes, including bonuses for certain employees. Adjusted EBITDA is also used to evaluate the ability to service debt because the excluded charges do not have an impact on prospective debt servicing capability and these adjustments are contemplated in our credit facility for the computation of our debt covenant ratios. We def ine Adjusted Free Cash Flow for a given period as Adjusted EBITDA less the cash portion of interest expense net of interest income, capital expenditures and cash taxes. Management believes that the presentation of Adjusted Free Cash Flow provides useful information to investors because it represents a liquidity measure used to evaluate, among other things, operating effect iveness and is used in decisions regarding the allocation of resources. However, each of these non-GAAP f inancial measures should be considered as a supplement to, not a substitute for, operating income, net income or other financial performance measures prepared in accordance with U.S. generally accepted accounting principles.
$ IN MILLIONS (except per share amounts) 2014* 2015 2016 2017 2018
Net Income $32.7 $36.0 $19.4 $39.6 $43.7
Provision for income taxes 16.0 17.8 16.5 17.2 8 .6
Operating (gains) , losses and other charges, net 1.3 2.4 26.9 4.3 2.6
Other nonoperat ing (income) expense, net C0.6) 0 .1 (1.1) (1.7) 0 .6
Share-based compensation 5.8 6 .6 7.6 8 .5 6 .0
Deferred compensation plan valuation adjustments 0.5 0.9 1.6 (1.0)
Interest expense, net 9.2 9.3 12.2 15.6 20.7
Depreciation and amortization 21.2 21.5 22.2 23.7 27.0
Cash payments for restructuring charges and exit cost (2.0) (1.5) (1.8) (1.7) (1.1)
Cash payments for share-based compensation (1.1) (3.4) (2.5) (3.9) (1.9)
Adjusted EBITDA $83.1 $88.8 $100.2 $103.3 $10S.3
Cash interest expense, net (8.1) (8.3) (11.2) (14.6) (19.6)
Cash paid for income taxes , net (3.8) (5.4) (3.0) (6.4) (3.3)
Cash paid for capital expenditures (22.1) (32.8) (34.0) (31.2) (32.4)
Adjusted Free Cash Flow $49.1 $42.3 $S1.9 $S1.2 $S0.0
Net Income $32.7 $36.0 $19.4 $39.6 $43.7
Pension settlement loss 24 .3
(Gains) losses on sales of assets and other, net (0.1) (0.1) 3.5 C0.5)
Impairment charges 0.4 0.9 1.1 0.3 1.6
Loss on debt refinancing 0.3
Tax reform (1.6)
Tax effect** (0.1) C0.4) (2.5) (1.2) (0.2)
Adjusted Net Income••• $32.9 $36.7 $42.3 $40.7 $44.6
Diluted Weighted Averages Shares Outstanding (OOO's) 88,355 84,729 77,206 70,403 6S,S62
Diluted Net Income per Share $0.37 $0.42 $0.2S $0.S6 $0.67
Adjustments per Share 0.01 0 .30 0.02 0.01
Adjusted Net Income per Share*** $0.37 $0.43 $0.SS $0.S8 $0.68
'Includes 53 operating weeks. "Tax adjustment for the loss on pension termination for full year 2016 is calculated using an effective tax rate of 8.8%. The remaining tax adjustments for full year 2016 are
calculated using the Company's year-to-date effective tax rate of 30.9%. Tax adjustments for fu ll years 2014, 2015, 2017 and 2018 are calculated using effective tax rates of 32.9%, 33.0%, 30.3% and 16.4% respectively.
'"As required by ASAU No. 2016-09, "Compensation - Stock Compensation: Improvements to Employee Share-Based Payment Accounting" issued by the FASB, excess tax benefits or defic iences are now recorded to the provision for income taxes in the consolidated statements of income, on a prospective basis beginning in 2017, instead of additional paid-in capital in the consolidated balance sheets.
DENNY'S OFFICERS: John C. Miller , Chief Executive Officer and President• F. Mark Wolfinger , Executive Vice President , Chief Administrative Officer and Chief Financia l Officer• Christopher D. Bode, Senior Vice President, Chief Operating Officer• John W. Dillon, Senior Vice President , Chief Brand Officer • Stephen C. Dunn, Senior Vice President , Chief Global Development Officer• Timothy E. Flemming, Senior Vice President, General Counsel and Chief Legal Officer • Michael L. Furlow, Senior Vice President , Chief Information Officer• Jill A. Van Pelt, Senior Vice President , Chief People Officer• Robert P. Verostek, Senior Vice President, Finance• Thomas L. Canty, Vice President, Franchise Opera t ions• David W. Coltrin, Vice President, Guest Experience and Marketing Technology • Laurie R. Curtis, Vice President, Marketing and Menu Innovation• Jay C. Gilmore , Vice President , Ch ief Accounting Officer and Corporate Control ler • Erik P. Jensen, Vice President , Brand Engagement• R. Gregory Linford, Vice President, Purchasing• Fasika Melaku-Peterson, Vice President, Training • Ross B. Nell, Vice President, Tax and Treasurer• Thomas M. Starnes, Vice President, Brand Protect ion, Quality and Chief Food Safety Off icer • Ramon Torres, Vice President, Operations Services• J. Scott Melton , Assistant General Counsel, Corporate Governance Officer and Secretary • C. Patrick Autry, Associate General Counsel, Ethics and Compliance Officer Ill
DENNY'S BOARD OF DIRECTORS: Brenda J. Lauderback, Board Chair, Retire d; Former President of Wholesale and Retai l Group of Nine West Group, Inc. • Bernadette S. Aulestia, Presiden t, Glo bal Distr ibut ion , Home Box Office, Inc. • Gregg R. Dedrick, Former President , KFC • Jose M. Gutierrez , Ret ired ; Senior Executive Vice President - Executive Operat ions, AT&T Services, Inc.• George W. Haywood, Self-Employed, Private Investor• Robert E. Marks, President, Marks Ventures, LLC • John C. Miller, Chief Executive Officer and President of Denny 's Corporation• Donald C. Robinson, Retired; President , Potcake Ho ldings, LLC • Laysha Ward, Executive Vice Preside nt and Chief External Engagement Officer, Target Corporation• F. Mark Wolfinger, Execut ive Vice President , Chief Administrative Officer and Chief Financia l Officer of Denny's Corporation
SHAREHOLDER INFORMATION Corporate Office : Denny's Corporation I 203 East Main Street I Spartanburg, SC 29319 I (864) 597-8000 Independent Auditors: KPMG LLP I Greenville, SC Stock Listing Information: Denny's Corporation common stock is listed on the NASDAQ Capital Market® under the symbol DENN Transfer Agent for Common Stock: Con t inental Stock Transfer & Trust Co.11 State Street, New York, NY 10004 I (212) 509-4000, (800) 509-5586 For Info rmatio n regarding change of address or other matters concerning your shareholder account, please contact the t ransfer agent. For Financial Information: Call (877) 784-7167 • Email ir(p)dennys.com I Or write to : Investor Relat ions I Denny's Corporation I 203 East Main Street, Spartanburg, SC 29319. Other investo r informatio n such as news releases, SEC filings and stock quotes may be accessed from Denny's investo r relations website at: investor.de nnys.com Annual Meeting: Wednesday, May 8, 2019
© 1019 OFO, LLC. Prinled in lhe U.S.A.