denny way/lake union cso control project · 12.3 final report and sedqual files: 27. ... as well as...
TRANSCRIPT

Denny Way/Lake Union CSO Control Project Long-Term Sediment Monitoring Program Areas A and B Nearshore Sediment Remediation Project Areas C, D, and E Monitored Natural Recovery Denny Way CSO and Elliott West CSO Treatment Facility, Post-Operation Sediment Monitoring, Year 3
Denny Way CSO Areas A and B Nearshore Sediment Remediation Project, Post-Construction Sediment Monitoring
Areas C, D, and E Monitored Natural Recovery Sampling and Analysis Plan Prepared for the King County Department of Natural Resources and Parks Wastewater Treatment Division by the King County Department of Natural Resources and Parks Marine and Sediment Assessment Group March 2008

Denny Way/Lake Union CSO Control Project Long-Term Sediment Monitoring Program Areas A and B Nearshore Sediment Remediation Project Areas C, D, and E Monitored Natural Recovery Denny Way CSO and Elliott West CSO Treatment Facility, Post-Operation Sediment Monitoring, Year 3
Denny Way CSO Areas A and B Nearshore Sediment Remediation Project, Post-Construction Sediment Monitoring
Areas C, D, and E Monitored Natural Recovery Sampling and Analysis Plan Prepared by Scott Mickelson, Senior Water Quality Project Manager Marine and Sediment Assessment Group King County Department of Natural Resources and Parks 201 South Jackson Street, Suite 600 Seattle, Washington 98104 206-296-8247 [email protected] March 2008

TABLE OF CONTENTS 1 Introduction 12 Project Directives 23 Site Description and Project History 3 3.1 The Denny Way/Lake Union CSO Control Project 3 3.2 Sediment Remediation at the Denny Way Site 5 3.3 Amended Sediment Monitoring Scope of Work 64 Sampling Design 7 4.1 Data Quality Objectives 7 4.1.1 Precision, Accuracy, and Bias 7 4.1.2 Representativeness 8 4.1.3 Completeness 8 4.1.4 Comparability 8 4.1.5 Sensitivity 8 4.2 Sampling Strategy 8 4.3 Location of Sampling Stations 9 4.4 Sample Acquisition and Analytical Parameters 10 4.5 Data Analysis 115 Project Organization and Schedule 126 Sampling Procedures 13 6.1 Station Positioning 13 6.2 Sampler Deployment and Retrieval 13 6.3 Sample Acceptability Criteria 14 6.4 Sample Processing – Sediment Chemistry 14 6.5 Sample Processing – Benthic Taxonomy 15 6.6 Sampling Equipment Decontamination 15 6.7 Sample Storage and Delivery 15 6.8 Chain of Custody 167 Sample Documentation 178 Field Measurements and Observations 189 Sediment Chemistry Analytical Methods 19 9.1 Conventionals – Analytical Methods and Detection Limits 19 9.2 Trace Metals – Analytical Methods and Detection Limits 20 9.3 Trace Organics – Analytical Methods and Detection Limits 20 9.3.1 BNA Target Analytes and Detection Limits 21 9.3.2 Chlorinated Pesticide and PCB Target Analytes and Detection Limits 22 9.3.3 VOC Target Analytes and Detection Limits 22 9.3.4 Organic-Carbon Normalized Detection Limits 2310 Benthic Taxonomy Analytical Methods 2411 Laboratory Quality Assurance/Quality Control 25 11.1 Sediment Chemistry QA/QC 25 11.2 Benthic Taxonomy QA/QC 26
i
TABLE OF CONTENTS (CONT.) 12 Data Reporting and Record Keeping 27 12.1 Sediment Chemistry Data 27 12.2 Benthic Taxonomy Data 27 12.3 Final Report and SEDQUAL Files 27 12.4 Record Keeping 2713 Project Health and Safety 28 13.1 General Vessel Safety 28 13.2 Grab Sampling 29 13.3 Chemical Hazards 2914 References 30
List of Tables Table 3-1 Summary of SQS and CSL Exceedences – 2001 Monitoring Event, p. 4 Table 3-2 Summary of SQS and CSL Exceedences – 2003 Monitoring Event, p. 4 Table 3-3 Summary of SQS and CSL Exceedences – 2006 Monitoring Event, p. 4 Table 4-1 Sediment Sampling Stations – Coordinates and Analytes, p. 10 Table 6-1 Sediment Chemistry – Sample Containers, Storage Conditions, and Hold Times, p. 15 Table 9-1 Conventional Methods and Detection Limits, p. 19 Table 9-2 Trace Metals Target Analytes, Methods, and Detection Limits, p. 20 Table 9-3 BNA Target Analytes and Detection Limits, p. 21 Table 9-4 Chlorinated Pesticide Target Analytes and Detection Limits, p. 22 Table 9-5 PCB Target Analytes and Detection Limits, p. 22 Table 9-6 VOC Target Analytes and Detection Limits, p. 23 Table 9-7 Non-Ionizable Organic Compound Detection Limits, p. 23 Table 11-1 Marine Sediment Chemistry Quality Control Samples, p. 25 Table 11-2 QA1 Acceptance Criteria for Marine Sediment Chemistry Samples, p. 25 Table 11-3 Data Qualifier Flags and QA1 Acceptance Criteria, p. 26 List of Figures Figure 1 – Denny Way Sediment Monitoring Site Summary of Sampling Stations Figure 2 – 2008 Elliott West TF/Denny Way CSO Sediment Monitoring Event Sampling Stations Figure 3 – King County Environmental Laboratory Chain of Custody Form Figure 4 – King County Environmental Laboratory Standard Field Sheet List of Appendices Appendix A – Trace Metal and Trace Organic Dry-Weight Normalized Method Detection Limits Compared to Recommended Practical Quantitation Limits (Tables A-1 through A-5) Appendix B – Trace Metal and Trace Organic QC Limits (Tables B-1 through B-10) Appendix C – Laboratory Information Management System (LIMS) Products and List Types (Table C-1)
ii
1 INTRODUCTION This sampling and analysis plan (SAP) presents project information and sampling and analytical methodologies that will be employed to perform the third year of post-operation sediment monitoring for the Denny Way/Lake Union combined sewer overflow (CSO) control project. This work is being performed as part of a long-term sediment monitoring program to meet requirements of the Biological Opinion WSB-00-039 (NMFS 2000) issued for the project by the National Marine Fisheries Service (NMFS) under the Endangered Species Act (16 U.S.C. 1531 et seq.). This SAP has also has been prepared to encompass additional sediment monitoring work that will be performed in the vicinity of the Denny Way/Lake Union CSO Control Project sediment monitoring site. The additional sediment monitoring work will include post-construction monitoring of the Denny Way CSO Nearshore Interim Sediment Cleanup Project (Ecology 2007). All of these data will also be used to monitor natural recovery of sediments in the area currently exceeding the Sediment Management Standards chemical criteria. The SAP includes a description of the project, sampling and analytical methodologies, quality assurance/quality control procedures, and reporting requirements. All figures referenced in this SAP are located at the end of the narrative. The SAP has been prepared in accordance with Washington State Department of Ecology (Ecology) and Army Corps of Engineers (ACOE) SAP preparation guidance documents (Ecology 2003 and ACOE 2000) as well as Chapter 173-204 WAC, the Washington State Sediment Management Standards (Ecology 1995).
1
2 PROJECT DIRECTIVES The Denny Way/Lake Union CSO Control Project was a joint effort of King County's Wastewater Treatment Division and Seattle Public Utilities to control City and County CSO discharges into Lake Union, as well as from the Denny Way CSO into Elliott Bay. The project included construction of two outfalls into Elliott Bay. A 490-foot outfall at a depth of -63 feet referenced to mean lower low water (MLLW) discharges treated CSO effluent from the new Elliott West CSO Treatment Facility (TF) during moderately heavy storm events. A 100-foot extension of the former Denny Way CSO outfall to a depth of -20 feet MLLW discharges untreated CSO to Elliott Bay during the once-per-year on average event when flows exceed the TF and system capacity (King County, City of Seattle, and EPA 1998). Pursuant to the Biological Opinion referenced in Section 1 of this SAP, King County developed a plan to monitor the marine environment surrounding the new outfalls. The primary goal of the sediment monitoring plan is to produce scientific data of known quality that can be used to determine whether implementation of the Denny Way/Lake Union CSO Control Project and operation of the Elliott West CSO TF/Denny Way CSO causes an impact to the biological communities in the marine environment surrounding the outfalls. If operation of the CSO facilities causes increased contamination of marine sediments to levels that exceed published sediment quality criteria, the monitoring program will identify such contamination and help King County and associated agencies develop a response plan. The long-term monitoring program was scheduled to monitor sediment quality over 20 years following construction and operation of the new Elliott West/Denny CSO treatment facility and associated marine outfalls. Subsequently, King County conducted an interim cleanup (Ecology 2007) in the area between the offshore area capped in 1990 and the old outfall location on the shoreline. As part of that Cleanup Action Plan, monitoring was required to address several objectives. The project directives have been amended to encompass the following additional tasks to address the post-construction components of that monitoring plan:
• a one-time monitoring event of sediment quality at seven stations around the perimeter of the area dredged and backfilled during a nearshore interim sediment cleanup project (Areas A and B);
• annual monitoring of one station within the backfilled area to evaluate the potential for recontamination; and
• continued annual monitoring of areas with sediments exceeding the SMS at the Denny Way site (Areas C, D, and E) for evaluation of natural recovery.
The stations to be monitored are shown in Figure 1. The 16 existing stations, which are sampled to monitor sediment quality for compliance with the CSO control project BO are shown on the figure in red (Stations DWMP-01 through DWMP-16). Station DWMP-10 is located within the area remediated during the nearshore interim cleanup project for Areas A and B. Six of the 16 stations are located in natural recovery monitoring Areas C, D, and E. The seven post-construction monitoring stations that will be sampled one time in April 2008, following completion of remediation construction activities, are shown on the figure in yellow. The seven stations sampled once in April 2008 will be submitted for sediment chemical analysis only. Eight of the 16 existing stations will be sampled for sediment chemistry only and eight will be sampled for both sediment chemistry and benthic community assemblages.
2
3 SITE DESCRIPTION AND PROJECT HISTORY The Elliott West CSO TF and Denny Way CSO outfalls and the associated sediment monitoring site are located on the northeast side of Elliott Bay, adjacent to Myrtle Edwards Park in Seattle, Washington (Figure 1). The old Denny Way CSO outfall was located in the intertidal zone and discharged directly onto the beach during storm events that occurred during low tides. The shoreline in the monitoring area is heavily armored with rip-rap with the exception of a small cove with some natural beach characteristics. Bathymetry in the area is moderately sloping. The old Denny Way CSO was the largest in King County's system and large volumes of combined storm water runoff and untreated sewage were discharged at this location. Prior to this location becoming a CSO in 1968, it was a raw sewage outfall. In 1986, The Municipality of Metropolitan Seattle or Metro (later incorporated into King County) began a trial program to identify and reduce toxicant inputs to the sewer system discharging through the Denny Way CSO. The Denny Way Sediment Cap project was instigated in 1990 as a demonstration project to remediate nearby contaminated sediments. The cap is a 3-foot thick layer of clean sediment placed over three acres of contaminated sediment offshore of the outfall beginning at the depth determined to not be subject to wave erosion. Sediment data from the Denny Way Cap monitoring program showed that surface sediments in the center of the cap were gradually becoming recontaminated with elevated concentrations of phthalate compounds, the highest concentrations detected at the monitoring station closest to the old Denny Way CSO outfall (Striplin Environmental Associates (SEA) 1997). Elevated chemical concentrations in sediments surrounding the cap have also been detected (SEA 1998). Chemicals of concern include polychlorinated biphenyls (PCBs), phthalate compounds, and mercury. Five areas of concern requiring remediation were identified in the vicinity of the old Denny Way CSO outfall (SEA 1999). Two of these areas are located inshore of the sediment cap and three are located offshore of the cap. Dredging and disposal of contaminated sediment following outfall construction was identified as the preferred remedial alternative for the inshore areas of concern. Monitored natural recovery was identified as the preferred alternative for the offshore areas. Sediment monitoring related to site remediation will be addressed in a future project document. 3.1 The Denny Way/Lake Union CSO Control Project Construction of the new outfalls was completed in March 2002. The shorter, shallow Denny Way CSO outfall is designed to discharge untreated CSO during large storm events, on average of once-per-year in a year of normal rainfall. The longer, deeper Elliott West CSO TF outfall is designed to discharge treated CSO effluent during periods of moderate rainfall when normal system capacity is exceeded. The deeper outfall is covered by a concrete “blanket” to prevent damage from excessive wave action or navigational mishaps. Habitat enhancement following construction included the placement of “habitat mix” (sand, gravel, cobble) in the disturbed areas surrounding the construction zone, along with armoring cobbles and boulders and large woody debris. Destruction of the old Denny Way CSO outfall in August 2002 moved the discharge of untreated CSO effluent offshore to the new Denny Way CSO outfall. Discharge of untreated CSO effluent at the new, shallower outfall continued during periods of rainfall that exceed normal system capacity until the Elliott West CSO TF came online in June 2005. Now online,
3
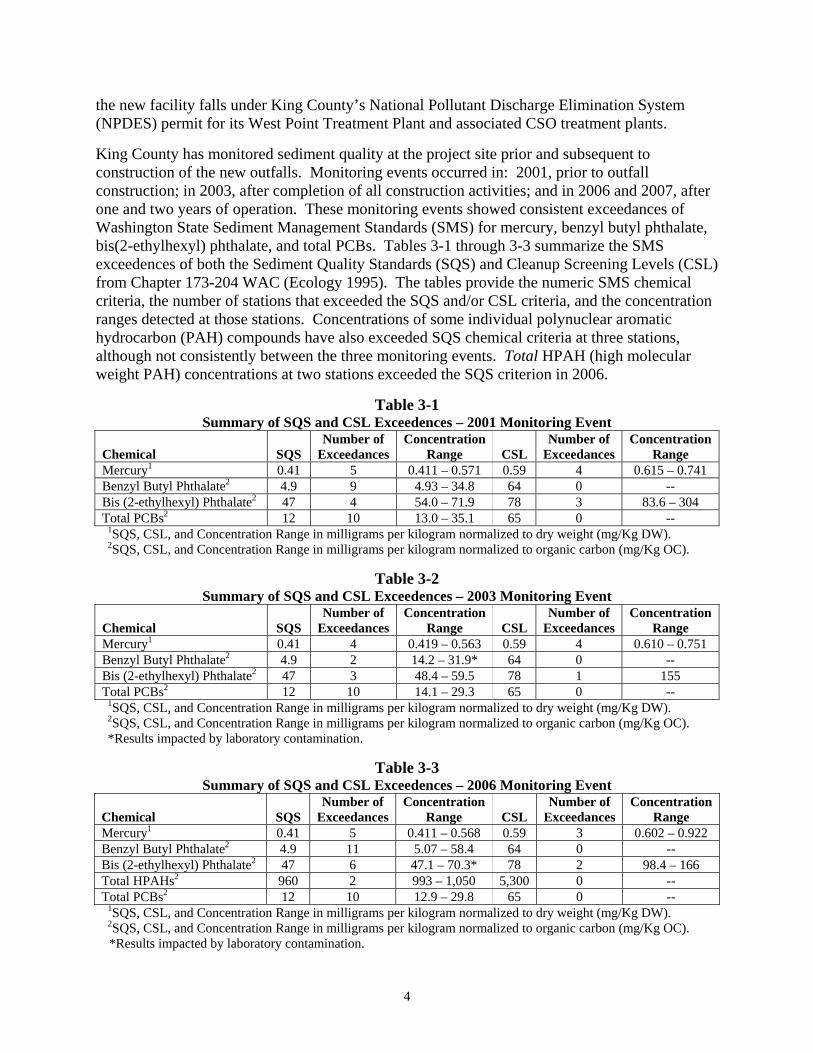
the new facility falls under King County’s National Pollutant Discharge Elimination System (NPDES) permit for its West Point Treatment Plant and associated CSO treatment plants. King County has monitored sediment quality at the project site prior and subsequent to construction of the new outfalls. Monitoring events occurred in: 2001, prior to outfall construction; in 2003, after completion of all construction activities; and in 2006 and 2007, after one and two years of operation. These monitoring events showed consistent exceedances of Washington State Sediment Management Standards (SMS) for mercury, benzyl butyl phthalate, bis(2-ethylhexyl) phthalate, and total PCBs. Tables 3-1 through 3-3 summarize the SMS exceedences of both the Sediment Quality Standards (SQS) and Cleanup Screening Levels (CSL) from Chapter 173-204 WAC (Ecology 1995). The tables provide the numeric SMS chemical criteria, the number of stations that exceeded the SQS and/or CSL criteria, and the concentration ranges detected at those stations. Concentrations of some individual polynuclear aromatic hydrocarbon (PAH) compounds have also exceeded SQS chemical criteria at three stations, although not consistently between the three monitoring events. Total HPAH (high molecular weight PAH) concentrations at two stations exceeded the SQS criterion in 2006.
Table 3-1 Summary of SQS and CSL Exceedences – 2001 Monitoring Event
Chemical
SQS
Number of Exceedances
Concentration Range
CSL
Number of Exceedances
Concentration Range
Mercury1 0.41 5 0.411 – 0.571 0.59 4 0.615 – 0.741 Benzyl Butyl Phthalate2 4.9 9 4.93 – 34.8 64 0 -- Bis (2-ethylhexyl) Phthalate2 47 4 54.0 – 71.9 78 3 83.6 – 304 Total PCBs2 12 10 13.0 – 35.1 65 0 --
1SQS, CSL, and Concentration Range in milligrams per kilogram normalized to dry weight (mg/Kg DW). 2SQS, CSL, and Concentration Range in milligrams per kilogram normalized to organic carbon (mg/Kg OC).
Table 3-2
Summary of SQS and CSL Exceedences – 2003 Monitoring Event Chemical
SQS
Number of Exceedances
Concentration Range
CSL
Number of Exceedances
Concentration Range
Mercury1 0.41 4 0.419 – 0.563 0.59 4 0.610 – 0.751 Benzyl Butyl Phthalate2 4.9 2 14.2 – 31.9* 64 0 -- Bis (2-ethylhexyl) Phthalate2 47 3 48.4 – 59.5 78 1 155 Total PCBs2 12 10 14.1 – 29.3 65 0 --
1SQS, CSL, and Concentration Range in milligrams per kilogram normalized to dry weight (mg/Kg DW). 2SQS, CSL, and Concentration Range in milligrams per kilogram normalized to organic carbon (mg/Kg OC). *Results impacted by laboratory contamination.
Table 3-3 Summary of SQS and CSL Exceedences – 2006 Monitoring Event
Chemical
SQS
Number of Exceedances
Concentration Range
CSL
Number of Exceedances
Concentration Range
Mercury1 0.41 5 0.411 – 0.568 0.59 3 0.602 – 0.922 Benzyl Butyl Phthalate2 4.9 11 5.07 – 58.4 64 0 -- Bis (2-ethylhexyl) Phthalate2 47 6 47.1 – 70.3* 78 2 98.4 – 166 Total HPAHs2 960 2 993 – 1,050 5,300 0 -- Total PCBs2 12 10 12.9 – 29.8 65 0 --
1SQS, CSL, and Concentration Range in milligrams per kilogram normalized to dry weight (mg/Kg DW). 2SQS, CSL, and Concentration Range in milligrams per kilogram normalized to organic carbon (mg/Kg OC). *Results impacted by laboratory contamination.
4
Analysis of the benthic taxonomy data indicates a generally healthy benthic community over most of the site. The data also indicate, however, that the benthic community assemblage in the area around the former Denny Way CSO outfall has most likely been impacted by historic discharges and, possibly, other sources. Some other locations in the shallow, nearshore environment also show possible environmental stress based on the presence of dominant, pollution-tolerant species. Benthic data from the 2006 and 2007 monitoring events indicate that some opportunistic, pollution-tolerant polychaetes have colonized the area near the new Elliott West CSO TF outfall. Data from these four monitoring events indicate no major changes in sediment quality at the site as a result of outfall construction activities or operation. The 2008 monitoring event, described in this SAP, will evaluate sediment quality approximately three years after the Elliott West CSO TF became operational. 3.2 Sediment Remediation at the Denny Way Site In 1997, King County characterized the nature and extent of surface and subsurface sediment contamination in the area of the old Denny Way outfall, as well as areas inshore and offshore of the existing Denny Way sediment cap (SEA 1997). Follow-up sediment sampling conducted by King County in 2005 demonstrated that chemical concentrations in the offshore areas declined over time due to a combination of natural processes, including biodegradation of chemicals, accumulation and mixing of clean sediment, and reduction of contaminant sources (King County 2005). Thus, monitored natural recovery is a prospective cleanup remedy for the offshore areas (Areas C, D, and E). These areas will continue to be evaluated by the Ecology and the County to determine if a more active cleanup remedy is required. Areas C, D, and E are shown in Figure 1. Unlike offshore areas of the site, natural recovery rates in the inshore sediment areas appeared to be progressing relatively slowly. In order to accelerate cleanup of the site and minimize the risk of future recontamination to other site areas due to resuspension of inshore sediments, including the offshore cap, an interim sediment cleanup action plan for the site was developed by King County and Ecology in 2007, including dredging to the extent practicable to remove sediments exceeding the SMS, and backfilling to restore the grade to close to pre-project conditions. The Denny Way CSO interim action remediated contaminated sediment present in the two nearshore areas in the immediate vicinity of the former Denny Way CSO outfall (Areas A and B). A combination of dredging, backfilling, and armoring was employed to remediate the nearshore areas. The dredging boundary for the Areas A and B cleanup is shown in Figure 1. Approximately 13,700 cubic yards (cy) of contaminated sediments were dredged from approximately +10 feet MLLW to approximately -35 feet MLLW within the 1.2-acre interim action area. The material within the dredge footprint was mechanically dredged using a clamshell bucket deployed from a derrick barge. The dredged area was backfilled and armored with an average thickness of more than 10 feet of material. Approximately 14,500 cy of well-graded clean sand was armored with approximately 4,000 cy of sandy-gravel habitat mix as well as large cobbles and boulders. An additional 1,500 cy of well-graded clean sand was placed in an approximately 6-in thin layer around the perimeter of the dredge prism to address any residuals that may have resulted from the dredging. Prior to commencement of construction activities, sediment grab samples were collected adjacent to and beyond the dredge boundary to document baseline pre-dredge sediment quality conditions near the project area.
5
3.3 Amended Sediment Monitoring Scope of Work The original Denny Way sediment monitoring scope of work was designed as part of a long-term sediment monitoring program to meet requirements of the CSO control project BO. The long-term monitoring program was scheduled to monitor sediment quality over a 20-year period, following construction and operation of the new Elliott West CSO TF and Denny Way CSO. The amended sediment monitoring scope of work will encompass the tasks listed below.
• A one-time monitoring event of sediment quality at seven stations around the perimeter of Areas A and B will evaluate whether dispersal of contaminated sediments during remedial activities has occurred. This monitoring event will occur in April 2008, following completion of all remedial construction activities. Surface sediment samples will be collected from Stations DW-01, DW-03, DW-13, DW-19, DW033, DW-34, and LTBC20(J), which are shown in yellow in Figure 1. Baseline sediment data was collected from these seven stations in November 2007.
• Annual monitoring of one station within Areas A and B will evaluate the potential for recontamination. Surface sediment samples will be collected from Station DWMP-10 annually in April, from 2008 through 2012.
• Continued annual monitoring of additional impacted sediments at the Denny Way site (Areas C, D, and E) will evaluate natural recovery at the site. Surface sediment samples will be collected annually in April, from 2008 through 2012 from Stations DWMP-14 and DWMP-15 (Area C), Station DWMP-08 (Area D), and Stations DWMP-01, DWMP-02, and DWMP-03 (Area E).
Figure 1 summarizes all of the stations that will be sampled under the amended scope of work for the Denny Way sediment monitoring program. The 16 existing stations, which are sampled to monitor sediment quality for compliance with the project BO, are shown on the figure in red (Stations DWMP-01 through DWMP-16). As stated above, seven of these stations will also monitor the effectiveness of the nearshore interim sediment remediation (DWMP-10) and natural recovery (DWMP-01, DWMP-02, DWMP-03, DWMP-08, DWMP-14, and DWMP-15). The seven monitoring stations that will be sampled one time in April 2008, following completion of remediation construction activities are shown on the figure in yellow. The seven stations sampled once in April 2008 (DW-01, DW-03, DW-13, DW-19, DW-33, DW-34, and LTBC20(J) will be submitted for sediment chemical analysis only. The 16 existing stations (DWMP-01 through DWMP-16) will be sampled for analysis of sediment chemistry and benthic community assemblages will be analyzed on eight of those 16 sediment chemistry samples.
6
4 SAMPLING DESIGN
The goal of the third year, post-operation sediment monitoring event is to continue evaluating sediment quality in the vicinity of the new Elliott West CSO TF outfall and the new, deeper Denny Way CSO outfall. Another goal is to monitor the areas around the perimeter of the nearshore sediment remediation area (Areas A and B) to see whether construction activities may have dispersed contaminated sediment outside the dredge prism or otherwise negatively impacted the area. The final goal is to continue monitoring sediment quality and natural recovery in Areas C, D, and E. 4.1 Data Quality Objectives The data quality objectives (DQOs) of the third year, post-operation sediment monitoring event are to collect data of sufficient quantity and quality to be able to meet the following monitoring objectives:
evaluate the areal extent and spatial variations of sediment chemical concentrations in the vicinity of the former Denny Way CSO and the new Elliott West CSO TF and Denny Way CSO outfalls;
•
•
•
•
•
•
evaluate sediment chemical concentrations in the study area relative to the current marine sediment quality standards of Chapter 173-204 WAC (Ecology 1995);
evaluate the benthic community assemblages at eight of the 16 stations from which sediment chemistry data have been collected; and
evaluate spatial differences in benthic community assemblages over the site as well as comparing the benthic community assemblages at the study site to regional Puget Sound benthic community data. evaluate sediment chemical concentrations at seven stations proximal and distal to the perimeter of remedial areas A and B, which were sampled prior to commencement of remedial construction activities; and
evaluate sediment chemical concentrations over time with the three natural recovery areas, Areas C, D, and E.
The quantity of sediment chemistry data to be collected is based on specifications in the project Biological Opinion (NMFS 2000). One sediment chemistry sample will be collected from each of 16 stations and will consist of sediment composited from three separate deployments of a grab sampler. Concurrent benthic taxonomy samples will be collected in triplicate from eight of the stations. Benthic taxonomy data has previously been collected from all 16 of the sediment chemistry stations. A review of all benthic taxonomy data collected to date has indicated that the benthos falls into two major communities, based on depth and grain size. These two groups can be successfully monitored through the collection of samples from just eight stations, rather than 16 as previously done. Validation of project data will assess whether the data collected are of sufficient quality to meet the study goals. The data quality issues of precision, accuracy, bias, representativeness, completeness, comparability, and sensitivity are described in the following sections. 4.1.1 Precision, Accuracy, and Bias Precision is the agreement of a set of results among themselves and is a measure of the ability to reproduce a result. Accuracy is an estimate of the difference between the true value and the
7

determined mean value. The accuracy of a result is affected by both systematic and random errors. Bias is a measure of the difference, due to a systematic factor, between an analytical result and the true value of an analyte. Precision, accuracy, and bias for sediment chemistry and benthic taxonomy may be measured by one or more of the following quality control (QC) procedures:
• analysis of various laboratory QC samples such as method blanks, matrix spikes, certified reference materials, and laboratory duplicates or triplicates for sediment chemistry;
• collection of sediment chemistry samples composited from three separate grab deployments; • analysis of triplicate benthic community samples from each station; and • confirmation of species identification by secondary taxonomists during benthic community
analysis. 4.1.2 Representativeness Representativeness expresses the degree to which sample data accurately and precisely represent a characteristic of a population, parameter variations at the sampling point, or an environmental condition. Sediment chemistry and benthic taxonomy samples will be collected from stations with pre-selected coordinates to represent specific site locations. Sediment chemistry samples will be homogenized to minimize variations in the chemical and physical composition of the sediments. Benthic taxonomy samples will be collected in triplicate at each station. Concurrent sediment chemistry samples will be collected along with each of the three benthic taxonomy samples and then composited into a single sample. Following the guidelines described for sampler decontamination, sample acceptability criteria, and sample processing (Section 6) will also help ensure that samples are representative. 4.1.3 Completeness Completeness is defined as the total number of samples for which acceptable analytical data are generated, compared to the total number of samples submitted for analysis. Adhering to standardized sampling and testing protocols will aid in providing a complete set of data for this study. The goal for completeness is 100%. If 100% completeness is not achieved, the study team will evaluate whether the DQOs can still be achieved or if additional samples may need to be collected and analyzed. 4.1.4 Comparability Comparability is a qualitative parameter expressing the confidence with which one data set can be compared with another. This goal is achieved through using standard techniques to collect and analyze representative samples, along with standardized data validation and reporting procedures. By following the guidance of this SAP, the goal of comparability will be achieved. 4.1.5 Sensitivity Sensitivity is a measure of the capability of analytical methods to meet study goals. The analytical method detection limits presented in Section 9 are sensitive enough to allow comparison of sediment chemistry data to current Ecology and PSDDA sediment quality criteria, both normalized to dry weight and to organic carbon, as appropriate. 4.2 Sampling Strategy Sediment chemistry samples will be collected from each of the 16 stations at the monitoring site that have been sampled since 2001, as well as from the seven perimeter stations that were
8

previously sampled in November 2007, prior to commencement of remedial construction activities. Dual van Veen grab samplers will be deployed in tandem at each station. For the 16 stations sampled as part of the long-term sediment monitoring program, sediment chemistry samples were previously collected from the top 2 centimeters (cm) of sediment retrieved in each of three separate deployments of the grab samplers, and then composited into a single sample. Samples at 10 of those stations will now be comprised of sediments collected from the top 10 cm. Collection of the top 10 cm will allow an assessment of sediment quality over the entire biologically active zone and allow King County to meet requirements of the post-construction sediment monitoring requirement at cleanup Areas A and B, as well as monitored natural recovery Areas C, D, and E. Samples at the six stations proximal to the Elliott West CSO TF outfall will continue with the 0- to 2-cm sampling regime to meet NPDES monitoring protocols. One station proximal to the outfall, DWMP-08 will have samples collected both from the 0- to 2-cm and 0- to 10-cm depth strata to meet NPDES protocols and monitoring requirements for monitored natural recovery Area D. Table 4-1 summarizes the sampling depth strata for the 16 long-term sediment monitoring stations. Sediment chemistry samples will be collected from the top 2 or 10 cm of sediment in one of the dual grab samplers during each deployment, while the benthic taxonomy replicate will be collected from the entire contents of the other tandem grab sampler at the eight stations from which benthic taxonomy data will be collected. For each of the seven perimeter stations, sediment will be collected from the top 10 cm of sediment, with the same number of grab deployments and compositing regime. All field work will be conducted on board the King County research vessel Liberty, staffed by King County personnel and project consultants. 4.3 Location of Sampling Stations Figure 2 shows the locations of the 16 stations from which samples will be collected for analysis of sediment chemistry. Benthic taxonomy samples will be collected from eight of those stations. The 16 stations are arranged around the new CSO outfalls in a grid pattern consisting of transect lines running perpendicular to the shoreline. The two outer transect lines consist of four stations each, with the two inner transect lines consisting of three stations each. The final two stations are located near the terminus of the new 490-foot outfall for the Elliott West CSO Storage and Treatment Facility. Fourteen of the 16 sampling locations are positioned at stations from which previous sediment samples were collected as part of the Denny Way Sediment Characterization (SEA 1998). Samples were collected from all 16 stations in 2001, 2003, 2006, and 2007. The seven perimeter stations that will be sampled once in 2008 for sediment chemistry as part of the nearshore sediment remediation monitoring are also shown on figure 2. Table 4-1 summarizes the stations, their coordinates, depth strata, and the analyses that will be performed at each station.
9

Table 4-1 Sediment Sampling Stations – Coordinates, Depth Strata and Analyses
Station Northing Easting Dep
th S
trat
um (c
m)
Am
mon
ia N
itrog
en
Part
icle
Siz
e D
istr
ibut
ion
Tot
al O
rgan
ic C
arbo
n
Tot
al S
olid
s
Tot
al S
ulfid
e
Vol
atile
Sol
ids
Tot
al M
etal
s¹
BN
As²
Chl
orin
ated
Pes
ticid
es
PCB
Aro
clor
s³
Vol
atile
Org
anic
s4
Ben
thic
Tax
onom
y (3
rep
s)
DWMP-01 228813 1264047 10 DWMP-02 228770 1263919 10 DWMP-03 228638 1263846 10 DWMP-04 228546 1263631 10 DWMP-05 229041 1263836 10 DWMP-06 228839 1263542 2 DWMP-07 228660 1263350 2 DWMP-08 228907 1263341 2/10 DWMP-09 228806 1263215 2 DWMP-10 229326 1263565 10 DWMP-11 229156 1263272 2 DWMP-12 228963 1263055 2 DWMP-13 229640 1263317 10 DWMP-14 229553 1263228 10 DWMP-15 229444 1263053 10 DWMP-16 229353 1262966 10 DW-01 229703 1263143 10 DW-03 229529 1263359 10 DW-13 229363 1263343 10 DW-19 229150 1263268 10 DW-33 229130 1263747 10 DW-34 228952 1263903 10 LTBC20 229241 1263454 10
4.4 Sample Acquisition and Analytical Parameters Chemistry samples will be collected from either the top 2 cm or top 10 cm of sediment recovered from three deployments of a van Veen grab sampler. Samples will be composited, homogenized, and split into laboratory containers in the field. Parameters of interest will include trace metals and organic compounds, as well as conventional sediment chemistry and physical properties. Analytical parameters have been chosen based on Ecology and ACOE recommendations for conducting baseline sediment quality studies (Ecology 1995; ACOE 2000). Analytical parameters for sediment chemistry will include:
• conventionals - percent solids, percent volatile solids, particle size distribution (PSD), total organic carbon (TOC), ammonia, and total sulfide;
10
• metals - arsenic, antimony, cadmium, chromium, copper, lead, mercury, nickel, silver, and zinc; and
• organics - volatile organic compounds (VOCs), base/neutral/acid extractable semivolatile organic compounds (BNAs), chlorinated pesticides, and PCBs (the complete list of organic parameters is shown in Section 9.3).
Note that the parameters above are those for which the 16 samples collected as part of the long-term monitoring program will be analyzed. The seven samples collected in association with the nearshore sediment remediation monitoring will be analyzed for a subset of those parameters (see Table 4-1). Benthic taxonomy samples will be collected concurrently with chemistry samples from the eight of the 16 study area stations. Each of these sediment samples will consist of the entire contents of a single van Veen grab sampler. As a test for environmental variability, three separate replicate grabs will be collected at each station for benthic taxonomy analysis. Two van Veen grab samplers will be deployed in tandem at each station, which will allow for concurrent collection of the chemistry and benthic taxonomy samples. 4.5 Data Analysis Sediment chemistry data will be evaluated by comparison to sediment chemical criteria from the SMS Tables I and III (Ecology 1995) as well as Table 5-1 in the PSDDA users manual (ACOE 2000). Data from this sampling event will be compared to results from previous studies including the Denny Way Sediment Characterization (SEA 1998) and the Denny Way Pre- and Post-Construction Sediment Characterization Studies (King County 2001, 2005), as well as the 2006 and 2007 years one and two, post-operation monitoring events. Sediment data for some organic compounds are generally normalized to organic carbon content for comparison to SMS criteria. Normalization to organic carbon can produce biased results, however, when the organic carbon content of the sample is very low (Ecology 1992). When the organic carbon content of a sample is near 0.1 or 0.2% (1,000 to 2,000 milligrams/kilogram (mg/Kg) dry weight), even background concentrations of certain organic compounds can exceed sediment quality criteria. If the organic carbon content at any particular station is below 0.5% dry weight, then dry weight-normalized results for non-ionizable organic compounds will be compared to Lowest Apparent Effects Threshold (LAET) or Second Lowest Apparent Effects Threshold (2LAET) criteria (EPA 1988), rather than SMS criteria. Benthic taxonomy results from the eight sampling stations will be compared to Puget Sound regional benthic data from areas of similar physical characteristics such as depth, grain size distribution, organic carbon content, and ambient water quality. These data will also be used to calculate diversity indices, species abundance (total abundance as well as abundance in each major taxa group), and biomass.
11

5 PROJECT ORGANIZATION AND SCHEDULE The tasks involved in conducting the third year, post-operation sediment monitoring event at the Denny Way/Lake Union CSO Control Project site, along with the post-construction monitoring for the Denny Way CSO Nearshore Interim Sediment Cleanup Project, and the King County and contracted personnel who will assume responsibility for those tasks are listed below.
• Scott Mickelson King County Marine and Sediment Assessment Group – (206) 296-8247 [email protected] Project management, study design, preparation of SAP, data validation and analysis, and preparation of final study report.
• John Blaine King County Environmental Laboratory – (206) 684-2384 [email protected] Coordination of field activities for sediment chemistry and benthic taxonomy sampling and field oversight of contract personnel.
• Fritz Grothkopp King County Environmental Laboratory – (206) 684-2327 [email protected] Coordination of all King County Environmental Laboratory activities, data validation, and data reporting.
• Allan Fukuyama University of Washington – (425) 745-3349 [email protected] Coordination of sampling and analytical activities for benthic taxonomy analysis.
• John Phillips King County Wastewater Treatment Division – (206) 263-6543 [email protected] Review of SAP and final study report; coordination of nearshore interim sediment cleanup project.
• Jeff Stern King County Wastewater Treatment Division – (206) 263-6447 [email protected] Review of SAP and final study report; coordination of King County’s long-term sediment management plan.
Field work for the 2008 monitoring event is anticipated to require up to one week of field time and will occur in April 2008. Sediment chemistry results will be available by August 2008. Validated chemistry data packages and electronic data files will be ready for release by September 2008. Benthic taxonomy results will be available by November 2008. The final report for this monitoring event will be ready for release in January 2009.
12
6 SAMPLING PROCEDURES All sampling will be performed according to guidelines recommended by the Puget Sound Estuary Program's (PSEP) Puget Sound Protocols (PSEP 1987,1997a, 1998). Sediment samples will be collected using dual, tandem 0.1 m2 modified, stainless steel van Veen grab samplers deployed via hydrowire and hydraulic winch from the King County research vessel Liberty. Chemistry samples will be collected from the top 2 or 10 cm of sediment. Sediment will be collected from the contents of three deployments of the dual grab samplers. Sediment chemistry samples will be stored on ice in coolers while in the field, then transported to the King County Environmental Laboratory at the end of each sampling day. Benthic organisms will be extracted from the entire contents of each of three replicate grabs. Qualified King County Environmental Laboratory and subcontracted personnel will be responsible for the sample collection, sieving, and preservation. Established chain of custody (COC) procedures will be followed for this sampling event. 6.1 Station Positioning Station positioning will employ a Trimble® Differential Global Positioning System (DGPS). Prior to the monitoring event, the prescribed station coordinates will be entered into the shipboard DGPS laptop computer. During sampling, the shipboard navigational system will utilize the differential data transmissions from regional Coast Guard base stations to automatically correct its GPS satellite data. The GPS antenna is boom-mounted above the sampler descent line to achieve a more accurate coordinate fix above the sampling point. Upon contact of the grab sampler with the bottom, the coordinate data representing the actual sediment grab impact point will be electronically recorded in real time. Positioning information will include local time and date that a position is recorded, comments, and coordinate data in both latitude/longitude and NAD 83 State Plane formats. Previous DGPS usage indicates that an average precision of ± 2 meters can usually be expected. Sample collection is expected to take place within a 6-meter radius of each station’s prescribed position and samples will not be collected if the grab deployment is outside of this limit. If conditions such as a steep slope or rocky substrate preclude sample collection at a particular station, the station may be relocated after consultation with the study coordinator and if relocation will not compromise the project goals. Any station relocation will be documented and reported. 6.2 Sampler Deployment and Retrieval Two 0.1 m2, modified, stainless-steel van Veen grab samplers will be deployed in tandem at each sampling station. The grab samplers will be lowered at a controlled speed of approximately 4 feet per second until it is near the bottom, at which time the speed will be decreased to approximately 1 foot per second to minimize potential bow-wake activity and subsequent bottom disturbance. After the grabs have tripped upon reaching the bottom, they will be raised slowly to allow gentle and complete closure of the sampler jaws, thus avoiding sample disturbance and loss. Once clear of the bottom, the ascent speed will be increased to approximately 4 feet per second. Care will
13

be taken to ensure that minimal sample disturbance occurs when swinging the grabs on board. Collection of undisturbed sediment requires that the grab samplers:
• create a minimal bow wake when descending; • form a leak-proof seal upon closure of the jaws; • are carefully retrieved to prevent excessive sample disturbance; and • allow easy access to the sediment within the grab. 6.3 Sample Acceptability Criteria When the grab samplers have been secured on board, the hinged top flaps will be opened and the samples examined for acceptability. Acceptability criteria will include that:
• the grabs are not overfilled to the point where there is evidence of sample loss around the access doors;
• overlying water is present, indicating minimal leakage; • overlying water is not excessively turbid, indicating minimal sample disturbance; and • a minimum acceptable sample penetration depth of at least 4 cm has been achieved. Samples collected from the top 2 cm of sediment will require a minimum grab penetration depth of 4 cm. Samples collected from the top 10 cm of sediment will require a minimum grab penetration depth of 11 cm. Care will be taken to extract sediment from the most undisturbed center portion of each grab without collecting sediment that has touched the sides or bottom of the grab. Penetration depth will be determined by measuring the depth of sediment within each grab by sliding a ruler vertically along the inside of the grab’s side wall after each successful cast. Penetration depth can also be calculated by measuring the space between the sediment’s surface within the grab and the top of the grab, then subtracting this vertical distance from 17 cm, the total inside height of the grab at the center point. Overlying water within the grab will be carefully siphoned off of the sediment surface for all acceptable samples. 6.4 Sample Processing – Sediment Chemistry Prior to any subsampling, sediment aliquots will be collected for analysis of volatile organic compounds and total sulfide. The volatile organic compound and total sulfide sample aliquots will always be collected from the top 2 cm of sediment in the first grab using a stainless steel spoon and then placed directly in the appropriate sample containers without homogenization. The remaining top 2 cm of undisturbed sediment will be collected from the first grab, as well as the subsequent two grabs, with a stainless steel "cookie cutter" and spatula. The sediment will then be placed in a stainless-steel bowl for homogenization, after which sediment aliquots will be transferred to appropriate laboratory containers. Prior to homogenization, collected sediment will be stored covered with aluminum foil in coolers since multiple grab deployments are required. Head space will be left in all lab containers, with the exception of total sulfide and volatile organic compounds, to allow further mixing at the laboratory and for expansion should the containers be stored frozen. All sample containers will be stored in insulated, ice-filled coolers while in the field. Total sulfide samples also require the use of a preservative. After the 4-ounce total sulfide lab container has been filled completely, 5 milliliters (ml) of 2N zinc acetate will be added to the top of the sediment prior to sealing the container. All sample containers, storage conditions, and hold times are summarized in Table 6-1.
14
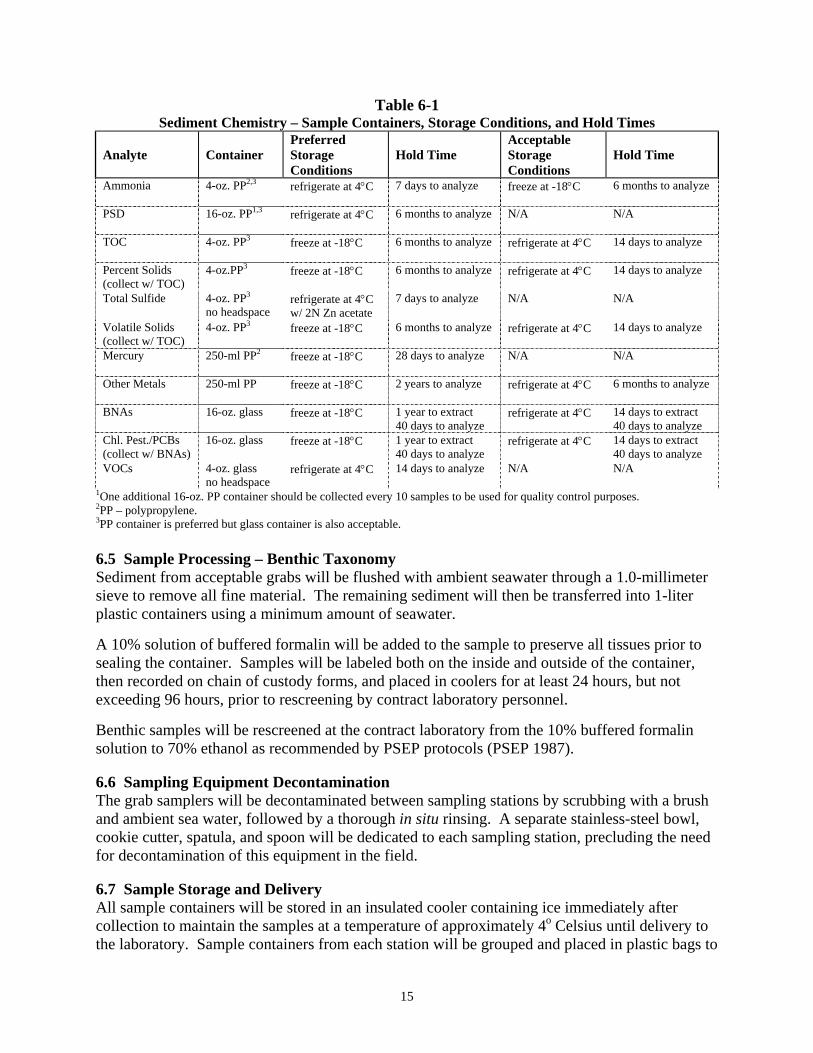
Table 6-1 Sediment Chemistry – Sample Containers, Storage Conditions, and Hold Times
Analyte
Container
Preferred Storage Conditions
Hold Time
Acceptable Storage Conditions
Hold Time
Ammonia
4-oz. PP2,3 refrigerate at 4°C 7 days to analyze freeze at -18°C 6 months to analyze
PSD
16-oz. PP1,3 refrigerate at 4°C 6 months to analyze N/A N/A
TOC
4-oz. PP3 freeze at -18°C 6 months to analyze refrigerate at 4°C 14 days to analyze
Percent Solids (collect w/ TOC)
4-oz.PP3 freeze at -18°C 6 months to analyze refrigerate at 4°C 14 days to analyze
Total Sulfide 4-oz. PP3
no headspace refrigerate at 4°C w/ 2N Zn acetate
7 days to analyze N/A N/A
Volatile Solids (collect w/ TOC)
4-oz. PP3 freeze at -18°C 6 months to analyze refrigerate at 4°C 14 days to analyze
Mercury
250-ml PP2 freeze at -18°C 28 days to analyze N/A N/A
Other Metals
250-ml PP freeze at -18°C 2 years to analyze refrigerate at 4°C 6 months to analyze
BNAs 16-oz. glass freeze at -18°C 1 year to extract 40 days to analyze
refrigerate at 4°C 14 days to extract 40 days to analyze
Chl. Pest./PCBs (collect w/ BNAs)
16-oz. glass freeze at -18°C 1 year to extract 40 days to analyze
refrigerate at 4°C 14 days to extract 40 days to analyze
VOCs
4-oz. glass no headspace
refrigerate at 4°C 14 days to analyze N/A N/A
1One additional 16-oz. PP container should be collected every 10 samples to be used for quality control purposes. 2PP – polypropylene. 3PP container is preferred but glass container is also acceptable. 6.5 Sample Processing – Benthic Taxonomy Sediment from acceptable grabs will be flushed with ambient seawater through a 1.0-millimeter sieve to remove all fine material. The remaining sediment will then be transferred into 1-liter plastic containers using a minimum amount of seawater. A 10% solution of buffered formalin will be added to the sample to preserve all tissues prior to sealing the container. Samples will be labeled both on the inside and outside of the container, then recorded on chain of custody forms, and placed in coolers for at least 24 hours, but not exceeding 96 hours, prior to rescreening by contract laboratory personnel. Benthic samples will be rescreened at the contract laboratory from the 10% buffered formalin solution to 70% ethanol as recommended by PSEP protocols (PSEP 1987). 6.6 Sampling Equipment Decontamination The grab samplers will be decontaminated between sampling stations by scrubbing with a brush and ambient sea water, followed by a thorough in situ rinsing. A separate stainless-steel bowl, cookie cutter, spatula, and spoon will be dedicated to each sampling station, precluding the need for decontamination of this equipment in the field. 6.7 Sample Storage and Delivery All sample containers will be stored in an insulated cooler containing ice immediately after collection to maintain the samples at a temperature of approximately 4o Celsius until delivery to the laboratory. Sample containers from each station will be grouped and placed in plastic bags to
15
facilitate sample receipt and login. At the end of each sampling day, all samples will be transported back to the King County Environmental Laboratory and the benthic taxonomy laboratory. 6.8 Chain of Custody Chain of custody (COC) will commence at the time that each sample is collected. While in the field, all samples will be under direct possession and control of King County field staff or the benthic taxonomy contractor. For chain of custody purposes, the research vessel will be considered a “controlled area.” Each day, all sample information will be recorded on a COC form. This form will be completed in the field and will accompany all samples during transport and delivery to the laboratory each day. Upon arrival at the King County Environmental Laboratory, the sample delivery person will relinquish all samples to the sample login person. The date and time of sample delivery will be recorded and both parties will then sign off in the appropriate sections on the COC form at this time. Once completed, original COC forms will be archived in the project file. Samples delivered after regular business hours will be stored in a secure chain of custody refrigerator until the next day. An example of the King County Environmental Laboratory’s COC form is included as Figure 3.
16

7 SAMPLE DOCUMENTATION Sampling information and sample metadata will be documented using the methods noted below.
• Field sheets generated by King County’s Laboratory Information Management System (LIMS) that will include information such as:
1. sample identification number 2. station name 3. station bottom depth 4. sediment depth (i.e., sampler penetration depth) for each successful grab deployment 5. physical sediment characteristics 6. date and time of sample collection 7. condition and height of tide 8. name of recorder
LIMS-generated container labels will identify each container with a unique sample number, station and site names, collect date, analyses required, and preservation method.
•
• The Liberty’s logbook will contain records of all shipboard activities, destinations, arrival and departure times, general weather and positioning information, the names of shipboard personnel.
• The Liberty’s cruise plan will list the prescribed stations to be sampled, along with their respective coordinates and other associated locating information.
• Electronic DGPS coordinate data will be electronically logged for each acceptable grab deployment, using both latitude/longitude and NAD 83 State Plane formats.
• COC documentation will consist of the King County Environmental Laboratory’s standard COC form, which is used to track release and receipt of each sample from collection to arrival at the lab.
A sample of a typical field sheet used by the King County Environmental Laboratory is included as Figure 4.
17
8 FIELD MEASUREMENTS AND OBSERVATIONS The following field measurements and observations will be recorded on the appropriate field sheet/log for each sample:
• sample (bottom) depth - measured as keel depth by vessel’s fathometer; • sediment depth (grab penetration depth) - measured by ruler inside the grab; • sediment sampling range (0 to 2 cm for Stations DWMP-01 through DWMP-16 and 0 to 10
cm for Stations DW-01, DW-03, DW-13, DW-19, DW-33, DW-34, and LTBC20); • sediment type (a mnemonic code indicating color, gross grain size, odor, and debris); • tide condition and height; and • collect date, collect time, and sampling personnel.
18
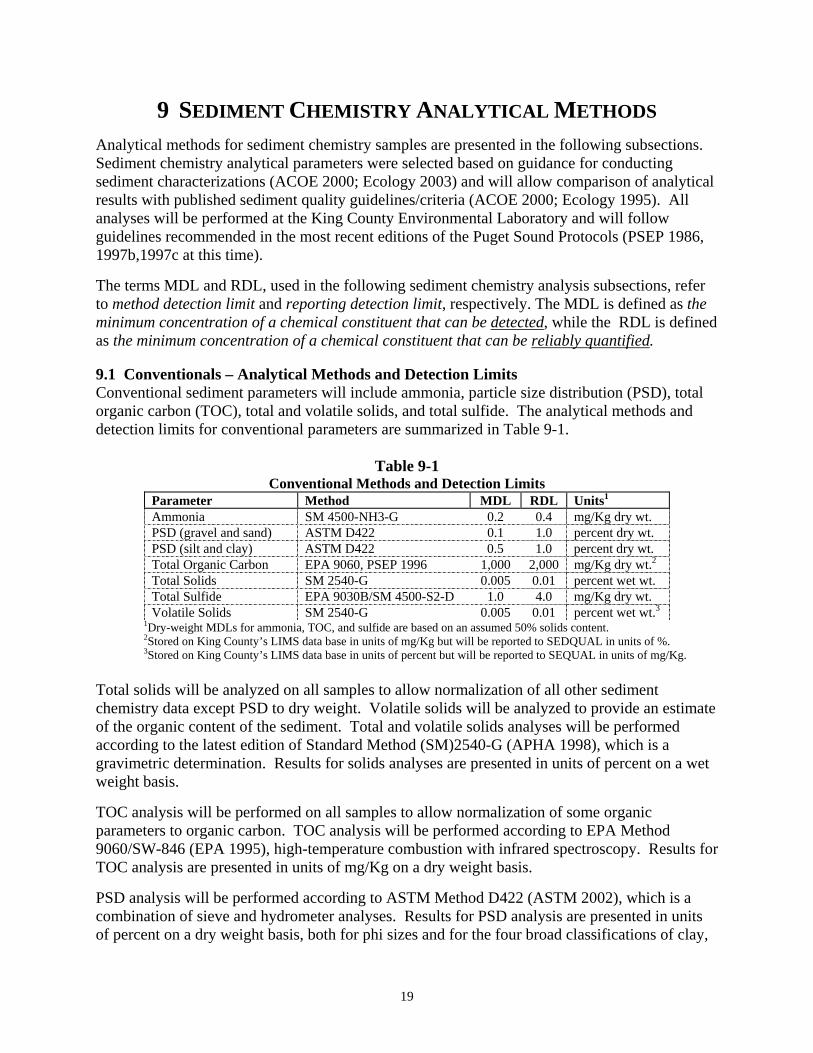
9 SEDIMENT CHEMISTRY ANALYTICAL METHODS Analytical methods for sediment chemistry samples are presented in the following subsections. Sediment chemistry analytical parameters were selected based on guidance for conducting sediment characterizations (ACOE 2000; Ecology 2003) and will allow comparison of analytical results with published sediment quality guidelines/criteria (ACOE 2000; Ecology 1995). All analyses will be performed at the King County Environmental Laboratory and will follow guidelines recommended in the most recent editions of the Puget Sound Protocols (PSEP 1986, 1997b,1997c at this time). The terms MDL and RDL, used in the following sediment chemistry analysis subsections, refer to method detection limit and reporting detection limit, respectively. The MDL is defined as the minimum concentration of a chemical constituent that can be detected, while the RDL is defined as the minimum concentration of a chemical constituent that can be reliably quantified. 9.1 Conventionals – Analytical Methods and Detection Limits Conventional sediment parameters will include ammonia, particle size distribution (PSD), total organic carbon (TOC), total and volatile solids, and total sulfide. The analytical methods and detection limits for conventional parameters are summarized in Table 9-1.
Table 9-1
Conventional Methods and Detection Limits Parameter Method MDL RDL Units1
Ammonia SM 4500-NH3-G 0.2 0.4 mg/Kg dry wt. PSD (gravel and sand) ASTM D422 0.1 1.0 percent dry wt. PSD (silt and clay) ASTM D422 0.5 1.0 percent dry wt. Total Organic Carbon EPA 9060, PSEP 1996 1,000 2,000 mg/Kg dry wt.2
Total Solids SM 2540-G 0.005 0.01 percent wet wt. Total Sulfide EPA 9030B/SM 4500-S2-D 1.0 4.0 mg/Kg dry wt. Volatile Solids SM 2540-G 0.005 0.01 percent wet wt.3
1Dry-weight MDLs for ammonia, TOC, and sulfide are based on an assumed 50% solids content. 2Stored on King County’s LIMS data base in units of mg/Kg but will be reported to SEDQUAL in units of %. 3Stored on King County’s LIMS data base in units of percent but will be reported to SEQUAL in units of mg/Kg. Total solids will be analyzed on all samples to allow normalization of all other sediment chemistry data except PSD to dry weight. Volatile solids will be analyzed to provide an estimate of the organic content of the sediment. Total and volatile solids analyses will be performed according to the latest edition of Standard Method (SM)2540-G (APHA 1998), which is a gravimetric determination. Results for solids analyses are presented in units of percent on a wet weight basis. TOC analysis will be performed on all samples to allow normalization of some organic parameters to organic carbon. TOC analysis will be performed according to EPA Method 9060/SW-846 (EPA 1995), high-temperature combustion with infrared spectroscopy. Results for TOC analysis are presented in units of mg/Kg on a dry weight basis. PSD analysis will be performed according to ASTM Method D422 (ASTM 2002), which is a combination of sieve and hydrometer analyses. Results for PSD analysis are presented in units of percent on a dry weight basis, both for phi sizes and for the four broad classifications of clay,
19

silt, sand, and gravel. Results for the clay and silt fractions are also summed to provide a result for “percent fines.” Ammonia and total sulfide, which are indicators of potential sediment toxicity, will be analyzed by SM 4500-NH3-G and SM 4500-S2-D (EPA 9030B), respectively. Ammonia analysis will involve a potassium chloride extraction followed by spectrometric analysis of the extract. Total sulfide will be analyzed by distillation following acidification and colorimetric analysis of the distillate. 9.2 Trace Metals – Analytical Methods and Detection Limits The analytical methods and detection limits for the target trace metals are summarized in Table 9-2. These MDLs and RDLs are presented on a wet-weight basis and are based on an initial sample weight of 1+0.05 grams (g) and a final volume of 50 ml for ICP metals and 100 ml for mercury. Mercury will be analyzed by cold vapor atomic absorption spectroscopy (CVAA) and other metals will be analyzed by inductively coupled plasma optical emission spectroscopy (ICP-OES) with a strong acid digestion.
Table 9-2
Trace Metals Target Analytes, Methods, and Detection Limits (mg/Kg wet weight)
Analyte Method MDL RDL Antimony EPA 3050B/6010B 1.5 7.5 Arsenic EPA 3050B/6010B 1.25 6.25 Cadmium EPA 3050B/6010B 0.10 0.50 Chromium EPA 3050B/6010B 0.125 .625 Copper EPA 3050B/6010B 0.20 1.0 Lead EPA 3050B/6010B .75 3.75 Mercury EPA 7471A 0.005 0.05 Nickel EPA 3050B/6010B .25 1.25 Silver EPA 3050B/6010B 0.20 1.0 Zinc EPA 3050B/6010B 0.25 1.25
Trace metal MDLs, normalized to dry weight over a range of percent solids concentrations, are shown in Appendix A. This information is provided to demonstrate whether dry-weight normalized trace metal MDLs will meet Ecology’s recommended Practical Quantitation Limits (PQLs) from the Sampling and Analysis Plan Appendix (SAPA) (Ecology 2003). The information in Appendix A shows that all dry-weight normalized MDLs for trace metals meet the SAPA-recommended PQLs at the range of percent solids from 25 to 75%. 9.3 Trace Organics – Analytical Methods and Detection Limits Trace organic parameters will include base/neutral/acid extractable semivolatile compounds (BNAs), chlorinated pesticides, PCBs, and volatile organic compounds (VOCs). The analytical methods and detection limits for the target trace organic compounds are summarized in Tables 9-3 through 9-6 on a wet-weight basis. Results for certain non-ionizing organic compounds are generally normalized to organic carbon for comparison to SMS chemical criteria. The King County Environmental Laboratory has attempted to optimize its procedures to produce the lowest cost-effective MDLs that are routinely achievable in a standard sediment sample. These MDLs should meet the required SMS chemical criteria for each parameter in most cases. The ability of the laboratory to attain
20

detection limits which meet organic-carbon normalized chemical criteria, however, will depend upon the TOC content of each sample. Organic-carbon normalized detection limits are shown in Table 9-7. These values are based on the wet weight detection limits shown in Tables 9-3 and 9-5 and converted using a conservatively-low percent solids concentration of 35% and the minimum TOC content that would be applicable for organic-carbon normalization (0.5% by dry weight). 9.3.1 BNA Target Analytes and Detection Limits The detection limits for the target BNA compounds are summarized in Table 9-3. These MDLs and RDLs are presented on a wet-weight basis and are based on a 40 g extraction with gel permeation cleanup and concentration to a final volume of 0.5 ml for analysis. Note that the detection limits can vary if limited sample is available for extraction (less than 30 g) or if dilution is required due to elevated analyte concentration(s). BNA analysis will be performed according to EPA methods 3550B/8270C (SW 846), which employ solvent extraction with sonication and analysis by gas chromatography/mass spectroscopy (GC/MS).
Table 9-3
BNA Target Analytes and Detection Limits (µg/Kg wet weight) Analyte MDL RDL Analyte MDL RDL 1,2,4-Trichlorobenzene 0.27 0.53 Chrysene 2.7 5.3 1,2-Dichlorobenzene 0.27 0.53 Coprostanol 53 106 1,3-Dichlorobenzene 0.27 0.53 Dibenzo(a,h)anthracene 2.7 5.3 1,4-Dichlorobenzene 0.27 0.53 Dibenzofuran 2.7 5.3 2,4-Dimethylphenol 2.7 5.3 Diethyl Phthalate 5.3 10.6 2-Methylnaphthalene 2.7 5.3 Dimethyl Phthalate 5.3 10.6 2-Methylphenol 5.3 10.6 Di-N-Butyl Phthalate 5.3 10.6 4-Methylphenol 5.3 10.6 Di-N-Octyl Phthalate 5.3 10.6 Acenaphthene 2.7 5.3 Fluoranthene 2.7 5.3 Acenaphthylene 2.7 5.3 Fluorene 2.7 5.3 Anthracene 2.7 5.3 Hexachlorobenzene 0.53 1.1 Benzo(a)anthracene 2.7 5.3 Hexachlorobutadiene 1.3 2.6 Benzo(a)pyrene 2.7 5.3 Hexachloroethane 2.7 5.3 Benzo(b)fluoranthene 2.7 5.3 Indeno(1,2,3-cd)pyrene 2.7 5.3 Benzo(g,h,i)perylene 2.7 5.3 Naphthalene 2.7 5.3 Benzo(k)fluoranthene 2.7 5.3 N-Nitrosodiphenylamine 5.3 10.6 Benzoic Acid 13 26 Pentachlorophenol 13.3 26.7 Benzyl Alcohol 5.3 10.6 Phenanthrene 2.7 5.3 Benzyl Butyl Phthalate 5.3 10.6 Phenol 5.3 10.6 Bis(2-Ethylhexyl) Phthalate 5.3 10.6 Pyrene 5.3 10.6 Caffeine 4.0 8.0 Total 4-Nonylphenol 5.0 10.0 Carbazole 2.0 4.0
MDLs for BNA compounds, normalized to dry weight over a range of percent solids concentrations, are shown in Appendix A. This information is provided to demonstrate whether dry-weight normalized MDLs for BNAs will meet Ecology’s recommended PQLs. The information in Appendix A shows that all dry-weight normalized MDLs for BNA compounds meet the SAPA-recommended PQLs at the range of percent solids from 25 to 75%.
21

9.3.2 Chlorinated Pesticide and PCB Target Analytes and Detection Limits The detection limits for the target chlorinated pesticides and PCB Aroclors® are summarized in Tables 9-4 and 9-5. These MDLs and RDLs are presented on a wet-weight basis and are based on a 20 g extraction with gel permeation cleanup and concentration to a final volume of 0.5 ml for PCB analysis and 2.5 ml for pesticides. Note that the detection limits can vary if limited sample is available for extraction (less than 30 g) or if dilution is required due to elevated analyte concentration(s). Chlorinated pesticide/PCB analysis will be performed according to EPA methods 3550B/8081A/8082 (SW 846), which employ solvent extraction with sonication and analysis by gas chromatography with electron capture detector (GC/ECD) and dual column confirmation.
Table 9-4
Chlorinated Pesticide Target Analytes and Detection Limits (µg/Kg wet weight) Analyte MDL RDL Analyte MDL RDL 4,4'-DDD 1.0 2.0 Endosulfan II 1.0 2.0 4,4'-DDE 1.0 2.0 Endosulfan Sulfate 1.0 2.0 4,4'-DDT 1.0 2.0 Endrin 1.0 2.0 Aldrin 1.0 2.0 Endrin Aldehyde 2.0 4.0 Alpha-BHC 0.5 1.0 Gamma-BHC (Lindane) 0.5 1.0 Alpha-Chlordane 0.5 1.0 Gamma-Chlordane 0.5 1.0 Beta-BHC 0.5 1.0 Heptachlor 0.5 1.0 Delta-BHC 0.5 1.0 Heptachlor Epoxide 0.5 1.0 Dieldrin 1.0 2.0 Methoxychlor 5.0 10 Endosulfan I 1.0 2.0 Toxaphene 10 20
Table 9-5 PCB Target Analytes and Detection Limits (µg/Kg wet weight)
Analyte MDL RDL Analyte MDL RDL Aroclor 1016 1.3 2.6 Aroclor 1248 1.3 2.6 Aroclor 1221 3.3 6.6 Aroclor 1254 1.3 2.6 Aroclor 1232 3.3 6.6 Aroclor 1260 1.3 2.6 Aroclor 1242 1.3 2.6
MDLs for chlorinated pesticides and PCBs, normalized to dry weight over a range of percent solids concentrations, are shown in Appendix A. This information is provided to demonstrate whether dry-weight normalized MDLs for chlorinated pesticides and PCBs will meet Ecology’s recommended PQLs. The information in Appendix A shows that dry-weight normalized MDLs for chlorinated pesticides and PCB Aroclors meet the SAPA-recommended PQLs at the range of percent solids from 25 to 75% with two exceptions. The dry-weight normalized MDLs for Aroclors 1221 and 1232 at 25% and 50% solids exceed the SAPA-recommended PQL of 6 µg/Kg DW. This should not prove problematic, however, since the highest dry-weight normalized MDL of 13 µg/Kg DW is still a factor of 10 lower than the LAET of 130 µg/Kg DW. 9.3.3 VOC Target Analytes and Detection Limits The detection limits for VOC target analytes are summarized in Table 9-6. These MDLs and RDLs are presented on a wet-weight basis and are based on a 5 g purge onto the VOA trap and desorbed onto the GC/MS. Note that the detection limits can vary if limited sample is available for purging (less than 5 g) or if dilution is required due to elevated analyte concentration(s).
22

VOC analysis will be performed according to EPA method 8260, which employs a methanol extraction diluted in reagent water and introduced via purge and trap to analysis by GC/MS.
Table 9-6 VOC Target Analytes and
Detection Limits (µg/Kg wet weight) Analyte MDL RDL Ethylbenzene 1.0 2.0 Tetrachloroethene (PCE) 1.0 2.0 Trichloroethene (TCE) 1.0 2.0 Total Xylenes 1.0 2.0
MDLs for VOCs, normalized to dry weight over a range of percent solids concentrations, are shown in Appendix A. This information is provided to demonstrate whether dry-weight normalized MDLs for VOCs will meet Ecology’s recommended PQLs. The information in Appendix A shows that dry-weight normalized MDLs for VOCs meet the SAPA-recommended PQLs at the range of percent solids from 25 to 75% with four exceptions. The dry-weight normalized MDLs for ethylbenzene, PCE, TCE, and total xylenes at 25% solids exceed the SAPA-recommended PQL of 3.2 µg/Kg DW. This should not prove problematic, however, since the lowest percent solids detected in samples collected previously at Denny Way has been 35%, which provides a dry-weight normalized MDL of 2.9 µg/Kg. 9.3.4 Organic-Carbon Normalized Detection Limits Table 9-7 shows the organic-carbon normalized detection limits for the non-ionizable organic compounds regulated under the SMS, based on a percent solids concentration of 35% and a TOC content of 0.5%.
Table 9-7
Non-Ionizable Organic Compound Detection Limits (mg/Kg OC) Analyte MDL RDL Analyte MDL RDL 2-Methylnaphthalene 1.5 3.0 Pyrene 3.0 6.1 Acenaphthene 1.5 3.0 1,2,4-Trichlorobenzene 0.15 0.30 Acenaphthylene 1.5 3.0 1,2-Dichlorobenzene 0.15 0.30 Anthracene 1.5 3.0 1,4-Dichlorobenzene 0.15 0.30 Benzo(a)anthracene 1.5 3.0 Hexachlorobenzene 0.30 0.63 Benzo(a)pyrene 1.5 3.0 Benzyl Butyl Phthalate 3.0 6.1 Benzo(b)fluoranthene 1.5 3.0 Diethyl Phthalate 3.0 6.1 Benzo(g,h,i)perylene 1.5 3.0 Dimethyl Phthalate 3.0 6.1 Benzo(k)fluoranthene 1.5 3.0 Di-N-Butyl Phthalate 3.0 6.1 Chrysene 1.5 3.0 Bis(2-Ethylhexyl) Phthalate 3.0 6.1 Dibenzo(a,h)anthracene 1.5 3.0 Di-N-Octyl Phthalate 3.0 6.1 Fluoranthene 1.5 3.0 Dibenzofuran 1.5 3.0 Fluorene 1.5 3.0 Hexachlorobutadiene 0.74 1.5 Indeno(1,2,3-cd)pyrene 1.5 3.0 N-Nitrosodiphenylamine 3.0 6.1 Naphthalene 1.5 3.0 PCBs (1016, 1242, 1248, 1254, 1260) 0.74 1.5 Phenanthrene 1.5 3.0 PCBs (1221, 1232) 1.9 3.8
All of the organic carbon normalized MDLs shown in Table 9-7 are below their respective SQS chemical criteria from Table I of Chapter 173-204 WAC (Ecology 1995).
23
10 BENTHIC TAXONOMY ANALYTICAL METHODS Contract laboratory staff will be expected to use standard and accepted techniques to sort all organisms from sediments (PSEP 1987). Small fractions of sample material will be placed in a petri dish under a 10X dissecting microscope. The petri dish will be scanned systematically and all animals and associated fragments will be removed using forceps. This sorting process will be conducted at least twice to ensure the removal of all animals. These organisms will then be separated out and placed in 70% ethanol according to one of the following major taxonomic groups: Annelida, Crustacea, Mollusca, and miscellaneous taxa (Echinodermata, Nemertea, Sipuncula, etc.). All organisms will be counted and identified to the lowest practical taxonomic level, which will usually be species. If animal fragments are present, only anterior portions will be counted. Identifications will be performed by regional taxonomic experts using stereo dissecting and high-power compound microscopes. Biomass measurements will also be performed in accordance with standard PSEP procedures.
24
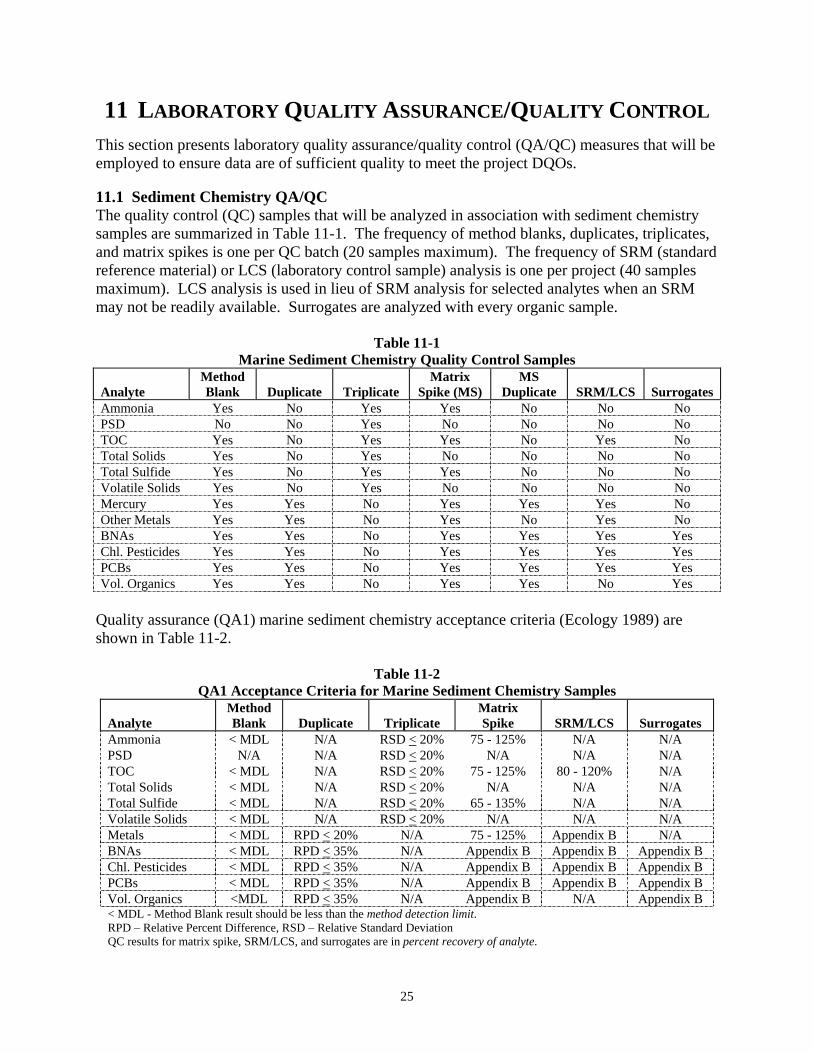
11 LABORATORY QUALITY ASSURANCE/QUALITY CONTROL This section presents laboratory quality assurance/quality control (QA/QC) measures that will be employed to ensure data are of sufficient quality to meet the project DQOs. 11.1 Sediment Chemistry QA/QC The quality control (QC) samples that will be analyzed in association with sediment chemistry samples are summarized in Table 11-1. The frequency of method blanks, duplicates, triplicates, and matrix spikes is one per QC batch (20 samples maximum). The frequency of SRM (standard reference material) or LCS (laboratory control sample) analysis is one per project (40 samples maximum). LCS analysis is used in lieu of SRM analysis for selected analytes when an SRM may not be readily available. Surrogates are analyzed with every organic sample.
Table 11-1 Marine Sediment Chemistry Quality Control Samples
Analyte
Method Blank
Duplicate
Triplicate
Matrix Spike (MS)
MS Duplicate
SRM/LCS
Surrogates
Ammonia Yes No Yes Yes No No No PSD No No Yes No No No No TOC Yes No Yes Yes No Yes No Total Solids Yes No Yes No No No No Total Sulfide Yes No Yes Yes No No No Volatile Solids Yes No Yes No No No No Mercury Yes Yes No Yes Yes Yes No Other Metals Yes Yes No Yes No Yes No BNAs Yes Yes No Yes Yes Yes Yes Chl. Pesticides Yes Yes No Yes Yes Yes Yes PCBs Yes Yes No Yes Yes Yes Yes Vol. Organics Yes Yes No Yes Yes No Yes
Quality assurance (QA1) marine sediment chemistry acceptance criteria (Ecology 1989) are shown in Table 11-2.
Table 11-2 QA1 Acceptance Criteria for Marine Sediment Chemistry Samples
Analyte
Method Blank
Duplicate
Triplicate
Matrix Spike
SRM/LCS
Surrogates
Ammonia < MDL N/A RSD < 20% 75 - 125% N/A N/A PSD N/A N/A RSD < 20% N/A N/A N/A TOC < MDL N/A RSD < 20% 75 - 125% 80 - 120% N/A Total Solids < MDL N/A RSD < 20% N/A N/A N/A Total Sulfide < MDL N/A RSD < 20% 65 - 135% N/A N/A Volatile Solids < MDL N/A RSD < 20% N/A N/A N/A Metals < MDL RPD < 20% N/A 75 - 125% Appendix B N/A BNAs < MDL RPD < 35% N/A Appendix B Appendix B Appendix B Chl. Pesticides < MDL RPD < 35% N/A Appendix B Appendix B Appendix B PCBs < MDL RPD < 35% N/A Appendix B Appendix B Appendix B Vol. Organics <MDL RPD < 35% N/A Appendix B N/A Appendix B
< MDL - Method Blank result should be less than the method detection limit. RPD – Relative Percent Difference, RSD – Relative Standard Deviation QC results for matrix spike, SRM/LCS, and surrogates are in percent recovery of analyte.
25
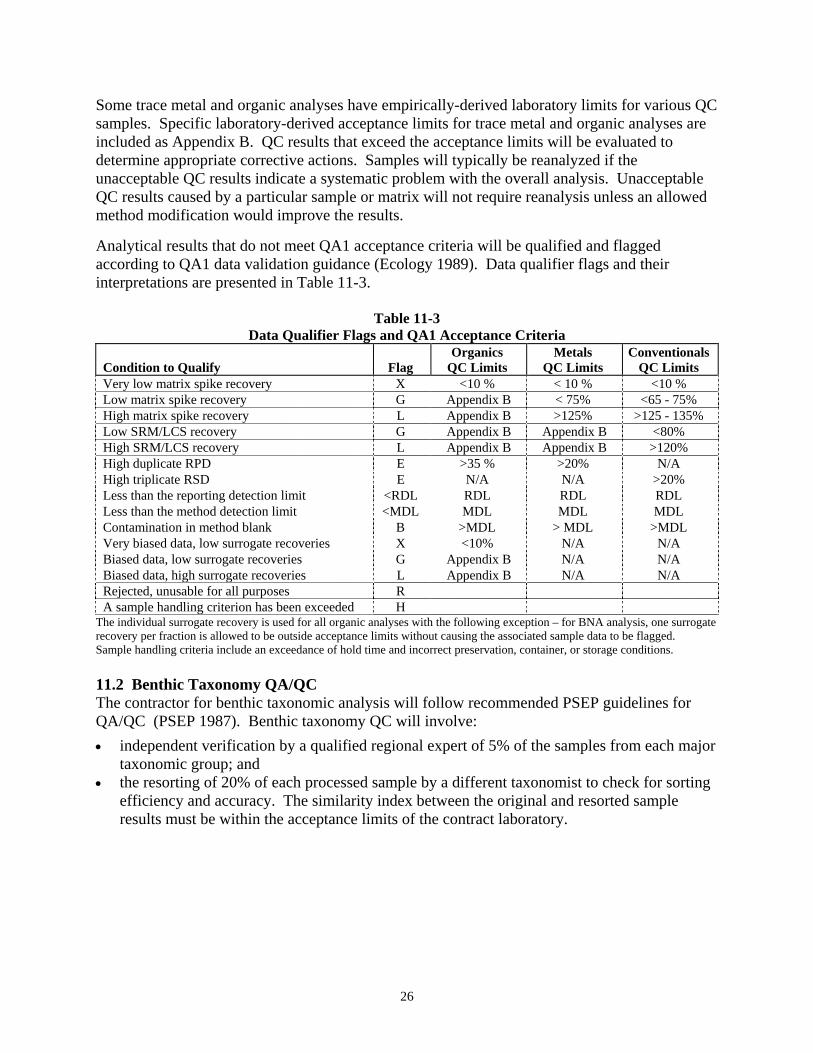
Some trace metal and organic analyses have empirically-derived laboratory limits for various QC samples. Specific laboratory-derived acceptance limits for trace metal and organic analyses are included as Appendix B. QC results that exceed the acceptance limits will be evaluated to determine appropriate corrective actions. Samples will typically be reanalyzed if the unacceptable QC results indicate a systematic problem with the overall analysis. Unacceptable QC results caused by a particular sample or matrix will not require reanalysis unless an allowed method modification would improve the results. Analytical results that do not meet QA1 acceptance criteria will be qualified and flagged according to QA1 data validation guidance (Ecology 1989). Data qualifier flags and their interpretations are presented in Table 11-3.
Table 11-3 Data Qualifier Flags and QA1 Acceptance Criteria
Condition to Qualify
Flag
Organics QC Limits
Metals QC Limits
Conventionals QC Limits
Very low matrix spike recovery X <10 % < 10 % <10 % Low matrix spike recovery G Appendix B < 75% <65 - 75% High matrix spike recovery L Appendix B >125% >125 - 135% Low SRM/LCS recovery G Appendix B Appendix B <80% High SRM/LCS recovery L Appendix B Appendix B >120% High duplicate RPD E >35 % >20% N/A High triplicate RSD E N/A N/A >20% Less than the reporting detection limit <RDL RDL RDL RDL Less than the method detection limit <MDL MDL MDL MDL Contamination in method blank B >MDL > MDL >MDL Very biased data, low surrogate recoveries X <10% N/A N/A Biased data, low surrogate recoveries G Appendix B N/A N/A Biased data, high surrogate recoveries L Appendix B N/A N/A Rejected, unusable for all purposes R A sample handling criterion has been exceeded H
The individual surrogate recovery is used for all organic analyses with the following exception – for BNA analysis, one surrogate recovery per fraction is allowed to be outside acceptance limits without causing the associated sample data to be flagged. Sample handling criteria include an exceedance of hold time and incorrect preservation, container, or storage conditions. 11.2 Benthic Taxonomy QA/QC The contractor for benthic taxonomic analysis will follow recommended PSEP guidelines for QA/QC (PSEP 1987). Benthic taxonomy QC will involve:
• independent verification by a qualified regional expert of 5% of the samples from each major taxonomic group; and
• the resorting of 20% of each processed sample by a different taxonomist to check for sorting efficiency and accuracy. The similarity index between the original and resorted sample results must be within the acceptance limits of the contract laboratory.
26

12 DATA REPORTING AND RECORD KEEPING
All project data will be reported to the following agencies as specified in the Biological Opinion:
• King County Department of Natural Resources, Wastewater Treatment Division • National Marine Fisheries Service • United States Fish and Wildlife Service • United States Environmental Protection Agency • Washington State Department of Natural Resources • Washington State Department of Ecology 12.1 Sediment Chemistry Data All sediment chemistry data will be reported in QA1 format (Ecology 1989). The final QA1 report will contain the following information and deliverables:
• a QA1 narrative discussing data quality in relation to study objectives and data criteria; • all associated QC data (LIMS QC reports and worklists); • copies of field sheets and COC forms; and • a comprehensive report containing all analytical and field data (including data qualifier
flags). 12.2 Benthic Taxonomy Data The mean abundance and richness of each major taxon at the benthic taxonomy stations (at three replicates per station) will be reported. Various diversity indices will also be calculated for each station. Data will be compared to regional Puget Sound benthic data. A narrative explaining the results, including any anomalies and statistical evaluations, will be included. 12.3 Final Report and SEDQUAL Files A final monitoring report will be prepared that will include a presentation and interpretation of the sediment chemistry and benthic taxonomy results. The report will compare sediment chemistry results to published sediment quality chemical criteria (ACOE 2000; Ecology 1995) as well as regional Puget Sound values in order to provide an evaluation of year one, post-construction sediment quality around the new CSO outfalls. Benthic taxonomy data will be compared to regional Puget Sound benthic data. The report narrative will include summary tables of sediment chemistry and benthic taxonomy results. Complete data packages and the QA1 review will be included as report appendices. The chemistry data will be also reported in SEDQUAL format (latest version) for delivery to Ecology. 12.4 Record Keeping All field and sampling records, custody documents, raw lab data, and summaries and narratives will be archived according to King County Environmental Laboratory policy, for a minimum of 10 years from the date samples were collected. Interpretative reports and memoranda, along with all chemistry data, benthic taxonomy data, and their respective data analysis project narratives and reports will be stored in project files for a minimum of 10 years from the date samples were collected. Appendix C includes LIMS “product names” and “list types” under which analytical data will be stored.
27
13 PROJECT HEALTH AND SAFETY
The following general health and safety guidelines have been provided in lieu of a site-specific Health and Safety Plan. These guidelines will be read and understood by all members of the sampling crew.
• All crew of the research vessel will have received annual vessel safety training, which will include proper chain of communication, equipment operation, and safe boating practices.
• Samplers will wear chemical-resistant gloves when coming into contact with sediment. • No eating or drinking by sampling personnel will be allowed during sampling operations. • All sampling operations will be conducted during daylight hours. • All accidents, “near misses,” and symptoms of possible exposure will be reported to a crew
member’s supervisor within 24 hours of occurrence. • All crew members will be aware of the potential hazards associated with any chemicals used
during the sampling effort. Several hazards are inherent to marine sediment sampling. General vessel safety, physical hazards unique to sediment grab sampling, and chemical hazards are discussed in sections 13.1 through 13.3. 13.1 General Vessel Safety To help prevent accidents and ensure adequate preparation for emergencies that may possibly arise, the following safety equipment will be required on the Liberty:
• one personal floatation device for each crew member as well as at least one throwable floatation device;
• an accessible, clearly labeled, fully stocked first-aid/CPR kit; • an accessible and clearly-labeled eye wash; • one (preferably two) VHF marine radio(s) with weather channel; • a cellular telephone; • a horn; • navigation lights; • an emergency life raft with oars or paddles; • an anchor and suitable line; • signal flares; and • a reach pole or shepherd's hook. Personal protective equipment will be selected and used that will protect workers involved in sediment sampling from the hazards and potential hazards likely to be encountered. Minimum required personal protective equipment for marine sediment sampling shall include the following:
• hard hat; • steel-toed rubber boots; • chemical-resistant gloves (i.e. Nitrile); and • safety glasses (safety glasses will be available for use if sediment characteristics indicate the
possible presence of hazardous chemicals; i.e., sheen or petroleum/solvent odor). Recommended additional personal protective equipment will include rain gear and hearing protection when on board the Liberty.
28
13.2 Grab Sampling Sampler deployment and retrieval present physical hazards due in part to the heavy weight of the grab sampler, its suspension above the vessel deck, and the risk of accidental or premature closure. Prior to each sampling event, all cabling, shackles, pins, housings, and swivels will be inspected to ensure the integrity of all points along the sampling assembly. The sampler will always be set while it is resting on a stable surface. Once set, a safety pin will be set in place on the triggering mechanism and remain in place until the sampler is swung outboard of the vessel rail. Special care will be exercised when removing the safety pin to ensure personal safety in the event of a gear or winch failure. Fingers will not be placed through the ring of the pin when it is removed and hands will be kept completely clear of the sampler interior after the pin has been removed. If a sampler is retrieved that has not been tripped, it will be lowered to a stable surface before any worker contact. During grab retrieval, one crew member will watch for the appearance of the grab sampler and alert the winch operator when the sampler is first visible below the water surface. Attempting to bring a swinging grab sampler on board poses a serious risk of being hit or knocked overboard. The winch operator will minimize swinging before the grab sampler is brought on board for the crew to secure. Hard hats and gloves will always be worn when handling the grab sampler. The winch drum, blocks, capstan, and any area between the grab sampler and railings, the deck, and heavy equipment all represent significant pinching and crushing hazards. Only experienced crew members will operate the winch or capstan during a sampling event. Other crew members will exercise care to avoid these potentially hazardous areas. 13.3 Chemical Hazards Contact with marine sediment at some sampling stations near the Elliott West CSO Storage and Treatment Facility and Denny Way CSO outfalls may present a health hazard from chemical constituents of the sediment, such as PAHs, PCBs, and mercury. Potential routes of exposure to chemical hazards include inhalation, skin and eye absorption, ingestion, and injection. Crew members will exercise caution to avoid coming into contact with sediment at all stations during sampling operations. Protective equipment will include chemical-resistant gloves, safety glasses or goggles, and protective clothing (i.e. rain gear). Crew members will exercise good personal hygiene after sampling and prior to eating or drinking.
29

14 REFERENCES
ACOE 2000. Dredged Material Evaluation and Disposal Procedures - A Users Manual for the Puget Sound Dredged Disposal Analysis (PSDDA) Program. United States Army Corps of Engineers, Seattle District. Seattle, Washington. APHA 1998. Standard Methods for the Examination of Water and Wastewater, 20th Edition. American Public Health Association. Washington, D.C. ASTM 2002. Standard Test Method for Particle-Size Analysis of Soils D422-63(2002). American Society for Testing and Materials. West Conshohocken, Pennsylvania. Ecology 1989. Puget Sound Dredged Disposal Analysis Guidance Manual - Data Quality Evaluation for Proposed Dredged Material Disposal Projects. Prepared for the Washington State Department of Ecology by PTI Environmental Services. Bellevue, Washington. Ecology 1992. Technical Information Memorandum, Organic Carbon Normalization of Sediment Data. Prepared by Teresa Michelsen for the Washington State Department of Ecology Sediment Management Unit. Olympia, Washington. Ecology 1995. Sediment Management Standards, Chapter 173-204 WAC. Washington State Department of Ecology. Olympia, Washington. Ecology 2003. Sediment Sampling and Analysis Plan Appendix - Guidance on the Development of Sediment Sampling and Analysis Plans Meeting the Requirements of the Sediment Management Standards (Chapter 173-204 WAC) (Revised). Prepared for the Washington State Department of Ecology by PTI Environmental Services. Bellevue, Washington. Ecology 2007. State of Washington Department of Ecology Agreed Order No. DE 5068. Washington State Department of Ecology. Olympia, Washington. EPA 1988. Sediment Quality Values Refinement: 1988 Update and Evaluation of Puget Sound AET. Prepared for the U.S. Environmental Protection Agency Region 10 by PTI Environmental Services. Seattle, Washington. EPA 1995. Test Methods for Evaluating Solid Waste. Laboratory Manual – Physical/Chemical Methods, SW-846, 3rd Edition, Update IIB. United State Environmental Protection Agency, Office of Solid Waste and Emergency Response. Washington, D.C. King County Department of Natural Resources WTD, City of Seattle SPU and EPA 1998. Denny Way/Lake Union Combined Sewer Overflow Control Project, Phases 2 and 3/4: Final SEPA Supplemental Environmental Impact Statement and NEPA Environmental Assessment. Seattle, Washington. King County 2001. Pre-Construction Sediment Characterization Study, Denny Way/Lake Union CSO Control Project, Final Report, Marine Sediment Chemistry/Benthic Infauna Community Assemblage. King County Department of Natural Resources. Seattle, Washington.
30
King County 2005. Post-Construction Sediment Monitoring, Denny Way/Lake Union CSO Control Project, Final Report. King County Department of Natural Resources. Seattle, Washington. NMFS 2000. Endangered Species Act - Section 7 Biological Opinion, Denny Way/Lake Union CSO Control Project (WSB-00-039). Prepared for the United Stated Environmental Protection Agency, Region 10 by the National Marine Fisheries Service. Seattle, Washington. PSEP 1986. Recommended Protocols for Measuring Conventional Sediment Variables in Puget Sound. Prepared for the Puget Sound Estuary Program (U.S. Environmental Protection Agency Region 10) by Tetra Tech, Inc. Seattle, Washington. PSEP 1987. Recommended Protocols for Sampling and Analyzing Subtidal Benthic Macroinvertebrate Assemblages in Puget Sound. Prepared for the Puget Sound Estuary Program (U.S. Environmental Protection Agency Region 10) by Tetra Tech, Inc. Seattle, Washington. PSEP 1997a. Recommended Guidelines for Sampling Marine Sediment, Water Column, and Tissue in Puget Sound. Prepared for the Puget Sound Estuary Program (U.S. Environmental Protection Agency Region 10) by the King County Environmental Laboratory. Seattle, Washington. PSEP 1997b. Recommended Guidelines for Measuring Metals in Puget Sound Marine Water, Sediment and Tissue Samples. Prepared for the Puget Sound Estuary Program (U.S. Environmental Protection Agency Region 10) by the King County Environmental Laboratory. Seattle, Washington. PSEP 1997c. Recommended Guidelines for Measuring Organic Compounds in Puget Sound Marine Water, Sediment and Tissue Samples. Prepared for the Puget Sound Estuary Program (U.S. Environmental Protection Agency Region 10) by the King County Environmental Laboratory. Seattle, Washington. PSEP 1998. Recommended Guidelines for Station Positioning in Puget Sound. Prepared for the Puget Sound Estuary Program (U.S. Environmental Protection Agency Region 10) by the King County Environmental Laboratory. Seattle, Washington. SEA 1997. Summary of Existing Information, Denny Way/Lake Union CSO Control Project. Prepared for King County and Black and Veatch. Seattle, Washington. SEA 1998. Proposed Marine Outfall Sediment Characterization, Denny Way/Lake Union CSO Control Project. Prepared for King County and Black and Veatch. Seattle, Washington. SEA 1999. Sediment Remediation Plan, Denny Way/Lake Union CSO Control Project. Prepared for King County and Black and Veatch. Seattle, Washington.
31

FIGURES

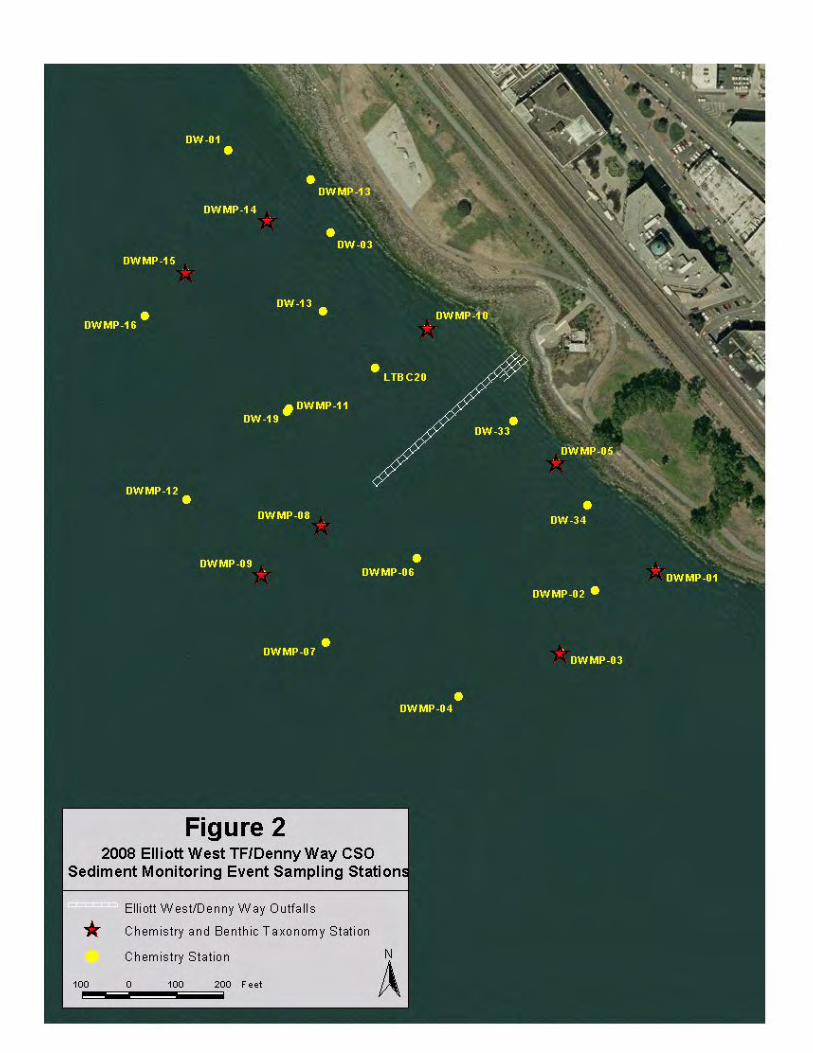

FIGURE 3 KING COUNTY ENVIRONMENTAL LABORATORY
CHAIN OF CUSTODY FORM
LABORATORY WORK ORDER King County Department of Natural ResourcesChain of Custody Water and Land Resources Division
Environmental LaboratoryProject Name: 322 West Ewing StreetProject Number: Seattle, Washington 98119-1507Laboratory Project Manager:Telephone Number:
Analyses
Sample Number Locator
Collect Date
Collect Time B
NA
S
BU
TYLT
IN
CH
LOR
OB
ENZE
NES
MET
HY
L M
ERC
UR
Y
PC
BS
MET
ALS
- I
CP
MER
CU
RY
- C
VA
A
AM
MO
NIA
OIL
& G
REA
SE
PSD
TOC
SOLI
DS
SULF
IDE
Nu
mbe
r of
Con
tain
ers
Comments
Additional Comments: Total Number of Containers Sampled By:
Relinquished By: Received By:
Signature Date Signature DatePrinted Name Time Printed Name TimeOrganization Organization King County Environmental Laboratory
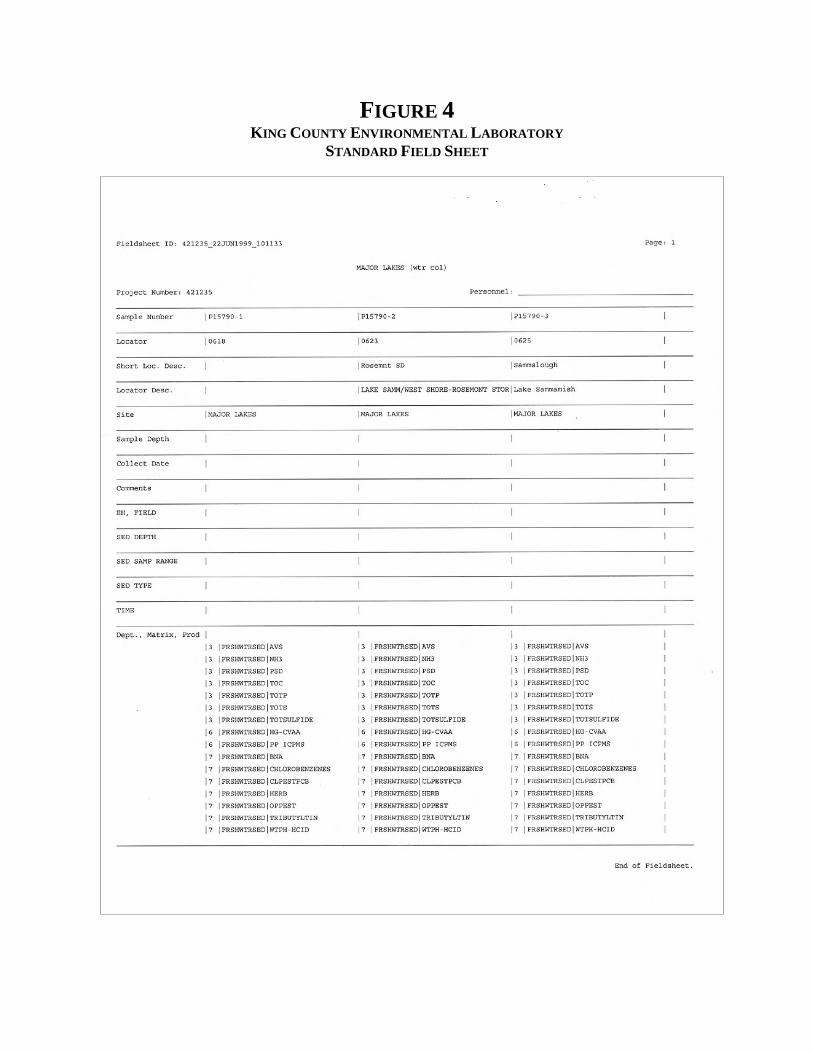
FIGURE 4 KING COUNTY ENVIRONMENTAL LABORATORY
STANDARD FIELD SHEET
APPENDIX A TRACE METAL AND TRACE ORGANIC DRY-WEIGHT NORMALIZED
METHOD DETECTION LIMITS (MDLS) COMPARED TO RECOMMENDED PRACTICAL QUANTITATION LIMITS (PQLS)
TABLES A-1 THROUGH A-5

Table A-1 Dry-Weight Normalized MDLs for Trace Metals Compared to SAPA PQLs (all values in mg/Kg)
Trace Metal
WW MDL
DW MDL 25%
DW MDL 50%
DW MDL 75%
DW SAPA PQL
Antimony 1.5 6.0 3.0 2.0 50 Arsenic 1.25 5 2.5 1.7 19 Cadmium 0.10 0.40 0.20 0.13 1.7 Chromium 0.125 0.50 0.25 .17 87 Copper 0.20 0.80 0.40 0.27 130 Lead 0.75 3.0 1.5 1.0 150 Mercury 0.005 0.020 0.010 0.0067 0.14 Nickel 0.25 1.0 0.50 0.33 47 Silver 0.20 0.80 0.40 0.27 2 Zinc 0.25 1.0 0.50 0.33 137 WW MDL – Nominal wet weight method detection limit from Table 9-2. DW MDL – Dry-weight normalized method detection limit based on percent solids content of 25, 50, and 75%. DW SAPA PQL – Recommended practical quantitation limit from Sampling and Analysis Plan Appendix (Ecology 2003). All dry-weight normalized MDLs for trace metals meet the SAPA-recommended PQLs at the range of percent solids from 25 to 75%.
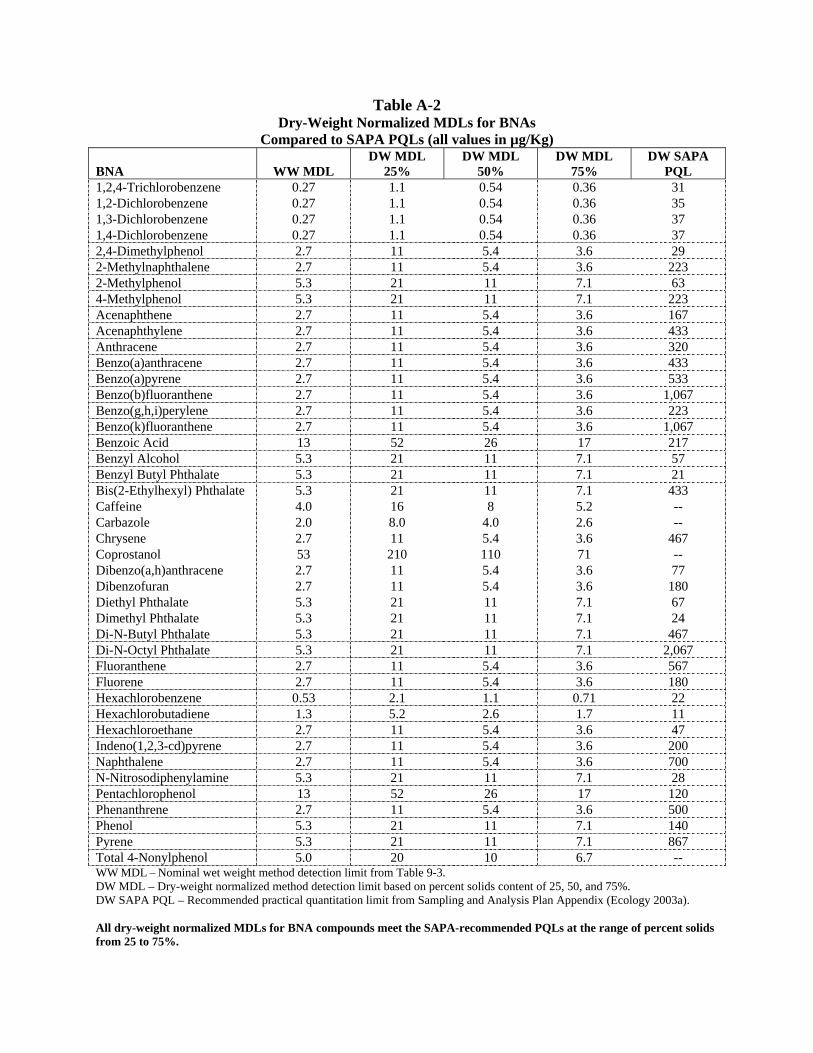
Table A-2 Dry-Weight Normalized MDLs for BNAs
Compared to SAPA PQLs (all values in µg/Kg) BNA
WW MDL
DW MDL 25%
DW MDL 50%
DW MDL 75%
DW SAPA PQL
1,2,4-Trichlorobenzene 0.27 1.1 0.54 0.36 31 1,2-Dichlorobenzene 0.27 1.1 0.54 0.36 35 1,3-Dichlorobenzene 0.27 1.1 0.54 0.36 37 1,4-Dichlorobenzene 0.27 1.1 0.54 0.36 37 2,4-Dimethylphenol 2.7 11 5.4 3.6 29 2-Methylnaphthalene 2.7 11 5.4 3.6 223 2-Methylphenol 5.3 21 11 7.1 63 4-Methylphenol 5.3 21 11 7.1 223 Acenaphthene 2.7 11 5.4 3.6 167 Acenaphthylene 2.7 11 5.4 3.6 433 Anthracene 2.7 11 5.4 3.6 320 Benzo(a)anthracene 2.7 11 5.4 3.6 433 Benzo(a)pyrene 2.7 11 5.4 3.6 533 Benzo(b)fluoranthene 2.7 11 5.4 3.6 1,067 Benzo(g,h,i)perylene 2.7 11 5.4 3.6 223 Benzo(k)fluoranthene 2.7 11 5.4 3.6 1,067 Benzoic Acid 13 52 26 17 217 Benzyl Alcohol 5.3 21 11 7.1 57 Benzyl Butyl Phthalate 5.3 21 11 7.1 21 Bis(2-Ethylhexyl) Phthalate 5.3 21 11 7.1 433 Caffeine 4.0 16 8 5.2 -- Carbazole 2.0 8.0 4.0 2.6 -- Chrysene 2.7 11 5.4 3.6 467 Coprostanol 53 210 110 71 -- Dibenzo(a,h)anthracene 2.7 11 5.4 3.6 77 Dibenzofuran 2.7 11 5.4 3.6 180 Diethyl Phthalate 5.3 21 11 7.1 67 Dimethyl Phthalate 5.3 21 11 7.1 24 Di-N-Butyl Phthalate 5.3 21 11 7.1 467 Di-N-Octyl Phthalate 5.3 21 11 7.1 2,067 Fluoranthene 2.7 11 5.4 3.6 567 Fluorene 2.7 11 5.4 3.6 180 Hexachlorobenzene 0.53 2.1 1.1 0.71 22 Hexachlorobutadiene 1.3 5.2 2.6 1.7 11 Hexachloroethane 2.7 11 5.4 3.6 47 Indeno(1,2,3-cd)pyrene 2.7 11 5.4 3.6 200 Naphthalene 2.7 11 5.4 3.6 700 N-Nitrosodiphenylamine 5.3 21 11 7.1 28 Pentachlorophenol 13 52 26 17 120 Phenanthrene 2.7 11 5.4 3.6 500 Phenol 5.3 21 11 7.1 140 Pyrene 5.3 21 11 7.1 867 Total 4-Nonylphenol 5.0 20 10 6.7 -- WW MDL – Nominal wet weight method detection limit from Table 9-3. DW MDL – Dry-weight normalized method detection limit based on percent solids content of 25, 50, and 75%. DW SAPA PQL – Recommended practical quantitation limit from Sampling and Analysis Plan Appendix (Ecology 2003a). All dry-weight normalized MDLs for BNA compounds meet the SAPA-recommended PQLs at the range of percent solids from 25 to 75%.
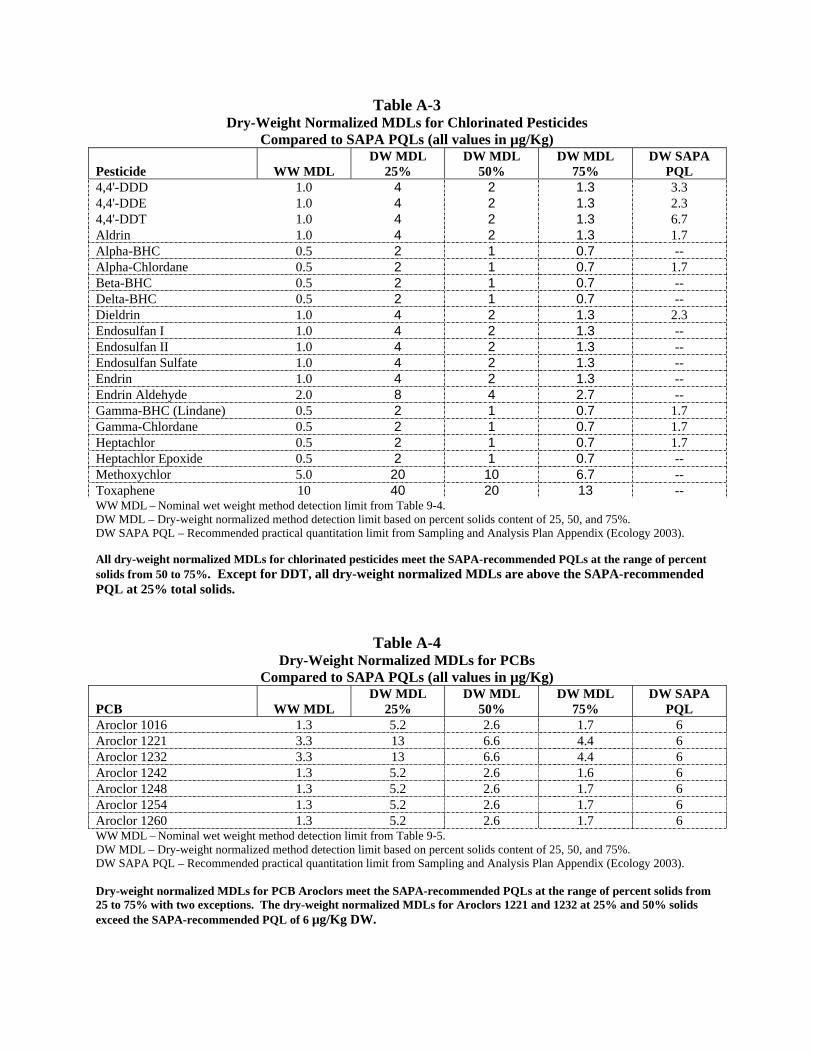
Table A-3 Dry-Weight Normalized MDLs for Chlorinated Pesticides
Compared to SAPA PQLs (all values in µg/Kg) Pesticide
WW MDL
DW MDL 25%
DW MDL 50%
DW MDL 75%
DW SAPA PQL
4,4'-DDD 1.0 4 2 1.3 3.3 4,4'-DDE 1.0 4 2 1.3 2.3 4,4'-DDT 1.0 4 2 1.3 6.7 Aldrin 1.0 4 2 1.3 1.7 Alpha-BHC 0.5 2 1 0.7 -- Alpha-Chlordane 0.5 2 1 0.7 1.7 Beta-BHC 0.5 2 1 0.7 -- Delta-BHC 0.5 2 1 0.7 -- Dieldrin 1.0 4 2 1.3 2.3 Endosulfan I 1.0 4 2 1.3 -- Endosulfan II 1.0 4 2 1.3 -- Endosulfan Sulfate 1.0 4 2 1.3 -- Endrin 1.0 4 2 1.3 -- Endrin Aldehyde 2.0 8 4 2.7 -- Gamma-BHC (Lindane) 0.5 2 1 0.7 1.7 Gamma-Chlordane 0.5 2 1 0.7 1.7 Heptachlor 0.5 2 1 0.7 1.7 Heptachlor Epoxide 0.5 2 1 0.7 -- Methoxychlor 5.0 20 10 6.7 -- Toxaphene 10 40 20 13 -- WW MDL – Nominal wet weight method detection limit from Table 9-4. DW MDL – Dry-weight normalized method detection limit based on percent solids content of 25, 50, and 75%. DW SAPA PQL – Recommended practical quantitation limit from Sampling and Analysis Plan Appendix (Ecology 2003).
All dry-weight normalized MDLs for chlorinated pesticides meet the SAPA-recommended PQLs at the range of percent solids from 50 to 75%. Except for DDT, all dry-weight normalized MDLs are above the SAPA-recommended PQL at 25% total solids.
Table A-4 Dry-Weight Normalized MDLs for PCBs
Compared to SAPA PQLs (all values in µg/Kg) PCB
WW MDL
DW MDL 25%
DW MDL 50%
DW MDL 75%
DW SAPA PQL
Aroclor 1016 1.3 5.2 2.6 1.7 6 Aroclor 1221 3.3 13 6.6 4.4 6 Aroclor 1232 3.3 13 6.6 4.4 6 Aroclor 1242 1.3 5.2 2.6 1.6 6 Aroclor 1248 1.3 5.2 2.6 1.7 6 Aroclor 1254 1.3 5.2 2.6 1.7 6 Aroclor 1260 1.3 5.2 2.6 1.7 6 WW MDL – Nominal wet weight method detection limit from Table 9-5. DW MDL – Dry-weight normalized method detection limit based on percent solids content of 25, 50, and 75%. DW SAPA PQL – Recommended practical quantitation limit from Sampling and Analysis Plan Appendix (Ecology 2003). Dry-weight normalized MDLs for PCB Aroclors meet the SAPA-recommended PQLs at the range of percent solids from 25 to 75% with two exceptions. The dry-weight normalized MDLs for Aroclors 1221 and 1232 at 25% and 50% solids exceed the SAPA-recommended PQL of 6 µg/Kg DW.
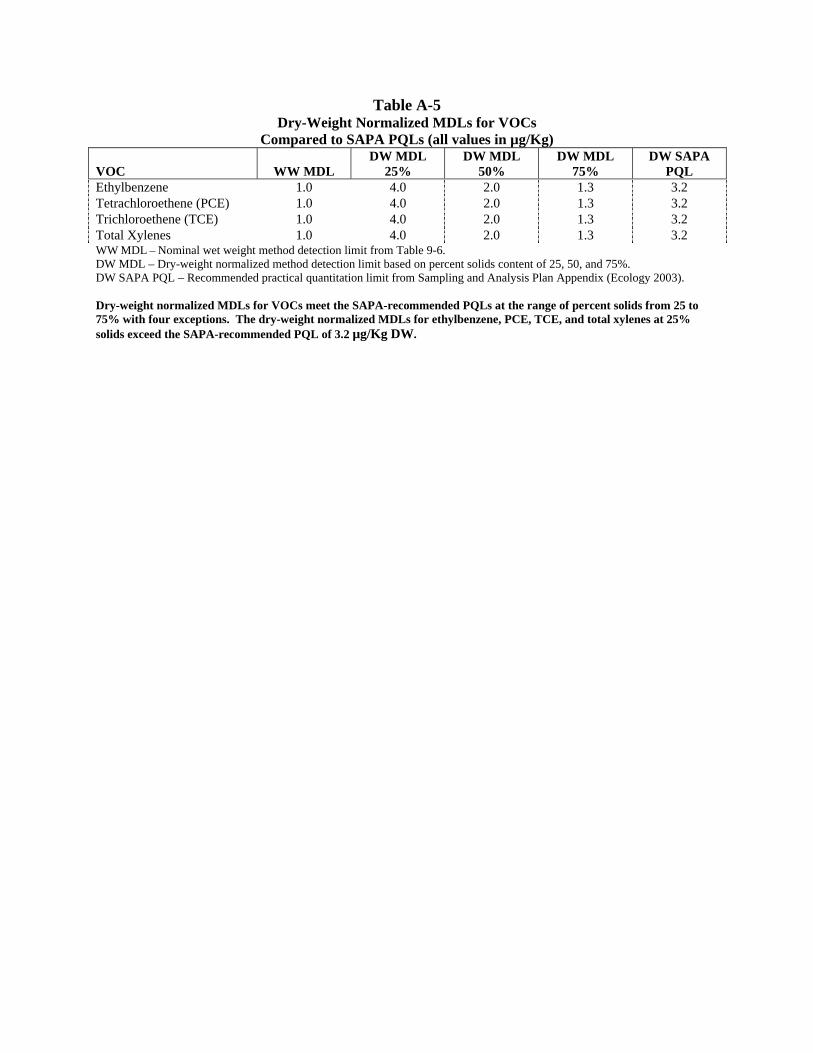
Table A-5 Dry-Weight Normalized MDLs for VOCs
Compared to SAPA PQLs (all values in µg/Kg) VOC
WW MDL
DW MDL 25%
DW MDL 50%
DW MDL 75%
DW SAPA PQL
Ethylbenzene 1.0 4.0 2.0 1.3 3.2 Tetrachloroethene (PCE) 1.0 4.0 2.0 1.3 3.2 Trichloroethene (TCE) 1.0 4.0 2.0 1.3 3.2 Total Xylenes 1.0 4.0 2.0 1.3 3.2 WW MDL – Nominal wet weight method detection limit from Table 9-6. DW MDL – Dry-weight normalized method detection limit based on percent solids content of 25, 50, and 75%. DW SAPA PQL – Recommended practical quantitation limit from Sampling and Analysis Plan Appendix (Ecology 2003). Dry-weight normalized MDLs for VOCs meet the SAPA-recommended PQLs at the range of percent solids from 25 to 75% with four exceptions. The dry-weight normalized MDLs for ethylbenzene, PCE, TCE, and total xylenes at 25% solids exceed the SAPA-recommended PQL of 3.2 µg/Kg DW.

APPENDIX B TRACE METAL AND TRACE ORGANIC QC LIMITS
TABLES B1 – B10
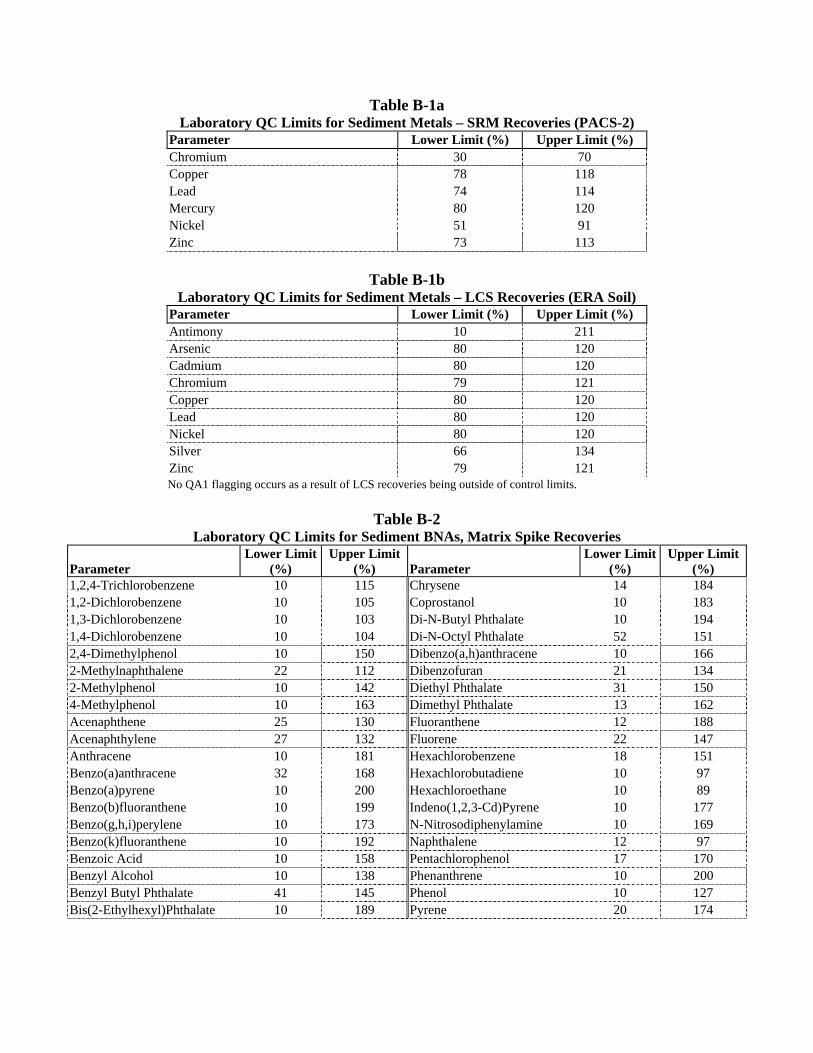
Table B-1a Laboratory QC Limits for Sediment Metals – SRM Recoveries (PACS-2)
Parameter Lower Limit (%) Upper Limit (%) Chromium 30 70 Copper 78 118 Lead 74 114 Mercury 80 120 Nickel 51 91 Zinc 73 113
Table B-1b
Laboratory QC Limits for Sediment Metals – LCS Recoveries (ERA Soil) Parameter Lower Limit (%) Upper Limit (%) Antimony 10 211 Arsenic 80 120 Cadmium 80 120 Chromium 79 121 Copper 80 120 Lead 80 120 Nickel 80 120 Silver 66 134 Zinc 79 121
No QA1 flagging occurs as a result of LCS recoveries being outside of control limits.
Table B-2 Laboratory QC Limits for Sediment BNAs, Matrix Spike Recoveries
Parameter
Lower Limit (%)
Upper Limit (%)
Parameter
Lower Limit (%)
Upper Limit (%)
1,2,4-Trichlorobenzene 10 115 Chrysene 14 184 1,2-Dichlorobenzene 10 105 Coprostanol 10 183 1,3-Dichlorobenzene 10 103 Di-N-Butyl Phthalate 10 194 1,4-Dichlorobenzene 10 104 Di-N-Octyl Phthalate 52 151 2,4-Dimethylphenol 10 150 Dibenzo(a,h)anthracene 10 166 2-Methylnaphthalene 22 112 Dibenzofuran 21 134 2-Methylphenol 10 142 Diethyl Phthalate 31 150 4-Methylphenol 10 163 Dimethyl Phthalate 13 162 Acenaphthene 25 130 Fluoranthene 12 188 Acenaphthylene 27 132 Fluorene 22 147 Anthracene 10 181 Hexachlorobenzene 18 151 Benzo(a)anthracene 32 168 Hexachlorobutadiene 10 97 Benzo(a)pyrene 10 200 Hexachloroethane 10 89 Benzo(b)fluoranthene 10 199 Indeno(1,2,3-Cd)Pyrene 10 177 Benzo(g,h,i)perylene 10 173 N-Nitrosodiphenylamine 10 169 Benzo(k)fluoranthene 10 192 Naphthalene 12 97 Benzoic Acid 10 158 Pentachlorophenol 17 170 Benzyl Alcohol 10 138 Phenanthrene 10 200 Benzyl Butyl Phthalate 41 145 Phenol 10 127 Bis(2-Ethylhexyl)Phthalate 10 189 Pyrene 20 174
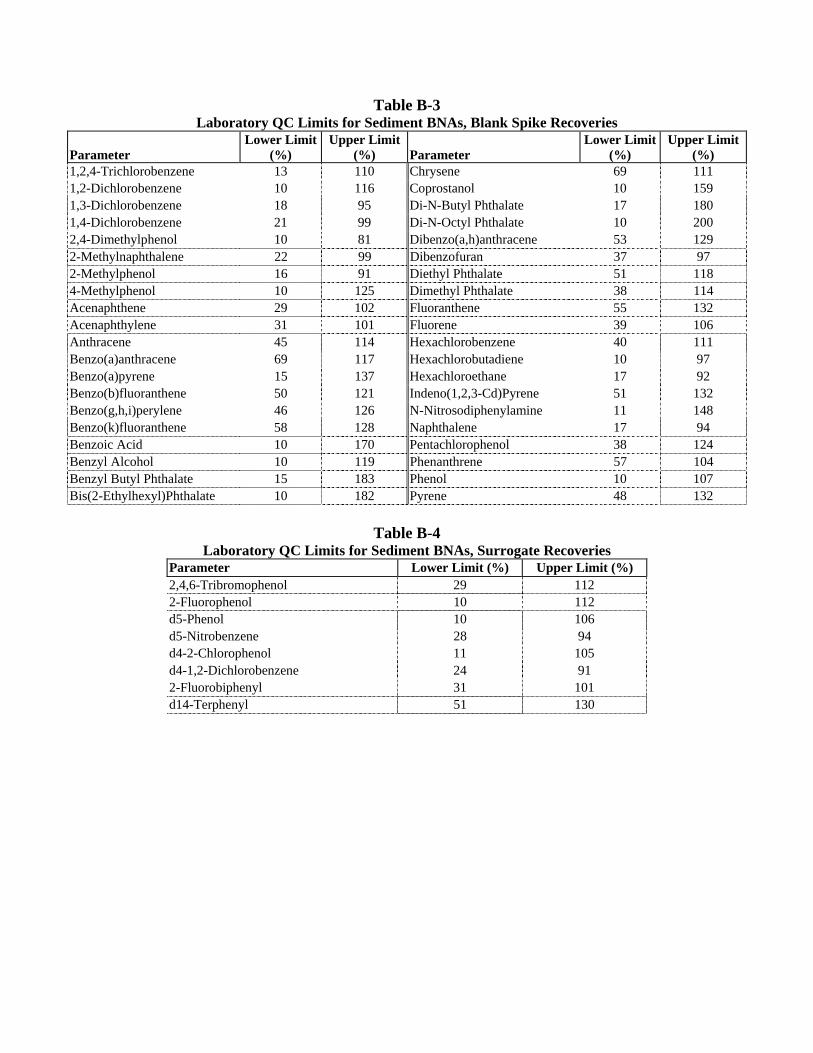
Table B-3 Laboratory QC Limits for Sediment BNAs, Blank Spike Recoveries
Parameter
Lower Limit (%)
Upper Limit (%)
Parameter
Lower Limit (%)
Upper Limit (%)
1,2,4-Trichlorobenzene 13 110 Chrysene 69 111 1,2-Dichlorobenzene 10 116 Coprostanol 10 159 1,3-Dichlorobenzene 18 95 Di-N-Butyl Phthalate 17 180 1,4-Dichlorobenzene 21 99 Di-N-Octyl Phthalate 10 200 2,4-Dimethylphenol 10 81 Dibenzo(a,h)anthracene 53 129 2-Methylnaphthalene 22 99 Dibenzofuran 37 97 2-Methylphenol 16 91 Diethyl Phthalate 51 118 4-Methylphenol 10 125 Dimethyl Phthalate 38 114 Acenaphthene 29 102 Fluoranthene 55 132 Acenaphthylene 31 101 Fluorene 39 106 Anthracene 45 114 Hexachlorobenzene 40 111 Benzo(a)anthracene 69 117 Hexachlorobutadiene 10 97 Benzo(a)pyrene 15 137 Hexachloroethane 17 92 Benzo(b)fluoranthene 50 121 Indeno(1,2,3-Cd)Pyrene 51 132 Benzo(g,h,i)perylene 46 126 N-Nitrosodiphenylamine 11 148 Benzo(k)fluoranthene 58 128 Naphthalene 17 94 Benzoic Acid 10 170 Pentachlorophenol 38 124 Benzyl Alcohol 10 119 Phenanthrene 57 104 Benzyl Butyl Phthalate 15 183 Phenol 10 107 Bis(2-Ethylhexyl)Phthalate 10 182 Pyrene 48 132
Table B-4
Laboratory QC Limits for Sediment BNAs, Surrogate Recoveries Parameter Lower Limit (%) Upper Limit (%) 2,4,6-Tribromophenol 29 112 2-Fluorophenol 10 112 d5-Phenol 10 106 d5-Nitrobenzene 28 94 d4-2-Chlorophenol 11 105 d4-1,2-Dichlorobenzene 24 91 2-Fluorobiphenyl 31 101 d14-Terphenyl 51 130

Table B-5 Laboratory QC Limits for Sediment BNAs, SRM Recoveries
Parameter Lower Limit (%) Upper Limit (%) Anthracene 28 98 Benzo(a)anthracene 66 124 Benzo(a)pyrene 60 116 Benzo(b)fluoranthene 52 190 Benzo(g,h,i)perylene 15 121 Benzo(k)fluoranthene 60 146 Chrysene 77 136 Dibenzo(a,h)anthracene 10 200 Fluoranthene 45 126 Indeno(1,2,3-Cd)Pyrene 33 121 Naphthalene 10 29 Phenanthrene 51 106 Pyrene 36 135
Table B-6
Laboratory QC Limits for Sediment Pesticides and PCBs Matrix Spike Recoveries
Parameter Lower Limit (%) Upper Limit (%) 4,4'-DDD 41 157 4,4'-DDE 59 125 4,4'-DDT 50 144 Aldrin 61 119 Alpha-BHC 59 111 Aroclor 1016 43 176 Aroclor 1260 13 198 Beta-BHC 60 119 Delta-BHC 54 126 Dieldrin 60 139 Endosulfan I 64 113 Endosulfan II 36 146 Endosulfan Sulfate 46 113 Endrin 62 166 Endrin Aldehyde 10 66 Gamma-BHC (Lindane) 61 135 Heptachlor 52 157 Heptachlor Epoxide 61 118 Methoxychlor 53 129
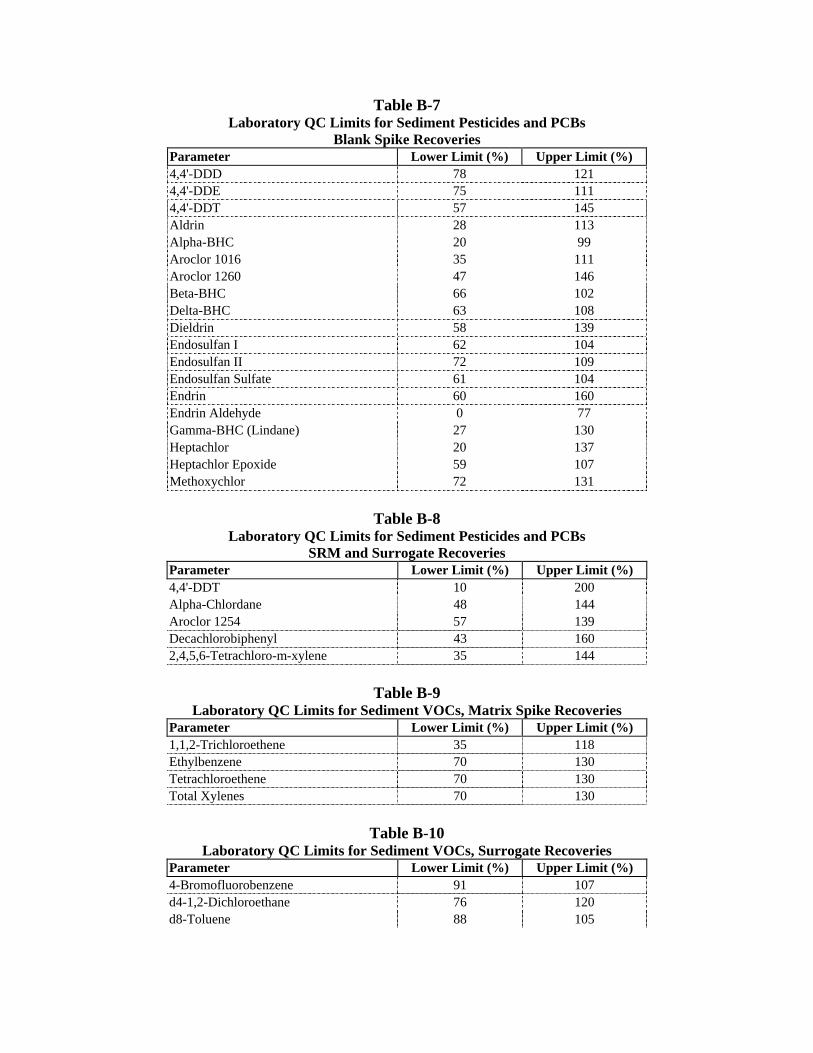
Table B-7 Laboratory QC Limits for Sediment Pesticides and PCBs
Blank Spike Recoveries Parameter Lower Limit (%) Upper Limit (%) 4,4'-DDD 78 121 4,4'-DDE 75 111 4,4'-DDT 57 145 Aldrin 28 113 Alpha-BHC 20 99 Aroclor 1016 35 111 Aroclor 1260 47 146 Beta-BHC 66 102 Delta-BHC 63 108 Dieldrin 58 139 Endosulfan I 62 104 Endosulfan II 72 109 Endosulfan Sulfate 61 104 Endrin 60 160 Endrin Aldehyde 0 77 Gamma-BHC (Lindane) 27 130 Heptachlor 20 137 Heptachlor Epoxide 59 107 Methoxychlor 72 131
Table B-8
Laboratory QC Limits for Sediment Pesticides and PCBs SRM and Surrogate Recoveries
Parameter Lower Limit (%) Upper Limit (%) 4,4'-DDT 10 200 Alpha-Chlordane 48 144 Aroclor 1254 57 139 Decachlorobiphenyl 43 160 2,4,5,6-Tetrachloro-m-xylene 35 144
Table B-9
Laboratory QC Limits for Sediment VOCs, Matrix Spike Recoveries Parameter Lower Limit (%) Upper Limit (%) 1,1,2-Trichloroethene 35 118 Ethylbenzene 70 130 Tetrachloroethene 70 130 Total Xylenes 70 130
Table B-10
Laboratory QC Limits for Sediment VOCs, Surrogate Recoveries Parameter Lower Limit (%) Upper Limit (%) 4-Bromofluorobenzene 91 107 d4-1,2-Dichloroethane 76 120 d8-Toluene 88 105

APPENDIX C LABORATORY INFORMATION MANAGEMENT SYSTEM (LIMS)
PRODUCTS AND LIST TYPES TABLE C-1
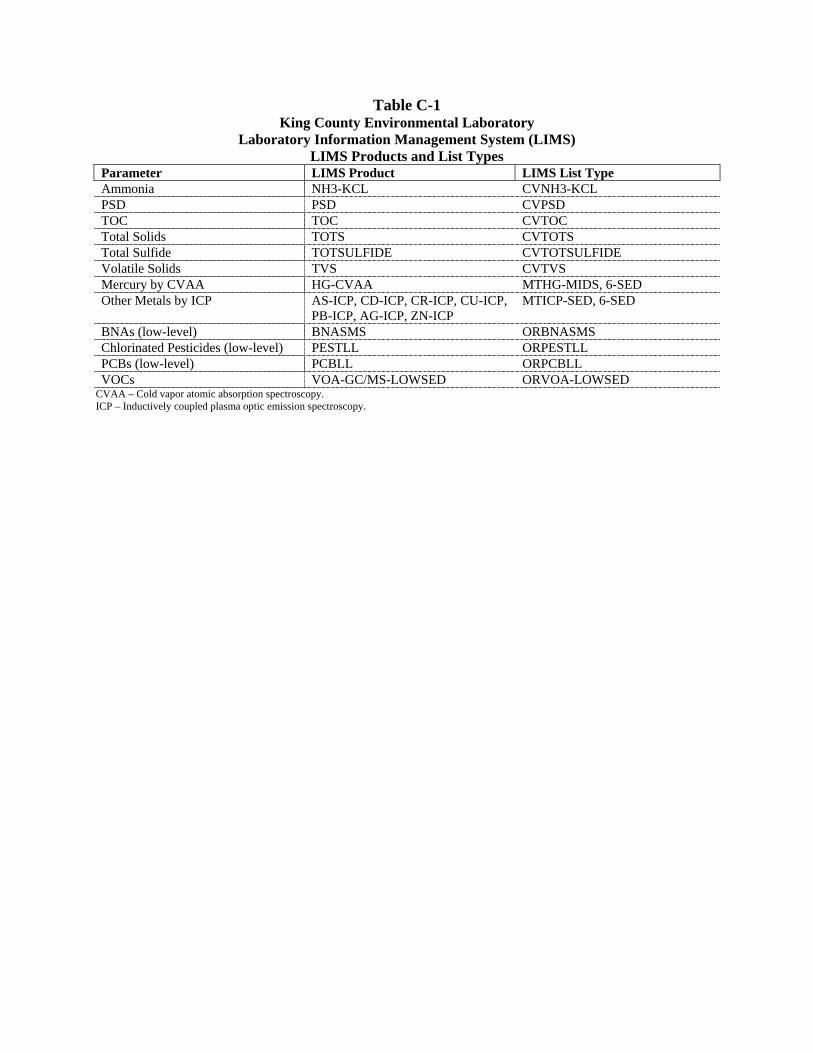
Table C-1 King County Environmental Laboratory
Laboratory Information Management System (LIMS) LIMS Products and List Types
Parameter LIMS Product LIMS List Type Ammonia NH3-KCL CVNH3-KCL PSD PSD CVPSD TOC TOC CVTOC Total Solids TOTS CVTOTS Total Sulfide TOTSULFIDE CVTOTSULFIDE Volatile Solids TVS CVTVS Mercury by CVAA HG-CVAA MTHG-MIDS, 6-SED Other Metals by ICP AS-ICP, CD-ICP, CR-ICP, CU-ICP,
PB-ICP, AG-ICP, ZN-ICP MTICP-SED, 6-SED
BNAs (low-level) BNASMS ORBNASMS Chlorinated Pesticides (low-level) PESTLL ORPESTLL PCBs (low-level) PCBLL ORPCBLL VOCs VOA-GC/MS-LOWSED ORVOA-LOWSED
CVAA – Cold vapor atomic absorption spectroscopy. ICP – Inductively coupled plasma optic emission spectroscopy.