denitrification barriers as a tool for nitrogen reduction in ... bednarek...denitrification barriers...
TRANSCRIPT

Denitrification barriers as a tool
for nitrogen reduction in agriculture catchments
Bednarek A1/2., Mankiewicz–Boczek J1/2., Gągała I1., Serwecińska L1., S. Szklarek1 , Izydorczyk K. 1, Frątczak W. 1, Zalewski M.1/2
1 European Regional Centre for Ecohydrology of the Polish Academy of Science, 3 Tylna, 90-364 Lodz, Poland; E-mail: [email protected] Department of Applied Ecology, Faculty of Biology and Environmental Protection, University of Lodz, 12/16 Banacha, 90-264 Lodz;
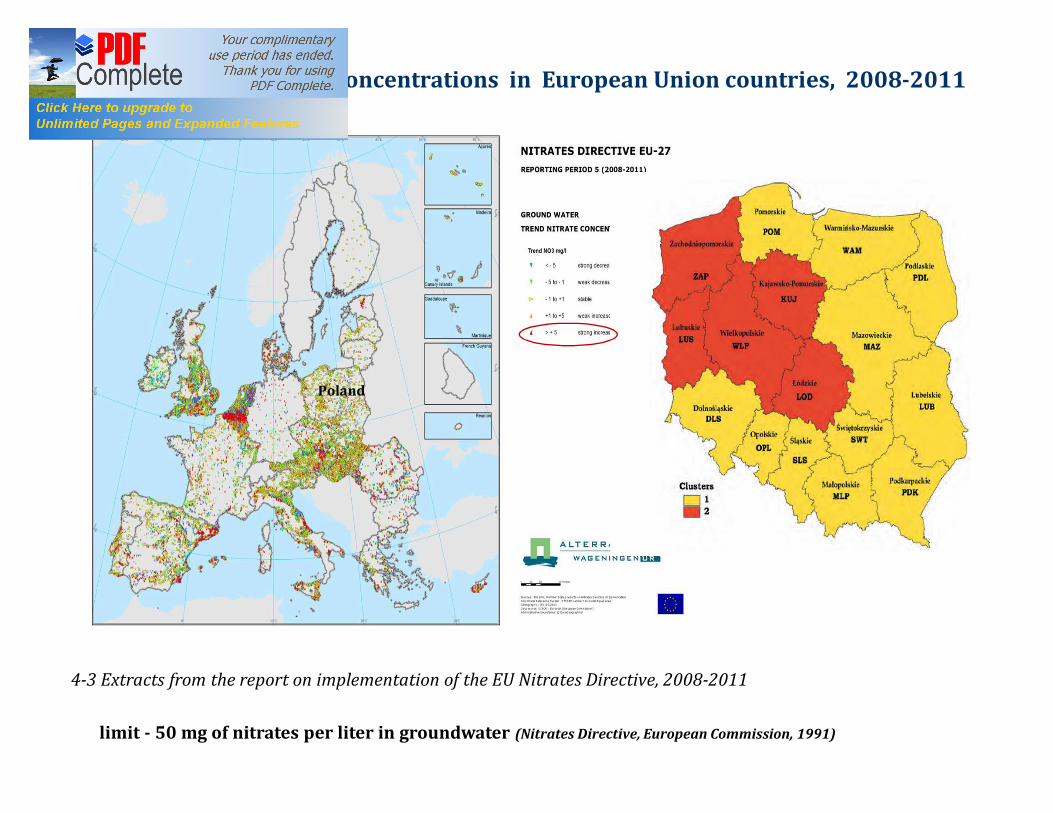
Groundwater nitrates concentrations in European Union countries, 2008-2011
4-3 Extracts from the report on implementation of the EU Nitrates Directive, 2008-2011
Poland
limit - 50 mg of nitrates per liter in groundwater (Nitrates Directive, European Commission, 1991)

emission NH3
Fot. http://en.wikipedia.org Fot. M.Ubraniak
Fot. M.Wysocki
NITROGEN POLLUTIONDIFFUSED POINT
leaching NO3
mineral fertilizers
lack of ecotone zone
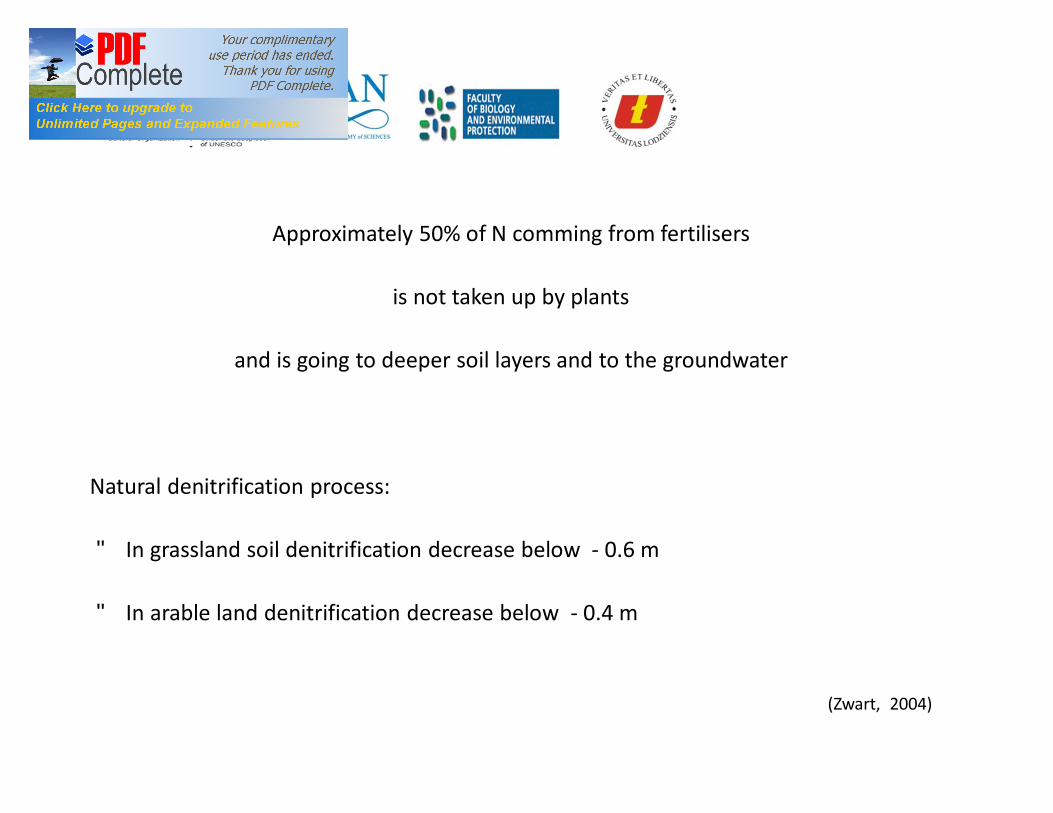
Approximately 50% of N comming from fertilisers
is not taken up by plants
and is going to deeper soil layers and to the groundwater
Natural denitrification process:
• In grassland soil denitrification decrease below - 0.6 m
• In arable land denitrification decrease below - 0.4 m
(Zwart, 2004)
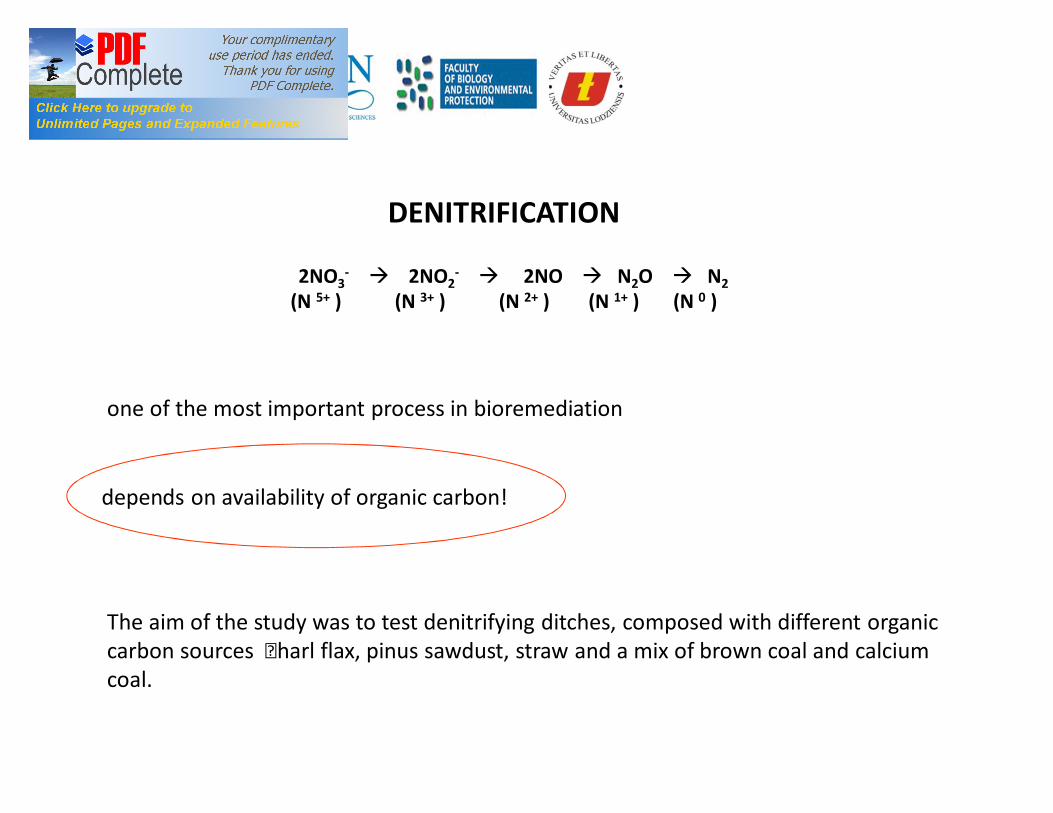
DENITRIFICATION
2NO3- à 2NO2
- à 2NO à N2O à N2(N 5+ ) (N 3+ ) (N 2+ ) (N 1+ ) (N 0 )
• one of the most important process in bioremediation
• depends on availability of organic carbon!
The aim of the study was to test denitrifying ditches, composed with different organic carbon sources – harl flax, pinus sawdust, straw and a mix of brown coal and calcium coal.
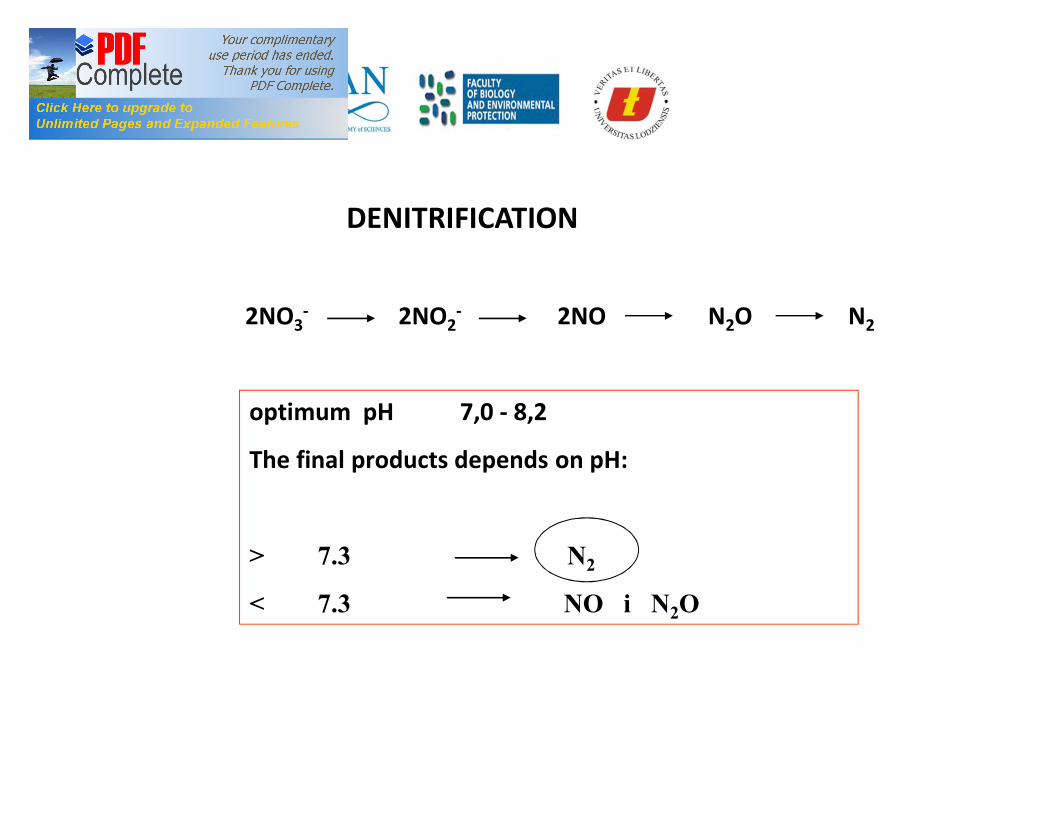
DENITRIFICATION
2NO3- 2NO2
- 2NO N2O N2
optimum pH 7,0 - 8,2
The final products depends on pH:
> 7.3 N2
< 7.3 NO i N2O
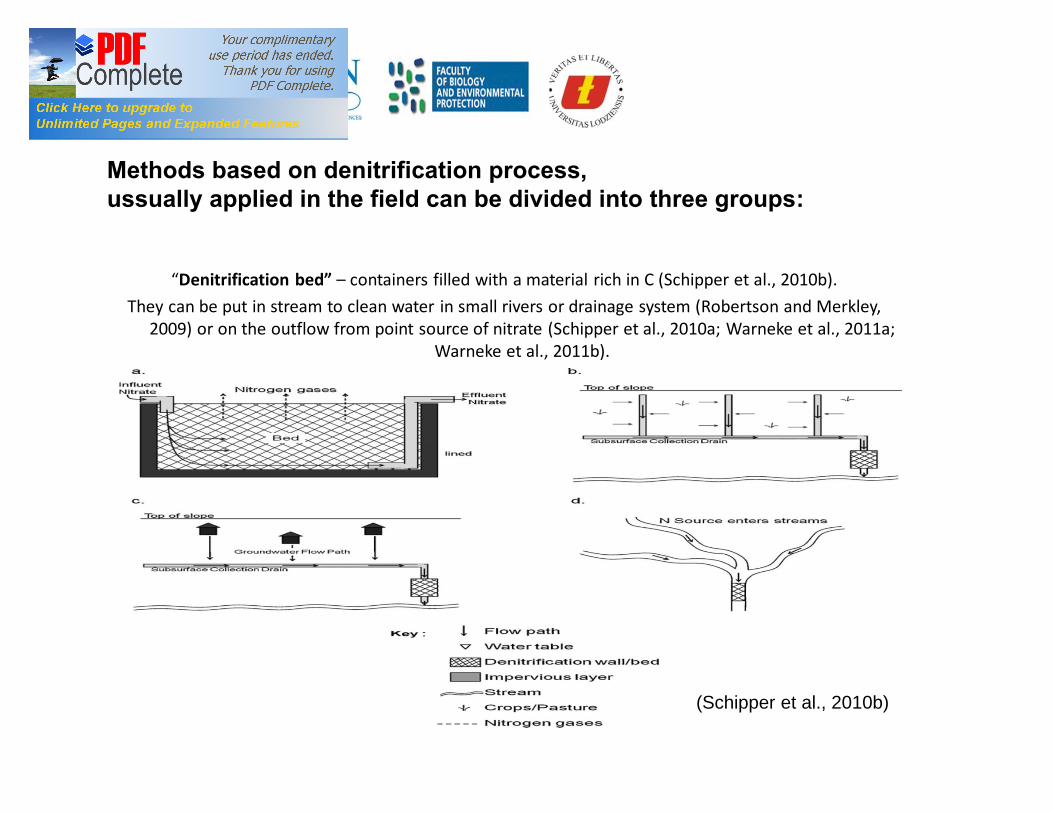
“Denitrification bed” – containers filled with a material rich in C (Schipper et al., 2010b). They can be put in stream to clean water in small rivers or drainage system (Robertson and Merkley,
2009) or on the outflow from point source of nitrate (Schipper et al., 2010a; Warneke et al., 2011a; Warneke et al., 2011b).
(Schipper et al., 2010b)
Methods based on denitrification process, ussually applied in the field can be divided into three groups:
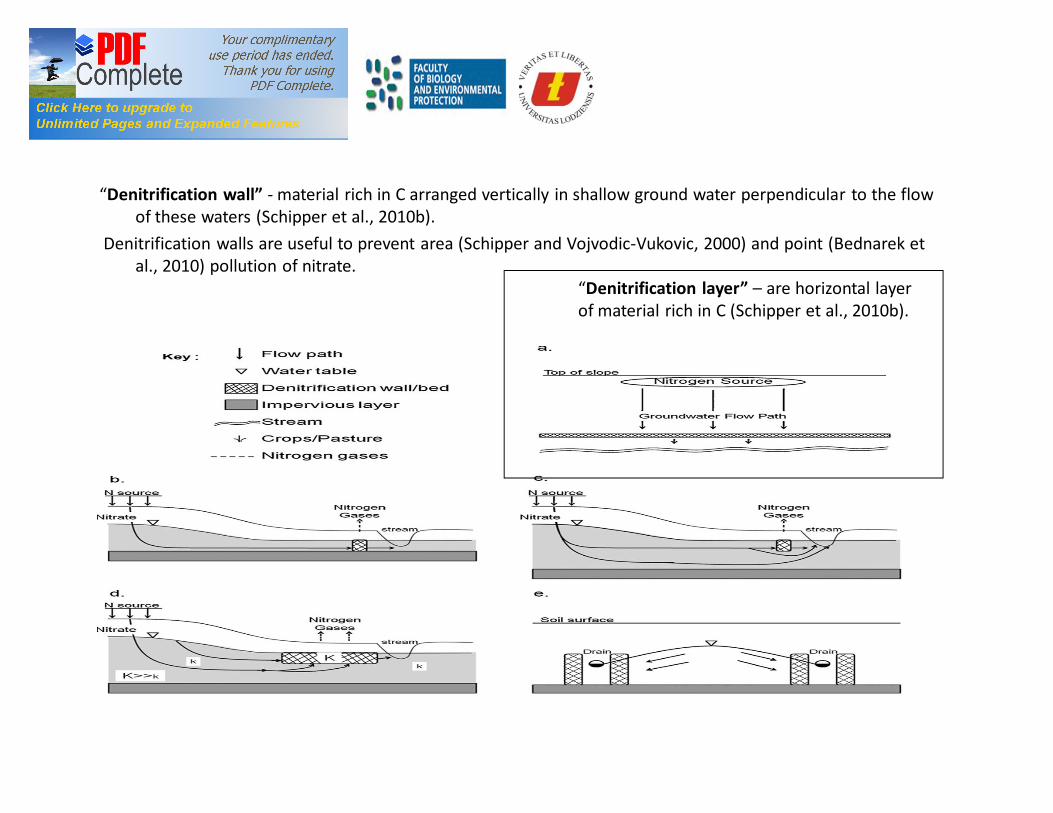
“Denitrification wall” - material rich in C arranged vertically in shallow ground water perpendicular to the flow of these waters (Schipper et al., 2010b).
Denitrification walls are useful to prevent area (Schipper and Vojvodic-Vukovic, 2000) and point (Bednarek et al., 2010) pollution of nitrate.
“Denitrification layer” – are horizontal layer of material rich in C (Schipper et al., 2010b).
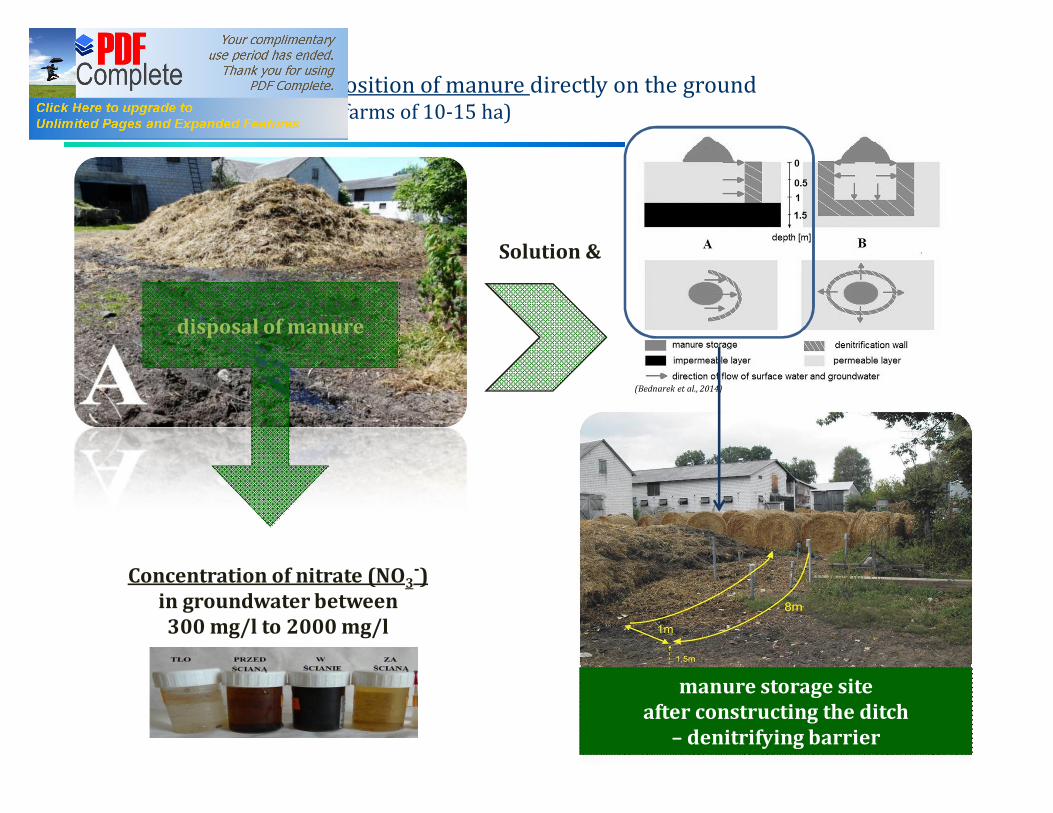
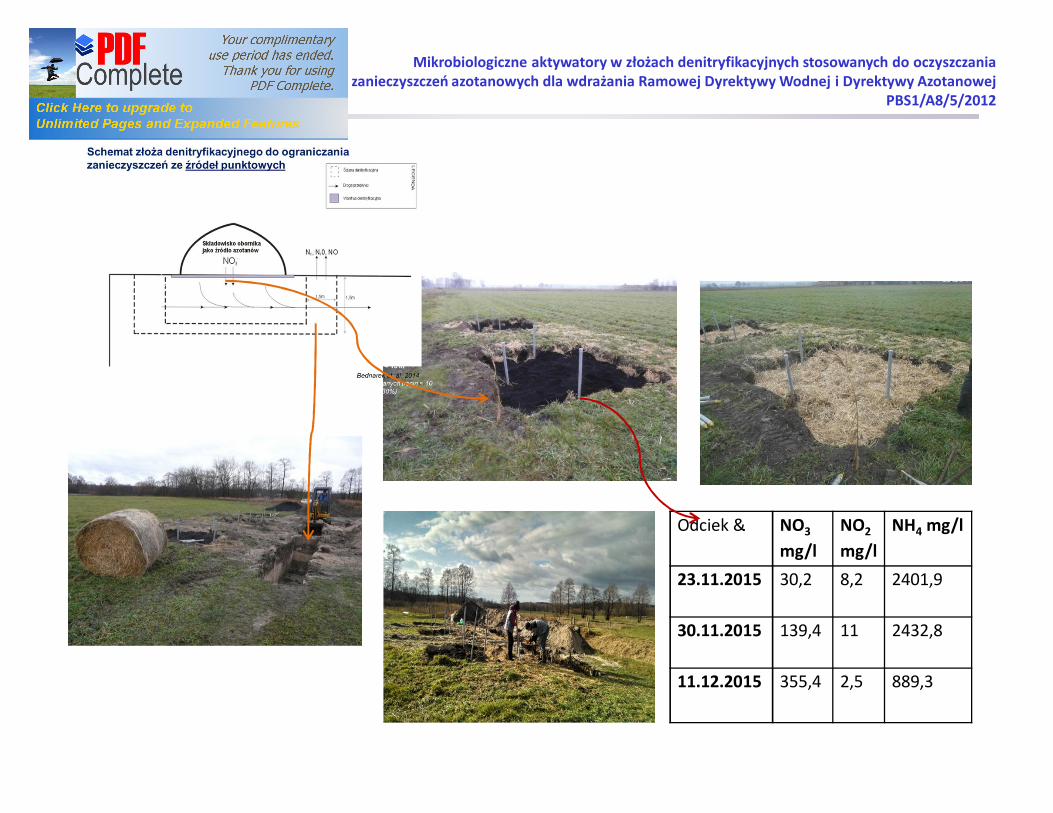
Problem in Poland - deposition of manure directly on the ground (especially in medium-sized farms of 10-15 ha)
Concentration of nitrate (NO3-)
in groundwater between 300 mg/l to 2000 mg/l
Długość ≈ 15 mObjętość dodanych trocin ≈ 10 m3(30%)
disposal of manure
manure storage site after constructing the ditch
– denitrifying barrier
Solution…
(Bednarek et al., 2014)
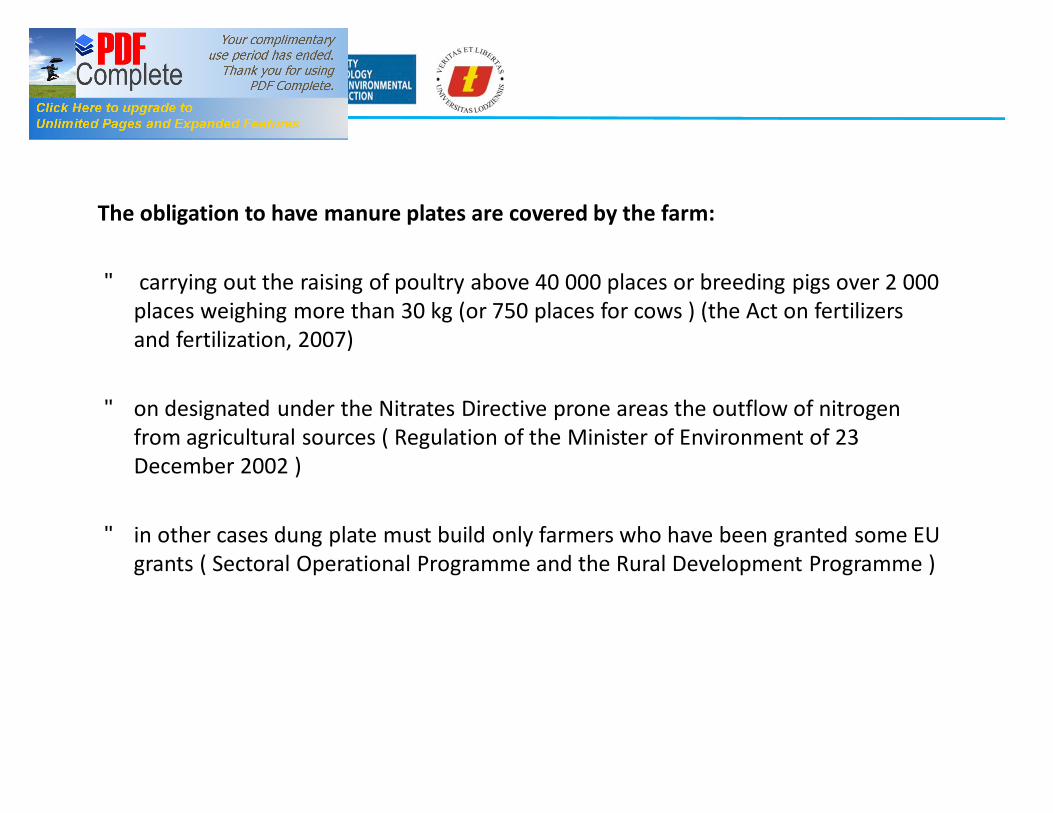
The obligation to have manure plates are covered by the farm:
• carrying out the raising of poultry above 40 000 places or breeding pigs over 2 000 places weighing more than 30 kg (or 750 places for cows ) (the Act on fertilizers and fertilization, 2007)
• on designated under the Nitrates Directive prone areas the outflow of nitrogen from agricultural sources ( Regulation of the Minister of Environment of 23 December 2002 )
• in other cases dung plate must build only farmers who have been granted some EU grants ( Sectoral Operational Programme and the Rural Development Programme )
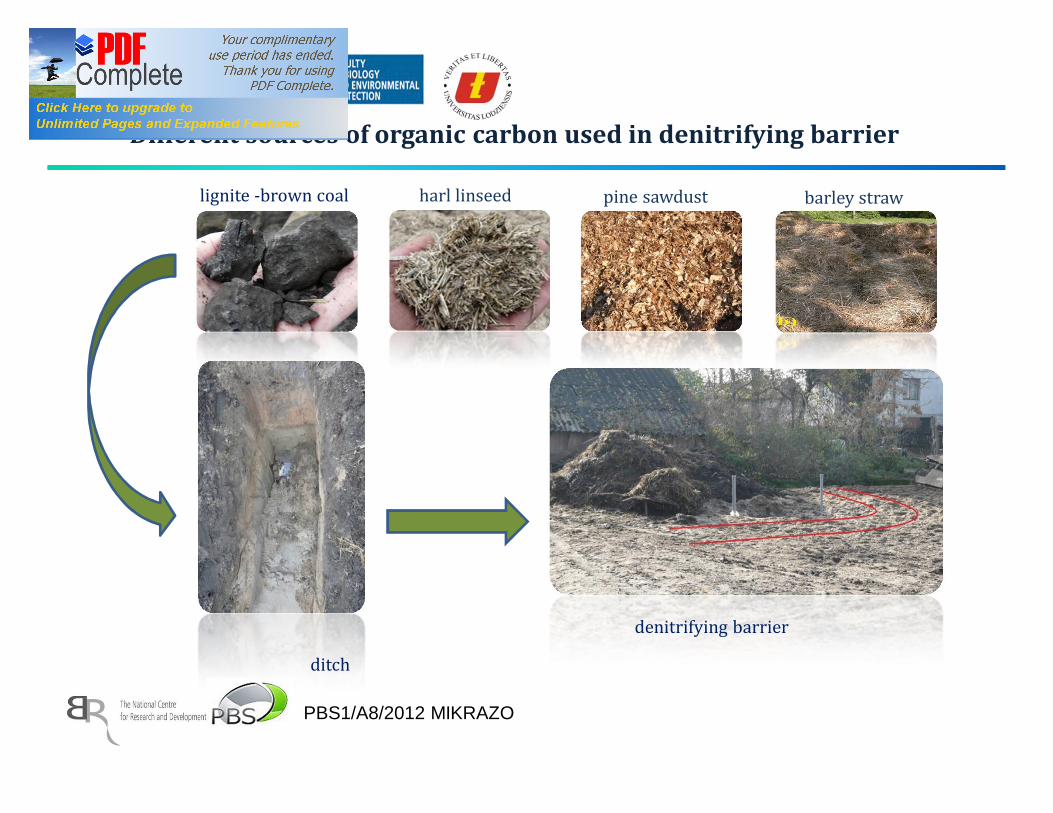
Different sources of organic carbon used in denitrifying barrier
lignite -brown coal pine sawdust barley straw harl linseed
ditch denitrifying barrierPBS1/A8/2012 MIKRAZO
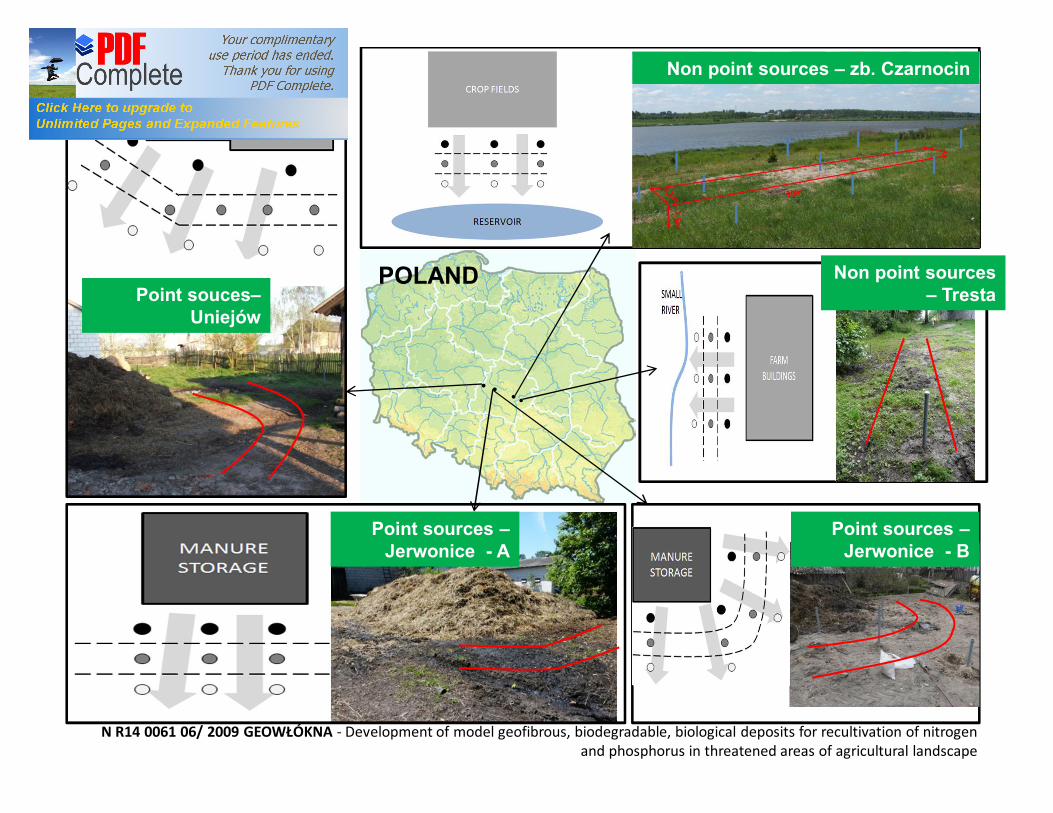
POLAND
P1 Non point sources – zb. Czarnocin
Point souces–Uniejów
Point sources –Jerwonice - A
Non point sources – Tresta
N R14 0061 06/ 2009 GEOWŁÓKNA - Development of model geofibrous, biodegradable, biological deposits for recultivation of nitrogen and phosphorus in threatened areas of agricultural landscape
Point sources –Jerwonice - B
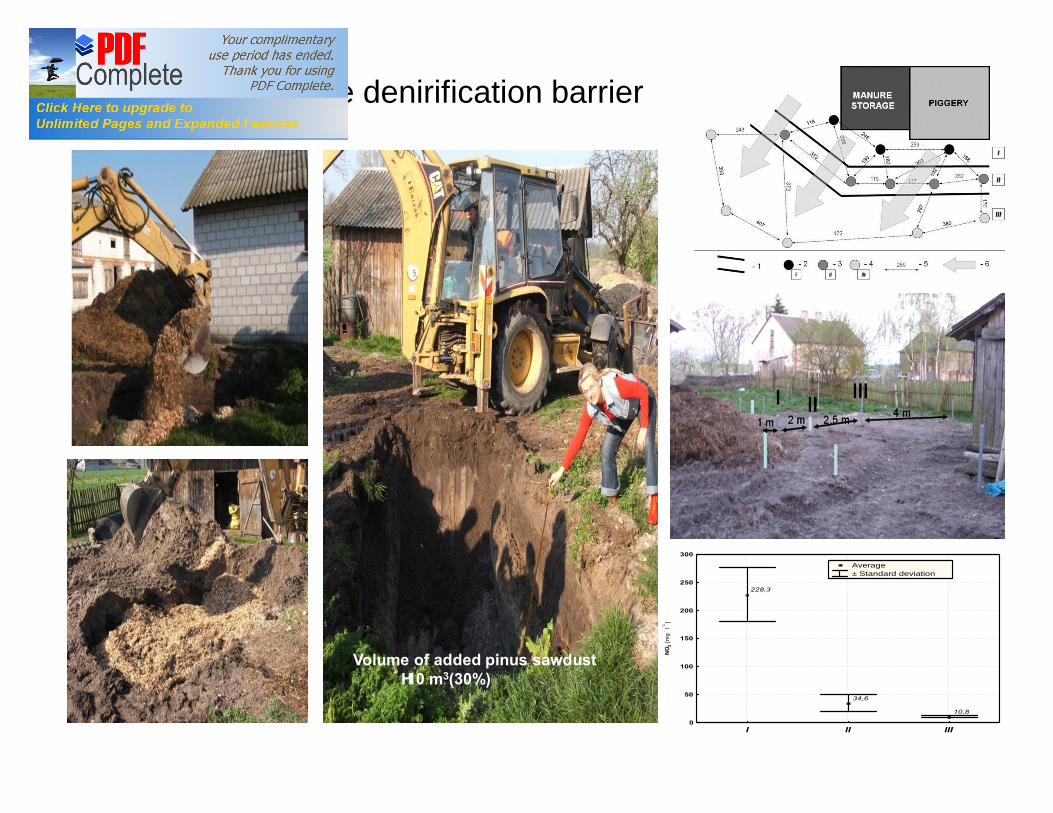
Construction of the denirification barrier
228,3
34,6
10,8
I II III0
50
100
150
200
250
300
NO 3
[mg
. l-1]
Average ± Standard deviation
Volume of added pinus sawdust≈ 10 m3(30%)
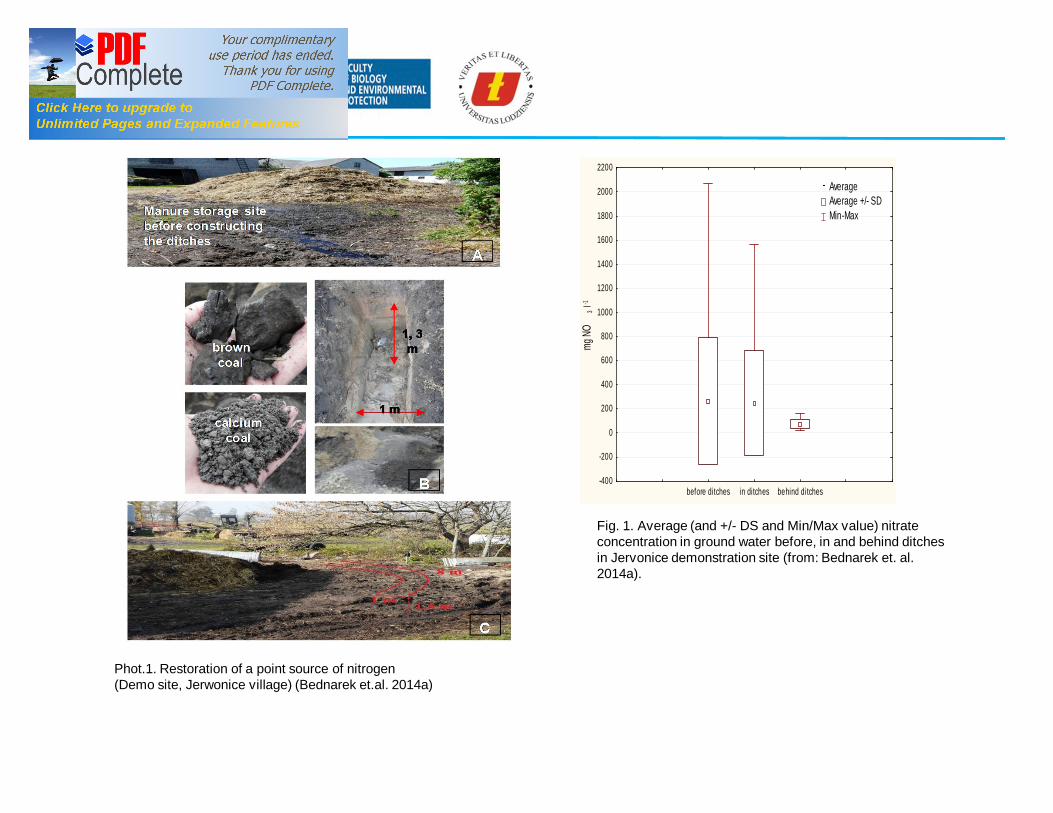
Phot.1. Restoration of a point source of nitrogen (Demo site, Jerwonice village) (Bednarek et.al. 2014a)
before ditches in ditches behind ditches-400
-200
0
200
400
600
800
1000
1200
1400
1600
1800
2000
2200
mg N
O3 l
-1
Average Average +/- SD Min-Max
Fig. 1. Average (and +/- DS and Min/Max value) nitrate concentration in ground water before, in and behind ditches in Jervonice demonstration site (from: Bednarek et. al. 2014a).
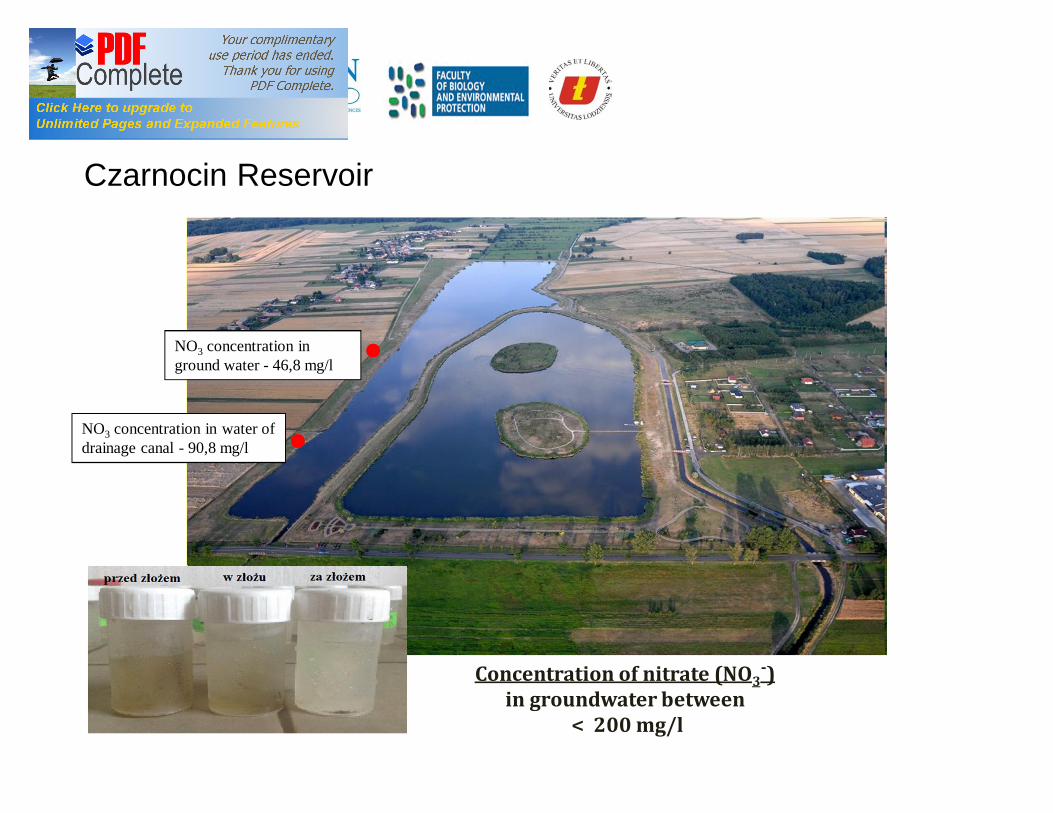
Czarnocin Reservoir
NO3 concentration in water of drainage canal - 90,8 mg/l
NO3 concentration in ground water - 46,8 mg/l
Concentration of nitrate (NO3-)
in groundwater between < 200 mg/l
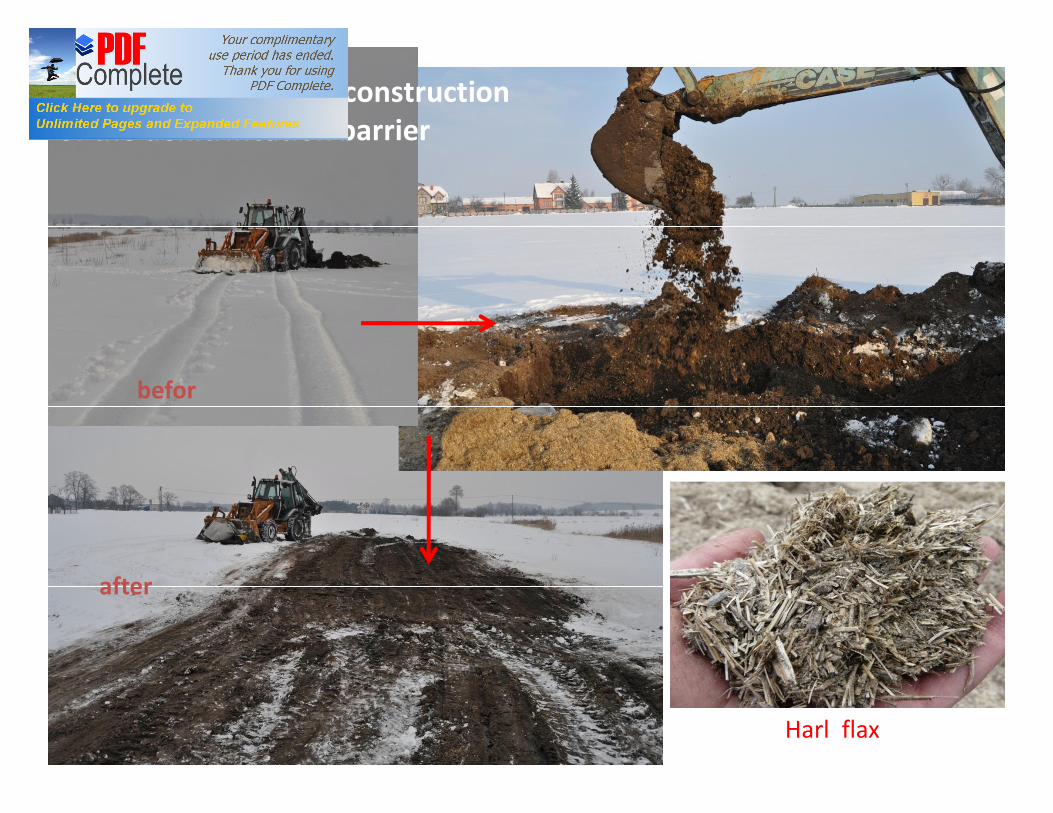
Czarnocin Reservoir - constructionof the denitrification barrier
Harl flax
befor
after
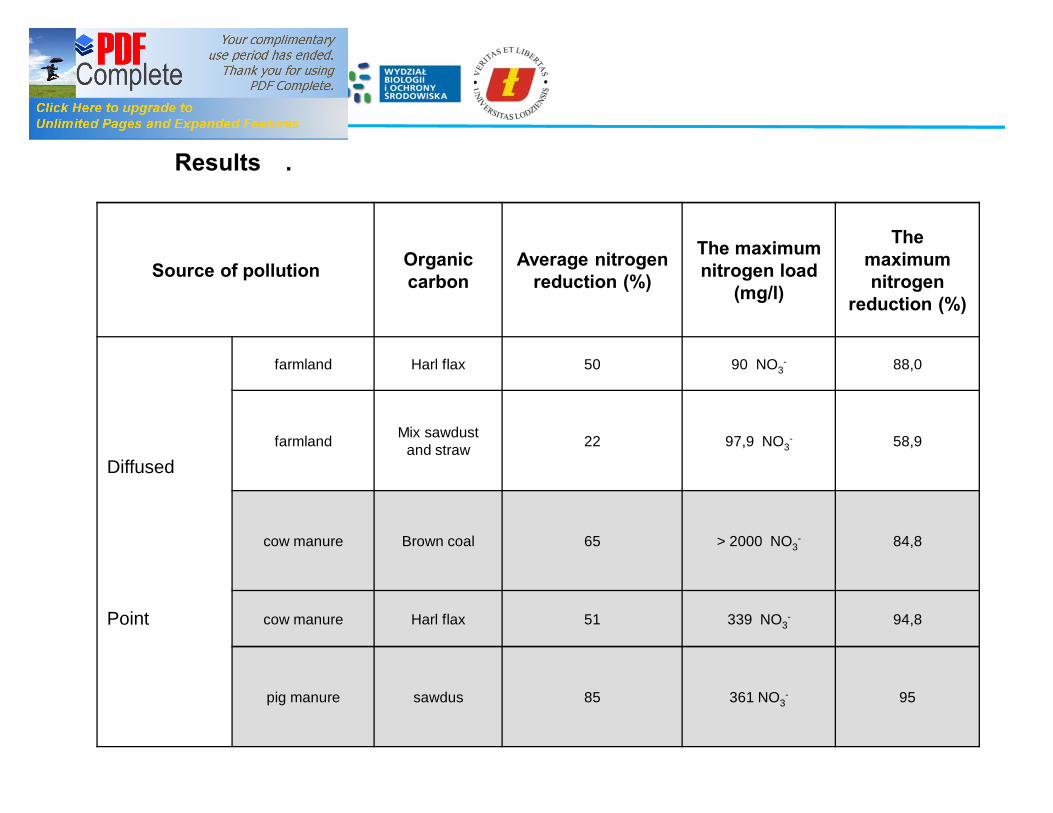
Source of pollution Organiccarbon
Average nitrogenreduction (%)
The maximumnitrogen load
(mg/l)
Themaximumnitrogen
reduction (%)
Diffused
Point
farmland Harl flax 50 90 NO3- 88,0
farmland Mix sawdustand straw 22 97,9 NO3
- 58,9
cow manure Brown coal 65 > 2000 NO3- 84,8
cow manure Harl flax 51 339 NO3- 94,8
pig manure sawdus 85 361 NO3- 95
Results….
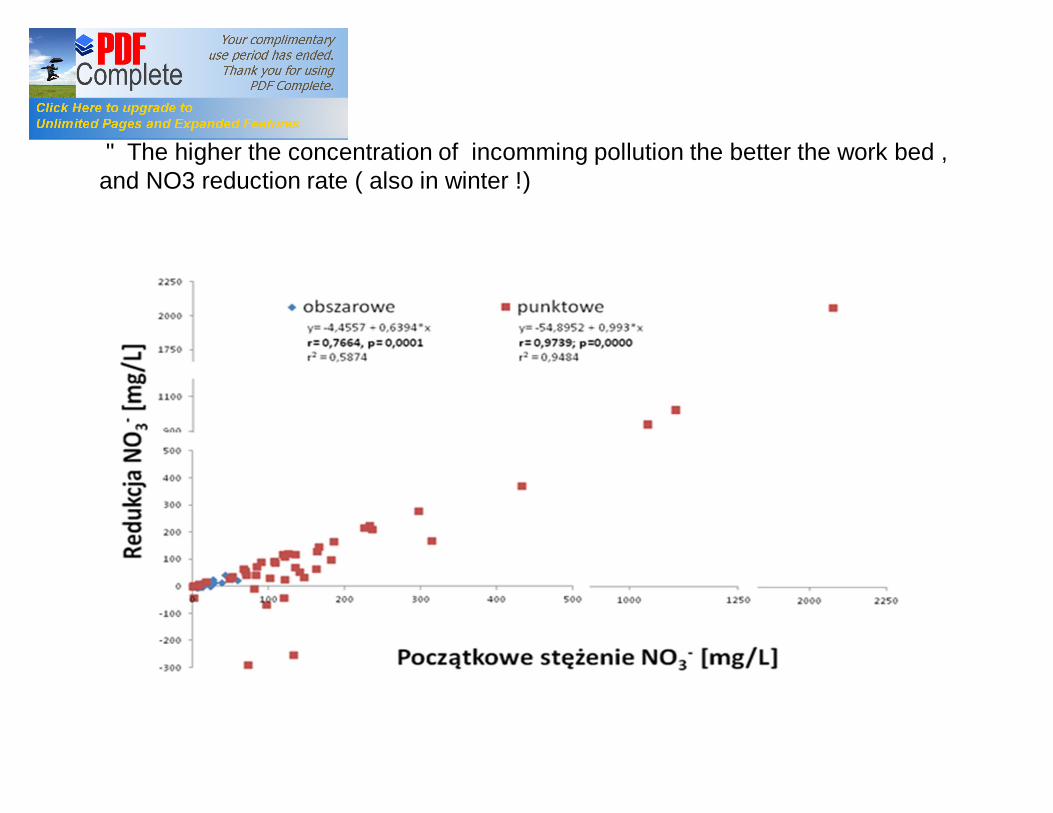
Results….
• The higher the concentration of incomming pollution the better the work bed , and NO3 reduction rate ( also in winter !)
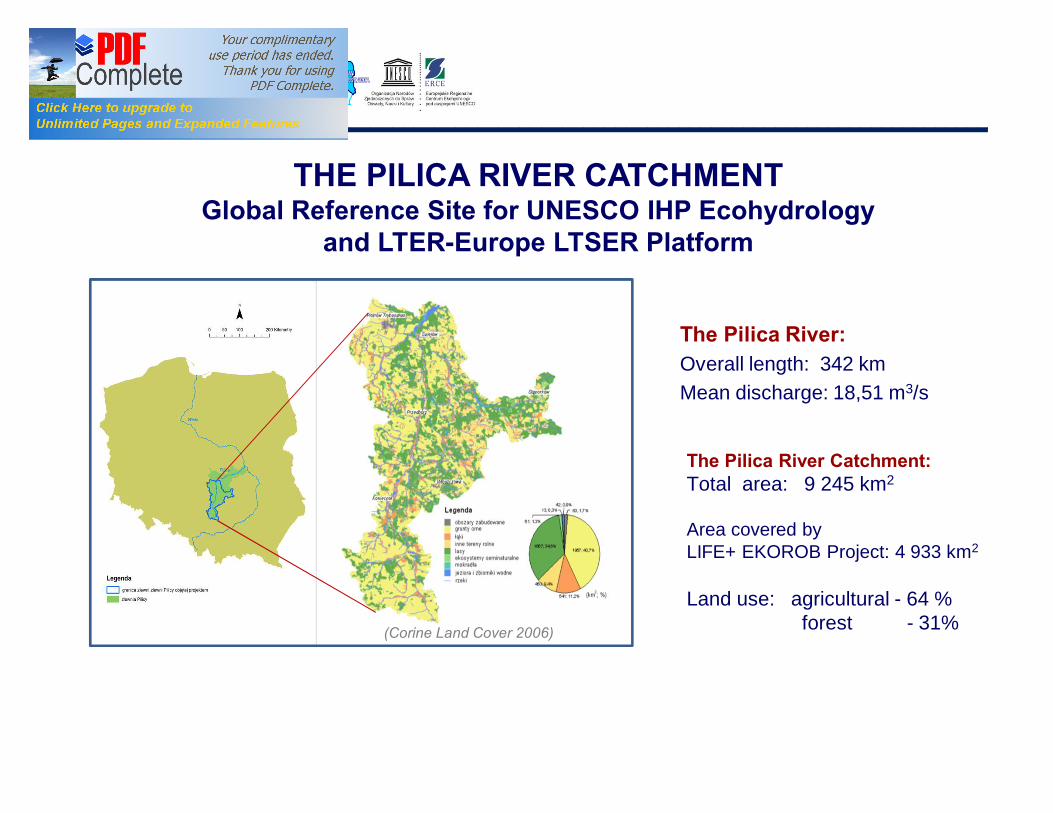
The Pilica River:Overall length: 342 kmMean discharge: 18,51 m3/s
The Pilica River Catchment:Total area: 9 245 km2
Area covered by LIFE+ EKOROB Project: 4 933 km2
Land use: agricultural - 64 %forest - 31%
THE PILICA RIVER CATCHMENTGlobal Reference Site for UNESCO IHP Ecohydrology
and LTER-Europe LTSER Platform
(Corine Land Cover 2006)
(www.geoportal.gov.pl)
B1
B4B5
0
100
200
300
400
B1 B4 B5
NO
3 co
ncen
trat
ion
ingr
ound
wat
er[m
g/l]
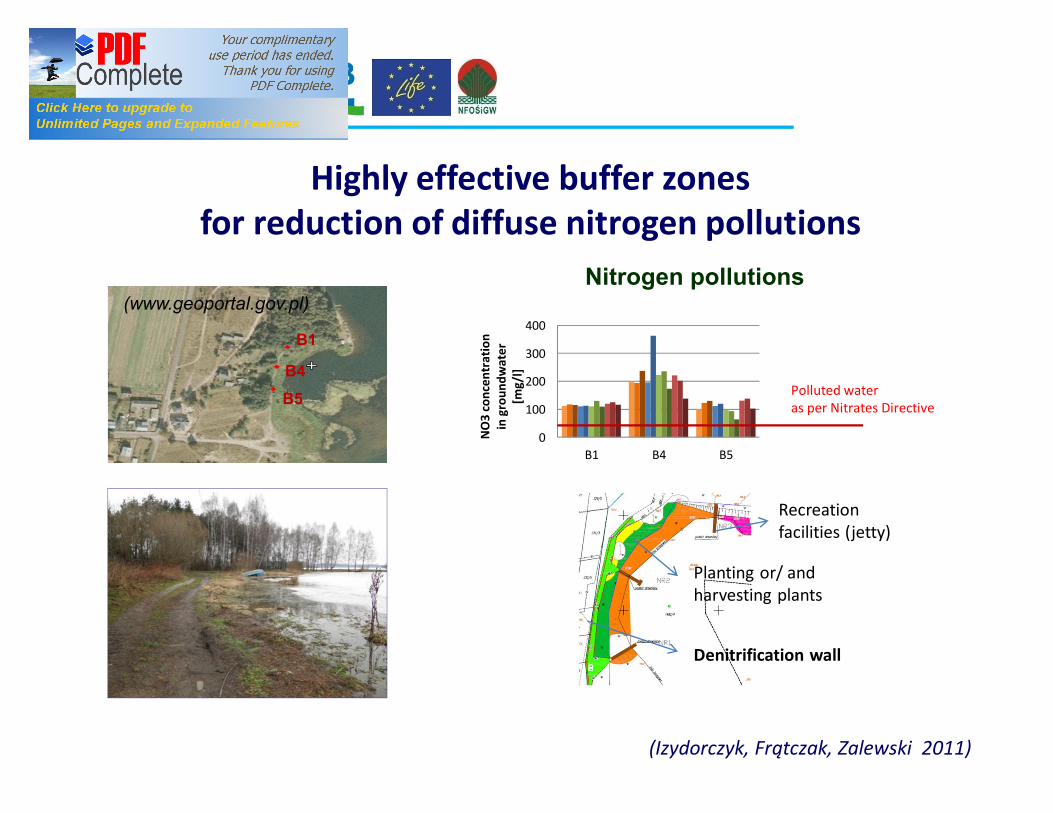
Polluted water as per Nitrates Directive
Denitrification wall
Planting or/ and harvesting plants
Recreation facilities (jetty)
Nitrogen pollutions
(Izydorczyk, Frątczak, Zalewski 2011)
Highly effective buffer zonesfor reduction of diffuse nitrogen pollutions
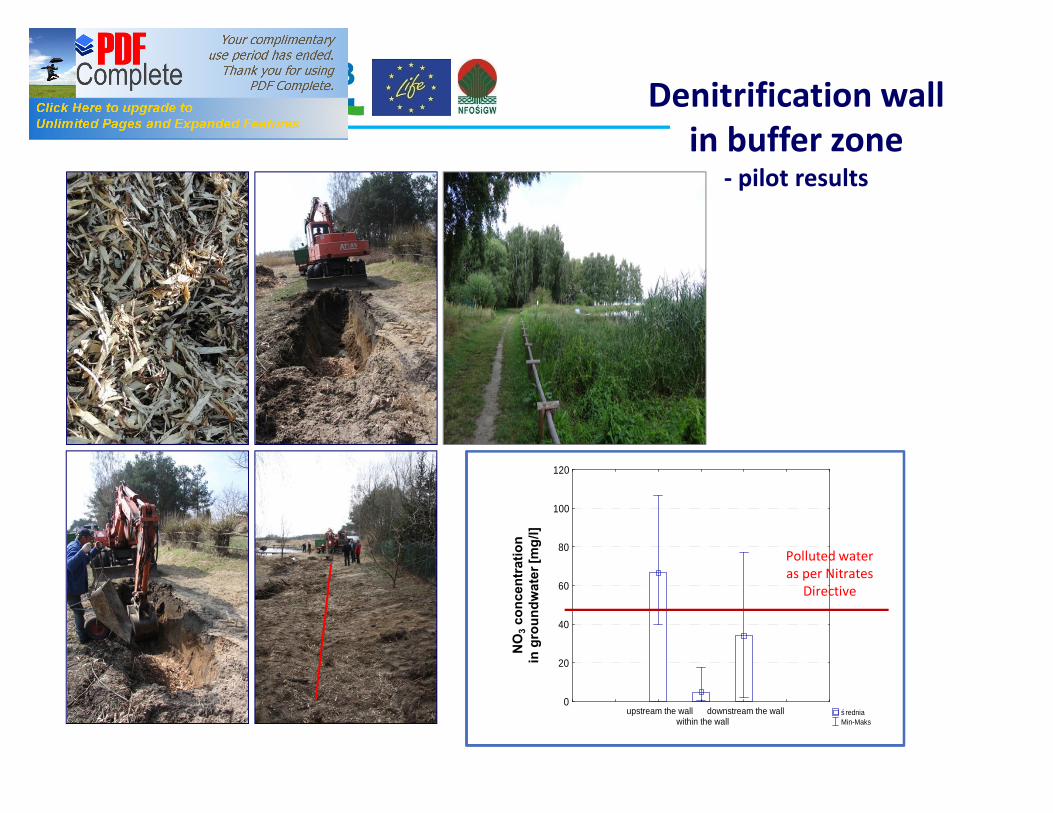
Średnia Min-Maks
upstream the wallwithin the wall
downstream the wall0
20
40
60
80
100
120
Denitrification wall in buffer zone
- pilot results
NO
3co
ncen
trat
ion
in g
roun
dwat
er [m
g/l]
Polluted water as per Nitrates
Directive
Next Question…
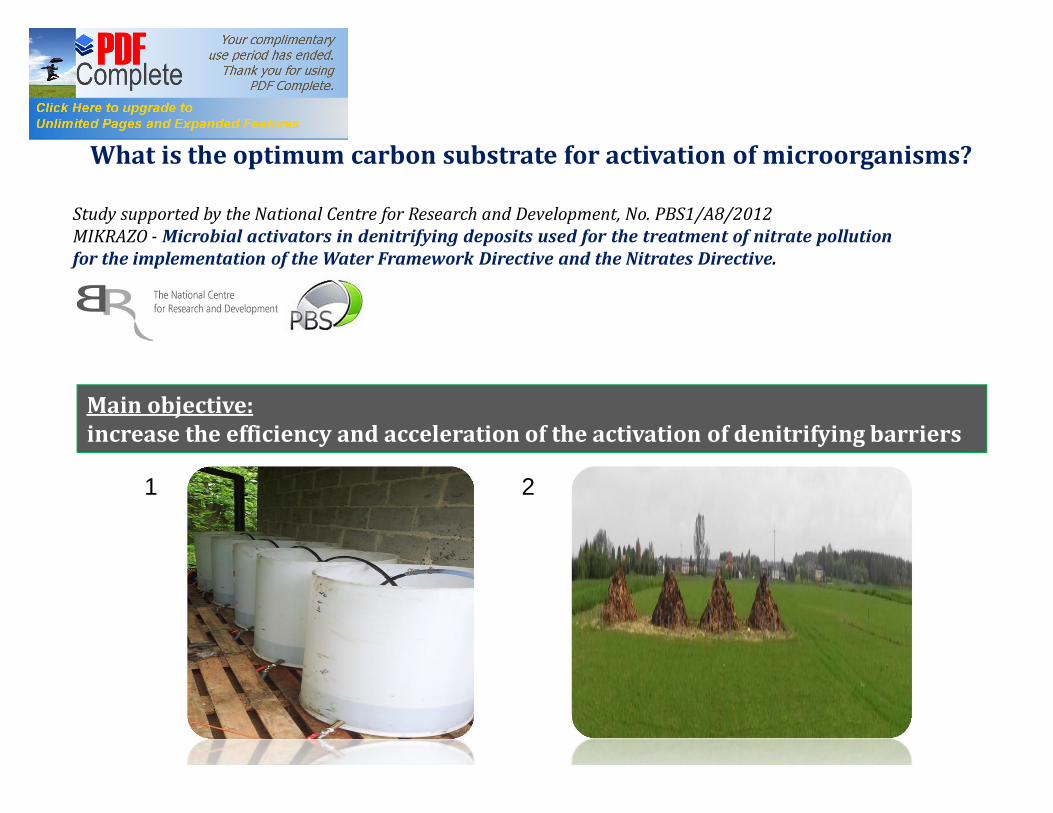
What is the optimum carbon substrate for activation of microorganisms?
Main objective: increase the efficiency and acceleration of the activation of denitrifying barriers
Study supported by the National Centre for Research and Development, No. PBS1/A8/2012MIKRAZO - Microbial activators in denitrifying deposits used for the treatment of nitrate pollutionfor the implementation of the Water Framework Directive and the Nitrates Directive.
1 2
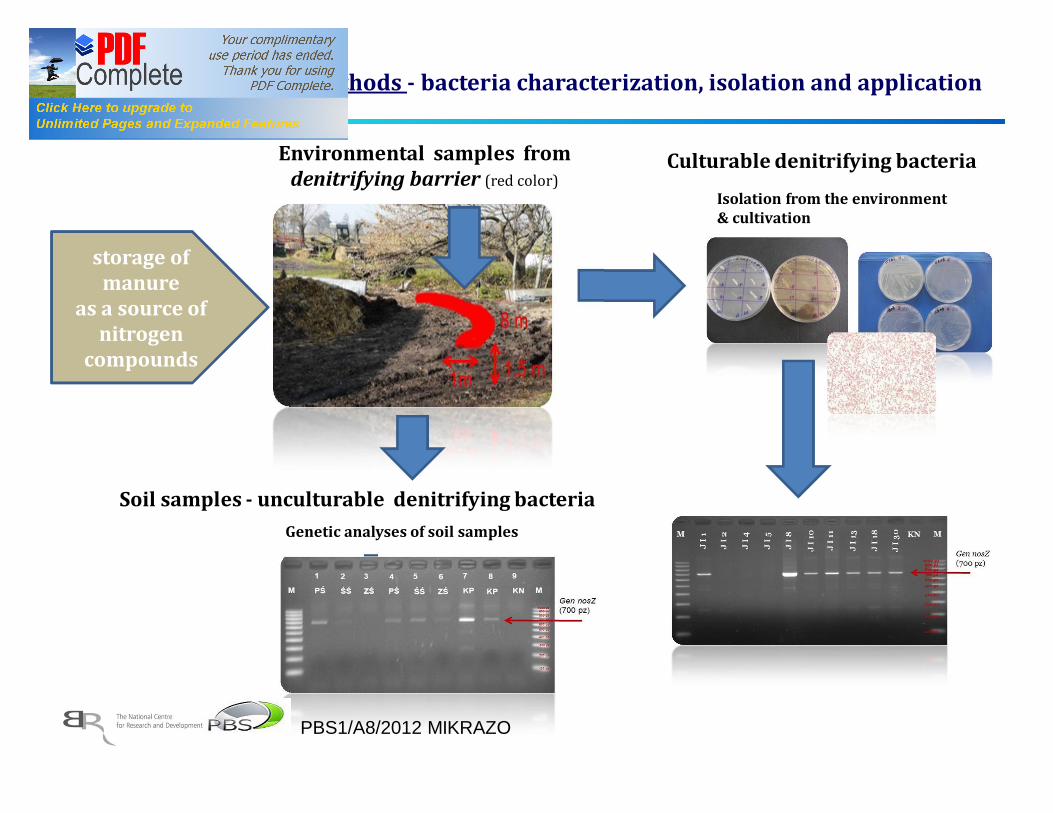
Environmental samples from denitrifying barrier (red color)
Soil samples - unculturable denitrifying bacteria
Isolation from the environment& cultivation
Culturable denitrifying bacteria
Material and methods - bacteria characterization, isolation and application
storage of manure
as a source of nitrogen
compounds
Genetic analyses of soil samples
PBS1/A8/2012 MIKRAZO
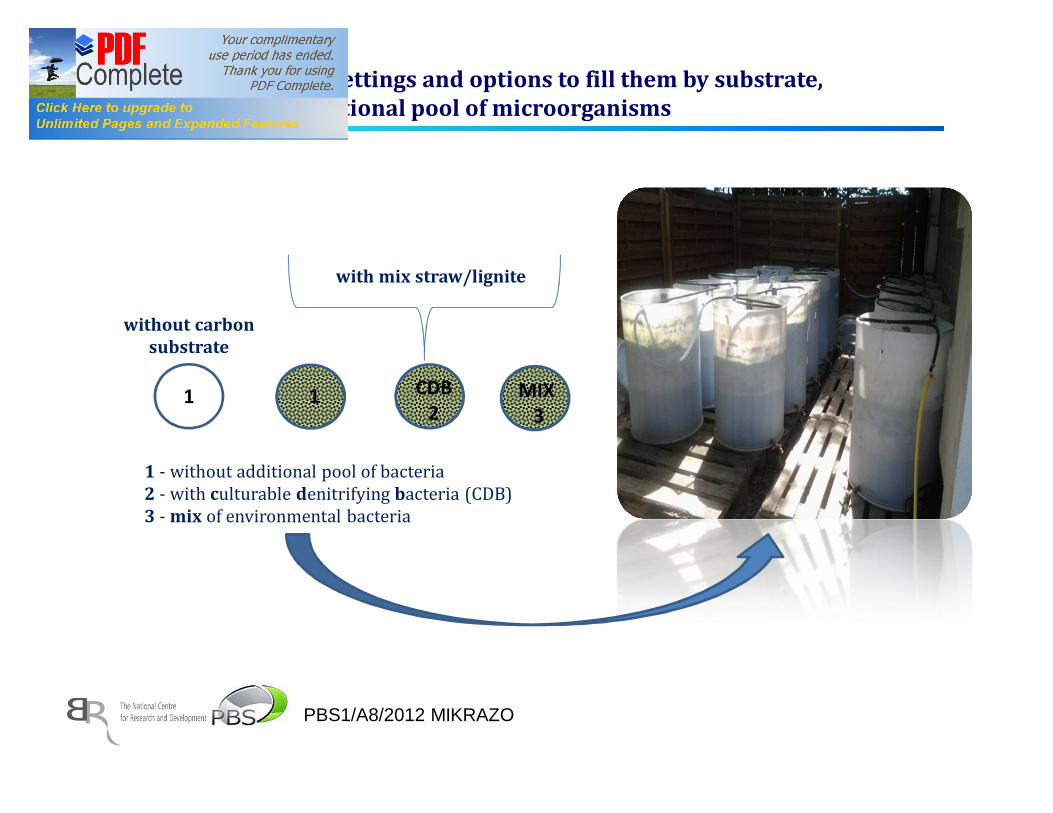
Scheme of bioreactors settings and options to fill them by substrate, and inoculation an additional pool of microorganisms
1 CDB2
1
without carbon substrate
with mix straw/lignite
1 - without additional pool of bacteria2 - with culturable denitrifying bacteria (CDB)3 - mix of environmental bacteria
MIX 3
PBS1/A8/2012 MIKRAZO

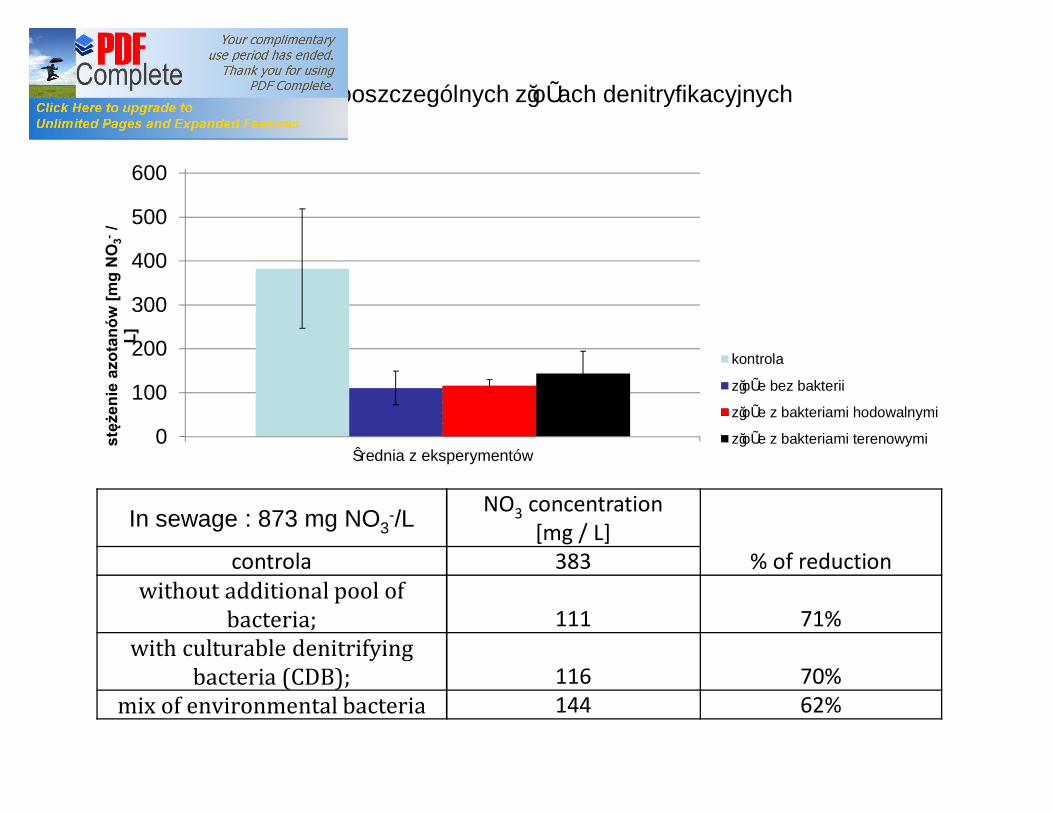
Result … experiment with mix straw/lignite (C substrate) and different variants of bacteria
1 - without additional pool of bacteria; 2 - with culturable denitrifying bacteria (CDB); 3 - mix of environmental bacteria
0200400600800
control 1 2 331st Jul 2014 (after 6 days of experiment)Conc
entr
atio
n [m
g/l]
NO3- NO2- NH4+
0200400600800
control 1 2 37th Aug 2014 (after 12 days of experiment)
Conc
entr
atio
n [m
g/l]
NO3- NO2- NH4+
0200400600800
Control 1 2 310th Sep 2014 (after 45 days of experiment)
Conc
entr
atio
n [m
g/l]
NO3- NO2- NH4+
sewage
SewageNO3 - - 448 mg/l; NO2 - - 730 mg/l and NH4+ - 260 mg/l
sewage
sewage
without carbon substrate mix straw/lignite
mix straw/lignite
mix straw/lignite
without carbon substrate
without carbon substrate
After 6 days
After 45 days
After 12 days
reduction of NH4+
reduction of NO3- reduction of NO3
- reduction of NO3-
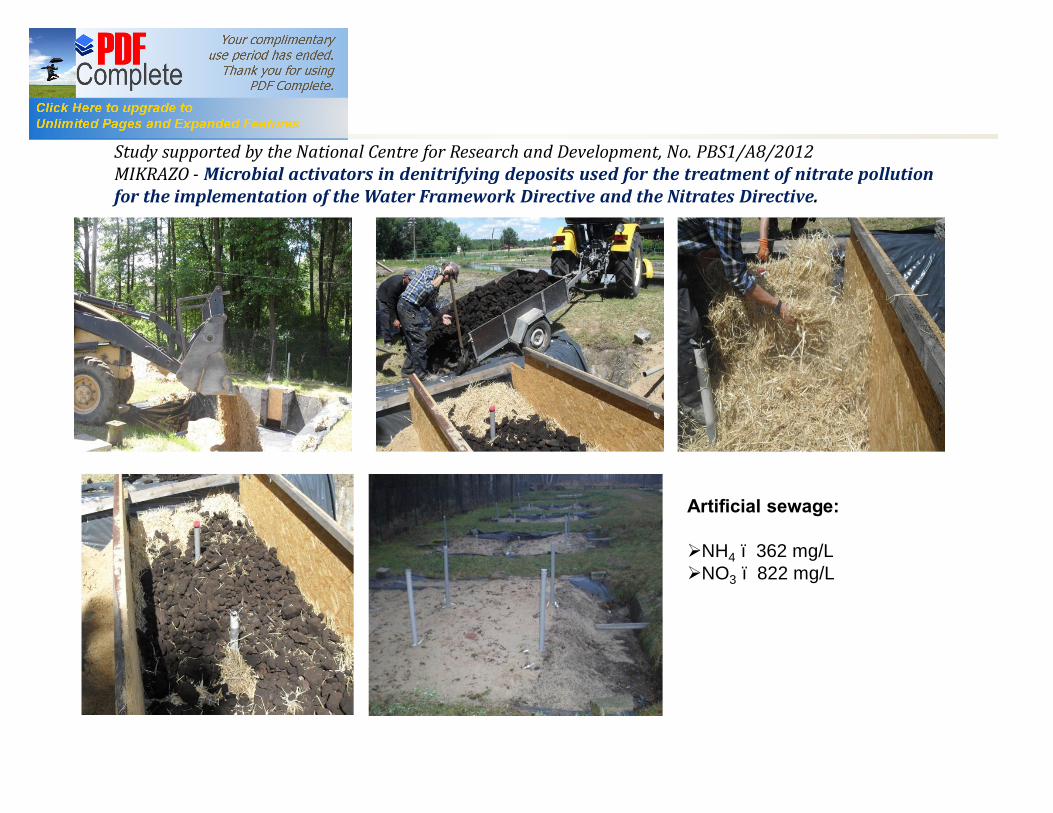
Artificial sewage:
ØNH4 – 362 mg/LØNO3 – 822 mg/L
Study supported by the National Centre for Research and Development, No. PBS1/A8/2012MIKRAZO - Microbial activators in denitrifying deposits used for the treatment of nitrate pollutionfor the implementation of the Water Framework Directive and the Nitrates Directive.
0
100
200
300
400
500
600
średnia z eksperymentów
stęż
enie
azo
tanó
w [m
g N
O3-
/ L]
kontrola
złoże bez bakterii
złoże z bakteriami hodowalnymi
złoże z bakteriami terenowymi
In sewage : 873 mg NO3-/L NO3 concentration
[mg / L]% of reductioncontrola 383without additional pool of bacteria; 111 71%with culturable denitrifying bacteria (CDB); 116 70%mix of environmental bacteria 144 62%
Redukcja azotanów w poszczególnych złożach denitryfikacyjnych(experyment Tresta)
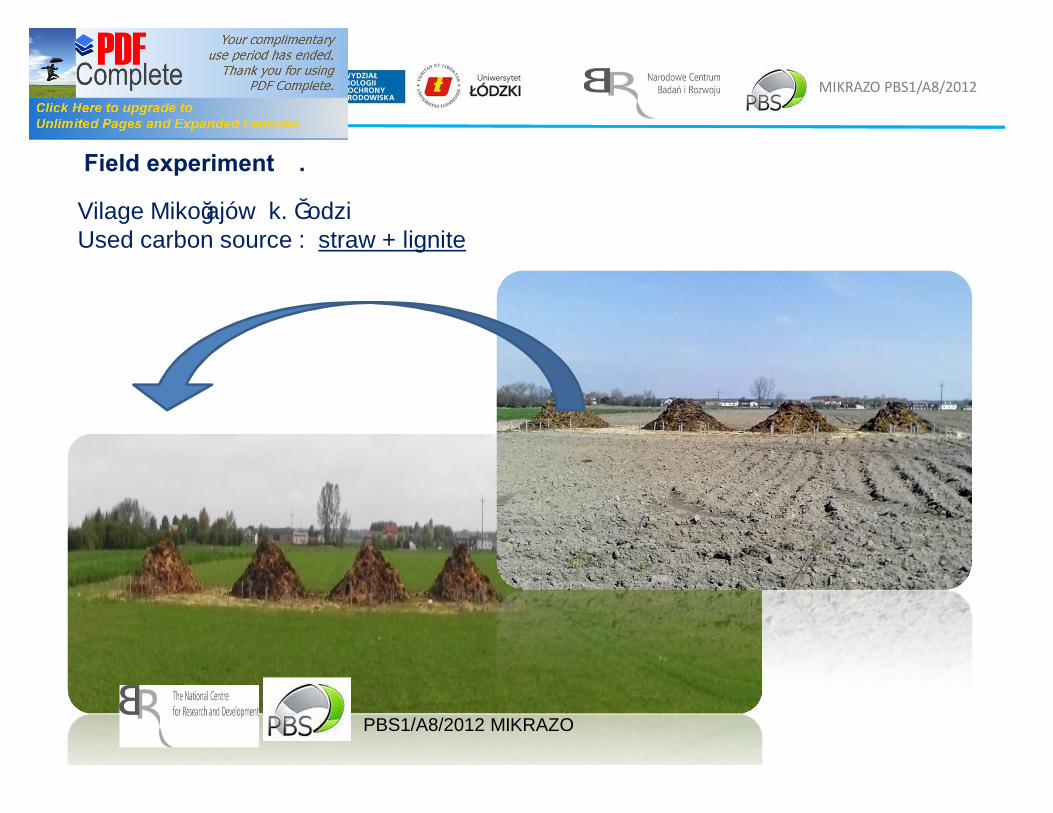
Vilage Mikołajów k. ŁodziUsed carbon source : straw + lignite
MIKRAZO PBS1/A8/2012
Field experiment….
PBS1/A8/2012 MIKRAZO
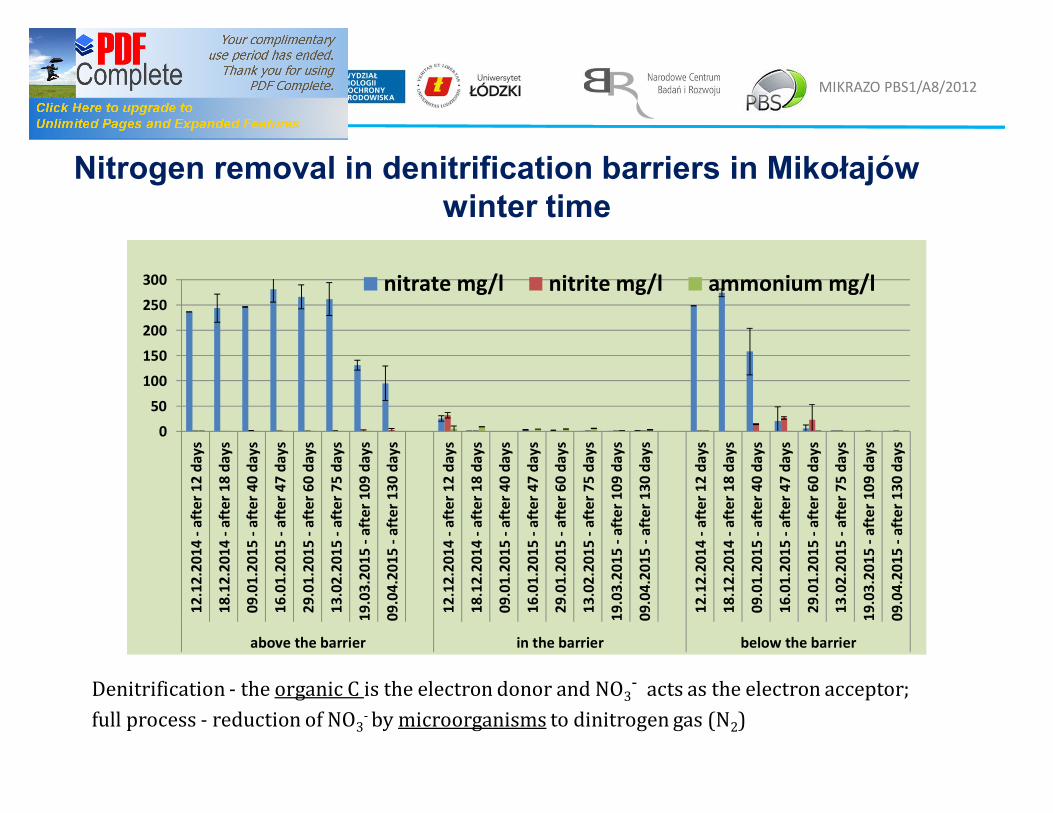
Nitrogen removal in denitrification barriers in Mikołajów winter time
MIKRAZO PBS1/A8/2012
050
100150200
250300
12.1
2.20
14 -
afte
r 12
days
18.1
2.20
14 -
afte
r 18
days
09.0
1.20
15 -
afte
r 40
days
16.0
1.20
15 -
afte
r 47
days
29.0
1.20
15 -
afte
r 60
days
13.0
2.20
15 -
afte
r 75
days
19.0
3.20
15 -
afte
r 109
day
s
09.0
4.20
15 -
afte
r 130
day
s
12.1
2.20
14 -
afte
r 12
days
18.1
2.20
14 -
afte
r 18
days
09.0
1.20
15 -
afte
r 40
days
16.0
1.20
15 -
afte
r 47
days
29.0
1.20
15 -
afte
r 60
days
13.0
2.20
15 -
afte
r 75
days
19.0
3.20
15 -
afte
r 109
day
s
09.0
4.20
15 -
afte
r 130
day
s
12.1
2.20
14 -
afte
r 12
days
18.1
2.20
14 -
afte
r 18
days
09.0
1.20
15 -
afte
r 40
days
16.0
1.20
15 -
afte
r 47
days
29.0
1.20
15 -
afte
r 60
days
13.0
2.20
15 -
afte
r 75
days
19.0
3.20
15 -
afte
r 109
day
s
09.0
4.20
15 -
afte
r 130
day
s
above the barrier in the barrier below the barrier
nitrate mg/l nitrite mg/l ammonium mg/l
Denitrification - the organic C is the electron donor and NO3- acts as the electron acceptor; full process - reduction of NO3- by microorganisms to dinitrogen gas (N2)
MIKRAZO PBS1/A8/2012
0
50
100
150
200
250
300
27.0
4.20
15 -
afte
r 4 d
ays
30.0
4.20
15 -
afte
r 7 d
ays
04.0
5.20
15 -
afte
r 11
days
07.0
5.20
15 -
afte
r 14
days
11.0
5.20
15 -
afte
r 18
days
14.0
5.20
15 -
afte
r 21
days
21.0
5.20
15 -
afte
r 28
days
27.0
4.20
15 -
afte
r 4 d
ays
30.0
4.20
15 -
afte
r 7 d
ays
04.0
5.20
15 -
afte
r 11
days
07.0
5.20
15 -
afte
r 14
days
11.0
5.20
15 -
afte
r 18
days
14.0
5.20
15 -
afte
r 21
days
21.0
5.20
15 -
afte
r 28
days
27.0
4.20
15 -
afte
r 4 d
ays
30.0
4.20
15 -
afte
r 7 d
ays
04.0
5.20
15 -
afte
r 11
days
07.0
5.20
15 -
afte
r 14
days
11.0
5.20
15 -
afte
r 18
days
14.0
5.20
15 -
afte
r 21
days
21.0
5.20
15 -
afte
r 28
days
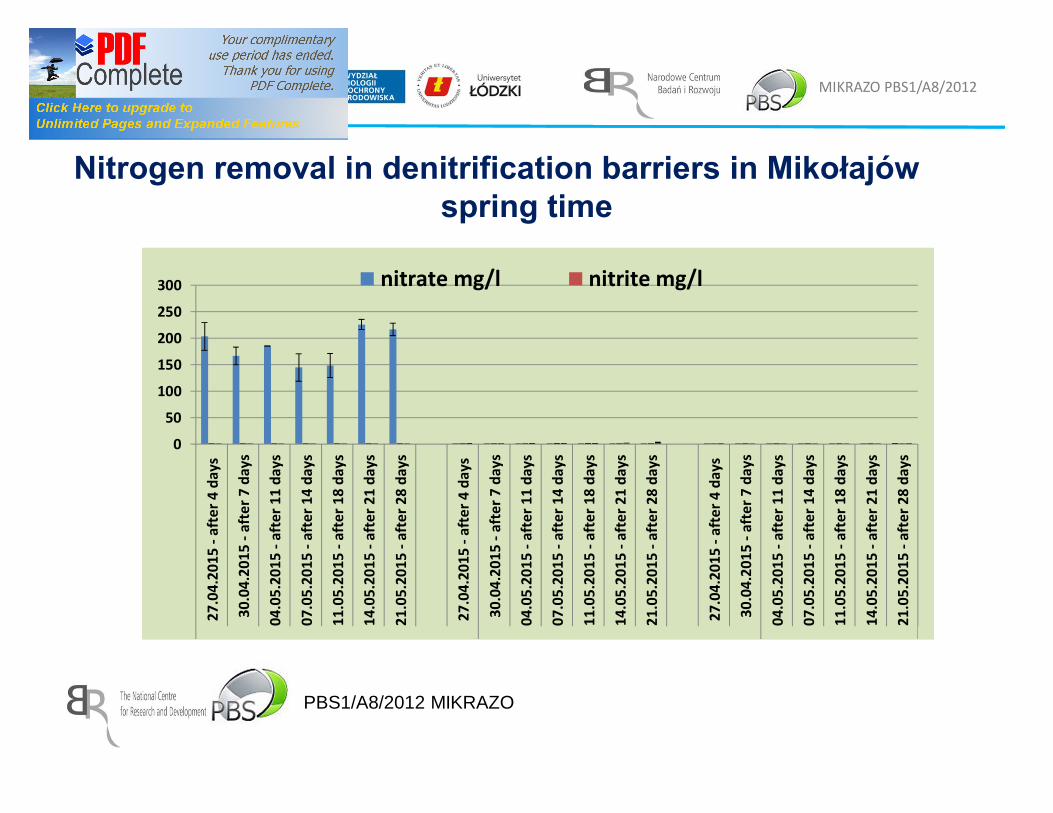
above the barrier in the barrier below the barrier
nitrate mg/l nitrite mg/l
Nitrogen removal in denitrification barriers in Mikołajówspring time
PBS1/A8/2012 MIKRAZO
Mikrobiologiczne aktywatory w złożach denitryfikacyjnych stosowanych do oczyszczania zanieczyszczeń azotanowych dla wdrażania Ramowej Dyrektywy Wodnej i Dyrektywy Azotanowej
PBS1/A8/5/2012
Odciek…. NO3
mg/lNO2
mg/lNH4 mg/l
23.11.2015 30,2 8,2 2401,9
30.11.2015 139,4 11 2432,8
11.12.2015 355,4 2,5 889,3

Mikrobiologiczne aktywatory w złożach denitryfikacyjnych stosowanych do oczyszczania zanieczyszczeń azotanowych dla wdrażania Ramowej Dyrektywy Wodnej i Dyrektywy Azotanowej
PBS1/A8/5/2012
0
500
1000
1500
2000
2500
3000
3500
2015
-11-
2320
15-1
1-23
2015
-11-
2320
15-1
1-23
2015
-11-
23
2015
-11-
3020
15-1
1-30
2015
-11-
30
2015
-12-
1120
15-1
2-11
2015
-12-
1120
15-1
2-11
2015
-12-
11
2015
-12-
2120
15-1
2-21
2015
-12-
2120
15-1
2-21
2015
-12-
21
2016
-01-
1520
16-0
1-15
2016
-01-
1520
16-0
1-15
2016
-01-
15
2016
-01-
2820
16-0
1-28
2016
-01-
2820
16-0
1-28
2016
-01-
28
A1 A2 B1 B2 C2 A2 B2 C2 A1 A2 B1 B2 C2 A1 A2 B1 B2 C2 A1 A2 B1 B2 C2 A1 A2 B1 B2 C2
Azotany [mg/L]
Azotyny [mg/L]
Amonowe [mg/L]
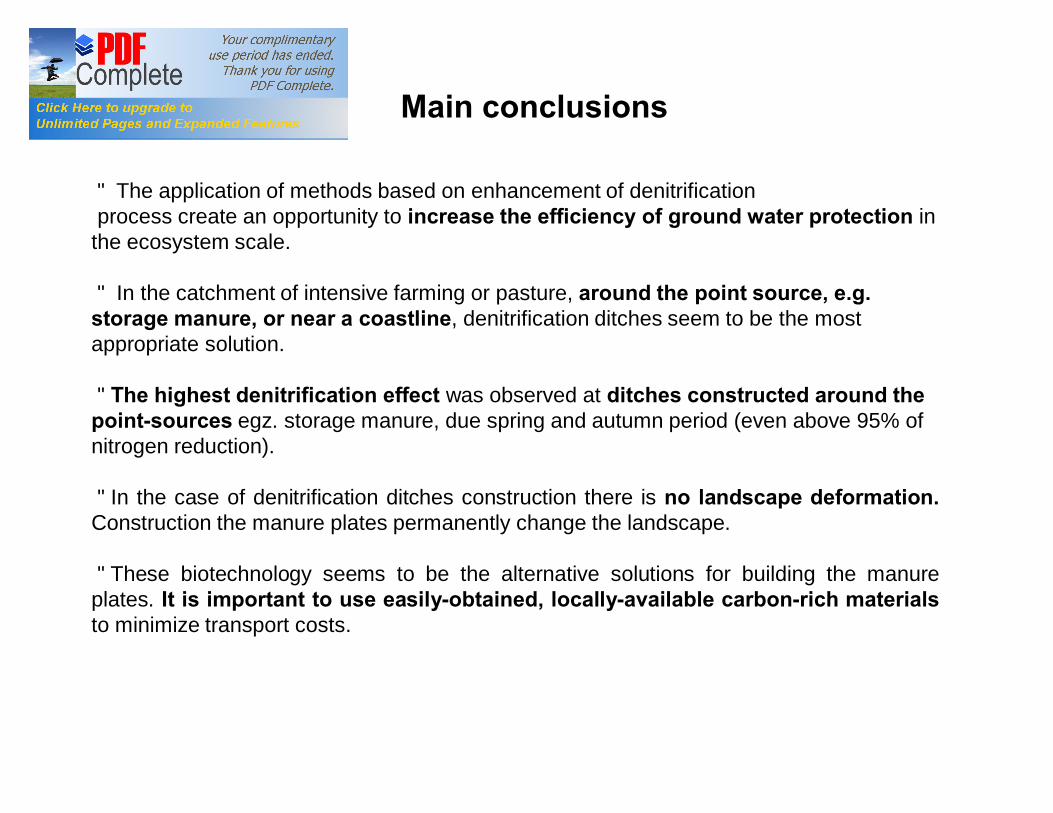
• The application of methods based on enhancement of denitrificationprocess create an opportunity to increase the efficiency of ground water protection in
the ecosystem scale.
• In the catchment of intensive farming or pasture, around the point source, e.g. storage manure, or near a coastline, denitrification ditches seem to be the most appropriate solution.
• The highest denitrification effect was observed at ditches constructed around the point-sources egz. storage manure, due spring and autumn period (even above 95% of nitrogen reduction).
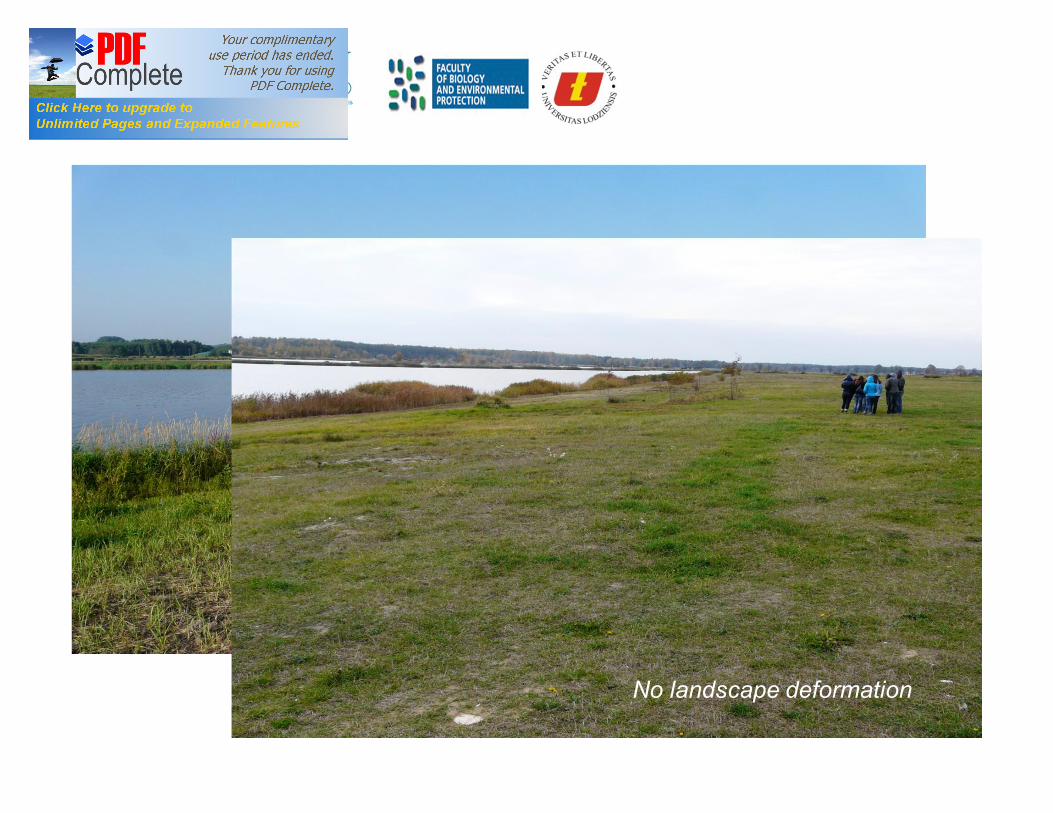
• In the case of denitrification ditches construction there is no landscape deformation.Construction the manure plates permanently change the landscape.
• These biotechnology seems to be the alternative solutions for building the manureplates. It is important to use easily-obtained, locally-available carbon-rich materialsto minimize transport costs.
Main conclusions
Thank you for invitation and hospitality
•Environmental Protection AgencyRepublic of Serbia Ministry of Agriculture and Environmental Protection
• Institute For Nature Conservation of Serbia
•Chamber of Commerce and Industry of Serbia
Study supported by :
N R14 0061 06/ 2009 GEOWŁÓKNA - Development of model geofibrous, biodegradable, biological deposits for recultivation of nitrogen and phosphorus in threatened areas of agricultural landscape
PBS1/A8/2012 MIKRAZO - Microbial activators in denitrifying deposits used for the treatment of nitrate pollution for the implementation of the Water Framework Directive and the Nitrates Directive
LIFE08 ENV /PL/000519EKOROB: Ecotones for the reduction of diffuse pollution
Thank you for your attention !
PBS1/A8/2012 MIKRAZO
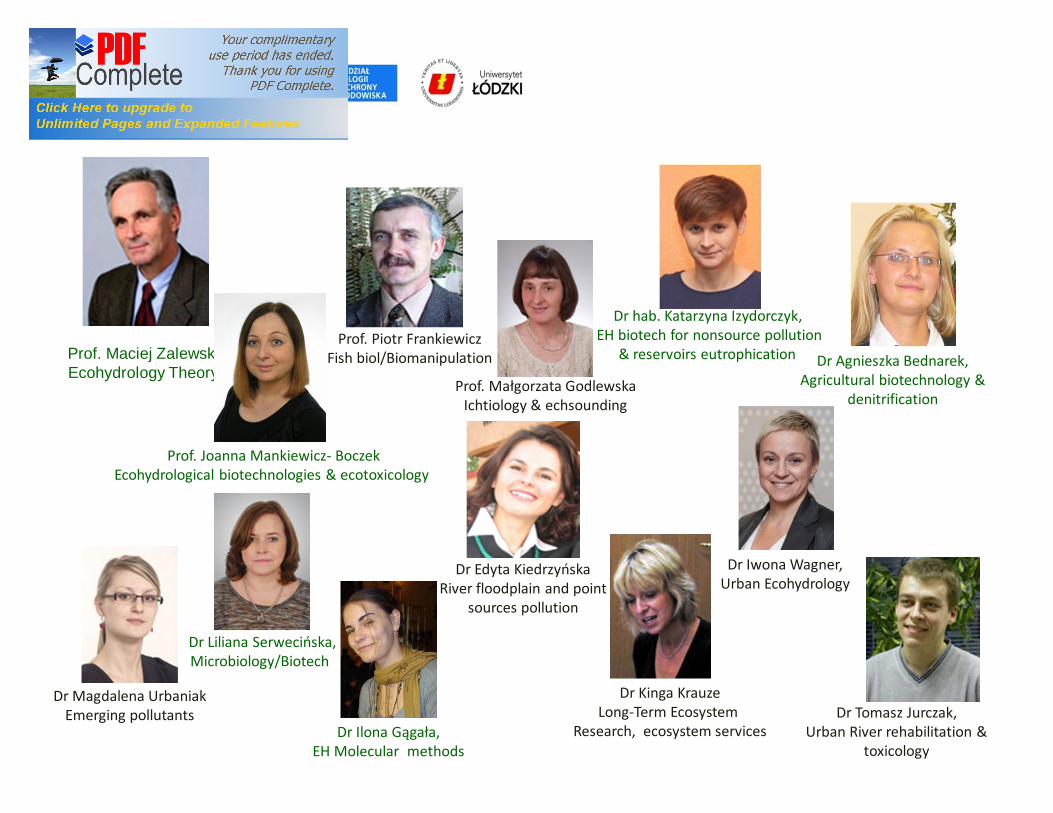
Dr Kinga KrauzeLong-Term Ecosystem
Research, ecosystem services
Prof. Joanna Mankiewicz- BoczekEcohydrological biotechnologies & ecotoxicology
Dr hab. Katarzyna Izydorczyk, EH biotech for nonsource pollution
& reservoirs eutrophication
Dr Magdalena UrbaniakEmerging pollutants
Dr Ilona Gągała,EH Molecular methods
Prof. Małgorzata GodlewskaIchtiology & echsounding
Prof. Maciej ZalewskiEcohydrology Theory
Prof. Piotr FrankiewiczFish biol/Biomanipulation
Dr Tomasz Jurczak, Urban River rehabilitation &
toxicology
Dr Liliana Serwecińska,Microbiology/Biotech
Dr Iwona Wagner,Urban Ecohydrology
Dr Agnieszka Bednarek, Agricultural biotechnology &
denitrification
Dr Edyta KiedrzyńskaRiver floodplain and point
sources pollution