den networks ltd investor · pdf fileinvestor presentation ... lco engagement den operating...
TRANSCRIPT

Investor PresentationFinancial Year 2014 -15
DEN Networks Ltd
May 12, 2015
1

2
…Invested in Growth Opportunities…
Post completion of Phase I & II, the internal accruals and Cash is being ...
CableBroadbandTV Com
merce
Soccer
...emerging out of Phase III & IV and
overlaying connectivity of broadband

Group Highlights 2015
Subscription Revenues increased 25%
Steady improvement seen in collections
9 DAS Cities generating Net Realization Per Box of more than ₹80 in Q4 FY’15 vs 3 cities a year ago
Content cost increased 25% (in line with previous guidance); Carriage Maintained
Encouraging Early Indicators
— 3.3 Lakh Homes Passed
— 23k Subscribers
60% Demo Installations converted into Sales
40% subscriptions generated from non-DEN homes
₹759 ARPU for FY’15
Clocking Annualised GMV of ₹117 Crore (based on Mar’15
GMV Booked)
~30% Conversion ratio (of total calls received in FY’15)
Minimal Investment
3

Group Key Performance Indicators
6
7
Digital Subscribers (Million)
FY'14
FY'15
FY’15 Additions+1Mn +33% +0.3Mn +19k
Cable Segment Broadband Segment
₹ 58
₹ 77
Blended DAS 1and 2 Subscription
Revenue Per Box
-
0.33
Homes Passed (Million)
4
23
Subscribers ('000s)*
*DEN Billing Less Applicable Taxes 4

Group 2015 Financial Highlights
Numbers in Brackets represent FY’14
₹1,130Cr
(₹ 1,117 Cr)
Revenues
₹92Cr
(₹ 302 Cr)
EBITDA
₹28Cr
(₹ 148 Cr)
EBITDA (Excluding
Activation)
Numbers in Brackets represent FY’14
₹934Cr
(₹ 1,216 Cr)
Cash and Equivalents
₹42Cr
(₹ 185 Cr)
Cash PAT
₹366Cr
(₹ 726 Cr)
Net Current Assets
5
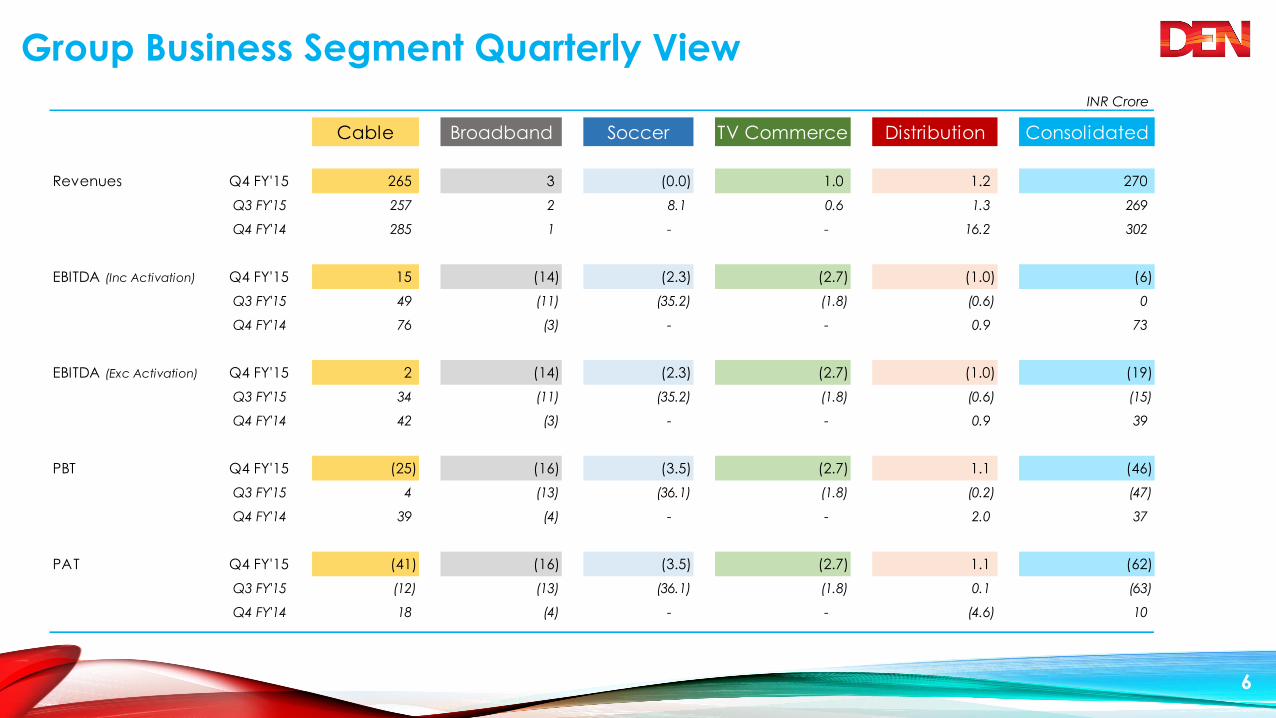
Group Business Segment Quarterly View
INR Crore
Cable Broadband Soccer TV Commerce Distribution Consolidated
Revenues Q4 FY'15 265 3 (0.0) 1.0 1.2 270
Q3 FY'15 257 2 8.1 0.6 1.3 269
Q4 FY'14 285 1 - - 16.2 302
EBITDA (Inc Activation) Q4 FY'15 15 (14) (2.3) (2.7) (1.0) (6)
Q3 FY'15 49 (11) (35.2) (1.8) (0.6) 0
Q4 FY'14 76 (3) - - 0.9 73
EBITDA (Exc Activation) Q4 FY'15 2 (14) (2.3) (2.7) (1.0) (19)
Q3 FY'15 34 (11) (35.2) (1.8) (0.6) (15)
Q4 FY'14 42 (3) - - 0.9 39
PBT Q4 FY'15 (25) (16) (3.5) (2.7) 1.1 (46)
Q3 FY'15 4 (13) (36.1) (1.8) (0.2) (47)
Q4 FY'14 39 (4) - - 2.0 37
PAT Q4 FY'15 (41) (16) (3.5) (2.7) 1.1 (62)
Q3 FY'15 (12) (13) (36.1) (1.8) 0.1 (63)
Q4 FY'14 18 (4) - - (4.6) 10
6

Group Business Segment Yearly View
INR Crore
Cable Broadband Soccer TV Commerce Distribution Consolidated
India’s Largest
Cable TV MSO
True High Speed
Internet
Owners of Delhi
Dynamos FC50-50 JV with Snapdeal Star Den^
13 Million
Subscribers
0.3 Million Homes
Passed
Transforming DEN
into a B2C play
A 24 hour home
shopping channel Right to Distribute
TV Channels
Revenues FY'15 1,093 8 8 2 19 1,130
FY'14 1,055 4 - - 57 1,116
EBITDA FY'15 187 (44) (46) (5) 0.2 92
FY'14 301 (7) - - 8.0 302
EBITDA (Exc Activation) FY'15 122 (44) (46) (5) 0.2 28
FY'14 147 (7) - - 8 148
PBT FY'15 10 (49) (48) (5) 4 (88)
FY'14 121 (7) - - 10 124
PAT FY'15 (46) (49) (48) (5) 3 (144)
FY'14 46 (7) - - (1) 38
Business Discontinuted in FY'15
Overv iewOne Stop Home
Entertainment
7

Consolidated Income Statement
INR Crore
Q4 FY'15 Q3 FY'15 Q4 FY'14 FY'15 FY'14
Revenues from Operational Activities 262 264 297 1,113 1,098
Other Operating Income 9 5 5 17 19
Total Revenues 270 269 302 1,130 1,117
Content Costs 139 110 101 465 372
Personnel Costs 30 26 26 111 106
Provison for Bad Debts 4 13 11 48 57
Other SG&A 103 119 90 414 280
EBITDA -6 0 73 92 302
Operating Margin – EBITDA% -2% 0% 24% 8% 27%
Other Income 23 24 24 88 58
Dep & Amort 47 48 41 186 147
Finance Costs 16 23 19 82 89
Profit Before Tax (47) (48) 37 (88) 124
Provisions for Tax 14 8 21 34 38
Minority Interest 1 7 5 22 37
Impairments / Loss on sale of investments - - 2 - 11
Net Income (62) (63) 10 (144) 38
8

Cash and Equivalents Movement in FY’15 (INR Cr)
Well Funded Balance Sheet
934 74
304 27 11
1,216 133
FY'14 Oper. Cash Profit Taxes Capex Debt Others FY'15
Cash and Equivalents FY’15 Breakup (INR Cr)
₹ 693
74%
₹ 145
16%
₹ 96
10% FD
MFs
Bank
9
Gross Debt (INR Crore)
998
292
1,025
266
FY'14 Raised Repaid FY'15
2015 Debt Breakup (INR Cr)
₹ 399
40%
₹ 158
16%₹ 365
37%
₹ 24
2%
₹ 49
5%
Term Loan
Finance Lease
Buyers Credit
Unsecured Loans

13m 54% ₹1,093Cr 42% ₹187Cr ₹122Cr
Subscribers Digital Customers Revenues Gross Margin EBITDA EBITDA Ex Activation
(47%) (₹1,055Cr) (50%) (₹301Cr) (₹147Cr)
Cable 2015 Highlights
10

Cable Subscribers – 13M
Total Digital Subscribers (Million)
6.10
6.40
6.64
6.84
7.03
Q4 FY'14 Q1 FY'15 Q2 FY'15 Q3 FY'15 Q4 FY'15
DAS 1and 2 Markets (Million STBs)
1.99 1.99 2.09 2.09 2.10
2.65 2.78 2.78 2.81 2.84
Q4 FY'14 Q1 FY'15 Q2 FY'15 Q3 FY'15 Q4 FY'15
Phase 1 Phase 2
DAS 3 Markets - Analog (Million STBs)
1.46 1.63
1.77 1.94
2.09
Q4 FY'14 Q1 FY'15 Q2 FY'15 Q3 FY'15 Q4 FY'15
47% 54%
Digital Subscribers % in Total Subscriber Base
24% 25%
DEN Market Share* in DAS 1 & 2 Markets Phase 3 & 4 expected to implement by end of
2015 and 2016 respectively providing a huge opportunity to increase the digital subscriber base where DEN has ~6 Million subscribers
4.6 4.8 4.9 4.9 4.9
* Market Share based on MPA Estimates (MPA 2014)
11

Cable Revenues
*Adjusted for LCO Share (FY’15 : INR 63 Cr, FY’14 INR: 35 Cr)
45%
46%
6% 3%
Subscription Placement
Activation Others
₹ 368
₹ 459
FY'14 FY'15
₹ 465₹ 474
FY'14 FY'15
₹ 155
₹ 64
FY'14 FY'15
Higher in the earlier period because of
Phase 2 Implementation
Revenue By Stream* (INR Cr) Subscription Revenues* (INR Cr) Placement Revenues (INR Cr) Activation Revenues (INR Cr)
+25%
12

Revenue Per Box Across DAS Markets – Steady Progress
(Number of Cities)
3 3
5
16
11
1
87
>80 65-80 50-65 <50
Q4 FY'14 Q4 FY'15
41%
4%
29%
26%
>80 65-80 50-65 <50
*DEN Billing Less Applicable Taxes 13
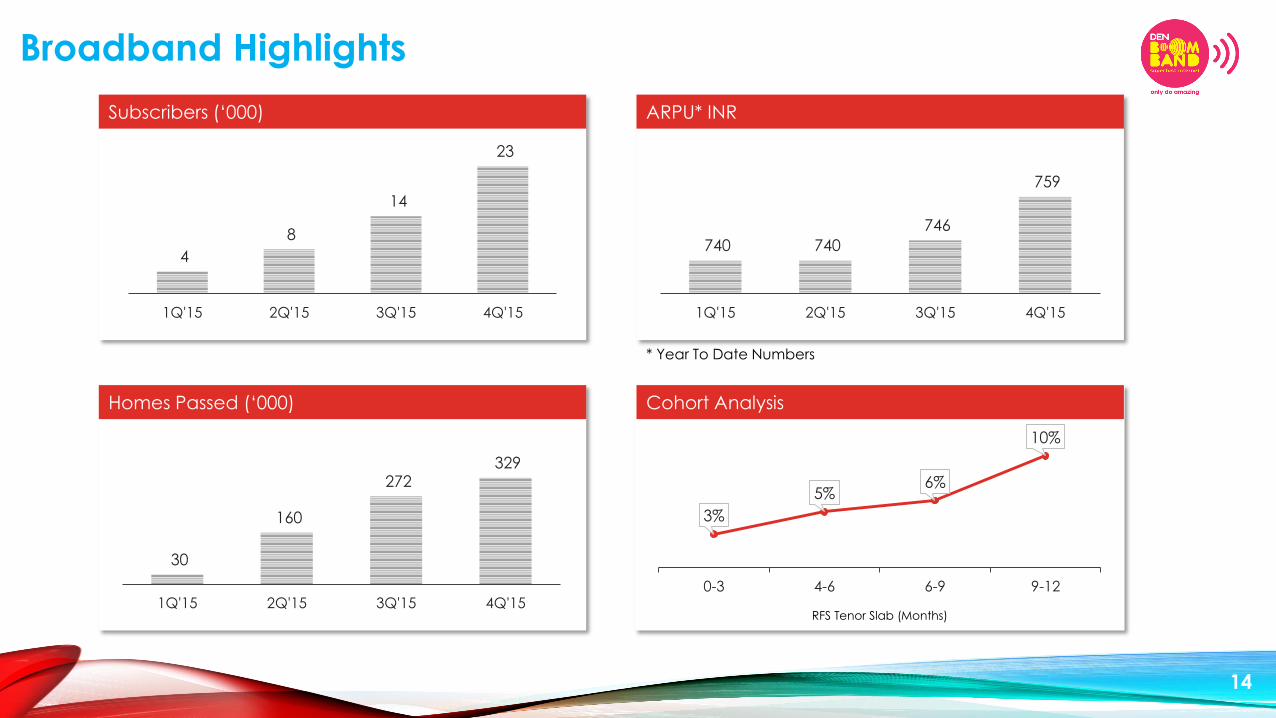
Broadband Highlights
4
8
14
23
1Q'15 2Q'15 3Q'15 4Q'15
Subscribers (‘000)
* Year To Date Numbers
740 740
746
759
1Q'15 2Q'15 3Q'15 4Q'15
ARPU* INR
3%
5%6%
10%
0%
2%
4%
6%
8%
10%
12%
0-3 4-6 6-9 9-12
Cohort Analysis
RFS Tenor Slab (Months)
30
160
272 329
1Q'15 2Q'15 3Q'15 4Q'15
Homes Passed (‘000)
14

Annualised GMV on Current Rate
₹117Cr
Reach (Million Homes)
25mn
Average Daily
Transactions (Mar’15)
1,312Conversion Ratio of Calls Received
30%
Repeat
Customers
17%
TV Commerce Key Takeaways
15

Road Ahead - Value Drivers
Improve monetisation in DAS I and II markets - Pricing, Packaging, HD, Pre-paid
Broadband execution – Multi channel sales, roll-out factory
Box seeding - phase III and IV markets
TV shop – increase the reach
IR – improve understanding & confidence
Road Ahead – Value Drivers
16
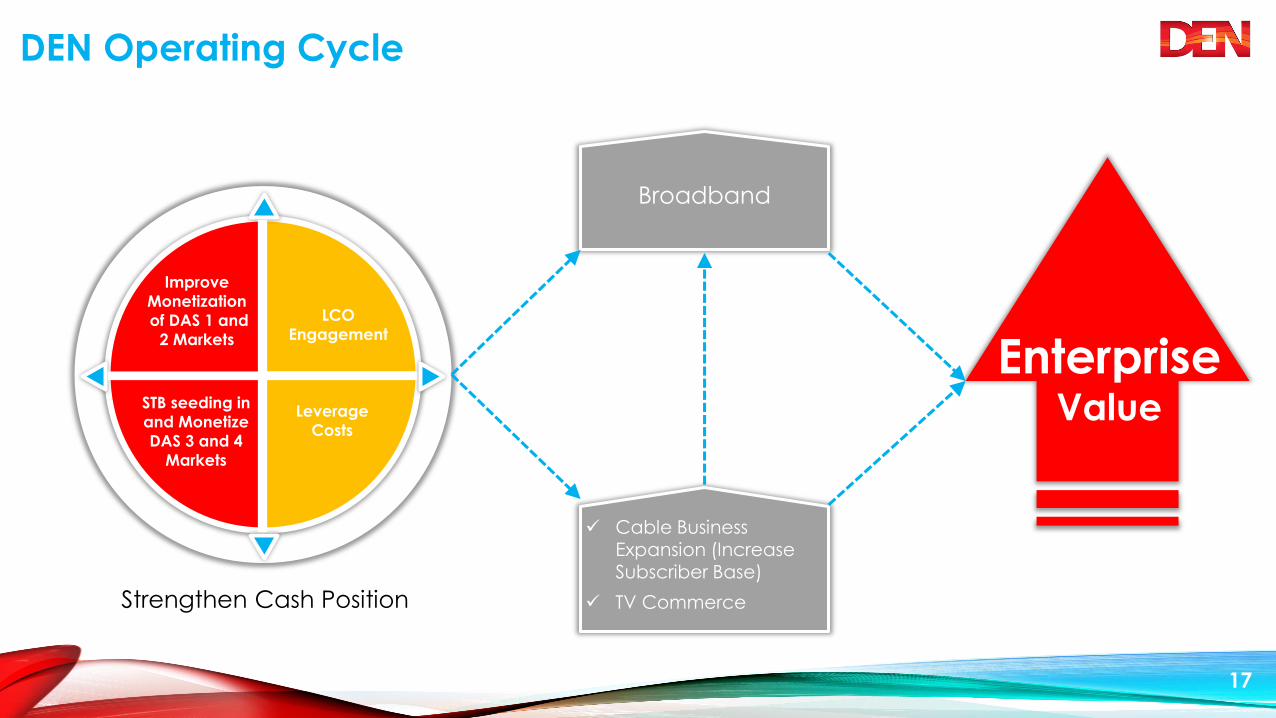
Cable Business Expansion (Increase Subscriber Base)
TV Commerce
Improve
Monetization
of DAS 1 and
2 Markets
Strengthen Cash Position
Broadband
EnterpriseValueSTB seeding in
and Monetize
DAS 3 and 4
Markets
Leverage
Costs
LCO
Engagement
DEN Operating Cycle
17

Jatin Mahajan
+91 11 4052 2200
DEN Networks Ltd.
(CIN No. L92490DL2007PLC165673)
Shogun Jain / Payal Dave
[email protected] / [email protected]
+91 77 3837 7756 / +91 98 1991 6314
Strategic Growth Advisors Pvt. Ltd.
(CIN No. U74140MH2010PTC204285)
For Further Information Please Contact