demystifying growth and development in north song … · demystifying growth and development in...
TRANSCRIPT

1
Working Papers No. 178/13
Demystifying growth and development in North
Song China, 960–1127
Kent G. Deng
© Kent G. Deng June 2013

2
Department of Economic History London School of Economics Houghton Street London, WC2A 2AE Tel: +44 (0) 20 7955 7860 Fax: +44 (0) 20 7955 7730

3
Demystifying growth and development in North Song
China, 960–1127
Kent G. Deng1
ABSTRACT
The Northern Song Period (960–1127) has been recognised as one of the most important eras in China’s economic and demographic history. This study investigates climatic and geopolitical conditions and factors that led to economic restructuring whereby intensive growth took place to generate more wealth to support a growing population. This paper reveals the unique nature and mechanisms behind the Song remarkable economic growth with quantitative evidence.
1 I wish to thank Dr. Lucy Zheng who has helped with the quantitative part of this paper. My deep indebtedness goes to Professors Eric L. Jones, Patrick O’Brien, Stephen Broadberry, Janet Hunter, Mark Elvin, Bruce Campbell and Bozhong Li, who commented and advised on various drafts over the last three years.

4
The mainstream scholarship on Song China has regarded the Northern Song (960–1127) as a period of ‘economic revolution’ with which China demonstrated a clear tendency towards intensive growth.2 Other opinions account for a small minority.3 There has been a range of influential works in Western literature by Robert Hartwell,4 Shiba Yoshinobu,5 Mark Elvin, Joel Mokyr and Kenneth Pomeranz.6 Eric Jones thus argued that Song China was the first credible candidate for a genuine industrial revolution centuries before any other civilisation.7 His provoking question ‘why China was unable to repeat its Song success’ has formulated an intriguing paradox.
Amongst Chinese academics, however, the Northern Song Period has not been celebrated quite the same way. In the Chinese collective memory, the Northern Song Period was marred by administrative weakness and military incompetence that led to repeated defeats with two emperors captured as prisoners of war and annual ransoms payable to nomads (Huizong, r. 1100–25; Qinzong, r. 1125–7), and then alien conquests of China. Even so, there has been a strong undercurrent in China to re-assess the Song economic performance.8 But the Song paradox of advanced industry and commerce coinciding with pathetic national defence has never failed to provoke debate.9
2 On the Song industrial sector, see Hartwell, ‘Iron and Coal Industries’, ‘Economic Change’, Iron and Early Industrialism and ‘Markets, Technology, and the Structure of Enterprise’. More recently, Wagner, ‘Administration of the Iron Industry’. On Song commerce, see Shiba, Commerce and Society; Elvin, Pattern of the Chinese Past, Pt. 2. On Song technology, see Needham, Science and Civilisation; Deng, Chinese Maritime Activities and Socioeconomic Development; Mokyr, Lever of Riches, ch. 8; Von Glahn, Fountain of Fortune; Twitchett and Smith, Cambridge History of China, vol. 5, Part One; Qi, Songdai Jingjishi, vol. 2, chs 13, 18, 19, 28. 3 Some have questioned the existence of the Song growth; see e.g. Landes, Wealth and Poverty, ch. 21. 4 Hartwell, ‘Iron and Coal Industries’, ‘Economic Change’, Iron and Early Industrialism and ‘Markets, Technology, and the Structure of Enterprise’. Noted here, most estimates have been based on 5.7 million piculs of iron (or 3,400 metric tons) received by the Song state in 1078; see Xu, Song Huiyao Jigao, ‘Shihou 33/3–4, 33/27–9’. Hartwell’s estimate of the Song annual iron output (114,000 metric tones) has not been short of debate; see e.g. Wagner ‘Administration of the Iron Industry’, p. 176 and his Science and civilisation in China, p. 300; Qi, Songdai Jingjishi, vol. 2, pp. 559–61; Liu, ‘Songdaide Tieqian Yu Tie Chanliang’; Wang, Songdai Kuangye Yanjiu, pp. 159–74; Yoshida, Chugoku Kagaku Gijutsu Shi Ronshu, pp. 364–6. General speaking, Hartwell and Wagner operate on the supply side of the industry; Qi, Liu and Wang on the demand side. In his most recent re-assessment, Wagner concluded that Hartwell’s figures were ‘of the right general order of magnitude’; see his Science and civilisation in China, p. 280. Others believe that Hartwell overestimated the Song capacity. Liu’s estimate is 10,000 metric tonnes; Qi-Wang’s, about 70,000; Yoshida, somewhere in between. 5 Shiba, Commerce and Society. 6 Elvin called it ‘the Medieval Revolution’; see his Pattern of the Chinese Past, Pt. 2; Mokyr, Lever of Riches; Pomeranz, Great Divergence. 7 Jones, European Miracle, p. 160; Jones, Growth Recurring, ch. 4; Jones, ‘Real Question about China’. Also, Hobson, Eastern Origins of Western Civilisation, chs 1–4, 9. 8 E.g. Yuan, ‘Local Government Schools’; Shi, Beisong Shiqi Ziran Zaihai Yu Zhengfu Guanli Tixi Yanjiu; Qi, Songdai Jingjishi; Wu, Songdai Jingjishi Yanjiu; Liu, Songjin Zhibishi; Cheng, Songdai Wujia Yanjiu; Gao, Songdai Huobi Yu Houbi Liutong Yanjiu. For a comprehensive review, see Zhu and Cheng, Songshi Yanjiu. Also, see Songshi Yanjiu Ji, a long-lasting research series published in Taiwan from 1958 to 1984 which contains short essays on all aspects of Song history. 9 Many civilisations were defeated by nomads from the Steppes around this time, China was no exception. But, Song China had serious internal defects. The Northern Song was established through a military coup d'état by Zhao Kuangyin (927–76) who later became paranoid about coup against himself.
5
Nevertheless, one view shared by both Western and Chinese literatures is that the Northern Song Period was marked by its rapid population growth.10 The main evidence comes from officially registered household numbers, which grew from 6.2 million households in 980 AD to 17.5 million households by 1101 AD, an increase of 280 per cent.11 This was monitored by regular surveys (with 1–3 year intervals), including dingzhang (male poll), dingchan bu (household asset assessment), shui zhang (household tax accounts), xiaqiu shui zhang (two seasonal tax accounts), and baojia bu (neighbourhood watch enrolment).12 During the previous Tang Period (618–907), nation-wide surveys were only conducted four times in total.13 This made the Song Period information-richer than any of its predecessors.
But so far, the actual population number of the Song (in persons) has remained unknown. Of 45 available observations from 960 to 1127, kou or dingkuo (meaning ‘male persons’ and ‘male poll-taxpayers’) varied from 1.42 to 2.57 per household, averaging 2.11.14 This male bias in population registration was deliberate. It all began in 963 when the newly crowned Emperor Taizhu (r. 960–76) decided to exclude the entire female population from the government taxation registrations.15 One therefore should not take these numbers as the actual sizes of Song households simply because such small family sizes would have made Song population unsustainable.
Sporadically, local family sizes were unveiled under certain extraordinary circumstances such as during famine when every soul was counted. Of over 400,000 locally registered relief beneficiary households, the average household had 5.3–5.5 persons.16 Or, one can use the Tang demography as a proxy, since the Tang Marriage Law was followed,17 and the geographic concentration of population remained more or less unchanged.18 However, scholars still have
He implemented a cluster of measures to separate military commanders from their troops and hence undermined the strength of the Song national defence which cancelled the Song advantages in military technology (including the world’s first compass and fire arms); see Deng, Chinese Premodern Economy, ch. 6. The system backfired after military leaders lost interest in the quality of troops. Army recruits were made of the ‘undesirable and untrustworthy’, i.e. beggars, ruffians, riffraff and bandits. Discipline was gone and mutinies were common; see Luo, Songshi Pieshi, pp. 3–58. As a result, of the 81 military clashes with the Khitans, the Songs triumphed only once; see Hua, Songshi Luji, p. 142. A lousy military was undoubtedly an Achilles’ heel of the Song Empire. 10 For Western works, see e.g. Durand, ‘Population Statistics of China, A.D. 2–1953’, pp. 227–8; Chao, Man and Land in Chinese History; Deng, “Unveiling China’s True Population Statistics”. 11 Liang, Zhongguo Lidai Huko Tiandi Tianfu Tongji, p. 164; Wu, Zhongguo Renkoushi, pp. 122–35. 12 Liang, Nansongde Nongcun Jingji, p. 54; Wu, Zhongguo Jingjishi Ruogan Wentide Jiliang Yanjiu, pp. 229–30; Wu, Zhongguo Renkoshi, pp. 59–62. 13 Liang, Zhongguo Lidai Huko Tiandi Tianfu Tongji, pp. 78–114. 14 Ibid., pp. 122–4. Similarly, see He, Songdai Xiaofei Shi, p. 308, where the average household size ‘declined’ from 2.2 to 1.7 persons. For the on-going debate, see Zhu and Cheng, Songshi Yanjiu, pp. 248–56. 15 The emperor instruction reads: ‘Local governments report the number of men from Age 20 until Age 60; women are excluded’, cited in Wu, Zhongguo Jingjishi Ruogan Wentide Jiliang Yanjiu, p. 255; see also Wu, Zhongguo Renkoshi, pp. 66–7. 16 Wu, Zhongguo Renkoushi, pp. 156, 159. 17 The legal ages for marriages were 15 for males and 13 for females during the Tang and the Northern Song; see Jiang, Renkou Yu Lishi, p. 272. 18 Population Census Office and the Institute of Geography, Population Atlas, pp. 70–1.
6
no agreed size for Song households.19 The variation may in fact reflect the Song regional demographic differences.20 To avoid further controversy, the current study sticks to the official household numbers instead of making yet another set of population estimates (see Table 1).21
Given that difference in growth rates between households and male poll-taxpayers is negligible. For the purpose of this research, one per cent a year can be taken as a proxy for the population growth per se. An independent check is available to support this growth rate. According to the government record, from 995 to 1078 the Songs total marketed salt increase from 373,545 xiaoxi (small units) to 739,620 daxi (large units), or from 43.5 million to 103.5 million catties, with an annual growth rate of one per cent.22 Salt consumption is both price and income inelastic. It is a reliable barometer for population growth.
The question is what made a persistent increase in the Song population possible. One popular explanation is that the Song population grew on a cheaper food source known as the ‘Champa Rice Hypothesis’. It asserts that a new rice species introduced from outside teleologically multiplied China’s food stock on the one hand, and population, and industry and commerce on the other.23 This is commonly associated with the ‘surplus-pulled’ model. The problem with this cheap food hypothesis is why a windfall of cheap food did so little for China’s industry and commerce during the Ming-Qing Period later. Historically, more food often meant more pleasure instead of more work in industry. Also due to the price and income inelasticity in food consumption, more food does not create more market value or greater capital accumulation and capital formation. Quite the opposite: cheap food always harms farmers. Historically, therefore, a low market price itself was always sufficient to discourage excessive supply of food to last for too long. So, the ‘Champa Rice Hypothesis’ is self-defeating.
There is also a ‘subsistence-pushed’ model which operates differently: when per capita farmland shrinks too much to live on home-grown staple food, producers are forced to produce non-staple products in order to sell them in exchange for food to consume, often at the subsistence level. In doing so, population may still increase but per capita income often does not, called ‘rural involution’.24 In this context, much of the growth was fuelled by Chayanovian ‘labour self-exploitation’ within a frozen production possibility frontier.25 To satisfy this ‘subsistence-pushed’ model however, the supply of arable land must be inelastic. This seems to be the case in later Qing but not during the Northern Song. If land supply was elastic, as in
19 The highest estimate is 7.5 people; the lowest, 5.0; the medium, 5.4–6.0. For a high estimate see Li, ‘Songmo Zhi Mingchu Jiangnan Nongmin Jingyingde Bianhua’, p. 33. For a low one, see Wu, Zhongguo Renkoushi, p. 580; Jiang, Population and History, p. 60; Duan, Historical Demography, p. 335. For the medium range; see Ge, Zhongguo Renkou Fazhanshi, p. 308; Wu, Zhongguo Jingjishi Ruogan Wentide Jiliang Yanjiu, pp. 253–63; Ma, ‘Family Size’. 20 Wang, Jindai Zhongguo Wujia, Gongzi He Shenghuo Shuiping Yanjiu, pp. 174–8. 21 We are fully aware of the story of lazy county magistrates forging local records in the late Qing; see Skinner, “Sichuan’s Population in the Nineteenth Century”. So far, there has been no similar complaint against the Song administration. The ‘Skinnerian data problem’ may have not been widespread during the Northern Song. 22 Tuo, Song Shi, vol. 181, ‘Shihuozhi 134’. Note: xiaoxi = 116.5 catties; daxi = 140 catties. 23 Ho, ‘Early-Ripening Rice’, p. 212. 24 For Ming-Qing North China, see Huang, Peasant Economy and Social Change in North China. For medieval England, see Campbell, ‘Agrarian Problem in the Early Fourteen Century’. 25 Chayanov, Theory of Peasant Economy.

7
China from 1000 throughout 1750, home-grown food was able to feed the family; then, the majority farmers did not need to trade for food.
Among Song scholars, opinions have been divided. Followers of the ‘surplus-pulled’ hypothesis include Qi Xia who develops a long list of advancements in Song agriculture for cheap food.26 Among the sceptics like Li Bozhong and Zeng Xiongsheng doubts are raised about a food windfall.27 They tend to favour a subsistence-pushed explanation.
An alternative model is ‘diversified income’, meaning that there are opportunities to earn more income differently, something close to Arthur Lewis’ dualism with which a higher income option available ex ante persuades people to change jobs across sectors voluntarily without the pain of the Enclosure Movement or class struggle.28 It fits well with “Say’s Law” of products being paid for by each other, and the market always clearing itself, an idea that has inspired many great works on modern growth.29 Then, more incomes lead to a growth in population in a virtuous spiral. To achieve that, the economy needs to have a structure that is different from a traditional farming society. This study argues that during the Northern Song China was such an economy where economic restructuring occurred, offering diversified opportunities to make a living outside the farming sector. Diverse incomes in turn supported an increase in population. This paper has thus three objectives: first, to investigate the causes and mechanisms of the economic restructuring and development during the Northern Song; second, to measure the impact of such development on population growth; and third, to provide systematic empirical evidence generated from quantitative modelling.
This paper is organised as follows: in the wake of this current introduction section, Section I discusses historical information available in general. Section II analyses the causes and mechanisms of the economic restructuring and development during the Northern Song Period. Section III discusses data and variables, constructs a quantitative model for empirical analysis, and discusses the findings. Section IV draws the final conclusion.
I
Granted, all the data from historical sources are far from fool-proof due to human errors and the rep-tape. But modern estimates and ‘guesstimates’ are not fool-proof, either. The former deserve the benefit of the doubt, to say the least. Information-wise, this study thus depends on available Song official and private sources. Official sources available are predominantly Song Shi (History of the Song Dynasty) and Song Huiyao Jigao (Edited Administrative Statutes of the Song Dynasty). Modern compilations of historical accounts such as Zhongguo Lidai Huko Tiandi Tianfu Tongji (Dynastic Data for China’s Households, Cultivated Land and Land Taxation) serve as a back-up since they include information extracted from other works such as state crafts like Xu Zizhi Tongjian Changbian (Enlarged Comprehensive
26 See Qi, Songdai Jingjishi, vol. 1, chs 1–3. 27 Li, Xuanjing, Jicui Yu Songdai Jiangnan Nongye Geming’; Zeng, ‘Songdaide Shuangji Dao’. 28 Lewis, ‘Economic Development with Unlimited Supplies of Labour’. 29 E.g. Braudel, Wheels of Commerce.

8
References for State Management) and Wenxian Tongkao (Comprehensive Study of Historical Records). Private accounts are also consulted such as Qimin Yaoshu (Essential Techniques for the Peasantry), Chenfu Nongshu (Chen Fu’s Treatise on Agriculture), Mengxi Bitan (Notes of Dreams), and Song poems. These private sources are often pivotal for revealing farmland yield level, household commercial activities, and household consumption level at the micro-level.
However, these works have a common problem of small, often one-off, samples. There is no easy way out of it other than more textual research and archaeological findings to yield more information which is however not the purpose of this study. Farming yield level is a good example. Given the sheer complicity of local weather conditions, soil quality and moisture levels, and individual farmers’ skills and working hours, it is impossible to know the real yield level within a county let alone the whole of China without a systematic survey. It is a common practice to pick up a figure for a region or for the country on an anecdotal basis. Such a figure should never be regarded as the ‘gold standard’ of farming practices. Rather, it is no more than a rough, plausible index when agricultural surveys on any scale were absent. Another example: the actual size of the population of Northern Song China is unknown. What accessible are numbers of households and male poll-taxpayers. Similarly, the real iron output during the Song is nonexistent. The only information is amount of the metal possessed by the government under the mandatory erba choufen scheme (20:80 output-sharing between the state and the producer).30 The scale and scope of market activities are also elusive, apart from the stated commercial tax rates (2–5 per cent). So, just about all Song economic quantities are widely open for dispute. Therefore, in many cases, numbers used are merely proxies.
Likewise, due to the inherent problem of data unavailability, quantitative accuracy is a rare luxury for a study such as this. The best hope one can have is to establish a direction and trajectory of growth and development. With this in mind, if there is a range of quantities, this study takes the minimum.
II
Economic activities during the Northern Song was geographically uneven. To reflect that, the Song territory can be divided into five echo-economic zones (see Figure 1).
Zones A and E were old dry farming zones since the formation of the Chinese empire in 221 BC. Zone B (including B' and B" from now on) developed paddy rice-farming much later mainly during the Tang Period (618–907). At the beginning of the Northern Song, Zone C remained a peripheral region to farm,31 known for dangerous parasites, insects, animals, and diseases and short life expectancies. It was a region to exile common criminals and political dissidents.32 Zone D was even less inhabitable than Zone C during the Northern Song, with a
30 Qi, Songdai Jingjishi, vol. 2, pp. 586–92; Hu, Zhongguo Shougongye Jingji Tongshi, pp. 149–50. 31 It was documented by an inspector that ‘Rice fields are half tilled and half deserted with only 70 to 80 per cent of plants standing. Local farmers never fertilise or weed fields. After sowing, everything is up to the luck.’ Cited in Gao, ‘Zhongguo Chuantong Jingjide Fazhan Xulie’, p. 73. 32 Zones C and D were stigmatised as yuan-e (faraway and nasty). During the Northern Song, criminals were routinely sent to Zones C and D with their faces tattooed to make their return to society impossible

9
nickname of fachang (‘the killing field’), making it the ultimate dumping ground for criminals and dissidents.33 This was an initial condition for the Song economy.
The regional demographic distribution was as follows (as in 1077/8): Zone A accounted for 24 per cent of all Northern Song households and 22 per cent of Norhtern Song China’s farmland; Zone B (including B' and B"), 41 per cent households and 46 per cent of farmland; Zone C, 19 per cent of households and 21 per cent of farmland; Zones D and E, 8 per cent of households and 11 per cent of farmland.34 Most economic activities took place in Zones A, B and C.
To understand how the Song economy evolved, one needs to retrospect to the environmental and geo-political factors that dictated Song society. The first-order factor, a force majeure, was a climate change, known as the ‘Little Ice Age’. It caused the average temperature to drop 1–2° C on East Asian Mainland.35 During 1000–1120 AD, the frequency of warm weather on record dropped 90 per cent compared a period either immediately before it or thereafter.36 On record, this climate change was severe enough to delay the harvest season for about a month,37 push China’s rice-growing belt 2–4° latitudes southwards, and move its economic centre 500 km to the Yangzi River (i.e. from Kaifeng to Wuhan, see Figure 2).38
In addition, there was an odd phenomenon of drought-flood double disasters. The Northern Song period experienced the most serious droughts since 500 AD,39 which devastated the flora over a vast area in North China and caused unprecedented soil erosion which in turn silted up the Yellow River bed and forced the river to burst its banks frequently, and even changed its course permanently. In 1108, the city of Julu (Hebei) was completely buried by silt of several meters deep; later in 1117, one million lives were lost to another flood in the same region.40 According to Ouyang Xiu (1007–72), floods attacked Hebei Province, wiped out 30 to 90 per cent of farmland in 20 counties at one go.41 The Huai and Yangzi rivers also behaved
(cipei); see Xu, Song Huiyao Jigao, vol. 168, ‘Xingfa, 4/1–4/4, 4/15, 4/25, 4/68’, ‘Xingfa 169, 5/12, 5/25’, ‘Xingfa 170, 6/34’. 33 Liang, Nansongde Nongcun Jingji, p. 63. 34 For households, see Geelan and Twitchett, Atlas of China p. 13; Needham, Science and Civilisation, 1961, ch. 4; 1984, pp. 3–46; 1986, pp. 23–181; Chen, Regional Economies, pp. 87, 96; also see Qi, ‘Productivity Increase’, pp. 43–5; Wu, Zhongguo Renkoushi, pp. 122–35. For data for 1102; see Liang, Zhongguo Lidai Huko Tiandi Tianfu Tongji, p. 164. For farmland, see Liang, Zhongguo Lidai Huko Tiandi Tianfu Tongji, pp. 290–1; Cheng, Songdai Diyu Jingji, p. 87. See also Perkins, Agricultural Development in China, p. 342. 35 Zhu, ‘Woguo Jinwuqiannianlai Qihou Bianqiande Chubu Yanjiu’, p. 36. There was a cycle of Little Ice Ages in the last two millennia: 1 AD, 536, 1000, 1350, 1650, 1750, 1800; see Flohn, World Survey of Climatology, p. 236; Schneider and Mass, ‘Volcanic Dust, Sunspots, and Temperature Trends’, pp. 741–6. For the global temperature decline, see Loehle, ‘A 2000-Year Global Temperature Reconstruction’. 36 Song et al. Zhongguo Gudai Ziran Zaiyi Dongtao Fenxi, p. 343. 37 Tuo, Song Shi, vol. 174, ‘Shihuozhi 127’. 38 Zhao and Yin, ‘Gongyuan 11 Shijihoude Qihou Bianleng Dui Songyihou Jingji Fazhande Dongtai Yingxiang’, p. 71; Cheng, Songdai Diyu Jingji, pp. 13–14. 39 Song et al. Zhongguo Gudai Ziran Zaiyi Dongtao Fenxi, p. 123. 40 Kang, Beisong Wenhua Zhongxin Yanjiu, p. 117. 41 Ouyang, Ouyang Xiu Quanji, vol. 2, p. 965.

10
erratically due to the environmental disequilibrium caused by the same climate change.42
The compounded impact was a 10–20 per cent decline in farming yield in a vast region north to the Yangzi River.43 There was an official complaint in around 1007 that, although the total farmland increased by 417,000 qing, government land tax revenue declined by 718,000 shi.44 Vast farming areas were simply deserted (feitian) despite government persistent promotion of agriculture. In 996, the court official Chen Jing (948–1026) filed a chilling report that ‘Across 30 prefectures of 1,000 li surrounding the capital, only 20–30 per cent arable land is actually cultivated. Only 50–60 taxpayers pay taxes. … People abandon farming and become idle.’45 Over time, it went from bad to worse: Hou Shuxian, an official in charge of farming in the north, reported in 1069 that
‘In the capital region, over 10,000 qing, or half the total arable land, is not farmed. … The capital region could produce several million shi of rice to feed the army. To cultivate idle land will reduce the cost of shipping stipend rice, save the military budget, enrich the country, and strengthen the army [fuguo qiangbing].’46
All this means that in North China faming was crippled. In this context, population grew in Zone A at the lowest rate, even lower than Zone D where migrants (criminals and dissidents) were sent (in households):47
980 1101 Annual %
Old zones
A 1,680,755 (100) 3,750,266 (223) 0.67
B 2,536,634 (100) 7,262,900 (286) 0.8748
E 436,964 (100) 1,349,072 (309) 0.94
New zones
C 879,117 (100) 3,677,907 (418) 1.19
D 636,297 (100) 1,474,484 (232) 0.68
42 Song et al., Zhongguo Gudai Ziran Zaiyi Dongtao Fenxi, pp. 120, 176, 226–7, 261, 281, 297, 317, 340–1, 369–70. 43 Zheng, Zhongguo Gudai Jingji Zhongxin Nanyi He Tangsong Jiangnan Jingji Yanjiu, pp. 39–43; Song et al. Zhongguo Gudai Ziran Zaiyi Dongtao Fenxi, p. 187; Zhang, Qihou Yu Renlei, pp. 123–4. 44 Tuo, Song Shi, vol. 174, ‘Shihuozhi 127’. Note: One qing = 100 mu; 1 Song qing = 6 ha. One Song shi = 46.2 kg. 45 Ibid., vol. 173, ‘Shihuozhi 126’. Note: the term li was elastic. Historically it meant consistently ‘300 paces long’. A modern observation makes it 500 metres. Hence, 1,000 Song li ≈ 500 km. 46 Xu, Song Huiyao Jigao, ‘Shihuo 7/19’. 47 Liang, Zhongguo Lidai Huko Tiandi Tianfu Tongji, p. 164; Wu, Zhongguo Renkoushi, pp. 122–35. See also Shiba, Songdai Jiangnan Jingjishi Yanjiu, p. 148. 48 For an estimate at one per cent per annum, see Shiba, Songdai Jiangnan Jingjishi Yanjiu, p. 148.

11
However, it will be wrong to assume the supply of arable land during the Northern Song was inelastic. Firstly, the registered farmland was not necessarily all in good use. It was documented in 1067 that of all the registered farmland (4.4 million qing), 11 per cent was feitian (‘wasted land’).49 In another account, 70 per cent of farming households did not farm all their registered land; they did not paid their expected taxes, either.50 Secondly, new land was plentiful in all southern zones (B, C and D). In 979, Emperor Taizong (r. 976–97) allowed people to self-declare private ownership over unclaimed land in Zone B.51 People did move to Zone B which explains why the immigrant/tenancy rates were so high there.52 Even so, according to Shen Kuo (1031–95), the best known proto-scientific writer in Chinese history,53 in 1074 ‘I witnessed in Liangzhe Province [at the heart of Zone B] lots of idle and unreported lands yet to be utilised in vast seashore in Wenzhou, Mingzhou and Taizhou.’54 By this time, Zones C and D were also fairly empty. This was disappointing after decades of government promotion of peasant landownership in the region. Now, if the supply of arable land was so elastic, there should have no involution in the rural sector. The ‘subsistence-pushed’ hypothesis for the Northern Song can be ruled out.
Clearly, something made the Song farmers half-hearted in their profession. The Song state was worried. Farming as well as food supply was on the agenda of the Song government all the time. Farming was consistently linked to the state’s goal of fuguo qiangbing (‘enriching the country and strengthening the military’).55 To bring more land to cultivation, an array of institutions was deployed by the state, including landownership, tax holidays and, to less extent, technical assistance. After self-declared ownership over unclaimed land, the offer was extended to all state-owned land in the Empire in 980.56 In 1082, army soldiers were allocated 200 mu each in military colonies.57 In the process of privatisation, state ownership dropped to merely 1.4 per cent of China’s total farmland, much lower than the previous Tang.58 Other measures included tax deduction and exemption. Although the Land Tax rate was set at 10 per cent of a farm’s output,59 farmers were granted 50 per cent tax reduction if they brought idle land back to cultivation.60 Taxes on newly reclaimed land went well below 10 per cent, too.61 Land under rice was once completely tax-free.62 Tax holidays and government loans were used to persuade farmers to stay in Zone A (Hebei) or to settle in Zone C (Jingxi).63 So much so, according to one 49 Tuo, Song Shi, vol. 173, ‘Shihuozhi 126’. Note: 4.4 million Song qing = 26.4 million ha. 50 Ibid., vol. 7, p. 5712. 51 Xu, Song Huiyao Jigao, ’Shihuo 69/36’. 52 Liang, Zhongguo Lidai Huko Tiandi Tianfu Tongji, pp. 126–9. 53 His Mengxi Bitan provides valuable information about the Song scientific achievements across a wide spectrum. 54 Xu, Song Huiyao Jigao, ‘Shihuo 7/28’. 55 Ibid., ‘Shihuo 61/97’. 56 Tuo, Song Shi, vol. 173, ‘Shihuozhi 126’. 57 Xu, Song Huiyao Jigao, ‘Bing 4/11’. Note: 200 mu = 12 ha. 58 Liang, Zhongguo Lidai Huko Tiandi Tianfu Tongji, p. 290; Qi, Songdai Jingjishi, p. 299. 59 Tuo, Song Shi, vol. 173, ‘Shihuozhi 126’. 60 Xu, Song Huiyao Jigao, ‘Shihuo 63/195’. 61 Ibid., ‘Shihuo 63/162’. 62 Tuo, Song Shi, vol. 173, ‘Shihuozhi 126’. 63 Xu, Song Huiyao Jigao, ‘Shihuo 63/182’, ‘Shihuo 69/38’.

12
source, only 30 per cent of land under cultivation actually bore tax before 1069.64 Government technical provision was also well documented.65 If this was not enough, during 1023 to 1063, with the mounting ransoms to the northern nomads and the military spending on the northern front, the emperor decided not to increase land taxes.66
From the Malthusian point of view, one thinks of more aggressive rice-farming outside the disaster-stricken Zones A and E as a way out the Song agrarian crisis. However, irrigation was the sine qua non for rice-farming across all regions under the Song rule, not to mention the frost-free season as another prerequisite, a factor that separates China from Southeast and South Asia where rain-fed rice-farming has been more common. Only about 5 per cent of rice paddies are rain-fed in China, compared with 40 per cent in South and Southeast Asia and 29 per cent on the world average.67 China’s low annual precipitation is a huge constraint. In contemporary China, for argument’s sake, Zone A has 500–1,000 millimetres; Zone B, 1,000–1,500 millimetres; Zones C and D, above 2,000 millimetres; and Zone E, 100–500 millimetres.68 No single zone in modern China is able to grow rice without artificial irrigation (in millimetres of water/day):69
Zone Seepage loss Plant evaporation Water deficit for rice
A and E 360–1,560 480–840 840–2,280
B 30–1,120 280–800 350–1,800
C and D 30–160 270–540 300–700
In Zones B and C, for example, the annual rainfall (1,000–2,000 millimetres) supports rice-growing for merely a week.
The Northern Song state did promote irrigation very ostentatiously. In 973, for example, it amassed 200,000 workers to build an irrigation system in Hangzhou.70 But the effectiveness of such projects is questionable. Of the state-owned land merely 0.5 per cent was irrigated.71 In 1011–69, six irrigation works were carried out across Zones A and B, creating only 42,800 qing irrigated land, barely one per cent of the Song total of 4.4 million qing (as in 1065).72 By the end of the Northern Song, the scale of irrigation remained 7–8 per cent of all farmland within
64 Zhou, Zhongguo Caizhengshi, p. 249. 65 Xu, Song Huiyao Jigao, ‘Shihuo 6/11 – 7/57’. 66 Tuo, Song Shi, vol. 173, ‘Shihuozhi 126’. 67 Neue, ‘Methane Emission from Rice Fields’, p. 467, Table 4. 68 Based on www.britannica.com/EBchecked/topic/11803/China/70982/Precipitation. 69 Zhao et al., Zhongguo Tezhong Dao, p. 100. 70 Tuo, Song Shi, vol. 97, ‘Hequzhi 49’. 71 See Shiba, Songdai Jiangnan Jingjishi Yanjiu, p. 203. 72 Tou, Song Shi, vol. 173, ‘Shihuozhi 126’. In fact, one cannot assume shili (water projects) were all for irrigation. Many large Song shuili projects were in fact devoted to canal construction and river flood control, not to rice-farming; see Fang, ‘Songdai Heliu Qianxi Yu Shuili Gongcheng’. In Hangzhou, the state employed several million worker-days to build a dyke along the sea front against tidal waves in 1012; see Tuo, Song Shi, vol. 97, ‘Hequzhi 49’.

13
the Song territory.73 This comes as no surprise because the irrigation rate of China’s all farmland was only 24 per cent in as late as 1919.74 With such a low irrigation rate, rice-farming had to be limited despite the government propaganda.
Moreover, even if irrigation was available universally, considering a shortened growth season at the mercy of the Little Ice Age, double-cropping of rice across Zones B and C (where 67 per cent of Song China’s farmland lay) was not performed according to all the known Northern Song sources. It was well documented that a single rice crop a year was the norm in Zones B, C and D where rice-farming was well suited.75 The earliest known experiment with double-cropping of rice took place in 1178 when the Northern Song was over.76 Champa Rice promoted by Emperor Zhenzong in 1012 across Zone B has been a supply-side of story. The actual demand for the new rice strain has been poorly justified,77 not to mention that the Chinese knew about this rice long before the Song.78 Double-cropping of rice became common much later during the Ming Period (1368–1644).79 Even so, in the 1930s, only four per cent of China’s farmland was double-cropped with rice.80 This is what the ‘Champa Rice Hypothesis’ completely overlooks. The widely quoted ‘second harvest of rice’ during the Song (zaishu dao, or daosun, meaning “rice’s offspring”) came in fact from re-tiller of old stems. The output from such re-growth was neither predictable nor guaranteed.81 So it cannot be justified as a crop. Rather, it is a weed.
The alleged double-cropping of rice during the Song has so far been based on the dubious notion that ‘early-ripening rice’ equates with ‘fast-ripening rice’ and then with ‘rice double cropping’.82
73 A total of 30,794,365–36,117,800 Song mu was recorded under irrigated rice vis-à-vis 443,792,405 Song mu farmland in total; based on Liang, Zhongguo Lidai Huko Tiandi Tianfu Tongji, pp. 290–1; Cheng, Songdai Diyu Jingji, p. 87. See also Perkins, Agricultural Development in China, p. 342. A higher figure of 36,117,800 comes from Tuo, Song Shi, vol. 173, ‘Shihuozhi 126’. 74 Perkins, Agricultural Development in China, pp. 16, 64. 75 Geelan and Twitchett, Atlas of China, p. 13; Needham, Science and Civilisation, 1961, ch. 4; 1984, pp. 3–46; 1986, pp. 23–181; Cheng, Songdai Diyu Jingji, pp. 87, 96; also see Qi, ‘Songdai Shehui Shengchanlide Fazhan Jiqizai Zhongguo Gudai Jingji Fazhan Guochengzhongde Diwei’, pp. 43–5; Wu, Zhongguo Renkoushi, pp. 122–35; Liang, Nansongde Nongcun Jingji, p. 117. For the geographic distribution of rice cultivation during the Northern Song, see Song Xi, ‘Beisong Daomide Chandi Fenbu’. 76 For the first recorded double-cropping of rice in Guangnan Xi, see Zhou, Lingwai Daida, vol. 8. 77 Tuo, Song Shi, vol. 8, ‘Benjin 8’; and vol. 173, ‘Shihuozhi 126’. 78 Wang, Tang Huiyao, vol. 98 ‘Linyi Kingdom’; Zhou, Lingwai Daida, vol. 2 ‘Annan’ and vol. 3 ‘Duonong’. 79 Li, Tangdai Jiangnan Nongyede Fazhan, pp. 119–20; and his ‘Songmo Zhi Mingchu Jiangnan Nongmin Jingyingde Bianhua’; Liang, Nansongde Nongcun Jingji, p. 117; Cheng, Songdai Diyu Jingji, pp. 98–101; Chao, Man and Land in Chinese History, p. 199. See also Chen and Zheng, ‘Daozuo Qiyuande Kaogu Tansuo’; Ting, ‘Zhongguo Zaipei Daozhongde Qiyuan Jiqi Yanbian’; Yan, ‘Zhongguo Daozuo Nongyede Qiyuan’; Lin, ‘Changjiang Qiantanjiang Zhongxiayou Diqu Xinshiqi Shidai Dili Yu Daozuode Qiyuan He Fenbu’; Cao, ‘Jiangxi Wannian Xianrendong Yicun Zaiyanjiu Ji Zhongguo Daozuo Nongye Qiyuan Xin Renshi’; Fan, ‘Jiangnan Diqude Shiqian Nongye’. 80 Perkins, Agricultural Development in China, pp. 16, 44. 81 Cheng, Songdai Diyu Jingji, p. 97. 82 In ancient China, ‘early-ripening’ (measured by crop harvest time) and ‘fast-ripening’ (measured by the duration needed for crops to mature) were not identical. In Shi Jing (Book of Odes) of the eleventh to sixth centuries BC, crops were already categorised as ‘early-sowing’, ‘late-sowing’, ‘early-ripening’ and
14
The question is whether the Song population could live on a single crop a year, something that needs to be investigated. There are three facts here. First, according to the Song official famine relief standards, an adult needed two sheng of grain (or 924 grams, presumably husked) to maintain subsistence.83 This is reasonable per diem, as according to John Buck’s survey in the 1920s–30s, 924 grams of traditionally produced rice, wheat and millet provided 2,270, 2,220, and 2,320 kilocalories of energy, respectively.84 A family of, say generously, six (three adults and three children) would need 4,240 grams per day or 1,550 kilograms a year, if weighting each child as half an adult in food consumption. To take into account wastage during milling,85 the gross amount of food should be around 2,060 kilograms. Second, it has been generally agreed that the average yield of the main crop from farmland of the medium fertility was roughly one Song shi per Song mu in the north and about twice as much per mu in the south.86 Third, the Song total registered farmland was 3.1 million qing in 996 AD.87 With these stylised facts, the Song farming regions would look like the following (with the afore-mentioned geographical distribution of farmland in 1077 as a proxy):88
‘late-ripening’; see Xia, Cihai, p. 97. In Ho’s work, however, ‘early-ripening’ and ‘fast-ripening’ are worryingly interchangeable. For critique, see Seng, ‘Songdaide Wandao He Zaodao’. 83 Tuo, Song Shi, vol. 175, ‘Shihuozhi 128’, and vol. 191, ‘Bingzhi 144’. One Song sheng = 1/100 Song shi = 462 grams. Two Song sheng = 924 grams. 84 Buck, Land Utilization in China, p. 66. 85 Rice-milling usually causes 20 per cent loss in weight to husks and another 8–12 per cent to bran; see http://www.knowledgebank.irri.org/rkb/index.php/rice-milling. Wheat loses 20–22 per cent to bran in the milling process; see http://www.apgoe.com/wheat.htm. 86 Wu, Zhongguo Jingjishi Ruogan Wentide Jiliang Yanjiu, p. 115; Ge and Gu, ‘Songdai Jiangnan Diqude Liangshi Muchan Jiqi Gusuan Fangfa Bianxi’ pp. 78–9; Hua, Shongshi Lunji, pp. 4–5; Qi, ‘Songdai Shehui Shengchanlide Fazhan Jiqizai Zhongguo Gudai Jingji Fazhan Guochengzhongde Diwei’, pp. 38–9; Li, Tangdai Jiangnan Nongyede Fazhan, p. 148. Noted, the Song shi and mu were lighter and smalller than their modern counterparts: one Song shi = 0.66 modern shi, and one Song mu = 0.9 modern mu; see Liang, Zhongguo Lidai Huko Tiandi Tianfu Tongji, p. 545; Wu, ‘Lishishang Liangshi Shangpinliang Cegu’, p. 19. One Song shi per Song mu = 46.2 kg. 87 Tou, Song Shi, vol. 173, ‘Shihuozhi 126’. Note: It is agreed that only 70–80 per cent of farmland ever got registered; see Wu, Zhongguo Jingjishi Ruogan Wentide Jiliang Yanjiu, p. 172. However, if this margin of error persisted, official figures still serve as minimum proxies after a ‘hair cut’. More headaches come from the common practice of zhemu (land unit conversion): A Song cadastral mu was not in a fixed physical size. Often, the average output from one mu of the medium fertility in a region was picked as a common denominator to convert outputs from plots in different fertilities. After that, farmers were taxed according to annual outputs not the actual acreage. The conversion rate was as high as 10:1; see Xu, Song Huiyao Jigao, ‘Shihuo 70/120’. In this context, although the official mu was always 240 paces in perimeter, the actual mu upon which the land tax was levied varied from 360 to 1,200 paces. For the Qing case, see Zhao, ‘Jishu Wucha, Zhemu Jiqi Juli Shuaijian Guilü Yanjiu’. That should not deter anyone to use the Song cadastral records so long as one knows the complexity behind those them. Note: one qing = 100 mu. 88 Geelan and Twitchett, Atlas of China p. 13; Cheng, Songdai Diyu Jingji, pp. 87, 96; also see Qi, ‘Songdai Shehui Shengchanlide Fazhan Jiqizai Zhongguo Gudai Jingji Fazhan Guochengzhongde Diwei’, pp. 43–5. Note: here, the shares of Zones A and E were almost larger than in 1077 because of a decline in farming there. But we stick to the 1077 shares because there is no other reliable information for 996.

15
Zone Million Song mu Main grain type Per mu yield
A 68.8 Millet/wheat 1 Song shi
B 142.6 Rice 2 Song shi
C 66.0 Rice 2 Song shi
D 1.3 Rice 2 Song shi
E 31.3 Millet/wheat 1 Song shi
Total farmland 310.0
China-wide average per Song mu 1.7 Song shi
Total food stock 520 million shi
The total food stock would be in the region of 520 million shi (24 million metric tons) and provide for 11.7 million households.89 But in the same year (i.e. 996), Song China had only 4.6 million households.90
Now, considering the impact of the climate change, Zone A could even be a write-off from farming. Then, the food stock would be 451 million shi (20.8 million tons) enough to sustain 10.1 million households. Song agriculture had at least an overcapacity of 120 per cent. Champa Rice is not needed in the equation.
But the Little Ice Age did create a niche for a winter crop in Zones A and B in the following pattern: a summer crop in Year One (including rice, a 145–175 day growing season) → a winter crop (a ±175 day growing season) → another summer crop in Year Two (a 145–175 day growing season).91 Winter-wheat (sumai, or ‘over-year wheat’) fills the bill very well when a combination of a low temperature and minimum irradiance was lethal for the vast majority of annuals.92 After the initial two-year cycle, farmers sowed and harvested twice in the same plot each calendar year. This was a different type of double cropping. This cropping pattern was confirmed in 1037 that ‘the Lower Yangzi is fertile with many products. ... In farming, the region has rice after harvesting [winter] wheat which makes two crops a year.’93 The yield of winter-wheat from land of medium fertility was about 0.8 Song shi per Song mu.94
To add winter-wheat to the farming cycle began in Tang China around the eighth
89 Note: one Song shi = 46.2 kg. 90 Liang, Zhongguo Lidai Huko Tiandi Tianfu Tongji, p. 122; Wu, Zhongguo Renkoushi, p. 346. Note: Liangs’ figure is 4,574,257; Wu’s is 3,574,257, one million apart. To play safe, the former is chosen. 91 Numerous references; e.g. Ge, Song Liao Xia Jin Jingji Yanxi, pp. 103–13; Li, ‘Changjiang Xiayou Daomai Fuzhongzhide Xingcheng He Fazhang’, p. 7; Kong, ‘Jianlun Zhongtang Yilai Chuantong Nongyede Yaosu Shengchanlü’. 92 See Cheng, Songdai Diyu Jingji, pp. 98–100. 93 Zhu, Wujun Tujing Xuji, vol. 1, ‘Wuchan’. 94 Wu, Zhongguo Jingjishi Ruogan Wentide Jiliang Yanjiu, p. 115; Ge and Gu, ‘Songdai Jiangnan Diqude Liangshi Muchan Jiqi Gusuan Fangfa Bianxi’ pp. 78–9; Qi, ‘Songdai Shehui Shengchanlide Fazhan Jiqizai Zhongguo Gudai Jingji Fazhan Guochengzhongde Diwei’, pp. 38–9.
16
century.95 The Tang tax system, the liangshui zhi (‘Two Seasonal Taxes’), was synchronised with one crop harvest in spring (winter-wheat) and the other in autumn (the main crop).96 However, winter-wheat gained wide popularity only during the Northern Song thanks to two specific reasons. First, the Little Ice Age climate change prolonged the winter season which made winter-wheat a sound insurance policy, described by the Song official Ouyang Xiu (1007–1072) as ‘people raise debts in winter and repay their debts with their winter-wheat harvest in early summer; they raise debts in summer-autumn and repay their debts with their main harvest before winter.’97 In fact, the Song low-interest qingmiao fa (‘Green-shoots Loan Scheme’) issued in 1069 was designed to help those whose winter-wheat crop failed.98 Second, the Song tenancy rate was high, affecting 30–50 per cent of all farmland.99 Winter crop was extra-attractive to tenants because the second crop was customarily rent-free.100 Evidence indicates that winter cropping was carried out on a large scale and remained the norm in regions like the Lower Yangzi until the early twentieth century.101
Assuming that winter-wheat was adopted where it was suited, the Song staple food production would look as follows when China’s farmland reached 4.4 million qing (as in 1065):102
95 Li, Tangdai Jiangnan Nongyede Fazhan, p. 116; Li, ‘Changjiang Xiayou Daomai Fuzhongzhide Xingcheng He Fazhang’, pp. 16–17. The Tang poet Bai Juyi (772–846) described it as:
When it is rainless and windy in the Third Month Wheat ears wither and die, When it is frosty and cold in the Ninth Month Rice ears go empty and dry.
Cited in Tang, Tangsong Shici Jianshang Zidian, p. 863. 96 Likewise, it was recorded during the Northern Song that in Zone B the xiashui (Summer Tax) was paid in wheat, textiles, and cash. No rice was involved. See Wu, Tangsong Zhiji Tianshui Zhidu Bianqian Yanjiu, p. 111. In another account, ‘The Summer Tax payment in grain is always made of wheat; the Autumn Tax payment in grain is always made of millet, rice, legume and so on.’ Cited in Song, Songshi Yanjiu Luncong, p. 90. 97 Cited in Hua, Songshi Lunji, p. 23. 98 Tuo, Song Shi, vol. 176, ‘Shihuozhi 129’. 99 Qi, Songdai Jingjishi, vol. 1, p. 269. For the kehu category (guest households), see Liang, Zhongguo Lidai Huko Tiandi Tianfu Tongji, pp. 126–9. 100 Li, ‘Changjiang Xiayou Daomai Fuzhongzhide Xingcheng He Fazhang’, p. 9; Ge and Gu, ‘Songdai Jiangnan Diqude Liangshi Muchan Jiqi Gusuan Fangfa Bianxi’, p. 82. The Song sharecropping practised a 40:60 split in favour of the landlord if he provided draught animals or in favour of the tenant if the landlord had no input other than land. See Yang, ‘Songdai Mintian Chuzude Dizu Xingtai Yanjiu’, p. 139; Liang, Nansongde Nongcun Jingji, p. 108; Ge and Gu, ‘Songdai Jiangnan Diqude Liangshi Muchan Jiqi Gusuan Fangfa Bianxi’, pp. 80–2. 101 E.g. Li, ‘Rengen Shimu Yu Mingqing Jiangnan Nongminde Jingying Guimo’. According to the British East India Company’s Hamilton H. Lindsay who travelled in 1832 to Shanghai on the Amherst, ‘Upon our arrival, wheat was just harvested in. That was immediately followed by ploughing, sowing and irrigation for growing rice. Rice ripens in the Ninth Month.’ See Hu, ‘A-meishide Hao 1832 Nian Shanghai Zhixin Jishi’, p. 277. In the 1930s, 18.6 per cent of China’s farmland was subject to the ‘winter-wheat plus rice regime’; see Perkins, Agricultural Development in China, pp. 16, 46. 102 Tou, Song Shi, vol. 173, ‘Shihuozhi 126’.

17
Zone Million Song mu Main grain type Per mu yield
A 97.7 Winter-wheat + millet 1.8 Song shi
B 202.4 Winter-wheat + rice 2.8 Song shi
C 93.7 Rice 2 Song shi
D 1.8 Rice 2 Song shi
E 44.4 Millet/wheat 1 Song shi
Total 440.0
China-wide average per Song mu 2.2 Song shi
Total food stock 978 million Song shi
The gain from the winter crop was likely to be 240 million Song shi, or one quater extra, to make an aggregate food stock of 978 million Song shi (45.2 milliom tons). It was documented that the payment ratio between the Summer Tax and the Autumn Tax 1:4 in loose grain (as in 1077),103 matching rather neatly our calculation. So, the climate change did make the Song farming more efficient.
To take away afore-mentioned 11 per cent lying idle, the Song food stock would be 870 million Song shi (40.2 milliom tons), able to feed 19.5 million households. In the same year, China only had 12.9 million households.104 Song agriculture thus still ran 50 per cent overcapacity. If farming in Zone A was again omitted, the amount of 32.9 million tons would support 16.0 million households. To push it further, without a winter crop at all, China would still produce 738 million Song shi (34.1 milliom tons) to maintain 16.6 million households. This is 25–30 per cent overcapacity.105 So, strickly speaking, winter-wheat helped but was not imperative.
The overcapacity of Song agriculture, which has not been recognised before, explins why the Song farmland acreage moved up and down like a yoyo when the population kept growing, which has puzzled many (Table 2).106 If the population lived a hand-tomouth life, China would have had seen one-third of the Song households facing starvation in 1085. But from the average point of view, the overcapacity was still 40 per cent over time. So, the periodical reduction of farmland could well be deliberate.
The acid test comes from food prices. Had the Song population growth been driven by surplus yield, food must have become cheaper. But that was not the case. Cash prices of rice increased about 500 per cent in densely populated regions (capital city, lower Yellow and lower
103 Liang, Zhongguo Lidai Huko Tiandi Tianfu Tongji, p. 289. 104 Ibid., p. 124; Wu, Zhongguo Renkoushi, pp. 347. 105 This approach differs from that of Perkins who worked out China’s national average yield per mu from a total food bill divided by the total farmland; see his Agricultural Development in China, pp. 14, 17. 106 It is worth noting that the Song Period was not unique regarding a decline in farmland coinciding with a rise in population. During the Ming Period (1368–1644), China’s farmland contracted by 27 per cent from 1393 to 1502; see Perkins, Agricultural Development in China, p. 223.

18
Yangzi):107
Kaifeng (A)108 Hedong (A) Liangzhe (B)
AD wen/one dou rice AD wen/one dou rice AD wen/one dou rice
989 30 979 10 970 20
1074 150 1086 50 1098 100
Annual % 1.9 1.5 1.3
As these prices were likely to be distorted by rampant inflation, currency heterogeneity, and multiple exchange rates of the time,109 a better gauge is rice prices relative to iron and silk (i.e. terms of trade). They all moved in the same direction as the cash prices:110
AD Amount iron/shi rice AD Bolts silk cloth/shi rice
997 16 997 0.24
1080 56 1108 0.95
Annual % 1.5 1.2
The point is that these prices all grew faster than the Song households. The notion ‘cheaper food feeding the Northern Song population’ was a red herring. This phenomenon dismisses the afore-mentioned ‘surplus-driven’ hypothesis. Meanwhile, there was no widespread famine or a large quantity of food imports. Sufficient food had to be produced to meet the aggregate demand. It means that the Song production overcapacity was not exploited.
Buy why did the Song population not maximise food output? The explanation leads to the geopolitical factor of external threat. To begin with, the Northern Song Empire was only about 40 per cent of the size of the Tang (Tang: 618–907).111 This territorial contraction was a result of three militarily powerful nomadic groups living side by side with the Chinese: the Khitans (Liao Kingdom: 916–1125), the Tanguts (Xixia Kingdom: 1038–1227) and then the Jurchens (Jin Kingdom: 1115–1234). Despite their small population sizes compared with the
107 Cheng, Songdai Wujia Yanjiu, pp. 125, 132–4, 139–41. Noted, these figures only serve as rough indications. 108 Kaifeng was the capital city where food was persistently more expensive. Hedong was one of the oldest northern farming provinces; Liangzhe was a new farming province at the time. 109 For the Northern Song inflation, see Peng, Zhongguo Huobi Shi, p. 505; Guo, ‘Songchaode Wujia Biandong Yu Jizang Lunzui’, p. 72; Qi, Songdai Jingjishi, vol. 2, pp. 1104–7. For multiple currencies and exchange rates, see Guo, Liansong Chengxiang Shangpin Huobi Jingji Kaolue, pp. 287–321, 331. 110 Iron-rice prices, cited in Hartwell, ‘Markets, Technology, and the Structure’, p. 33; silk-rice prices, based on Yu, Zhongguo Jiage Shi, pp. 602, 610. 111 Tan, Jiangming Zhongguo Lishi Ditu Ji, pp. 41–2, 51–2; Fu et al., Zhongguo Junshi Shi, Lidai Zhanzheng Nianbiao, Xia, pp. 1–13.

19
Song,112 these groups firmly controlled the areas where the old Great Wall and the Silk Road were located. China’s old farming and industrial core along the Yellow River was eventually lost to the Jurchens in 1127, which ended the Northern Song (Figure 2). Arguably, the scale, scope and persistence of the southward expansion by the nomads, who were specialised with violence to prey on farming communities, were dictated by the very same climate change that made the livelihood in the Steppes far less sustainable.113 So, the origin of the problem was the same. But the similarity ended there.
The pressure from external invasion formed yet another force majeure to Northern Song China. Unlike the climate change which only tested China’s farming and administrative capacities to maintain food security, the threat from the nomads tested China’s capacity to generate non-food wealth. In other words, the climate change only made the Song farming more efficient farming but did not alter China’s growth trajectory. The external threat of invasion however forced the Song mindset, behaviour and growth trajectory to embark on some drastic changes.
Most puzzlingly, the response of the Song state to the external threat was not to fight but to appease and compromise.114 China’s military vulnerability and diplomatic weakness were exploited to the full by nomads who demanded annual ransoms as a precondition for peace. In accordance with the humiliating ‘1004 Chanyuan Treaty’, the Khitans received annually 200,000 bolts of silk cloth and 100,000 taels of silver (3.7 metric tons). As the Song economy grew fast, the sums increased accordingly to 300,000 bolts of silk cloth and 200,000 taels of silver (7.4 metric tons) in the ‘1042 Guannan Treaty’.115 The Tanguts along another stretch of the Song border followed the suit, demanding 130,000 bolts of silk cloth, 500,000 taels of silver, and 200,000 catties of tea a year as their price for peace with China.116 More wealth was forcefully transferred to the coffers of the greedier Jurchens, a third group who joined the kill. In 1126, the Song state shipped to the Jurchen Jin 5 million taels of gold, 50 million taels of silver, 2 million bolts of silk cloth, and 11,000 draft animals. Another 378,000 taels of gold, 7,140,000 taels silver, and 1,040,000 bolts of silk went to the Jurchens a year later.117 These were heavy fiscal burden on the Song state finance. Meanwhile, to secure their prey, the Khitan-Song treaties stipulated that the Song side was not allowed to build walls or dig moats along the border to obstruct the Khitan cavalry.118 Song China lived on borrowed time; and the stake was high.
Considering that the Song state collected about two million bolts of silk cloth a year as taxes, the silk ransom was easy to fulfil domestically. But the Song economy produced only 200,000 taels of silver a year (as in 1078),119 not enough for the ransom of over one million taels a year. Some silver had to come from outside and through voluntary and peaceful
112 E.g. in 938 AD, the total household number of the Khitan Liao was 127,200; see Tuo, Liao Shi, ‘Dilizghi 1’. 113 For the Mongol case, see Gumilev, Searches for an Imaginary Kingdom. 114 Cheng, ‘Songchu Mibinglunde Jiantao’. 115 Mao, Songchaode Duiwai Jiaowang Geju, pp. 166, 176. 116 Ibid., p. 177. 117 Ibid., pp. 50, 227. 118 Ibid., pp. 167, 176. 119 Tuo, Song Shi, vol. 185, ‘Shihuozhi 138’. Note: a tael = 37.5 grams.

20
exchange given the weakness of the Song military. Moreover, to maintain a rapport with its nomadic neighbours, the Song state made sure a continuous supply of luxuries to the northern borders.120 Such luxuries only came by sea routes thanks to the loss of the Silk Road.
Facing its draconian hard-budget diktat, more non-food production and more trade were the only option in a perfect sample of Toynbee’s challenge-response theory.121 To survive, the Song state turned quickly to clear-cut mercantilism, no more ambivalence towards trade and merchants. This was a volte-face from China’s long-entrenched norm of yishang (confining trade).122 A preferential tax rate was set at half the rate imposed on agriculture.123 There were marked regional differences in freedom and tax burden. Cities in the north bore more commercial taxes in both the total and per household terms (Table 3).
Zones B, C and D were corvée-tax havens, ‘Special Economic Zones’ of the time:
Zone A Very strong government/military presence; taxes paid mainly in kind; heavy
in corvée services.124
Zone B Some government presence; taxes paid mainly in cash; hardly any corvée
imposed.125
Zone C Weak government presence; taxes paid mainly in cash; no corvée services
recorded.126
Zone D The weakest government presence; hardly any tax or corvée.127
Zone E The same as Zone A
So, predictably, the market found it cosy in the south where more industrial and commercial growth was generated. Also, it was no accident that paper currency and business credit were invented there.
The state priority was given to overseas trade. Large sea-worthy ships were designed and
120 In an official account, the Jurchen Jin imported from its ‘belligerent’, meaning the Northern Song, lychees, longans, mandarins, olives, bananas, sugar, sapanwood, rhinoceros horns, elephant tusks, and cinnabar – items native to China and beyond; see Tuo, Jin Shi, ‘Shihuo 5’; see also Qi, Songdai Jingjishi, vol. 2, pp. 1030–41. 121 See Somervell, A Study of History; Kearny, ‘Arnold Toynbee; Challenge and Response’. 122 Tian, Zhongguo Gudai Xingzheng Shilue, p. 228. 123 Tuo, Song Shi, vol. 173, ‘Shihuozhi 126’ and vol. 186, ‘Shihuozhi 139’. For the debate, see Guo, Liansong Chengxiang Shangpin Huobi Jingji Kaolue, pp. 238–41. 124 For geographic deployment of officials, see Cheng, Songdai Diyu Jingji, pp. 132–4. For regional taxes, see Xu, Song Huiyao Jigao, ‘Shihou 15/1–20’; Guo, Liansong Chengxiang Shangpin Huobi Jingji Kaolue, pp. 223–8. 125 Cheng, Songdai Diyu Jingji, pp. 132–4; Xu, Song Huiyao Jigao, ‘Shihuo 7/13–14’. 126 Cheng, Songdai Diyu Jingji, pp. 132–4. 127 Ibid., pp. 132–4, 263–4.
21
built; new sea routes opened; and new trading destinations explored,128 new policies and institutions created and implemented.129 In the official account, 33 foreign countries were on the trading list. Apart from those in nearby Southeast Asia and the India Subcontinent, there were new ones in the remote Arabian Peninsular (Tazi) and East African coast (Zanj).130 The scale was more or less the same as Zheng He’s voyages in the early fifteenth century. Ports along China’s southeast coast were free from nomad-raiders and geographical handy for this new development (see Figure 1).
To yield overseas trade returns, a network of customs offices of two tiers (wu and chang) were set up and officials were given performance quotas to fulfil.131 Imported materials, predominately xiang yao (spices, perfumes and pharmaceuticals), were subject to state monopoly for revenue. Pharmaceuticals were controlled by the shibo si (Bureau for Maritime Trade). The bureau then distributed the imports through the taiyiju maiyaosuo (Pharmacy of the Imperial Medical Bureau) via a chain of 1,800–2,000 wu (bureaus) and chang (fairs) whose tentacles reached each of the 1,235 counties across the Empire to sell goods and collect commercial taxes on them at the same time.132 Between 1076 and 1078, an amount of frankincense worth 1.5 billion bronze coins was sold that way.133 This makes on average 60 coins per household, not trivial. In the end, pharmaceutical imports altered China’s pharmacopoeia. According to the Song pharmacopoeia published in 1080, 33 per cent of animal ingredients, 53 per cent of plant ingredients and 13 per cent of mineral ingredients came from overseas.134 Similarly, spices were monopolised by the same bureau and re-sold to the domestic consumers through another network of the shiyiwu (Market Trading Office) for a profit margin of 20–100 per cent.135
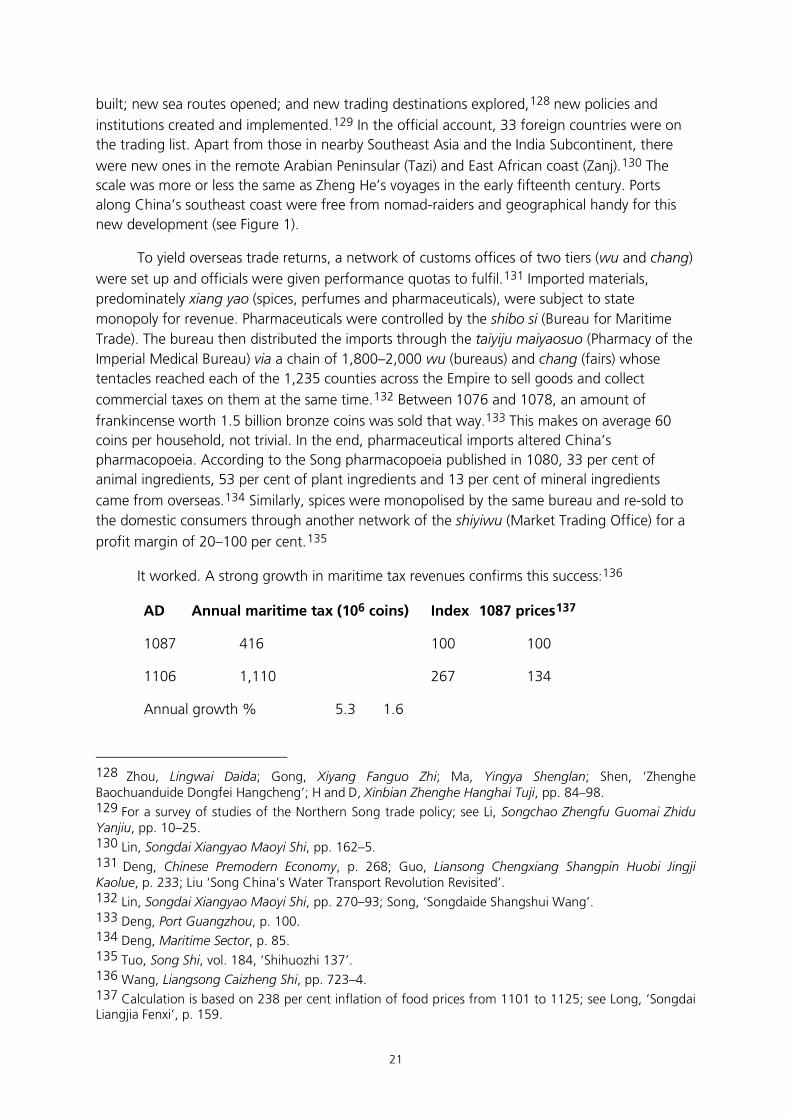
It worked. A strong growth in maritime tax revenues confirms this success:136
AD Annual maritime tax (106 coins) Index 1087 prices137
1087 416 100 100
1106 1,110 267 134
Annual growth % 5.3 1.6
128 Zhou, Lingwai Daida; Gong, Xiyang Fanguo Zhi; Ma, Yingya Shenglan; Shen, ‘Zhenghe Baochuanduide Dongfei Hangcheng’; H and D, Xinbian Zhenghe Hanghai Tuji, pp. 84–98. 129 For a survey of studies of the Northern Song trade policy; see Li, Songchao Zhengfu Guomai Zhidu Yanjiu, pp. 10–25. 130 Lin, Songdai Xiangyao Maoyi Shi, pp. 162–5. 131 Deng, Chinese Premodern Economy, p. 268; Guo, Liansong Chengxiang Shangpin Huobi Jingji Kaolue, p. 233; Liu ‘Song China’s Water Transport Revolution Revisited’. 132 Lin, Songdai Xiangyao Maoyi Shi, pp. 270–93; Song, ‘Songdaide Shangshui Wang’. 133 Deng, Port Guangzhou, p. 100. 134 Deng, Maritime Sector, p. 85. 135 Tuo, Song Shi, vol. 184, ‘Shihuozhi 137’. 136 Wang, Liangsong Caizheng Shi, pp. 723–4. 137 Calculation is based on 238 per cent inflation of food prices from 1101 to 1125; see Long, ‘Songdai Liangjia Fenxi’, p. 159.

22
As a result, the maritime duties accounted for 15 per cent of the government total revenue.138
On the domestic front, government procurement-marketing schemes involved anything that the state was able to lay its hands on: metals, silk textiles, tea, salt, wine and so forth. Tea, wine, salt and silk were monopolised.139 Tea was controlled by 6 government bureaus and 13 centres. They routinely handled some 23 million catties a year, earning the government between 100 and 300 million coins.140 Over 100 million decilitres of wine and 400 million catties of salt were handled under the government procurement schemes on a yearly basis.141 The amount of silk cloth bought by the government increased five-fold from 600,000 bolts (in 1004) to 3,000,000 bolts (in 1041), with an annual growth rate of 4.5 per cent.142 All this sped up commercialisation of the economy.
The government also collected revenue disproportionately more in cash than goods, called zhebian.143 From 1021 to 1065, the cash component in the tax revenue grew 226 per cent and the cash share in the total revenue jumped from 18 per cent to 52 per cent.144 On the other hand, Poll Tax payments collected in home-made cloth decline in relative terms in relation to a continuous increase in poll-taxpayers:145
AD Tax payments in home-made cloth (bolts)
997 2,180,000 (100)
1077 2,672,323 (123)
Annual growth % 0.2
Similarly, the Land Tax collected in grain stagnated first and then declined in absolute
terms:146
138 Chen and Wu, China’s Maritime Trade, pp. 180–2. For the debate, see Guo, Liansong Chengxiang Shangpin Huobi Jingji Kaolue, pp. 390–405. 139 Tuo, Song Shi, vols 180–6, ‘Shihuozhi 134, 135’. 140 Hua, Songshi Lunji, pp. 76, 109. The amount of 23 million catties of tea required about 5.1 million working days; based on Hua, Songshi Lunji, p. 58. 141 Hu, Zhongguo Shougongye Jingji Tongshi, Song Yuan Juan, pp. 353, 402. Official involvement in market deals and profiteering became epidemic and corruption was widespread. But that was a separate issue. 142 Li, Songchao Zhengfu Guomai Zhidu Yanjiu, p. 466. 143 Zhang, ‘Songdai Zhebianzhi Tanxi’. 144 Quan, ‘Tang Song Zhengfu Suiru Yu Hubi Jingjide Guanxi’, p. 202. 145 Liang, Zhongguo Lidai Huko Tiandi Tianfu Tongji, pp. 288–9. 146 Ibid., pp. 288–9; also Bao, Songdai Difang Caizhengshi Yanjiu, pp. 282, 316–9.

23
AD Land Tax payments in food (shi)
997 31,707,000 (97)
1021 32,782,000 (100)
Annual growth % 0.1
1021 32,782,000 (100)
1077 17,887,257 (55)
Annual growth % –1.1
From 1021 to 1086, the cash component amounted for about a quarter to a third of all Land Tax payments,147 meaning that farming households now paid cash for their dues. Tenants’ rent payment had the same trend because their landlords needed cash.148
Overall, the fiscal importance of the agricultural sector became marginalised while the share of the non-agricultural sector doubled:149
AD Total (109 coins) Agricultural share Non-agricultural share
997 35.6 65% 35%
1077 70.7 30% 70%
In addition, the state issued negotiable securities such as yanyin (Salt Permits), chayin (Tea Permits) and dudie (Certificates for Monks and Nuns) for investors.150 All these securities were part of the public debts raised by the Song state to ease its budget deficits in the absence of foreign borrowings of the time (106 coins):151
AD Revenues Expenditures Balance
997 70,893 86,950 -16,057
1021 140,298 168,044 -27,746
1049 126,252 126,252 0
1065 116,138 120,343 -4,205
1086 82,491 91,910 -9,419
147 For tax components, see Wang, Liangsong Caizheng Shi, pp. 688–92; for prices, see Peng, Zhongguo Huobi Shi, pp. 487, 507. 148 Qi, Songdai Jingjishi, vol. 1, ch. 9. The reform was called zhebian; see Zhang, ‘Songdai Zhebianzhi Tanxi’. 149 Ye, ‘Songdai Gongshangye Fazhangde Lishi’, p. 108; Bao, Songdai Difang Caizhengshi Yanjiu, pp. 282, 316–9. 150 In 1078, salt permits sold by the government were worth 23 billion coins; see Li, Songchao Zhengfu Guomai Zhidu Yanjiu, p. 222. Regarding Certificates for Monks and Nuns, a total of 20,5918 such certificates were sold for 32.2 billion coins in 1068–1109; see Qi, Songdai Jingjishi, vol. 2, chs 22, 23, 25, 29; Guo, Liansong Chengxiang Shangpin Huobi Jingji Kaolue, pp. 259–68. Wang, Liangsong Caizheng Shi, pp. 741–3. 151 Wang, Liangsong Caizheng Shi, pp. 678–86; Cheng, ‘Songdaide Gongzhai’.
24
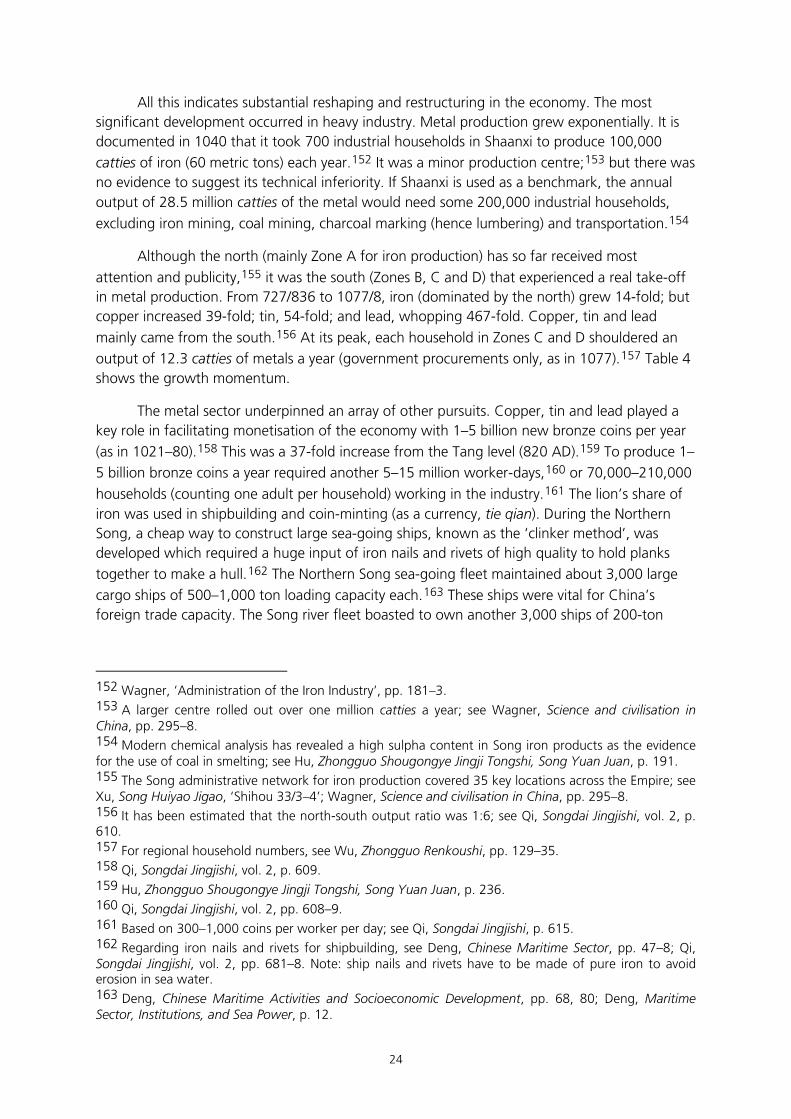
All this indicates substantial reshaping and restructuring in the economy. The most significant development occurred in heavy industry. Metal production grew exponentially. It is documented in 1040 that it took 700 industrial households in Shaanxi to produce 100,000 catties of iron (60 metric tons) each year.152 It was a minor production centre;153 but there was no evidence to suggest its technical inferiority. If Shaanxi is used as a benchmark, the annual output of 28.5 million catties of the metal would need some 200,000 industrial households, excluding iron mining, coal mining, charcoal marking (hence lumbering) and transportation.154
Although the north (mainly Zone A for iron production) has so far received most attention and publicity,155 it was the south (Zones B, C and D) that experienced a real take-off in metal production. From 727/836 to 1077/8, iron (dominated by the north) grew 14-fold; but copper increased 39-fold; tin, 54-fold; and lead, whopping 467-fold. Copper, tin and lead mainly came from the south.156 At its peak, each household in Zones C and D shouldered an output of 12.3 catties of metals a year (government procurements only, as in 1077).157 Table 4 shows the growth momentum.
The metal sector underpinned an array of other pursuits. Copper, tin and lead played a key role in facilitating monetisation of the economy with 1–5 billion new bronze coins per year (as in 1021–80).158 This was a 37-fold increase from the Tang level (820 AD).159 To produce 1–5 billion bronze coins a year required another 5–15 million worker-days,160 or 70,000–210,000 households (counting one adult per household) working in the industry.161 The lion’s share of iron was used in shipbuilding and coin-minting (as a currency, tie qian). During the Northern Song, a cheap way to construct large sea-going ships, known as the ‘clinker method’, was developed which required a huge input of iron nails and rivets of high quality to hold planks together to make a hull.162 The Northern Song sea-going fleet maintained about 3,000 large cargo ships of 500–1,000 ton loading capacity each.163 These ships were vital for China’s foreign trade capacity. The Song river fleet boasted to own another 3,000 ships of 200-ton
152 Wagner, ‘Administration of the Iron Industry’, pp. 181–3. 153 A larger centre rolled out over one million catties a year; see Wagner, Science and civilisation in China, pp. 295–8. 154 Modern chemical analysis has revealed a high sulpha content in Song iron products as the evidence for the use of coal in smelting; see Hu, Zhongguo Shougongye Jingji Tongshi, Song Yuan Juan, p. 191. 155 The Song administrative network for iron production covered 35 key locations across the Empire; see Xu, Song Huiyao Jigao, ‘Shihou 33/3–4’; Wagner, Science and civilisation in China, pp. 295–8. 156 It has been estimated that the north-south output ratio was 1:6; see Qi, Songdai Jingjishi, vol. 2, p. 610. 157 For regional household numbers, see Wu, Zhongguo Renkoushi, pp. 129–35. 158 Qi, Songdai Jingjishi, vol. 2, p. 609. 159 Hu, Zhongguo Shougongye Jingji Tongshi, Song Yuan Juan, p. 236. 160 Qi, Songdai Jingjishi, vol. 2, pp. 608–9. 161 Based on 300–1,000 coins per worker per day; see Qi, Songdai Jingjishi, p. 615. 162 Regarding iron nails and rivets for shipbuilding, see Deng, Chinese Maritime Sector, pp. 47–8; Qi, Songdai Jingjishi, vol. 2, pp. 681–8. Note: ship nails and rivets have to be made of pure iron to avoid erosion in sea water. 163 Deng, Chinese Maritime Activities and Socioeconomic Development, pp. 68, 80; Deng, Maritime Sector, Institutions, and Sea Power, p. 12.

25
displacement to handle 300,000 tons of cargo each year along inland waterways.164 The river fleet was imperative for the Song market function and food supply to the north. Given that a traditional ship of the medium size (a 70-tonner) needed 100 m3 of wood planks and 5 metric tons of iron nails and rivets to build,165 the aggregate inputs in the Song shipbuilding were in the region of 5 million m3 of planks and a quarter of million tons of nails and rivets.166 Regarding money supply, from circa 970 AD onwards, iron coins were mass-produced in the region of 400 million pieces (wen) a year, the largest amount made of iron in Chinese history hitherto, to maintain a dual track system together with bronze coins to tackle the growing hunger for liquidity in a commercial boom.167 Other common objects made of iron included weapons, statues, bridge-building (iron chains), musical instruments (e.g. gongs and cymbals), farming and handicraft tools (spades, ploughs, saws, chisels), and kitchen utensils (knives, pots and woks).168 Steel was produced from iron during the Northern Song, although its quantity is known.169 Iron sheets were also used to produce copper with an input-output ratio at 2.4:1 called dantong fa, a novel method of extracting copper cheaply through a chemical agent (i.e. CuSO4·5H2O).170
During the Northern Song, China’s ceramic production came a long way from the earthenware tang sancai type (Tang three-coloured earthenware) to the genuine water-proof porcelain made of the ‘kaolin clay’ (powder from rocks), baked for weeks on end at a temperature above 1200º C in kilns of a house size. Unlike the cottage-based earthenware-making potteries, the new porcelain industry was a heavy industry which needed a minimum output to justify the investment sum. Northern Song had 28 porcelain production centres, although the size of the workforce has remained unknown.171
There was a strong growth in construction. In Quanzhou (Zone B"), the main trading port for the Song Empire, about 290 bridges were constructed during the Northern Song.172 They cost a total of one billion Song coins, coming mainly from the private sector.173 To build these bridges needed a minimum of 890,000 tons of granite slabs,174 or 4.4 tons of slabs per household in the prefecture of the time (as in 1078).175 To achieve that, sizeable quarrying, masonry and overland transport industries were vital.176
164 Deng, Chinese Maritime Activities and Socioeconomic Development, pp. 62, 66, 82. 165 Deng, Maritime Sector, Institutions, and Sea Power, pp. 29, 31. 166 Ibid., p. 27. 167 Yan, Liangsong Tieqian, p. 403; for the historical context, see von Glahn, Fortune. 168 Ebrey, Illustrated History, p. 144. 169 There were three documented ways to make steel out of iron at the time; see Hu, Zhongguo Shougongye Jingji Tongshi, pp. 205–7. 170 The annual copper production this way reached 380,000 catties a year. The iron input required was one million catties; see Qi, Songdai Jingjishi, vol. 2, pp. 567–8. 171 Li, Zhongguo Gudai Jingjishi Gao, vol. 3, pp. 48–55; Qi, Songdai Jingjishi, vol. 2, pp. 690–700. 172 Deng, Maritime Sector, Maritime Sector, Institutions, and Sea Power, p. 27. 173 Ibid., p. 39. Buddhists played a highly visible role in bridge construction as good deeds; see Fang, ‘Songdai Sengtu Dui Zaoqiaode Gongxian’. 174 Deng, Maritime Sector, Maritime Sector, Institutions, and Sea Power, p. 38. 175 Wu, Zhongguo Renkoushi, p. 131. 176 Deng, Maritime Sector, Maritime Sector, Institutions, and Sea Power, p. 39.

26
Regarding light industry, a boom appeared in paper manufacturing. In Zone B, eight prefectures were specialised in paper-making.177 Huizhou Prefecture (Zone B) and Xinan Prefecture (Zone A) alone were able to roll out annually 1.4 and 1.5 million sheets, respectively.178 Such a quantity was achieved by an organised workforce. A recent archeological discovery made in Fuyang (Zone B) reveals a sizeable paper workshop built in 1009 AD with a floor area of 22,000 m2 with a daily pulp output capacity of 10 tons.179 Much of the paper outputs fuelled the growth in the printing industry for which the Northern Song was prominent in Chinese history.180 Large numbers of books were produced for prestige, profit, and bureaucrat recruitment via the Imperial Examinations.181 From 1080 to 1113, a total of 300 million characters were carved on 400,000 printing blocks in Fujian for the circulation of a Chinese translation of the Tripitaka.182 On the whole, 6,705 new book titles with 73,877 volumes were registered as newly acquired items in the Song imperial collections.183 There was also regular circulation of official and semi-official newspapers (chaobao, dibao, and xiaobao).184
There was the repertoire of household-based textile production to meet tax obligations, a tradition going back to the Tang.185 There was also an urban arm of the industry to produce mainly for the upper end of the market with an elaborate putting-out system. Urban professional weavers amounted for about 100,000 households, each producing 30 bolts a year, or three million bolts in total.186
A growth also infected the service sector (including commerce) which was well documented. The evidence of fast commercialisation came from money supply. Bronze coins issued increased over six times:187
AD Output (106 coins) Metal inputs (106 catties)
995 800 4 (2,400 tons)
1080 5,060 25.3 (15,180 tons)
Annual growth % 2.2 2.2
177 Zheng, Tang Wudai Jiangnan Gongshangye Buju Yanjiu, pp. 206–7. 178 Needham, Science and Civilisation, vol. 5, pt 1, p. 47; Hu, Zhongguo Shougongye Jingji Tongshi, Song Yuan Juan, p. 51. 179 See http://xbh.zjol.com.cn/05xbh/system/2010/01/20. 180 Qi, Songdai Jingjishi, vol. 2, pp. 715–22. 181 During the Song Period, the numbers of candidates received their Imperial Degrees a year was 5 times of the previous Tang and 3.4 times of the Qing half a millennium later; see Yang, Songdai Chuban Wenhua, p. 47. 182 Kang, Beisong Wenhua Zhongxin Yanjiu, p. 157. 183 Tuo, Song Shi, vol. 202, ‘Yiwenzhi 155’. 184 Kang, Beisong Wenhua Zhongxin Yanjiu, pp. 108–31. 185 In theory, there were some 20 million households producing home-made textiles to pay their taxes; in reality only a tenth of them actually did it. See Liang, Zhongguo Lidai Huko Tiandi Tianfu Tongji, pp. 288–9. 186 Hu, Zhongguo Shougongye Jingji Tongshi, Song Yuan Juan, p. 118. 187 Qi, Songdai Jingjishi, vol. 2, pp. 608–9.
27
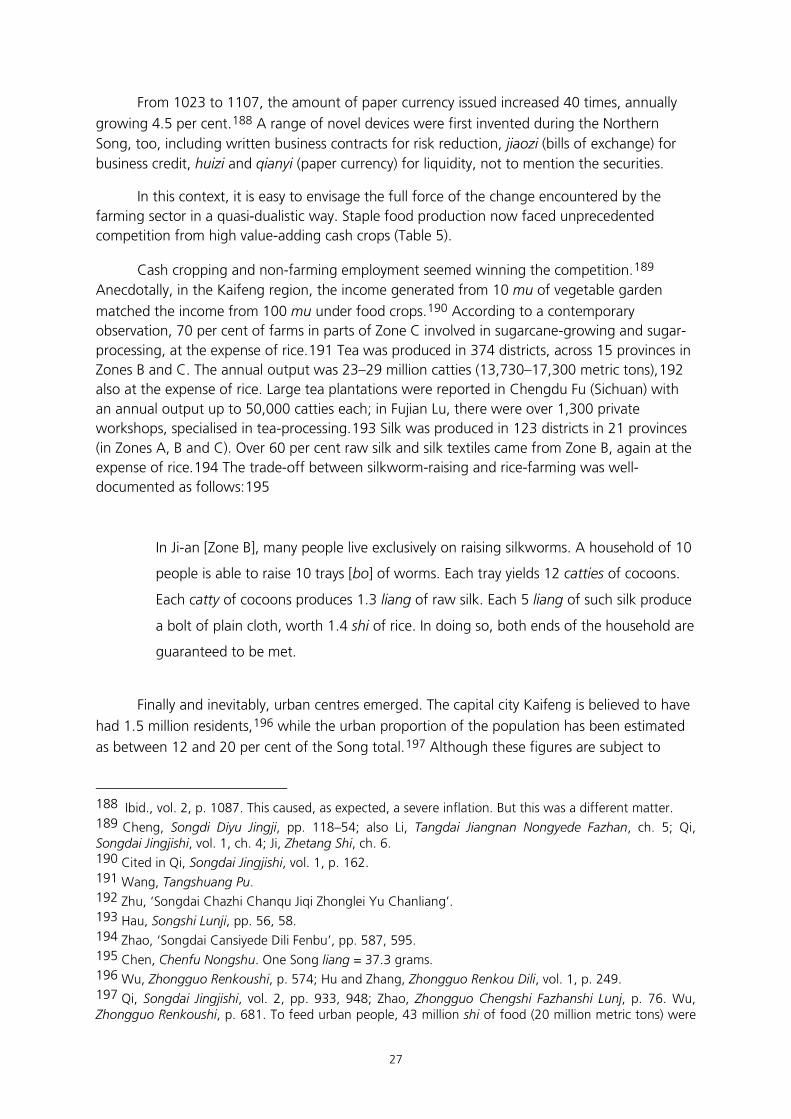
From 1023 to 1107, the amount of paper currency issued increased 40 times, annually growing 4.5 per cent.188 A range of novel devices were first invented during the Northern Song, too, including written business contracts for risk reduction, jiaozi (bills of exchange) for business credit, huizi and qianyi (paper currency) for liquidity, not to mention the securities.
In this context, it is easy to envisage the full force of the change encountered by the farming sector in a quasi-dualistic way. Staple food production now faced unprecedented competition from high value-adding cash crops (Table 5).
Cash cropping and non-farming employment seemed winning the competition.189 Anecdotally, in the Kaifeng region, the income generated from 10 mu of vegetable garden matched the income from 100 mu under food crops.190 According to a contemporary observation, 70 per cent of farms in parts of Zone C involved in sugarcane-growing and sugar-processing, at the expense of rice.191 Tea was produced in 374 districts, across 15 provinces in Zones B and C. The annual output was 23–29 million catties (13,730–17,300 metric tons),192 also at the expense of rice. Large tea plantations were reported in Chengdu Fu (Sichuan) with an annual output up to 50,000 catties each; in Fujian Lu, there were over 1,300 private workshops, specialised in tea-processing.193 Silk was produced in 123 districts in 21 provinces (in Zones A, B and C). Over 60 per cent raw silk and silk textiles came from Zone B, again at the expense of rice.194 The trade-off between silkworm-raising and rice-farming was well-documented as follows:195
In Ji-an [Zone B], many people live exclusively on raising silkworms. A household of 10
people is able to raise 10 trays [bo] of worms. Each tray yields 12 catties of cocoons.
Each catty of cocoons produces 1.3 liang of raw silk. Each 5 liang of such silk produce
a bolt of plain cloth, worth 1.4 shi of rice. In doing so, both ends of the household are
guaranteed to be met.
Finally and inevitably, urban centres emerged. The capital city Kaifeng is believed to have had 1.5 million residents,196 while the urban proportion of the population has been estimated as between 12 and 20 per cent of the Song total.197 Although these figures are subject to
188 Ibid., vol. 2, p. 1087. This caused, as expected, a severe inflation. But this was a different matter. 189 Cheng, Songdi Diyu Jingji, pp. 118–54; also Li, Tangdai Jiangnan Nongyede Fazhan, ch. 5; Qi, Songdai Jingjishi, vol. 1, ch. 4; Ji, Zhetang Shi, ch. 6. 190 Cited in Qi, Songdai Jingjishi, vol. 1, p. 162. 191 Wang, Tangshuang Pu. 192 Zhu, ‘Songdai Chazhi Chanqu Jiqi Zhonglei Yu Chanliang’. 193 Hau, Songshi Lunji, pp. 56, 58. 194 Zhao, ‘Songdai Cansiyede Dili Fenbu’, pp. 587, 595. 195 Chen, Chenfu Nongshu. One Song liang = 37.3 grams. 196 Wu, Zhongguo Renkoushi, p. 574; Hu and Zhang, Zhongguo Renkou Dili, vol. 1, p. 249. 197 Qi, Songdai Jingjishi, vol. 2, pp. 933, 948; Zhao, Zhongguo Chengshi Fazhanshi Lunj, p. 76. Wu, Zhongguo Renkoushi, p. 681. To feed urban people, 43 million shi of food (20 million metric tons) were

28
debate, by the end of the Northern Song, a dozen cities seemed to have had over 100,000 households each.198 The growth was particularly strong in the south where Jizhou and Tanzhou surpassed Kaifeng (Table 6). This is not surprising given the political and economic freedom in Zone C.
A general pattern emerges from the Northern Song changes and growth. Firstly, the economy experienced major restructuring and leaned more towards industry and services. Secondly, industry and commerce grew fast and the south performed better than the north due to climatic, geopolitical and institutional reasons. Thirdly, the farming sector did not aim to make food cheaper despite its spare capacity. Only a high market price for food, together with the availability of arable land and tax cuts, was able to persuaded and compensate those who kept on farming. Fourthly, in the process, resources were allocated by and through the market. The Song households now optimised incomes across different sectors instead of maximising their food output. Finally, the population grew continuously through these changes. Only an established market economy behaves this way. The Song Chinese could well be short-listed for the first group of Homo economicus in the world history.
This pattern was most obvious in the south where the local population did not plump for a mono-product of grain despite the absolute advantages in doing so (including more suited climate, more arable land and a long way from external threat). Rather, metal production, trade and urbanisation flourished there. The local population grew, too. Such a change is compatible with the on-going ‘real wage debate’ in global history.199
The findings of the causes, mechanisms and stance of the Song growth and development suggests that Eric Jones is right: ‘China came within a hair’s breath of industrialising’.200
III
This study argues that the unprecedented Song population spurt was fuelled by an economic restructuring-cum-growth. It is already clear from the prime facie evidence that annual growth rates of industry and services increased faster than that of the population. To test that further, this paper employs the Ordinary Least Squares (OLS) to regress a set of time series data to examine the impact of economic growth on the Song population (for data sources, see Appendix). The model in the log-linear version is structured as follows:
sold to cities and towns every year, enough to sustain one million households at the subsistence level. See Gao, ‘Lun Songdai Huobi Liutongzhongde Jige Guanxi’, p. 96. 198 Guo, Liansong Chengxiang Shangpin Huobi Jingji Kaolue, pp. 79–80. 199 The debate is all about differences in monetary costs for the same ‘utility function’ across different economies. Consumers pay more for the same level of consumption in a more advanced economy where wages are higher than a less advanced economy where wages are lower. Or, wages in a more advanced economy have less purchasing power than their counterpart in a less advanced economy in possessing the same basket of consumer goods. This is the basic principle of utilitarianism. It has been argued that such a divergence in wages leads to different investment strategies which in turn determine different growth trajectories. See e.g. Allen et al., Living Standards; Broadberry and Burhop, ‘Real Wages and Labor Productivity’. 200 Jones, European Miracle, p. 160.
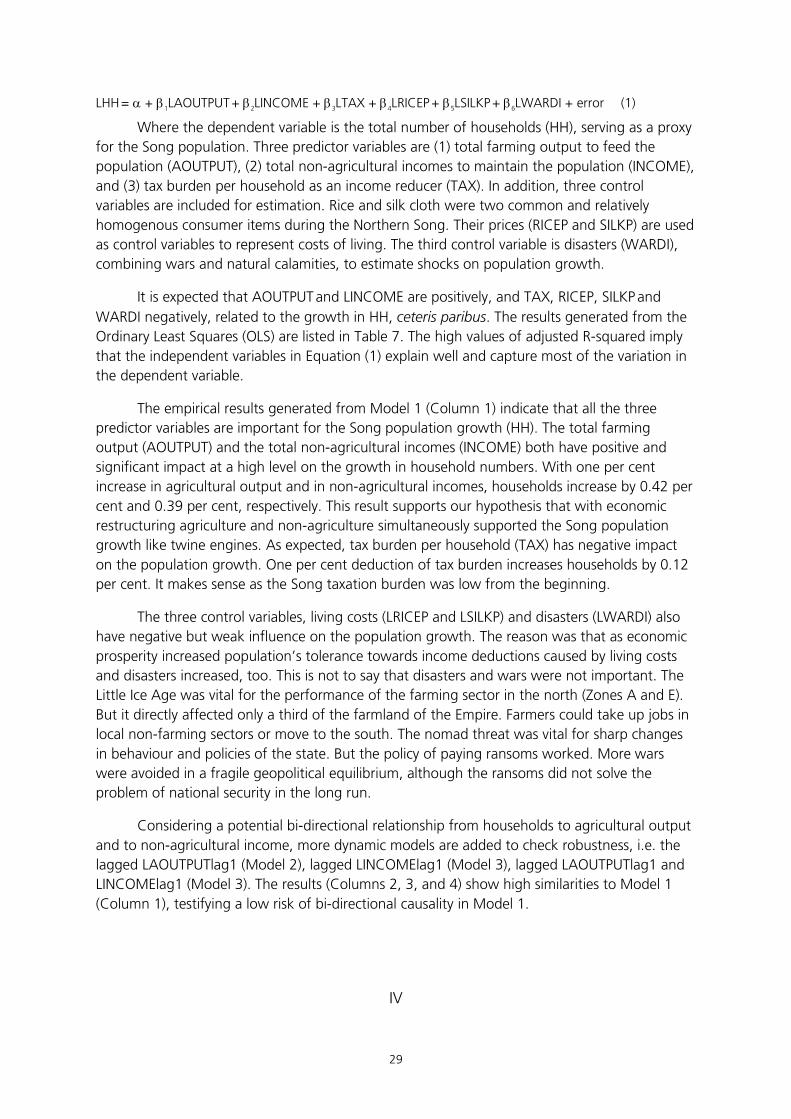
29
LHH = α + β1LAOUTPUT + β2LINCOME + β3LTAX + β4LRICEP + β5LSILKP + β6LWARDI + error (1)
Where the dependent variable is the total number of households (HH), serving as a proxy for the Song population. Three predictor variables are (1) total farming output to feed the population (AOUTPUT), (2) total non-agricultural incomes to maintain the population (INCOME), and (3) tax burden per household as an income reducer (TAX). In addition, three control variables are included for estimation. Rice and silk cloth were two common and relatively homogenous consumer items during the Northern Song. Their prices (RICEP and SILKP) are used as control variables to represent costs of living. The third control variable is disasters (WARDI), combining wars and natural calamities, to estimate shocks on population growth.
It is expected that AOUTPUT and LINCOME are positively, and TAX, RICEP, SILKP and WARDI negatively, related to the growth in HH, ceteris paribus. The results generated from the Ordinary Least Squares (OLS) are listed in Table 7. The high values of adjusted R-squared imply that the independent variables in Equation (1) explain well and capture most of the variation in the dependent variable.
The empirical results generated from Model 1 (Column 1) indicate that all the three predictor variables are important for the Song population growth (HH). The total farming output (AOUTPUT) and the total non-agricultural incomes (INCOME) both have positive and significant impact at a high level on the growth in household numbers. With one per cent increase in agricultural output and in non-agricultural incomes, households increase by 0.42 per cent and 0.39 per cent, respectively. This result supports our hypothesis that with economic restructuring agriculture and non-agriculture simultaneously supported the Song population growth like twine engines. As expected, tax burden per household (TAX) has negative impact on the population growth. One per cent deduction of tax burden increases households by 0.12 per cent. It makes sense as the Song taxation burden was low from the beginning.
The three control variables, living costs (LRICEP and LSILKP) and disasters (LWARDI) also have negative but weak influence on the population growth. The reason was that as economic prosperity increased population’s tolerance towards income deductions caused by living costs and disasters increased, too. This is not to say that disasters and wars were not important. The Little Ice Age was vital for the performance of the farming sector in the north (Zones A and E). But it directly affected only a third of the farmland of the Empire. Farmers could take up jobs in local non-farming sectors or move to the south. The nomad threat was vital for sharp changes in behaviour and policies of the state. But the policy of paying ransoms worked. More wars were avoided in a fragile geopolitical equilibrium, although the ransoms did not solve the problem of national security in the long run.
Considering a potential bi-directional relationship from households to agricultural output and to non-agricultural income, more dynamic models are added to check robustness, i.e. the lagged LAOUTPUTlag1 (Model 2), lagged LINCOMElag1 (Model 3), lagged LAOUTPUTlag1 and LINCOMElag1 (Model 3). The results (Columns 2, 3, and 4) show high similarities to Model 1 (Column 1), testifying a low risk of bi-directional causality in Model 1.
IV

30
What this paper has achieved is to demystify the intricacies of the Song growth and development. It has revealed that the unprecedented population spurt during the Northern Song Period was not a result of a purposely introduced new rice species. Rather, it was a complicated story of shocks, economic restructuring and development, and subsequent population growth. In the process, industry and commerce grew faster than the one per cent population growth rate; farming for staple food matched the population growth, but only just. So, the Northern Song growth was neither ‘surplus-pulled’ nor ‘subsistence-pushed’ as commonly believed. Rather, this is predominantly a story of ‘demand-driven backward linkages’.
The Northern Song paradox is all about spectacular incompetence in national security leading to epic economic prosperity. The prime mover for the Song growth and development was the mounting geopolitical pressure from nomads who decided to exert their military supremacy to milk cash and luxuries from the Northern Song economy. Such specific demand did two things to Song China. First, it created a pressing fiscal emergency for the Song state to amass the cash and luxuries. Second, to get cash and luxuries activated a dormant market economy as well as Chinese creativity. A chain reaction of backwards linkages soon began, leading to economic re-structuring. Here, the role of the state and the market orientation of the Song economy were both decided by the quality and quantity of the ransoms. There could be three other realistic scenarios: the nomads could have demanded, say, staple food and slaves instead; the Song state could have surrendered to the nomads at the beginning; and the Song military could have been overhauled and defeated the enemy. Any of them would have made the Song economic landscape look very different.
All the time, the economic restructuring was a freestanding factor independent from the population increase.201 The Little Ice Age did little to transform the Song economic structure. At best, the climate change helped Song China reach an existing production possibility frontier with the diffusion of winter-wheat at the time when the Song farmers were fully able to produce enough food during the climate change without Champa Rice or even without winter-wheat. Of course, the climate change caused the life in the Steppes to deteriorate. But it did not automatically justify nomads’ wars against China. During the Northern Song Period, arable land was abundant in all zones; and the monad population small. If enough nomads had had decided to be ‘sinicised’, immigrate, settle in and become farmers, as a great many Khitans did after 1127,202 the Song economic landscape would have looked very different, too.
Consequently, with the economic restructuring, China’s production possibility frontier shifted outwards, exuberant non-farming sectors became increasingly significant in the economy, and individuals’ incomes increased and diversified. So, after deductions (e.g. taxation and securities), enough was left to be funnelled to support one per cent growth in population. This virtuous growth spiral was not intended when the Northern Song began in 960 AD.
201 This fundamentally contracts North and Thomas’ view on how better institutions were created under population pressure; see North and Thomas, Rise of the Western World, ch. 3. 202 The Khitan Jin boasted to have 6.15 million households and 1.69 million qing of farmland (as in 1183); and its official policy of the Khitan Jin was stated as ‘tilling and weaving as the foundation of the economy’ (in 1189); see Tuo, Jin Shi, ‘Shihuo 1’. The Jin official land allocation was 100 mu for each poll-taxpayer in a land abundant region, and 10 mu for each poll-taxpayer in a land scarce region; see Tuo, Jin Shi, ‘Shihuo 2’. Also see Deng, Chinese Premodern Economy, ch. 6.
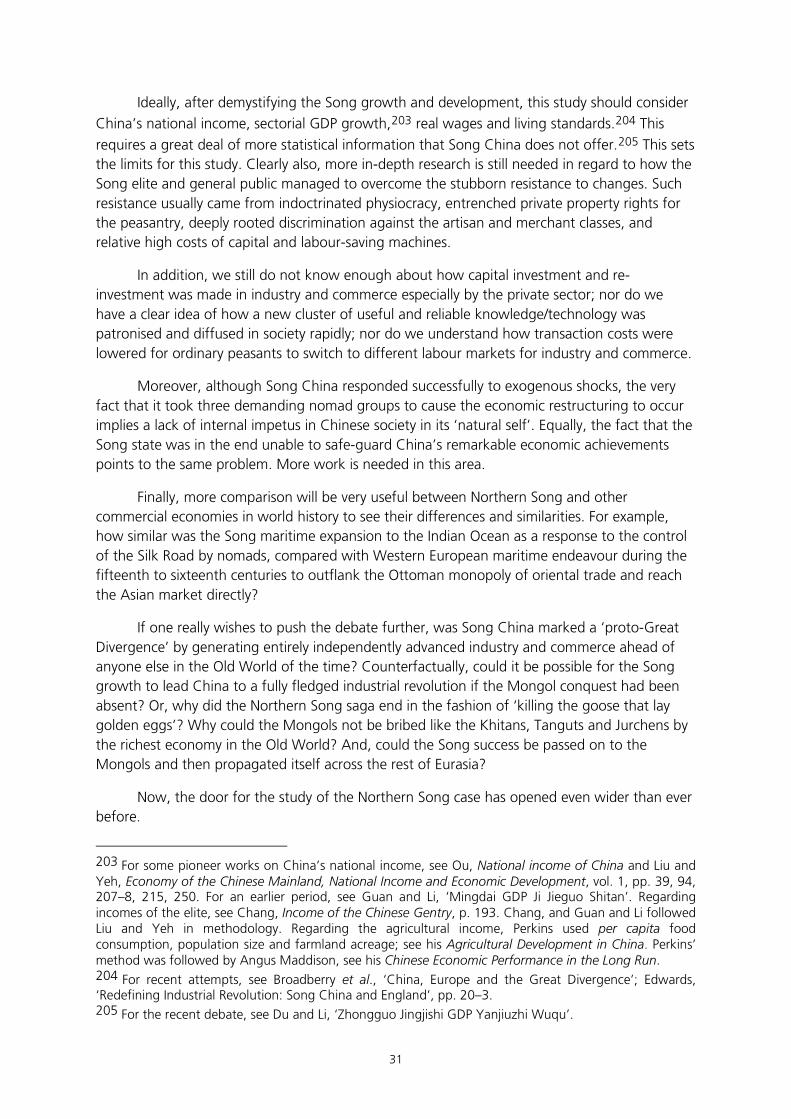
31
Ideally, after demystifying the Song growth and development, this study should consider China’s national income, sectorial GDP growth,203 real wages and living standards.204 This requires a great deal of more statistical information that Song China does not offer.205 This sets the limits for this study. Clearly also, more in-depth research is still needed in regard to how the Song elite and general public managed to overcome the stubborn resistance to changes. Such resistance usually came from indoctrinated physiocracy, entrenched private property rights for the peasantry, deeply rooted discrimination against the artisan and merchant classes, and relative high costs of capital and labour-saving machines.
In addition, we still do not know enough about how capital investment and re-investment was made in industry and commerce especially by the private sector; nor do we have a clear idea of how a new cluster of useful and reliable knowledge/technology was patronised and diffused in society rapidly; nor do we understand how transaction costs were lowered for ordinary peasants to switch to different labour markets for industry and commerce.
Moreover, although Song China responded successfully to exogenous shocks, the very fact that it took three demanding nomad groups to cause the economic restructuring to occur implies a lack of internal impetus in Chinese society in its ‘natural self’. Equally, the fact that the Song state was in the end unable to safe-guard China’s remarkable economic achievements points to the same problem. More work is needed in this area.
Finally, more comparison will be very useful between Northern Song and other commercial economies in world history to see their differences and similarities. For example, how similar was the Song maritime expansion to the Indian Ocean as a response to the control of the Silk Road by nomads, compared with Western European maritime endeavour during the fifteenth to sixteenth centuries to outflank the Ottoman monopoly of oriental trade and reach the Asian market directly?
If one really wishes to push the debate further, was Song China marked a ‘proto-Great Divergence’ by generating entirely independently advanced industry and commerce ahead of anyone else in the Old World of the time? Counterfactually, could it be possible for the Song growth to lead China to a fully fledged industrial revolution if the Mongol conquest had been absent? Or, why did the Northern Song saga end in the fashion of ‘killing the goose that lay golden eggs’? Why could the Mongols not be bribed like the Khitans, Tanguts and Jurchens by the richest economy in the Old World? And, could the Song success be passed on to the Mongols and then propagated itself across the rest of Eurasia?
Now, the door for the study of the Northern Song case has opened even wider than ever before.
203 For some pioneer works on China’s national income, see Ou, National income of China and Liu and Yeh, Economy of the Chinese Mainland, National Income and Economic Development, vol. 1, pp. 39, 94, 207–8, 215, 250. For an earlier period, see Guan and Li, ‘Mingdai GDP Ji Jieguo Shitan’. Regarding incomes of the elite, see Chang, Income of the Chinese Gentry, p. 193. Chang, and Guan and Li followed Liu and Yeh in methodology. Regarding the agricultural income, Perkins used per capita food consumption, population size and farmland acreage; see his Agricultural Development in China. Perkins’ method was followed by Angus Maddison, see his Chinese Economic Performance in the Long Run. 204 For recent attempts, see Broadberry et al., ‘China, Europe and the Great Divergence’; Edwards, ‘Redefining Industrial Revolution: Song China and England’, pp. 20–3. 205 For the recent debate, see Du and Li, ‘Zhongguo Jingjishi GDP Yanjiuzhi Wuqu’.

32
Appendix
The time series examined cover the period from 997 to 1111 due to data availability. The time series has 38/39 observation points with intervals of three years apart. All the prices are converted to a 997 constant price when applicable.206 The original data are often patchy, but well spread out across the 997–1111 period. The missing data are linearly interpolated and, only occasionally, extrapolated.
Regarding the dependent variable (HH), there are 18 entries directly from historical sources. We use two compilations of historical records: Liang’s Zhongguo Lidai Huko Tiandi Tianfu Tongji and Wu’s Zhongguo Renkoushi. The value of the total farming output (AOUTPUT) is obtained from the total farmland multiplied by the average yield level per mu. The data for farmland come from the Song cadastral surveys in 996, 1021, 1067 and 1083, cited in Tuo’s Song Shi (vol. 173, ‘Shihuozhi 126’), Liang’s Zhongguo Lidai Huko Tiandi Tianfu Tongji, Qi’s Songdai Jingjishi and Cheng’s Songdai Diyu Jingji. The yield level is region-weighted as discussed earlier (i.e. 1.7 Song shi per Song mu before circa 1000 AD and 2.2 Song shi per Song mu after 1000 AD). This range is very modest.207 Modern estimates of Song farmland are not used due to their tendency to assume that the Song acreage went up all the time, simply untrue in reality. Moreover, those estimates are overwhelmingly derived from the Song population per se,208 an approach that is highly vulnerable to endogeneity.
The value of non-agricultural incomes (INCOME) is derived from the commercial tax rate (5 per cent) and the government non-agricultural tax revenues. Eight government fiscal reports are available (for 996, 1021, 1058, 1063, 1065, 1069, 1078, and 1086). Our sources are Liang’s Zhongguo Lidai Huko Tiandi Tianfu Tongji. Regarding the tax rate, we use Tuo’s Song Shi (vol. 173, ‘Shihuozhi 126’, and vol. 186, ‘Shihuozhi 139’), Wang’s Liangsong Caizheng Shi, Li’s ‘Luexi Songdai Guanshizhi Zheng’, and Guo’s Liansong Chengxiang Shangpin Huobi Jingji Kaolue. Undoubtedly, extra revenue could be extracted if the taxman collected more than five per cent of goods’ value. On the other hand, Zone D was tax-free, and tax evasion was widespread in other zones, which led to the radical reforms of Wang Anshi (1021–86). So, over-taxation and tax aversion/haven could cancel each other to a great extent.
The value of tax burden per household (TAX) is calculated from tax payments in goods and cash, divided by the total households. Apart from the eight entries for the government non-agricultural revenues in cash, there are six official figures for agricultural revenues collected in foods (996, 1021, 1063, 1065, 1078, and 1086), and another six in silk (996, 1021, 1063, 1065, 1078, and 1086). Our sources are Liang’s Zhongguo Lidai Huko Tiandi Tianfu Tongji and Wang’s Liangsong Caizheng Shi. Food and silk are then converted to the period market value 206 Price conversion is based on Peng, Zhongguo Huobi Shi, p. 505; Guo, ‘Songchaode Wujia Biandong Yu Jizang Lunzui’, p. 72; Qi, Songdai Jingjishi, vol. 2, pp. 1104–7. For multiple currencies and exchange rates, see Guo, Liansong Chengxiang Shangpin Huobi Jingji Kaolue, pp. 287–321, 331. 207 Note: During the Ming-Qing Period (1368–1911), the same nominal output levels, i.e. 1–2 shi per mu, were cited; see Buck, Land Utilization in China, p. 209; Li, Duoshijiao Kan Jiangnan Jingjishi, pp. 298–9; Wu, Zhongguo Jingjishi Ruogan Wentide Jiliang Yanjiu, pp. 142–4; Shi, ‘Shijiu Shiji Shangbanqide Zhongguo Liangshi Muchanliang Ji Zongchanliang Zaiguji’, pp. 57, 61. But one Qing shi per Qing mu = 1.6 Song shi per Song mu. 208 Qi Xia’s estimate is 720 million mu for 1110; see his Songdai Jingjishi, vol. 1, pp. 59–60. If true, the entire Song workforce would have to do one thing only: to farm. And food would have become much cheaper. Qi clearly mistook the Song for the Ming-Qing.

33
for uniformity. The food and silk prices come from Cheng’s Songdai Wujia Yanjiu and Yu’s Zhongguo Jiage Shi.
Information of prices of rice and silk for living costs (RICEP, SILKP) comes from Cheng’s Songdai Wujia Yanjiu, Guo’s ‘Songchaode Wujia Biandong Yu Jizang Lunzui’, and Yu’s Zhongguo Jiage Shi. In all, 16 rice prices are collected (996, 1003, 1009, 1029, 1042, 1053, 1069, 1075, 1080, 1086, 1088, 1094, 1099, 1108, and 1110). Ten silk prices are obtainable (1000, 1016, 1046, 1063, 1070, 1079, 1086, 1101, 1103 and 1107). All the information is from anecdotes, not market surveys; but it is as good as one can probably get.
Data for wars and natural disasters (WARDI) are derived from various records. Floods, storms, locust outbreaks, and communicable plagues are used as proxies for natural disasters. Our sources are Fu et al.’s Zhongguo Junshi Shi, Lidai Zhanzheng Nianbiao, Xia and Song et al.’s Zhongguo Gudai Ziran Zaiyi Dongtao Fenxi.
The final line-up is in Table 8.

34
Table 8. Time-Series Dataset
Year Households A-output Non A-income Tax R-price S-price W/D 997 1000 1003 1006 1009 1012 1015 1018 1021 1024 1027 1030 1033 1036 1039 1042 1045 1048 1051 1054 1057 1060 1063 1066 1069 1072 1075 1078 1081 1084 1087 1090 1093 1096 1099 1102 1105 1108 1111
4574257 5719209 6864160 7417570 8402537 8412470 8422403 8545276 8677677 9898121 10030405 10162689 10296565 10663027 10179989 10307640 10682947 10723695 10747954 10792705 10825580 11091112 12462317 14181485 14414043 15091560 15684529 16402631 16730504 17211713 17957092 18655093 19120921 19435570 19715555 20264307 20456273 20648238 20882258
531292712.5 561000000 794942937.8 845956630.2 900244017.2 959868841.8 1019493666 1107645339 1154527950 1145716209 1132699506 1119682802 1098440741 1085889435 1077601675 1065288486 1053115991 1041082588 1033136804 1021331689 1001955497 990506677.6 982946899 968000000 973830886.6 982643140.6 991535135.8 1000507596 1006534296 1015642320 1037695870 1075521066 1098874819 1122735673 1138930058 1163660667 1189202604 1214744538 1232236729
2.4E+11 2.64984E+11 2.92568E+11 3.23025E+11 3.56651E+11 3.9378E+11 4.3477E+11 4.80029E+11 5.3E+11 5.44702E+11 5.59813E+11 5.75342E+11 5.91302E+11 6.07705E+11 6.24563E+11 6.41889E+11 6.59695E+11 6.77996E+11 6.96803E+11 7.16133E+11 7.36E+11 7.96991E+11 8.63037E+11 9.34555E+11 1.012E+12 1.04708E+12 1.08338E+12 1.12094E+12 1.15979E+12 1.2E+12 9.6E+11 9.68607E+11 9.77291E+11 9.86054E+11 9.94894E+11 1.00381E+12 1.01281E+12 1.02189E+12 1.03106E+12
3457.22267 2828.411036 2409.373136 2275.00168 2050.420468 2093.327858 2136.133886 2170.090024 2170.465091 1863.031732 1790.953432 1720.751436 1646.211746 1569.919802 1859.466838 2334.660459 3073.791938 2564.027214 2320.899075 2062.041732 4832.942321 4791.557818 4314.032491 4160.036419 4123.493713 2175.776882 1272.13729 832.7358763 804.9506367 782.5216653 3193.425194 2004.352768 1587.31024 1326.963131 1207.070243 1085.88359 1065.377429 1045.252609 1060.446705
300 475 650 515 380 415 450 503 533 563 615 667 745 794 829 885 978 1080 1154 1275 1093 997 938 829 780 990 1200 1633 2067 1344 620 865 870 815 760 980 1090 1200 1200
1013 971 929 895 862 831 800 954 1042 1138 1310 1482 1848 2109 2303 2629 3000 2565 2310 1975 1520 1300 1300 1300 1300 1300 1300 1300 1300 1550 1800 1588 1473 1367 1300 1400 1450 1500 2000
248 0 55 29 33 0 50 28 10 6 0 30 20 10 6 12 20 13 5 13 31 10 6 5 21 17 37 34 7 27 23 12 12 11 13 11 0 24 2
Note: The original data available are fragmentary with gaps in between. Such gaps are filled with figures derived from the existing data with a linear growth rate. A-output = Agricultural output; Non A-income = non-agricultural income; R-price = Rice price; S-price = Silk cloth price; W/D = Wars and natural disasters. Source: See the body of text in Appendix.

35
References
Allen, Robert, Tommy Bengtsson and Martin Dribe (eds), Living Standards in the Past, New Perspectives on Well-Being in Asia and Europe (Oxford, 2005).
Bao Weimin, Songdai Difang Caizhengshi Yanjiu (A History of Local Finance during the Song Period) (Shanghai, 2001).
Braudel, Fernand, The Wheels of Commerce: Civilisation and Capitalism 15th–18th Century (New York, 1981–84)
Broadberry, Stephen and Carsten Burhop, ‘Real Wages and Labor Productivity in Britain and Germany, 1871–1938’, The Journal of Economic History, 70/2 (2010): pp. 400–27.
---, Hanhui Guan and Daokui Li, ‘China, Europe and the Great Divergence, a Study in Historical National Income Accounting’, Conference paper for the XVI WEHC, Stellenbosch, 2012.
Buck, John L., Land Utilization in China, Statistics (London, 1937).
Campbell, Bruce, ‘The Agrarian Problem in the Early Fourteen Century’, Past and Present, 188 (August 2005), pp. 3–70.
Cao Guanyi, Zhongguo Nongye Jingjishi (An Agricultural Economic History of China) (Beijing, 1989).
Cao Keping, ‘Jiangxi Wannian Xianrendong Yicun Zaiyanjiu Ji Zhongguo Daozuo Nongye Qiyuan Xin Renshi’ (Re-examination of Remains of the 10,000 Year Old Cave of Immortals in Jiangxi and the New Insight into the Origin of Rice Farming in China), Dongnan Wenhua (South-eastern Culture), 3 (1998), pp. 25–31.
Cao Shuji (ed.), ‘He Pu Jiaoshi’ (Annotated Thesaurus of Rice), Zhongguo Nongshi (Agricultural History of China), 3 (1985), pp. 74–84.
Chang, Chung-li, The Income of the Chinese Gentry (Seattle, 1962).
Chao, Kang, Man and Land in Chinese History: An Economic Analysis (Stanford, 1986).
Chayanov, A. V., The Theory of Peasant Economy (1925. Reprint. Madison, 1986).
Chen Chun and Zheng Jianming, ‘Daozuo Qiyuande Kaogu Tansuo’ (Archaeological Discoveries of the Origin of Rice Cultivation), Fudan Xuebao (Research Bulletin of Fudan University), 4 (2005), pp. 126–31.
Chen Fangming, ‘Songchu Mibinglunde Jiantao’ (Assessment of the Debate on Disarmament in Early Song Times), in SYBX, ed., Songshi Yanjiu Ji (Selected Essays on Song History), vol. 9 (1977), pp. 63–98.
Chen Fu, Chenfu Nongshu (Chen Fu’s Treatise on Agriculture) (1149 AD. Reprint. Beijing, 1956).
Chen Gaohua and Wu Tai, Songyuan Shiqide Haiwai Maoyi (China’s Maritime Trade during the Song and Yuan Periods) (Tianjin, 1981).

36
Cheng Minsheng, Songdai Diyu Jingji (Regional Economies during the Song Period) (Zhengzhou, 1992).
Cheng Minsheng, ‘Songdaide Gongzhai’ (Public Debts during the Song Period), Zhongguoshi Yanjiu (Study of Chinese History), 3 (2006), pp. 111–5.
---, Songdai Wujia Yanjiu (Research into Song Commodity Prices) (Beijing, 2009).
Deng Duanben (ed.), Guangzhou Gangshi (A History of Port Guangzhou) (Beijing, 1986).
Deng, Gang, Chinese Maritime Activities and Socioeconomic Development, c. 2100 B.C. – 1900
A.D. (London and New York, 1997).
---, Development versus Stagnation: Technological Continuity and Agricultural Progress in Premodern China (New York and London, 1993).
---, Maritime Sector, Institutions, and Sea Power of Premodern China (London and New York, 1999).
---, The Chinese Premodern Economy – Structural Equilibrium and Capitalist Sterility (London, 1999).
Deng, Kent, “Unveiling China’s True Population Statistics for the Pre-Modern Era with Official Census Data”, Population Review, 43/2 (2004), pp. 1–38.
Du Wenyu, ‘Tang Song Jingji Shili Bijiao Yanjiu’ (A Comparison of Economic Strength between the Tang and Song Periods), Zhongguo Jingjishi Yanjiu (Research in Chinese Economic History), 4 (1998), pp. 37–52.
Du Xuncheng and Li Jin, ‘Zhongguo Jingjishi GDP Yanjiuzhi Wuqu’ (Pitfalls for GDP Studies in Chinese Economic History’, Xueshu Yuekan (Academics Monthly), 10 (2011), pp. 74–81.
Duan Jixian, Zhongguo Renkou Zaoshi Xinlun (New Theory of China’s Historical Demography) (Beijing, 1999).
Durand, J. D., ‘The Population Statistics of China, A.D. 2–1953’, Population Studies, 13/3 (1960), pp. 209–57.
Ebrey, Patricia B, The Cambridge Illustrated History of China (Cambridge, 1999).
---, Anne Walthall, and James Palais, East Asia: A Cultural, Social, and Political History (Boston, 2006).
Edwards, Ronald, ‘Redefining Industrial Revolution: Song China and England’, working paper, online: https://editorialexpress.com/cgi-bin/conference/download.cgi
Elvin, Mark, The Pattern of the Chinese Past (Stanford, 1973).
---, and Liu, Ts’ui-jung (eds), Sediments of Time, Environment and Society in Chinese Society (Cambridge, 1998).
Fan Yuzhou, ‘Jiangnan Diqude Shiqian Nongye’ (Pre-historical Farming in the Lower Yangzi Region), Zhongguo Nongshi (Agricultural History of China), 2 (1995), pp. 1–8.

37
Fang Hao, ‘Songdai Heliu Qianxi Yu Shuili Gongcheng’ (Changes of River Courses and Flood Control Works during the Song Period), in SYBX, ed., Songshi Yanjiu Ji (Selected Essays on Song History), vol. 2 (1964), pp. 255–82.
---, ‘Songdai Sengtu Dui Zaoqiaode Gongxian’ (Monks’ Contribution to Bridge Construction during the Song Period), in SYBX, ed., Songshi Yanjiu Ji (Selected Essays on Song History), vol. 13 (1981), pp. 231–58.
Flohn, Hermann (ed.), World Survey of Climatology, vol.2, General Climatology (New York, 1969).
Fu Zhongjia, Zhang Xing, Tian Zhaolin and Yang Boshi, Zhongguo Junshi Shi, Lidai Zhanzheng Nianbiao, Xia (A Military History of China, Volume of Chronicle of Wars, II) (Beijing, 1986).
Gao Congming, ‘Lun Songdai Huobi Liutongzhongde Jige Guanxi’ (On Economic Links in Monetary Circulation during the Song Period), Zhongguo Jingjishi Yanjiu (Research in Chinese Economic History), 2 (1998), pp. 89–97.
---, Songdai Huobi Yu Houbi Liutong Yanjiu (Currencies and Their Circulation in the Song Period) (Baoding, 2000).
Gao Wangling, ‘Zhongguo Chuantong Jingjide Fazhan Xulie’ (Developmental Sequence in China’s Traditional Economy), Shixue Lilun Yanjiu (Study of Historiography), 3 (1994), pp. 69–80.
Ge Jianxiong, Zhongguo Renkou Fazhanshi (A History of Chinese Demography) (Fuzhou, 1991).
Ge Jinfang, ‘Liangsong Tanding Rumu Qushi Buzheng’ (Evidence for the Conversion of the Poll Tax to the Land-Poll Combined Tax in Song Times), Jinan Xuebao (Bulletin of Jinan University), 3 (1991), pp. 63–8.
Ge Jingfang, Song Liao Xia Jin Jingji Yanxi (Analysis of the Song, Liao, Xia, Jin Economies) (Wuhan, 1991).
--- and Gu Rong, ‘Songdai Jiangnan Diqude Liangshi Muchan Jiqi Gusuan Fangfa Bianxi’ (Estimation and Evidence of Yield Level in the Lower Yangzi Region during the Song Period), Hubei Daxue Xuebao (Bulletin of the University of Hubei), 3 (2000), pp. 78–83.
Geelan, P. J. M. and D. C. Twitchett (eds.), The Times Atlas of China (London, 1974).
Gong Zhen, Xiyang Fanguo Zhi (Journeys to Foreign Countries in the Indian Ocean) (Ming Dynasty. Reprint. Beijing, 1961).
Guan Hanhui and Li Daokui, ‘Mingdai GDP Ji Jieguo Shitan’ (GDP of Ming China and Its Structure), Jingjixue (Economics), 9/3 (2010), pp. 787–828.
Gumilev, L. N., Searches for an Imaginary Kingdom. Translated by R. E. F. Smith. (Cambridge, 1987).

38
Guo Dongxu, ‘Songchaode Wujia Biandong Yu Jizang Lunzui’ (Price Fluctuations and Judiciary Punishment on Stolen Goods), Zhongguo Jingjishi Yanjiu (Research in Chinese Economic History), 1 (2004), pp. 69–75.
Guo Zhengzhong, Liansong Chengxiang Shangpin Huobi Jingji Kaolue (The Rural and Urban Commercial and Cash Economy of the Northern and Southern Song Periods) (Beijing, 1997).
H and D (Haijun Haiyang Cehui Yanjiusuo and Dalian Haiyun Xueyuan Hanghaishi Yanjiushi [Naval Institute of Ocean Cartography and Department of Maritime History, and Dalian Sea Transportation Institute]) (eds.), Xinbian Zhenghe Hanghai Tuji (A New Compilation of the Navigation Chart of Zheng He’s Voyages) (Beijing, 1988).
Hartwell, Robert M., ‘A Cycle of Economic Change in Imperial China: Coal and Iron in Northwest China, 750–1350’, Journal of the Economic and Social History of the Orient, 10/1 (1967), pp. 102–59.
---, ‘A Revolution in the Chinese Iron and Coal Industries during the Northern Sung, 960–1126 A.D.’ Journal of Asian Studies, 21/1 (1962), pp. 153–62.
---, Iron and Early Industrialism in Eleventh-Century China (Chicago, 1963).
---, ‘Markets, Technology, and the Structure of Enterprise in the Development of the Eleventh–Century Chinese Iron and Steel Industry’, Journal of Economic History, 26/1 (1966), pp. 29–58.
He Hui, Songdai Xiaofei Shi (A History of Consumption during the Song Period) (Beijing, 2010).
Ho, Ping-ti, ‘Early-Ripening Rice in Chinese History’, Economic History Review, 9/2 (1956), pp. 200–18.
Hobson, John M., The Eastern Origins of Western Civilisation (Cambridge, 2004).
Hu Huanyong and Zhang Shanyu, Zhongguo Renkou Dili (Demographic Geography of China) (Shanghai, 1986).
Hu Xiami (Hamilton H. Lindsay), ‘A-meishide Hao 1832 Nian Shanghai Zhixin Jishi’ (Travels on the Amherst to the Shanghai Region in 1832), in Shanghaishi Yanjiu Luncong (Selected Works on History of Shanghai) (Shanghai, 1989), pp. 270–80.
Hu Xiaopeng, Zhongguo Shougongye Jingji Tongshi, Song Yuan Juan (A General Economic History of Handicraft Industry in China, the Song and Yuan Periods) (Fuzhou, 2004).
Hua Shan, Songshi Lunji (Collected Essays on Song History) (Jinan, 1982).
Huang, Phillip, The Peasant Economy and Social Change in North China (Stanford, 1985).
Ji Xianlin, Zhetang Shi (A History of Sugarcane Sugar) (Beijing, 2007).
Jia Sixie, Qimin Yaoshu (Essential Techniques for the Peasantry) (c. 534 AD. Reprint. Beijing, 1985).

39
Jiang Tao, Renkou Yu Lishi (Population and History) (Beijing, 1998).
Jones, Eric L., Growth Recurring: Economic Change in World History (Oxford, 1988).
---, The European Miracle (Cambridge, 1981).
---, ‘The Real Question about China: Why Was the Song Economic Achievement Not Repeated?’ Australian Economic History Review, 30/2 (1990), pp. 5–22.
Kang Baoling, Beisong Wenhua Zhongxin Yanjiu (Cultural Centre during the Northern Song Period) (Beijing, 2011).
Kearny, H. F., ‘Arnold Toynbee; Challenge and Response’, University Review, 1/4 (1955), pp. 33-41.
Kong Qingfeng, ‘Jianlun Zhongtang Yilai Chuantong Nongyede Yaosu Shengchanlü’ (Factor Productivities of Traditional Agriculture since the Mid-Tang Period), Wen Shi Zhe (Literature, History and Philosophy), 6 (2006), pp. 100–107.
Landes, David, The Wealth and Poverty of Nations (London, 1998).
Lewis, Arthur, ‘Economic Development with Unlimited Supplies of Labour’, The Manchester School, 22/2 (1954), pp. 139–91.
Li Ao, Xu Zizhi Tongjian Changbian (Enlarged Comprehensive References for State Management) (1183. Reprint. Beijing, 1956).
Li, Bozhong, Duoshijiao Kan Jiangnan Jingjishi (Multiple Approaches to Economic History of the Yangzi Delta) (Beijing, 2003).
---, ‘Rengen Shimu Yu Mingqing Jiangnan Nongminde Jingying Guimo’ (The Practice of Ten Mu per Farmer and the Scale of the Traditional Peasant Economy), Zhongguo Nongshi (Agricultural History of China), 1 (1996), pp. 1–14.
---, ‘Sibo Yixin Songdai Jiangnan Jingjishi Yanjiu Pingjie’ (Review of Yoshinobu Shiba’s Studies of the Economic History of Jiangnan in the Song Period), Zhongguo Jingjishi Yanjiu (Research in Chinese Economic History), 4 (1990), pp. 146–59.
---, ‘Songmo Zhi Mingchu Jiangnan Nongmin Jingyingde Bianhua’ (Changes in the Peasant Economy in the Lower Yangzi Region from Late Song to Early Ming Times), Zhongguo Nongshi (Agricultural History of China), 2 (1998), pp. 30–9.
---, Tangdai Jiangnan Nongyede Fazhan (Development of Jiangnan Agriculture during the Tang Period) (Beijing, 1990).
---, ‘Xuanjing, Jicui Yu Songdai Jiangnan Nongye Geming’ (Sampling Methods and the Agricultural Revolution in the Lower Yangzi), Zhongguo Shehui Kexue (Social Sciences in China), 1 (2000), pp. 177–92.

40
Li Genpan, ‘Changjiang Xiayou Daomai Fuzhongzhide Xingcheng He Fazhang’ (Formation and Development of the Rice-Wheat Multi-cropping System in the Low Yangzi Reaches), Lishi Yanjiu (Study of History), 5 (2002), pp. 3–28.
Li Jiannong, Zhongguo Gudai Jingjishi Gao (A Drafted Economic History of Premodern China) (Wuhan, 2005).
Li Ruoyu, ‘Tongqian Yu Zhongguo Lidai Fengjian Wangchaode Caizheng Jingji’ (Bronze Currency and the Fiscal State in Premodern China), Zhongguo Jingjishi Yanjiu (Research in Chinese Economic History), 1 (1991), pp. 76–94.
Li Xiao, Songchao Zhengfu Guomai Zhidu Yanjiu (Government Procurement System of the Song) (Shanghai, 2007).
Li Zhaochao, ‘Luexi Songdai Guanshizhi Zheng’ (Commercial Taxes under the Song), Jingji Kexue (Economic Sciences), 5 (1991), pp. 70–6.
Liang Fangzhong, Zhongguo Lidai Huko Tiandi Tianfu Tongji (Dynastic Data for China’s Households, Cultivated Land and Land Taxation) (Shanghai, 1980).
Liang Gengyao, Nansongde Nongcun Jingji (The Rural Economy in the Southern Song Period) (Beijing, 2006).
Lin Chengkun, ‘Changjiang Qiantanjiang Zhongxiayou Diqu Xinshiqi Shidai Dili Yu Daozuode Qiyuan He Fenbu’ (The Origin and Geographic Distribution of Rice Cultivation during the Neolithic Period in the Middle and Lower Reaches of the Yangzi and Qiantang Rivers), Nongye Kaogu (Agricultural Archaeology), 1 (1987), pp. 283–91.
Lin Tianwei, Songdai Xiangyao Maoyi Shi (A History of Spice, Perfume and Pharmaceutical Trade during the Song Period) (Taipei, 1986).
Lin Wenxun, Tang Song Shehui Biange Lungang (Outline of Social Changes during the Tang-Song Era) (Beijing, 2011).
Liu, Guanglin, “Song China’s Water Transport Revolution Revisited”, Pacific Economic Review, 17/1 (2012), pp. 57–85.
Liu, Ta-chung and Kung-chia Yeh. The Economy of the Chinese Mainland: National Income and Economic Development, 1933–1959 (Santa Monica, 1963).
Liu Sen, ‘Songdaide Tieqian Yu Tie Chanliang’ (Iron Coins and Iron Outputs during the Song Period), Zhongguo Jingjishi Yanjiu (Research in Chinese Economic History) 2 (1993), pp. 86–90.
---, Songjin Zhibishi (A History of Paper Currencies during the Song and Jin Periods) (Beijing, 1993).
Loehle, Craig, ‘A 2000-Year Global Temperature Reconstruction Based on Non-Treering Proxies’, Energy and Environment, 7–8/18 (2007), pp. 1048–58.

41
Long Denggao, ‘Songdai Liangjia Fenxi’ (Food Prices in the Song Period), Zhongguo Jingjishi Yanjiu (Research in Chinese Economic History), 1 (1993), pp. 151–60.
Luo Bingliang, Songshi Pieshi (A Glance at the Song History) (Beijing, 2011).
Ma Duanlin, Wenxian Tongkao (Comprehensive Study of Historical Records) (Publisher unknown, 1307 AD).
Ma Huan, Yingya Shenglan (Tours to Great Sites Overseas) (1451. Reprint. Beijing, 1955). Also, Ma Huan, Ying-yai Sheng-lan: An Overall Survey of the Oceanic Shores [1433], translated by J. V. G. Mills (Cambridge, 1970).
Ma Yuchen, ‘Songdai Jiating Guimo Zai Tuisuan’ (Re-estimation of the Family Size during the Song Period), Zhongguo Shehui Jingjishi Yanjiu (Study of Chinese Social and Economic History), 4 (2008), pp. 36–41.
Maddison, A., Chinese Economic Performance in the Long Run (Paris, 1998).
Malthus, T. R., An Essay on Population (London, 1914).
Mao Zhixiang, Songchaode Duiwai Jiaowang Geju (Pattern of the Song Diplomacy) (Yangzhou, 2012).
Mokyr, Joel, The Lever of Riches (Oxford, 1990).
Needham, Joseph, Science and Civilisation in China (Cambridge, 1954–2008).
Neue, Heinz-Ulrich, ‘Methane Emission from Rice Fields’, BioScience, 43/7 (1993), pp. 466–73.
North, D. C., Structure and Change in Economic History (New York and London, 1981).
--- and R. P. Thomas, The Rise of the Western World, A New Economic History (Cambridge, 1973).
Ou Pao-san, National income of China, 1933, 1936 and 1946 (Nanking, 1947).
Ouyang Xiu, Ouyang Xiu Quanji (The Collected Works of Ouyang Xiu) (Beijing, 1986).
---, Xin Tangshu (The New History of the Tang Dynasty), vol. 54, in Er-shi-wu Shi (or ESWS, Twenty-Five Official Histories) (1060. Reprint. Shanghai, 1986).
Peng Xinwei, Zhongguo Huobi Shi (A History of Currencies in China) (Shanghai, 1965).
Perkins, Dwight, Agricultural Development in China, 1368–1968 (Edinburgh, 1969).
Pomeranz, Kenneth, The Great Divergence, Europe, China and the Making of the Modern World Economy (Princeton, 2000).
Population Census Office of the State Council of the People’s Republic of China and the Institute of Geography of the Chinese Academy of Sciences (eds), Population Atlas of China (Hong Kong and Oxford, 1987).
Qi Xia, Songdai Jingjishi (An Economic History of the Song) (Shanghai, 1987).

42
---, ‘Songdai Shehui Shengchanlide Fazhan Jiqizai Zhongguo Gudai Jingji Fazhan Guochengzhongde Diwei’ (Productivity Increase in Song Times and Its Importance in China’s Premodern Economic Growth), Zhongguo Jingjishi Yanjiu (Research in Chinese Economic History), 1 (1986), pp. 29–52.
Qiao Youmei, ‘Lun Songdai Wujia Yu Huobide Guanxi’ (Relationship between Prices and Currency during the Song Period), Zhongguo Jingjishi Yanjiu (Research in Chinese Economic History), 9 (1992), pp. 117–27.
Quan Hansheng, ‘Tang Song Zhengfu Suiru Yu Hubi Jingjide Guanxi’ (Relationship between Government Revenues and the Cash Economy), in Academia Sinica (ed.), Guoli Zhongyang Yanjiuyuan Lishi Yuyan Yanjiusuo Jikan (Bulletin of the Institute of History and Linguistics, Academia Sinica), 20 (1948), pp. 189–220.
Schneider, Stephen H. and Mass, Clifford, ‘Volcanic Dust, Sunspots, and Temperature Trends’, Science, 190/4216 (1975), pp. 741–6.
Shen Fuwei, ‘Zhenghe Baochuanduide Dongfei Hangcheng’ (Zheng He’s Treasure Fleet and Its Voyages to the Eastern African Coast), in Institute of Maritime History of China, ed., Zhenghe Xia Xiyang Lunwen Ji (Selected Works on Zheng He’s Voyages in the Indian Ocean) (Beijing, 1985), pp. 166–83.
Shen Kuo (Shen Gua), Mengxi Bitan (Notes of Dreams) (1095. Reprint. Beijing, 1975).
Shi Hejin, ‘Tangsong Shiqi Jingji Zhongxin Nanyide Dili Jichu’ (Geographic Rationale for the Southward Shifting of the Centre of Economic Gravity during the Tang-Song Era), Nanjing Shida Xuebao (Bulletin of the Nanjing Normal University), 3 (1991), pp. 35–42.
Shi Tao, Beisong Shiqi Ziran Zaihai Yu Zhengfu Guanli Tixi Yanjiu (Natural Disasters and Government Management System during the Northern Song Period) (Beijing, 2010).
Shi Zhihong, ‘Shijiu Shiji Shangbanqide Zhongguo Liangshi Muchanliang Ji Zongchanliang Zaiguji’ (‘Re-Estimation of the Yield per Mu and the Total Grain Output in China during the Early Nineteenth Century’), Zhongguo Jingjishi Yanjiu (Research in Chinese Economic History), 3 (2012), pp. 52–66.
Shiba, Yoshinobu, Commerce and Society in Sung China. Translated by and Mark Elvin (Ann Arbor, 1970).
--- (Sibo Yixin), Songdai Jiangnan Jingjishi Yanjiu (An Economic History of the Lower Yangzi Region during the Song Period), translated by Fang Jian and He Zhongli (Nanjing, 2001).
---, So-dai Konan Keizai-shi no Kenkyu (Studies of the Economic History of the Lower Yangzi Region in the Song Period) (Tokyo, 1988).
Skinner, G. W. “Sichuan’s Population in the Nineteenth Century: Lessons from Disaggregated Data”, Late Imperial China, 8/1 (1987), pp. 1–79.
Somervell, D. C, A Study of History: Abridgement of Vols I–IV (London, 1946).

43
Songshi Yanjuji Bianji Xiaozhu (SYBX) (Compilation Group of Selected Essays on Song History) (ed.), Songshi Yanjiu Ji (Selected Essays on Song History) (Taipei, 1958–84).
Song Xi, ‘Beisong Daomide Chandi Fenbu’ (Geographic Distribution of Rice Cultivation), in SYBX, ed., Songshi Yanjiu Ji (Selected Essays on Song History), vol. 1 (1958), pp. 130–70.
---, ‘Songdaide Shangshui Wang’ (Commercial Taxation Network during the Song Period), in SYBX, ed., Songshi Yanjiu Ji (Selected Essays on Song History), vol. 3 (1966), pp. 321–50.
---, Songshi Yanjiu Luncong (Collected Essays on Song History) (Taipei, 1980).
Song Zhenghai, Gao Jianguo, Sun Guanlong, and Zhang Binglun, Zhongguo Gudai Ziran Zaiyi Dongtao Fenxi (Dynamic Analysis of Natural Disasters in Premodern China) (Hefei, 2002).
Su Hua, Songci Jianshang Zidian (Annotated Song Poems) (Shanghai, 1987).
Tan Qixiang, Jianming Zhongguo Lishi Ditu Ji (Concise Historical Atlas of China) (Beijing, 1991).
Tang Gaocai, Tangsong Shici Jianshang Zidian (Annotated Poems of the Tang and Song) (Shanghai, 1988).
Tian Zaoyang, Zhongguo Gudai Xingzheng Shilue (A Brief History of Administration in Premodern China) (Beijing, 1994).
Ting Ying, ‘Zhongguo Zaipei Daozhongde Qiyuan Jiqi Yanbian’ (The Origin and Differentiation of Cultivated Rice in China), Nongyie Xuebao (Acta Agriculturae Sinica), 8/3 (1957), pp. 243–60.
Tuo Tuo, Jin Shi (History of the Jin Dynasty), 1344 AD, in Er-shi-wu Shi (or ESWS, Twenty-Five Official Histories) (Shanghai, 1986).
---, Liao Shi (History of the Liao Dynasty), 1344 AD, in Er-shi-wu Shi (or ESWS, Twenty-Five Official Histories) (Shanghai, 1986).
---, Song Shi (History of the Song Dynasty), 1345 AD, in Er-shi-wu Shi (or ESWS, Twenty-Five Official Histories) (Shanghai, 1986).
Twitchett, Denis and Smith, Paul J. (eds.), The Cambridge History of China, vol. 5, Part One: the Sung Dynasty and Its Precursors, 907–1279 (Cambridge, 2009).
Von Glahn, Richard, Fountain of Fortune: Money and Monetary Policy in China, 1000–1700 (Berkeley, 1996).
Wagner, Donald B., ‘The Administration of the Iron Industry in Eleventh-Century China’, Journal of the Economic and Social History of the Orient, 44/2 (2001), pp. 175–97.
---, Science and Civilisation in China, vol. 5: Chemistry and Chemical Technology. Part 11: Ferrous Metallurgy (Cambridge, 2008).
Wang Lingling, Songdai Kuangye Yanjiu (Mining and Metallurgy during the Song Period) (Shijiazhuang, 2005).

44
Wang Pu, Tang Huiyao (Complete Record of the Tang Dynasty) (961 AD. Reprint. Beijing, 1985).
Wang Shengduo, Liangsong Caizheng Shi (A Fiscal History of the Northern and Southern Songs) (Beijing, 1995).
Wang Yuru, Jindai Zhongguo Wujia, Gongzi He Shenghuo Shuiping Yanjiu (Prices, Wages and Living Standards in Early Modern China) (Shanghai, 2007).
Wang Zhuo, Tangshuang Pu (Treatise on Sugar-making) (Publishers unknown, 1154 AD).
Wu Hui, ‘Lishishang Liangshi Shangpinliang Cegu’ (Estimation of Marketisation of Grain in History), Zhongguo Jingjishi Yanjiu (Research in Chinese Economic History), 4 (1998), pp. 16–36.
---, Zhongguo Jingjishi Ruogan Wentide Jiliang Yanjiu (Quantitative Studies of Chinese Economic History) (Fuzhou, 2009).
---, Zhongguo Lidai Liangshi Muchan Yanjiu (Research in the Dynastic Grain Outputs per Mu in China) (Beijing, 1985).
Wu Shuguo, Tangsong Zhiji Tianshui Zhidu Bianqian Yanjiu (Changes in Land Taxes during the Tang and Song Periods) (Harbin, 2007).
Wu Songdi, Zhongguo Renkoushi, Disan Juan, Liao, Song, Jin, Yuan Shiqi (Demographic History of China: Vol. III, the Liao, Song, Jin and Yuan Periods) (Shanghai, 2000).
Wu Xiaoliang (ed.), Songdai Jingjishi Yanjiu (Research in Economic History of the Song Period) (Kunming, 1994).
Xia Zhengnong (ed.), Cihai (Encyclopaedia) (Shanghai, 1989).
Xu Song, Song Huiyao Jigao (Edited Administrative Statutes of the Song Dynasty) (1809. Reprint. Taipei, or RT, 1976).
Xue Yaling, ‘Zhongguo Lishishang Tong Xi Kuangye Fenbude Bianqian’ (Distribution of Copper and Tin Mines and its Changes in China’s History), Zhongguo Jingjishi Yanjiu (Research in Chinese Economic History), 4 (2001), pp. 102–6.
Yan Fushan, Gao Fengying, Yuan Lin, and Zhou Yanling, Liaosong Tieqian (Iron Coins of the Song Dynasty) (Beijing, 2000).
Yan Wenming, ‘Zhongguo Daozuo Nongyede Qiyuan’ (The Origin of Rice Cultivation in China), Nongye Kaogu (Agricultural Archaeology), 1 (1982), pp. 19–31.
Yang Jiping, ‘Songdai Mintian Chuzude Dizu Xingtai Yanjiu’ (Rent Types during the Song Period), Zhongguo Jingjishi Yanjiu (Research in Chinese Economic History), 1 (1992), pp. 128–41.
Yang Ling, Songdai Chuban Wenhua (Printing Culture of the Song Period) (Beijing, 2012).

45
Ye Tan, ‘Songdai Gongshangye Fazhangde Lishi Tezheng’ (Features of Development in Handicrafts and Commerce during the Song Period), Shanghai Shehui Kexueyuan Xueshu Jikan (Academic Quarterly of the Shanghai Academy of Social Sciences), 2 (1991), pp. 103–11.
Yoshida Mitsukuni, Chugoku Kagaku Gijutsu Shi Ronshu (Essay on the History of Science and Technology in China) (Tokyo, 1972).
Yu Yaohua, Zhongguo Jiage Shi (A History of Prices in China) (Beijing, 2000).
Yu Yiefei, ‘Zhongguo Lidai Liangshi Pingjun Muchanliang Kaolue’ (An Investigation of the Dynastic Average Grain Output per Mu in China), Chongqing Shiyuan Xuebao (Bulletin of Chongqing Teachers' College), 3 (1980), pp. 8–21.
Yuan Yitang, ‘Beisong Qianhuang’ (Currency Famine during the Northern Song Period), Lishi Yanjiu (Study of History), 4 (1991), pp. 129–40.
Zeng Anzhi, He Pu (Thesaurus of Rice), 1094, in Cao Shuji, ed., ‘He Pu Jiaoshi’ (Annotated Thesaurus of Rice), Zhongguo Nongshi (Agricultural History of China), 3 (1985), pp. 74–84.
Zeng Xiongsheng, ‘Songdaide Shuangji Dao’ (Double-cropping of Rice in the Song Period), Ziran Kexueshi Yanjiu (Study of History of Natural Sciences), 3 (2002), pp. 255–68.
---, ‘Songdaide Wandao He Zaodao’ (Late Rice and Early Rice during the Song Period), Zhongguo Nongshi (Agricultural History of China), 1 (2002), pp. 54–63.
---, ‘Xi Songdai Dao-Mai Ershu Shou’ (Rethinking of Rice-Wheat-Cropping during the Song Period), Lishi Yanjiu (Study of History), 1 (2005), pp. 86–106.
Zhang Jiacheng, Qihou Yu Renlei (Climate and Humankind) (Zhengzhou, 1988).
Zhang Jiaju, Liansong Jingji Zhongxinde Nanyi (Southward Shift of the Economic Centre in Song Times) (Wuhan, 1957).
Zhang Jianguang, Tang Wudai Jiangnan Gongshangye Buju Yanjiu (Industrial and Commercial Distribution in the Lower Yangzi Region during the Tang and Five Dynasties) (Nanjing, 2003).
Zhang Xiwei, ‘Songdai Zhebianzhi Tanxi’ (Tax Payment Conversions during the Song Period), Zhongguoshi Yanjiu (Study of Chinese History), 1 (1992), pp. 26–33.
Zhao Dexin (ed.), Zhongguo Jingjishi Cidian (Dictionary of Chinese Economic History) (Wuhan, 1990).
Zhao Gang, Zhongguo Chengshi Fazhanshi Lunji (Collected Essays on Development of Urbanisation in Chinese History) (Taipei, 1995).
Zhao Gesheng, Lai Laizhan and Zheng Jingui, Zhongguo Tezhong Dao (Sorted Rice Types in China) (Shanghai, 1995).

46
Zhao Hongjun and Yin Bocheng, ‘Gongyuan 11 Shijihoude Qihou Bianleng Dui Songyihou Jingji Fazhande Dongtai Yingxiang’ (Dynamic Impact of Cooling Down in Climate After the Eleventh Century on Economic Development in Post-Song China), Shehui Kexue (Social Sciences), 4 (2011), pp. 68–78.
Zhao Yashu, ‘Songdai Cansiyede Dili Fenbu’ (Geographic Distribution of Silk Production during the Song Period), in SYBX, ed., Songshi Yanjiu Ji (Selected Essays on Song History), vol. 7 (1974), pp. 573–605.
Zhao Yun, ‘Jishu Wucha, Zhemu Jiqi Juli Shuaijian Guilü Yanjiu’ (Technical Errors: Land Unit Conversion and the Law of Diminishing Distance), Zhongguo Shehui Jingjishi Yanjiu (Research in Chinese Social and Economic History), 3 (2007), pp. 1–13.
Zheng Xuemeng, Zhongguo Gudai Jingji Zhongxin Nanyi He Tangsong Jiangnan Jingji Yanjiu (Southward Shift of China’s Economic Centre of Gravity and the Economy of the Lower Yangzi Delta during the Tang and Song Periods) (Zhengzhou, 1996).
Zhou Bodi, Zhongguo Caizhengshi (Financial History of China) (Shanghai, 1981).
Zhou Qufei, Lingwai Daida (Knowledge about South China and Beyond), in Ji Jun (ed.) Wenyuange Siku Quanshu (The Qing Imperial Complete Collection of Books in the Wenyuan Library) (1178. Reprint. Taipei, 1983), vol. 347, Part 6.
Zhu Changwen, Wujun Tujing Xuji (Illustrated Maps of the Lower Yangzi, Continued) (1037, currently online: http://wenxian.fanren8.com/06/05/62/2.htm)
Zhu Kezhen, ‘Woguo Jinwuqiannianlai Qihou Bianqiande Chubu Yanjiu’ (Preliminary Analysis of Climatic Changes in China in the Past 5,000 Years), Kaogu Xuebao (Bulletin of Archaeology), 1 (1972), pp. 15–38.
Zhu Ruixi and Cheng Yu, Songshi Yanjiu (Studies of Song History) (Fuzhou, 2006).
Zhu Zhongseng, ‘Songdai Chazhi Chanqu Jiqi Zhonglei Yu Chanliang’ (Tea Production Districts, Varieties and Outputs during the Song Period), in SYBX, ed., Songshi Yanjiu Ji (Selected Essays on Song History), vol. 15 (1984), pp. 291–350.

47
Figure 1. Song Eco-Economic Zones, River Systems and Sea Ports
Note: A, B, D and E – mainly temperate; D – subtropical; B' (Chengdu Fu) and B" (Liangzhe and Fujian Lu)
shared a similar farming pattern with B. The territorial sizes of those zones were not identical with their
farmland sizes. Sea ports are marked by crosses.
Source: Tan, Jiangming Zhongguo Lishi Ditu Ji, pp. 41–2, 51–4; Qi, ‘Songdai Shehui Shengchanlide
Fazhan Jiqizai Zhongguo Gudai Jingji Fazhan Guochengzhongde Diwei’, pp. 43–5; Liang, Zhongguo Lidai
Huko Tiandi Tianfu Tongji, p. 164.

48
Figure 2. Geopolitical Map of Song China
Note: Along the northern border were the Khitan Kingdom (Liao) and the Tangut
Kingdom (Xixia) prior to 1127. The grey line = new international border between the
Jurchen Jin and the Southern Song after 1127. GW = the line where the old Great Wall
had laid. Numbers represent provinces (lu), as in 1111 AD. Kaifeng was the capital of
the Northern Song; Lin-an, that of the Southern Song.
Source: Based on Tan, Jiangming Zhongguo Lishi Ditu Ji, pp. 51–4.

49
Table 1. Official Registered Numbers of Households, 1003–1100
Households Index Poll-taxpayers Index
1003* 6,864,160 100 14,278,040 100
1020 9,716,716 142 22,717,272 159
1042* 10,307,640 150 22,926,101 161
1061* 11,091,112 162 22,683,112 159
1080 16,730,504 244 23,830,781 167
1100 19,960,812 291 44,914,991 316
Annual % 1.1 1.2
Note: * The closest observation points available at the beginning of a decade. Source: Based on Liang, Zhongguo Lidai Huko Tiandi Tianfu Tongji, pp. 122–4; Wu, Zhongguo Renkoshi, pp. 346–8.

50
Table 2. Fluctuations in Farmland vs. Growth in Household Numbers, 1021–85
Farmland (105 qing) Index Households (106) Index
1021 52.5 100 8.7 100
1054 22.8 43 10.8 124
1065 44.0 84 12.9 148
1085 24.8 47 18.0* 207
Average 36.0 12.6
Note: * Year 1086 figure. One qing = 100 mu. Sources: Data for farmland, based on Tuo, Song Shi, vol. 173, ‘Shihuozhi 126’. Data for households, based on Liang, Zhongguo Lidai Huko Tiandi Tianfu Tongji, pp. 122–4; Wu, Zhongguo Renkoushi, p. 346–7.

51
Table 3. Urban Commercial Tax-Paying Shares, 1077 (106 coins)
Zone Urban
centres
Revenue Tax % (I) RHS % (II) I/II
A 48 1,376.6 42.2 23.6 1.8
B 49 1,263.0 38.8 41.1 0.9
C 20 391.1 12.0 19.4 0.6
D – – – 8.3 –
E 10 228.6 7.0 7.5 0.9
Total 127 3,259.3 100.0 100.0 1.0
Note: RHS – Regional Household Shares in China’s Total. Source: Guo, Liansong Chengxiang Shangpin Huobi Jingji Kaolue, pp. 223–8; Wu, Zhongguo Renkoushi, pp. 122–35; Liang, Zhongguo Lidai Huko Tiandi Tianfu Tongji, p. 164.

52
Table 4. Growth in Metal Outputs (in Catties), 727–1077
AD Iron Copper* Tin Lead
727† 2,070,000 - - -
997§ – 4,122,000 269,000 793,000
1077/8§ 28,500,000¶ 21,744,750 6,159,300 7,943,350
Annual growth %
727–1077/8 0.8‡ - - -
997–1077/8 - 2.1 4.0 2.9
Note: One Tang/Song catty = 0.6 kg. * Large quantities of copper were also produced from iron sheet with sulphuric acid. † Tang government taxable iron output, used here as a benchmark. § Song government procurements only, hence the minimum. ¶ Based on (1) 5.7 million catties received by the state (or 3,400 metric tons) in 1078 and (2) the compulsory erba choufen scheme of 20:80 output-sharing between the state and the producer. ‡ The growth rate of household numbers from 726 AD to
1077 AD was only 0.2 per cent per year in comparison.209 Source: Iron, based on Qi, Songdai Jingjishi, vol. 2, pp. 586–92; Hu, Zhongguo Shougongye Jingji Tongshi, pp. 149–50. Other metals, based on Ma, Wenxian Tongkao, vol. 18, Entry ‘Mining’; Du, ‘Tang Song Jingji Shili Bijiao Yanjiu’, p. 44. Tang output, based on Ouyang, Xin Tangshu, vol. 54, ‘Shihuozhi’.
209 For the household numbers, see Liang, Zhongguo Lidai Huko Tiandi Tianfu Tongji, pp. 6, 124.

53
Table 5. Crop Choices during Song Times
Calendar Month Growth cycle (days)
Food crops
Winter-wheat* 9th – 3rd (the following year) 175 Millet 2nd – 7th 145 Rice α† 3rd – 5th 58 Rice β† 3rd – 7th 116 Buckwheat§/Rice γ† 4th – 9th 145
Cash crops
Hemp 1st – 6th 145 Sugarcane§ 2nd – 10th 230 Early sesame 3rd – 7th 116 Early legume 4th – 7th 87 Late sesame 5th – 9th 116 Vegetables 3rd – 10th 201 Tea, fruits, mulberry trees 3rd – 10th 201 Note: A Chinese calendar month has 29 days. Rice α–γ = rice choices; their sowing timing did not allow two rice crops within the same calendar year. * Suited for Zones A, B (including B' and B") and E. † Suited for Zones B, C and D. § Sugarcane is perennial and requires re-planting once every three years. Source: Chen, Chenfu Nongshu, pp. 2–5; Wang, Tangshuang Pu; Guo, Liansong Chengxiang Shangpin Huobi Jingji Kaolue, pp. 258, 264–8; Liang, Nansongde Nongcun Jingji, p. 117; Cheng, Songdai Diyu Jingji, pp. 98–100.
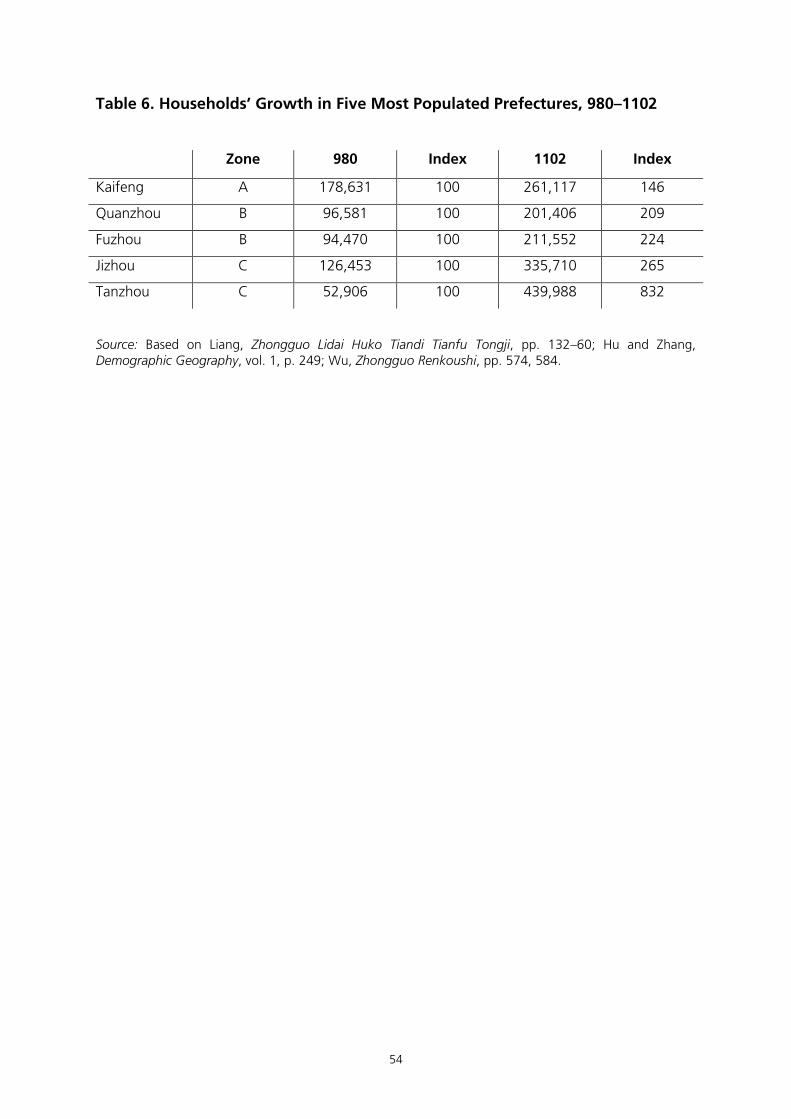
54
Table 6. Households’ Growth in Five Most Populated Prefectures, 980–1102
Zone 980 Index 1102 Index
Kaifeng A 178,631 100 261,117 146
Quanzhou B 96,581 100 201,406 209
Fuzhou B 94,470 100 211,552 224
Jizhou C 126,453 100 335,710 265
Tanzhou C 52,906 100 439,988 832
Source: Based on Liang, Zhongguo Lidai Huko Tiandi Tianfu Tongji, pp. 132–60; Hu and Zhang, Demographic Geography, vol. 1, p. 249; Wu, Zhongguo Renkoushi, pp. 574, 584.
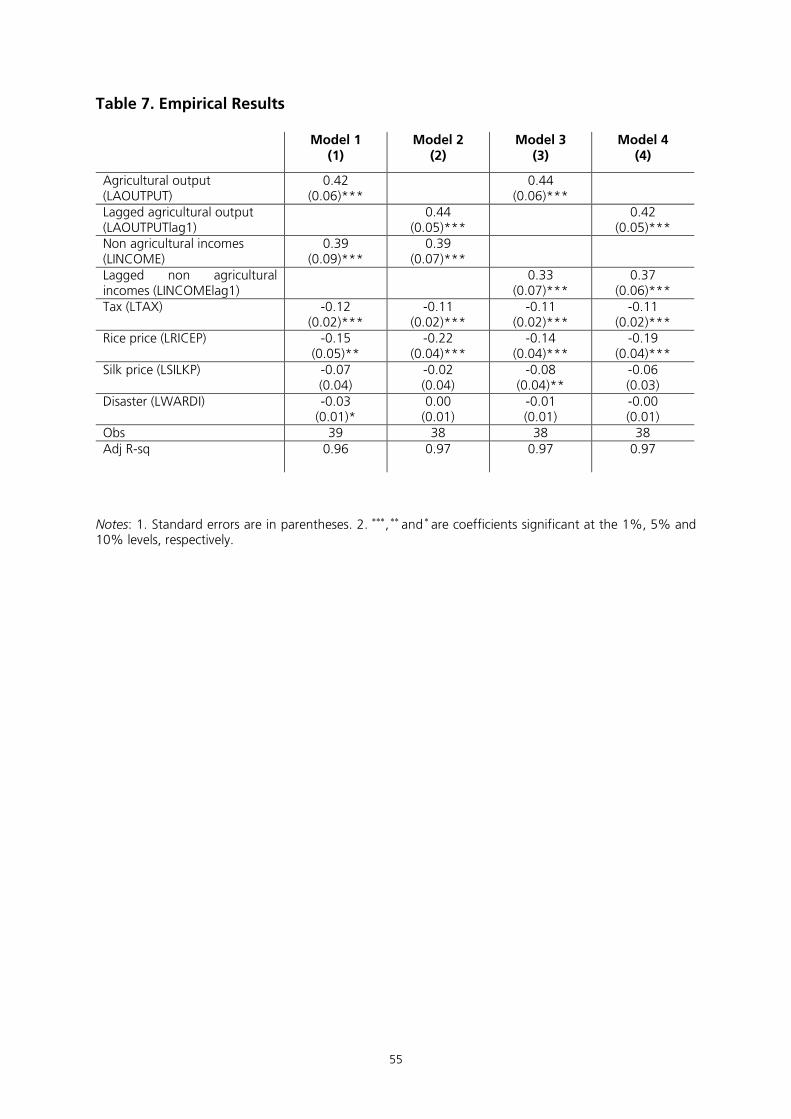
55
Table 7. Empirical Results
Model 1 (1)
Model 2 (2)
Model 3 (3)
Model 4 (4)
Agricultural output (LAOUTPUT)
0.42 (0.06)***
0.44 (0.06)***
Lagged agricultural output (LAOUTPUTlag1)
0.44 (0.05)***
0.42 (0.05)***
Non agricultural incomes (LINCOME)
0.39 (0.09)***
0.39 (0.07)***
Lagged non agricultural incomes (LINCOMElag1)
0.33 (0.07)***
0.37 (0.06)***
Tax (LTAX) -0.12 (0.02)***
-0.11 (0.02)***
-0.11 (0.02)***
-0.11 (0.02)***
Rice price (LRICEP) -0.15 (0.05)**
-0.22 (0.04)***
-0.14 (0.04)***
-0.19 (0.04)***
Silk price (LSILKP) -0.07 (0.04)
-0.02 (0.04)
-0.08 (0.04)**
-0.06 (0.03)
Disaster (LWARDI) -0.03 (0.01)*
0.00 (0.01)
-0.01 (0.01)
-0.00 (0.01)
Obs 39 38 38 38 Adj R-sq
0.96 0.97 0.97 0.97
Notes: 1. Standard errors are in parentheses. 2. ∗∗∗, ∗∗ and ∗ are coefficients significant at the 1%, 5% and 10% levels, respectively.

56
LONDON SCHOOL OF ECONOMICS
ECONOMIC HISTORY DEPARTMENT WORKING PAPERS (from 2009 onwards) For a full list of titles visit our webpage at http://www.lse.ac.uk/
2009
WP114 War and Wealth: Economic Opportunity Before and After the Civil
War, 1850-1870 Taylor Jaworski WP115 Business Cycles and Economic Policy, 1914-1945: A Survey Albrecht Ritschl and Tobias Straumann WP116 The Impact of School Provision on Pupil Attendance: Evidence From
the Early 20th Century Mary MacKinnon and Chris Minns WP117 Why Easter Island Collapsed: An Answer for an Enduring Question Barzin Pakandam WP118 Rules and Reality: Quantifying the Practice of Apprenticeship in Early
Modern Europe Chris Minns and Patrick Wallis WP119 Time and Productivity Growth in Services: How Motion Pictures
Industrialized Entertainment Gerben Bakker WP120 The Pattern of Trade in Seventeenth-Century Mughal India: Towards
An Economic Explanation Jagjeet Lally WP121 Bairoch Revisited. Tariff Structure and Growth in the Late 19th Century Antonio Tena-Junguito WP122 Evolution of Living Standards and Human Capital in China in 18-20th
Centuries: Evidences from Real Wage and Anthropometrics Joerg Baten, Debin Ma, Stephen Morgan and Qing Wang WP123 Wages, Prices, and Living Standards in China, 1738-1925: in
Comparison with Europe, Japan, and India

57
Robert C. Allen, Jean-Pascal Bassino, Debin Ma, Christine Moll-Murata, Jan Luiten van Zanden
WP124 Law and Economic Change in Traditional China: A Comparative
Perspective Debin Ma WP125 Leaving Home and Entering Service: The Age of Apprenticeship in Early
Modern London Patrick Wallis, Cliff Webb and Chris Minns WP126 After the Great Debasement, 1544-51: Did Gresham’s Law Apply? Ling-Fan Li WP127 Did Globalization Aid Industrial Development in Colonial India? A
Study of Knowledge Transfer in the Iron Industry Tirthankar Roy WP128 The Education and Training of Gentry Sons in Early-Modern England Patrick Wallis and Cliff Webb WP129 Does Trade Explain Europe’s Rise? Geography, Market Size and
Economic Development Roman Studer WP130 Depression Econometrics: A FAVAR Model of Monetary Policy During
the Great Depression Pooyan Amir Ahmadi and Albrecht Ritschl WP131 The Economic Legacies of the ‘Thin White Line’: Indirect Rule and the
Comparative Development of Sub-Saharan Africa Peter Richens WP132 Money, States and Empire: Financial Integration Cycles and
Institutional Change in Central Europe, 1400-1520 David Chilosi and Oliver Volckart WP133 Regional Market Integration in Italy During the Unification (1832-1882) Anna Missiaia 2010 WP134 Total Factor Productivity for the Royal Navy from Victory at Texal
(1653) to Triumph at Trafalgar (1805) Patrick Karl O’Brien FBA and Xavier Duran

58
WP135 From Sickness to Death: The Financial Viability of the English Friendly
Societies and Coming of the Old Age Pensions Act, 1875-1908 Nicholas Broten WP136 Pirates, Polities and Companies: Global Politics on the Konkan Littoral,
c. 1690-1756 Derek L. Elliott WP137 Were British Railway Companies Well-Managed in the Early Twentieth
Century? Nicholas Crafts, Timothy Leunig and Abay Mulatu WP138 Merchant Networks, the Baltic and the Expansion of European Long-
Distance Trade: Re-evaluating the Role of Voluntary Organisations Esther Sahle WP139 The Amazing Synchronicity of the Global Development (the 1300s-
1450s). An Institutional Approach to the Globalization of the Late Middle Ages
Lucy Badalian and Victor Krivorotov WP140 Good or Bad Money? Debasement, Society and the State in the Late
Middle Ages David Chilosi and Oliver Volckart WP141 Becoming a London Goldsmith in the Seventeenth Century: Social
Capital and Mobility of Apprentices and Masters of the Guild Raphaelle Schwarzberg WP142 Rethinking the Origins of British India: State Formation and Military-
Fiscal Undertakings in an Eighteenth Century World Region Tirthankar Roy WP143 Exotic Drugs and English Medicine: England’s Drug Trade, c.1550-
c.1800 Patrick Wallis WP144 Books or Bullion? Printing, Mining and Financial Integration in Central
Europe from the 1460s David Chilosi and Oliver Volckart WP145 ‘Deep’ Integration of 19th Century Grain Markets: Coordination and
Standardisation in a Global Value Chain Aashish Velkar

59
WP146 The Utility of a Common Coinage: Currency Unions and the
Integration of Money Markets in Late Medieval Central Europe Lars Boerner and Oliver Volckart WP147 The Cost of Living in London, 1740-1837 Ralph Turvey WP148 Labour Market Dynamics in Canada, 1891-1911: A First Look From
New Census Samples Kris Inwood, Mary MacKinnon and Chris Minns WP149 Economic Effects of Vertical Disintegration: The American Motion
Picture Industry, 1945 to 1955 Gregory Mead Silver 2011
WP150 The Contributions of Warfare with Revolutionary and Napoleonic
France to the Consolidation and Progress of the British Industrial Revolution
Patrick Karl O’Brien WP151 From a “Normal Recession” to the “Great Depression”: Finding the
Turning Point in Chicago Bank Portfolios, 1923-1933 Natacha Postel-Vinay WP152 Rock, Scissors, Paper: the Problem of Incentives and Information in
Traditional Chinese State and the Origin of Great Divergence Debin Ma WP153 The Finances of the East India Company in India, c.1766-1859 John F. Richards WP154 Labour, law and training in early modern London: apprenticeship and
the city’s institutions Patrick Wallis WP155 Why did (pre‐industrial) firms train? Premiums and apprenticeship
contracts in 18th century England Chris Minns, Patrick Wallis

60
WP156 Merchantilist institutions for a first but precocious industrial revolution; The Bank of England, the Treasury and the money supply, 1694-1797 Patrick O’Brien
2012
WP157 Hand Looms, Power Looms, and Changing Production Organizations:
The Case of the Kiryu Weaving District in the Early 20th Century Japan Tomoko Hashino, Keijuro Otsuka
WP158 From Divergence to Convergence: Re-evaluating the History Behind
China’s Economic Boom Loren Brandt, Debin Ma, Thomas G. Rawski
WP159 Money and Monetary System in China in the 19th-20th Century: An
Overview Debin Ma
WP160 Contesting the Indigenous Development of"Chinese Double-entry
Bookkeeping" and its Significance in China's Economic Institutions and Business Organization before c.1850 Keith Hoskin, Richard Macve
WP161 Steel, Style and Status: The Economics of the Cantilever Chair, 1929-
1936 Tobias Vogelgsang
WP162 The Seven Mechanisms for Achieving Sovereign Debt Sustainability
Garrick Hileman WP163 Reparations, Deficits, and Debt Default: The Great Depression in
Germany Albrecht Ritschl
WP164 Bounded Leviathan: or why North and Weingast are only right on the
right half Alejandra Irigoin, Regina Grafe
WP165 Monetary sovereignty during the classical gold standard era: the
Ottoman Empire and Europe, 1880-1913 Coşkun Tunçer
WP166 Going Beyond Social Savings. How would the British economy have
developed in the absence of the railways? A case study of Brunner

61
Mond 1882-1914. Edward Longinotti
WP167 Public Finance in Britain and China in the long Eighteenth Century
Peer Vries WP168 The rise of the patent department: A case study of Westinghouse
Electric and Manufacturing Company Shigehiro Nishimura
WP169 The Maghribi industrialists contract enforcement in the Moroccan industry, 1956-82
Romain Ferrali WP170 Adopting the rights-based model: music multinationals and local music
industries since 1945 Gerben Bakker
WP171 The Eighth Wonder of the World: How might access for vehicles have
prevented the economic failure of the Thames Tunnel 1843-1865? Rio Lydon
WP 172 Sunk costs and the dynamics of creative industries Gerben Bakker
WP173 A Trojan Horse in Daoguang China? Explaining the flows of silver in and out of China Alejandra Irigoin
WP174 Evaluating the Swiss Transitory Labour Contribution to Germany in the Second War Eric Golson
WP175 From Divergence to Convergence: Re-evaluation the History behind
China’s Economic Boom Loren Brandt, Debin Ma, and Thomas G. Rawski
WP 176 Historical Foundations for a Global Perspective on the Emergence of a Western European Regime for the Discovery, Development and Diffusion of Useful and Reliable Knowledge Patrick O’Brien

62
WP177 Risky institutions: political regimes and the cost of public borrowing in early modern Italy David Chilosi