demystifying cross-device - iab uk · built-in technology that allows marketers to track people...
TRANSCRIPT

Adbrain « London | New York | www.adbrain.comCopyright © Adbrain 20151 DEMYSTIFYING CROSS-DEVICE
DEMYSTIFYING CROSS-DEVICEEssential reading for product management,
business development and business technology leaders
Includes a contribution from the IAB

Adbrain « London | New York | www.adbrain.comCopyright © Adbrain 20152 DEMYSTIFYING CROSS-DEVICE
EXECUTIVE SUMMARY
This guide is intended to provide Marketers with an introduction to cross-device,
and more importantly a framework for evaluating cross-device solutions. For
the purposes of this guide “Marketers” include direct brands, media agencies,
programmatic specialists and publishers. Different types of businesses will focus on
different cross-device applications but the evaluation process will be very similar.
Cross-device is a new opportunity in the digital advertising ecosystem, but a crucial
one since it allows Marketers to understand how a single customer is interacting
with their brand across devices. Without that understanding it is impossible to build
effective and efficient marketing strategies. The good news is there are several
options in the market today.
In summary, this guide introduces the following concepts and discussion points:
• Why understanding cross-device is so critical in today’s digital landscape
• The key applications of cross-device technology that can benefit brands,
publishers, and technology vendors alike
• The advantages and disadvantages of different cross-device technologies
• How to evaluate cross-device vendors
• How to measure and compare cross-device performance
It is essential reading for product management, business development and business
technology leaders.

Adbrain « London | New York | www.adbrain.comCopyright © Adbrain 20153 DEMYSTIFYING CROSS-DEVICE
TABLE OF CONTENTS
Future forward, words from the IAB 4
Introduction to Cross-Device 5
Creating value from device graphs 7
Comparing cross-device vendors 10
Measuring device graph performance 25
The confusion matrix 31
Summary 37
References 41
Adbrain « London | New York | www.adbrain.comCopyright © Adbrain 2015
Adbrain « London | New York | www.adbrain.comCopyright © Adbrain 20154 DEMYSTIFYING CROSS-DEVICE
We’re at a point now where mobile accounts
for 34% of digital display advertising
spending (IAB UK / PWC Digital Adspend
Study). This is testament to the fact that
mobile delivers results, both from a branding
and DR perspective. When you couple this
with the proliferation of smartphone and
tablet devices it presents a huge opportunity
for businesses from all sectors. In fact,
according to a recent Ericsson Research
study, the average US household now
posseses 5.2 internet connected devices and
this figure is only set to grow as we head
into the era of The Internet of Things and
wearable technology.
As the growth curve continues we’re seeing
the emergence of cross-device campaigns.
This is being driven by the consumer
appetite to engage with content on any
number of different devices and screen
sizes, for advertisers this means being able
to reach the same consumer with relevant
messages across the different devices they
use throughout the day. Tying this consumer
behavior together with relevant and targeted
advertising is the challenging part, however
the emergence of sophisticated probabilistic
methods of targeting has made cross-device
campaigns a much stronger proposition.
Despite all this progress there is still a need
for education in this area, a point highlighted
in our latest IAB Mobile Agency Snapshot
Study where 89% of agency employees
agreed that ‘Not being able to track cross-
device campaigns is holding back the
growth of mobile.’ For digital advertising to
continue its impressive growth advertisers
and agencies need to feel confident that
their investment will drive results. The good
news is that developments in cross-device
technologies have opened up a world of
possibilities, including the promise of
cross-channel attribution. It’s truly an
exciting time to be a part of this industry,
but with new opportunities comes new
challenges and it’s clear that education will
play a role in bringing the industry up to
speed, which will ultimately deliver better
advertising experiences.
Mike Reynolds, Senior Mobile Executive at the IAB
The good news is that developments in cross-device technologies have opened up a world of possibilities

Adbrain « London | New York | www.adbrain.comCopyright © Adbrain 20155 DEMYSTIFYING CROSS-DEVICE
INTRODUCTION TO CROSS-DEVICE
Recent studies have shown that 90% of internet users are now using more
than one device to accomplish a task over time.1 Couple that with new numbers
showing that there are now 2bn global smartphone users, with an additional
400m projected by the end of 2017, and it’s clear that consumer behaviour has
become increasingly cross-device.2 Despite all of these developments there is no
built-in technology that allows Marketers to track people across those different
digital properties.
This is the so-called cross-device challenge. How can a Marketer optimize their
online content, maximize their yield, plan media campaigns effectively, manage
user profiles, track conversions and measure true reach / frequency without
knowing when they are interacting with the same user, just on a different device?
By 2016 digital media ad spend will overtake TV in the US, consequently the
cross-device challenge will intensify as consumers shift to emerging platforms.3
ABOUT THE AUTHOR
Adbrain is at the cutting-edge of providing intelligent technology solutions that can
transform the cross-device challenge into an opportunity.
Adbrain ingests billions of data points daily and overlays sophisticated artificial
intelligence technology to create a single, privacy-safe view of the consumer
across devices. We enable Marketers to understand who their audiences are by
identifying linkages between devices. This in turn drives precise and innovative
cross-device applications from media buying to analytics and attribution.
Adbrain’s solutions have been designed to plug-in to the Marketer’s existing media
delivery or data platforms.
01
Adbrain « London | New York | www.adbrain.comCopyright © Adbrain 20156 DEMYSTIFYING CROSS-DEVICE
Adbrain was founded two years ago and currently has offices
in London, New York, and San Francisco. We currently work
with leading brands, publishers, and advertising / marketing
technology businesses.
For more information please visit our website or email your
questions to [email protected]
In this fast moving and highly innovative space we expect
further developments to occur, but we believe this document
will remain relevant for some time.
SO, WHAT IS A CROSS-DEVICE SOLUTION?
Cross-device solutions all share the same basic functionality
of linking devices together. In practice, this means creating
connections between the IDs that the advertising industry
uses to track user interactions, create profiles and manage
ad delivery.
For desktop and mobile web these are mainly cookie IDs, and
for mobile apps they are mobile device ids (IDFA, Android
Advertising ID). In the simplest terms, the task at hand is to pair
multiple IDs together that belong to the same user.
These sets of ID pairs are called device graphs, and it’s these
graphs that form the basis of cross-device applications.

Adbrain « London | New York | www.adbrain.comCopyright © Adbrain 20157 DEMYSTIFYING CROSS-DEVICE
CREATING VALUE FROM DEVICE GRAPHS
WHY DOES MY BUSINESS NEED A CROSS-DEVICE SOLUTION?
At a high level the idea of understanding a single user across multiple devices
is compelling. However, in practical terms it isn’t always clear to Marketers
what the tangible applications to drive business value and incremental revenue
actually are.
As a starting point here are some of the highest value applications of cross-device.
MEDIA-CENTRIC APPLICATIONS
1. Cross-Device Audience Amplification
Take audiences identified via one channel and market to them on other devices.
Activating an audience across different channels is a way to extract greater
value from your existing data management platforms. For example, a publisher
could leverage its desktop user profile data when that user appears in
their app.
2. Cross-Device Retargeting
Mobile to desktop - Retarget users who have researched your products on
their mobile devices when they are on their respective desktop devices (and
are more likely to complete a complex transaction).
Desktop to mobile - Reach your engaged desktop users on their mobile devices
(to encourage them to download, install and interact through your apps).
Desktop to desktop - Ensure a single user’s profile is ported across all
browsers on a single or multiple desktop devices.
02

Adbrain « London | New York | www.adbrain.comCopyright © Adbrain 20158 DEMYSTIFYING CROSS-DEVICE
3. Cross-Device Frequency Capping
A device graph can be deployed within a media adserver to limit the number of ads
a single user sees for a particular brand or product across all devices. This yields
significant reduction in media wastage. For example, Marketers can avoid showing
ads on one device to users who have already been exposed to that same ad across
other devices.
4. Cross-Device Sequential Messaging
Delivering a tailored ad to a user based on their previous interaction with an
advertising campaign is a proven brand engagement tactic. Access to a device
graph allows this tactic to be extended across screens. For example, a desktop ad
can be tailored to reflect the user’s previous interactions with that campaign across
mobile devices.

Adbrain « London | New York | www.adbrain.comCopyright © Adbrain 20159 DEMYSTIFYING CROSS-DEVICE
ANALYTICS AND AUDIENCE-CENTRIC APPLICATIONS
1. Cross-Device Conversion Uplift
A device graph means you can understand how a conversion is attributed to media
interactions across screens. This is very much the Holy Grail for many Marketers
since it allows them to truly understand the overall impact of investing in different
media channels. For example, this type of insight analytics allows a Marketer to finally
understand how mobile media dollars drive performance and brand engagement on
other, non-mobile channels.
2. True Unique Reach and Frequency
Access to a device graph provides a much clearer view of how many actual people have
been reached, and at what frequency. This makes for more effective media planning
and reduced media wastage. For example, true cross-device reach would allow
you to optimize a media plan by removing mobile placements that aren’t delivering
incremental reach to desktop placements.
3. Cross-Device Segment Creation
Create segments of users based on their interactions across multiple devices.
For example, create a segment of users who have downloaded an app but continue to
interact only on desktop.
4. Predictive Modelling
Collapse device-specific data signals to the user level prior to model run-time to
increase volume of data signals. Parameterize mobile vs desktop data signals
separately at model run-time to create output reflective of device specific behaviors.
Not all cross-device vendors will support these application so with this list of examples in
mind it is necessary to define how the technology can be applied to your business.

Adbrain « London | New York | www.adbrain.comCopyright © Adbrain 201510 DEMYSTIFYING CROSS-DEVICE
COMPARING CROSS-DEVICE VENDORS
When evaluating vendors there are a few key questions to consider.
These questions will have a material impact on how much value can be
extracted by the Marketer.
03
QUESTION FACTOR TO CONSIDER
How is the cross-device service accessed?
Can the Marketer use the vendor’s solution with their existing technology?
Does the solution support all the applications listed above?
What input data is used to create the device graph?
Does the Marketer have to contribute their own data?
Does the input data scale in terms of volume and new markets?
How are the linkages between devices created?
Is the number of matches constrained by the vendors’ other products?
Are matches created with due respect to the end user’s privacy?
Are the matches created performant i.e. correct?

Adbrain « London | New York | www.adbrain.comCopyright © Adbrain 201511 DEMYSTIFYING CROSS-DEVICE
ACCESSING A DEVICE GRAPH
In general there are three ways that a vendor may make its device graph available
to Marketers:
1. Coupled to media activation
The vendor only allows the Marketer to access their device graph when the
Marketer also uses the vendor to run media campaigns. Put differently, the
Marketer has to use the vendor as a media partner to access the device graph.
These vendors will typically charge on a media CPM for every impression delivered
using cross-device data. For example, the device graph vendor may provide cross-
device path to conversion attribution, but only for campaigns executed on the
vendor’s media platform.
Advantage:
• For some vendors coupling the device graph with media makes for a simpler
deployment and a quicker activation for Marketers.
Disadvantages:
• Media coupled solutions typically are less flexible since the Marketer can only
use the device graph for media provided by the vendor. This means the Marketer
may need multiple vendors for each part of their media plan.
• A solution that is coupled to media limits the value of the applications above.
For example, cross-device path to conversion attribution is very much limited in
value if not run across all components of a media plan.
• Vendors who also operate a media business may not disclose their media
margins, which makes it difficult to evaluate the added technology cost.
Adbrain « London | New York | www.adbrain.comCopyright © Adbrain 201512 DEMYSTIFYING CROSS-DEVICE
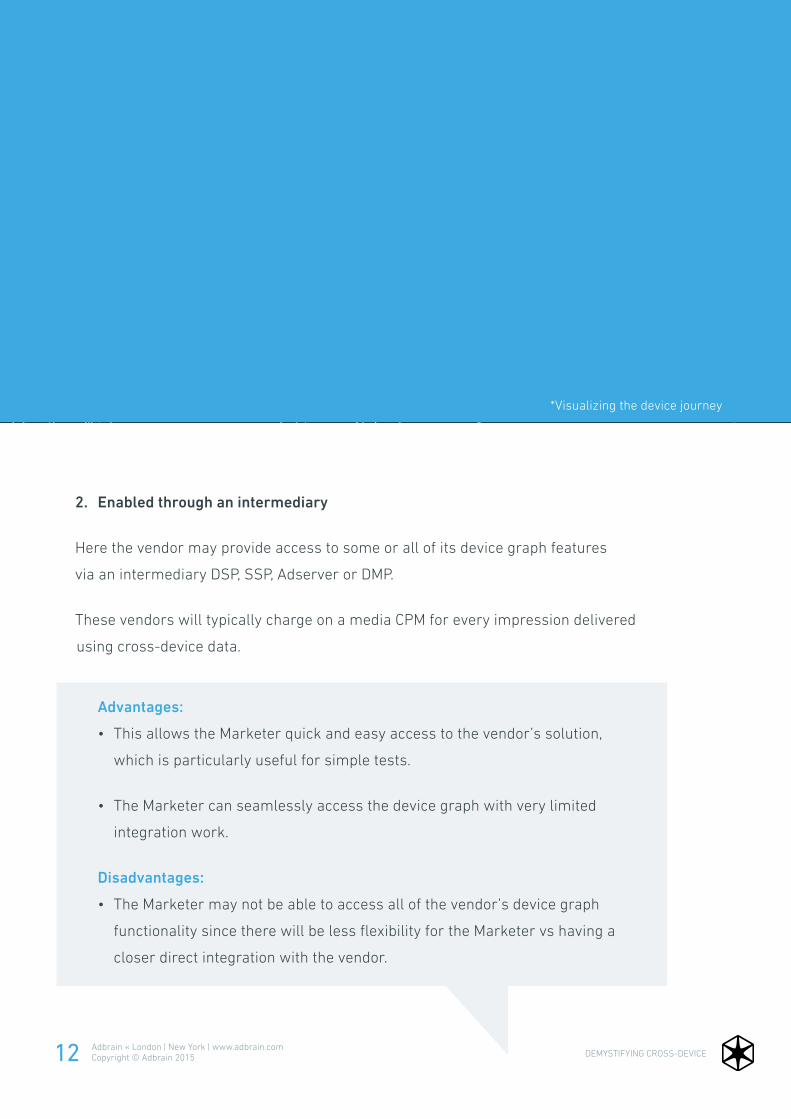
2. Enabled through an intermediary
Here the vendor may provide access to some or all of its device graph features
via an intermediary DSP, SSP, Adserver or DMP.
These vendors will typically charge on a media CPM for every impression delivered
using cross-device data.
Advantages:
• This allows the Marketer quick and easy access to the vendor’s solution,
which is particularly useful for simple tests.
• The Marketer can seamlessly access the device graph with very limited
integration work.
Disadvantages:
• The Marketer may not be able to access all of the vendor’s device graph
functionality since there will be less flexibility for the Marketer vs having a
closer direct integration with the vendor.
*Visualizing the device journey

Adbrain « London | New York | www.adbrain.comCopyright © Adbrain 201513 DEMYSTIFYING CROSS-DEVICE
3. Decoupled from media activation
In this model the vendor provides access to the device graph within its
pre-existing ad tech infrastructure.
These vendors will typically charge a monthly licence fee based on the quantity
of data provided to the Marketer.
Advantages:
• This solution means the Marketer retains control of their media activation
i.e. no need to change media plans. The vendor provides new cross-device
services to enhance the Marketer’s existing technology.
• Allows the Marketer to create their own intellectual property and their own
products/services to create their own differentiated end user propositions.
• Clear commercial distinction between media and technology fees.
Disadvantage:
• The Marketer needs to activate the output of the device graph in their own ad
tech platforms and for some vendors this integration can be time consuming.
The trade-off is between transparency and control vs simplicity. Each Marketer
should consider that trade-off as part of their broader vendor evaluation because it
significantly impacts how the partnership is structured.4

Adbrain « London | New York | www.adbrain.comCopyright © Adbrain 201514 DEMYSTIFYING CROSS-DEVICE
INPUT DATA FOR THE DEVICE GRAPH
It’s important to ask where the data a vendor uses to create its device graph
actually comes from.
It is an area worth scrutinizing since it strongly influences the strength of the
vendor’s solution in two ways:
1. Does the input data include data derived from the Marketer’s media impression
footprint? If so, then this could mean the Marketer’s data is helping to create
an asset that advantages others. While there is nothing intrinsically wrong
with a vendor leveraging all the data available to provide a better service to all
customers, this is something that most Marketers would need disclosed.
2. Does the input data scale both in terms of coverage of a single market, but
also other markets of interest? This point is crucial because there is
significant value in working with a vendor who can service a global
business (e.g. minimizing the costs of having multiple different vendors in
different markets).
Adbrain « London | New York | www.adbrain.comCopyright © Adbrain 201515 DEMYSTIFYING CROSS-DEVICE
Broadly speaking, there are three strategies a vendor may use for input data:
1. Input data derived from media campaign impressions
In this model the vendor will use data signals collected from impressions served in
the media campaigns that the vendor is running on behalf of the Marketer.
For vendors that run a media business this is technically easy to do and hard to
monitor because they have free access to load their code into the ads they are
serving. Vendors can also follow this strategy by asking marketers to place
non-frequency capped “tracking tags” into the Marketer’s media campaigns.
Advantage:
• The advantage of this solution is principally with the vendor – helping them
to create connections between IDs at reduced cost. This can benefit the
Marketer if that cost saving is passed through to the them.
Disadvantages:
• There is scope for the Marketer to indirectly benefit a potential competitor
(client X’s media helps build the device graph for competitor Y to use). It’s
unlikely that the client will be directly compensated for this value exchange.
• Vendors who rely on media impression data to build their device graph
will be constrained by the media footprint they have access to. This type of
device graph cannot scale without media scale.
Adbrain « London | New York | www.adbrain.comCopyright © Adbrain 201516 DEMYSTIFYING CROSS-DEVICE
2. Input data contributed by the marketer
Another common scenario is when the vendor makes no attempt to build
their own data sources. These vendors offer a service where the marketer
contributes their own data for the vendor to process and create a device graph.
Advantage:
• The integration will be very “deep” since data must flow seamlessly between
vendor and Marketer. This type of data flow often makes it simpler to
activate cross-device applications.
• For similar reasons there can be an advantage here in terms of data security,
particularly where the vendor deploys its solution onto the Marketer’s
hardware (an on-premises software only solution).
• It’s clear that the marketer’s data will only be used to benefit that specific
client, and not others. This is not often clear with other approaches.
Disadvantages:
• One key disadvantage is the reverse of the key advantage. A “deep”
integration is only efficient once the costly and time consuming integration
process is finished.
• Scale (volume and geography) for these solutions can by definition never
exceed the scale of the Marketer’s data and every customer starts with
an “empty” device graph. Even the larger marketers are unlikely to have
sufficient data to fuel a truly scaled device graph.
Adbrain « London | New York | www.adbrain.comCopyright © Adbrain 201517 DEMYSTIFYING CROSS-DEVICE
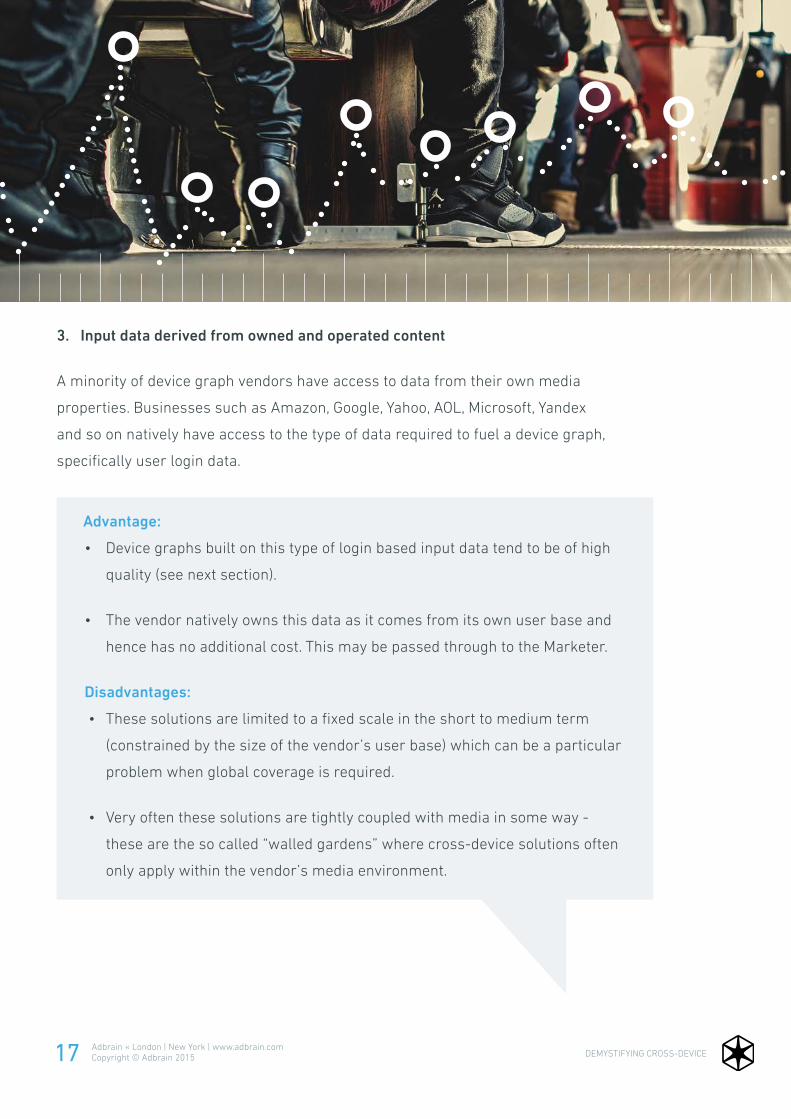
3. Input data derived from owned and operated content
A minority of device graph vendors have access to data from their own media
properties. Businesses such as Amazon, Google, Yahoo, AOL, Microsoft, Yandex
and so on natively have access to the type of data required to fuel a device graph,
specifically user login data.
Advantage:
• Device graphs built on this type of login based input data tend to be of high
quality (see next section).
• The vendor natively owns this data as it comes from its own user base and
hence has no additional cost. This may be passed through to the Marketer.
Disadvantages:
• These solutions are limited to a fixed scale in the short to medium term
(constrained by the size of the vendor’s user base) which can be a particular
problem when global coverage is required.
• Very often these solutions are tightly coupled with media in some way -
these are the so called “walled gardens” where cross-device solutions often
only apply within the vendor’s media environment.

Adbrain « London | New York | www.adbrain.comCopyright © Adbrain 201518 DEMYSTIFYING CROSS-DEVICE
4. Input derived from data partners
The final option is where vendors derive input data from data partners entirely
independent of campaigns run by or websites controlled by the Marketer.
Advantage:
• Marketers get access to a pre-existing device graph that’s ready to use.
• Data from the Marketer’s media impressions aren’t used to enhance the
vendor’s device graph. Therefore there is no risk of a Marketer’s data
potentially advantaging a competitor who is using the same device graph.
• Vendors can deploy device graphs into new markets by expanding existing
data partnerships. There is no long time-lag while the vendor ramps up
their media business.
• Vendors in this category will also allow Marketers to optionally work as both
a device graph customer and a data partner which provides an enhanced
version of the Marketer contribution model described above.
Disadvantages:
• This strategy creates a data acquisition cost for the vendor and typically
means they will need more sophisticated mathematical algorithms to create
linkages between devices. Both of these can mean there is a higher cost to
the marketer.

Adbrain « London | New York | www.adbrain.comCopyright © Adbrain 201519 DEMYSTIFYING CROSS-DEVICE
HOW ARE DEVICE LINKAGES IDENTIFIED?
Each vendor will have its own approach for creating the linkages between IDs.
There are two important dimensions for evaluating the strength of these approaches.
1. Is the matching solution respectful of consumer privacy?
2. Does the matching solution scale?
In market there are currently three general solutions. Each option uses different
strategies for what types of ID will be linked together and different strategies for how
the linkages themselves are created:
GRAPH TYPE TYPE OF ID LINKED LINKAGE CREATED
Deterministic Deterministic Deterministic
Pure Probabilistic Deterministic Probabilistic
Probabilistic & Statistical IDs
Statistical + Deterministic
Probabilistic
Adbrain « London | New York | www.adbrain.comCopyright © Adbrain 201520 DEMYSTIFYING CROSS-DEVICE
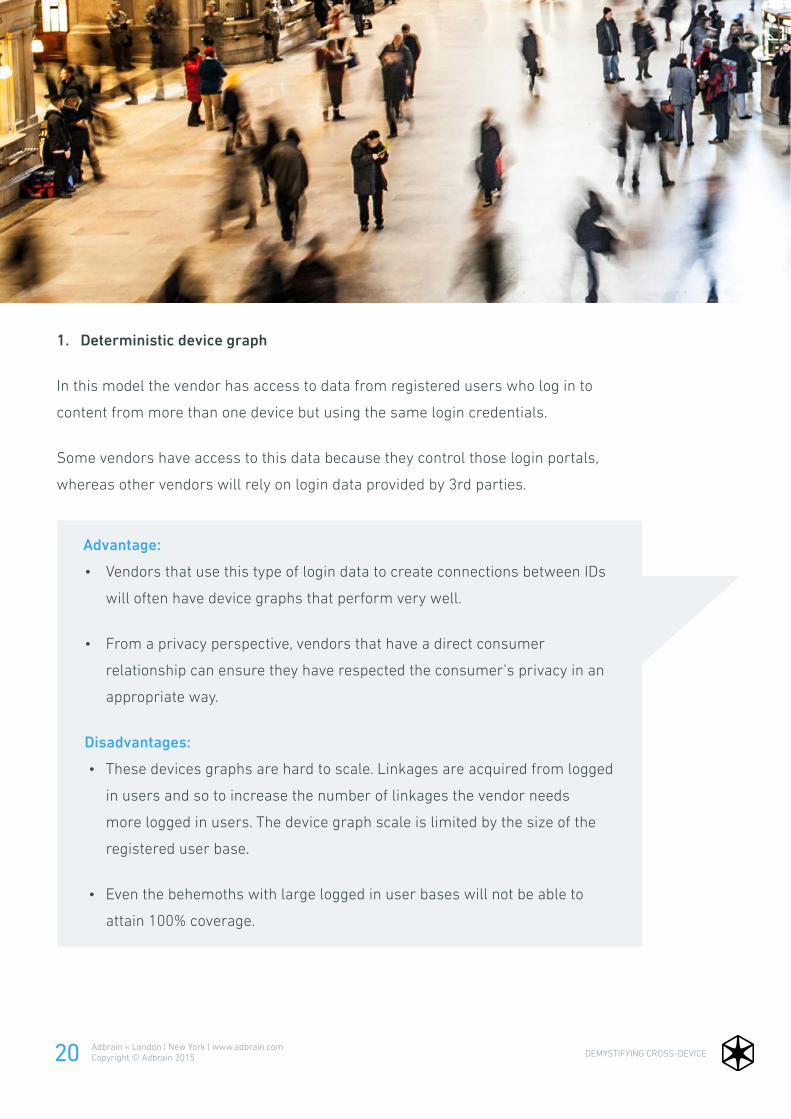
1. Deterministic device graph
In this model the vendor has access to data from registered users who log in to
content from more than one device but using the same login credentials.
Some vendors have access to this data because they control those login portals,
whereas other vendors will rely on login data provided by 3rd parties.
Advantage:
• Vendors that use this type of login data to create connections between IDs
will often have device graphs that perform very well.
• From a privacy perspective, vendors that have a direct consumer
relationship can ensure they have respected the consumer’s privacy in an
appropriate way.
Disadvantages:
• These devices graphs are hard to scale. Linkages are acquired from logged
in users and so to increase the number of linkages the vendor needs
more logged in users. The device graph scale is limited by the size of the
registered user base.
• Even the behemoths with large logged in user bases will not be able to
attain 100% coverage.
Adbrain « London | New York | www.adbrain.comCopyright © Adbrain 201521 DEMYSTIFYING CROSS-DEVICE
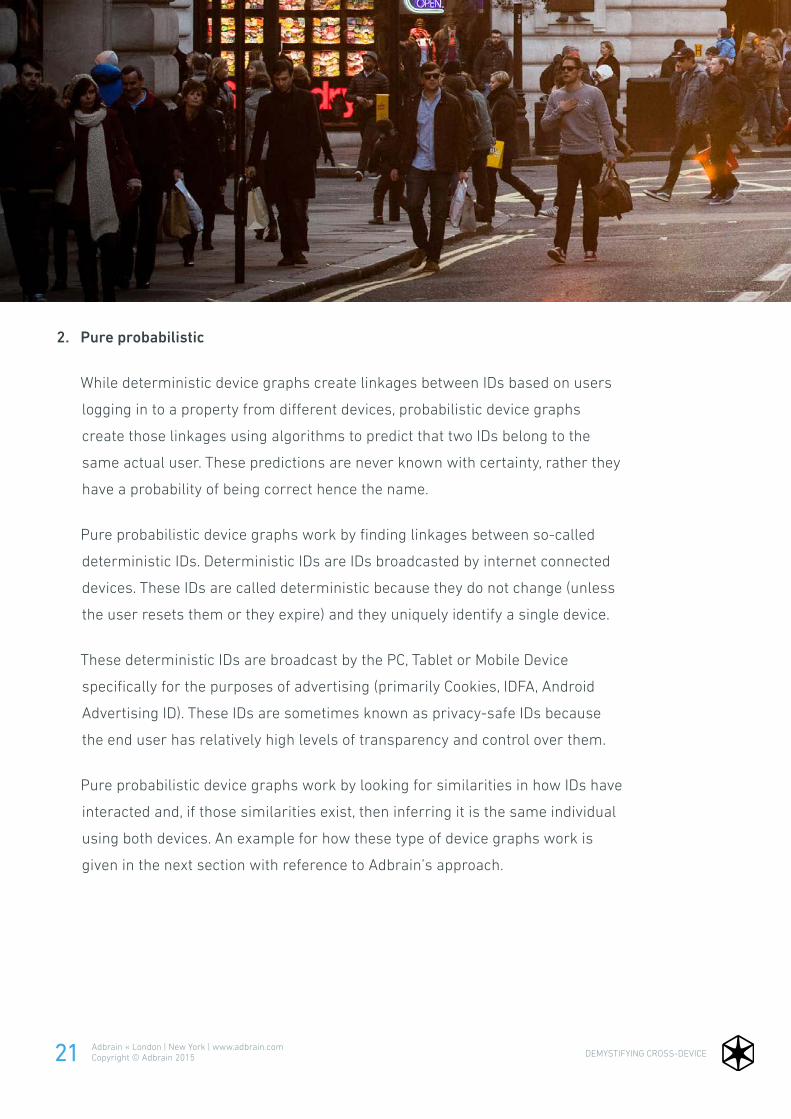
2. Pure probabilistic
While deterministic device graphs create linkages between IDs based on users
logging in to a property from different devices, probabilistic device graphs
create those linkages using algorithms to predict that two IDs belong to the
same actual user. These predictions are never known with certainty, rather they
have a probability of being correct hence the name.
Pure probabilistic device graphs work by finding linkages between so-called
deterministic IDs. Deterministic IDs are IDs broadcasted by internet connected
devices. These IDs are called deterministic because they do not change (unless
the user resets them or they expire) and they uniquely identify a single device.
These deterministic IDs are broadcast by the PC, Tablet or Mobile Device
specifically for the purposes of advertising (primarily Cookies, IDFA, Android
Advertising ID). These IDs are sometimes known as privacy-safe IDs because
the end user has relatively high levels of transparency and control over them.
Pure probabilistic device graphs work by looking for similarities in how IDs have
interacted and, if those similarities exist, then inferring it is the same individual
using both devices. An example for how these type of device graphs work is
given in the next section with reference to Adbrain’s approach.
Adbrain « London | New York | www.adbrain.comCopyright © Adbrain 201522 DEMYSTIFYING CROSS-DEVICE
Advantage:
• Probabilistic solutions tend to scale. The only limiting factors are the
quantity and quality of input data and the robustness of the technology.
• These solutions are also highly respectful of end user privacy if the vendor
has set up an appropriate policy.
Disadvantages:
• By nature probabilistic device graphs will never be 100% correct.
• They require a huge amount of input data and sophisticated math, so these
are hard for Marketers to build in-house. This is also a costly process that
may be passed on to the Marketer.
• This approach is highly dependent on devices broadcasting their
deterministic IDs, this poses a problem when such IDs are not available.

Adbrain « London | New York | www.adbrain.comCopyright © Adbrain 201523 DEMYSTIFYING CROSS-DEVICE
3. Probabilistic with statistical IDs
One downside with a pure probabilistic approach is that not all devices will
be broadcasting a deterministic ID. In other words there can be device “blind
spots” where no deterministic ID exists.
In particular, this blind spot exists for the Apple Safari web browser where
3rd party cookies are by default not allowed. For probabilistic solutions this
presents more of an issue since they rely on 3rd party cookies.
This blind spot means that some vendors with a probabilistic approach
to linking IDs will also take a probabilistic approach to creating the IDs
themselves. These vendors use code deployed to an actual device to create
a statistical ID (or fingerprint) when there is no deterministic ID being
broadcasted.
In other words, these probabilistic with statistical ID device graphs will try to
create a new ID for a device if that device isn’t broadcasting one.
Advantage:
• Smaller blindspots in the device graph due to absence of deterministic IDs.
Disadvantages:
• From a scale perspective this solution is imperfect since the vendor
can only create these statistical IDs if they have also had access to a device
to serve their code and therefore the device graph is constrained by
served impressions.
• From a privacy perspective the Marketer needs to assess the privacy risk
of choosing a vendor that uses these statistical IDs (even if they aren’t
using them for the Marketer specifically). Problems can arise when the
vendor creates a statistical ID for a user who has previously opted out,
this typically happens when a vendor has no record, or is unaware of the
user’s preference.

Adbrain « London | New York | www.adbrain.comCopyright © Adbrain 201524 DEMYSTIFYING CROSS-DEVICE
PROBABILISTIC DEVICE GRAPHS WITH DETERMINISTIC MATCH DATA
Vendors that use probabilistic methodologies are usually doing so in order to
maximize scale and coverage. However, those vendors can still use login based
deterministic linkage data to enhance their solution. In other words, these vendors
can use login based data to help develop the best performing probabilistic
algorithms. For example, the vendor may start by creating five versions of their
algorithm, and can then use login based data to understand which of those five
performs the best. Not only can the vendor now use the best performing algorithm,
but they can now also create five more variants of it and then find the best of those.
This process can be repeated many times over to create a kind of evolutionary
process. This is known as optimizing a device graph based on login data. Similarly,
a probabilistic device graph can be augmented with whatever (usually small
number of) known deterministic login based linkages that are available.
AN EXAMPLE OF PURE PROBABILISTIC MATCHING
Adbrain’s approach can be used as an example of a pure probabilistic matching
approach (although we do also enhance with deterministic login based linkages).
Our algorithms analyze our input data to predict the probability that different
devices belong to the same user by looking primarily at devices locations
throughout the day. When Adbrain does this it only uses the privacy safe
deterministic IDs available on devices that exist for advertising purposes.
For example, if a particular ID for a smartphone and a particular ID for a laptop are
often found together throughout the days and weeks, over time these two devices
can be predicted to belong to the same user.
This is a pure probabilistic approach because it doesn’t create any statistical IDs or
fingerprints and only estimates a probability that a user X is using devices Y and Z.

Adbrain « London | New York | www.adbrain.comCopyright © Adbrain 201525 DEMYSTIFYING CROSS-DEVICE
MEASURING DEVICE GRAPH PERFORMANCE
Perhaps the area where most discussion exists currently is around device graph
performance. Device graph performance means how “correct” the matches that a
vendor provides actually are. Correctness can be measured using three metrics:
accuracy, precision and recall.
ONE: Scale is as important as performance.
TWO: Accuracy is not the best measure for device graph performance.
THREE: Recall and precision are more useful metric, but there is a usually a
trade-off between these two.
SCALE VS PERFORMANCE
In order to measure these performance metrics the vendor needs access to
a source of ground truth – this is a data source that includes known matches
between IDs and known non-matches (i.e. when 2 IDs are paired and when 2 IDs
aren’t paired). This effectively means that vendors measure performance only for
the section of their device graph which overlaps with the truth set:
04
Truth Set
Vendor Device Graph
Measured Region
Adbrain « London | New York | www.adbrain.comCopyright © Adbrain 201526 DEMYSTIFYING CROSS-DEVICE
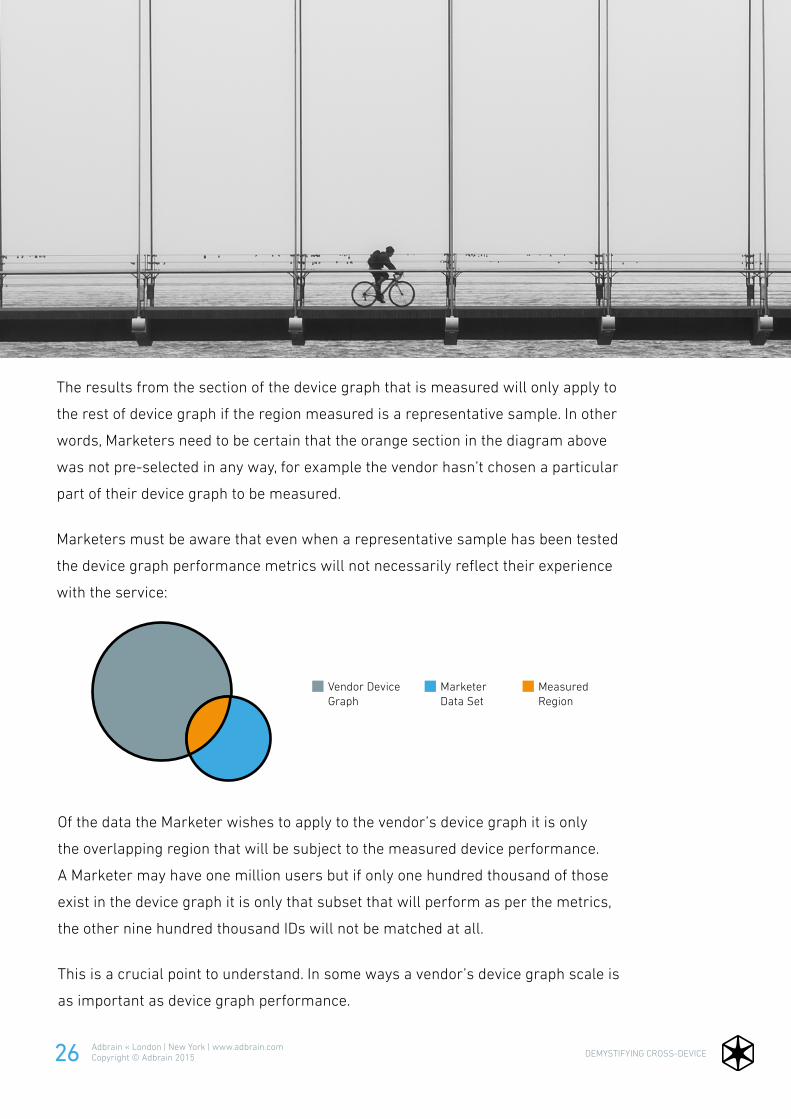
The results from the section of the device graph that is measured will only apply to
the rest of device graph if the region measured is a representative sample. In other
words, Marketers need to be certain that the orange section in the diagram above
was not pre-selected in any way, for example the vendor hasn’t chosen a particular
part of their device graph to be measured.
Marketers must be aware that even when a representative sample has been tested
the device graph performance metrics will not necessarily reflect their experience
with the service:
Of the data the Marketer wishes to apply to the vendor’s device graph it is only
the overlapping region that will be subject to the measured device performance.
A Marketer may have one million users but if only one hundred thousand of those
exist in the device graph it is only that subset that will perform as per the metrics,
the other nine hundred thousand IDs will not be matched at all.
This is a crucial point to understand. In some ways a vendor’s device graph scale is
as important as device graph performance.
Vendor Device Graph
Marketer Data Set
Measured Region

Adbrain « London | New York | www.adbrain.comCopyright © Adbrain 201527 DEMYSTIFYING CROSS-DEVICE
DEVICE GRAPH PERFORMANCE METRICS
“Accuracy” is the most commonly published metric by vendors.
The problem is that this is a commonly misunderstood metric, it’s not particularly
relevant when evaluating a vendor. Primarily this is because any reasonable device
graph will perform well on the basis of accuracy and therefore this metric is not highly
differentiating. For example, using independent validation data some existing vendors
have reported accuracy scores anywhere between 91% and 97%.6
WHAT IS ACCURACY?
Accuracy is the number of matches the vendor correctly identified as existing plus the
matches the vendor correctly identified as not existing divided by the total number of
predictions.
In other words it is the number of times the vendor got a prediction correct, including
non-match predictions, from all the predictions it made. This is not a very useful
measurement for the following reasons:
1. The Marketer usually derives less value if the vendor correctly predicts that a
linkage doesn’t exist than predicting correctly if one does.
2. Even an “unsophisticated” algorithm will deliver Accuracy because there are many
more non-matches than actual matches. For example:
a. There are 100 people in the world with 2 devices each
b. Therefore there is a total of 200 unique IDs
c. Therefore there are 19,900 possible pairs
d. Of which we know only 100 are correct (100 people with 2 devices)
e. There are 19,800 non-matched pairs (i.e 19,800 ID pairs that don’t exist)
f. An algorithm that randomly picks pairs of IDs as its non-match predictions
has a 99.5% (19,800/19,900) chance of being correct
g. An algorithm that predicts every possible pair combination will get an
accuracy of approximately 99.5%
To understand fully the Marketer can use the confusion matrix in the following section.
Adbrain « London | New York | www.adbrain.comCopyright © Adbrain 201528 DEMYSTIFYING CROSS-DEVICE
IF NOT ACCURACY, THEN WHAT?
Instead of accuracy the following two metrics are more useful measuresments:
• Recall - Of all the matches that actually do exist, how many did the vendor identify?
• Precision - Of all the matches that the vendor said were true, how many actually
were true?
The relevancy of these metrics will depend on what the Marketer is trying to achieve.
The Marketer must also understand the scale vs performance concept described above.
WHAT IS RECALL?
A high recall means that a vendor has predicted a large number of the matches
that exist, but tells us nothing about the number of matches predicted that didn’t
actually exist.
A vendor can improve recall by using a mathematical approach that is optimized
towards predicting all the linkages that really exist but doesn’t place any negative
weighting on incorrectly predicting linkages that weren’t true.
Therefore optimizing towards recall usually means that the majority of real linkages are
predicted but at the cost of predicting quite a few linkages that aren’t true.
WHAT IS PRECISION?
A high precision means that if the vendor predicts a linkage exists it is very likely to
be true, but tells us nothing about how many of the real linkages were predicted.An
approach to maximize precision could be to only predict a linkage only if there are
several data signals to reinforce that linkage at the expense of not predicting a probable
linkage where there is less corroborating data.
Optimizing towards precision therefore means that the linkages predicted are more
likely to be true, but at the cost of not predicting all of them.
Adbrain « London | New York | www.adbrain.comCopyright © Adbrain 201528
Adbrain « London | New York | www.adbrain.comCopyright © Adbrain 201529 DEMYSTIFYING CROSS-DEVICE
RECALL VS PRECISION
There is no reason why a device graph can’t have high precision and high recall.
However, typically improving one of these metrics comes at the expense of the
other.
For example, if I am trying to match siblings from a group of people I could optimize
the graph towards one of two goals:
• To maximize recall I could simple match together all people of a similar age.
This would mean I am likely to correctly match nearly all the real siblings but
also match together a lot of unrelated people.
• To maximize precision I could match based on age, hair colour, height, weight,
accent and eye colour. This would mean the siblings I predict are likely to be
accurate but I will probably miss some siblings (who happen not to share hair
colour, for example).
In practical terms for vendors using a probabilistic approach there is a trade-off
between creating a large set of linkages that have high recall vs a smaller set of
linkages that have high precision.
Some vendors will actually have two sets of algorithms to create sets of linked IDs
- one set of algorithms will create linkages that have high recall but low precision
and the other create a set of linkages that have high precision but low recall.
In other words some vendors have a recall optimized graph and a precision
optimized graph. In most cases Marketers will probably get most immediate value
from a recall optimized graph.

Adbrain « London | New York | www.adbrain.comCopyright © Adbrain 201530 DEMYSTIFYING CROSS-DEVICE
APPLICATIONS FOR RECALL
As a rule of thumb, for applications that involve delivering ads to a user to drive some
kind of transaction, a high recall is crucial. The Marketer will gain more by reaching all
the “in target” users across all devices compared to the cost of reaching some users
that aren’t “in target”.
This equation holds true because the cost of serving an ad is several orders of
magnitude less than the value of a successful transaction.
In other words, because media is relatively cheap the cost benefit of reaching some
“out of target” users to reach more “in target” users is positive, so you can think of this
as a net gain.
APPLICATIONS FOR PRECISION
As a rule of thumb, this metric is more important when we think about analytics and
understanding consumer journeys. For analytics the Marketer doesn’t want to draw
incorrect conclusions from incorrect linkages. Instead it is better to draw correct
conclusions from whichever subset of correct linkages is available. In other words the
benefit of exclusively analyzing data for truly matched IDs is greater than the cost of
not being able to analyze all the data available.
An exception to this rule might be where a Marketer is running a brand focused
campaign targeted to a particular audience that will be measured based on number of
impressions to “in target” users (e.g. GRP reporting). In that scenario precision would
again be useful as the “cost” of reaching one incorrect user is equal, or greater than,
the “benefit” of reaching one correct user.
Adbrain « London | New York | www.adbrain.comCopyright © Adbrain 201531 DEMYSTIFYING CROSS-DEVICE
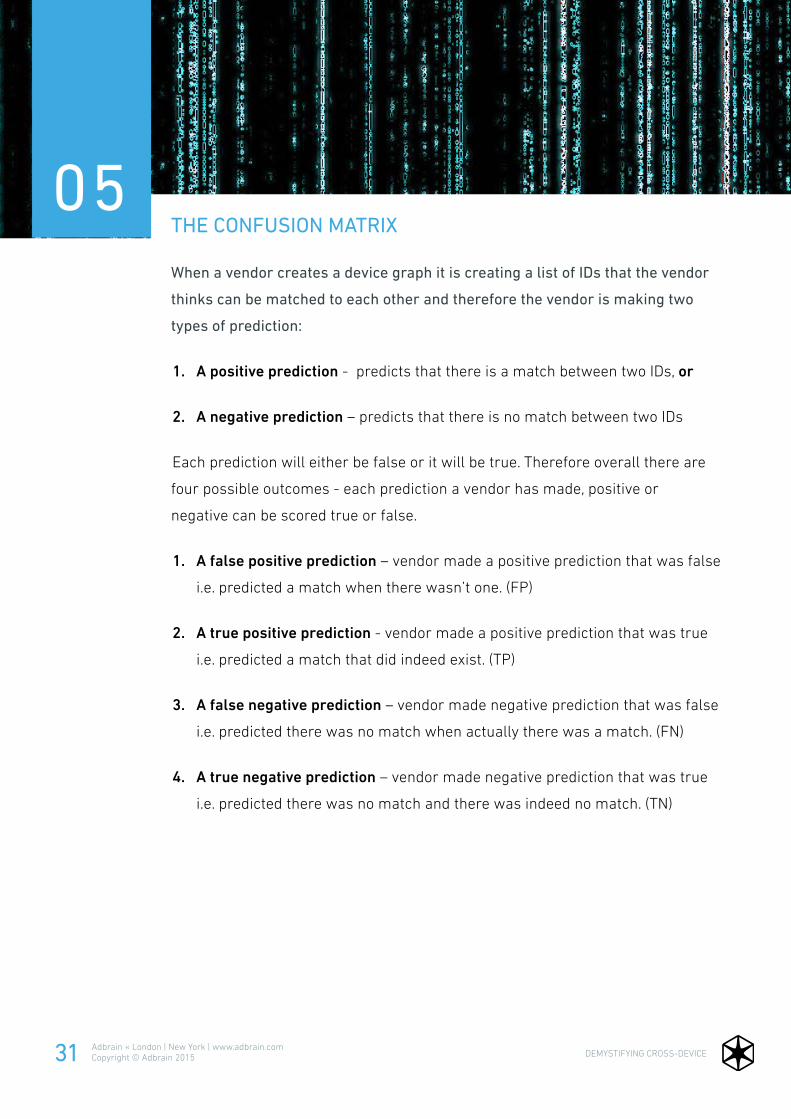
THE CONFUSION MATRIX
When a vendor creates a device graph it is creating a list of IDs that the vendor
thinks can be matched to each other and therefore the vendor is making two
types of prediction:
1. A positive prediction - predicts that there is a match between two IDs, or
2. A negative prediction – predicts that there is no match between two IDs
Each prediction will either be false or it will be true. Therefore overall there are
four possible outcomes - each prediction a vendor has made, positive or
negative can be scored true or false.
1. A false positive prediction – vendor made a positive prediction that was false
i.e. predicted a match when there wasn’t one. (FP)
2. A true positive prediction - vendor made a positive prediction that was true
i.e. predicted a match that did indeed exist. (TP)
3. A false negative prediction – vendor made negative prediction that was false
i.e. predicted there was no match when actually there was a match. (FN)
4. A true negative prediction – vendor made negative prediction that was true
i.e. predicted there was no match and there was indeed no match. (TN)
05

Adbrain « London | New York | www.adbrain.comCopyright © Adbrain 201532 DEMYSTIFYING CROSS-DEVICE
Mathematically:
Recall = TP / (TP + FN)
Precision = TP / (TP + FP)
Accuracy = (TP + TN) / (TP + FP + TN + FN)
Because true negative predictions are always an order of magnitude bigger than
any other predictions (simply because a single ID is only paired to a tiny fraction of
all the other IDs in the world) the accuracy equation means this metric will tend to
100%:
TN >> TP, FP, FN
(TP + TN) / (TP + FP + TN + FN) trends to TN / TN

Adbrain « London | New York | www.adbrain.comCopyright © Adbrain 201533 DEMYSTIFYING CROSS-DEVICE
EXECUTING A DEVICE GRAPH PERFORMANCE TEST
In order to do this the vendor needs access to a truth set (that contains known
matches and non-matches). Once they have this they can construct a confusion
matrix and score their predictions:
IDVENDOR PREDICTION
TRUTH SET
IDVENDOR SCORE
c1 IS MATCHED TO IS MATCHED TO d1 TRUE POSITIVE
c2 IS MATCHED TO IS MATCHED TO d2 TRUE POSITIVE
c3 IS MATCHED TO IS NOT MATCHED TO d3 FALSE POSITIVE
c4 IS NOT MATCHED TO IS NOT MATCHED TO d4 TRUE NEGATIVE
c5 IS NOT MATCHED TO IS MATCHED TO d5 FALSE NEGATIVE
c6 IS NOT MATCHED TO IS MATCHED TO d6 FALSE NEGATIVE
EXAMPLE EVALUATION OF DEVICE GRAPH PERFORMANCE:
ADBRAIN’S METHODOLOGY
Adbrain has validated its recall optimized device graph using truth data sets
provided by Twine Data. We used our recall optimized device graph since this
matches the use case for many of our customers.
Using the evaluation methodology described below, Adbrain has validated its recall
optimized device graph with a Recall of 85%. The accuracy was 95%.
Twine Data manage a network of publishers and merchants who provide them with
login based mobile ID pairs for the US market; in other words Twine can provide
data that tells Adbrain with perfect confidence that Mobile Advertising ID A belongs
to the same user as Mobile Advertising ID B.

Adbrain « London | New York | www.adbrain.comCopyright © Adbrain 201534 DEMYSTIFYING CROSS-DEVICE
The type methodology Adbrain adopted to measure performance of our device graph is a more complex version of the following:
STEP ONE
Create a list of all the matches predicted
as existing (positive predictions) and all
the matches predicted as not existing
(negative predictions).
ADBRAIN POSITIVE PREDICTIONS
A B
C F
D F
F G
ADBRAIN NEGATIVE PREDICTIONS
A C
A D
A F
A G
B C
B D
B F
B G
C D
C G
D G
PARTNER KNOWN POSITIVES
A B
A F
A H
D J
PARTNER KNOWN NEGATIVES
A J
A D
H B
H F
H J
H D
B F
B J
B D
F J
D F
STEP TWO
Examine validation partner’s known
matches and known non-matches.
“ ”

Adbrain « London | New York | www.adbrain.comCopyright © Adbrain 201535 DEMYSTIFYING CROSS-DEVICE
STEP THREE
Logically, in order to score a pair that Adbrain has predicted, the validation
partner has to have data for both the IDs in the predicted pair.
Therefore we filter the records predicted by Adbrain and the records in the truth
set to only those pairs that contain IDs known to both partners.
For example, the validation partner has no knowledge of ID C or ID G and Adbrain
has no knowledge of ID H or ID J. Predicted pairs that include those IDs are
removed from the analysis:
ADBRAIN POSITIVE PREDICTIONS (FILTERED)
A B
C F
D F
F G
ADBRAIN NEGATIVE PREDICTIONS (FILTERED)
A C
A D
A F
A G
B C
B D
B F
B G
C D
C G
D G
ADBRAIN POSITIVE PREDICTIONS (FILTERED)
A B
A F
A H
D J
ADBRAIN NEGATIVE PREDICTIONS (FILTERED)
A J
A D
H B
H F
H J
H D
B F
B J
B D
F J
D F

Adbrain « London | New York | www.adbrain.comCopyright © Adbrain 201536 DEMYSTIFYING CROSS-DEVICE
STEP FOUR
Build the confusion matrix and compute metrics.
IDADBRAIN PROBABILISIC
PARTNER KNOWN
IDADBRAIN SCORE
A IS MATCHED TO IS MATCHED TO B TRUE POSITIVE
D IS MATCHED TO IS NOT MATCHED TO F FALSE POSITIVE
A IS NOT MATCHED TO IS NOT MATCHED TO D TRUE NEGATIVE
A IS NOT MATCHED TO IS MATCHED TO F FALSE NEGATIVE
B IS NOT MATCHED TO IS NOT MATCHED TO D TRUE NEGATIVE
B IS NOT MATCHED TO IS NOT MATCHED TO F TRUE NEGATIVE
Recall = TP / (TP + FN) = 1 / (1+1) = 50%
Precision = TP / (TP + FP) = 1 / (1 + 1) = 50%
Accuracy = (TP + TN) / (TP + FP + TN + FN) = (1 + 3) / (1 + 1 + 3 + 1) = 67%
INTERPRETING DEVICE GRAPH PERFORMANCE
When evaluating device graph performance it is prudent to evaluate these results
with the following considerations in mind:
• The scale of the device graph overall, and its ability to scale further (in volume
and geographic coverage).
• Some vendors will evaluate a sample (i.e. the best performing sections)
of their device graphs. This is known as over-fitting and can produce
misleading results.
• Whether recall or precision are more important metrics to your business.

Adbrain « London | New York | www.adbrain.comCopyright © Adbrain 201537 DEMYSTIFYING CROSS-DEVICE
06SUMMARY
EVALUATION QUESTIONS
1. Consider whether or not you want a cross-device solution that can only be
accessed if you also buy media from the vendor.
2. Look for a vendor that can support as many applications as possible that can
also allow you to build differentiated products and services for your clients
and customers.
3. Look for vendors that are transparent about what data they use to create
their device graph and whether or not their approach can actually scale in
terms of volume, and different geographies.
4. Recognize which vendors are also a media business, and whether or not their
device graph operates independently of their media. For example, can they
provide a device graph in markets where they have no media footprint?
5. Consider the privacy components of a potential vendor – in particular think
carefully about any vendors that have a media footprint where they could
deploy fingerprint or statistical ID code.
6. Consider if login based pure deterministic device graphs will provide the
geographic scale you require.
7. If not, can additional vendors complement login based matches with
probabilistic device graphs?
Adbrain « London | New York | www.adbrain.comCopyright © Adbrain 201538 DEMYSTIFYING CROSS-DEVICE
8. Understand that device graph performance (accuracy, recall and precision) has to
balanced against scale - remember that the overlap between your data and the
vendors device graph is crucial.
9. Understand that accuracy is only one way of measuring device graph
performance. Precision and recall are often more useful. Ask the vendor about
recall in particular.
10. Ask vendors if they publish performance numbers only using a sample of
their graph, for example using a small amount of truth-set validation data to
over-fit results.
11. Finally, it is important to explore the kind of relationship you’ll have with a vendor.
The Marketer will likely benefit from a collaborative and transparent partnership
that suits specific business needs.

Adbrain « London | New York | www.adbrain.comCopyright © Adbrain 201539 DEMYSTIFYING CROSS-DEVICE
AND FINALLY, DEVICE GRAPH 2.0
When evaluating vendors, Marketers may be exposed to second generation device
graphs. These are probabilistic device graphs that are designed to provide the most
flexible and most scalable solutions.
These device graphs 2.0 have the following standout features:
Flexible access - Marketers can choose how and in which platforms they want to
use the vendor’s technology.
Data ownership - Input data to the device graph is collected independently of the
Marketer and not dependent on the Marketer’s data to function.
Scale - Device graph input data is not constrained in any way by the size or
geographic reach of the vendor’s media footprint / ad network.
Deterministically validated and optimized - The device graph is measured and
trained using an independent deterministic data set.
In the majority of cases most Marketers will benefit from a device graph 2.0,
including supplementing any login based device graphs available to the Marketer.
CONCLUSION

Adbrain « London | New York | www.adbrain.comCopyright © Adbrain 201540 DEMYSTIFYING CROSS-DEVICEAdbrain « London | New York | www.adbrain.comCopyright © Adbrain 201540
Marketers will likely find the development of cross-device solutions a complex
addition to the ecosystem since, as with all areas of innovation, there are many
new concepts to absorb. But the opportunity is massive, cross-device can drive
new marketing and enterprise applications, offering deeper user insights and more
memorable and rewarding consumer experiences.
This guide is designed to be educational, from here the Marketer should be
prepared to ask the tough questions and ultimately make an informed decision that
will empower them to truly transform their business.
For more information please visit www.adbrain.com or email your questions to

Adbrain « London | New York | www.adbrain.comCopyright © Adbrain 201541 DEMYSTIFYING CROSS-DEVICE
REFERENCES
1. https://www.thinkwithgoogle.com/research-studies/the-new-multi-screen-world-study.html
2. http://www.emarketer.com/Article/2-Billion-Consumers-Worldwide-Smartphones-by-2016/1011694
3. http://adage.com/article/media/digital-overtake-tv-ad-spending-years-forrester/295694/
4. https://www.exchangewire.com/blog/2014/10/06/many-businesses-will-benefit-from-a-core-stack
5. http://venturebeat.com/2015/01/28/facebook-passes-1-39b-monthly-active-users-and-890m-daily-
active-users
6. http://www.tapad.com/nielsen-study-finds-tapads-device-connections-91-2-percent-accurate
http://www.drawbrid.ge/news/p/drawbridge-cross-device-connected-consumer-graph-is-973-accurate