demonstration on the use of urine in urban agriculture
TRANSCRIPT
018530 - SWITCH Sustainable Water Management in the City of the Future Integrated Project Global Change and Ecosystems Deliverable D5.2.4 Annex 9
Demonstration on the use of urine in urban agriculture
Due date of deliverable: Actual submission date: M63 Start date of project: 1 February 2006 Duration: 63 months Organisation name and lead contractor for this deliverable: IWMI Revision [final]
Project co-funded by the European Commission within the Sixth Framework Programme (2006-2011)
Dissemination Level PU Public X PP Restricted to other programme participants (including the Commission Services) RE Restricted to a group specified by the consortium (including the Commission Services) CO Confidential, only for members of the consortium (including the Commission Services)

i
DEMONSTRATION ON THE USE OF URINE IN URBAN AGRICULTURE
APRIL 2011
FINAL REPORT
Cofie Olufunke,
Amoah Philip,
Egyir Irene,
Adamtey Noah,
and
Tettey-lowor Fredrick

ii
Executive summary
This report is an output of the Sustainable Urban Water Management Improves Tomorrow’s City’s Health (SWITCH) demonstration project, which took place in Accra, Ghana. Accra is one of the ten (10) demonstration cities under the SWITCH project. The main objective of the demo project was to demonstrate (as pilot) the potential of using urine for crop production in Accra Metropolitan Area (AMA) and provide recommendations for scaling up. Methodology The study was organized into three main parts: I) socioeconomic, II) agronomic, and III) training. The socioeconomic component had two parts: the financial feasibility and the perception studies. I) Socioeconomic part The socioeconomic part has two components: a) financial feasibility analysis and b) perception studies. In both cases the study adopted a triangulation approach. First, the theoretical framework was determined, then the methods of data analysis of each specific objective were identified and finally the data collection procedure. a) Financial feasibility analysis The methods used include: Cost Benefit Analysis (CBA) for the financial feasibility of using urine, partial budgeting for assessing the savings to be made by farmers and Contingent Valuation Method (CVM) was used and for willingness to pay analysis. In estimating the savings made by farmers when they use urine instead of chemical fertilizer, data from IWMI on yield of cabbage under different fertilizer treatments were used. The design of the urine collection system and the logistic needs of the entrepreneur at the Valley View University (VVU) were observed to verify existing literature. Equipment suppliers like Dizengoff Ghana Limited, Agrimat, Poly tank Ghana Limited and local enterprises were contacted to ascertain the market prices of the logistics needed for the establishment and operation and maintenance of the urine collection system in Ghana Cedis (GH¢).
b) Perception studies The perception assessment studies were in three parts: farmer’s perception on the use of human urine for vegetable production, marketers’ perception on the use of human urine for vegetable production and consumers’ perception on the use of human urine for vegetable production. A total of about three hundred and fifteen (315) respondents were interviewed. A pool of six questions was used to quantify consumer’s perception about the use of human urine for vegetable production. Data collection commenced by sensitizing the farmers after which face-to-face interviews were conducted with the aid of questionnaires.

iii
II) Agronomic part The purpose of this part of the study was to determine the effect of human urine (alone or in combination with other organic manure) on the growth/yield of cabbage, crop nutrient uptake and soil characteristics. The study was carried out in Accra, Ghana between September, 2009 and June 2010 using a field trial. A Randomised Complete Block Design (RCBD) was used and four different treatments (urine alone, urine + dewatered faecal sludge, urine + poultry droppings, NPK + poultry droppings and soil alone were applied. The chemical characteristics of the urine and the other fertilizer sources were determined using standard methods before application. Data on growth parameters were collected forth-nightly starting from the third day after transplanting. Yield parameters were determined at maturity. III) Training A series of training programmes were organized to demonstrate the potential of using urine as an alternative source of fertilizer for crop production in Accra Metropolitan Area (AMA). The main aim of the urine demonstration was to enhance the operational skills of farmers and Agricultural Extension Agents (AEA’s) of the Ministry of Food and Agriculture (MoFA) and other key stakeholders. A total of about six separate training programmes/meetings were organized between September 2009 and January, 2011. Methods used include presentation (both pictorial and power point), field observations, demonstrations, discussions, role plays etc. Main project findings Financial feasibility study The results of the study shows that there are many inbound, operations and outbound logistics that need to be budgeted for each year. The least cost (May 2010 prices) item is the mob stick and the greatest variable cost item is vehicle maintenance fees. Apart from organizing logistics for construction, procuring the dislodging vehicle is the greatest challenge. The operation of the urine collection and reuse system require administrative and managerial competence and these can all be found in the Central Business District (CBD) of the AMA. Urine generation in the CBD can be a reliable source of low-cost fertiliser for urban vegetable farming in the city of Accra as the volumes of urine generated by the urinals far exceed that which would be required for urban vegetable farming. About five thousand meter cube (5,000m3) of urine is generated yearly by these urinals as against two thousand meter cube (2000m3) which would be required for urban vegetable farming. The profitability level of the operations depended on whether the ownership was fully private or public. It also depended on the urinal user charge and urine sale charges agreed upon by the Assembly and the farmers. At the current situation of GH¢0.05
iv
urinal charge, the investment in urinal project will not be feasible for both a private and public sector entrepreneur. However, if the charge is increased by 100% and the sales price by 5 percent, then there will be profitability and the investment will be paid back in after 6 and 3 years for private and public owners, respectively. In one cropping season (usually 3 months), a cabbage farmer in Accra (of farm size 200 m2 -0.02 ha with a planting distance of 0.45m × 0.60m) would make a savings of GH¢24.60 for using S+PD+U as an alternative fertiliser in lieu of S+PD+NPK. . Perception Farmers with positive perception about urine quality will adopt the technology. The probability that male farmers will be willing to adopt the urine technology will increase by 26% more than females. Young farmers will be more willing to adopt the technology than the elderly. Farmers who use organic fertilizers probability of using the urine technology are higher than those who do not use organic fertilizers by 0.06. Marketers’ willingness to buy u-vegetables was influenced by their perception, gender, norm and religious influence. A unit increase in a marketer’s urine perception index increases the probability of willingness to buy u-vegetables by 0.03. Probability of willingness to buy u-vegetables was highest among marketer’s whose religious beliefs is not against the use of human urine for vegetable production than those whose religious belief is against human urine use on vegetable production by 0.585. . Fifty six percent (56%) of consumers do not want human urine to be disposed off as a municipal waste, although they (72%) could not tell what is in human urine that makes it a resource. Meanwhile, from the PCA results, about 44% of the consumers were willing to buy u-vegetables. These were people who perceive urine as a resource and their consumption of u-vegetables is independent of religious influence and norm in the society. Consumers mentioned a perceived health risk associated with the consumption of u-vegetables as a major concern that can influence their choice to consume u-vegetables. Consumers with alternative source of buying vegetables willingness to buy u-vegetables will decrease by 35 percent relative to consumers with no alternative source. However, a positive consumer perception about urine will increase his/her willingness to consume u-vegetables by 2.4%. The study also observed some potential barriers that can impede the successful introduction of the use of human urine on vegetables. These include the health effects, socio-cultural perceptions, environmental effects, technical know-how and economic effects. Agronomic study
The major lipophylic pharmaceutical residues expected to be present in the collected for the trial are chloroquine, amodiaquine and lumefantrine. The total nitrogen concentration (10.3 g L-1) was close to the total N concentration for undiluted fresh

v
human urine. Phosphorus and potassium values of 0.20 to 0.21 g L -1, respectively
were also close to what has been reported in literature. Between various treatments, there were no significant differences (P < 0.05) in the plant height, number leaves, canopy size, circumference of cabbage head, fresh and dry matter yield. However, cabbages treated with NPK + PD had the highest percentage (58.2%) of rotten cabbage heads. This was significantly higher than the other treatments. ‘Urine + DFS’ on the other hand had the lowest percentage (30%) of rotten cabbage heads. Soil residual nitrogen content for Urine + DFS and Urine + PD were significantly (P< 0.05) higher than that of NPK + PD. Even though urine could be an alternative source of nutrients for crop production applying it in combination with other organic fertilizer e.g. poultry droppings or dewatered faecal sludge produced better results. Training Results and lessons learnt Participants as well as Agricultural Extension Agents (AEAs) and other stakeholders are now aware of the potential of urine as a source of fertilizer for crop production and have understood how to apply urine, the potential health risks associated with the use and how to minimize these risks. Concerns raised by participants suggest that further research would be required to address them. These include:
• How users could receive regular supply of urine and how to obtain storage facilities.
• Application rates for various crops and how different would these rates be compared with that of cabbage
• The effect of urine on different soil types (especially sandy soil) as well as the effect on soil characteristics.
• How to reduce the bad odour of urine • Health concerns related to potential pharmaceutical residues
For up-scaling the results of the demo project further training and awareness creation would be required to improve the knowledge and skills of all stakeholders

vi
Table of contents Page Executive summary……………………………………………………………………………i List of tables…………………………………………………………………………………...ix List of figure……………………………………………………………………………………xi List of plates…………………………………………………………………………………...xii List of boxes…………………………………………………………………………………..xiii List of abbreviations……………………………………………………………………….....xiv Acknowledgements………………………………………………………………..………....xv CHAPTER ONE………………………………………………………………………………..1 1.0 Introduction………………………………………………………………………………..1
1.1 Description of SWITCH project………………………………………………..3 1.1.1 Objectives of SWITCH project………………………………………...4 1.1.2 Potential impact of SWITCH project………………………………….4
1.2 Organization of the Report……………………………………………………5 CHAPTER TWO……………………………………………………………………………….6 2.0 Financial feasibility of producing a urine-based fertiliser for vegetable
farming in Accra6 2.1 Methodology……………………………………………………………………6
2.1.1 Theoretical framework…………………………………………………6 2.1.2 Financial feasibility analysis………………………………………….6 2.1.3 Analysis of savings to be made by farmers………………………....8 2.1.4 Willingness to pay analyses………………………………………….9
2.2 Methods of data analyses…………………………………………………….10 2.2.1 Identifying the logistics needs of the entrepreneur………………...10 2.2.2 Determining the profitability of the urine-based
fertiliser production system…………………………………………...11 2.2.3 Estimating the savings made by farmers when they use
urine instead of chemical fertilizer…………………………………...13
2.3 Sources and methods of data collection…………………………………….13 2.3.1 Sources of data………………………………………………………...13
2.4 Results and discussion………………………………………………………. 14 2.4.1 The logistic needs of the entrepreneur who will invest
in urine-based fertilizer………………………………………………..14 2.4.2 Justification for inventory of logistics………………………………...18
vii
2.4.3 Profitability of the urine-based fertiliser production system……....19 2.4.4 Savings made by farmers when they use Urine
as an alternative fertiliser……………………………………………..22 2.4.5 Results of partial budgeting…………………………………………..27 2.4.6 Experiment on the use of S+PD+U and S+PD+NPK )…………….28
2.5 Conclusion……………………………………………………………………..29
CHAPTER THREE……………………………………………………………………………32 3.0 Perception and willingness of market actors on the use of human
urine as a source of fertilizer for vegetables production……………………..32
3.1 Methodology……………………………………………………………………….32 3.1.1 Assessing perception………………………………………………….32 3.1.2 Assessing factors that influence willingness to use urine
and u-vegetables………………………………………………………32 3.1.3 Sampling procedure…………………………………………………...35 3.1.4 Data collection………………………………………………………...35
3.2 Results and discussion………………………………………………………….37 3.2.1 Socio-demographic characteristics of respondents………………..37 3.2.2 Farmers’ perception of the use of human urine for
vegetable production…………………………………………………..43 3.2.3 Marketers perception on the use of human urine for
vegetable production…………………………………………………..46 3.2.4 Consumer’s perception of the use of human urine for
vegetable production…………………………………………………..49 3.2.5 Factors that influence farmers’ willingness to use
sanitized human urine for vegetable production…………………...52 3.2.6 Factors that influence marketers’ willingness to buy
U-vegetables…………………………………………………………...55 3.2.7 Factors that influence consumers’ willingness to buy
U-vegetables…………………………………………………………...56
3.3 Conclusions……………………………………………………………………57 CHAPTER FOUR……………………………………………………………………………..60 4.0 Use of human urine in urban and peri-urban agriculture: effect on
cabbage growth, yield, nutrient uptake and soil characteristics…………....60
4.1 The existing infrastructure…………………………………………………....60 4.2 Collection of urine for field trial……………………………………………….62

viii
4.3 Methodology of field trial………………………………………………………63
4.3.1 Experimental site………………………………………………………63 4.3.2 Experimental design…………………………………………………..64 4.3.3 Treatments and mode of application………………………………...64
4.3.4 Field operations………………………………………………………..65 4.3.5 Plant and soil analysis………………………………………………...66 4.3.6 Statistical analysis……………………………………………………..66
4.4 Results and discussion………………………………………………………..66
4.4.1 Chemical characteristics of treatments……………………………...66 4.4.2 Effect of various treatments on plant growth parameters………....67 4.4.3 Effect on soil characteristics………………………………………….75
4.5 Conclusion………………………………………………………………………....76
CHAPTER FIVE 5.0 Training on the use of urine as an alternative source of nutrient for
crop production: Risks and benefits, method of application, impact on crop yield and soil characteristics……………………………………………...
5.1 Introductory meeting with farmers, Agricultural Extension Officers and other stakeholders……………………………………………………………………..
5.2 The second training……………………………………………………………… 5.3 The third training…………………………………………………………………. 5.4 Results and lessons learnt………………………………………………………
5.4.1 The introductory meeting………………………………………………... 5.4.2 Second training………………………………………………………… 5.4.3 Third training……………………………………………………………..
CHAPTER SIX………………………………………………………………………………… 6.0 General conclusions and recommendations………………………………………
References……………………………………………………………………………………… Appendices……………………………………………………………………………………..

ix
List of tables Table Page 2.1 Standard layout for partial budgeting………………………………………..8 2.2 Fixed cost logistic items for the urine collection system…………………..17 2.3 Variable cost logistic items for the urine collection system………………..17 2.4 Financial analysis of the investment into urine-based fertiliser
production system under private ownership………………………………..20 2.5 Financial analysis of the investment into urine-based fertiliser
production system of public ownership……………………………………..22 2.6 Cross tabulation between educational level and Gender of
Respondents…………………………………………………………………...23 2.7 Distribution of respondents according to full time occupation……………24 2.8 Respondents land ownership and acquisition……………………………...25 2.9 Distribution of respondents according to farming experience………….....25 2.10 Distribution of respondents according to farm size………………………...26 2.11 Fertiliser and pesticides usage by respondents…………………………..26 2.12 Awareness of human urine as an alternative fertiliser………………….....27 2.13 Willingness to pay for the use of urine as an alternative fertiliser………..27 2.14 Partial budget to estimate the effect of substituting (S+PD+U) for
(S+PD+NPK) as fertiliser on a 200m2 cabbage farm……………………...28 3.1 Explanatory variables used in the probit model for farmers’
willingness to use urine as an alternative fertilizer…………………….....33 3.2 Explanatory variables used in the probit model for marketers’
willingness to use urine as an alternative fertilizer ………………………..34 3.3 Explanatory variables used in the probit model for consumers’
willingness to buy u-vegetables……………………………………………..34 3.4 Sample of market actors from selected AMA sub-metropolitan
Areas……………………………………………………………………….......36 3.5 Distribution of farmer respondents according to farming sites
in Accra…………………………………………………………………….......37 3.6 Socio-demographic characteristics of respondents……………………....39 3.7 Socio-economic background of marketers………………………………....40 3.8 Marketers’ criteria for assessing vegetable quality………………………..41 3.9 Socio-demographic background of consumers………………………........42 3.10 Income distribution of respondents…………………………………………43 1.11 Consumers’ criteria for assessing vegetable quality………………….......43 3.12 Perception of farmers on the use of human urine for vegetable
Production……………………………………………………………………..44 3.13 Correlation among farmers’ perception statements and factors
from PCA…………………………………………………………………........45 3.14 Perception of marketers on the use of human urine for vegetable
production……………………………………………………………………...47 3.15 Correlation among marketers’ perception statements and factors
from PCA……………………………………………………………………….49
x
3.16 Perception of consumers on the use of human urine for vegetable production………………………………………………………...50
3.17 Correlation among consumers’ perception statements and factors from PCA……………………………………………………………………...51
3.18 Regression results of farmers’ willingness to use urine as an alternative fertilizer (probit model)……………………………………….....54
3.19 Regression results of marketer’s willingness to buy u-vegetables from farmers (probit model)………………………………………………....55
3.20 Regression results of consumers’ willingness to buy u-vegetables from marketers (probit model)……………………………....57
4.1a Chemical characteristics of soil and other fertilizer sources…………….66 4.1b Chemical characteristics of soil and urine for second trial……………....67 4.2a Effect of urine and its related treatments on fresh weight, dry
weight and nutrient uptake of cabbage after first trial…………………...73 4.2b Effect of urine and its related treatments on fresh weight, dry
weight and nutrient uptake of cabbage after second trial………………74 4.3a Effect of urine and its related treatments on soil characteristics
after first trial…………………………………………………………………76 4.3b Effect of urine and its related treatments on soil
characteristics after second trial……………………………………………76

xi
List of figures Figure Page 1 Trends in fertiliser prices in Ghana, 2000-2008……………………………2 2.1 Schematic diagram of the stages involved in the urine collection
and distribution………………………………………………………………..11 2.2 Distribution of respondents according to religion………………………....23 2.3 Yield response of cabbage to different fertiliser application…………......29 3.1 Urban agricultural sites within Accra Metropolitan Area………………....36 3.2 Summary Statistics to double-bounded dichotomous choice
Questions……………………………………………………………………....53 4.1 Dzorwulu, the experimental site……………………………………………...63 4.2 Experimental design of the trial- A Randomised Complete Block
Design…………………………………………………………………………..64 4.3 Experimental unit showing plants for data collection in a
rectangle earmarked red……………………………………………………...64 4.4a Effect of urine and its related treatments on cabbage plant height
after first trial…………………………………………………………………...68 4.4b Effect of urine and its related treatments on cabbage plant height at
maturity after second trial…………………………………………………….68 4.5a Effect of urine and its related treatments on number of cabbage
leaves after first trial…………………………………………………………..69 4.5b Effect of urine and its related treatments on number of cabbage
leaves after second trail……………………………………………………...70 4.6 Effect of urine and its related treatments on canopy of cabbage
after first trail…………………………………………………………………..70 4.7a Effect of urine and its related treatments on rottenness of cabbage
heads after first trial ………………………………………………………….71 4.7b Effect of urine and its related treatments on rottenness of cabbage
heads after second trial……………………………………………………...72 4.8 Effect of urine and its related treatments on circumference of
cabbage heads after first trail……………………………………………….73
xii
List of plates Page 2.1 Small scale urine collection system………………………………………..15 2.2 Large scale urine collection system………………………………………...16 4.1 Big 2 B Ltd Urinals……………………………………………………………61 4.2 Storage container underneath the urinal………………………………….. 61 4.3 A standing Urinal used the Male…………………………………………….61 4.4 Bidets used by the female Clients…………………………………………..61 4.5 Outlet connection from the urinal showing the stop cock…………………62 4.6 Urine storage in poly tank container………………………………………...63 4.7 A Photo showing the distance between…………………………………....64 4.8 A farmer applying urine in holes a plant and a hole in which
urine is applied near the plants……………………………………………...64 4.9 Farmers weighing lettuce heads after the trial……………………………..66 4.10 Farmers weighing cabbages from different treatment plots……………...74 5.1 Photos showing lettuce fertilized with urine……………………………….79 5.2 Meeting with farmers on the benefits and risks of using urine as
Alternative source of fertilizer for crop production at Dzorwulu………….79 5.3 Seminar with the extension staff of the Ministry of Food and
Agriculture (MoFA), Accra on the benefits and risks of using urine in crop production……………………………………………………………...80
5.4 Farmers measuring harvested cabbage heads during the training……....84

xiii
List of boxes Box Page 5.1 Questions from farmers and MoFA staff and other key stakeholder…...............80 5.2 The field trial…………………………………………………………………………83 5.2 Questions from farmers and MoFA staff and other key stakeholders…………87

xiv
List of abbreviations AMA Accra Metropolitan Assembly BCR Benefit Cost Ratio CBA Cost Benefit Analysis CBD Central Business District CDF Cumulative Distributive Function CVM Contingent Valuation Method DFS Dewatered Faecal Sludge EPA Environmental Protection Agency FDB Food and Drugs Board GH¢ Ghana Cedis GSB Ghana Standard Board GTZ Deutsche Gesellschaft für Technische Zusammenarbeit IRR Internal Rate of Return IWMI International Water Management Institute LR Likelihood Ration LSD Least Significant Difference MLE Maximum Likelihood Estimate MoFA Ministry of Food and Agriculture NPK Nitrogen Phosphorus and Potassium NPV Net Present Value PBP Pay Back Period PCA Principal Component Analysis SWITCH Sustainable Urban Water Management Improves Tomorrows Citys Health UDDT Urine Diverted Dry Toilet VVU Valley View University WHO World Health Organization WIAD Women in Agricultural Development WMD Waste Management Department WTP Willingness To Pay WTU Willingness To Use

xv
Acknowledgements This (product) has been prepared within the framework of the European research project SWITCH. SWITCH is supported by the European Commission under the 6th Framework Programme and contributes to the thematic priority area of “Global Change and Ecosystems” [1.1.6.3] Contract no 018530-2.

1
CHAPTER ONE
1.0 INTRODUCTION
Ghana’s capital city is Accra and like most cities in the developing world it is experiencing rapid population growth and urbanization. This rapid urbanization has brought about urban poverty, food insecurity and severe environmental degradation (Tetteh-Lowor, 2007). To reduce the impact of food security in the city several cities including those in the developed countries have given attention to urban agriculture which is considered as part of the urban ecological system. Earlier studies in Accra observed that, up to 90 percent of the city’s fresh vegetable consumption is from production within the city (Cencosad 1994, Drechsel et al., 2006). Extensive urban agriculture takes place on seven main sites and there are about one thousand (1,000) vegetable farmers as well as other farmers who are engaged in some seasonal crops such as maize and cassava. In addition to this, a considerable number of households are engaged in backyard gardening. As at 2004, it was estimated that about 17 hectares of land was under cultivation for maize, 20 ha under cultivation for pepper, 104 ha under cultivation for okro and 14 ha under cultivation of tomatoes (Obuobie et al., 2006, Cofie et al., 2006). With the growing use of agrarian land for residential and office buildings, the area under cultivation is bound to reduce over the years. What will grow as a result of this phenomenon is the intensification of agriculture which requires the use of fertilizers to maintain soil fertility. Currently farmers in Accra, particularly operating commercial irrigated vegetable production use poultry manure and chemical fertilizers. The high cost of mineral fertilizers is a constraint to farming activities in the city (see figure 1). Hence availability of alternative sources of nutrient will enhance the productivity of urban agriculture. Alternatives such as urine have been suggested by several researchers and tested and accepted in economies like Finland, South Africa, Israel and China (Mang et al., 2007, Jönsson, 2003). Can the success story be replicated in Accra? May be yes; however the government of Ghana represented by the Ministry of Food and Agriculture (MoFA) is yet to start experiments to demonstrate the feasibility of urine based farming system. The International Water Management Institute (IWMI), Ghana in collaboration with both local and international organizations initiated this project to address this issue.

2
Figure 1: Trends in fertiliser prices in Ghana, 2000-2008 Accra is one of the ten (10) demonstration cities under one of its projects, Sustainable Urban Water Management Improves Tomorrow’s City’s Health (SWITCH) with work package 5.2 which focuses on urban and peri-urban agriculture. The project aims at developing possible interventions to effect significant improvements in agricultural production, and other livelihood activities using freshwater, storm and wastewater among others. As part of the project objectives, urine use as an alternative fertilizer in urban and peri-urban agriculture is being considered. Results of a rapid appraisal study in 2007, showed that, in Accra 95% of the city’s populace uses on site sanitation facilities (public toilet, bucket latrines, septic tanks) as the main means of sanitation (Cofie et al., 2007). This makes these places a potential source of nutrients and organic matter production for urban agriculture in Accra in the form of human excreta and urine. Public toilets are common, especially in the highly densely populated marginalized areas. Close to a third of the city’s households have no toilets in their homes and they therefore rely on public places of convenience. Furthermore, there are public urinals which are located within some of the densely populated residential areas and public places such as bus stations, markets and restaurants. Most of the urinals and public toilets that are located within and around the city centre are privately owned and are pay to use. Further results of the study carried out on 14 of the urinals which are located within the Central Business District (CBD) of Accra, revealed that 7.3 m3 of urine is generated per day. This is approximately 2.2 thousand m3 of urine per year. In terms of nitrogen content this volume represents 6.6 tonnes of plant available nitrogen. According to Wolgast (1993), the annual amount of human excreta of one person corresponds to the amount of fertiliser needed to produce 250 kg of cereal which is also the amount of

3
cereal that one person needs to consume per year. The value of human urine as nutrient can thus not be over emphasized. All that is needed is proper liquid waste collection and management technologies. Unfortunately these are generally absent in most public urinal facilities. It is speculated that there has been agreements between the Waste Management Department of the Accra metropolitan Assembly (AMA) and an entrepreneur; the latter was given a franchise to operate public urinals and properly disposed off the urine generated from these urinals at the waste disposal sites of AMA. Unfortunately this agreement has not been adhered to. Consequently all the urine that comes from these urinals are discharged directly into the drains and consequently into the Korle lagoon untreated thereby seriously polluting the water body. The environmental consequence of this practice is any bodies guess. In 2005, the GTZ documented the “Ecosan approach” to solving the sanitation problems of cities. It suggested that sanitation problems could be solved more sustainably and efficiently if the resources contained in excreta and wastewater are recovered and used rather than discharged into the water bodies and the surrounding environment (GTZ, 2005). Earlier in 2004, it was also reported that, an international group of planners, architects, engineers, ecologists, biologists, agronomists and social scientists had developed an approach to sanitation that saved water, does not pollute and returns the nutrients in human excreta (human faeces and human urine) to the soil (Winblad and Simpson-Hébert, 2004). It means that the current linear1
flow of plant nutrients in cities can be reversed. By harvesting and using urine for urban agriculture, a win-win situation can be achieved. It can reduce the pollution burden from current urine discharge into drains. It will serve as another fertilizer source for urban farmers.
1.1 Description of SWITCH project The International Water Management Institute’s (IWMI’S) SWITCH project proposed that “in collaboration with the private sector, an entrepreneur will adopt existing urinals within the Central Business District of Accra and adapt them to make urine collection possible. The entrepreneur will handle the transport of urine from the urinals to the farm. This approach will make it easier for the technology to be exploited by urinal operators within the city thereby contributing to a healthy environment and a reduction of the level of pollution in the Korle lagoon. The urine so collected will be used for demonstration purposes as an alternative fertilizer on one of the urban farming sites in Dzorwulu. The demonstration project will run for a period of two years. It will demonstrate to the farmers the right use of urine application and also a comparative analysis in the increase in yield of crops fertilized with urine as compared to chemical fertilizer, poultry manure and crops not fertilized at all. The innovation in this demonstration project lies in the integration of two sectors, the
1 This means that plant nutrients are taken up from the soil by the plant, transported to the market as crop, consumed in the form of food, excreted and discharged in the form of urine and faeces
4
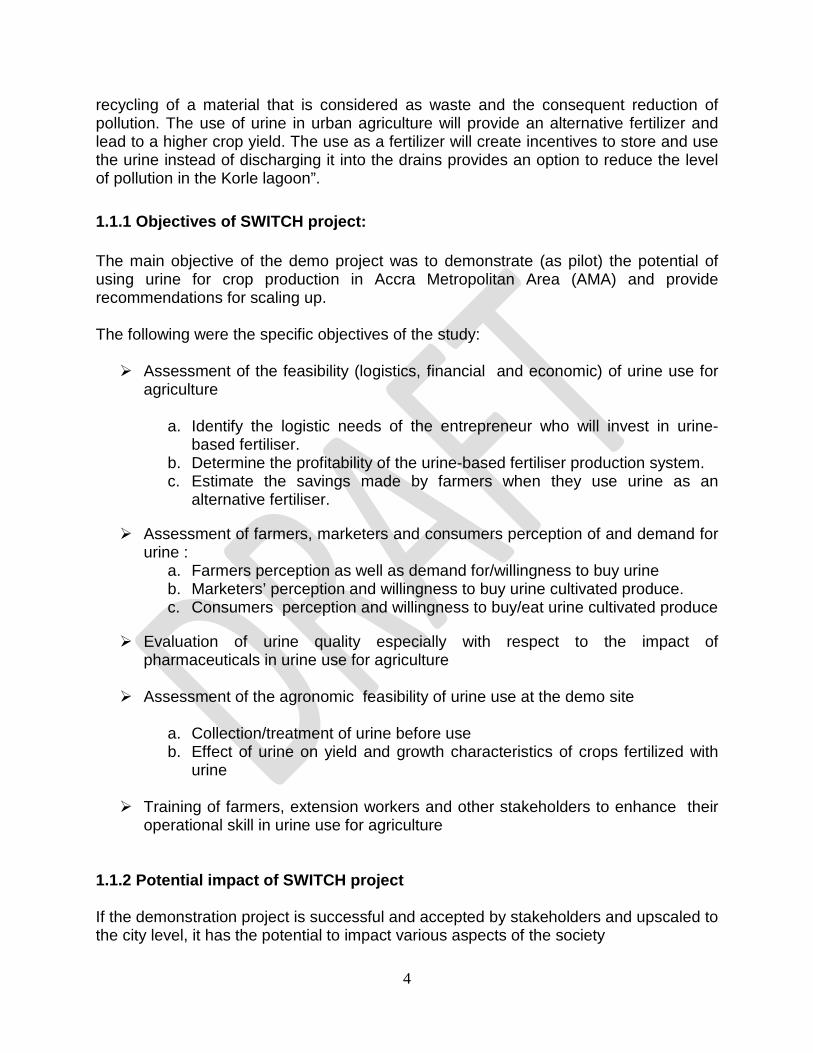
recycling of a material that is considered as waste and the consequent reduction of pollution. The use of urine in urban agriculture will provide an alternative fertilizer and lead to a higher crop yield. The use as a fertilizer will create incentives to store and use the urine instead of discharging it into the drains provides an option to reduce the level of pollution in the Korle lagoon”. 1.1.1 Objectives of SWITCH project: The main objective of the demo project was to demonstrate (as pilot) the potential of using urine for crop production in Accra Metropolitan Area (AMA) and provide recommendations for scaling up. The following were the specific objectives of the study: Assessment of the feasibility (logistics, financial and economic) of urine use for
agriculture
a. Identify the logistic needs of the entrepreneur who will invest in urine-based fertiliser.
b. Determine the profitability of the urine-based fertiliser production system. c. Estimate the savings made by farmers when they use urine as an
alternative fertiliser.
Assessment of farmers, marketers and consumers perception of and demand for urine :
a. Farmers perception as well as demand for/willingness to buy urine b. Marketers’ perception and willingness to buy urine cultivated produce. c. Consumers perception and willingness to buy/eat urine cultivated produce
Evaluation of urine quality especially with respect to the impact of pharmaceuticals in urine use for agriculture
Assessment of the agronomic feasibility of urine use at the demo site
a. Collection/treatment of urine before use b. Effect of urine on yield and growth characteristics of crops fertilized with
urine
Training of farmers, extension workers and other stakeholders to enhance their operational skill in urine use for agriculture
1.1.2 Potential impact of SWITCH project If the demonstration project is successful and accepted by stakeholders and upscaled to the city level, it has the potential to impact various aspects of the society

5
Environmental impact The nutrient load particularly on the Korle lagoon (which receives most of the municipal wastewater from the city) will be reduced drastically. Currently most of the municipal wastewater from Accra enters this water body untreated through the Odaw River. Several studies have shown that up to 80% of the total N load, and around 45% of the total P load in municipal wastewater originates from urine. A separation of urine therefore will improve the quality of this water body and reduce eutrophication. Socio-Economic impact Farmers, private entrepreneurs and municipal authorities would benefit from the intervention. The approach will cater for a new type of fertilizer. Urine application may increase crop yield between 2 to 6 times more than crops not fertilized at all. This will improve the crop yield of the farmers and increase their income, hence improve livelihood. Furthermore, the project will also provide employment for those who will be engaged in transporting the urine. Health impact There would also be positive impact on the public health from reduction in pollution and odour as nuisance from indiscriminate disposal of urine. Beyond Accra, the success of this intervention can be taken up across sub-Saharan Africa and other developing nations.
1.2 Organization of the Report The study is organized into three main parts, I, II and III. Part I is the socio economic component described in chapter 2 and 3. Chapter 2 describes the financial feasibility of producing a urine-based fertiliser for vegetable farming in Accra, Ghana whiles chapter 3 describes the perception and willingness of market actors on the use of human urine as a source of fertilizer. Part II which is on agronomy is describes the effect of urine on cabbage growth, yield, nutrient uptake and soil characteristics in chapter four of the report. Part III is on training of farmers and other stakeholders on the use of urine for crop production. This is described in chapter five. Chapter 6 is on general conclusions and recommendations for further studies.

6
CHAPTER TWO 2.0 Financial feasibility of producing a urine-based fertiliser for vegetable farming in Accra 2
This chapter presents the financial feasibility/profitability of the urine-based production system. It identifies the logistic needs of the entrepreneur who will invest in urine-based fertilizer production and estimate the savings that will be made by farmers when they use urine as an alternative source of fertilizer for crop production. 2.1 Methodology The methodology of the study adopted a triangulation approach. First, the theoretical framework was determined, then the methods of data analysis of each specific objective were determined and finally the data collection procedure.
2.1.1 Theoretical framework Human urine and vegetables produced from their use (here referred to as u-vegetables) are basically non-market goods (they are not sold on the market) in Ghana. In order to study its feasibility in terms of financial viability analysis and estimation of market actor’s willingness to process, distribute and pay for human urine and u-vegetables, several economic methodologies including hedonic pricing, cost‐benefit analysis, travel cost and cost‐effectiveness have been used. 2.1.2 Financial feasibility analysis For financial feasibility analysis, it is assumed that the project is an investment activity where capital resources will be expended to create a producing asset from which we can expect to realize benefits over an extended period of time (Gittinger, 1982). Hence, the profitability of a project can be appraised by both qualitative and quantitative analysis. Nevertheless, the most common appraisal method based on efficiency criteria is a general Cost Benefit Analysis (CBA) framework. Cost Benefit Analysis takes into account both financial and socio-economic costs and benefits to assess the comparative advantage of different options in monetary terms. A decision on the profitability of a project can be arrived by the estimation of the Net Present Value (NPV), Internal Rate of Return (IRR), the Benefit Cost Ratio (BCR) and the Pay Back Period (PBP) using equations (3.1), (3.2),(3.3) and (3.4) respectively(Gittinger, 1982 and Berry et al, 1979).
i. Net Present Value (NPV)
2 This chapter is a extract from an MSc theses by Mark Ofei (University of Ghana-Legon, Ghana)

7
Net present value is computed by finding the difference between the present worth of benefit stream less the present worth of cost stream.
A project is profitable or feasible if the calculated NVP is positive when discounted at the opportunity cost of capital. This would reflect a project where the present value of net benefits exceeds the present value of all capital and operating costs. The final result is a numerical value in Ghana cedis (GH¢). Where: = net cash flow in year of the project
Benefit in each year of the project Cost in each year of the project Interest (discount) rate 1, 2…20 (time of the project life in years) Number of years in the project, in this case 20 years
ii. Internal Rate of Return (IRR) Internal Rate of Return (IRR) is that discount rate which just makes the net present value (NVP) of the cash flow equal zero. It represents the average earning power of the money used in the project over the project life. It is also sometimes called yield of the investment. A project is profitable or feasible for investment when the internal rate of return is higher than the opportunity cost of capital.
iii. Benefit Cost Ratio (BCR) It is the ratio of present worth of benefit stream to present worth of cost stream.
The investment is said to be profitable when the BCR is one or greater than 1.

8
iv. Pay Back Period (PBP) The Payback period is the length of time required for an investment is able to pay itself out.
Where:
= initial investment of the project = the projected net cash flows per year from the investment.
The Pay Back Period is expressed in number of years and a project with a shorter PBP is normally good for an investor especially when the initial investment cost is higher. v. Sensitivity Analysis A sensitivity analysis is conducted to systematically test what would happen to the earning capacity of a project, here, the urine collection system if events change from that used in the initial planning of the project. This is done as a means of dealing with uncertainty about future events and values (Gittinger, 1982). The sensitivity analysis is carried out by varying the cost and benefits of the urine collection system and the effect on the outcome of the project worth is determined. 2.1.3 Analysis of savings to be made by farmers Partial budgeting is suggested for assessing the savings made due to a small change on a firm’s operations. It is considered as a managerial analysis technique as it looks at the changes in cost and receipts (benefit), that is net farm income, likely to result from marginal change in farming system (Johnson, 1982). The layout and valuations include new costs, costs saved, new revenue and lost revenue/income (Table 2.1). Table 2.1: Standard layout for partial budgeting
LOSSES GAINS
Income lost: New cost: Net gains
New income: Cost saved:
or Net loss
Source: Johnson, 1982 2.1.4 Willingness to pay analyses

9
Much of the current willingness to pay (WTP) analysis is based on Contingent Valuation Method (CVM) which elicits directly what individuals (here, farmers, marketers, consumers) would be willing to pay for a particular product or good (Misra et al., 1991; Huang et al., 1999; Boccaletti and Nardella, 2000; Batte et al., 2007; Posri et al., 2007). Individuals simply indicate their willingness to use and how much they would be willing to pay (WTP) without purchasing the (nonmarket) hypothetical product (in this study, human urine). A major drawback to CVM is that market actors may have little information about the risks involved and therefore they may give a wrong monetary evaluation of the benefit from risk avoidance. In order to go round this, researchers suggest a thorough description of the product (including risks and benefits involved) during the interview (Buzby et al., 1995; Fox et al., 1995). The decisions individuals face are assumed to be dichotomous; a farmer can decide to use human urine for vegetable production or not; a marketer/consumer will buy u-vegetables or not. These binary (yes/no) decisions require a binary response model during estimation (Greene, 2003). If there is an assumption of a cumulative distributive function (CDF) then the logit and probit models can be applied (Gujarati, 2004). In most applications, the choice between these two models seems not to make much difference. Several empirical studies have tried to capture the influence of socio-economic variables on farmer’s adoption decision (Rahm and Huffman, 1984; Hailu, 1990; Kebede et al., 1990; Adesina, 1996). In the current study, the requirement is to produce predictions consistent with the underlying theories of input demand (farmers and marketers) and consumer demand (consumers). The probit model was selected. The probit model is associated with the normal cumulative density function3
iZ
. The probit model is based on the premise that an individual decision [farmers to use human urine on vegetables or not; marketers and consumers’ willingness to buy u-vegetables or not] depends on a vector of Xi influential factors and unknown parameters, β. It assumes a theoretically continuous index, which is determined by the explanatory variables. i.e.
'i iZ X β= (Gujarati, 2004). A positive decision takes place only when the combined
effect of the influential and unknown parameters (Xi β) reach a certain unobservable critical value, *
iZ . The decision variable, Yi (the dichotomous dependent variable) takes the value of 1 if a positive decision is made and 0 otherwise; for example the dichotomous willingness to use human urine on vegetables for the ith farmer could be specified as:
(3.5)
where 1,2,...,
' *1 if ' *0 if
i N
X Zi iYi X Zi i
ββ
=
≥=
<
3 If a variable X follows the normal distribution with mean μ and variance σ2, its probability density function
(PDF) is 2 2( ) / 2
2
1( )2
Xf X e µ σ
σ π− −=
10
In the model the probability that
' * '
' * '
( 1) is given by Prob( 1) ( ) and (3.6)
( 0) is given by 1 Prob( 0) 1 ( )i i i i i i
i i i i i i
X Z Y P Y F X
X Z Y P Y F X
β β
β β
≥ = = = =
< = − = = = −
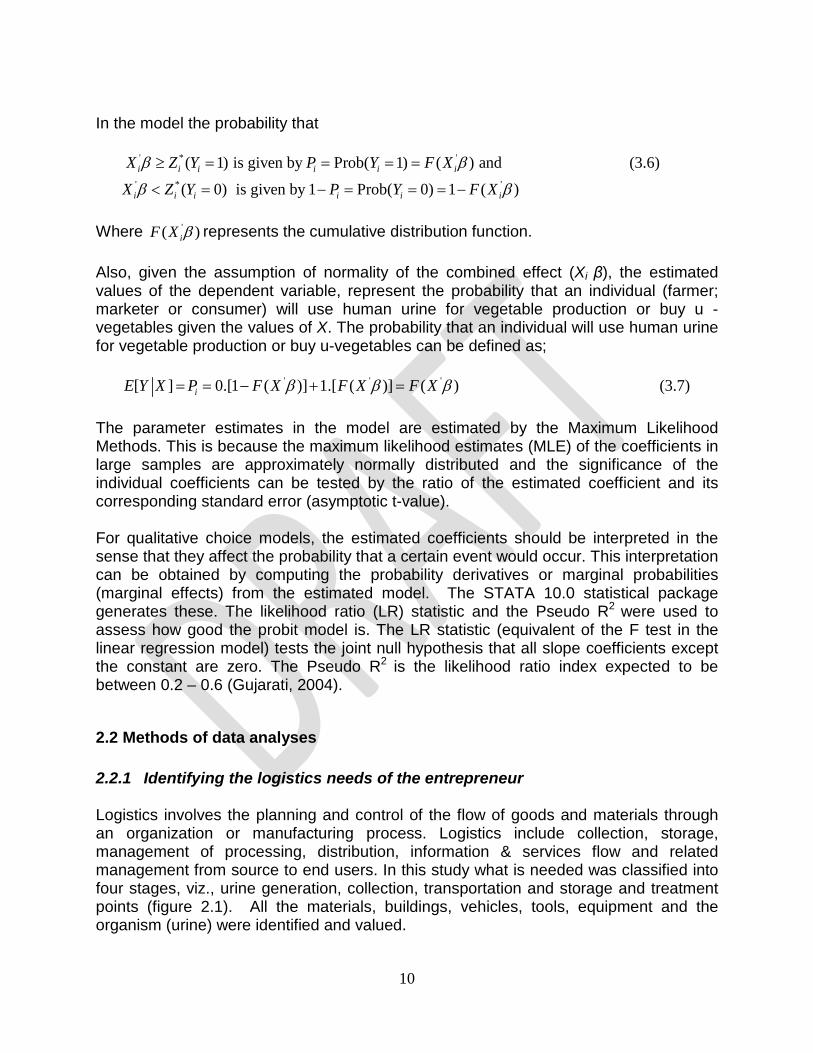
Where '( )iF X β represents the cumulative distribution function. Also, given the assumption of normality of the combined effect (Xi β), the estimated values of the dependent variable, represent the probability that an individual (farmer; marketer or consumer) will use human urine for vegetable production or buy u -vegetables given the values of X. The probability that an individual will use human urine for vegetable production or buy u-vegetables can be defined as;
' ' '[ ] 0.[1 ( )] 1.[ ( )] ( ) (3.7)iE Y X P F X F X F Xβ β β= = − + =
The parameter estimates in the model are estimated by the Maximum Likelihood Methods. This is because the maximum likelihood estimates (MLE) of the coefficients in large samples are approximately normally distributed and the significance of the individual coefficients can be tested by the ratio of the estimated coefficient and its corresponding standard error (asymptotic t-value). For qualitative choice models, the estimated coefficients should be interpreted in the sense that they affect the probability that a certain event would occur. This interpretation can be obtained by computing the probability derivatives or marginal probabilities (marginal effects) from the estimated model. The STATA 10.0 statistical package generates these. The likelihood ratio (LR) statistic and the Pseudo R2 were used to assess how good the probit model is. The LR statistic (equivalent of the F test in the linear regression model) tests the joint null hypothesis that all slope coefficients except the constant are zero. The Pseudo R2 is the likelihood ratio index expected to be between 0.2 – 0.6 (Gujarati, 2004).
2.2 Methods of data analyses 2.2.1 Identifying the logistics needs of the entrepreneur Logistics involves the planning and control of the flow of goods and materials through an organization or manufacturing process. Logistics include collection, storage, management of processing, distribution, information & services flow and related management from source to end users. In this study what is needed was classified into four stages, viz., urine generation, collection, transportation and storage and treatment points (figure 2.1). All the materials, buildings, vehicles, tools, equipment and the organism (urine) were identified and valued.

11
Figure 2.1: Schematic diagram of the stages involved in the urine collection and
distribution
It was assumed that 519 litres of urine can be collected in a day, and a person (male or female) spends 3 minutes in a cubicle. With the 3.4% population growth rate of the city the number of urinal cubicles required to collect urine after 10 years were increased. 2.2.2 Determining the profitability of the urine-based fertiliser production system In order to ascertain the profitability of the urine collection system, the total costs and total benefits were identified and valued based on the technological design. The total cost of the urine collection system was then estimated from the equation (3.8) below.
Where:
The total cost of the urine collection system. The total fixed cost of the urine collection system The total variable cost of the urine collection system
The total fixed cost or investment cost is the money required at the beginning of the project to finance or purchase materials, labour and any other costs related to construction and implementation of the urine collection system. Equation (3.9) was used to estimate the total fixed cost of the urine collection system.
Where:
= Construction of platform for the installation of male and female urinal = Construction and installation of underground storage tanks at source = Construction and installation of storage tanks at destination
Urine Generation Point
Urine Collection Point
Urine Transportation
Urine Storage and Treatment Point

12
= Installation of urinals on platform = Poly kiosk for attendants = Dislodging vehicle (used 6000 litre suction truck) = Dustbin
= Change of the suction truck tires every 5years = Waterless stand-alone urinals (for male)
= Waterless stand-alone urinals (for male) = Bidet (waterless urinal for female)
Sink The total variable cost ) or operational and maintenance cost of the urine collection system is the money that is required to sustain the system once it has begun operation. Equation (3.9) was used to estimate the total variable cost of the urine collection system.
Where:
= Mob stick = Mob bucket = Gloves = Detergent (allow GH¢ 20.00 per month for detergent) = Ground rent (30% of total revenue as mandated by AMA) = Registration fee (Business Operating Permit)
= Supervisors (salaries increases by 5% of previous every 2 years) = Secretary (salaries increases by 5% of previous every 2 years) = Driver for dislodging truck (salaries increases by 5% of previous every 2 years) = Attendants (2) (salaries increases by 5% of previous every 2 years) = Labourers for dislodging vehicle (2) (salaries increases by 5% of previous
every 2 years) = Fuel
2.2.3 Estimating the savings made by farmers when they use urine instead of chemical fertilizer In the urban vegetable farming system in Accra poultry manure is usually mixed with chemical fertilizers during soil fertility management. Hence the budgeting here included evaluation of the following: New costs that arose for using poultry manure + Urine

13
Explicit costs saved for not using Poultry manure + Chemical fertiliser Explicit income lost when Poultry manure + chemical fertilizer was not used New income obtained when Poultry manure + Urine was used
In terms of fertiliser usage, the main types of fertilisers that are used by the urban farmers are: NPK15-15-15, Ammonia Sulphate, Urea and Muriate of Potash. The net gain/loss was calculated as an arithmetic difference. Then the significance of the difference between the value and zero was tested using the chi-square. The mean values of costs and returns, obtained from which were the result of a demonstration project conducted by IWMI on the use of urine for cultivating cabbage on Dzorwulu farmers’ site. It was validated with survey data.
2.3 Sources and methods of data collection 2.3.1 Sources of data The study used data obtained from the following sources: International Water Management Institute (IWMI), provided data on yield of
cabbage (in kilogrammes) under different fertiliser treatments from a demonstration project which took place at Dzorwulu, on the use of urine and poultry manure to grow cabbage as compared to cabbage grown with NPK and poultry manure, data on volume and urine generation rate by some urinals in the Central Business District (CBD) in Accra in litres and project reports and existing studies on ecological sanitation systems relevant to this study were also obtained.
The design of the urine collection system and the logistic needs of the entrepreneur were observed at the Valley View University to verify existing literature. Also a local consultant and engineer of Safi Sana Company Limited was contacted to provide estimates in Ghana Cedis (GH¢) of the construction of platform for the installation of male and female urinal, construction and installation of underground storage tanks near the urine generation point and construction and installation of storage tanks at the storage and treatment point.
Equipment suppliers like Dizengoff Ghana Limited, Agrimat, Poly tank Ghana Limited and local enterprises were contacted to ascertain the market prices of the logistics needed in the establishment and operation and maintenance of the urine collection system in GH¢.
Questionnaires were issued to six hundred and fifteen (615) vegetable farmers, marketers and consumers several farming sites and markets in Accra to obtain data on awareness, perception and willingness to use and pay for human urine as an alternative liquid fertilizer. Other data included fertiliser and pesticide
14
utilisation, land size and ownership, harvesting and marketing of cabbage and common farmer practices.
Management of Big 2 Company Limited (a urinal operator), One Touch Waste Management (human excreta dislodging suction truck operator) and the Waste Management Department (WMD) of Accra Metropolitan Assembly (AMA) of Ashiedu Keteke Sub-metro were interviewed to obtain information on urinal and dislodging truck operation and maintenance including urinal user charges, labour, administrative and managerial charges and policies regarding the operation of urinal and excreta management in the Central Business District (CBD) of Accra.
2.4 Results and discussion The key findings of the financial feasibility study are presented and discussed according to the three specific objectives:
1. Identify the logistic needs of the entrepreneur who will invest in urine-based fertiliser.
2. Determine the profitability of the urine-based fertiliser production system.
3. Estimate the savings made by farmers when they use urine as an alternative fertiliser.
2.4.1 The logistic needs of the entrepreneur who will invest in urine-based
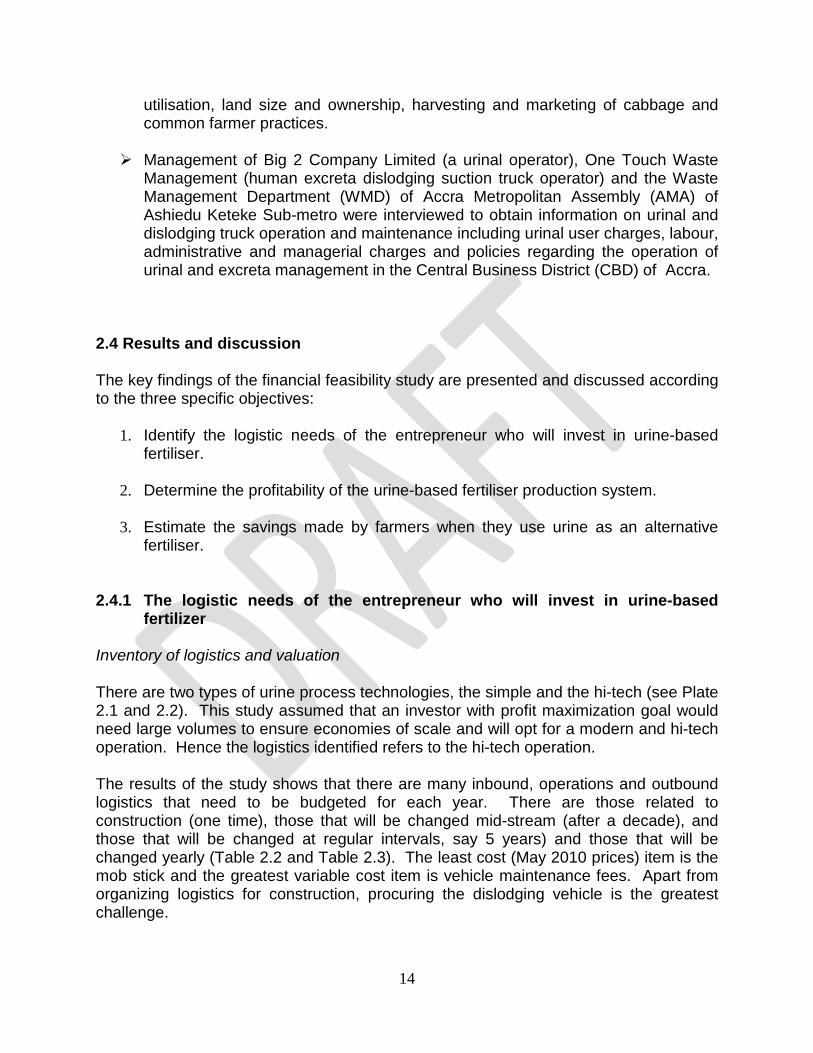
fertilizer Inventory of logistics and valuation There are two types of urine process technologies, the simple and the hi-tech (see Plate 2.1 and 2.2). This study assumed that an investor with profit maximization goal would need large volumes to ensure economies of scale and will opt for a modern and hi-tech operation. Hence the logistics identified refers to the hi-tech operation. The results of the study shows that there are many inbound, operations and outbound logistics that need to be budgeted for each year. There are those related to construction (one time), those that will be changed mid-stream (after a decade), and those that will be changed at regular intervals, say 5 years) and those that will be changed yearly (Table 2.2 and Table 2.3). The least cost (May 2010 prices) item is the mob stick and the greatest variable cost item is vehicle maintenance fees. Apart from organizing logistics for construction, procuring the dislodging vehicle is the greatest challenge.

15
Considering the logistic needs of the urine collection and reuse system, it can be concluded that it is a capital intensive project that would need financial support in its operation and sustenance. Technical expertise is also required to ensure efficiency of operation.
Plate 2.1: Small scale urine collection system
16
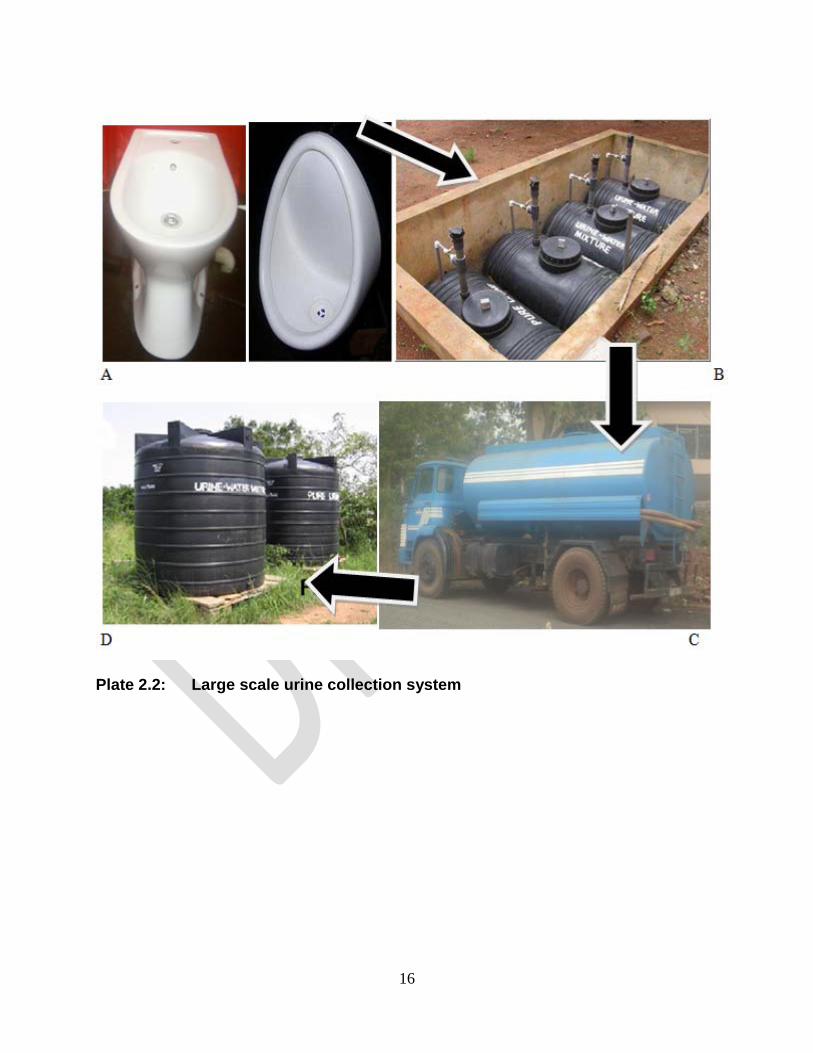
Plate 2.2: Large scale urine collection system

17
Table 2.2: Fixed cost logistic items for the urine collection system
Item Quantity Unit cost (GH¢)
Rank of cost
Lifespan (Years)
Construction of platform for the installation of male and female urinal
***
Construction and installation of underground storage tanks at source
***
Construction and installation of storage tanks at destination
***
Urinal cubicles 12 1200 3 20 Waterless stand-alone urinals (for male) 6 35 7 10 Bidet (waterless urinal for female) 6 135 6 10 Sink Dustbin 12 7 8 10 Poly kiosk for attendants 2 920 4 20 Poly tank( Rambo 850) 5 1265 2 20 Dislodging vehicle (used 6000 litre suction truck) 1 45000 1 20 Change of the suction truck tires every 5years 6 550 5 5 Source: Survey results (May 2010) ***See tables in Offei, 2010) for details
Table 2.3: Variable cost logistic items for the urine collection system Item Quantity Unit cost
(GH¢)) Rank of
cost Lifespan (Years)
Mob stick 2 4 13 1 Mob bucket 2 5 12 1 Gloves 6 7.5 11 1 Detergent (allow GH¢ 20.00 per month for detergent)
20 10 **
Ground rent (30% of total revenue as charged by AMA)
*** *** ***
Registration fee (Business Operating Permit)
140 9 1
Director(salaries increases by 5% of previous every 2 years)
1 1000 2 **
Supervisors (salaries increases by 5% of previous every 2 years)
1 800 3 **
Secretary (salaries increases by 5% of previous every 2 years)
1 700 5 **
Driver for dislodging truck (salaries increases by 5% of previous every 2 years)
1 300 6 **
Attendants (2) (salaries increases by 5% of previous every 2 years)
2 200 7 **
Labourer for dislodging vehicle (2) (salaries increases by 5% of previous every 2 years)
2 200 7 **
Fuel *** 720 4 1 Change of oil, filters and workmanship *** 1080 1 1 Source: Survey results (May 2010) **Monthly salaries

18
2.4.2 Justification for inventory of logistics Urine generation point At the urine generation level (the case of the large scale urine collection system), urinal cubicles are fitted on a platform which serves as an enclosed compartment that houses the urinal and give users privacy from the public. Inside these cubicles are waterless urinals made of ceramic for the collection of pure undiluted urine; usually standalone urinals for male and bidets for female (see pictures in Offei, 2010). Plastic tubes are connected from the urinal level which re-routes the urine generated to an underground storage tank near the urine generation point. Poly kiosks are also important to provide shade for the attendants who are responsible for the cleaning of the urinal and collection of urinal user charges and sale of urine to farmers. Other logistics at the urine generation point include dustbin, mob stick and basket and gloves. Urine collection stage The urine collection point consists of a suitably constructed underground structure with plastic holding tanks (see plate 2.2B which shows an underground holding tank at the Valley View University for urine collection). Due to the chemical composition of urine, the tanks are made airtight and kept at a minimum ventilation to retain plant available nutrients in the form of ammonia and also to minimise odour. These tanks are fitted with adapters to make suction possible. Also an overflow is connected to the tanks so that in cases of emergency, the urine will flow into the drain. The system is covered with precast slaps so that tanks are not visible to the public and also prevent rain water and the influx of unwanted materials. When the underground holding tanks are full, a suction truck is made available to empty their content and transported to a storage and treatment point close to a farm site or at one of the disposal sites of the Waste Management Department (WMD) of the Accra Metropolitan Assembly. Transportation The Central Business District of Accra in the Ashiedu Keteke sub-metro, where large volumes of urine is expected to be collected (as a result of the concentration of businesses ) is generally far from most farming sites in Accra where the storage and treatment point is expected to be located. The use of suction truck by the septic tank operators would lead to faecal contamination of the urine and therefore the introduction of pathogens in the urine. This means that the operator of the urine collection and reuse system need to acquire its own suction truck solely for the transport of the urine.

19
Storage and treatment The storage and treatment point of the urine collection and reuse system is very important; because at this point the urine could be kept for a minimum of one month and a maximum of six months (WHO, 2006) prior to usage on the farm. The storage process allows the formation and accumulation of bottom sludge (see equation 2.4) which contains urease, the enzyme active for the decomposition of urea to ammonium, thereby increasing the pH of the urine from 6 to about 9. This allows any existing pathogenic-microorganism no matter its source and calibre to die-off making the urine thoroughly sanitized and suitable for application on the farm. Usually, the storage and treatment tanks are arranged in such a way that while some tanks are being filled other tanks are being stored so that at a certain point in time while fresh urine is being filled some would be ready for use on the field.
2.4.3 Profitability of the urine-based fertiliser production system The results of the study showed that the profitability level of the operations depended on whether the ownership was fully private or public. A public corporate may overlook some costs due to ownership of some rights in land and other services which may not be paid for. It also depended on the urinal user charge and urine sale charges agreed upon by the Metro Assembly and the farmers respectively. Scenario A: Private ownership This is under the assumption that the urine-based fertiliser production system (all operations, from the point of urine generation through to the point of urine storage and treatment) is under the confines of a private profit oriented entrepreneur, who invests into the establishment of the system and its sustenance and benefited from the urinal user charges and sale of urine to farmers. It is important to note that currently the Accra Metropolitan Assembly (AMA) holds the sole responsibility to operate a urinal in the Metropolis. However, in-line with its privatization policy, private entrepreneurs are invited to operate the urinals on condition that 30% of the earnings (Total revenue) made by the entrepreneurs goes to AMA (AMA, 2006). At the current situation of GH¢0.05 urinal charge the investment in urinal project will not be feasible for a private entrepreneur. It would cost GH¢ 78,502.58 to establish the urine collection system and an average annual operating cost of GH¢ 55,900.32. The average annual benefit is GH¢ 46,601.74. The NPV of GH¢ -89,372.15 is less than zero (NPV < 0); it implies that the present value of incremental benefit is less than the present value of all investment and operating costs. The BCR of 0.59 is less than one

20
(BCR: 0.59:1). This means that for each GH¢ 1.00 invested at a discount rate of 25% would yield a return of GH¢ 0.59. The IRR is the rate at which the discounted benefit equals discounted costs and suggests the entrepreneur can still breakeven. However, in this scenario, the IRR is invalid suggesting that there is no any real discount rate that would make the NPV greater or equal to zero. It can be concluded under this scenario, investment into the urine-based fertiliser production system is not feasible and there would be no payback when the lifespan is 20 years and the discount rate is 25%. However, if the urinal user charge is increased by 100 percent and the sale price by 5 percent, then there will be profitability and after 6 years the investment will be paid back (Table 2.4) (see appendices 4.1 and 4.2 for details of the discounted cash flow of the financial analysis).
Table 2.4; Financial analysis of the investment into urine-based fertiliser production system under private ownership
Base situation (Urinal user fee = GH¢0.05) Investment cost (GH¢)
78,502.60 Total operating cost (GH¢)
1,062,106.04
Total benefit (GH¢)
885,433.00
NPV (25%) (GH¢) (89372.15) BCR (25%)
0.59:1
IRR
-
Sensitivity situation (Urinal user fee=GH¢0.10) Investment cost (GH¢)
78502.60 Total operating cost (GH¢)
1,062,106.04
Total benefit (GH¢)
1,770,866.00
NPV (20%) (GH¢)
8,147.79
BCR (20%) 1.03 IRR (%)
22.65
PBP (years)
5.44

21
Scenario B: Public Ownership This is under the assumption that; the AMA is the operator of the urine-based fertiliser production system and pays neither ground rent nor any annual Business Operating Permit which accounts for 33.8% of total operating cost (that is: saves an average operating cost of GH¢ 14,120.32 annually), it however makes all other investment and operating costs that the private operator would have made and benefited from the urinal user charges and sale of urine to farmer. In this scenario B, it is shown that it would cost GH¢78,502.58 to establish the urine-based fertiliser production system with an average annual operating cost of GH¢ 41,780.00. The average annual benefit would be GH¢ 46.601.74. At the current situation of GH¢0.05 urinal charge the investment in urinal project will not be feasible for a public sector entrepreneur. The NPV of GH¢ -50,699.01 is less than zero (NPV < 0), this means that the present value of incremental benefit is less than the present value of all investment and operating costs. The BCR of 0.71:1 is less than one (BCR: 0.71:1), this means that for each GH¢ 1.00 invested at a discount rate of 25% would yield a return of GH¢ 0.71 which is unable to recover the total investment and operating costs. Also IRR of 1.37% is far less than the discount rate of 25%. It can be concluded under this scenario that, investment into urine-based fertiliser production system would not be feasible and would not yield a payback within the 20 years of the project lifespan. However, if the urinal user charge is increased by 100 percent and the sale price by 5 percent, then there will be profitability and after 3 years the investment will be paid back (Table 2.5) (see appendix 4.3 and 4.4 in Ofei, 2010 for details of the discounted cash flow of the financial analysis).

22
Table 2.5: Financial analysis of the investment into urine-based fertiliser
production system of public ownership Base situation (Urinal user fee=GH¢0.05) Investment cost (GH¢)
78,502.60
Total operating cost (GH¢)
793,820.04
Total benefit (GH¢)
885,433.00
NPV (25%) (GH¢)
(50699.01)
BCR (25%)
0.71:1
IRR (%)
1.37
Sensitivity situation (Urinal user fee=GH¢0.10)
Investment cost (GH¢) 78,502.60
Total operating cost (GH¢) 793,820.04 Total benefit (GH¢)
1,770,866.00
NPV (25%) (GH¢)
68089.61
BCR (25%)
1.38:1
IRR (%)
51.45
PBP (years)
2.48
It can be concluded that investment into the urine-based fertiliser production system can be made feasible for operation by both a private entrepreneur and the Accra Metropolitan Assembly (public ownership). The right pricing system needs to be determined all the time. What is not determined yet is whether there is opportunity for increase in sale volumes which can also alter the benefit stream in favour of the entrepreneur. Whether new spaces will be made available for new farmers or additional fields acquired by old farmers cannot be determined. 2.4.4 Savings made by farmers when they use urine as an alternative fertiliser Socio-demographic characteristics The farmers whose views inform the results of the partial budgeting have somewhat variable socio-demographic characteristics. Majority (94%) are men, many (42%) have not received formal education (Table 2.6), majority (70%) are married, many (68%) are

23
of the Islamic faith (Figure 2.2) and majority (82%) work as full time farmers (Table 2.7). Many of the farmers are energetic; their ages are 50 years or below. Table 2.6: Cross tabulation between educational level and gender of
respondents
Pearson Chi-Square Value (14.252), DF (6), Probability (0.027) Source: Survey data (May, 2010)
Figure 2.2: Distribution of respondents according to religion (Source: Survey data (May, 2010)
Gender (n=300) Total Educational level of respondent Female Male None 2 56 58 Primary 3 37 40 JSS/Middle school 11 75 86 SSS 0 23 23 Post secondary 0 12 12 Tertiary 2 10 12 Non-formal 1 68 69 Total 19 281 300
24
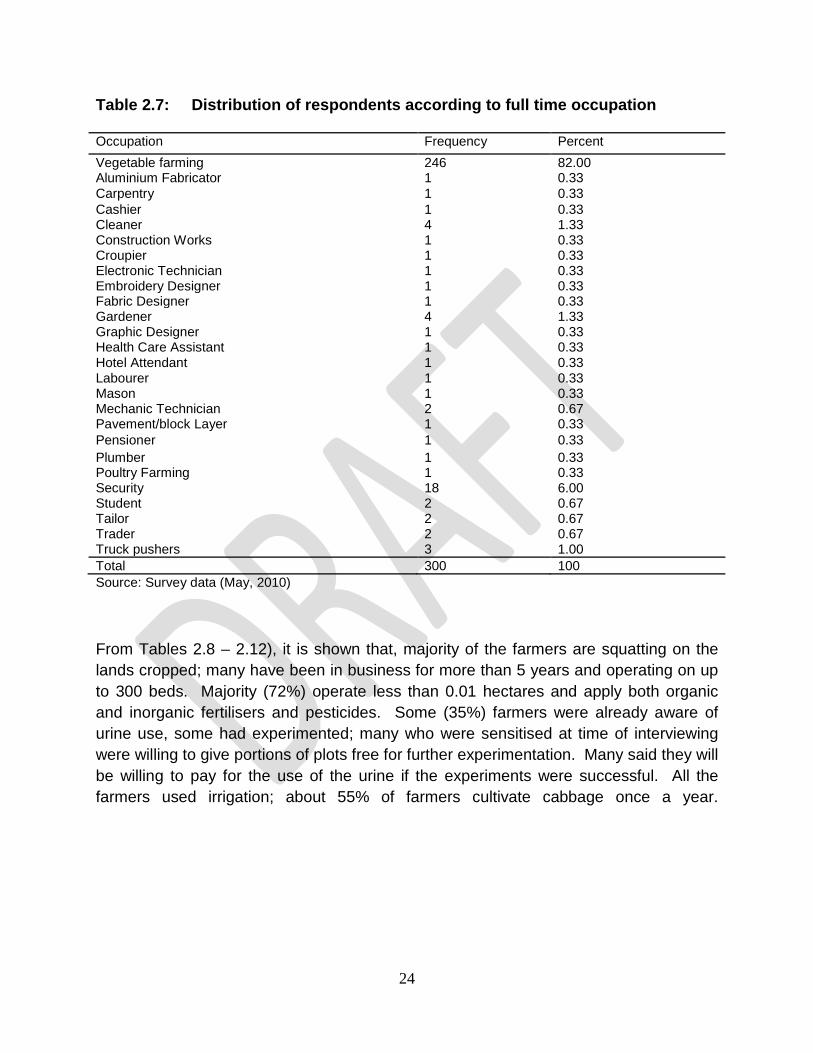
Table 2.7: Distribution of respondents according to full time occupation
Occupation Frequency Percent Vegetable farming 246 82.00 Aluminium Fabricator 1 0.33 Carpentry 1 0.33 Cashier 1 0.33 Cleaner 4 1.33 Construction Works 1 0.33 Croupier 1 0.33 Electronic Technician 1 0.33 Embroidery Designer 1 0.33 Fabric Designer 1 0.33 Gardener 4 1.33 Graphic Designer 1 0.33 Health Care Assistant 1 0.33 Hotel Attendant 1 0.33 Labourer 1 0.33 Mason 1 0.33 Mechanic Technician 2 0.67 Pavement/block Layer 1 0.33 Pensioner 1 0.33 Plumber 1 0.33 Poultry Farming 1 0.33 Security 18 6.00 Student 2 0.67 Tailor 2 0.67 Trader 2 0.67 Truck pushers 3 1.00 Total 300 100 Source: Survey data (May, 2010)
From Tables 2.8 – 2.12), it is shown that, majority of the farmers are squatting on the lands cropped; many have been in business for more than 5 years and operating on up to 300 beds. Majority (72%) operate less than 0.01 hectares and apply both organic and inorganic fertilisers and pesticides. Some (35%) farmers were already aware of urine use, some had experimented; many who were sensitised at time of interviewing were willing to give portions of plots free for further experimentation. Many said they will be willing to pay for the use of the urine if the experiments were successful. All the farmers used irrigation; about 55% of farmers cultivate cabbage once a year.

25
Table 2.8: Respondents land ownership and acquisition
Do you own the land you are operating on? Total Farming Site No Yes Dzorwulu 54 1 55 Roman ridge 25 0 25 Plant pool 22 0 22 Korle-bu 75 0 75 Osu-cantoment 30 0 30 La 35 6 41 Airport residential 52 0 52 Total 293 7 300 If no, how did you acquire it? Frequency Percent Rented/leased 1 0.3 Acquired from a friend/relative for free 28 9.6 From AMA or government at a fee 4 1.4 Sharecropping 5 1.7 Squatting on a private land 36 12.3 Squatting on a public land 209 71.3 Family land/traditional council 10 3.4 Total 293 100 Source: Survey data (May, 2010)
Table 2.9: Distribution of respondents according to farming experience Experience(years) Frequency Percent Mean 1- 2 44 14.7 3 – 5 34 11.3 6 – 8 30 10.0 9 – 11 32 10.7 12 – 14 21 7.0 15 – 17 31 10.3 5.6 years 18 – 20 36 12.0 21 – 23 7 2.3 24 – 26 12 4.0 27 – 29 6 2.0 30 – 32 17 5.7 33 – 35 8 2.7 36 & > 22 7.3 Total 300 100.0 Source: Survey data (May, 2010)

26
Table 2.10: Distribution of respondents according to farm size
Number of beds Mean number of beds
Frequency Percent Farm size /ha
6-8 7 5 1.7 0.01 10-20 15 54 18.0 0.02 21-30 26 44 14.7 0.04 31-40 36 51 17.0 0.05 41-50 46 35 11.7 0.06 51-60 56 19 6.3 0.08 61-70 66 9 3.0 0.09 71-100 86 25 8.3 0.12 101-120 111 5 1.7 0.15 121-130 126 4 1.3 0.17 131-140 136 1 0.3 0.19 141-150 146 4 1.3 0.20 151-300 226 10 3.3 0.31 > 300*** --- 34 11.3 ----
Total 300 100
Source: Survey data (May, 2010) *** Farm size: > 1 acre (> 0.4048 ha)
Table 2.11: Fertiliser and pesticides usage by respondents Do you use fertilizer? Do you use pesticides in
production?
Farm site No Yes Total Yes Total Dzorwulu 0 55 55 55 55 Roman ridge 0 25 25 25 25 Plant pool 0 22 22 22 22 Korle-bu 2 73 75 75 75 Osu-cantonment 0 30 30 30 30 La 3 38 41 41 41 Airport residential 1 51 52 52 52 Total 6 294 300 300 300 Source: Survey data (May, 2010)

27
Table 2.12: Awareness of human urine as an alternative fertiliser
Are you aware human urine has fertilizing potential as chemical fertilizer?
Total number of respondents
Farm site No Yes Dzorwulu 36 19 55 Roman ridge 7 18 25 Plant pool 8 14 22 Korle-bu 61 14 75 Osu-cantonment 22 8 30 La 25 16 41 Airport residential 36 16 52 Total 195 105 300 Pearson Chi-Square (33.391), DF (6), Probability (0.000) Source: Survey data (May, 2010)
Table 2.13: Willingness to pay for the use of urine as an alternative fertiliser Frequency Percent No 1 0.40 Yes 260 99.6 Total 261 100.0 Source: Survey data (May, 2010)
2.4.5 Results of partial budgeting The results of the partial budgeting analysis (effect of substituting Soil + Poultry Droppings + urine, S+PD+Ufor Soil +Poultry Droppings + NPK, S+PD+NPK) on a 200 metre square cabbage farm shows a net gain of approximately GH¢ 25.00 (see Table 2.1.4). When cabbage was fertilized with S+PD+U fertiliser (82.9g PD + 158.5cm3U), it increased the mean yield from 775.67g (of the no fertiliser application) to a mean yield of 1,080.07g (of S+PD+U application). There is an additional 304.4g when urine is applied together with other organic manures. The cost incurred is GH¢ 0.84. On the other hand, cabbage which was fertilized with S+PD+NPK fertiliser (82.9g PD + 10.9g NPK) gave a mean yield of 1,041.70g (that is 266.03g over the no fertilizer case); the cost incurred was GH¢ 1.46. In one cropping season (usually 3 months), a cabbage farmer in Accra (of farm size 200 m2 -0.02 ha with a planting distance of 0.45m × 0.60m) would make a savings of GH¢24.60 for using S+PD+U as an alternative fertiliser in lieu of S+PD+NPK. The revenue accrued to the farmer who uses urine is GH¢135.60 when the mean price of

28
cabbage is GH¢ 0.60 per kilogramme. On the other hand, revenue accruing to the farmer who does not use urine is GH¢118.20. Table 2.14: Partial budget to estimate the effect of substituting (S+PD+U) for
(S+PD+NPK) as fertiliser on a 200m2 cabbage farm LOSSES GAINS Income lost GH¢ New income GH¢
0.197 tonnes mean extra yield of cabbage at GH¢ 0.60/kg
118.20 0.226 tonnes mean extra yield of cabbage at GH¢ 0.60/kg
135.60
New costs Costs saved Fertiliser (S+PD+U): Fertiliser (S+PD+NPK): (61.4kg PD + 117.4L U) 3.70 (61.4kg PD +8.1kg NPK) 10.89 Net gain 24.59 GH¢146.49 GH¢146.49 Source: Survey data (May, 2010).
2.4.6 Experiment on the use of S+PD+U and S+PD+NPK (see details in chapter 4) The results of the demonstration project in Dzorwulu showed that with the exception of the first replication (R1), cabbage fertilized with poultry manure and urine (S+PD+U) gave higher yields in R2 and R3, than cabbage fertilized with poultry manure and chemical fertiliser (S+PD+NPK) (Figure 2.4). That is; in R1, yield of cabbage fertilized with S+PD+U gave a mean of 762.5g whilst yield of cabbage fertilized with S+PD+NPK gave a mean of 1089.0g. In R2, cabbage fertilized with S+PD+U gave a mean of 1260.7g whilst S+PD+NPK gave a mean of 1172.0g. Also in R3, mean yield of cabbage was 1217.0g and 864.1g for S+PD+U and S+PD+NPK, respectively. However, when the statistical significance was tested between yields of cabbage fertilized with S+PD+U and S+PD+NPK, the t-calculated gave a value of (0.26), but t-critical at 5% significant level gives a value of (2.13). Since t-cal. (0.26) > t-crit. (2.13), we do not reject the null hypothesis and conclude that there was no statistically significant difference in the yield between cabbages fertilized with S+PD+NPK and S+PD+U. This would mean that ceteris paribus, vegetable farmers in Accra have an alternative fertilising material.

29
Figure 2.4: Yield response of cabbage to different fertiliser application Source: Adamptey, May 2010 (drawn from Appendix 12) The results of the urine-use perception analysis suggest that if farmers are well sensitised and shown the usefulness of urine as an alternative fertiliser, they will give it a try and adopt it in the long run. Again the result of the experiment on yield also shows that there was a mathematical difference between use of urine and chemical fertiliser; the farmer is slightly better-off with the urine. The partial budget is carried out to ascertain the extent of cost saving, if any. However, when the statistical significance was tested between yields of cabbage fertilized with S+PD+U and S+PD+NPK, the t-calculated gave a value of (0.26), but t-critical at 5% significant level gives a value of (2.13). Since t-cal. (0.26) ˂ t -crit. (2.13), we do not reject the null hypothesis and conclude that; there was no statistically significant difference in the yield between cabbages fertilized with S+PD+NPK and S+PD+U. This would mean that ceteris paribus, vegetable farmers in Accra have an alternative fertilising material. 2.5 Conclusion The study revealed that the urine collection system is a capital intensive project considering the logistics that are involved. The system should have four (4) main features that would enable the collection of pure undiluted urine:

30
a urine generation point which comprises of a urinal with urinal attendant who clean the facility and takes user charges,
a urine collection point comprises of a well-constructed underground storage tanks connected to the urinal at the urine generation point with plastic tubes to allow urine to be collected and temporally stored,
a medium of transporting the collected urine; this involves a suction truck which is devoted solely for the transport of urine from the urine collection point near the urinal to the storage and treatment point,
storage and treatment point involves the installation of poly tanks for filling and storing urine to make the urine sanitised for application on the field.
The operation of the urine collection and reuse system require administrative and managerial competence and these can all be found in the Central Business District of the AMA. Urine generation in the CBD can be a reliable source of low-cost fertiliser for urban vegetable farming in the city of Accra as the volumes of urine generated by the urinals far exceed that which would be required for urban vegetable farming. That is, 5.2 thousand m3 of urine is generated yearly by these urinals as against 2 thousand m3
which would be required for urban vegetable farming. The cost-benefit analysis study (including sensitivity analysis) showed that both a profit-oriented entrepreneur and the Accra Metropolitan Assembly (AMA) who would wish to enter into such a business would not be successful if it is considered that the operation will last 20 years and the discount rate is 25% with a urine user fee of GH¢ 0.05 and sale of urine to farmers at GH¢0.30 per jerry-can (20 litres) as it gave negative NPVs (NPVs: GH¢ -89372.15 and GH¢ -50699.01), BCRs of less than one (BCRs: 0.59:1and 0.71:1) and IRRs of less than 25% (IRRs: - and 1.37%) respectively. However it is feasible for operation by both a private entrepreneur and the Accra Metropolitan Assembly (Public ownership), only if they charge a urine user fee of GH¢ 0.10 as it gave positive NPVs (NPVs: GH¢ GH¢ 8147.79 and GH¢ GH¢ 104901.34), BCRs of less than one (BCRs: 1.03 and 1.49) and IRRs of less than 25% (IRRs: 22.65% and 51.45%) and payback periods of 5.44 and 2.91 years respectively. The partial budgeting study showed that, in one cropping cycle (normally 3 month), a cabbage farmer with an average farm size of 0.02ha (200 m2) would make a savings of GH¢24.59 when they pay for and use sanitized urine as an alternative to the chemical fertiliser NPK. The farmer perception study revealed that many farmers (82%) perceive human urine to contain plant nutrients and that it should not be disposed off as municipal waste. About 89% of the farmers were willing to handle human urine as an alternative fertilizer. The socioeconomic characteristics of ‘likely users of human urine’ for vegetable production were similar to ‘non-likely users’. The PCA revealed that 90% of the farmers were more willing to embrace the urine technology to help improve their

31
yield. Farmers’ religion and norm in the society would not be an impediment to their use of the urine technology. However, the farmers expressed their willingness to discontinue the use of the human urine if u-vegetables were not patronized by consumers and marketers. The marketers’ perception study showed that some marketers (54%) do not want human urine to come close to any farm activity. They believe it has no nutrient value to be used for vegetable production. They also cited a perceived health risk factor on consumers and that many consumers would not patronize their produce. They said their religion would not be a stumbling block in their choice to buy u-vegetables however it would be influenced by the customary situation (as suggested by 60% of them) existing in the society (norms). Some marketers identified the reduction in cost (making vegetables cheaper on the market), the medicinal value inherent in human urine and the long lifespan of organic produce as the main reasons they would encourage farmers to use human urine as an alternative fertilizer on vegetables. Some marketers (48%) indicated they will look for alternative places other than Accra to buy vegetables if the ones produced in Accra are fertilized with human urine although most of the marketers (76%) were not aware of the use of human urine for vegetable production in the city of Accra. Marketers (77%) were not willing to buy u-vegetables at a higher price than the conventional ones. There was no distinct difference between the socio-economic characteristics of marketers who will likely buy u-vegetables and those who will not. The study concludes that marketers do not view human urine as a resource and their decision to buy u-vegetables or not is not backed by religion but rather norms in the society and possible health risk associated with the use of human urine for vegetable production on consumers. This can lead to customers not satisfied with their produce leading to a negative effect on their sales.

32
CHAPTER THREE 3.0 Perception and willingness of market actors on the use of human urine as a source of fertilizer for vegetables production4
This chapter presents the results of the assessment of farmer’s perception on the use of human urine for vegetable production, examines the factors that will influence marketer’s willingness to buy urine fertilized-vegetables (u-vegetables) from farmers, and assesses marketers and consumers perception on the use of human urine for vegetable production. It also examines the factors that will influence consumer’s willingness to buy u-vegetables from marketers. 3.1 Methodology 3.1.1 Assessing perception The assessment studies were in three parts: farmer’s perception on the use of human urine for vegetable production, marketers’ perception on the use of human urine for vegetable production and consumers’ perception on the use of human urine for vegetable production. A pool of six questions was used to quantify consumer’s perception about the use of human urine for vegetable production. In terms of item scores, “Strongly Agree” received 5 points, “Agree” received 4 points, “Neither Agree nor Disagree/Don’t know” received 3 points, “Disagree” received 2 points and “Strongly Disagree” received 1 point. To construct the perception variable, the 6 item scores for each respondent were first summed to obtain a total score. The total perception scores were then expressed as an index of relative urine perception index ranging from 0 to 100. An index value of 100 corresponds to the highest possible total score of 30 points. 3.1.2. Assessing factors that influence willingness to use urine and u-vegetables It was assumed that willingness to use a product will be affected by an individual’s perception about the product (urine/u-vegetable), level of school attainment, age, gender, location of farmer, religious influence, norm, knowledge of production, access to alternative source of the product, mode of soil conservation, farmers’ soil condition and urine availability. The dependent variable is whether an individual will use the product or not. If the farmer/marketer/consumer will use it takes the value of 1 and 0 otherwise. The expectations of the effect of selected variables on willingness to use are shown in
4 This chapter is a extract from the MSc thesis of Patrick Koomson (University of Ghana-Legon, Ghana)
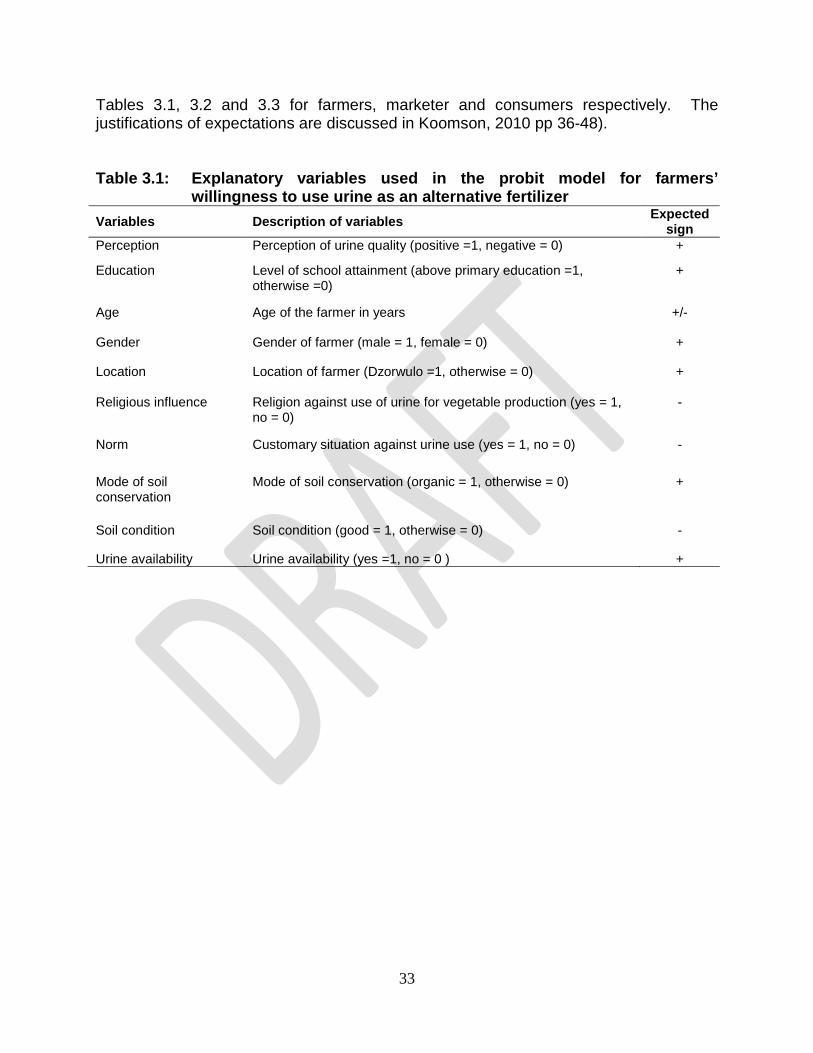
33
Tables 3.1, 3.2 and 3.3 for farmers, marketer and consumers respectively. The justifications of expectations are discussed in Koomson, 2010 pp 36-48). Table 3.1: Explanatory variables used in the probit model for farmers’
willingness to use urine as an alternative fertilizer Variables Description of variables Expected
sign Perception Perception of urine quality (positive =1, negative = 0) +
Education Level of school attainment (above primary education =1, otherwise =0)
+
Age Age of the farmer in years +/-
Gender Gender of farmer (male = 1, female = 0) +
Location Location of farmer (Dzorwulo =1, otherwise = 0) +
Religious influence Religion against use of urine for vegetable production (yes = 1, no = 0)
-
Norm Customary situation against urine use (yes = 1, no = 0) -
Mode of soil conservation
Mode of soil conservation (organic = 1, otherwise = 0) +
Soil condition Soil condition (good = 1, otherwise = 0) -
Urine availability Urine availability (yes =1, no = 0 ) +

34
Table 3.2: Explanatory variables used in the probit model for marketers’
willingness to use urine as an alternative fertilizer
Variables Description of variables Expected sign
Gender Gender of marketer (male = 1, female = 0) +
Age Age of the marketer in years -
Education Level of school attainment (above basic education =1, otherwise =0)
+
Marital status Marital status (married = 1, single = 0) -
Religious influence Religion against purchase of u-vegetables (yes = 1, no = 0) -
Norm Customary situation against u-vegetables (yes = 1, no = 0) -
Knowledge of production Knowledge of vegetable production (yes = 1, no = 0) +
Perception index Perception about human urine for vegetable production index (100 is highest, 0 least )
+
Table 3.3: Explanatory variables used in the probit model for consumers’
willingness to buy u-vegetables Variables Description of variables Expected
sign Gender Gender of consumer (male = 1, female = 0) + Age Age of the consumers in years - Education Number of years spent in formal education -/+
Marital status Marital status (Married = 1, Single = 0) -
Income Monthly income (in natural logarithm) -
Religious influence Religion against u-vegetables (Yes = 1, No = 0) -
Norm Customary situation against u-vegetables (Yes = 1, No = 0)
-
Access to alternative source Access to other source of vegetables than u-vegetables (Yes = 1, No = 0)
-
Urine perception index Perception about human urine for vegetable production index (100 is highest, 0 least )
+
35
3.1.3 Sampling procedure The loss of land to estate developers and widening of drains has led farming to be concentrated in some few areas in AMA, hence the purposive clustered sampling technique was employed in selecting the farm sites. With the exception of farmers in Dzorwulu (IWMI demonstration site), the other six farming sites were chosen for the fact that the urine technology for vegetable production is relatively unknown among these farmers allowing comparison on perception and attitudes of farmers to be made between them and farmers in Dzorwulu farm sites. In the case of the marketers, the market selected were major marketing centres in AMA. Also majority of the farmers sell their produce to market women from these market centres. Households in East Legon/Legon, Osu, La/Cantoments, and Dansoman were selected for their diversity in terms of cultural, social and economic characteristics which income, education, occupation and food shopping groupings. Nima/Maamobi was selected for the fact that Muslims are predominant in the area in order to compare the perceptions and attitudes of Muslims towards urine technology for vegetable production with non-Muslims. Random sampling is where sample selection of the population is entirely done at random. The random sampling technique was employed because of unavailability of suitable sampling frame for market actors and hence farmers, marketers and consumers were identified at random when they are available on the field, market and households respectively and were willing to participate in the research. In November 2009, a total of 315 respondents were selected and this included farmers, marketers and consumers. Table 3.5 presents the number of respondents selected from the various sub-metropolitan areas. In May 2010, the farmer survey was repeated to validate the earlier study and track new issues in partial budgeting (Table 3.6). Some of the farmers in the old survey were interviewed in the second survey. Since the sample is large enough, no grave consequences were expected in the analysis.
3.1.4 Data collection
Data collection commenced by sensitising the farmers after which face-to-face interviews were conducted with the aid of questionnaires. A description of the product was given to the respondents (see Appendix 3.1 section B of willingness to pay farmer questionnaire in Koomson, 2010) at the selected urban agricultural sites (Fig. 3.1).

36
Figure 3.1: Urban agricultural sites within Accra Metropolitan Area
Table 3.4: Sample of market actors from selected AMA sub-metropolitan areas Areas Sub-metropolitan area Number
Farmers Cantonments/La La 18 Dworwulo/Plant pool Ayawaso West-Wuogon 32 Airpot Ayawaso West-Wuogon 13 Korle Bu Ablekuma South 13 Marine Drive Osu-klottey 14 Total 90 Marketers Agbobloshie Ashiedu-Keteke 13 Malata Ayawaso Central 16 Makola Osu-Klottey 12 Kaneshie Okaikoi Soutth 31 Dansoman Ablekuma South 11 Total 83 Consumers Nima/Maamobi Ayawaso East 15 East Legon/Legon Ayawaso West-Wuogon 38 Osu Osu-Klottey 17 La/Cantoments La 29 Dansoman Ablekuma South 43 Total 142 Grand Total 315 Source: Koomson’s survey data (November, 2010)

37
Table 3.5: Distribution of farmer respondents according to farming sites in Accra
Farm site Frequency Percentages Dworwulu 55 18.3 Roman ridge 25 8.3 Plant pool 22 7.3 Korle-bu 75 25.0 Osu-cantoment 30 10.0 La 41 13.7 Airport residential 52 17.3 Total 300 100.0 Source: Offei’s survey data (May 2010)
3.2 Results and discussion
The key findings of the study are presented and discussed according to the six specific objectives: Assess farmers’ perception on the use of human urine for vegetable production
Assess marketers’ perception on the use of human urine for vegetable
production
Assess consumers’ perception on the use of human urine for vegetable production
Examine the factors that will influence farmer’s willingness to use sanitized human urine for vegetable production.
Examine the factors that will influence marketer’s willingness to buy u-vegetables from farmers.
Examine the factors that will influence consumer’s willingness to buy u-vegetables from marketers.
3.2.1 Socio-Demographic Characteristics of Respondents The respondents whose views informed the results of the perception and probit analyses have somewhat variable socio-demographic characteristics.

38
Farmers Majority (94%) are men and youthful, many (76%) have received formal education (Table 3.6), majority (60%) are married, many (54%) are of the Islamic faith and many (64%) have family sizes of five or less (Table 3.7). Marketers Majority (94%) are women and youthful, many (83%) have received formal education (Table 3.6), majority (70%) are married, many (85%) are of the Christian faith and many (54%) have family sizes of five or less (Table 3.7). Many marketers are concerned about the quality characteristics of the vegetables they purchase. (Table 3.8). Consumers The consumers interviewed are men and women of youthful ages, majority of them single and living with family, of mixed ethnicity and faith; many are literate (Table 3.9). They are of diverse income groups (Table 3.10). Many consumers are concerned about the quality characteristics of the vegetables they purchase (Table 3.11).

39
Table 3.6: Socio-demographic characteristics of respondents
Characteristics Location of farm (n=90)
Total Dzorwulo Airport La Korle-Bu Marine Drive
Gender Female 12.5 0.0 22.2 0.0 7.1 10.0 Male 87.5 100.0 77.8 100.0 92.9 90.0 Marital status
Married 46.9 61.5 72.2 61.5 71.4 60.0 Single 53.1 38.5 27.8 38.5 28.6 40.0 Age
Less than 20 6.3 0.0 0.0 0.0 7.1 3.3 20-29 28.1 46.2 11.1 0.0 14.3 21.1 30-39 18.8 15.4 5.6 46.2 14.3 18.9 More than 40 46.9 38.5 83.3 53.8 64.3 56.7 Household size
1 person 21.9 38.5 16.7 0.0 42.9 23.3 2-5 persons 37.5 23.1 50.0 61.5 35.7 41.1 6-10 persons 31.3 38.5 33.3 30.8 21.4 31.1 Above 10 persons 9.4 0.0 0.0 7.7 0.0 4.4 Ethnicity
Busanga 53.1 84.6 0.0 76.9 0.0 42.2 Ga/Adangme 9.4 0.0 77.8 0.0 71.4 30.0 Akan 6.3 7.7 11.1 0.0 14.3 7.8 Ewe 12.5 0.0 0.0 7.7 0.0 5.6 Mossi 6.3 7.7 0.0 0.0 0.0 3.3 Others 12.5 0.0 11.1 15.4 14.3 11.1 Religion
Christian 34.4 0.0 100.0 7.7 64.3 43.3 Muslims 65.6 100.0 0.0 92.3 21.4 54.4 No religion 0.0 0.0 0.0 0.0 14.3 2.2 Education
Illiterate 28.1 38.5 11.1 46.2 0.0 24.4 Basic 50.0 53.8 55.6 38.5 50.0 50.0 Secondary 18.8 7.7 22.2 15.4 21.4 17.8 Tertiary 3.1 0.0 11.1 0.0 28.6 7.8 Source: Survey data, November, 2009.

40
Table 3.7: Socio-economic background of marketers
Characteristics Location of market (n=83) Total Agbogbloshie Malata Makola Kaneshie Dansoman Gender Female 92.3 100.0 83.3 96.8 90.9 94.0 Male 7.7 0.0 16.7 3.2 9.1 6.0 Marital status
Married 53.8 81.3 83.3 58.1 90.9 69.9 Single 46.2 18.8 16.7 41.9 9.1 30.1 Age
Less than 20 0.0 0.0 0.0 3.2 0.0 1.2 20-29 23.1 25.0 8.3 25.8 18.2 21.7 30-39 23.1 25.0 41.7 38.7 36.4 33.7 More than 40 53.8 50.0 50.0 32.3 45.5 43.4 Household size
1 person 23.1 6.3 8.3 9.7 0.0 9.6 2-5 persons 30.8 31.3 75.0 45.2 45.5 44.6 6-10 persons 46.2 56.3 16.7 41.9 36.4 41.0 Above 10 persons 0.0 6.3 0.0 3.2 18.2 4.8 Ethnicity
Akan 100.0 31.3 41.7 51.6 45.5 53.0 Ewe 0.0 31.3 33.3 6.5 18.2 15.7 Ga/Adangme 0.0 18.8 25.0 25.8 27.3 20.5 Mossi/Grusi/Busanga 0.0 0.0 0.0 6.5 9.1 3.6 Dagarti 0.0 0.0 0.0 3.2 0.0 1.2 Dagomba 0.0 18.8 0.0 3.2 0.0 4.8 Other 0.0 0.0 0.0 3.2 0.0 1.2 Religion
Christian 92.3 81.3 83.3 87.1 81.8 85.5 Moslems 7.7 18.8 16.7 12.9 9.1 13.3 Traditional 0.0 0.0 0.0 0.0 9.1 1.2 Education
Illiterate 15.4 18.8 16.7 9.7 36.4 16.9 Basic 69.2 75.0 75.0 77.4 54.5 72.3 Secondary 15.4 6.3 8.3 12.9 9.1 10.8 Source: Survey data, November, 2009.

41
Table 3.8: Marketers’ criteria for assessing vegetable quality
S/N Quality statements Agree Undecided Disagree Mean N % N % N %
A13 I look out for the size of the vegetables that I purchase
81 97.6 1 1.2 1 1.2 1.04
A14 I look out for the freshness of the vegetables that I purchase
83 100.0 0 0.0 0 0.0 1.00
A15 I look out for the colour of the vegetables that I purchase
83 100.0 0 0.0 0 0.0 1.00
A16 I look out for the firmness of the vegetables that I purchase
82 98.8 0 0.0 1 1.2 1.02
A17 I look out for absence of spots on the vegetables that I purchase
82 98.8 0 0.0 1 1.2 1.02
A18 I look out for dirt on the vegetables that I purchase
27 32.5 7 8.4 49 59.0 2.27
Source: Survey data, November, 2009.

42
Table 3.9: Socio-demographic background of consumers
Characteristics Location of consumer (n=142)
Total Nima / Maamobi
East Legon / Legon
Osu La/ Cantoments
Dansoman
Gender Female 46.7 42.1 64.7 65.5 30.2 46.5 Male 53.3 57.9 35.3 34.5 69.8 53.5 Marital status Married 40.0 21.1 29.4 51.7 25.6 31.7 Single 60.0 78.9 70.6 48.3 74.4 68.3 Age Less than 20 6.7 2.6 11.8 13.8 9.3 8.5 20-29 26.7 60.5 23.5 48.3 60.5 50.0 30-39 33.3 18.4 29.4 24.1 14.0 21.1 More than 40 33.3 18.4 35.3 13.8 16.3 20.4 Household size 1 person 20.0 65.8 47.1 41.4 34.9 44.4 2-5 persons 40.0 28.9 35.3 44.8 30.2 34.5 6-10 persons 33.3 2.6 17.6 10.3 30.2 17.6 Above 10 persons 6.7 2.6 0.0 3.4 4.7 3.5 Ethinicity Akan 33.3 76.3 35.3 48.3 55.8 54.9 Ewe 6.7 5.3 5.9 17.2 16.3 11.3 Ga/Adangme 13.3 10.5 52.9 20.7 25.6 22.5 Mossi/Grusi/Busanga 20.0 0.0 0.0 6.9 0.0 3.5 Guan 6.7 5.3 0.0 6.9 2.3 4.2 Sissala/Wala 6.7 0.0 5.9 0.0 0.0 1.4 Other 13.3 2.6 0.0 0.0 0.0 2.1 Religion Christian 53.3 94.7 88.2 86.2 88.4 85.9 Moslems 46.7 2.6 5.9 13.8 2.3 9.9 Traditional 0.0 2.6 0.0 0.0 7.0 2.8 No religion 0.0 0.0 5.9 0.0 2.3 1.4 Illiterate 13.3 5.3 5.9 0.0 7.0 5.6 Basic 53.3 10.5 52.9 44.8 18.6 29.6 Secondary 20.0 31.6 29.4 37.9 44.2 35.2 Tertiary 13.3 52.6 11.8 17.2 30.2 29.6 Illiterate 13.3 5.3 5.9 0.0 7.0 5.6

43
Table 3.10: Income distribution of respondents
Table 2.11: Consumers’ criteria for assessing vegetable quality
S/N Quality statements Agree Undecided Disagree Mean N % N % N %
A11 I look out for the size of the vegetable that I purchase
132 93.0 0 0.0 10 7.0 1.14
A12 I look out for the freshness of the vegetable that I purchase
141 99.3 0 0.0 1 0.7 1.01
A13 I look out for the colour of the vegetable that I purchase
123 86.6 0 0.0 19 13.4 1.27
A14 I look out for the firmness of the vegetable that I purchase
131 92.3 0 0.0 11 7.7 1.15
A15 I look out for absence of spots on the vegetable that I purchase
128 90.1 0 0.0 14 9.9 1.20
A16 I look out for dirt on the vegetable that I purchase 111 78.2 5 3.5 26 18.3 1.40 A17 I look out for holes on the vegetable that I purchase 140 98.6 0 0.0 2 1.4 1.03 Source: Survey data, November, 2009. 3.2.2 Farmers’ perception of the use of human urine for vegetable production The perception of farmers on the use of human urine for vegetable production is presented in Table 3.12. Most of the farmers (82%) disagreed with the disposal of human urine as municipal waste. They strongly believe that there are plant nutrients in human urine that can be used for vegetable production. Only 11 farmers (12 %) said human urine is of no use and should be disposed off as municipal waste. Of the 11
Income
Location of consumer (%) (n=142) Total Nima /
Maamobi East Legon /
Legon Osu La/
Cantonments Dansoman
Less than GH¢100
60.0 63.2 88.2 72.4 60.5 66.9
GH¢100- GH¢500
40.0 23.7 11.8 27.6 34.9 28.2
More than GH¢500 0.0 13.2 0.0 0.0 4.7 4.9

44
farmers who said human urine should be disposed off as municipal waste 73% were Muslims while the remaining 27% were Christians. Additionally, the Principal Component Analysis (PCA) was applied to identify the main dimensions of farmers on the use of human urine for vegetable production. Results on farmers’ perception statements after the PCA have been applied are presented in Table 5.8. The PCA applied to the farmers’ perception statements gave two factors which accounted for about 74% of the total variance. All the seven variables were used because their communalities were high (more than 0.5) (see also appendix D1 of Koomson, 2010). The first factor labeled ‘resource’ explains 45% of the total variance and is associated with non-disposal of urine as a municipal waste, farmers’ willingness to handle urine as an alternative fertilizer, use of urine for vegetable production, positive influence of urine on vegetables and willingness to cope with the smell of human urine. The second factor accounts for 29% of total variance and is associated with the influence of religion and norm on farmers’ willingness to use human urine for vegetable production. Table 3.12: Perception of farmers on the use of human urine for vegetable
production
S/N Perception Statements Agree Undecided Disagree Mean
N % N % N % P1 Urine should be disposed off as a municipal waste 11 12.2 5 5.6 74 82.2 2.70 P2 Will you be willing to handle urine as an alternative
fertilizer 80 88.9 4 4.4 6 6.7 1.18
P3 Religion will have an influence on your choice to use human urine as an alternative fertilizer
12 13.3 5 5.6 73 81.1 2.68
P4 Norm will have an influence on your choice to use human urine as an alternative fertilizer
10 11.1 5 5.6 75 83.3 2.72
P5 Urine is a waste and should not be used for vegetable production
13 14.4 4 4.4 73 81.1 2.67
P6 I think urine has a positive influence on vegetable production
72 80.0 13 14.4 5 5.6 1.26
P7 I will be willing to cope with the smell of urine 79 87.8 1 1.1 10 11.1 1.23 Source: Survey data, November, 2009. Sample size = 90

45
Table 3.13: Correlation among farmers’ perception statements and factors from PCA
S/N
Perception statements
Farmers Factor 1
Resource Factor 2
Religion and Norm
P1 Urine should be disposed off as a municipal waste -0.669 0.327 P2 Will you be willing to handle urine as an alternative fertilizer 0.850 -0.218 P3 Religion will have an influence on choice to use human urine for
vegetable production -0.282 0.923 P4 Culture will have an influence on choice to use human urine for
vegetable production -0.183 0.941 P5 Urine is a waste and should not be used for vegetable
production -0.754 0.279 P6 I think urine has a positive influence on vegetable production 0.807 -0.043 P7 I will be willing to cope with the smell of urine 0.818 -0.256 % of Total variance 45.30% 29.11%
Bold values indicate the highest correlations between sentences and factors
Further analysis of qualitative data showed that there are a lot of concerns in relation to the use of human urine for vegetable production. These included: The nutrient effect of human urine on their vegetables The efficiency of storage of human urine in soil The availability of the sanitized human urine for all the farmers in urban Accra
should in case they all adopt urine fertilization for their vegetables The possibility of rodents attacking their vegetable farm since urine has been
used as bait to attract rodents The fertilization rate and application techniques for different vegetables when
using the sanitized human urine Suspect fertilization rate and application techniques will be labour intensive than
the conventional mineral fertilizer and poultry manure The effectiveness of the urine fertilization on vegetables under different climatic
conditions How easier will it be to handle relative to the conventional mineral fertilizer and
poultry manure during fertilization These technical concerns raised by the farmers suggest the need for demonstration farms (see chapter 4).

46
This is how one farmer puts it: “if the sanitised human urine proves to be better than the conventional method, I will buy and use it no matter the price after all the mineral fertilizers and poultry manure are also sold (Male, age 25, La)”. There were suggestions that any entrepreneur who wants to go into the business of supplying sanitized human urine to farmers should consider ways of improving his/her sanitized urine to be better (for example conversion into struvite (powder) for easy handling and other plant nutrients) than the one generated in the household by the farmers to induce them to buy his/her own. 3.2.3 Marketers perception on the use of human urine for vegetable production
Table 3.14 presents a summary of perception of marketers on the use of human urine for vegetable production. Opinions of respondents were sought (agree or disagree with certain statements). Of the 83 responses, 54 (65.1%) indicated that human urine should be disposed off as a municipal waste. Another 29% of the marketers said human urine should not be disposed off as municipal waste and the rest of the respondents were not sure. Respondents were also asked to express their opinion concerning the use of human urine as a resource. About 57% indicated that human urine can be used as a resource. Only 20% of the respondents suggested that religious influence will have an effect on their choice to buy u-vegetables for marketing. Majority of the respondents (72%) said religious influence will not have an influence on their choice to buy u-vegetables for marketing. About 60% of the respondents suggested that the norms (customary situation or circumstances) in their society will not have any influence on their choice to market u-vegetables.

47
Table 3.14: Perception of marketers on the use of human urine for vegetable production
S/N Perception statements Agree Undecided Disagree Mean N % N % N %
A1 Urine should be disposed off as a municipal waste 54 65.1 5 6.0 24 28.9 1.64
A2 Urine can be used as a resource 47 56.6 1 1.2 35 42.2 1.86 A3 Religion will have an influence on choice
to buy U-vegetables 17 20.5 6 7.2 60 72.3 2.52 A4 Norms will have an influence on choice to
buy U-vegetables 27 32.5 6 7.2 50 60.2 2.28 A5 Urine is a waste and should not be used
for vegetable production 45 54.2 0 0.0 38 45.8 1.92 A6 I will be willing to sell my urine 16 19.3 2 2.4 65 78.3 2.59 A7 I will buy vegetable if I know that it is
cultivated with urine 47 56.6 0 0.0 36 43.4 1.87 A8 I will not buy U-vegetables from Accra if I
know that it is cultivated with urine 40 48.2 0 0.0 43 51.8 2.04 A9 I will like toilet system which separates
urine from human excreta 35 42.2 5 6.0 43 51.8 2.10 A10 I will wash U-vegetables very well before
retailing if it is cultivated with human urine 30 36.1 8 9.6 45 54.2 2.18 A11 I am aware of the use of urine for
vegetable production 20 24.1 0 0.0 63 75.9 2.52 A12 I will pay higher price for u-vegetables 12 14.5 7 8.4 64 77.1 2.63 Source: Survey data, November, 2009. Sample size = 83 About 54% of the respondents said urine is a waste and should not be used for vegetable production whiles the remaining 46% said human urine is not a waste and can be used for vegetable production. Respondents that disagree with the use of human urine for vegetable production gave the following reasons: They believe there is a health risk factor associated with the use of human urine
for vegetable production. Customers (consumers) will no longer patronize their vegetables.
They believe that human urine is a waste and there is nothing good it can be
used for. The marketers that said human urine can be used for vegetable production gave the following reasons: Chemical fertilizer vegetables’ lifespan is very short and therefore they want
something organic.
Urine is from the human body and therefore they do not see what is wrong if it is used as a resource.

48
They are aware of the medicinal value inherent in human urine.
They believe that the use of human urine will cut down on cost of production
making vegetables cheaper on the market.
Marketers’ perception communalities after conducting PCA (Appendix D2, Koomson 2010) revealed that only 11 variables could be used for the PCA since the twelfth variable communality was less than 0.5. The results are shown in Table 3.15. Information obtained was reduced into three principal components accounting for 70% of the total variance. The first factor, “Resource” explains 38% of the total variance and refers to non-disposal of urine as a municipal waste, urine as a resource, use of urine for vegetable production, willingness to sell urine, willingness to buy u-vegetables with information about source, access to alternative source of vegetables if farmers in Accra produce u-vegetables and likeness for UDDTs. The second factor accounts for 16% of total variance and is associated with the influence of religion and norm on marketer’s willingness to buy u-vegetables. The third factor was called ‘awareness’. It contributes 15% of the total variance and was associated with washing u-vegetables very well before retailing and awareness of u-vegetables on the market.

49
Table 3.15: Correlation among marketers’ perception statements and factors from PCA
S/N
Perception statements
Marketers Factor 1
Resource Factor 2 Religion
and Norm
Factor 3 Awareness
A1 Urine should be disposed off as a municipal waste -0.800 -0.011 -0.142
A2 Urine can be used as a resource 0.815 -0.115 0.027 A3 Religion will have an influence on choice to
buy U-vegetables -0.155 0.909 -0.029 A4 Norms will have an influence on choice to
buy U-vegetables -0.027 0.893 -0.124 A5 Urine is a waste and should not be used for
vegetable production -0.855 -0.084 0.166 A6 I will be willing to sell my urine 0.696 -0.170 -0.247 A7 I will buy vegetable if I know that it is
cultivated with urine 0.798 -0.109 -0.327 A8 I will not buy U-vegetables from farmers if I
know that it is cultivated with urine -0.761 0.213 0.299 A9 I will like toilet system which separates
urine from human excreta 0.585 0.117 0.567 A10 I will wash U-vegetables very well before
retailing if it is cultivated with human urine -0.348 -0.011 0.724 A11 I am aware of the use of urine for
vegetable production 0.084 0.196 -0.691 % of Total variance 38.45% 16.20% 14.95%
Bold values indicate the highest correlations between sentences and factors 3.2.4 Consumer’s perception of the use of human urine for vegetable production Perception statements about the use of human urine for vegetable production were presented to the consumers and the results tabulated in Table 3.16. About 56% of the consumers disagree that urine should be disposed off as a municipal waste. They strongly believed that there is something (which they could not tell) in urine which can be put into good use rather than letting it go waste. Another 42% said they do not see anything good in urine and that it should be disposed off as a municipal waste. When asked if urine can be used as resource about 72% (102 consumers) of the consumers said they agree. About 25% said they do not agree with such a statement that urine can be used as a resource.
About 78 (54.9%) of the consumers were willing to provide their urine for a fee. They were willing to sell it for a maximum and average price of GH¢500 and GH¢44 per 200 litres of human urine respectively. Only one person was willing to give her urine for free.

50
Table 3.16: Perception of consumers on the use of human urine for vegetable production
S/N Perception statements Agree Undecided Disagree Mean
N % N % N % A1 Urine should be disposed off as a municipal waste 59 41.5 3 2.1 80 56.3 2.15 A2 Urine can be used as a resource 102 71.8 4 2.8 36 25.4 1.54 A3 Religion will have an influence on choice to
consume U-vegetables 24 16.9 5 3.5 113 79.6 2.63
A4 Culture will have an influence on choice to consume U-vegetables
31 21.8 6 4.2 105 73.9 2.52
A5 Urine is a waste and should not be used for vegetable production
61 43.0 3 2.1 78 54.9 2.12
A6 I will be willing to sell my urine 78 54.9 2 1.4 62 43.7 1.89 A7 I will buy vegetable if I know that it is cultivated with
urine 77 54.2 4 2.8 61 43.0 1.89
A8 I will not consume vegetables from Accra if I know it is u-vegetables
71 50.0 1 0.7 70 49.3 1.99
A9 I will like toilet system which separates urine from human excreta
81 57.0 12 8.5 49 34.5 1.77
A10 I will wash U-vegetables very well before consumption
125 88.0 6 4.2 11 7.7 1.20
A18 Think more research should be done about health impact of U-vegetables
134 94.4 2 1.4 6 4.2 1.10
Source: Survey data, November, 2009. Sample size = 142
Those who did not want to sell their urine formed about 44% of the respondents. These people were wary of the use of their urine for ritual purposes “sakawa” and entirely against the use of human urine for vegetable production. Consumers were asked if they will buy u-vegetables, 77 (54.2%) said they will buy them. These consumers explained that they cannot guarantee the safety of the current vegetables found in the market. Some even concluded that the vegetables they consume are consuming now are “u-vegetables” because the farmers use waste water for irrigation which contains human urine. Some too said u-vegetables should even be priced higher because they believe it is better than chemically produce vegetables in terms of health and lifespan. About 43% of the consumers also said they will not buy u-vegetables because they belief that it is not healthy to consume u-vegetables.

51
Table 3.17 describes the correlation among consumer perception statements and components from the PCA. Table 3.17: Correlation among consumers’ perception statements and factors
from PCA
S/N
Perception statements Consumers
Factor 1 Resource
Factor 2 Religion
and Norm
Factor 3 Access
A1 Urine should be disposed off as a municipal waste
-0.713
0.244
0.198
A2 Urine can be used as a resource 0.687 -0.406 -0.249 A3 Religion will have an influence on choice to
consume U-vegetables
-0.108
0.928
0.033 A4 Culture will have an influence on choice to
consume U-vegetables
-0.132
0.922
-0.009 A5 Urine is a waste and should not be used for
vegetable production
-0.830
-0.011
0.050 A6 I will be willing to sell my urine 0.722 -0.053 0.379 A7 I will buy vegetable if I know that it is cultivated
with urine
0.783
0.038
-0.269 A8 I will not consume vegetables from Accra if I know
it is u-vegetables
-0.169
0.030
0.909 A9 I will like toilet system which separates urine from
human excreta
0.646
-0.284
-0.043 % of Total variance 36.44% 22.46% 12.78%
Bold values indicate the highest correlations between sentences and factors
Only 9 variables were used for the PCA because the tenth variable communality was very low (A10, 0.341; See Appendix D3, Koomson, 2010). Consumers perception were summarized into three factors that accounted for 72% of the total variance. The first one, ‘Resource’, explains 36% of variance and is linked to the non-disposal of urine as municipal waste, urine as a resource, use of urine for vegetable production, willingness to sell urine, willingness to buy u-vegetables and likeness of the UDDTs. The second factor, ‘Religion and Norm influence’, explains 22% of the total variance and refers to the influence of consumers religion and current circumstances surrounding the society in which he/she lives on the consumers consumption of u-vegetables. Finally, the third factor contributes 13% of the total variance. It is called ‘Access’ and shows consumers desire to consume vegetables outside Accra if vegetables within Accra are u-vegetables.

52
3.2.5 Factors that influence farmers’ willingness to use sanitized human urine for vegetable production
Level of willingness to use Out of the 90 farmers, 81 (90%) were willing to use (WTU), indicating a very high willingness to use the urine technology. Interestingly, this high rate of willingness to use human urine was translated into high willingness to pay. About 96% of the farmers who were willing to use were willing to pay. As Figure 3.2 shows, 97% of the respondents who were willing to pay for the urine technology were willing to pay the first bid, which was GH¢1.5 per 200 liters of sanitized urine. In the follow up questions, farmers (100%) who were willing to pay the first bid were also willing to pay the second higher bid (GH¢2.0) and 100% of the respondents who were not willing to pay the first bid were willing to pay the second lower bid (GH¢1.0). Results of probit analysis A probit model was estimated to examine the various factors that affect farmer’s willingness to use (WTU) human urine for vegetable production. The dependent variable of willingness to use human urine was regressed on perception, education, age, gender, location, religious influence, norm, mode of soil conservation, soil condition and urine availability. The results are presented in Table 3.18. The Wald statistics reveal that the variables included in the model are jointly statistically significant in explaining the WTU human urine decision of the farmers. The Pseudo R2 value of 0.5681 means that about 56.8% of the variation in the dependent variable is explained by variation in the independent variables.

53
Figure 3.2: Summary Statistics to double-bounded dichotomous choice questions
WTU 90 obs
NO (10%)
YES (90%)
WTP
YES (96.3%)
NO (3.7%)
WTP 2nd
higher bid GH¢ 2.0
WTP 1st bid GH¢1.5
NO (2.6%)
YES (97.4%)
WTP 2nd
lower bid GH¢1.0
NO (0%)
NO (0%)
YES (100%)
YES (100%)

54
Table 3.18: Regression results of farmers’ willingness to use urine as an alternative fertilizer (probit model)
Variables Coefficient Robust
Std. Error z. P>z Marginal Effects
Constant 1.739 2.874 0.610 0.545 0.000 Perception 6.923*** 1.603 4.320 0.000 0.999 Education 0.773 0.524 1.480 0.140 0.010 Age -0.597*** 0.183 -3.260 0.001 -0.005 Age square 0.007*** 0.002 3.490 0.000 0.000 Gender 2.365*** 0.676 3.500 0.000 0.260 Location 1.262* 0.678 1.860 0.063 0.010 Religious influence -0.576 1.200 -0.480 0.631 -0.009 Norm -0.229 1.046 -0.220 0.827 -0.002 Mode of soil conservation 1.823*** 0.561 3.250 0.001 0.060 Soil condition 1.897** 0.958 1.980 0.048 0.139 Urine availability 0.871 0.565 1.540 0.123 0.017
Number of obs = 90 Log pseudo likelihood = -12.63659 Wald chi2(11) = 49.63 Pseudo R2 = 0.5681 Prob > chi2 = 0.0000 *** significant at 1%, ** significant at 5%, * significant at 10%
The second column shows the coefficient of various variables that affect the decision of farmers to use human urine for vegetable production. With the exception religious influence, norm, education and urine availability, all the explanatory variables are statistically significant. This means that although religious influence, norm, education of the farmer and urine availability bears the a priori sign they do not play a role in determining whether a farmer will adopt the urine technology for fertilization or not. Perception about human urine, age, gender, and mode of soil conservation were statistically significant at 1 percent while soil condition and location of the farmer are statistically significant at 5 and 10% respectively. The results show that the young farmers are more likely to adopt the urine fertilization technology than the elderly as shown by the negative and positive coefficients of the age and the age square variables. The perception variable indicates that farmers with positive perception. Additionally, males will be more likely to use the urine technology than females. Farmers who use organic means of conserving the soil and those who perceive their soil conditions to be good are more likely to use the human urine for vegetable production. This result was not surprising because farmers will always want to increase their productivity and those who use organic (poultry manure, cow dung, compost) means to conserve soil nutrients will be more willing to welcome the urine fertilization technology. Farmers in Dzorwulu farm site are more likely to use the urine

55
technology. This is because farmers here have received a demonstration of the urine technology. The marginal effects of the perception variable shows that farmers with positive perception about urine quality have about 100% chance of using the urine for vegetable production than those who have negative perception about urine quality, ceteris paribus. The probability that male farmers will adopt the urine technology will be 26% more than female farmers. The elderly will be 0.005 less likely to adopt the urine technology for fertilization. Dzorwulu farmers will have 1 percent more chance to adopt the urine technology than farmers at other farm sites. Farmers with perceived good soil conditions will still adopt the urine fertilization of vegetables and this will be higher than farmers with perceived bad soil conditions of their land by about 14%. Farmers familiar with organic fertilization of soils probability of using human urine for fertilization will be 0.06 more than those who use chemical fertilizers for fertilization.
3.2.6 Factors that influence marketers’ willingness to buy U-vegetables Results of probit analysis The Wald statistic reported was 44.55 with a p-value of 0.0000 suggesting that the whole model is statistically significant at 1 percent (Table 3.19). The Pseudo R2 value of 0.4361 implies about 43% of the variation in the dependent variable is explained by variation in the explanatory variables. Table 3.19 Regression results of marketer’s willingness to buy u-vegetables
from farmers (probit model)
Variables Coefficient Robust
Std. Error z. P>z Marginal Effects
Constant -5.653** 2.238 -2.530 0.012 0.000 Gender -1.321** 0.573 -2.300 0.021 -0.478 Age 0.150 0.112 1.340 0.179 0.057 Age square -0.002 0.001 -1.470 0.141 -0.001 Education -0.063 0.528 -0.120 0.906 -0.024 Marital status -0.888 0.547 -1.620 0.104 -0.304 Religious influence -1.633*** 0.515 -3.170 0.002 -0.585 Norm 0.829* 0.498 1.670 0.096 0.296 Knowledge of production 0.075 0.405 0.190 0.852 0.029 Urine perception index 0.074*** 0.014 5.330 0.000 0.028
Number of obs = 83 Log pseudo likelihood = -32.030683 Wald chi2(9) = 44.55 Pseudo R2 = 0.4361 Prob > chi2 = 0.0000 *** significant at 1%, ** significant at 5%, * significant at 10%

56
All the estimated coefficients had the expected sign with the exception of gender, education and norm. Moreover, gender and norm were statistically significant at 5 and 10% significant levels respectively. This result appears plausible because Obuobie et al. (2006) observed that market women (vegetable marketing business is female dominated) support the growing of vegetables within the city. It provides them with employment, reduced cost and time for transporting vegetables from peri-urban and rural areas. It will also give the women easy access to fresh vegetables and will also lower prices on the vegetable produce since transportation cost will be less. This also support the argument that norm will not be a hindrance to their purchasing of u-vegetables within the city. For instance, market women continue to buy produce from farmers despite media reports about farmer’s within the city usage of waste water for irrigation. Both religious influence and urine perception index were statistically significant at 1%. The negative sign for the religious influence variable supports the hypothesis that the probability that a marketer would be willing to buy u-vegetables for the market would decrease if his/her religion is against the use of human urine for vegetable production. The positive sign for urine perception index variable supports the hypothesis that the probability that a marketer will be willing to pay for u-vegetables increases as his/her perception about human urine use for vegetable production increases. The marginal effect for the religious influence variable suggest that for marketers whose religion is against the use of human urine for vegetable production, the probability that they will buy u-vegetables will decrease by 0.585 compared with marketers whose religion is not against the use of human urine for vegetable production. Similarly, a unit increase in marketers’ urine perception index increases the probability of willingness to buy u-vegetables by 0.03. The probability of willingness to buy u-vegetables is higher for female marketers than male marketers by 0.478. 3.2.7 Factors that influence consumers’ willingness to buy U-vegetables Results of probit analysis The estimated results from the probit model for consumer’s willingness to buy u-vegetables were presented in Table 3.20. The Wald chi2 value of 79.27 was significant at 0.01 level which means that the overall model is significant. The Pseudo R2 value of 0.4474 implies about 45% of the variation in the dependent variable is explained by variation in the explanatory variables. Except for income, access to alternative source of vegetables and perception index, none of the estimated coefficients is statistically different from zero at the 10% significance level. This means that religious influence, norm, age, sex, education and marital status do not have an effect on consumers’ willingness to buy u-vegetables. Huang et al. (1999) used ordered probit to reveal that socioeconomic characteristics do

57
not have an influence on consumers’ willingness to pay for hydroponically grown vegetables. The results rather confirmed that, willingness to buy u-vegetables decreases as consumer’s income increases. Huang et al. (1999) observed similar results in their joint estimation probit model for consumers’ willingness to pay for food safety in Taiwan. A one percent increase in consumer’s income is likely to decrease willingness to buy u-vegetables by 11%. The impact that access to alternative source of vegetables will have on willingness to buy u-vegetables is also shown. Most consumers complained about the source of water for irrigation in the urban area by farmers but they consume the vegetables produced by them because they do not have alternative source. The results show that consumers with alternative source of buying vegetables other than u-vegetables will be less willing to buy u-vegetables. The marginal effect of -0.348 means that if consumers are to have alternative sources of buying vegetables, their willingness to buy u-vegetables will decrease by about 35%. Individuals with positive perception about the use of human urine for vegetable production will be more willing to buy u-vegetables. The chances are that consumers with positive perception about the use of human urine for vegetable production willingness to buy u-vegetables will be higher than those with negative perception by 2.4%. Table 3.20: Regression results of consumers’ willingness to buy u-vegetables
from marketers (probit model)
Variables Coefficient Robust
Std. Error z. P>z Marginal Effects
Constant -3.862** 1.649 -2.340 0.019 0.000 Sex 0.402 0.298 1.350 0.177 0.159 Age 0.040 0.073 0.550 0.583 0.016 Age square 0.000 0.001 -0.290 0.774 0.000 Education 0.011 0.040 0.290 0.775 0.005 Marital status 0.238 0.426 0.560 0.576 0.094 Income (natural log) -0.286* 0.170 -1.680 0.092 -0.114 Religious influence -0.653 0.564 -1.160 0.247 -0.254 Norm 0.713 0.516 1.380 0.167 0.272 Access to alternative source -0.904*** 0.307 -2.940 0.003 -0.348 Urine perception index 0.060*** 0.010 6.110 0.000 0.024
Number of obs = 128 Log pseudo likelihood = -48.946702 Wald chi2(11) = 79.27 Pseudo R2 = 0.4474 Prob > chi2 = 0.0000 *** significant at 1%, ** significant at 5%, * significant at 10% Note: Sample size = 128 (Respondents with no income were ignored because of the natural log)

58
3.3 Conclusion The consumers’ perception study showed that some consumers (56%) do not want human urine to be disposed off as a municipal waste, although they (72%) could not tell what is in human urine that makes it a resource. Meanwhile, about 44% of the consumers were willing to buy u-vegetables as obtained from the PCA. These were people who perceive urine as a resource and their consumption of u-vegetables is independent of religious influence and norm in the society. The reasons they gave included lack of alternative source of vegetables and their inability to guarantee the safety of the conventional vegetables on the market because the market women would not disclose the source of the produce to them. However, consumers mentioned a perceived health risk associated with the consumption of u-vegetables as a major concern that can influence their choice to consume u-vegetables. None of the consumers was able to mention a specific disease associated with consumption of u-vegetables. Socio-economic characteristics of consumers who were willing to consume u-vegetables was however not different from those who would not consume. The main conclusion drawn is that consumers were willing to buy u-vegetables but more concerned about the possible health effects of u-vegetables consumption. The farmer probit estimation showed that perception about urine quality, gender, mode of soil conservation, location and soil condition positively affected farmers’ willingness to adopt the urine technology. The study concludes that farmers with positive perception about urine quality will adopt the technology. The probability that male farmers will be willing to adopt the urine technology will increase by 26% more than females. Young farmers will be more willing to adopt the technology than the elderly. Farmers who use organic fertilizers probability of using the urine technology are higher than those who do not use organic fertilizers by 0.06. Indeed, farmers with perceived good soil conditions will increase their adoption of the urine technology by 14% relative to their colleagues with perceived poor soil conditions. The marketer probit model estimation found that marketers’ willingness to buy u-vegetables was influenced by their perception, gender, norm and religious influence. A unit increase in a marketer’s urine perception index increases the probability of willingness to buy u-vegetables by 0.03. Probability of willingness to buy u-vegetables was highest among marketer’s whose religious beliefs is not against the use of human urine for vegetable production than those whose religious belief is against human urine use on vegetable production by 0.585. Female marketers’ willingness to buy u-vegetables is higher than male marketers by 48% even if the cultural situation surrounding their communities is against the use of human urine for vegetable production. The consumer probit estimation also revealed that a 1% increase in consumer’s income will lead to 11% decrease in consumer’s willingness to buy u-vegetables. Consumers with alternative source of buying vegetables willingness to buy u-vegetables will decrease by 35 percent relative to consumers with no alternative source. However, a

59
positive consumer perception about urine will increase his/her willingness to consume u-vegetables by 2.4%. The study also observed some potential barriers that can impede the successful introduction of the use of human urine on vegetables. These include (no order): The health effects (the perceived health risk of urine use and effect of misapplication by farmers), socio-cultural perceptions (opposition from the religious groups, traditional councils and media), environmental effects (perceived effect of continuous use of the human urine on plants and the soil), technical know-how (lack of knowledge on application rate and mode of application, urine availability, rodent attack, urine effect on different climatic conditions, and so on) and economic effects (would it be profitable - the price that the urine would be sold).

60
CHAPTER FOUR 4.0 Use of Human Urine in Urban and Peri-urban Agriculture: Effect on cabbage growth, yield, nutrient uptake and soil characteristics This chapter describes a field study carried out to determine the effect of human urine (and other fertilizers including poultry droppings, NPK and human excreta) on cabbage growth, yield, nutrient uptake and soil characteristics. It describes the existing infrastructure (urinals), the process of urine collection from the Central Business District (CBD) of Accra, transportation to the experimental site and its subsequent application either as the only source of fertilizer or in combination with other forms of fertilizer. The chapter also touches on potential pharmaceutical residues in the urine collected for the trial. The field study was carried out at Dzorwulu in Accra, Ghana between September to December 2009 and March to June 2010. The field demonstration was carried out in collaboration with a private company (SAFISANA HOLDING) who was responsible for collection and transportation of urine to the farm site.
4.1 The existing infrastructure The urinal from which urine was collected for this study at the Central Business District (CBD) is the property of Big 2 B Limited. This company was set up to provide urinals for the teaming masses of people who come to the city daily for business and other related activities. The urinals are made of plastics and are lockable both from the inside and outside. It therefore provides some kind of privacy for the users (Plate 4.1). These urinals have been constructed in such a way that there is a storage receptacle underneath (Plate 4.2). This storage receptacle could be used to store the urine for later collection but the urine is released into the drainage system that runs through the Novotel Park in Accra. The urinals have been modified into male and female units. The male unit uses a standard standing urinal (Plate 4.3) whilst the Female unit uses a bidet (Plate 4.4).

61
Plate 4.1: Big 2 B Ltd Urinals Plate 4.2: Storage container underneath the urinal Users of the urinal pay an amount of ten Ghana pesewas (10p approximately 0.65 USD) to use the facility. Operators have been employed to collect the user fees and also clean the facility every morning and evening and a thorough cleaning on Sundays when there is virtually little or no patronage. The main cleaning agents used are detergents.
Plate 4.3: A standing Urinal used the Male Plate 4.4: Bidets used by the female Clients

62
4.2 Collection of urine for field trial
A survey was conducted in the market adjacent the Novotel Hotel in Accra to identify the potential lipohpylic pharmaceutical residues likely to be present in urine samples to be collected from a public urinary located within the market premises. Questionnaires were designed to collect information on the major sicknesses/diseases and the drugs used in the treatment of these sicknesses/diseases from respondents within the market premises. Prior to the actual collection of the urine it was decided that there is the need to eliminate the use of chemical detergents and to use only biodegradable ones. Vinegar and Citronella were therefore chosen to wash and to control the scent emanating from the urinal during this period. Two of the units (one female and one male) were chosen for this exercise. The operators were instructed to stop the use of the chemical detergents and were asked to use vinegar instead. The operators were provided with overcoats, wellington boots, gloves and nose masks for protection. Special plastic stop cocks were used to regulate the flow of urine from the urinal into the drain. Since the urine was located very close to the drain, a wooden platform was constructed about 450mm from the bottom of the drain (see plate 4.5). The purpose of this platform was to act as a kind of support for the containers during the collection process. Every morning, the stop cock was closed to ensure that the urine stays within the collection receptacle. In the evening the stop cock was opened and the urine was then collected into 25L containers placed on special platforms mounted in the drain.
Plate 4.5: Outlet connection from the urinal showing the stop cock (Photo credit: Frederick lowor-Tettey)
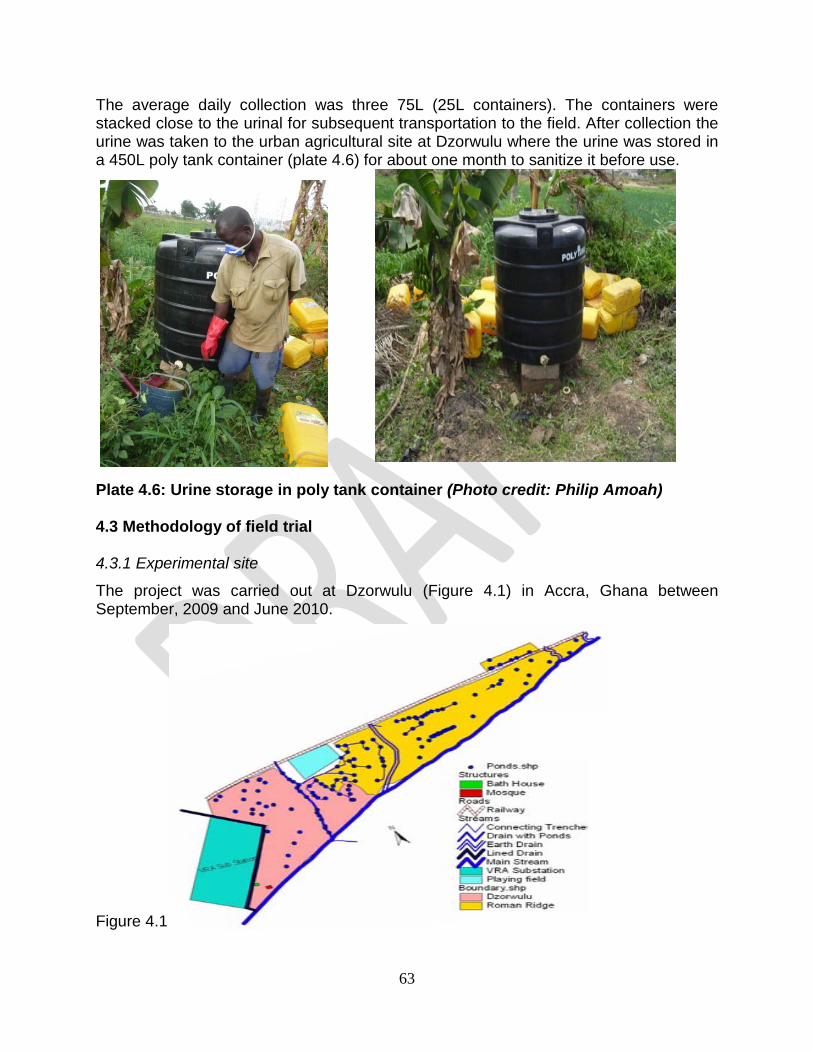
63
The average daily collection was three 75L (25L containers). The containers were stacked close to the urinal for subsequent transportation to the field. After collection the urine was taken to the urban agricultural site at Dzorwulu where the urine was stored in a 450L poly tank container (plate 4.6) for about one month to sanitize it before use.
Plate 4.6: Urine storage in poly tank container (Photo credit: Philip Amoah) 4.3 Methodology of field trial 4.3.1 Experimental site
The project was carried out at Dzorwulu (Figure 4.1) in Accra, Ghana between September, 2009 and June 2010.
Figure 4.1

64
4.3.2 Experimental design A Randomised Complete Block Design (RCBD) was used (Figure 4.2 and 4.3).Each experimental plot was replicated three times. The total plot size was 11.4 m x 20.4 m and each experimental unit was 3.8 m x 3.4 m consisting of four rows of 28 plants (Figure 4.3) and the planting distance was 60 cm x 45 cm. R3 R2 R1
Figure.4.2: Experimental design of the trial- A Randomised Complete Block Design
Figure: 4.3: Experimental unit showing plants for data collection in a rectangle earmarked red
4.3.3 Treatments and mode of application
The treatments applied included urine alone (U), urine + dewatered faecal sludge (U + DFS), urine + poultry droppings (U + PD), NPK + poultry droppings (NPK + PD) and soil alone (S). With the exception of soil alone, each treatment was applied at the rate of 121 kg N ha-1 according to Adamtey (2006). The combined treatments were applied such that each treatment contributed to 50% of the total N applied. All the treatments were buried at the surface of the soil. Three days after transplanting about 60.5 kg N ha-
1 of urine was applied to seedlings that received urine alone whiles 60.5 kg N ha-1 each of DFS and PD was applied to seedlings that were labelled to receive urine + DFS Urine + PD and PD + inorganic fertilizer (NPK). A month after transplanting the manure applications were repeated at the same rate described above. The 1 month old stored urine was well shaken before application with a well calibrated container. Urine application was done through holes dug 20 cm away from the plants (Plate 4.7 and 4.8) and 1–4 cm deep.
100cm
100cm
60c
45c
Urine alone
Soil (S) alone
PD+ Urine
DFS+ Urine
NPK + PD+
Urine alone
PD+ Urine
DFS+ Urine
NPK + PD+
Soil (S) alone
Urine alone
PD+ Urine
DFS+ Urine
NPK + PD+
Soil (S) alone

65
Plate 4.7A: Photo showing the distance between Plate 4.8: A farmer applying urine in a plant and a hole in which urine is applied hole dug near the plants (Photo credit: Noah Adamptey) (Photo credit: Noah Adamptey) The holes were covered immediately with soil as described by Heinonen-Tanski and Wijk-Sijbesma (2005). This simple practice mimics the successful injection technique used by Richert Stintzing et al. (2002) to avoid ammonia losses. The soil was slightly watered before the urine was applied late in the evening to avoid volatilisation.
The chemical characteristics of the urine and the other fertilizer sources were determined before application. The pH and EC were determined in DFS- or PD-water slurry with a ratio of 1:5, v/v (TMECC, 2002) and soil- water slurry with a ratio 1:1 v/v (Black et al., 1965). Total nitrogen in urine was determined according to the method described by Folin and Farmer (2009). The resultant digest was used to determine phosphorus (P) and potassium (K). Phosphorus was determined calorimetrically using spectrophotometer (model Perkin Elmer Lambda 45). Total K was determined using flame photometer (model Jenway PFP7). The nitrogen content of DFS, PD and soil were determined according to the Kjeldahl method described by Okalebo et al. (2002). Inorganic nitrogen (NH4
+-N, NO3- -N) was determined from 40-ml aliquots of 2M KCl
extracts by steam distillation (Okalebo et al., 2002). Total carbon content of DFS, PD and soil was determined by dry combustion using Carbon and Surphur Analyser Eltra CS 500. Total P and K of DFS, PD and soil were determined as described above after digestion with ternary mixture (20 ml HClO4: 500 ml HNO3: 50 ml H2SO4). 4.3.4 Field operations Cabbage seeds cv. Oxolus were nursed in September 2009 and transplanted onto permanent field in the third week of September, 2009. A second cropping was also carried out between March and June 2010. At transplanting seedlings height and number of leaves were noted and recorded; this was to ensure that there were some levels of uniformity among the transplanted seedlings. Watering, weeding, pest and disease control were done as and when necessary. Data on growth parameters (no. of leaves, leaf area, canopy, and plant height) were collected forth-nightly starting from the third day after transplanting. Cabbage canopy was measured using meter rule across the longest diameter. Unlike the other parameters, cabbage canopy was taken two weeks after transplanting. This is because, before week 2 after transplanting, the plant canopy was not uniform. Yield parameters (fresh weight, circumference of head, no of leaves of head, height of head and dry matter yield) were determined at maturity (see plate 4.9). Circumference was measured using tape measure. Cabbage heads that got damaged (rotten) were counted per treatment and expressed over total number of heads per bed as a percentage. This data was taken once at the later stage of the experiment to determine the level of damage or rottenness in each of the treatments.

66
Plate 4.9: Farmers weighing lettuce heads after the trial (Photo credit: Philip Amoah) 4.34 Plant and soil analysis
Soil samples were collected before and immediately after harvest, air dried, sieved and analysed for pH, EC, N, P, K as described above. Harvested plants were oven dried at 70°C for two weeks, milled before analysed as described above.
4.3.5 Statistical analysis Data collected were subjected to statistical analysis using ANOVA and means separated by the Least Significant Difference (LSD). 4.4 Results and discussion 4.4.1 Chemical characteristics of treatments The chemical characteristics of the different fertilizer sources used for the first trial are shown in (Table 4.1a).
Table 4.1a: Chemical characteristics of soil and other fertilizer sources
Sample pH EC Carbon Nitrogen NH4+-N NO3
- -N Phosphorus Potassium
µScm-1 % % mg/kg mg/kg % % Soil 7.0 275 13.60 0.05 38.00 9.14 0.05 0.02 Urine 8.5 >3000 NA 1.03 NA NA 0.10 0.75 DFS 5.4 >3000 1.06 2.26 489.216 83.72 2.82 0.50 PD 6.8 1650 15.41 1.96 740.376 26.404 1.95 1.23
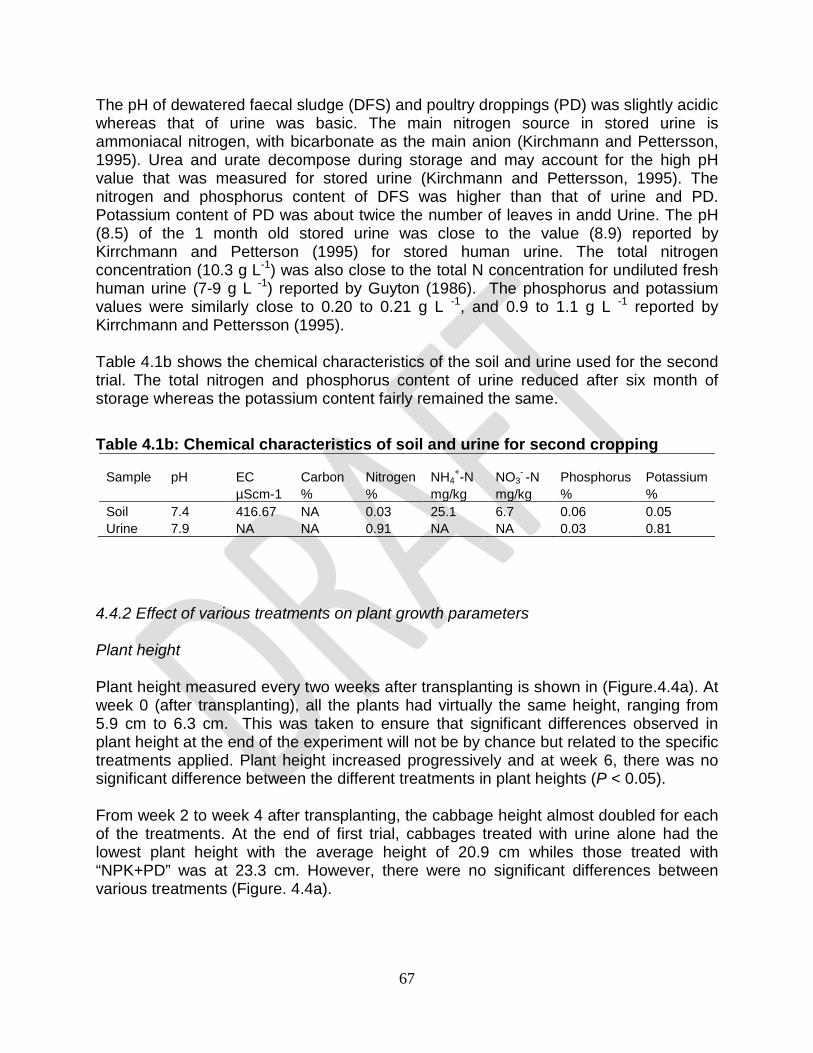
67
The pH of dewatered faecal sludge (DFS) and poultry droppings (PD) was slightly acidic whereas that of urine was basic. The main nitrogen source in stored urine is ammoniacal nitrogen, with bicarbonate as the main anion (Kirchmann and Pettersson, 1995). Urea and urate decompose during storage and may account for the high pH value that was measured for stored urine (Kirchmann and Pettersson, 1995). The nitrogen and phosphorus content of DFS was higher than that of urine and PD. Potassium content of PD was about twice the number of leaves in andd Urine. The pH (8.5) of the 1 month old stored urine was close to the value (8.9) reported by Kirrchmann and Petterson (1995) for stored human urine. The total nitrogen concentration (10.3 g L-1) was also close to the total N concentration for undiluted fresh human urine (7-9 g L -1) reported by Guyton (1986). The phosphorus and potassium values were similarly close to 0.20 to 0.21 g L -1, and 0.9 to 1.1 g L -1 reported by Kirrchmann and Pettersson (1995). Table 4.1b shows the chemical characteristics of the soil and urine used for the second trial. The total nitrogen and phosphorus content of urine reduced after six month of storage whereas the potassium content fairly remained the same.
Table 4.1b: Chemical characteristics of soil and urine for second cropping
Sample pH EC Carbon Nitrogen NH4+-N NO3
- -N Phosphorus Potassium
µScm-1 % % mg/kg mg/kg % % Soil 7.4 416.67 NA 0.03 25.1 6.7 0.06 0.05 Urine 7.9 NA NA 0.91 NA NA 0.03 0.81
4.4.2 Effect of various treatments on plant growth parameters Plant height Plant height measured every two weeks after transplanting is shown in (Figure.4.4a). At week 0 (after transplanting), all the plants had virtually the same height, ranging from 5.9 cm to 6.3 cm. This was taken to ensure that significant differences observed in plant height at the end of the experiment will not be by chance but related to the specific treatments applied. Plant height increased progressively and at week 6, there was no significant difference between the different treatments in plant heights (P < 0.05). From week 2 to week 4 after transplanting, the cabbage height almost doubled for each of the treatments. At the end of first trial, cabbages treated with urine alone had the lowest plant height with the average height of 20.9 cm whiles those treated with “NPK+PD” was at 23.3 cm. However, there were no significant differences between various treatments (Figure. 4.4a).

68
Figure: 4.4a Effect of urine and its related treatments on cabbage plant height after first trial In the second trial, plant height, number of leaves and canopy of cabbage plant were taken only at maturity. This was because most of the initial transplanted seedlings died and were replaced later. This resulted in unequal growth among the plants. The plant height at maturity at the end of second trial is shown in (Figure. 4.4b).
19.0
20.9
19.1
20.620.2
18.0
18.5
19.0
19.5
20.0
20.5
21.0
Pla
nt h
eigh
t (cm
)
Soil only Urine Urine +DFS
Urine +PDNPK+PD
Treatment
Figure 4.4b: Effect of urine and its related treatments on cabbage plant height at maturity after second trial

69
Number of leaves The number of leaves at various weeks after transplanting is shown in (Figure 4.5a). There was no significant difference (P < 0.05) in the number of leaves between the various treatments at the end of the experiment. However, there was a significant difference (P < 0.05) in the number of cabbage leaves between ‘week 0’ and ‘week 2’ after transplanting for all treatments. The average minimum number of leaves per plant was 17. The number of leaves per plant did not really change from the fourth week to the sixth week.
55
5
6
6
15
1414
14
15
18
1918
19
18
18
1819
17
17
0
2
46
8
1012
1416
18
20
Num
ber o
f lea
ves
WEEK0 WEEK2 WEEK4 WEEK6
After transplanting
Urine PD + U DFS + U NPK + PD Soil alone
Figure 4.5a: Effect of urine and its related treatments on number of cabbage leaves after first trial For ‘PD+U’, ‘NPK+PD’ and ‘Soil alone’, the number of leaves decreased by 1 to 2. This was due to the drying of the lower leaves which were therefore not counted. There were no significant differences in the number of leaves between the various treatments in the first trail. Similar observation was made at the end second trial (Figure 4.5b). The results of the plant height and number of leaves confirm a study carried out by Pradhan et al. (2007). The authors reported that the total growth rate of urine-fertilized cabbages was slightly higher than that of the mineral-fertilized plants, but the difference was not significant.

70
17
1918
16
17
14
15
16
17
18
19
Num
ber o
f lea
ves
Soil only Urine Urine +DFS
Urine+PD
NPK+PD
Treatment
Figure 4.5b: Effect of urine and its related treatments on number of cabbage leaves after second trail
Canopy of cabbage The canopy of cabbage at various weeks after transplanting is shown in (Figure 4.6). There was no significant difference (P<0.05) in canopy size between various treatments at the end of the experiment. The canopy size for all treatments increased significantly from week 2 to week 6 after transplanting. The canopy size at week 4 was higher than that of week 6. Similar observations were observed during the second trial. This indicates a decrease in canopy size, though not significant. This might be attributed to dried outer leaves which affected the canopy size.
38.7
41.940.2
43.6
40.9
59.062.5
59.6
63.4
59.157.4
57.157.4
55.6
58.1
0.0
10.0
20.0
30.0
40.0
50.0
60.0
70.0
Cano
py o
f cab
bage
(cm
)
WE E K 2 WE E K 4 WE E K 6
After trans planting
Urine P D + U DF S + U NP K + P D S oil alone
Figure 4.6: Effect of urine and its related treatments on canopy of cabbage

71
after first trail Rotten cabbage head Figures 4.7a and b show the percentage of rotten cabbage heads for the various treatments in the first and second trials. At the end of first trial cabbages treated with NPK + PD had the highest percentage (58.2%) of rotten cabbage heads. This was significantly higher than the other treatments. ‘Urine + DFS’ on the other hand had the lowest percentage (30%) of rotten cabbage heads. With exception of ‘NPK + PD’ treatments, there were no significant differences (P < 0.05) between the various treatments. Similar observation was made in the second trial (Figure 4.7b). The high percentage of rotten cabbage heads in ‘NPK + PD’ and ´Urine + PD´ treated cabbages may be attributed to the high nitrogen uptake. The high N uptake might have promoted vegetative growth as well as succulent plant parts making such plants more susceptible to various forms of damage.
Figure: 4.7a: Effect of urine and its related treatments on rotten of cabbage heads after firs cropping Pradhan et al. (2007) reported that the nitrogen content of cabbage plants could affect the performance of special insect pest of Brassica plants and that there was a good correlation between the extent of insect damage and the cabbage growth rate. The authors also reported that insect damage was more severe in the mineral-fertilized cabbages, which had a faster initial growth than the urine-fertilized cabbages. This probably reflects the preference of many insects, for example, the diamondback moth (Plutella xylostella), flea beetle (Phyllotreta striolata), and mustard beetle (Phaedon
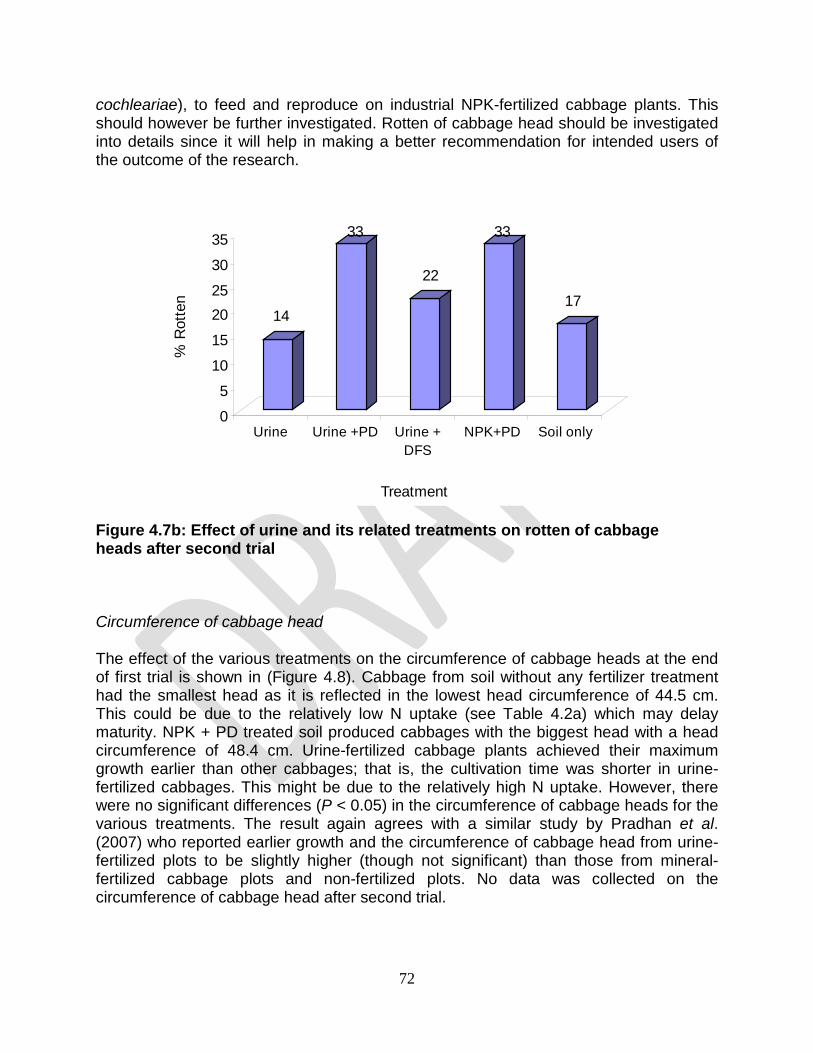
72
cochleariae), to feed and reproduce on industrial NPK-fertilized cabbage plants. This should however be further investigated. Rotten of cabbage head should be investigated into details since it will help in making a better recommendation for intended users of the outcome of the research.
Circumference of cabbage head The effect of the various treatments on the circumference of cabbage heads at the end of first trial is shown in (Figure 4.8). Cabbage from soil without any fertilizer treatment had the smallest head as it is reflected in the lowest head circumference of 44.5 cm. This could be due to the relatively low N uptake (see Table 4.2a) which may delay maturity. NPK + PD treated soil produced cabbages with the biggest head with a head circumference of 48.4 cm. Urine-fertilized cabbage plants achieved their maximum growth earlier than other cabbages; that is, the cultivation time was shorter in urine-fertilized cabbages. This might be due to the relatively high N uptake. However, there were no significant differences (P < 0.05) in the circumference of cabbage heads for the various treatments. The result again agrees with a similar study by Pradhan et al. (2007) who reported earlier growth and the circumference of cabbage head from urine-fertilized plots to be slightly higher (though not significant) than those from mineral-fertilized cabbage plots and non-fertilized plots. No data was collected on the circumference of cabbage head after second trial.
14
33
22
33
17
0
5
10
15
2025
30
35
% R
otte
n
Urine Urine +PD Urine +DFS
NPK+PD Soil only
Treatment
Figure 4.7b: Effect of urine and its related treatments on rotten of cabbage heads after second trial
73
46.1
48.047.1
48.4
44.5
42.0
43.0
44.0
45.0
46.0
47.0
48.0
49.0C
ircum
fere
nce
of c
abba
ge h
ead
(cm
)
Urine Urine + P D Urine + DF S NP K + P D S oil
Treatment
Figure 4.8: Effect of urine and its related treatments on circumference of cabbage heads after first trail Fresh weight and dry matter yield After the end of first trial, there were no significant differences (P<0.05) in the fresh weight of cabbage head among the treatments (see Table 4.2a). The fresh weight of cabbage head from Urine + PD treated soil was the highest and was 3.6% higher than NPK + PD treated ones. On the other hand NPK + PD treated cabbage was 14.2% and 10% higher than that treated alone urine alone and Urine + DFS, respectively (see Table 4.2a). Also, the fresh weight of Urine + DFS and Urine + PD treated cabbage was 6.6% and 7.8 % higher than those treated with urine alone and 14.2% higher than soil alone, respectively. There was no significant difference between Urine + PD, NPK + PD and Urine + DFS treated cabbages after the end of second trial (Table 4.2b). The fresh weight of cabbage treated with Urine + PD was 3.9% higher than those treated with NPK + DFS. Table 4.2a: Effect of urine and its related treatments on fresh weight, dry weight and nutrient uptake of cabbage after first trial Treatment Fresh weight Dry matter N uptake P uptake K uptake g head-1 g head-1 mg kg-1 mg kg-1 mg kg-1 Soil alone 861.0 85.3 194.0 45.8 230.9 Urine 913.0 89.7 222.0 46.8 241.5 Urine+DFS 965.0 90.6 212.0 46.8 294.6 Urine+PD 1080.0 102.9 277.0 61.0 229.5 NPK+PD 1042.0 96.8 261.0 52.0 274.9 LSD(P<0.05) 357.5 18.94 73.5 13.7 94.0

74
Table 4.2b: Effect of urine and its related treatments on fresh weight, dry weight and nutrient uptake of cabbage after second trial
Treatment Fresh weight Dry matter N uptake P uptake K uptake g head-1 g head-1 mg kg-1 mg kg-1 mg kg-1 Soil alone 269.7 15.8 31.7 11.3 58.8 Urine 375.5 17.3 40.5 15.3 78.7 Urine+DFS 434.6 17.6 42.1 16.0 68.6 Urine+PD 529.7 24.8 65.8 20.2 107.9 NPK+PD 510.0 18.5 37.0 15.9 78.9 LSD(P<0.05) 104.9 NS 20.4 5.80 30.4
Significant differences were observed in the second trial between fresh weight of cabbages treated with Urine + PD, Urine + NPK and Urine or soil alone. In general, the fresh weight of cabbage for all the treatments during the first trail was lower than those from the second trail. This can be attributed to poor plant growth and development as a result of prolong drought (2 weeks) and heavy downpour which led to flooding during the growing period.
Plate 4.10: Farmers weighing cabbages from different treatment plots (Photo credit: Philip Amoah) There were no significant differences in the Dry Matter Yield (DMY) between the treatments at the end of first trial (p<0.05), (Table 4.2a). Cabbages treated with Urine +

75
PD gave the highest DMY followed by NPK + PD with soil alone having the least. The DMY at the end of second trial (Table 4.2b) followed similar pattern as observed in the first trial. The relatively low DMY of cabbage treatment with NPK + PD indicated that the cabbage from such treatment was more succulent and might also account for the high percentage of rottenness observed (Figures4.7a and b). The above results agree with that of Pradhan et al. (2007) who reported total biomass (dry matter yield) and commercial biomass (fresh weight of head) of urine-fertilized cabbage to be slightly higher than those from mineral -fertilizer treated plots but this was not significantly different from non-fertilized cabbage plots (soil alone).
Nutrient uptake
At the end of first trial the nitrogen uptake from NPK + PD treatment cabbage was 6.1% lower than those treated with Urine + PD but 17.6% to 23.1% higher than those treated with urine alone and Urine + DFS, respectively (Table 4.2a). With the exception of treatments with urine + PD and soil than received no treatment (soil alone), there were no significant differences (P<0.05) in the nitrogen uptake among the treatments. Phosphorus uptake followed similar pattern as in nitrogen uptake (Table 4.2a). Potassium uptake from cabbages treated with Urine + DFS was three times higher than those treated with NPK + PD. At the end of second trial, the nitrogen, phosphorus and potassium uptake (Table 4.2b) followed similar pattern as observed in the first trial.
4.4.3 Effect on soil characteristics The addition of urine related treatments did not lead to any significant changed in the pH of soil (Tables 4.3a and b). However, urine related treated soils showed a decrease in soil pH by 0.1. The decrease in pH was probably a result of nitrification of the ammonia, producing H+ ions, from the urine (Mekeni et al., 2008). Soil electrical conductivity (EC) for urine treated plots showed higher electrical conductivity compared to soil alone. This agrees with Mekeni et al. (2008) who reported urine to increase soil electrical conductivity to 4.64 and 13.35 mS cm–1 as rate of N application increased. The soil residual nitrogen content for Urine + DFS and Urine + PD were significantly (P< 0.05) higher than that of NPK + PD at the end of first trial (Table 4.3a). On the other hand no significant differences were observed in the soil residual nitrogen after second cropping among treatments Urine + DFS, Urine + PD, NPK + PD and Urine alone (Table 4.3b). At the end of first and second cropping the soil residual P and K for Urine + PD and NPK + PD related treatments were higher than Urine alone, or soil alone (Tables 4.3a and b). The high soil residual nitrogen content for treatment Urine + DFS at the end of first cropping can be attributed to low nitrogen uptake. Whereas the insignificant differences in the residual nitrogen among urine related treatments at the end of second trial (Table 4.3b) may be attributed to the flooding effect that occurred during crop growth.

76
Table 4.3a: Effect of urine and its related treatments on soil characteristics after first trial
Treatment pH EC NH4+-N NO3
- -N N P K µScm-1 mg kg-1 mg kg-1 mg kg-1 mg kg-1 mg kg-1 Soil alone 7.4 416.7 25.1 6.7 266.0 593.0 535.5 Urine alone 7.3 883.33 21.8 5.7 359.0 645.0 808.3 Urine + DFS 7.3 1090.0 21.8 5.0 494.0 711.0 1208.3 Urine + PD 7.3 1283.3 28.4 5.3 449.0 754.0 916. 7 NPK + PD 7.3 1293.3 26.9 7.0 380.0 732.0 1187.5 LSD (P<0.05) 0.007 134.6
Table 4.3b: Effect of urine and its related treatments on soil characteristics after second trial
Treatment pH EC NH4+-N NO3
- -N N P K µScm-1 mg kg-1 mg kg-1 mg kg-1 mg kg-1 mg kg-1
Soil alone 7.8 895.0 28.4 6.6 866.0 720.0 1062.0 Urine alone 7.8 1156.0 28.4 6.8 1001.0 622.0 1232.0 Urine + DFS 7.7 1227.0 25.5 6.1 1057.0 819.0 1194.0 Urine + PD 7.6 1109.0 28.8 10.4 1097.0 838.0 1271.0 NPK + PD 7.7 1002.0 26.2 5.9 1052.0 948.0 1150.0 LSD (P<0.05) NS NS NS 2.54 201 NS NS
4.5 Conclusion The results suggest that urine with poultry droppings (PD) or dewatered faecal sludge (DFS) could be used as a good substitute for NPK + PD (farmer practice) for cabbage cultivation. Although the amounts of applied N were similar for all the fertilizer treatments, the cabbage yield and above ground dry matter yield were highest in the Urine + PD treatment possibly due to high nutrient uptake. Urine treated plots had reduced percentage rottenness of cabbage between 20% and 28% compared to 58% farmer practice (NPK + PD) in the first trial. Soil residual nitrogen content for Urine + DFS and Urine + PD were significantly (P< 0.05) higher than that of NPK + PD. Even though urine could be an alternative source of nutrients for crop production applying it in combination with other organic fertilizer e.g. poultry drippings or dewatered faecal sludge produce better results confirming the fertilizer value of Urine + DFS, and Urine + PD. The findings from this study have important implications. They may contribute to the development of positive attitudes about the use of Urine + PD or Urine + DFS as fertilizer - a way to increase crop yield and reduce water pollution. In addition, results may contribute to optimize the use of Urine + PD or Urine + DFS to fertilize crops, which will help to maintain cabbage quality, improve soil characteristics, and to control N emission from the waste materials as well as reducing the demand for industrial fertilizer to some extent, thus reducing the environmental pollution released during fertilizer

77
manufacturing and transportation. However, the authors recommend that the research should be repeated on different soils in different locations to confirm the conclusions made. Detail research should also be conducted on the effect of the treatments on rottenness of cabbage head, leaching of nitrate, and soil electrical conductivity.
78
CHAPTER FIVE 5.0 Training on the use of urine as an alternative source of nutrient for crop production: Risks and benefits, method of application, impact on crop yield and soil characteristics.
This chapter focuses on a series of training programmes organized to demonstrate the potential of using urine as an alternative source of fertilizer for crop production in Accra Metropolitan Area (AMA) and provide recommendations for scaling up. The main aim of the urine demonstration project was to enhance the operational skills of farmers and Agricultural Extension Agents (AEA’s) of the Ministry of Food and Agriculture (MoFA) and other key stakeholders in the use of urine for agriculture. In these programmes the participants were trained about the possibility, benefits and risk of the use of human urine for crop production and on how urine (with or without other soil ameliorants) is applied and the effect on crop yield. A total of six separate training programmes were organized between September 2009 and January, 2011. 5.1 Introductory meeting with farmers, Agricultural Extension Officers and other stakeholders Preparations Prior to the meeting preparations were made by developing a session plan (see appendix 1) and presentations to be made including photos to be used carefully selected and printed for distribution to participants. Other materials including flip charts, markers were gathered. The learning objectives were: to make the participants aware of the benefits of urine as a source of nutrient for
crop production (Message: urine is a good source of nutrients for crop production)
for the participants to know the risk associated with the use of urine for crop production (Message: urine is safe for crop production if handled well)
What happened At two separate meetings held on the 13th and 16th of October 2009, the first training program in the series was conducted to create awareness among participants on benefits and risks of the use of urine for crop production.

79
At the farmers meeting held on the 13th of October, 2009 on the demo site (farm), two short presentations on 1) benefits and 2) risks of using for crop production were presented to the farmers. This was after a brief introduction of the resource person(s) and the agenda for the day which were clearly displayed on a flip chart. For easy understanding of the information presented to farmers, coloured pictures showing farmers from other parts of the world using urine, crops fertilized with urine or without urine, crops treated with urine and other forms of fertilizer etc. (see examples of photos in plate 5.1 below) were shown to participants during each of the two presentations. After that participants were allowed to ask questions (see box 5.1 for questions asked by farmers) and answers were provided. Finally farmers were led as a group by the training team to visit the trial site which was also used during the subsequent training programme. A total of about 45 farmers participated in the training.
Plate 5.1: Photos showing lettuce fertilized with urine (a) and others produced with other form of fertilizer (Photo credit: CREPA, Ouagadougou)
Plate 5.2: Meeting with farmers on the benefits and risks of using urine as alternative source of fertilizer for crop production at Dzorwulu (Photo credit: Philip Amoah and Noah Adamptey)

80
A similar training was organized for 25 Agricultural Extension Agents (AEAs) of the Ministry of Food and Agriculture (MoFA) and other key stakeholders on the 16th October, 2010(see plate 5.3). However, unlike the farmers two power point presentations on the benefits and risks of using urine as fertilizer were made. Each presentation was followed by a question and answer section.
Box 5.1 Questions from farmers and MoFA staff and other key stakeholder Farmers
1. Will any chemical be added to the urine before it is used? 2. Can the urine of other farm animal (sheep, goat, pigs) be used or only human urine? 3. Will farmers be willing to purchase urine? 4. Land has different soil characteristics, how will the experiment here cater for different soil
characteristics on different land? 5. Inorganic fertilizer has different application rates and mode of application. What about urine
fertilizer? 6. What are the possible problems to be encountered when urine is applied to soil with high
salinity?
MoFA staff and other key stakeholders
1. How will the urine be collected? 2. Are there urine-diverted toilets in the country? 3. Is the project working with the Ministry of Health to look at their views concerning the use of
urine fertilizer on public health? 4. Are the urine-diverted toilets designed to take care of both males and females? 5. What are the mode of application and the application rates of the urine fertilizer? 6. Are there guidelines for the use of urine as a source of fertilizer? 7. What can be done about the bad odour of urine on the farm? 8. Can urine used on the field as fertilizer drive away insects or attract them? 9. Urine in the villages have been used to trap rodents especially grasscutter. Will the urine
fertilizer when applied attract these rodents to the farmer’s crops or not? 10. What is the perception of farmers, marketers and consumers concerning the use of urine as
fertilizer?

81
Plate 5.2: Meeting with the extension staff of the Ministry of Food and Agriculture (MoFA), Accra on the benefits and risks of using urine in crop production (Photo credit: Philip Amoah and Noah Adamptey) 5.2 The second training A second training for only farmers was held on the 14th of December, 2009.. This was organized to demonstrate to farmers how urine (with or without other soil ameliorants) is applied, the effect on crop yield and on soil characteristics. A total of 35 farmers participated in this training. The following were gathered prior to the training: Stored urine Other soil ameliorants e.g. poultry manure (PM), dewatered faecal sludge (DFS),
inorganic fertilizer(NPK) Weighing scale Flip charts and sheets of paper for recording
The learning objectives were as follows: participants to know the correct method andrate of application of urine for crop
production.
participants to appreciate the effect of urine (with or without other soil ameliorants) on crop (yield, quality etc.).
to register farmers to take part in a field demonstration on urine use on farmers own field.
At the start of the meeting participants were welcomed by the trainer after which they were registered. Participants were then given an overview of the day’s agenda. The days training was introduced by recapping the issues discussed during the previous training (see the first training) and participants were allowed to ask questions for further clarification.

82
Information on urine application (application rate with or without other fertilizer sources, application distance, time of application etc.) was explained to participants. After that they were allowed to observe the urine and other forms of fertilizer used. The information used in this meeting was based on a field trial set out earlier by the research team (see chapter four of this report for details). The field trial (See a short description in box 5.2) was carried was carried out with one local farmer fully in charge of the day to day activities. Other farmers occasionally visited the site to observe what was happening. Box 5.2: The field trial Cabbages were grown on raised beds of size of approximately 3m2. Each bed had a total number of 30 cabbages planted at approximately 0.25m intervals. For the trial the plot was divided into 3 blocks. Each block contained five beds making a total of 15. Using a randomized complete block design (RCBD), each of the five beds in a block was randomly allocated to one of five treatments. The five different treatments (including control) consisted of application of urine alone, urine + dewatered faecal sludge (DFS), urine + PM (poultry manure), PM + NPK, and soil alone (control). These treatments were applied to the beds two weeks after transplanting following farmers’ usual practices. Before transplanting soil samples were collected from the beds for chemical analysis. The crops on a bed were irrigated once daily with approximately 30 litres of water every morning excluding rainy days.
Cabbages growing on beds at the trial plots (See detailed results on this trial with appropriate scientific analysis in chapter four) After the explanation (followed by questions and answers), the farmers were taken to the urine experimental plot to observe the effect of the various treatments on the mature cabbage. This session was very practical because after physical observation of the various plots, they were allowed to harvest four randomly selected cabbage heads and weigh (see plate 5.3 below) the marketable portion to assist them make a choice of the treatment they prefer to use. After the session, the harvested vegetables were carried to the laboratory for further analysis (including nutrient uptake assessment, fresh and dry weight determination, counting the number of leaves per cabbage head per treatment etc.) to see how the laboratory results compare with the farmers choice (results on this
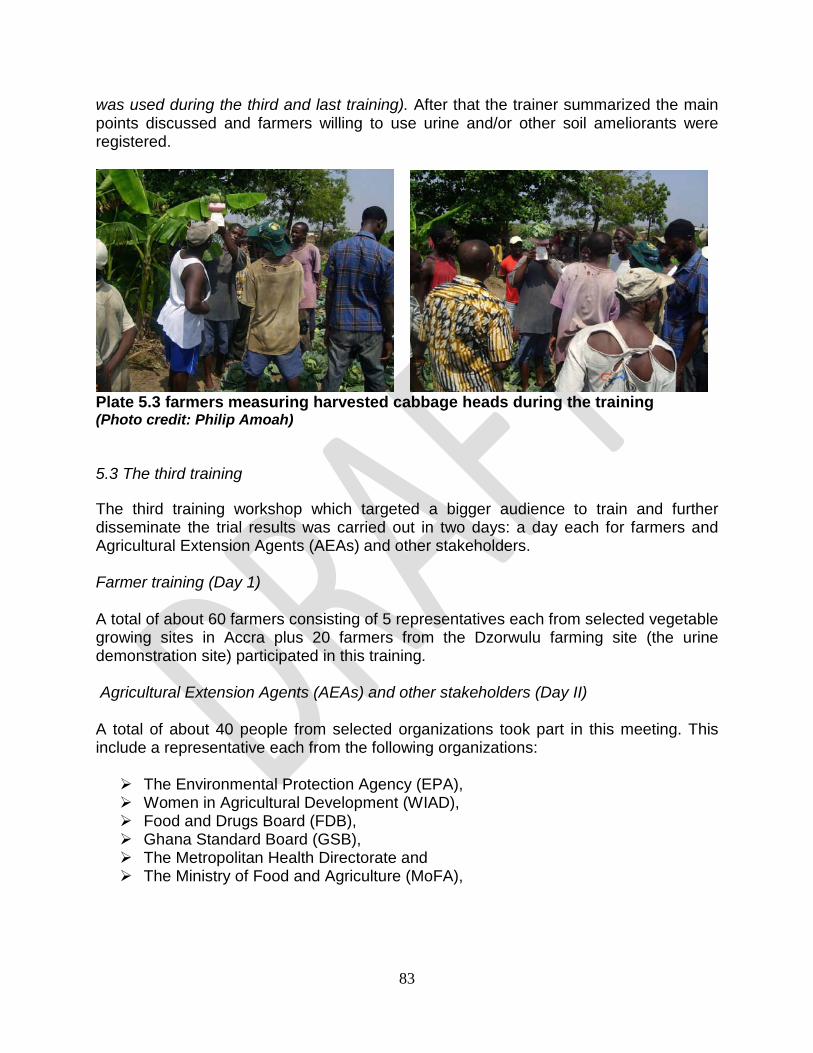
83
was used during the third and last training). After that the trainer summarized the main points discussed and farmers willing to use urine and/or other soil ameliorants were registered.
Plate 5.3 farmers measuring harvested cabbage heads during the training (Photo credit: Philip Amoah) 5.3 The third training The third training workshop which targeted a bigger audience to train and further disseminate the trial results was carried out in two days: a day each for farmers and Agricultural Extension Agents (AEAs) and other stakeholders. Farmer training (Day 1) A total of about 60 farmers consisting of 5 representatives each from selected vegetable growing sites in Accra plus 20 farmers from the Dzorwulu farming site (the urine demonstration site) participated in this training.
Agricultural Extension Agents (AEAs) and other stakeholders (Day II) A total of about 40 people from selected organizations took part in this meeting. This include a representative each from the following organizations: The Environmental Protection Agency (EPA), Women in Agricultural Development (WIAD), Food and Drugs Board (FDB), Ghana Standard Board (GSB), The Metropolitan Health Directorate and The Ministry of Food and Agriculture (MoFA),

84
The rest were 23 Agricultural Extension Agents (AEAs) from Accra Metropolitan Assembly (AMA) plus 4 AESs from each of the nearby districts assemblies and 3 IWMI Researchers. The learning objectives On both occasions the learning objectives included the following: Participants will be aware of the potential of urine as a source of fertilizer for crop
production (Message 1: urine is a potential source of fertilizer) Participants will understand how to minimize the health risk during the use of
urine for crop production (Message 2: potential health risk are manageable) Participants will know rate of application of urine (to be applied alone on in
combination with other sources of fertilizer) and methods of application for effective crop yield. (Message 3: urine could be applied alone or combined with other forms of fertilizer)
Participants (especially farmers) will know how to modify of on-farm ponds could
minimize risks associated with the use of wastewater for crop production. What happened The training sections were held separately on the 26th and 27th January, 2011 for farmers and other stakeholders, respectively (See plate 5.4 below). The methodology used included power point presentations, demonstrations and role plays. The presentations were on methods of application of urine and how to minimize potential risks associated with the urine, results from the on farm demonstrations carried out at Dzorwulu. After each of these presentations, participants were allowed to ask questions (see some questions below) for clarification. The questions asked opened up very fruitful discussion and gave more insight to the participants. The resource persons addressed all questions/issues raised and took note of suggestions from participants for consideration. At the end of the training participants were asked to give their remarks or generation impression about the entire training programme.

85
Plate 5.4 Photo showing AEAs from MoFA and other stakeholders and farmers during the training (Photo credit: Philip Amoah) Box 5.2 Questions asked
Farmers
The waste management Department has septic tank operators who dump faecal sludge and urine indiscriminately into the environment. How best can we put the mixed toilet and urine into good use?
What should be the planting distance(in this case cabbage) when using undiluted urine?
If crops are cultivated using the broadcasting method (not row planting) which is very common among
farmers, how can the urine be applied?
Is urine applied only to vegetables?
How does the use of urine help reduce carbon emission?
Urine may have different chemical composition depending on the source. Has the project taken into consideration the health implications on the consumers of urine fertilized vegetables?
Does the farmer need to know the moisture level of the soil before fertilization with either diluted or undiluted urine?
After storage for 1 month, will the nutrients in the urine be available for the crops?
Is it proven that after storage for 1 month there will be no health implications to the consumer?
Has the pharmaceutical contents of the urine been considered? If no will it be advisable to encourage farmers to start urine fertilization?
The chemical composition of urine shown suggests that there is low level of phosphorus. Do farmers need to
supplement the soil with phosphorus fertilizers?
Did the project consider different ratios (urine-water ratio) to benefit other plants? AEAs and other stakeholders What mechanisms do you have in place such that detergents and disinfectants are not found in the urine?
What is the best form of storage material since polytanks have hydrocarbons which can easily be dissolved
into the urine? What goes into pretreatment of urine? Can urine be applied during land preparation phase?

86
5.4 Results and lessons learnt 5.4.1 The introductory meeting The level of participation in the first training programme was very high. The participants were very happy to receive this training. This was evident from the enthusiasm with which the participants from both groups asked questions. During the first training farmers and the Agricultural Extension Agents (AESs) from the Ministry of Food and Agriculture showed different concerns on the use of urine in crop production. Farmers wanted to know more about how they can receive a regular supply of urine, how to obtain storage facilities, the mode and the different application rates for the various crops and different soil types (especially sandy soil) as well as the effect on soil characteristics5
. These questions were directly related to their farming activities and how the urine can be used effectively. Concerns were also raised about the use of using urine and the fear of being ridiculed for using urine as fertilizer, since it is perceived to be unhygienic. Religion was also an issue among the Moslem farmers who saw urine as unclean.
The extension staff on the other hand was more concerned about the possibility of collecting urine in substantial quantities. They expected that high volumes of urine will be required for production. Other concerns raised were safety issues related to the use of urine for farmers and consumers, guidelines on the use of urine, willingness of the farmers to use urine, the societal readiness to market and consume urine products. There are always varied fears and concerns surrounding handling of human excreta and urine. This was evident from the questions and comments made by most of the participants which pre supposes that more awareness campaigns would be required erase the negative perception some farmers and non-farmers have. Most of the questions asked were answered by the resource persons. However, some few questions were deferred to a later date when appropriate answers are expected to be ready. For example, on the rate of application of urine, farmers were referred to the experimental set up on the field which was designed to address this and other relevant issues. The two groups expressed interests to see the outcome of the field trial. 5.4.2 second training Like the previous training the level of enthusiasm of the participants was very high. The participatory approach used made is easier for the farmers to identify which of the treatments had a better impact on the yield and growth characteristics of cabbage. this made it easier for them to choose which type of fertilizer had the best impact on the crops and what will be applied on tried on their own farms. Questions from the previous training (e.g. the rate of application of urine) which were deferred pending results from the field trial were answered. 5 This was addressed in subsequent training

87
Most (about 60%) of the farmers who were prepared to use urine for crop production chose Urine + Poultry Dropping which gave a relatively high yield and low number of rotten cabbage heads. None of them said that they will use NPK and poultry droppings (PD) Even though that was the normal farmer practice. This combination (NPK and PD) recorded the highest number of rotten cabbage heads. Table 5.1 shows simplified results (see detailed results presented in chapter 4 above) of the observation and weighing exercise carried out by farmers during the training. Table 5.1: Fresh weight of cabbage and the number of rotten cabbage heads
Treatment No of cabbage per bed
No of rotten cabbage head
Weight of cabbage head (g)
Urine alone 28 4 900 Urine + PD 28 5 1000 Urine + DFS 29 7 900 NPK + PD 23 16 1040 Soil alone 17 6 700 From the discussions after the presentations it was obvious that participants were happy but would need more training and awareness creation to 5.4.3 Third training Farmers who participated in the training were happy to be trained on the use of urine as a source of fertilizer for crop production. This was more evident from the participants who joined the training for the first time. Similar observations were made in the agricultural extension agents and other stakeholder. The questions asked by both groups indicated that they were prepared to know more about urine and its use for crop production. It was evident from the questions asked that a lot more work needs to be done to ensure that enough information on urine use is made available for potential users. For example there is the need to conduct these trials on different soils and in different regions and also on different crops since some conclusions drawn from the trials conducted cannot be generalized. A simplified user manual on the methods and use of urine was suggested since this is new to many farmers especially those who were not part of the previous training. This will also make it easier for more Agricultural extension staff to be trained and scale up the use of urine by farmers in other areas. Concerns raised about the pharmaceutical residues in urine and the potential impact on consumer and this needs to be investigated. Detailed research and laboratory analysis of urine would be required to confirm or other the presence and quantities of the pharmaceutical residues. Other concerns raised which would need further and research is the bad odour of urine and how to reduce it. Suggestions were also made to look at the possibility of converting urine and other sources (PD, DFS etc) into of pellets for easy application

88
Chapter 6 General conclusions and recommendations
Socioeconomic part The demo project has revealed that: Considering the logistic needs which include collection, storage and treatment,
transportation of urine and also labour requirements etc. it is concluded that investment in urine to be used for fertilization purposes is capital intensive and would require a high initial capital for any potential investor. The required administrative and managerial competence for the operation of the urine collection and reuse system can all be found in the Central Business District of the Accra Metropolitan Assembly
The volumes of urine generated by the urinals in the Central Business District of
Accra far exceed what would be required for urban vegetable farming. It is estimated that about 5,000m3 of urine is generated yearly from these urinals as against 2,000m3 which would be required for urban vegetable farming.
The cost-benefit analysis study showed that both a profit-oriented entrepreneur and
the Accra Metropolitan Assembly (AMA) (Public ownership) who would wish to enter into such a business would not be successful if it is considered that the operation will last 20 years and the discount rate is 25% with a urine user fee of GH¢ 0.05 and sale of urine to farmers at GH¢0.30 per jerry-can (20 litres). However it is feasible for operation by both a private entrepreneur and for public ownership if they charge a urine user fee of GH¢ 0.10. The payback periods of 5 and 3 years were calculated for the private entrepreneur and the public ownership, respectively if they charge a user fee of GH¢ 0.10.
In one cropping cycle which is normally 3 month, a cabbage farmer with an average
farm size of 0.02ha would make a savings of about GH¢ 25 when they purchase and use sanitized urine as an alternative to the chemical fertiliser (NPK).
Many farmers (>80%) perceive human urine to contain plant nutrients and that it should not be disposed off as municipal waste and about 80% of them were willing to handle human urine as an alternative fertilizer. About 90% of the farmers were more willing to embrace the urine technology to help improve their yield and that religion and norm in the society would not be an impediment to their use of the urine technology. However, the continuous use of urine by farmers would depend on the patronage of u-vegetables by consumers and marketers.
The study concludes that marketers do not view human urine as a resource and
their decision to buy u-vegetables or not is not backed by religion but rather norms in the society and possible health risk associated with the use of human urine for

89
vegetable production on consumers. Most marketers do not want human urine to come close to any farm activity. They, unlike the farmers believe that urine has no nutrient value to be used for vegetable production. The perceived health risks on consumers were also cited and that many consumers would not patronize their produce. Some of them will look for alternative places other than Accra to buy vegetables if the ones produced in Accra are fertilized with human urine. Marketers were not willing to buy u-vegetables at a higher price than the conventional ones.
Some marketers however identified 1) the potential reduction in cost of vegetables if urine, instead of inorganic fertilizer, is used in for production as why they are in favour of the use of urine, 2) the perceived medicinal value inherent in human urine and 3) the long lifespan of organic produce were cited as the main reasons why they would encourage farmers to use human urine as an alternative fertilizer on vegetables.
The consumers’ perception study showed that some consumers (56%) do not want
human urine to be disposed off as a municipal waste, although they (72%) could not tell what is in human urine that makes it a resource. Meanwhile, about 44% of the consumers were willing to buy u-vegetables as obtained from the PCA. These were people who perceive urine as a resource and their consumption of u-vegetables is independent of religious influence and norm in the society. The reasons they gave included lack of alternative source of vegetables and their inability to guarantee the safety of the conventional vegetables on the market because the market women would not disclose the source of the produce to them. However, consumers mentioned a perceived health risk associated with the consumption of u-vegetables as a major concern that can influence their choice to consume u-vegetables. None of the consumers was able to mention a specific disease associated with consumption of u-vegetables. Socio-economic characteristics of consumers who were willing to consume u-vegetables was however not different from those who would not consume. The main conclusion drawn is that consumers were willing to buy u-vegetables but more concerned about the possible health effects of u-vegetables consumption.
The farmer probit estimation showed that perception about urine quality, gender, mode of soil conservation, location and soil condition positively affected farmers’ willingness to adopt the urine technology. The study concludes that farmers with positive perception about urine quality will adopt the technology. The probability that male farmers will be willing to adopt the urine technology will increase by 26% more than females. Young farmers will be more willing to adopt the technology than the elderly. Farmers who use organic fertilizers probability of using the urine technology are higher than those who do not use organic fertilizers by 0.06. Indeed, farmers with perceived good soil conditions will increase their adoption of the urine technology by 14% relative to their colleagues with perceived poor soil conditions.
The marketer probit model estimation found that marketers’ willingness to buy u-vegetables was influenced by their perception, gender, norm and religious influence.

90
A unit increase in a marketer’s urine perception index increases the probability of willingness to buy u-vegetables by 0.03. Probability of willingness to buy u-vegetables was highest among marketer’s whose religious beliefs is not against the use of human urine for vegetable production than those whose religious belief is against human urine use on vegetable production by 0.585. Female marketers’ willingness to buy u-vegetables is higher than male marketers by 48% even if the cultural situation surrounding their communities is against the use of human urine for vegetable production.
The consumer probit estimation also revealed that a 1% increase in consumer’s income will lead to 11% decrease in consumer’s willingness to buy u-vegetables. Consumers with alternative source of buying vegetables willingness to buy u-vegetables will decrease by 35 percent relative to consumers with no alternative source. However, a positive consumer perception about urine will increase his/her willingness to consume u-vegetables by 2.4%.
The study also observed some potential barriers that can impede the successful
introduction of the use of human urine on vegetables. These include (no order): The health effects (the perceived health risk of urine use and effect of misapplication by farmers), socio-cultural perceptions (opposition from the religious groups, traditional councils and media), environmental effects (perceived effect of continuous use of the human urine on plants and the soil), technical know-how (lack of knowledge on application rate and mode of application, urine availability, rodent attack, urine effect on different climatic conditions, and so on) and economic effects (would it be profitable - the price that the urine would be sold).
Agronomic part The results suggest that urine with poultry droppings (PD) or dewatered faecal
sludge (DFS) could be used as a good substitute for NPK + PD (farmer practice) for cabbage cultivation. Although the amounts of applied N were similar for all the fertilizer treatments, the cabbage yield and above ground dry matter yield were highest in the Urine + PD treatment possibly due to high nutrient uptake. Urine treated plots had reduced percentage rottenness of cabbage between 20% and 28% compared to 58% farmer practice (NPK + PD) in the first trial. Soil residual nitrogen content for Urine + DFS and Urine + PD were significantly (P< 0.05) higher than that of NPK + PD. Even though urine could be an alternative source of nutrients for crop production applying it in combination with other organic fertilizer e.g. poultry drippings or dewatered faecal sludge produce better results confirming the fertilizer value of Urine + DFS, and Urine + PD.
The findings from this study have important implications. They may contribute to the development of positive attitudes about the use of Urine + PD or Urine + DFS as fertilizer - a way to increase crop yield and reduce water pollution. In addition, results may contribute to optimize the use of Urine + PD or Urine + DFS to fertilize crops,

91
which will help to maintain cabbage quality, improve soil characteristics, and to control N emission from the waste materials as well as reducing the demand for industrial fertilizer to some extent, thus reducing the environmental pollution released during fertilizer manufacturing and transportation. However, the authors recommend that the research should be repeated on different soils in different locations to confirm the conclusions made. Detail research should also be conducted on the effect of the treatments on rottenness of cabbage head, leaching of nitrate, and soil electrical conductivity.
Recommendations Based on the findings from the study and questions asked by participants during the training exercise it can be recommended that further studies should be conducted in the following areas
• The research should be repeated on different soils in different locations to confirm the conclusions made.
• More research on the levels of pharmaceuticals and hormones in urine and its transformation through the soil and to plants
• Detail research should also be conducted on the effect of the treatments on rottenness of cabbage head, possible leaching of nitrate, and soil electrical conductivity
• The effect of urine on soil characteristics over a successive cropping season will be require further research since urine, for example has a relatively high amount of salt.
• More research on how to reduce the scent associated with urine and how to concentrate the nutrients will be required.
• More work on the logistical requirements for a successful business in the use of urine will be useful for potential entrepreneur.
• Further training and awareness creation would be required to improve the knowledge and skills of all stakeholders and to upscale the use of urine as a source of fertilizer in agriculture.

92
REFERENCES
Adesina, A. A. (1996). ‘Factors affecting the adoption of fertilizers by rice farmers in Cote d’Ivoire.’ Nutrient Cycling in Agroecosystems, vol. 46, pp. 29-39.
AMA (2006): Know Accra Metropolitan Assembly. Retrieved from http://ama.ghanadistricts.gov.gh/ retrieved on 20/08/09.
Annorbah-Sapei et al., 1994 Batte, M. T., Hooker, N. H., Haab, T. C. and Beaverson, J. (2007). ‘Putting their
moneywhere their mouths are: Consumer willingness to pay for multi-ingredient, processed organic food products.’ Food Policy, vol. 32, pp. 145–159.
Boccaletti, S. and Nardella, M. (2000). ‘Consumer willingness to pay for pesticide-free fresh fruit and vegetables in Italy.’ International Food and Agribusiness Management Review, vol. 3, pp. 297–310.
Bonzi M, (2008): Experiences and opportunities for human excreta fertiliser in improving small scale Agriculture, Stockholm World Water week presentation.
Buzby, J., Skees, J. and Ready, R. (1995). Using contingent valuation to value food safety: a case study of grapefruit and pesticide residues. In J. A. Caswell (Ed.), Valuing food safety and nutrition (pp. 219–256).Boulder, CO: Westview Press.
Cencosad (1994). Urban market gardens in Accra. Centre for Community Studies, Action and Development and the Mega Cities Project. Accra, Ghana.
Clark, G. A. (2003). A test of the production of organically fertilized amaranth in Tehuixtla, Morelos, Mexico. Manuscript [Online] available at: [email protected]
Cofie, O., Danso, G., Larbi, T., Kufogbe, S. K., Obiri-Opareh, N., Abraham, E., Schuetz, T. and Henseler, M. (2006). Urban agriculture in Accra, Ghana - Assessing Livelihood Potentials and Policy Mechanisms. A working paper for the RUAF project.
Cofie, O.O, Mainoo, O. K et al (2007): The potential of urine recovery and reuse densely populated districts within the Accra Metropolitan Area. A working paper for the IWMI project.
Danso, G., Drechsel, P. and Gyiele, L. (2003). Urban household perception of urine-excreta and solid waste source separation in urban areas of Ghana. Paper presented at the 2nd International Symposium on Ecological Sanitation, April 2003. Lübeck, Germany.
Drangert, O. J. (2004). Norms and Attitudes Towards Ecosan and Other Sanitation Systems. Stockholm: EcoSanRes Publication Series.
Drechsel, P., Graefe, S., Sonou, M. and Cofie, O. O. (2006). Informal irrigation in urban West Africa: An overview. Colombo, Sri Lanka: International Water Management Institute (IWMI Research Report 102).
Duncker, L. C., Matsebe, G. N. and Moilwa, N. (2007). ‘The Social/cultural Acceptability of Using Human Excreta (faeces and urine) for Food Production in Rural Settlements in South Africa.’ WRC Report No TT 310/07.
Egyir and Nyamike Jnr, (2007). Urban and Peri-urban Agriculture: Towards a better understanding of low-income producer organizations. Food and Agriculture Organisation of the UN, Rome Italy.

93
Esrey, S. A. and Andersson, I. (2001). Ecological Sanitation. Closing the loop. [Online] available at: www.ruaf.org/1-3/35-37/.html
Falusi, A.O. (1974/5). ‘Application of multivariate probit to fertilizer use decision: sample survey of farmers in three states in Nigeria.’ J. Rural Econ. Dévelopment, vol. 9, no.1, pp.49-66.
Flynn-Dapaah, K. (2002). Land negotiations and tenure relationships: Accessing land for urbanand peri-urban agriculture in Sub-Saharan Africa. CFP Report Series 36. IDRC: Ottawa.
Fox, J. A., Shogren, J. F., Hayes, D. J. and Kliebenstein, J. B. (1995). Experimental auctions to measure willingness to pay for food safety. In J. A. Caswell (Ed.), Valuing food safety and nutrition (pp. 115–128). Boulder, CO: Westview Press.
Gittinger, J.P. (1982), Economic Analysis of Agricultural project, Second edition, the John Hopkins University Press; Baltimore, USA.
GSS (2005). 2000 Population and housing census: Greater Accra Region. Analysis of district data for planning. Ghana Statistical Service, Accra, Ghana.
Government of Ghana (1999). ‘Environmental Sanitation Policy’ (ESP). Ministry of Local Government and Rural Development. Accra, Ghana.
Greene, W. H. (2003). Econometric Analysis. Fifth Edition, Pearson Education, Inc., Upper Saddle River, New Jersey.
Gujarati, D. N. (2004). Basic Econometrics. Fourth Edition, McGraw-Hill, New York. Hailu, Z. (1990). ‘The adoption of modern farm practices in African agriculture. Empirical
evidence about the impacts of household characteristics and input supply systems in the Northern Region of Ghana’. Nyankpala Agricultural Research Report 7, CSI/GTZ, pp.114-167.
Heinonen-Tanski, H., Sjöblom, A.; Fabritius, H. and Karinen, P. (2007). ‘Pure human urine is a good fertilizer for cucumbers’. Bioresour. Technol, vol. 98, pp. 214 –217.
Huang, C. L., Kan, K. and Fu, T. (1999). ‘Consumer Willingness to Pay for Food Safety in Taiwan: A Binary-Ordinal Probit model of Analysis’. The Journal of Consumer Affairs, vol. 33, no.1, pp.76-91.
Johansson, 2000: Urine Separation – Closing The Nutrient Cycle Final Report On The R&D Project Source-Separated Human Urine – A Future Source Of Fertiliser For Agriculture in the Stockholm Region.
Johnson T. D. (1982), The Business of Farming. A Guide to Farm Business Management in the Tropics, the Macmillan Press LTD.
Jönsson, H (2003). The role of ecosan in achieving sustainable nutrient cycles. In: Ecosan – Closing the loop. Proceedings of the 2nd international symposium on ecological sanitation, incorporating the 1st IWA specialist group conference on sustainable sanitation, Lübeck, Germany, April 7–11; pp. 35 – 40.
Jönsson, H., Stintzing, A. R., Vinnerås, B. and Salomon, E. (2004). Guidelines on the Use of Urine and Faeces in Crop Production. EcoSanRes Programme. Stockholm Environment Institute, Sweden.
Kebede, Y., Gunjal, K. and Coffin, G. (1990). Adoption of new technologies in Ethiopian agriculture: the case of Tegulet-Bulga District, Shoa Province. Agricultural Economics. Vol 4. No.1.

94
Kirchmann, H. and Pettersson, S. (1995). ‘Human urine chemical composition and fertilizer use efficiency’. Fert. Res, vol. 40, pp.149–154.
Koomson, P. (2010): Perception and willingness of market actors on use of human urine and its products for urban in the city of Accra. Unpublished M.Phil. thesis, Department of Agricultural Economics and Agribusiness, University of Ghana.
Kvarmo, P. 1998. Human urine as nitrogen fertiliser to cereals. (In Swedish). MSc thesis 1998, no 107, Department of Soil Science, Swedish University of Agricultural Sciences.
Lienert, J., Haller, M., Berner, F., Stauffacher, M. and Larsen, T. A. (2002). ‘How farmers in Switzerland perceive fertilizers from recycled anthropogenic nutrients (urine)’. Water Science and Technology, vol. 48, No.1, pp. 47–56.
Misra, S. K., Huang, C. L., and Ott, S. L. (1991). ‘Consumer Willingness to Pay for Pesticide-Free Fresh Produce’. Western Journal of Agricultural Economics, vol.16, no. 2, pp. 218-227.
Nkamleu, G. B. and Adesina, A. A. (2000). ‘Determinants of chemical input use in peri-urban lowland systems: Bivariate probit analysis in Cameroon’. Agricultural Systems, vol. 63, pp.111-121.
Norris, P. E. and Battie, S. S. (1987). ‘Virginia farmers soil conservation decisions: an application of Tobit analysis’. Southern J. Agric Econ, vol. 52, pp.208-220.
Nurah, G. K. (1999). Baseline study of vegetable production in Ghana. NARP Report, p.151,July 1999, KNUST, mimeo.
Obosu-mensah 2001 Obuobie, E., Danso, G. and Drechsel, P. (2003). Access to land and water for urban
vegetable farming in Accra. Urban Agriculture Magazine 11, pp.15-17. Offei, M. K. (2010). Feasibility of the production and use of human urine as liquid
fertilizer for vegetable farming in Accra. Unpublished M.Phil Thesis. Department of Agricultural Economics and Agribusiness, University of Ghana: Legon.
Otieno, M. O. and Von Münch, E. (2006). Investigating the attitudes of several communities in Nakuru municipality (Kenya) towards sanitation issues and ecosan options. 3rd International Ecological Sanitation Conference, 23-26 May 2006. Durban, South Africa.
Pinsem, W. and Vinnerås, B. (2003). Composting with human urine: plant fertilizer approach. Paper presented at the 2nd International Symposium on Ecological Sanitation, April 2003. Lübeck, Germany.
Posri, W., Shankar, B. and Chadbunchachai, S. (2007). ‘Consumer Attitudes Towards and Willingness to Pay for Pesticide Residue Limit Compliant “Safe” Vegetables in Northeast Thailand’. Journal of International Food & Agribusiness Marketing, vol. 19, no.1, pp.81-101.
Rahm, M. R. and Huffman, W. E. (1984). The adoption of reduced tillage: the role of human capital and other variables. American Agricultural Economics Association, pp 405-413.
Rahm, T. and Singh, R. D. (1988). Farm household in rural Burkina Faso: some evidence on allocative and direct returns to schooling, and male-female labour productivity differentials. World Development, vol. 16. no.3, pp.419-424.
95
Schönning, C. and Stenström, T. A. (2004). Guidelines for the Safe Use of Urine and Faeces in Ecological Sanitation Systems. Report 2004-1. EcoSanRes Programme. Stockholm Environment Insitute.
Schönning, C., Leeming, R. and Stenström, T. A. (2002). ‘Faecal contamination of source-separated human urine based on the content of faecal sterols.’ Water Research, vol. 36, no.8, pp.1965-1972.
Schouw, N. L.; Danteravanich, S.; Mosbaeck, H.; Tjell, J. C. (2002) Composition of human excreta, a case study from Southern Thailand. Sci. Total EnViron., vol. 286, pp.155–166.
Singh, R. D. (2003). Urine-separating toilet in popularising ecological sanitation in the peri-urban of Manipur, India. Paper presented at the 2nd International Symposium on Ecological sanitation, April 2003.Lübeck, Germany.
Simons, J. and Clemens, J. (2004). The use of separated human urine as mineral fertilizer. In: Ecosan –closing the loop. Proceedings of the 2nd International Symposium on Ecological Sanitation. Incorporating the 1st IWA specialist group conference on sustainable sanitation, 7th-11th April 2003. Lubeck, Germany.
Sridhar, M. K. C., Coker, A. O., Adeoye, G. O. and Akinjogbin, I. O. (2005). Urine Harvesting and Utilization for Cultivation of Selected Crops: Trials from Ibadan, South West Nigeria. Paper presented at the 3rd International Ecological Sanitation Conference, 23-26 May 2005. Durban, South Africa.
Stintzing, A. R. (2005). Urine use in agriculture: organizational issues on municipal level. Paper presented at the 3rd International Ecological Sanitation Conference, May 2005. Durban, South Africa.
Stintzing, A. Richert, Rodhe, L. and Åkerhielm, H. (2001). Human urine as fertiliser of plant nutrients, application technique and environmental effects. Swedish Institute of Agricultural Engineering (JTI): Uppsala, Sweden; JTI-report Lantbruk & Industri 278.
Sullivan, L. P. and Grantham, J. J. (1982). Physiology of the Kidney, 2nd ed.; Lea & Febiger: Philadelphia, PA; p 236.
Sundin, A. (1999), Humane urine improves the growth of Swiss chard and soil fertility in Ethiopian urban agriculture. Thesis and Seminar projects No. 112, Department of Soil Science, Swedish University of Agricultural Sciences.
Tetteh-Lowor, F. (2007). Closing the loop between sanitation and agriculture in Accra, Ghana. - Improving yields in urban agriculture by using urine as a fertilizer and drivers & barriers for scaling-up. M.Sc Thesis. Urban Environmental Management. Wageningen University: Netherlands.
Tsiagbey, M., Danso, G., Leslie, A. and Eric, S. (2005). Perceptions and Acceptability of Urine-Diverting Toilets in a Low-Income Urban Community in Ghana. Paper presented at the 3rd International Ecological Sanitation Conference, 23-26 May 2006. Durban, South Africa.
WHO (2006). Guidelines for the safe use of wastewater, excreta and greywater. Vol.4: Excreta and greywater use in agriculture. Geneva, Switzerland. World Health Organisation.
Winblad, U. and Simpson-Hébert, M. (2004). Ecological sanitation –Revised and Enlarged Edition. Stockholm Environmental Institute, Stockholm, Sweden, 2004.

96
Adamtey, N., 2006. Development of compost-fertilizer (comlizer) for improved nutrient and water use by urban farmers. Report to IDRC- AGROPOLIS, School of Research and Graduate Studies, Faculty of Science, University of Ghana, Legon, Accra, Ghana, p.41.
Amoah, P., Drechsel, P. and Abaidoo, R.C., 2005. Irrigated urban vegetable production in Ghana: Sources of pathogen contamination and health risks elimination. Irrigation and Drainage. 54, S49-S61.
Black, C.A., Evans, D.D., White, J.L., Ensminger, L.E. and Clark, F.E. (Editors), 1965. Agronomy, No.9, Part 2: Methods of soils analysis. Amer. Soc. of Agronomy, Madison, Wisconsin.
Cofie, O.O., Kranjac-Berisavljevic, G. and Drechsel, P., 2005. The use of human waste for peri-urban agriculture in Northern Ghana. Renewable Agriculture and Food Systems. 20 (2), 73-80.
Folin, O. and Farmer, J., 2009. A new method for the determination of total nitrogen in urine. Biological Chemistry, 493-501 Dowloaded from www.jbc.org, on October 1, 2009.
Guyton, A., 1986. Textbook of Medical Physiology. W.B. Saunders Co, Philadelphia, USA.
Heinonen-Tanski, H., Sjöblom, A., Fabritius, H. and Karinen, P., 2007. Pure human urine is a good fertilizer for cucumbers. Bioresour Technol. 98, 214-217.
Heinonen-Tanski, H. and Van Wijk-Sijbesma, C., 2005. Human excreta for plant production. Review Paper. Bioresource Technology. 96 (4), 403-411.
Kirchmann, H. and Pettersson, S., 1995. Human urine - Chemical composition and fertilizer use efficiency. Fertilizer Research. 40, 149-154.
Mnkeni, P.N.S., Austin, A. and Kutu, F.R., 2005. Preliminary studies on the evaluation of human urine as a source of nutrients for vegetables in the Eastern Cape Province, South Africa. In: Ecological Sanitation: a Sustainable Integrated Solution. , Proc. of the Third International Ecological Sanitation Conference,, Durban, South Africa, 23-26 May 2005, pp. 418-426. http://conference2005.ecosan.org/papers/mnkeni_et_al.pdf.
Mnkeni, P.N.S., Kutu, F.R., Muchaonyerwa, P. and Austin, L.M., 2008. Evaluation of human urine as a source of nutrients for selected vegetables and maize under tunnel house conditions in the Eastern Cape, South Africa. Waste Management and Research. 26 (2), 132-139.
Okalebo, J.R., Guthua, K.W. and Woomer, P.J., 2002. Laboratory methods of soil and plant analysis- A working manual. TSBF-CIAT and SACRED Africa, Nairobi, Kenya, pp. 128.
Pradhan, S., Holopainen, J.K. and Heinonen-Tanski, H., 2009. Stored human urine supplemented with woodash as fertilizer in tomato (Solanum lycopersicum) cultivation and its impacts on fruit yield and quality. J. Agric. Food Chem. 57 7612–7617.
Pradhan, S.K., Anne-Marja, N., Sjöblom, A., HOLOPAINEN, J.K. and Heinonen-Tanski, H., 2007. Use of human urine fertilizer in cultivation of cabbage (Brassica oleracea)-Impacts on chemical, microbial, and flavor quality. J. Agric. Food Chem. (55 ), 8657-8663.

97
Richert Stintzing, A., Rodhe, L., Akerhielm, H. and Steineck, S., 2002. Human urine as a fertiliser-plant nutrients, application technique and environmental effects. . In: J. In: Venglovsk, Gréserovà, G., (Eds.), (Editor), Proc. 10th Int. Conf. Ramiran 2002 Network. . FAO European System of cooperative Research Network., pp. 161-162.
Sullivan, L.P. and Grantham, J.J., 1982. Physiology of the Kidney, 2nd ed.; Lea & Febiger: Philadelphia, PA, ; p. 236.
TMECC, 2002. Test methods for the examination of composting and compost (TMECC). The United States Department of Agriculture and the United States Composting Council "http://tmecc.org/tmecc//"
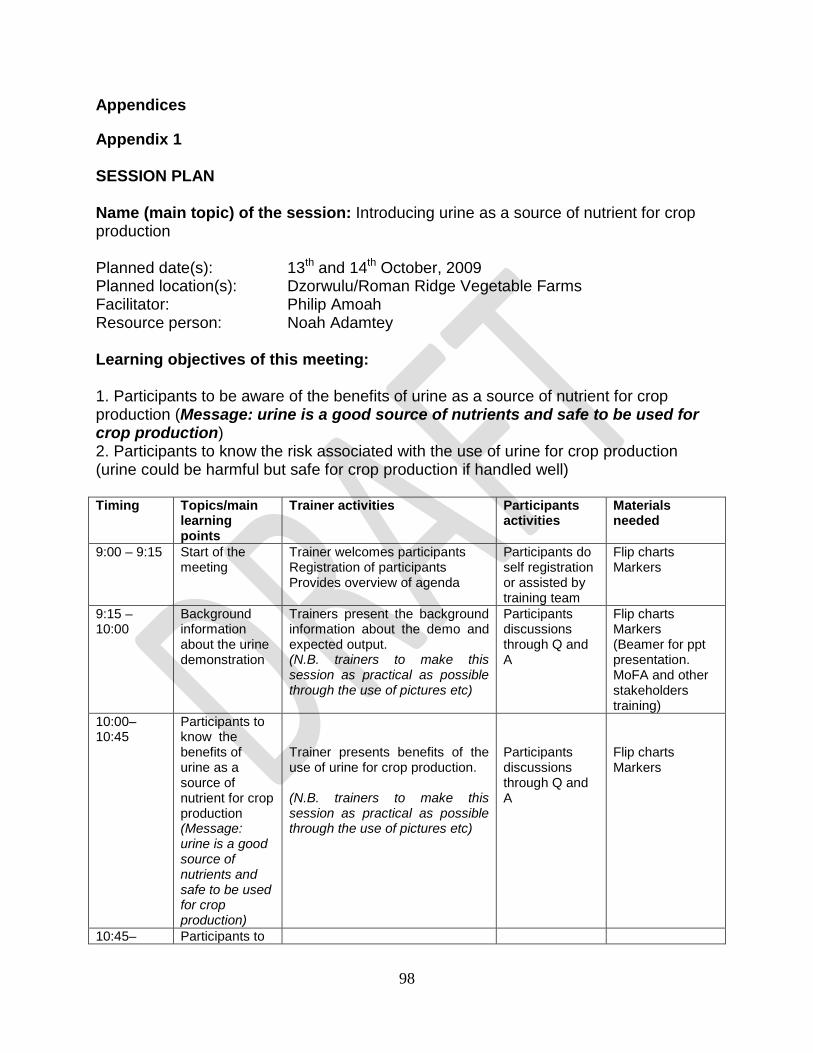
98
Appendices
Appendix 1 SESSION PLAN Name (main topic) of the session: Introducing urine as a source of nutrient for crop production Planned date(s): 13th and 14th October, 2009 Planned location(s): Dzorwulu/Roman Ridge Vegetable Farms Facilitator: Philip Amoah Resource person: Noah Adamtey Learning objectives of this meeting: 1. Participants to be aware of the benefits of urine as a source of nutrient for crop production (Message: urine is a good source of nutrients and safe to be used for crop production) 2. Participants to know the risk associated with the use of urine for crop production (urine could be harmful but safe for crop production if handled well) Timing Topics/main
learning points
Trainer activities Participants activities
Materials needed
9:00 – 9:15 Start of the meeting
Trainer welcomes participants Registration of participants Provides overview of agenda
Participants do self registration or assisted by training team
Flip charts Markers
9:15 – 10:00
Background information about the urine demonstration
Trainers present the background information about the demo and expected output. (N.B. trainers to make this session as practical as possible through the use of pictures etc)
Participants discussions through Q and A
Flip charts Markers (Beamer for ppt presentation. MoFA and other stakeholders training)
10:00– 10:45
Participants to know the benefits of urine as a source of nutrient for crop production (Message: urine is a good source of nutrients and safe to be used for crop production)
Trainer presents benefits of the use of urine for crop production. (N.B. trainers to make this session as practical as possible through the use of pictures etc)
Participants discussions through Q and A
Flip charts Markers
10:45– Participants to

99
11:30 know the risk associated with the use of urine for crop production (Message: urine could be harmful but safe for crop production if handled well
Trainer presents risks of the use of urine for crop production. (N.B. trainers to make this session as practical as possible through the use of pictures etc)
Participants discussions through Q and A
Flip charts Markers (Beamer for ppt presentation. MoFA and other stakeholders training)
11:30– 12:15
Summary Trainers summarizes the main points discussed.
Flip charts Markers

100
Appendix 2 SESSION PLANNING Name (main topic) of the session: Urine application and its effect on crop yield Planned date(s): 10th December, 2009 Planned location(s): Dzorwulu/Roman Ridge Vegetable Farms Resource person: Noah Adamtey Learning objectives of this meeting: 1. Participants to know the correct method of application of urine for crop production 2. Participants to appreciate the effect of urine (with or without other soil ameliorants) on crop (yield, quality etc) 3. Register farmers to take part in urine demonstration Timing Topics/main
learning points Trainer activities Participants
activities Materials needed
9:00 – 9:15 Start of the meeting
Trainer welcomes participants Registration of participants Provides overview of agenda
Participants do self registration or assisted by training team
Flip charts Markers
9:00 – 9:30 Previous lessons recapped
Trainer introduces the days training by recapping the issues raised during the previous training
Participants to ask questions for better understanding
Flip charts Markers
9:30–10:15 Information on rate of urine application etc (to be based on quantities of urine applied, application distance from crop, application with or without manure etc during the demo)
Trainers present the background information about the demo and expected output. (N.B. trainers to demonstrate these activities with the farmers on the field)
Participants discussions through Q and A
Flip charts Markers Urine and other manure (poultry manure, comlizer)
10:15– 11:00 Participants to deepen their knowledge by asking question for further clarification
Trainer addresses related questions and further clarifies issues raised. (N.B. trainers to make this session as practical as possible through the use of pictures etc)
Participants discussions through Q and A
Flip charts Markers

101
11:00– 11:45
Participants to know the impact of urine use on crop yield
Trainer guides the participant to make direct observation of treated crops and explain the various treatments and their effect on crops to the farmers. (N.B. trainers to make this session as practical as possible through the use of pictures etc)
Participants discussions through Q and A Participants allowed to take some measurements (height, weight circumference of head etc) and compare various treatments to appreciate the impact on the yield
Flip charts Measuring devices (weighing scale, measuring tape/ruler) Markers
11:45– 12:15 Summary Trainer summarizes the main points discussed.
Flip charts Markers
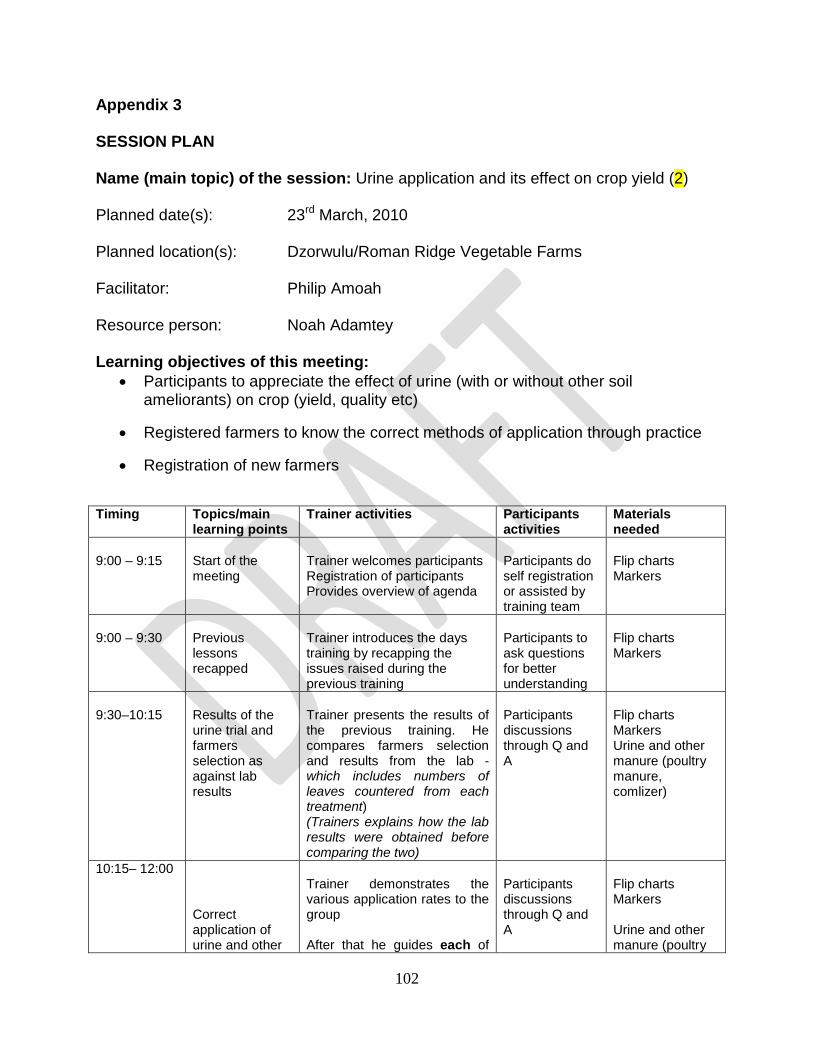
102
Appendix 3 SESSION PLAN Name (main topic) of the session: Urine application and its effect on crop yield (2) Planned date(s): 23rd March, 2010 Planned location(s): Dzorwulu/Roman Ridge Vegetable Farms Facilitator: Philip Amoah Resource person: Noah Adamtey Learning objectives of this meeting:
• Participants to appreciate the effect of urine (with or without other soil ameliorants) on crop (yield, quality etc)
• Registered farmers to know the correct methods of application through practice
• Registration of new farmers
Timing Topics/main
learning points Trainer activities Participants
activities Materials needed
9:00 – 9:15
Start of the meeting
Trainer welcomes participants Registration of participants Provides overview of agenda
Participants do self registration or assisted by training team
Flip charts Markers
9:00 – 9:30
Previous lessons recapped
Trainer introduces the days training by recapping the issues raised during the previous training
Participants to ask questions for better understanding
Flip charts Markers
9:30–10:15
Results of the urine trial and farmers selection as against lab results
Trainer presents the results of the previous training. He compares farmers selection and results from the lab - which includes numbers of leaves countered from each treatment) (Trainers explains how the lab results were obtained before comparing the two)
Participants discussions through Q and A
Flip charts Markers Urine and other manure (poultry manure, comlizer)
10:15– 12:00 Correct application of urine and other
Trainer demonstrates the various application rates to the group After that he guides each of
Participants discussions through Q and A
Flip charts Markers Urine and other manure (poultry

103
inputs the registered farmers to apply the selected input on their own farms and also addresses related questions and further clarifies issues raised on individual basis. (this section may be extended to the following day if all registered farmers are not covered)
Farmers do the application on their own farms and asks question for clarification
manure, comlizer)
12:00– 12:15 Summary Group reconvenes (if all registered farmers are guided to apply the input(s) in time) and trainer summarizes the main points discussed.
Flip charts Markers