demonstration of the iron-regulated surface … · conduit of the heme transfer pathway. our data...
TRANSCRIPT
DEMONSTRATION OF THE IRON-REGULATED SURFACE DETERMINANT HEME TRANSFER PATHWAY IN STAPHYLOCOCCUS AUREUS
Muryoi, Naomi1, Tiedemann, Michael, T.2, Pluym, Mark2, Cheung, Johnson1, Heinrichs, David E.1, and Stillman, Martin J.2
From Department of Microbiology and Immunology1, The University of Western Ontario, London, Ontario, CANADA N6A 5C1 and Department of Chemistry2, The University of
Western Ontario, London, Ontario, CANADA N6A 5B7
RUNNING Head: Heme transfer between S. aureus Isd proteins *Address correspondence to: David E Heinrichs, Department of Microbiology and Immunology, University of Western Ontario, London, Ontario, CANADA N6A 5C1; E-mail: [email protected] and Martin J. Stillman Department of Chemistry, University of Western Ontario, London, Ontario, CANADA N6A 5B7; E-mail: [email protected].
In this study, we report experimental results that provide the first complete challenge of a proposed model for heme acquisition by S. aureus via the Isd pathway first put forth by Mazmanian et al. (Science 2003 299: 906-909). The heme-binding NEAT domains of Isd proteins IsdA, IsdB (domain 2), IsdC, and HarA/IsdH (domain 3), and the heme-binding IsdE protein, were overexpressed and purified in apo (heme-free) form. Absorption and magnetic circular dichroism spectral data, together with electrospray ionization mass spectrometry were used to unambiguously identify that heme transfers from NEAT-A, through NEAT-C, to IsdE. Heme transfer was demonstrated to occur in a unidirectional fashion in the sequence NEAT-B2 → NEAT-A → NEAT-C → IsdE or, alternatively, initiating from NEAT-H3 instead of NEAT-B2: NEAT-H3 → NEAT-A → NEAT-C → IsdE. Under the conditions of our experiments, only NEAT-H3 and NEAT-B2 could transfer bidirectionally, that is in the reverse direction as well, and only with each other. While apo-IsdE readily accepted heme from holo-NEAT-C, it would not accept heme from holo-NEAT-A; heme transfer to IsdE appears to require the presence of holo-NEAT-C, in agreement with the proposal that IsdC serves as the central conduit of the heme transfer pathway. Our data show that heme transport from the wall-
anchored IsdH/IsdB proteins proceeds directly to IsdE at the membrane and, for this to occur, we propose that specific protein-protein interactions must take place.
Staphylococcus aureus is widely known as an important human pathogen that causes a range of infections and diseases from minor, such as impetigo and abscesses, to life-threatening, such as pneumonia, meningitis, endocarditis, and septicemia (1). The emergence of resistant bacteria has taken place over several decades and methicillin-resistant S. aureus (MRSA) and vancomycin-resistant S. aureus (VRSA) are particularly clinically challenging, often accompanied by limited treatment options (2). Furthermore, MRSA, initially limited to hospitals, has since spread to the community (CA-MRSA). Adding to the complexity is our incomplete understanding of mechanisms of drug resistance.
Iron is an essential nutrient for the majority of living organisms. Although the human body contains abundant iron (10-9 M), its low solubility leaves little directly available to bacteria. As such, bacteria have developed multiple iron acquisition systems to facilitate their survival in such low iron environments. The most abundant potential iron source for bacteria is heme, or iron-protoporphyrin IX, which is typically bound in proteins such as hemoglobin and myoglobin. Pathogenic bacteria have evolved specialized mechanisms for
http://www.jbc.org/cgi/doi/10.1074/jbc.M802171200The latest version is at JBC Papers in Press. Published on August 1, 2008 as Manuscript M802171200
Copyright 2008 by The American Society for Biochemistry and Molecular Biology, Inc.
by guest on March 13, 2019
http://ww
w.jbc.org/
Dow
nloaded from

Heme transfer between S. aureus Isd proteins
HemeTransfer-JBC-Rev3-2cols-08July23-3qo 2008-07-25
Page 2 of 13
acquiring heme from the host (for recent reviews, see 3,4-6). In recent years, there has been a significant amount of research into defining the Isd-mediated heme acquisition system, especially in S. aureus (7). Together, the series of Isd proteins in S. aureus are believed to interact with heme proteins, extract the heme molecule and transport it across the cell wall through to the membrane where it is then translocated into the cytoplasm. The Isd system in S. aureus consists of nine iron-regulated proteins: IsdA, IsdB, IsdC, and IsdH/HarA, which are cell-wall anchored surface proteins, and IsdDEF, which constitute a membrane-localized transporter and, finally, IsdG and IsdI, which encode heme-degrading enzymes in the cytoplasm (8). IsdA is highly expressed on the cell wall of iron-limited S. aureus and, in addition to several other reported functions (9-11), is effective at scavenging heme (12,13). Additional reported functions of Isd proteins include the binding by IsdB of hemoglobin (14), IsdH/HarA-dependent binding of haptoglobin and haptoglobin-haemoglobin (15), and heme binding by IsdC and IsdE (16-19). IsdE, a lipoprotein and a member of the bi-lobed, alpha-helical backbone family of substrate binding proteins, binds heme into a shallow groove between the two lobes of the protein, using His and Met to coordinate to the heme-iron (18). Conversely, proteins IsdA, IsdB, IsdC and IsdH/HarA each contain at least one so-called Near Transporter (NEAT) domain that adopt a beta sandwich structure to bind one heme into a groove with heme-iron coordination via Tyr (13,17).
A mechanism first proposed by Mazmanian et al. (20) suggests that, during infection, IsdB first binds hemoglobin, and in combination with IsdA, removes the heme component, which is then transferred further into the cell wall to IsdC, then subsequently through to the membrane localized binding protein and ABC transporter (IsdEF) and finally upon entry into the cytoplasm, IsdG and IsdI degrade heme releasing free iron which is then available as an iron source. As described above, substrate binding by individual components has been demonstrated, as has the heme degrading ability of IsdG and IsdI (8). In a recent study, transfer of heme from IsdA to IsdC was demonstrated as measured by absorption spectroscopy (21). In this report, we describe the use of detailed magnetic circular dichroism
(MCD) spectral data together with electrospray ionization mass spectrometry (ESI-MS) to unambiguously determine the products, or lack of products, when a heme-donor (i.e. heme-bound protein) and heme-accepter (i.e. apo-protein) are mixed. MCD spectroscopy has been shown in many reports, and by us in reports describing the heme binding environment of both the complete proteins IsdA, IsdB, IsdC, IsdE and as well the isolated NEAT domains of IsdA, IsdB (domain 2), IsdH (domain 3), and IsdC, to exhibit parameters sensitive to the heme binding axial ligands, oxidation state and spin state (12,16,19,22-27). Previous reports of the mass spectral data have shown that the heme-free native apo-protein can be readily distinguished from the heme-free denatured apo-protein and the native, heme-bound holo-proteins (12,24,25). Extending the power of these two tools, we now demonstrate, for the first time, direct evidence for an ordered, multi-protein, heme transfer system between Gram-positive bacterial surface Isd proteins. Key to these experiments using the ESI-MS technique is that not only do the measured data indicate possible changes in folding as a function of heme binding, but when mixtures are measured, the data show all components in their relative fractions – so that in heme exchange reactions, heme binding between the very similar NEAT-containing Isd proteins can be clearly identified, thus providing unambiguous information on the heme transfer.
EXPERIMENTAL PROCEDURES
Gene cloning. DNA encoding residues 62-184 of IsdA, residues 337-462 of IsdB, residues 28-150 of IsdC, residues 539-658 of IsdH/HarA and residues 32-292 of IsdE were PCR amplified from S. aureus RN6390 chromosome and cloned into pET28(+) in such a way as to incorporate N-terminal 6X-His tags. DNA encoded His-tagged protein was digested out of pET28a(+) and cloned into pBAD30 (28) before being introduced into E.coli RP523, a hemB mutant (29). Over the course of the study, two different cloning methods were used to generate each of His-tagged IsdB-NEAT-domain 2 and IsdH-NEAT-domain 3, resulting in a slight difference in amino acid composition in the His-tag region of recombinant protein (i.e. non-Isd protein sequence), even after thrombin cleavage. Sensitivity of MS illustrates
by guest on March 13, 2019
http://ww
w.jbc.org/
Dow
nloaded from

Heme transfer between S. aureus Isd proteins
HemeTransfer-JBC-Rev3-2cols-08July23-3qo 2008-07-25
Page 3 of 13
these differences in mass. Construct 1 of each of the two proteins was used in Figs. 1 and 5, and construct 2 was used in Figs. 8 and 9. There was no change in heme binding properties between the two constructs.
Protein expression and purification. E.coli RP523 cells harboring recombinant plasmids were grown at 30oC in Luria-Bertani broth (LB; Difco) containing ampicillin (100μg/ml) and L-arabinose (0.2%). After overnight incubation, cells were harvested and resuspended in binding buffer (20mM sodium phosphate, pH 7.4, 500mM NaCl, 10 mM imidazole). Cells were then ruptured in a French pressure cell and cell lysates were subjected to ultracentrifugation at 150,000 × g for 1 hr to remove insoluble material. Proteins were purified using a 1 ml HisTrap column (GE Healthcare) and an ÄKTA FPLC system with an elution buffer containing 20mM sodium phosphate, pH 7.4, 500mM NaCl, 500mM imidazole. Proteins were then desalted using a 5ml HiTrap Desalting Column (GE Healthcare). Thrombin was used to remove The 6xHis-tags were removed by incubation with thrombin (10U/mg protein; GE Healthcare) at room temperature for 16 hours and run through HisTrap column for final purification.
Hemin (Sigma) was dissolved in DMSO for estimation of solution concentrations. Hemin concentrations in DMSO were calculated using the extinction coefficients 10.74 mM-1 cm-1 at 501 nm and 6.23 mM-1 cm-1 at 624 nm. These values were determined using the pyridine hemochrome test as a reference, using ε526 = 16.99 mM-1 cm-1 and ε526
= 16.99 mM-1 cm-1 for pyridine hemochrome (30). Protein concentrations were estimated using the extinction coefficients at 280 nm of 15.48 mM-
1cm-1 for myoglobin, 15.93 mM-1cm-1 for NEAT-A and NEAT-B2, 18.49 mM-1 cm-1 for NEAT-C, and 14.65 mM-1 cm-1 for NEAT-H3. Due to the lack of tryptophan residues in IsdE, mass spectrometry was used to estimate protein concentrations using a NEAT domain sample as reference point. Protein samples in 1x PBS buffer were incubated with 1.5x molar excess hemin dissolved in DMSO. Samples were then concentrated to approximately 100 μM and purified using G-25 size exclusion chromatography. Mass spectra of collected samples were run to ensure that free heme was effectively removed.
Magnetic circular dichroism measurements. Protein solutions were prepared in a 1xPBS buffer at pH 7.4. Measurements at room temperature were made in 1 cm cuvettes at 5.5 T in an Oxford Instruments SM2 superconducting magnet, aligned in a Jasco J810 CD instrument. Peak absorbance was always below 0.8 near 400 nm. Absorption measurements were made using a Cary 500 (Varian, Canada). All solutions were measured in the Cary 500 before and after being measured in the MCD spectrometer. No changes were observed.
ESI-MS measurements. A Micromass LC-T instrument was used with sample infusion through a microlitre pump. The mass spectrometer settings were: capillary +3,300V, sample cone: 75-100 V;, desolvation temperature: 20 0C, source temperature: 80 0C. Samples were infused at rates of approximately 10 µL/minute. Averaging was carried out for several minutes. Max Ent 1 (Micromass) software was used to calculate the deconvoluted parent spectrum.
ESI-MS sample preparation. Stock protein solutions in PBS were concentrated using centrifuge concentration tubes (Millipore) to approximately 100 μM. Buffer exchange to 20 mM ammonium formate (pH 7.3) was performed using G-25 size exclusion chromatography.
Heme transfer reactions. To monitor heme transfer between the two NEAT domains (NEAT-A and NEAT-C) and IsdE, the protein samples were mixed with an approximate 1.5x excess of the appropriate heme acceptor protein. The mixing times were varied from 10 m to 2 h. In all cases the spectra remained the same.
RESULTS
ESI-MS as a method to discriminate apo from holo Isd proteins – The heme binding NEAT domains from IsdA (NEAT-A), IsdB (NEAT-B2), IsdC (NEAT-C) and HarA or IsdH (NEAT-H3), as well as IsdE, were overexpressed in apo-form and purified. Holo-proteins were prepared by reconstitution of apo-proteins with hemin. The proteins were analyzed by mass spectrometry to confirm that each was heme-free (apo) or homogeneously heme bound (holo), and to establish the number of heme molecules bound to each protein. The mass spectral data are shown as
by guest on March 13, 2019
http://ww
w.jbc.org/
Dow
nloaded from

Heme transfer between S. aureus Isd proteins
HemeTransfer-JBC-Rev3-2cols-08July23-3qo 2008-07-25
Page 4 of 13
the charge states in Figure 1 with the deconvoluted spectra in Figure 2. Charge states in ESI-MS provide an indication of the volume of the protein or solvent access to the protein’s basic amino acid residues (25) and, in Figure 1, the lack of changes in charge state distribution between the apo- and holo-species for NEAT-B2, and NEAT-C, in addition to that previously published for IsdE (25), indicates that no significant structural changes take place with heme binding. The ESI-MS data in Figure 1B, c.f. 1A, indicate that there is a very slight change in conformation of NEAT-A upon heme binding because the charge state maximum increases to +8 from +7, suggesting solvent exposure of one additional basic residue when the heme binds. Similarly, we note the change in the relative magnitude of the +9 and +8 charge states in 1(G) cf. 1(H) for apo and holo-NEAT-H3, respectively; again, the implication is that there are conformational changes upon binding the heme in holo-NEAT-H3, that, in this case, cause a reduction of solvent exposure. Compared with changes that take place following acid-induced denaturation of, for example, IsdE (25), the change in conformation of NEAT-A and NEAT-H3 with heme binding are small, but real, and for NEAT-A in agreement with the published crystal structures of the holo versus apo forms of the protein (13).
Following heme loading, mass spectrometry was used again to confirm that the holo-proteins were formed (Figure 2 (A) – (J)). The mass spectral data provide important evidence that the holo-proteins were the only source of heme in the transfer reactions due to the lack of a mass near 616 Daltons (data not shown). This is an important test, as we have observed that absorption spectroscopy is not a reliable technique to ensure the complete uptake and hence removal of free heme from a solution. The Soret band of free heme can appear as a blue-shifted shoulder on the Soret band of bound-heme and may be confused with its vibronic band, yielding complications in assessing heme transfer reactions spectroscopically. Moreover, because each of the heme-binding Isd NEAT domains possess heme-binding characteristics that result in similar optical properties, quantifying heme transfer proves very difficult; Table 1 summarizes the UV-visible absorption band maxima for each of the heme binding NEAT domains and IsdE. Given that the
absorption spectroscopic properties of the hemes bound in IsdA, IsdB NEAT domain 2, IsdC, and IsdH NEAT domain 3 are all very similar, monitoring NEAT domain heme transfer reactions via absorption spectroscopy is, therefore, ambiguous and likely to be imprecise as the spectral envelopes of the reactants and products significantly overlap.
Magnetic circular dichroism spectra do, however, exhibit additional assignment criteria that provide far more information from heme-containing proteins and we have demonstrated this sensitivity with both the full-length proteins and the isolated NEAT-domains (12,24,25). When the data from MCD measurements are combined with mass spectrometric data, heme transfer reactions can be studied in detail and all protein species present can be identified together with their relative concentrations.
The key focus of this study was determining the ability of heme to transfer among Isd proteins in order to directly address the hypothesis that they function in concert as a heme shuttle system in the Gram-positive bacterial cell wall. A key test is whether the transfer reactions are quite general and independent of the donor or, on the other hand, highly specific to the heme-donor as would be the case if specific protein-protein interactions were involved. Since each NEAT domain contains a distinct amino acid composition and, therefore, a distinct mass (making mass spectral peak assignment straightforward; demonstrated in Figure 2), heme transfer reactions could therefore readily be followed using the MS technique. However, it was important to verify any MS results with other techniques that have been previously used to study heme proteins, including absorption spectroscopy and magnetic circular dichroism spectroscopy.
Magnetic circular dichroism spectral data indicates that heme transfer takes place from NEAT-A, through NEAT-C to IsdE - While the optical spectral properties of the heme-bound-NEAT domains are very similar due to the similarity in axial ligation of the heme-iron, IsdE contains a novel heme binding domain, which is quite distinct from the NEAT domains and, as a result, exhibits a very different absorption and MCD spectrum (see Table 1). Indeed, IsdE
by guest on March 13, 2019
http://ww
w.jbc.org/
Dow
nloaded from

Heme transfer between S. aureus Isd proteins
HemeTransfer-JBC-Rev3-2cols-08July23-3qo 2008-07-25
Page 5 of 13
coordinates a single heme using both a histidine and a methionine residue, whereas the NEAT domains bind a single heme using a proximal tyrosine for heme-iron coordination (12,13,17,18,25). The Soret absorption band is red-shifted to 415 nm for IsdE, significantly separated from the ~404 nm Soret band of the NEAT domains. Heme transfer reactions could, therefore, be monitored using UV-visible absorption spectroscopy when NEAT-IsdE transfer reactions are being monitored.
Despite the close similarity in absorption spectral properties between NEAT-A and NEAT-C, the MCD spectral properties are slightly different because the heme iron in NEAT-C is slightly lower spin than in NEAT-A so the Soret region MCD bands distinctly change. Figure 3A shows the sequence of spectra recorded for holo-NEAT-A in the presence of increasing concentrations of apo-NEAT-C. Clearly, there is a change in the spectra but based on these data alone, it was ambiguous as to whether heme transfer took place. However, unambiguous data showing heme transfer in this reaction was obtained from the ESI-MS data shown below, confirming that the heme in NEAT-A transferred stoichiometrically to apo-NEAT-C. In other words, while the absorption data recorded for this transfer are very poor discriminators, and even the MCD data provide imprecise data, the ESI-MS data provide definitive data to support the conclusion that heme transfer took place.
Figure 3B shows that the effect of adding apo-IsdE to holo-NEAT-A is essentially negligible in the absorption spectrum but is actually quite significant in the MCD spectrum. The MCD data clearly show that the heme does not transfer from NEAT-A to IsdE. However, an interesting finding was that the MCD data show that spectral changes do take place at the heme site in holo-NEAT-A (despite the fact that heme is not removed), which can be associated with a decrease in the high spin g factor of the ferric ground state, a situation encountered when a weak field ligand is replaced by a slightly stronger field ligand. The ESI-MS data described below confirm that no heme transfer took place between NEAT-A and IsdE but, unlike the data obtained from MCD, do not discriminate the fact that an interaction between the two proteins does occur.
Figure 4 is the key experiment in this study because the MCD spectra shown follow the spectral changes arising from heme transfer as increasing concentrations of apo-IsdE are added to a solution of holo-NEAT-A and apo-NEAT-C (the same solution as that used to generate the spectral data shown in Figure 3A – in fact, as shown conclusively above, that solution rapidly shifts to apo-NEAT-A and holo-NEAT-C). Since the spectral properties of the heme in holo-IsdE are completely different than when the heme is bound in either holo-NEAT-A or holo-NEAT-C, there are dramatic and systematic changes that are observed in both the absorption and MCD spectra. These data emphasize that transfers between NEAT-domains are difficult to quantify by optical measurements alone, but that heme transfer to IsdE is readily measurable, and the MCD spectra provide clear assignment criteria with respect to the exact heme-containing protein at the end of the reaction.
In the following sections, we report the use of the ESI-MS technique to unambiguously demonstrate that specific heme transfer reactions occur between the NEAT domains of IsdH (domain 3), IsdB (domain 2), IsdA, and IsdC and the IsdE protein. Apo-NEAT-C efficiently removes heme from holo-NEAT-A, holo-NEAT-B2, and holo-NEAT-H3 – In Figure 5, we show using mass spectral data that
Table 1. Absorption spectra properties for the heme-bound NEAT domains of IsdA, IsdB-domain2, IsdC and IsdH-domain 3, and IsdE
Protein Soret λmax (nm)
Visible region λmax (nm)
Reference
NEAT-A 406 502, 535, 628 (24)
NEAT-B2 404 505, 533, 627 This work
NEAT-C 403 502, 533, 627 (24)
NEAT-H3 403 502, 533, 629 This work
IsdE 415 530, 558, 650 (25)
by guest on March 13, 2019
http://ww
w.jbc.org/
Dow
nloaded from

Heme transfer between S. aureus Isd proteins
HemeTransfer-JBC-Rev3-2cols-08July23-3qo 2008-07-25
Page 6 of 13
heme is transferred directly, rapidly and completely from each of holo-NEAT-A (A), holo-NEAT-B2 (B), and holo-NEAT-H3 (C) to apo-NEAT-C. The heme donor proteins were mixed with an approximately 1.5x excess of the heme acceptor protein. Three major peaks are seen in each of the deconvoluted spectra (lower panels in A, B and C in Figure 5), which are associated with (i) the heme free form of the donor, (ii) the heme-free form of the acceptor and (iii) the heme-bound form of the acceptor. No remaining heme-bound form of the donor is observed (see Figure 2 for the masses of the holo species). We should point out that the relative magnitudes of the %-abundances cannot be used to determine relative concentrations between different proteins because the uptake by the mass spectrometer is different for each protein. However, the relative concentrations of the heme-bound and heme-free species of the same protein can be related. In these data even though the apo-and holo- masses might be close, there is no direct overlap and within the precision of the experiment only three-separate species can be identified.
If the reverse reaction occurred in the presence of holo-acceptor protein, then four species would be observed since none of the possible protein species would be completely removed from solution. This was observed for only one experiment: namely for the heme transfer between NEAT-B2 and NEAT-H3, described below.
Our conclusions from these data are that, unlike the ambiguous data obtained from absorption and MCD spectra, the ESI-MS data unambiguously show that heme was transferred to apo-NEAT-C in every case. We next tested the heme-transfer hypothesis and the MCD data described above, by adding IsdE to these solutions.
ESI-MS data show that apo-IsdE efficiently removes heme from holo-NEAT-C, -B2 and H3 –Figure 6 consolidates two experiments; in part (A), we show the mass spectral data recorded following mixing of holo-NEAT-C and apo-IsdE and, in part (B), we show the separate absorption spectra for the two heme-bound proteins, holo-NEAT-C and holo-IsdE after heme-transfer from the holo-NEAT-C. First, the mass spectral data (Figure
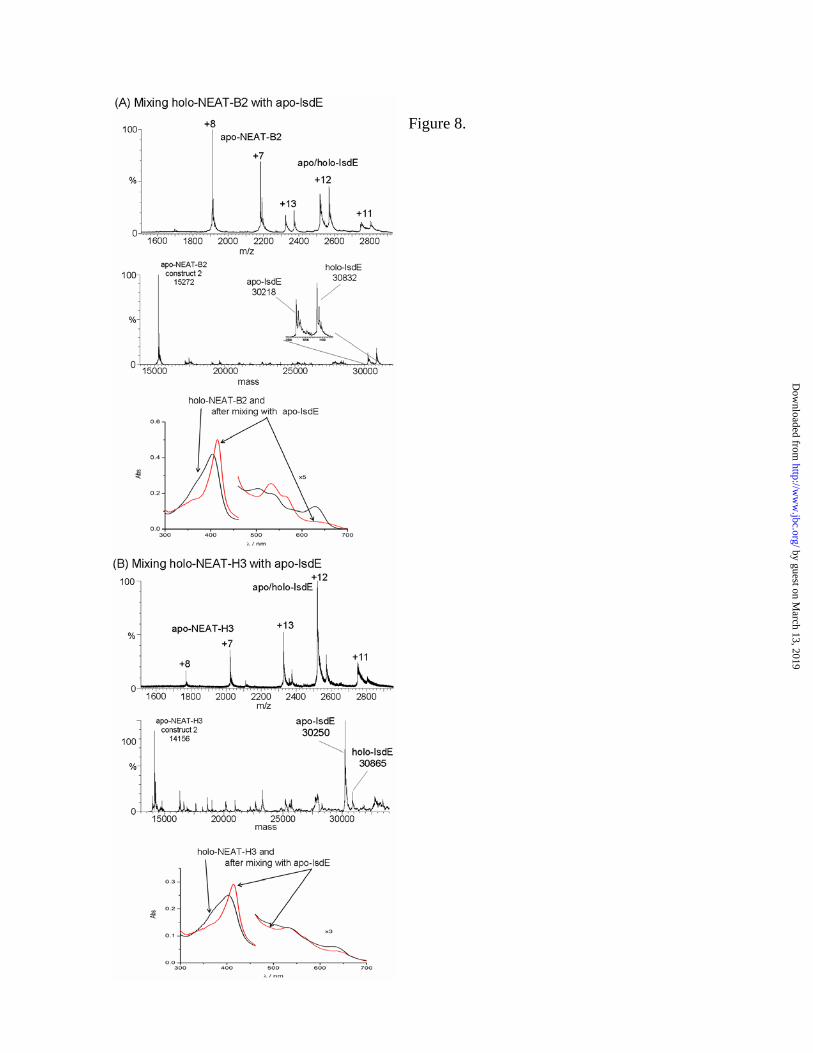
6A) shows that NEAT-C-bound-heme was transferred entirely to apo-IsdE. Only apo-NEAT-C at 14,443 Da, apo-IsdE at 30,258 Da and holo-IsdE, 615 Da heavier at 30,873 Da, are identified. The 616 Da mass is quite small with respect to the apo-heme-free mass of IsdE, so the charge states overlap and we observe a duplication from +11 to +13. There is only one set of charge states for the NEAT-C as there is no holo-NEAT-C remaining. The +6 charge state overlaps with the +13 of IsdE. Inspection of the charge states illustrate how heme binding does not change the overall conformation of either IsdE or NEAT-C significantly (Figure 6A c.f. Figure 1), since the +12 state for IsdE and +8 for NEAT-C remain predominant following heme-binding. The absorption spectra in Figure 6B show how the Soret band for holo-NEAT-C red-shifts when apo-IsdE is added. For this combination, the absorption spectra are different because the maximum of IsdE lies ca. 12 nm to the red near 415 nm, Table 1. Apo-IsdE does not accept heme from holo-NEAT-A – The ESI-MS data in Figure 7A show that there is no heme transfer when apo-IsdE is mixed with holo-NEAT-A. This is the only scenario (other than with holo-myoglobin, data not shown), where we observed no transfer to the heme-free Isd acceptor protein at all (we note slight changes in deconvoluted masses arise from both uncertainty in the experimental masses of the charge states and from the presence of adducts, however, there is no ambiguity in the identity of the protein species, and especially, the heme-free nature of the apo-IsdE). This lack of transfer is emphasized in the absorption spectra (Figure 7B) where the spectrum of holo-NEAT-A mixed with apo-IsdE is exactly the same as holo-NEAT-A – quite unlike the case in all the other spectra shown previously. However, recall that the MCD spectra in Figure 4 suggest that there is interaction between these two proteins, but without transfer of the heme. Apo-IsdE accepts heme from holo-NEAT-B2 and holo-NEAT-H3 – The ESI-MS data in Figure 8 show unambiguously that heme, whether it be in NEAT-B2 (panel A) or NEAT-H3 (panel B), was transferred rapidly and completely to apo-IsdE. The absorption spectra in Figures 8A and 8B again illustrate that when IsdE is the heme acceptor there
by guest on March 13, 2019
http://ww
w.jbc.org/
Dow
nloaded from

Heme transfer between S. aureus Isd proteins
HemeTransfer-JBC-Rev3-2cols-08July23-3qo 2008-07-25
Page 7 of 13
are significant differences in the absorption spectra. The spectra measured following mixing of holo-NEAT-B2 and apo-IsdE and of holo-NEAT-H3 and apo-IsdE are virtually identical, representing solely holo-IsdE. Apo-NEAT-A accepts heme from holo-NEAT-B2 and holo-NEAT-H3 – The ESI-MS data in Figures 9A and 9B show that the heme in holo-NEAT-B2 and holo-NEAT-H3 transfers to apo-NEAT-A. The transfer from holo-NEAT-H3 to apo-NEAT-B2 is inefficient since the data in Figure 9C show the presence of all four species.
DISCUSSION The Isd series of proteins are proposed to
represent a complete heme acquisition and transport system, together functioning to remove heme from proteins such as hemoglobin, then to shuttle heme across the Gram-positive bacterial cell wall right through to membrane ABC transporters, which translocate the heme molecule into the cytoplasm where it is eventually degraded by proteins IsdG and IsdI. While significant evidence now exists demonstrating substrate binding for the various proteins (8,12-14,16-18,20,21,24,25,31), the first direct evidence for heme transfer between Isd proteins was only very recently obtained for the IsdA to IsdC transfer reaction (21). In the present study, a complete picture of heme transfer between all of the heme binding Isd proteins that reside on the outside of the bacterial cell has been obtained for the first time.
All heme-binding Isd NEAT domains possess overlapping heme-binding properties. Each has been shown to coordinate a single, 5-coordinate, high-spin ferric heme through a conserved tyrosine residue (12,13,17,24) and, as such, the absorption spectroscopic properties of the hemes bound in IsdA, IsdB, IsdC, and IsdH are all very similar. The spectroscopic and structural data reported to date do not provide information on the process or mechanism that would be required if the Isd proteins are to capture and transfer heme molecules. Although the heme binding properties of the NEAT domains appear very similar, the data presented here show that the NEAT domains do, in fact, possess distinct qualities. The majority of heme transfer reactions occurred rapidly and in
a unidirectional fashion (except for the transfer between NEAT-B2 and NEAT-H3) and, in the case of IsdA, very selectively. Via apo-NEAT-C towards heme-free-IsdE
It is important to note that none of the Isd proteins used in this study were capable of extracting heme from holo-myoglobin (data not shown). The oxidation state of the heme in myoglobin did not alter the results, as both ferric and ferrous hemes could not be removed (data not shown). Together, the results suggest that specific protein-protein interactions must occur to promote the removal of heme from Isd proteins since concentrations of free heme were extremely low and if protein:protein reactions were not to occur, would result in very slow transfer rates. Experimentally, this is not what was observed. Also, in the absence of protein-protein interactions we would expect to observe in both optical data (especially the MCD spectra) and ESI-mass spectra mixtures indicating the presence of equilibria. We see no evidence for significant concentrations of both donor and acceptor. It is likely, then, that one or more of the remaining, non-heme binding NEAT domains, that is, NEAT-B1 and/or NEAT-H1 or NEAT-H2 play crucial roles in extracting heme from myoglobin or hemoglobin. In support of this, it is noteworthy that NEAT-B1 binds hemoglobin (14) whereas NEAT-H1 binds hemoglobin-haptoglobin (31). In the proposed Isd-mediated heme transport system, the surface exposed Isd proteins interact with heme containing proteins such as hemoglobin (IsdB) or hemoglobin-haptoglobin (IsdH), which are found in serum following erythrocyte lysis. Extraction of the heme then occurs, followed by heme transfer to other Isd proteins present in spatially arranged locations within the cell wall architecture.
Analysis of the optical data illustrates the difficulties in obtaining precise information for transfer between the NEAT domains. Even though the MCD spectra provide far more information, there is only a small change following transfer from holo-NEAT-A to apo-NEAT-C. The situation is far better when the transfer takes place to IsdE. The transfer to IsdE was further confirmed by absorption spectroscopy since a gradual shift of the Soret band from 404 to 415 nm was observed. On the other hand, the
by guest on March 13, 2019
http://ww
w.jbc.org/
Dow
nloaded from

Heme transfer between S. aureus Isd proteins
HemeTransfer-JBC-Rev3-2cols-08July23-3qo 2008-07-25
Page 8 of 13
mass spectrometric data show that holo-NEAT-H3 transferred heme to all other NEAT domains as well as to IsdE. Holo-NEAT-B2 showed similar behavior, even supplying heme to apo-NEAT-H3 with heme. This was the only example of bidirectional heme transfer that was observed in this study and suggests that IsdB and IsdH are functionally closely related, in agreement with predictions based on bioinformatic analyses.
A key result of this study is that the IsdA NEAT domain (NEAT-A) behaved quite differently than either NEAT-B2 or NEAT-H3. NEAT-A accepted heme from NEAT-B2 and NEAT-H3 in a unidirectional fashion, and only transferred heme to NEAT-C not to apo-IsdE. All three techniques, mass spectrometry, MCD and absorption spectroscopy, confirmed that IsdE was unable to accept heme from NEAT-A. Figures 3B and 7 show the MCD and absorption spectra of holo-NEAT-A before and following the addition of excess apo-IsdE. No shift in the Soret band or any change in the visible region was observed. Mass spectrometry showed that even following 24 hr of incubation of holo-NEAT-A with apo-IsdE, no sign of heme transfer was observed (data not shown). IsdC has been proposed to function as the central conduit in the cell wall for heme passage to the bacterial cell membrane. The ability of NEAT-C to accept heme from NEAT-A, NEAT-B2, and NEAT-H3 (Figure 5) and to only transfer it to apo-IsdE (Figures 4 and 6) offers strong support for this proposal; no increase in holo-IsdE was observed after incubation with holo-NEAT-A whereas a significant increase in holo-IsdE was obtained following incubation of apo-IsdE with holo-NEAT-C (Figure 7 c.f. Figure 6).
In conclusion, the data presented here support a model for heme transport as illustrated in Figure 10, in strong agreement with the proposal first offered by Mazmanian et al. (20). Of importance in these challenge experiments, is that the flow of heme is from the distally-located IsdH (HarA) and IsdB through to the membrane-proximal IsdE protein. Key to the mechanistic analyses is that heme does not transfer from holo-Isd NEAT-A directly to apo-IsdE; apo-NEAT-C is the required facilitator. This fact, taken together with the demonstrated unidirectionality of the transfer reactions, suggests that specific protein-protein interactions must be a necessary part of the
mechanism required to drive the heme transfer towards the membrane.
During the review process of this manuscript, a study relevant to this work became available on JBC Papers in Press (32).
by guest on March 13, 2019
http://ww
w.jbc.org/
Dow
nloaded from

Heme transfer between S. aureus Isd proteins
HemeTransfer-JBC-Rev3-2cols-08July23-3qo 2008-07-25
Page 9 of 13
FOOTNOTES This work was supported by a Canadian Institutes of Health Research operating grant (to DEH),
operating and equipment grants from the Natural Sciences and Engineering Research Council (NSERC) of Canada (to MJS), the NSERC Postgraduate Scholarship program (to MP) and the Ontario Graduate Scholarship program (to MTT).
ABBREVIATIONS used are: isd (iron-regulated surface determinant), Circular dichroism (CD);
Magnetic CD (MCD); electrospray ionization mass spectrometry (ESI-MS); NEAr iron Transporter (NEAT); recombinant IsdA (rIsdA).
FIGURE LEGENDS Figure 1. ESI-MS charge state spectra for four Isd NEAT domains and IsdE studied as the heme-
free, apo-NEAT-A, -NEAT-C, -NEAT-B2, -NEAT-H3 and -IsdE species (A, C, E, G, I) and the heme-bound, holo-NEAT-A, -NEAT-C, -NEAT-B2, -NEAT-H3 and -IsdE species (B, D, F, H, J). The charge states provide information about the change in conformation associated with heme binding. The close similarities in charge state distribution between the apo-and holo- pairs of data show that the proteins do not significantly change in folding following heme binding. Each charge state arises from the same protein mass, as shown in Figure 2. The peak marked with * between +6 and +5 in (G) arises from an unknown identified species that is not seen in the holo-NEAT-H3 (H); the lack of corresponding mass in the deconvoluted spectra in Figure 2 (G) suggests a low molecular mass species.
Figure 2. Deconvoluted ESI-mass spectra of the heme-free Isd apo-NEAT-A, -NEAT-C, -NEAT-
B2, -NEAT-H3 and -IsdE species (A, C, E, G, I) and Isd heme-bound-NEAT-A, -NEAT-C, -NEAT-B2, -NEAT-H3 and -IsdE species (B, D, F, H, J). The data show that only one heme binds to each of these species. The mass difference between the pairs of data for the apo- and holo-species is approximately 616 Da, the mass of a single heme.
Figure 3. Absorption and magnetic circular dichroism (MCD) spectra recorded for heme transfer
from Isd holo-NEAT-A to Isd apo-NEAT-C and for a mixed solution of Isd holo-NEAT-A and apo-IsdE. (A) Changes in the spectra when apo-NEAT-C is added to holo-NEAT-A in steps of 0.3 mol eq. Lines shown for additions to: 0, 0.3, 0.6, 0.9 and 1.2 mol eq. apo-IsdE. The spectra have been corrected for dilution effects. In the absorption spectrum the only significant change is the increase in absorbance at 390 nm and the slight blue shift from 405 to 402 nm; as marked by arrows. There is more change in the MCD spectrum because the MCD spectrum of the holo-NEAT-C product is slightly blue-shifted when compared with the holo-NEAT-A reactant, and also exhibits a more prominent negative signal at 390 nm, a more positive signal at 408, and a less negative signal at 424 nm than holo-NEAT-C resulting in a significant change in the intensities of the bands at these wavelengths as the reaction proceeds. (B) Absorption and magnetic circular dichroism (MCD) spectra recorded when heme-free, apo-IsdE was added to a solution of heme-containing, Isd holo-NEAT-A. Three sets of spectra are shown: with a total of 0, 0.6 and 1.2 mol. eq. IsdE added. While there is little change in the absorption spectrum, addition of apo-IsdE results in intensification of the Soret MCD band envelope centered on 416 nm, a sign of increased low spin contribution in the ferric heme. There is no indication of the distinctly different absorption and MCD spectra of heme-containing, holo-IsdE. The changes are a result of interactions between the two proteins. Mass spectral data in Figure 7 also clearly show that no heme transfer took place and that the solution after mixing contains only holo-NEAT-A and apo-IsdE.
Figure 4. Changes in the absorption and magnetic circular dichroism spectra when heme-free, apo-
IsdE is added to a solution of heme-containing, Isd holo-NEAT-A and apo-NEAT-C (the solution used in
by guest on March 13, 2019
http://ww
w.jbc.org/
Dow
nloaded from

Heme transfer between S. aureus Isd proteins
HemeTransfer-JBC-Rev3-2cols-08July23-3qo 2008-07-25
Page 10 of 13
Figure 3(A)). Isosbestic change in spectral properties indicates the formation of heme-containing, holo-IsdE that was transferred from the holo-NEAT-A, to the apo-NEAT-C, then to the apo-IsdE. Spectra are shown for solutions with a total of: 0, 0.3, 0.6, 0.9, 1.2 and 2.1 mol eq apo-IsdE added. The lines show the direction of the spectral changes. The final absorption and MCD spectra closely resemble those of heme-loaded-IsdE (holo-IsdE).
Figure 5. Mass spectral data for solution of mixed proteins showing heme transfer from the Isd
holo-NEAT domains (A, B2, and H3) to apo-NEAT-C. (A) Charge state and deconvoluted mass spectra measured for a mixture of heme-containing, Isd holo-NEAT-A and apo-NEAT-C. Excess heme-free, apo-NEAT-C was added. Three species coexist in solution and are identified in the charge state spectra with the abbreviations for apo-NEAT-C (a-C; with a mass of 14,442), apo-NEAT-A (a-A; with a mass of 14,626) and holo-NEAT-C (h-C; with a mass of 15,059). (B) Charge state and deconvoluted mass spectra measured for a mixture of heme-containing, Isd holo-NEAT-B2 and apo-NEAT-C. Excess heme-free, apo-NEAT-C was added. Three species coexist in solution and are identified in the charge state spectra with the abbreviations for apo-NEAT-B2 (a-B2; with a mass of 14,345), apo-NEAT-C (a-C; with a mass of 14,444), and holo-NEAT-C (h-C; with a mass of 15,060). (C) Charge state and deconvoluted mass spectra measured for a mixture of heme-containing, Isd holo-NEAT-H3 and apo-NEAT-C. Excess heme-free, apo-NEAT-C was added. Three species coexist in solution and are identified in the charge state spectra with the abbreviations for apo-NEAT-H3 (a-H3; with a mass of 14,640), apo-NEAT-C (a-C; with a mass of 14,444), and holo-NEAT-C (h-C; with a mass of 15,060). In each case heme transfer to Isd NEAT-C was observed, resulting in a mixture of the heme-free-Isd-NEAT domain of NEAT-A, NEAT-B2, NEAT-H3) and heme-free apo-NEAT-C and heme-bound-holo-NEAT-C. No heme-bound-holo-NEAT-A (at 15,245 Da), NEAT-B2 (at 14,960 Da) or NEAT–H3 (at 15,256 Da) was observed in their respective mass spectra following mixing with apo-NEAT-C. The difference in relative %-abundances of the proteins depends on the relative efficiencies of the charged proteins reaching the detector in competition with the other ions. Closely similar ratios of protein were used in each of the spectral data shown here. In each case, excess (approximately 1.5x) of the heme-acceptor protein was used, so that there was also apo-heme-free protein remaining.
Figure 6. Heme transfer from holo-NEAT-C to apo-IsdE. (A) Charge state and deconvoluted mass
spectra of the solution made by mixing holo-NEAT-C and apo-IsdE. Excess apo-IsdE was added. (B) Absorption spectra of holo-NEAT-C before (indicated by arrows) and following the addition of apo-IsdE. The significant change in the Soret band maxima following heme transfer to the apo-IsdE (indicated by arrows from the legend’holo-IsdE + apo-NEAT-C’) means that for this heme transfer experiment, absorption spectra can be used to monitor the progress of the reaction. The absorption spectrum of holo-IsdE is quite different from that of either apo-NEAT-C or holo-NEAT-C.
Figure 7. Demonstration that no heme transfer takes place from holo-NEAT-A to apo-IsdE. (A)
ESI-MS spectra (charge states and deconvolution) for a mixture of holo-NEAT-A and apo-IsdE showing the presence of only holo-NEAT-A and apo-IsdE; there is no indication of the presence of either apo-NEAT-A or holo-IsdE showing that no heme transfer took place. (B) The absorption spectra recorded before and after addition of the apo-IsdE are characteristic of holo-NEAT-A for both solutions. There is no indication of formation of holo-IsdE, which has a significantly different absorption spectrum.
Figure 8. Heme transfer from holo-NEAT-B2 and holo-NEAT-H3 to apo-IsdE. Charge state and
deconvoluted mass spectra and absorption spectra measured for mixtures of (A) holo-NEAT-B2 with apo-IsdE as a heme acceptor and (B) holo-NEAT-H3 with apo-IsdE as a heme acceptor. In (A) the data show that holo-NEAT-B2 transfers heme to apo-IsdE. In each mass spectrum are peaks that correspond to both the holo-and apo-proteins: peaks that correspond to apo-IsdE (+11 to +13) at 30,218 Da, peaks that correspond to holo-IsdE (+11 to +13) at 30,832 Da and peaks that correspond to apo-NEAT-B2 (+7 to +8) at 15,272 Da. The absorption spectra represent the holo-NEAT-B2 before the addition of IsdE
by guest on March 13, 2019
http://ww
w.jbc.org/
Dow
nloaded from

Heme transfer between S. aureus Isd proteins
HemeTransfer-JBC-Rev3-2cols-08July23-3qo 2008-07-25
Page 11 of 13
(indicated by the arrow from the legend ‘holo-NEAT-B2’) and following mixing with IsdE for 25 min (indicated by the arrows from the legend ‘after mixing with apo-IsdE’). The holo-NEAT-B2 was formed by binding heme to heme-free, apo-NEAT-B2 (construct 2), which was made using a different cloning strategy than that used to make NEAT-B2 which was used for the data in Figures 1, 2 and 5. Residues in the His-tag region (non-Isd) differ between the two constructs (see Experimental Procedures). The experimental results were unchanged by the use of the second construct. In (B) the data show that holo-NEAT-H3 transfers heme to apo-IsdE. In each mass spectrum are peaks that correspond to both the holo-and apo-proteins: peaks that correspond to apo-IsdE (+11 to +13) at 30,250 Da, peaks that correspond to holo-IsdE (+11 to +13) at 30,865 Da and peaks that correspond to apo-NEAT-H3 (+7 to +8) at 14,156 Da. The absorption spectra of the holo-NEAT-H3 before the addition of IsdE (indicated by arrows from the legend ‘holo-NEAT-H3’) and following mixing with apo-IsdE for 25 min (indicated by arrows from the legend ‘after mixing with apo-IsdE’). The final spectrum corresponds to that of heme-containing, holo-IsdE. The apo-NEAT-H3 (construct 2) was made using a different cloning procedure than that used for the NEAT-H3 which was used to generate the data shown in Figures 1, 2 and 5. Residues in the His-tag region (non-Isd) were altered between the two constructs (see Experimental Procedures). The experimental results were unchanged by the use of the second construct.
Figure 9. Heme transfer from holo-NEAT-B2 to apo-NEAT-A, and holo-NEAT-H3 to apo-NEAT-
A and NEAT–B2. Charge state and deconvoluted mass spectra, and absorption spectra measured for mixtures of (A) holo-NEAT-B2 with apo-NEAT-A as a heme acceptor, (B) holo-NEAT-H3 with apo-NEAT-A as a heme acceptor, and (C) holo-NEAT-H3 with apo-NEAT-B2 as heme acceptor. In (A) the data show that holo-NEAT-B2 transfers heme to apo-NEAT-A. In each mass spectrum are peaks that correspond to both the holo-and apo-proteins: peaks in the mass spectra that correspond to apo-NEAT-A (a-A: +7 and +8) at 14,630 Da, peaks that correspond to holo-NEAT-A (h-A: +7 and +8) at 15,245 Da and peaks that correspond to apo-NEAT-B2 (a-B2: +7 to +8) at 14,347 Da. In (B) the data show that holo-NEAT-B2 transfers heme to apo-NEAT-A. In each mass spectrum are peaks that correspond to both the holo-and apo-proteins: peaks that correspond to apo-NEAT-A (a-A: +7 and +8) at 14,630 Da, peaks that correspond to holo-NEAT-A (h-A: +7 and +8) at 15,245 Da and peaks that correspond to apo-NEAT-H3 (a-H3: +7 to +8) at 14,640 Da. In (C) the data show that holo-NEAT-H3 transfers heme to apo-NEAT-B2. In each mass spectrum are peaks that correspond to both the holo-and apo-proteins: peaks that correspond to apo-NEAT-B2 (a-B2: +7 and +8) at 14,346 Da, peaks that correspond to holo-NEAT-B2 (h-B2: +7 and +8) at 14,962 Da, and peaks that correspond to holo-NEAT-H3 (h-H3: +7) at 15,256 Da, and to apo-NEAT-H3 (a-H3: +7 to +8) at 14,640 Da.
Figure 10. A heme transport model based on analysis of the magnetic circular dichroism and mass
spectral data obtained from this study. Overall, heme transfer is from membrane distal IsdH/HarA (studied using NEAT domain H3) and IsdB (studied using the NEAT domain B2) proteins through to the membrane-proximal IsdE. There is unidirectional heme transfer from NEAT-A to NEAT-C to IsdE. There is no transfer from NEAT-A to IsdE. The mass spectral data to support the model are in agreement with the model first proposed by Schneewind and colleagues (20). The absorption and MCD data of the equilibrated solutions fully support the conclusions reached from analysis of the mass spectral data.
by guest on March 13, 2019
http://ww
w.jbc.org/
Dow
nloaded from

Heme transfer between S. aureus Isd proteins
HemeTransfer-JBC-Rev3-2cols-08July23-3qo 2008-07-25
Page 12 of 13
REFERENCES 1. Gordon, R. J., and Lowy, F. D. (2008) Clin Infect Dis 46 Suppl 5, S350-359 2. McGowan, J. E., Jr., and Tenover, F. C. (2004) Nat Rev Microbiol 2(3), 251-258 3. Genco, C. A., and Dixon, D. W. (2001) Mol Microbiol 39(1), 1-11 4. Wandersman, C., and Stojiljkovic, I. (2000) Curr Opin Microbiol 3(2), 215-220 5. Skaar, E. P., and Schneewind, O. (2004) Microbes Infect 6(4), 390-397 6. Wandersman, C., and Delepelaire, P. (2004) Annu Rev Microbiol 58, 611-647 7. Reniere, M. L., Torres, V. J., and Skaar, E. P. (2007) Biometals 20(3-4), 333-345 8. Skaar, E. P., Gaspar, A. H., and Schneewind, O. (2004) J Biol Chem 279(1), 436-443 9. Clarke, S. R., and Foster, S. J. (2008) Infect Immun 10. Clarke, S. R., Mohamed, R., Bian, L., Routh, A. F., Kokai-Kun, J. F., Mond, J. J., Tarkowski, A.,
and Foster, S. J. (2007) Cell Host Microbe 1(3), 199-212 11. Clarke, S. R., Wiltshire, M. D., and Foster, S. J. (2004) Mol Microbiol 51(5), 1509-1519 12. Vermeiren, C. L., Pluym, M., Mack, J., Heinrichs, D. E., and Stillman, M. J. (2006) Biochemistry
45(42), 12867-12875 13. Grigg, J. C., Vermeiren, C. L., Heinrichs, D. E., and Murphy, M. E. (2007) Mol Microbiol 63(1),
139-149 14. Torres, V. J., Pishchany, G., Humayun, M., Schneewind, O., and Skaar, E. P. (2006) J Bacteriol
188(24), 8421-8429 15. Dryla, A., Gelbmann, D., von Gabain, A., and Nagy, E. (2003) Mol Microbiol 49(1), 37-53 16. Mack, J., Vermeiren, C., Heinrichs, D. E., and Stillman, M. J. (2004) Biochem Biophys Res
Commun 320(3), 781-788 17. Sharp, K. H., Schneider, S., Cockayne, A., and Paoli, M. (2007) J Biol Chem 282(14), 10625-
10631 18. Grigg, J. C., Vermeiren, C. L., Heinrichs, D. E., and Murphy, M. E. (2007) J Biol Chem 282(39),
28815-28822 19. Pluym, M., Vermeiren, C. L., Mack, J., Heinrichs, D. E., and Stillman, M. J. (2007) J. Porph.
Phthal. 11(03), 165-171 20. Mazmanian, S. K., Skaar, E. P., Gaspar, A. H., Humayun, M., Gornicki, P., Jelenska, J.,
Joachmiak, A., Missiakas, D. M., and Schneewind, O. (2003) Science 299(5608), 906-909 21. Liu, M., Tanaka, W. N., Zhu, H., Xie, G., Dooley, D. M., and Lei, B. (2008) J Biol Chem 22. Cheek, J., and Dawson, J. H. (2000) Magnetic circular dichroism spectroscopy of heme iron
systems. In: Kadish, K. M., Smith, K. M., and Guilard, R. (eds). The handbook of porphyrins and related macrocycles, Academic Press, New York
23. Eakanunkul, S., Lukat-Rodgers, G. S., Sumithran, S., Ghosh, A., Rodgers, K. R., Dawson, J. H., and Wilks, A. (2005) Biochemistry 44(39), 13179-13191
24. Pluym, M., Muryoi, N., Heinrichs, D. E., and Stillman, M. J. (2008) J Inorg Biochem 102(3), 480-488
25. Pluym, M., Vermeiren, C. L., Mack, J., Heinrichs, D. E., and Stillman, M. J. (2007) Biochemistry 46(44), 12777-12787
26. Springall, J., Stillman, M. J., and Thomson, A. J. (1976) Biochim Biophys Acta 453(2), 494-501 27. Tiedermann, M. T., Muryoi, N., Heinrichs, D. E., and Stillman, M. J. (2008) Journal of
Porphyrins and Phthalocyanines Submitted 28. Guzman, L.-M., Belin, D., Carson, M. J., and Beckwith, J. (1995) J Bacteriol 177, 4121-4130 29. Li, J. M., Umanoff, H., Proenca, R., Russell, C. S., and Cosloy, S. D. (1988) J Bacteriol 170(2),
1021-1025 30. Berry, E. A., and Trumpower, B. L. (1987) Anal. Biochem. 161, 1-15 31. Dryla, A., Hoffmann, B., Gelbmann, D., Giefing, C., Hanner, M., Meinke, A., Anderson, A. S.,
Koppensteiner, W., Konrat, R., von Gabain, A., and Nagy, E. (2007) J Bacteriol 189(1), 254-264
by guest on March 13, 2019
http://ww
w.jbc.org/
Dow
nloaded from

Heme transfer between S. aureus Isd proteins
HemeTransfer-JBC-Rev3-2cols-08July23-3qo 2008-07-25
Page 13 of 13
32. Zhu, H., Xie, G., Liu, M., Olson, J. S., Fabian, M., Dooley, D. M., and Lei, B. (2008) J Biol Chem 283(26), 18450-18460
END OF TEXT
by guest on March 13, 2019
http://ww
w.jbc.org/
Dow
nloaded from

DEMONSTRATION OF THE IRON-REGULATED SURFACE DETERMINANT (ISD) HEME TRANSFER PATHWAY IN STAPHYLOCOCCUS AUREUS
Muryoi, Naomi1, Tiedemann, Michael, T.2, Pluym, Mark2, Cheung, Johnson1, Heinrichs, David E.1, and Stillman, Martin J.2
FIGURES Muryoi-et al-JBC-Hemetransfer-Rev3-FIGS-10Q Saved: 7/25/2008 10:30:00 AM
by guest on March 13, 2019
http://ww
w.jbc.org/
Dow
nloaded from


and Martin J. StillmanNaomi Muryoi, Michael T. Tiedemann, Mark Pluym, Johnson Cheung, David E. Heinrichs
Staphylococcus aureusDemonstration of the iron-regulated surface determinant heme transfer pathway in
published online August 1, 2008J. Biol. Chem.
10.1074/jbc.M802171200Access the most updated version of this article at doi:
Alerts:
When a correction for this article is posted•
When this article is cited•
to choose from all of JBC's e-mail alertsClick here
by guest on March 13, 2019
http://ww
w.jbc.org/
Dow
nloaded from