demonstration and deployment strategy workshop: … · 2014-06-12 · demonstration and deployment...
TRANSCRIPT


DEMONSTRATION AND DEPLOYMENT STRATEGY WORKSHOP
Demonstration and
Deployment Strategy
Workshop: Summary
May 2014
Workshop and report sponsored by the
U.S. Department of Energy
Office of Energy Efficiency and Renewable Energy
Bioenergy Technologies Office
Demonstration and Deployment Team
Prepared by
Energetics Incorporated

DEMONSTRATION AND DEPLOYMENT STRATEGY WORKSHOP
i
Preface This report is based on the proceedings of the U.S. Department of Energy’s Bioenergy Technologies Office (BETO) Demonstration and Deployment (D&D) Strategy Workshop, held on March 12–13, 2014, at Argonne National Laboratory. The workshop gathered stakeholders from industry, academia, national laboratories, and government to discuss the issues and potential for demonstration and deployment activities to pave the way for large-scale production of cost-competitive, renewable fuels from biomass resources. The ideas provided here represent a snapshot of the perspectives and ideas generated by the discrete set of participants in attendance at the workshop.
Acknowledgements Special thanks are extended to the workshop plenary speakers in helping to frame this workshop: Anthony Crooks, PhD, U.S. Department of Agriculture; Angela Foster-Rice, United Airlines; Kevin A. Gray, PhD, Beta Renewables; Jennifer Holmgren, LanzaTech; Sharyn Lie, U.S. Environmental Protection Agency; Jonathan Male, BETO; Ron Meeusen, Cultivian Sandbox Ventures, LLC; Hans van der Sluis, POET-DSM Advanced Biofuels; Jim Spaeth, BETO; and Travis Tempel, BETO. BETO gratefully acknowledges the valuable ideas and insights contributed by all of the stakeholders who participated in the D&D Strategy Workshop. The willingness of these experts to share their time and knowledge has helped to identify and better define current and emerging opportunities to expedite the demonstration and deployment of innovative technologies for sustainably producing a suite of advanced biofuels and bioproducts. These individuals are listed in Appendix A. Workshop planning and execution and the preparation of this report were conducted under the direction of Jim Spaeth and Travis Tempel, with significant contributions from others in BETO and Energetics Incorporated.
Disclaimer
The views and opinions of the workshop attendees, as summarized in this document, do not necessarily reflect those of the United States government or any agency thereof, nor do their employees make any warranty, expressed or implied, or assume any liability or responsibility for the accuracy, completeness, or usefulness of any information, apparatus, product, or process disclosed, or represent that its use would not infringe privately owned rights.
Cover
Original photo provided courtesy of INEOS BIO.
DEMONSTRATION AND DEPLOYMENT STRATEGY WORKSHOP
ii
Contents Preface ...................................................................................................................................... i Acknowledgements ................................................................................................................... i Executive Summary ................................................................................................................. iv
1. Introduction ......................................................................................................................... 1
1.1 Non-Technical Barriers ................................................................................................. 2
2. Feedstocks .......................................................................................................................... 4
2.1 Overview ...................................................................................................................... 4
2.2 Technical Barriers ........................................................................................................ 5
2.3 Priorities for Advancement Activities............................................................................. 6
RD&D Priorities ........................................................................................................ 6
Analysis and Outreach Priorities .............................................................................. 6
3. Products .............................................................................................................................. 7
3.1 Overview ...................................................................................................................... 7
3.2 Technical Barriers ........................................................................................................ 8
3.3 Priorities for Advancement Activities............................................................................. 9
RD&D Priorities ........................................................................................................ 9
Analysis and Outreach Priorities ............................................................................ 10
4. Fuels via Biochemical Conversion .................................................................................. 11
4.1 Overview .................................................................................................................... 11
4.2 Technical Barriers ...................................................................................................... 11
4.3 Priorities for Advancement Activities........................................................................... 13
RD&D Priorities ...................................................................................................... 13
Analysis and Outreach Priorities ............................................................................ 13
5. Fuels via Thermochemical Conversion: Group A ........................................................... 14
5.1 Overview .................................................................................................................... 14
5.2 Technical Barriers ...................................................................................................... 15
5.3 Priorities for Advancement Activities........................................................................... 16
RD&D Priorities ...................................................................................................... 16
Analysis and Outreach Priorities ............................................................................ 16
6. Fuels via Thermochemical Conversion: Group B ........................................................... 17
6.1 Overview .................................................................................................................... 17
6.2 Technical Barriers ...................................................................................................... 18
6.3 Priorities for Advancement Activities........................................................................... 19
RD&D Priorities ...................................................................................................... 19
Analysis and Outreach Priorities ............................................................................ 19

DEMONSTRATION AND DEPLOYMENT STRATEGY WORKSHOP
iii
Appendix A: Attendees List ................................................................................................... 21
Breakdown by Affiliation: 110 Participants ........................................................................... 21
Attendee List ....................................................................................................................... 21
Appendix B: Acronyms .......................................................................................................... 25
Appendix C: Meeting Agenda ................................................................................................ 26
Appendix D: Advancement Activities .................................................................................... 28

DEMONSTRATION AND DEPLOYMENT STRATEGY WORKSHOP
iv
Executive Summary To accelerate the commercial production of drop-in hydrocarbon fuels from biomass, the Bioenergy Technologies Office (BETO) in the U.S. Department of Energy’s Office of Energy Efficiency and Renewable Energy (EERE) held a strategy workshop at Argonne National Laboratory on March 12–13, 2014. The workshop brought together a broad spectrum of experts from industry, academia, national laboratories, and government to discuss the technical and economic barriers impeding the demonstration and deployment of technologies for the commercial production of drop-in hydrocarbon fuels and products. The wealth of information generated at the workshop will inform BETO’s strategic planning and prioritization efforts. As summarized and grouped thematically in Table ES-1, workshop participants identified key barriers, as well as activities to address those barriers.
Working in five parallel breakout sessions, workshop participants prioritized 25 advancement activities that could accelerate the commercialization of drop-in hydrocarbon fuels. These technical groups ultimately placed priority on a number of activities in common, suggesting the potential for broad appeal across the sector. Four recurring themes echoed across the groups:
Creation of Test Facilities: A truly versatile test facility, while challenging to set up and finance, would expedite technology validation efforts.
Feedstock Handling: Improved equipment for feedstock handling could resolve issues that often lead to biorefinery failure.
Economic Value: Bioproducts—and the versatility they provide—could improve the economics of biorefineries.
Partnering Efforts: Partnering is always a critical need; technical experts in diverse fields are needed to design, build, and operate a successful biorefinery.
These industry opinions on mechanisms for advancing biofuels provide valuable insights into activities that could potentially help realize the commercial potential of drop-in hydrocarbon biofuels.

DEMONSTRATION AND DEPLOYMENT STRATEGY WORKSHOP
v
Table ES-1.1: Key Barriers and Activities to the Development and Demonstration of Critical Technologies
Barrier Advancement Activity Group
Standards Development and Market Analysis
Lack of widely available, reliable, comprehensive, and transparent information on costs and conversion efficiencies at each stage of the supply chain
Publish estimated costs and conversion efficiencies by feedstock and conversion process each year.
F
Overly optimistic evaluations that set unrealistically high targets and expectations for pioneer plants
Establish a new standard to guide the critical review of technical and economic metrics.
BC
Lack of useable and enforceable metrics for assessing the industrial robustness of organisms, enzymes, and processes for biochemical conversion
Develop metrics to indicate the technological robustness of organisms, enzymes, and processes. BC
Inconsistent techno-economic modeling results due to different assumptions and methodologies
Standardize analytics for techno-economic and process modeling.
TC B
Facilities / Test Beds Technical and economic challenges of separations Demonstrate separations technologies at pilot and
demonstration scales. P
Prohibitive cost for a single entity to produce large volumes (i.e., >1000 gallons) of biofuel
Create a Cross-Platform Development Incubator BC
Lack of validated catalyst performance data to feed into the technical and economic models that guide future engineering design for technology scale-up and demonstration
Conduct preliminary pilot-scale testing to measure the performance of catalysts.
TC A
Limited number, range, and industry awareness of facilities for pilot-scale thermochemical testing and development; lack of demonstration-scale user facilities and consistent, adequate support for pilot facilities
Use the convening power of DOE to form partnerships to develop the technology, further develop existing pilot facilities, and expand them into demonstration-scale user facilities.
TC A
Need to test and validate the economic viability of a fully integrated plant operation, from feedstock to end products
Establish Plant Integration facility for users to demonstrate acceptable plant uptime, product quality and yield, and operating costs.
TC B
Difficulties in validating catalyst performance (yield, selectivity, lifetime) in converting biomass to intermediates and in upgrading those intermediates to “whole barrel” replacement hydrocarbons
Provide facility or facilities for demonstrating catalyst manufacturing and evaluating catalyst performance at scale.
TC B
Feedstock Handling Challenges in scaling up technologies without adversely affecting feedstock cost, the availability and reliability of supply, and consistent quality
Develop and demonstrate advanced logistics systems for biomass feedstocks. F
Lack of operational flexibility to accommodate feedstock variability
Design robust processes to transform diverse biomass resources into homogeneous intermediates, enabling component separation for further processing.
P
Lack of feedstock-flexible processing and handling systems, especially at pilot or larger scale
Develop more versatile feedstock handling systems at pilot scale and larger.
TC B

DEMONSTRATION AND DEPLOYMENT STRATEGY WORKSHOP
vi
Barrier Advancement Activity Group
Equipment Development Lack of simple, timely, accurate instruments to verify biomass quality specifications at points of collection, consolidation, delivery, or storage
Develop fast, simple, and inexpensive devices/measures to accurately determine feedstock quality.
F
Lack of biorefinery plant infrastructure (i.e., pumps, heat exchangers, etc.)
Clarify an infrastructure procurement strategy for biorefineries (e.g., a Green Manhattan Effort).
P
Current processing units that are not optimized for the bioenergy industry
Conduct value engineering on specific unit operations.
P
High cost of biorefinery infrastructure, particularly for creation of new processes
Build on the existing ethanol infrastructure. BC
Outreach and Partnering Efforts
Uncoordinated development and commercialization efforts along the feedstock supply chain
Engage a broader spectrum of biomass feedstock development stakeholders to accelerate progress.
F
Difficulty in identifying compatible partners and thermochemical technologies
Develop a database of thermochemical technologies (by feedstock, process, and product) to enable assembly of field and patent data from federally funded projects.
TC A
Lack of connection among catalyst manufacturers, process inventors, and developers in DOE-funded programs; high financial and technical risks for all parties on a team
Encourage and support collaborative efforts to scale up catalyst production and piloting.
TC A
“Gaps” or areas of lower competency/resources present in most organizations for moving new technology into integrated commercialization (D&D)
Establish best practices in partnering or gap filling to bolster experience, expertise, finances, etc. (including foreign entities).
TC B
Economic Value Overwhelming nature of the vast array of options for chemicals that can be produced from biomass
Target specific platform chemical intermediates that could collectively substitute for the whole barrel.
P
Low-value end use for significant portion of the feedstocks that move through the supply chain
Add value to the rest of a bale, specifically lignin conversion.
P
Economic limitations of producing a single product Co-produce multiple bioproducts to enhance economic stability.
BC
Funding Support Limited funding and construction of commercial- scale facilities
Underwrite activities to bolster investor confidence and market pull; validate the technical and economic performance of these technologies with a focus on the end customer.
BC
BC: Biochemical Conversion; F: Feedstock; P: Products; TC A: Thermochemical Conversion A; TC B: Thermochemical Conversion B

DEMONSTRATION AND DEPLOYMENT STRATEGY WORKSHOP
1
1. Introduction Displacing conventional jet fuel, diesel, and gasoline with renewable fuels will require the production of bio-based molecules that are equivalent in performance to the petroleum-based molecules they are designed to replace. Domestic production of drop-in hydrocarbon fuels that can directly substitute for conventional transportation fuels will deliver a wealth of benefits, including economic growth, energy security, reduced greenhouse gas emissions, and positive impacts on sustainability and the environment. While domestic biofuels make up less than 6% of today’s market (Figure 1.1), the U.S. bioindustry is on the verge of developing and deploying novel technologies that will give the country a cleaner and more sustainable source of transportation fuel. As the private sector embarks on the commercial-scale production of cellulosic ethanol, the Bioenergy Technologies Office (BETO) in the Office of Energy Efficiency and Renewable Energy (EERE) at the U.S. Department of Energy (DOE) continues to support those efforts and seeks to catalyze progress in the nation’s domestic capability to produce cost-competitive, drop-in hydrocarbon fuels from biomass. The objectives of BETO’s Demonstration and Deployment (D&D) team are to demonstrate novel technologies for various conversion pathways at progressively larger scales and to validate the associated cost and performance data. The D&D team helps span the gap from research and development to commercial production, reducing technology and investment risk. In pursuit of these objectives, BETO provides cost-shared funding for the construction of biorefineries at the pilot, demonstration, and pioneer scales. DOE currently provides cost-shared support for 12 pilot, 4 demonstration, and 4 pioneer-scale integrated biorefineries. Using a range of feedstocks and conversion technologies, these facilities are pushing biofuels along the development curve toward cost parity with traditional petroleum fuels. Derisking these technologies helps them navigate the treacherous “valley of death” that often prevents promising laboratory technologies from advancing to commercialization. Federal support for these plants and the broader bioeconomy is essential to successfully achieve widespread commercialization of these innovative technologies. After validating the modeled cost target for cellulosic ethanol in 2012, BETO has been able to prioritize work on drop-in hydrocarbon fuels, and the D&D team has begun to more narrowly focus on the barriers that prevent the commercial deployment of these production technologies. To better understand these barriers and challenges, the D&D team convened a Strategy Workshop on March 12–13, 2014, at Argonne National Laboratory. At the workshop, stakeholders from industry, academia, national laboratories, and government gathered to discuss the issues and potential paths forward to sustainable, cost-competitive fuels from non-food biomass resources. This report summarizes the workshop results, which will provide useful input as BETO identifies, evaluates, and prioritizes the demonstration and deployment efforts needed to achieve affordable, scalable, and sustainable production of hydrocarbon biofuels. This report is not designed to comprehensively cover all of the relevant issues but merely to summarize the innovative ideas generated by those in attendance at the workshop. These results are presented within four technical areas:
Feedstocks: Commercial-scale feedstock choice, growth, collection, transport, and processing
Products: Conversion pathways ending in products other than fuels (technology agnostic)
Figure 1.1: 2013 U.S. fuel production So urce: EIA Petroleum & Other Liquids, Supply and Disposition
0
1,000
2,000
3,000
4,000
5,000
6,000
Conventional Renewable
Other Renewable
Ethanol
Motor Gasoline
Diesel
Jet Fuel
U.S. Fuel Production, 2013
Mill
ion
s o
f B
arre
ls

DEMONSTRATION AND DEPLOYMENT STRATEGY WORKSHOP
2
Fuels via Biochemical Conversion: Enzymatic conversion pathways to fuels (most likely in a bioreactor)
Fuels via Thermochemical Conversion: Inorganic catalytic conversion pathway to fuels (discussed in parallel by two separate breakout groups).
1.1 Non-Technical Barriers
Aside from technical challenges, the accelerated commercialization of biomass and biofuels faces significant non-technical barriers. These barriers fit into three main categories: regulation, finance, and education. While these issues fall outside the traditional scope of BETO activities, they constitute significant barriers and should be addressed in tandem with the technical issues.
Regulatory
Regulatory barriers can actively hinder the deployment of biofuels and bioproducts. Petroleum-derived fuels continue to dominate the supply chain, even with the Renewable Fuels Standard (RFS) driving the creation of a more sustainable fuel supply. Petroleum-based fuels involve a fairly predictable and established set of refining operations, processes, and systems, and an effective structure has evolved to regulate this mature industry. Biofuels production, in contrast, involves significantly more varied feedstocks, suppliers, pathways, and sustainability issues. Effective regulation of this emerging industry must necessarily reflect the dynamic and innovative nature of biofuels processing—or it will impede progress. Improved rules implementation and approval pathways focused on application-specific validation could expedite market entry of novel transportation biofuels. Regulations need to interpret sustainability more broadly to include the use of traditional waste streams as feedstocks. Biorefineries today can receive Renewable Identification Number (RIN) credits (or the like) for corn stover but not for diverting organic waste from landfills, including municipal solid waste. Simple regulatory changes are needed to reflect the large number of feedstocks and pathways that biorefineries may employ to sustainably produce a diverse slate of renewable products that support national goals for energy and the environment. Given the large capital and operating expenses incurred in running an integrated biorefinery, the legislative environment also needs to provide better policy direction and investor certainty. A more responsive regulatory environment and clear prioritization of fuels or pathways would better inform industry decisions and expedite commercialization. The wider marketplace needs to be better educated about biofuels. Genetically modified organisms represent novel and promising feedstocks, which could be tailored for use in conversion pathways. This approach could potentially raise yields and lower costs, yet the costly approval process imposed by current regulations constrains deployment. Biofuels receive significant pushback from the petroleum industry. Although biofuels are direct competitors to this long-established market, many producers target refinery integration as a mutually beneficial strategy. While biofuels regulation must recognize existing biases, they must also avoid worsening relationships between these two industries, which could discourage potential collaborations and ultimately delay deployment of biofuels.
Economic Financial issues continue to impede the construction of large demonstration and pioneer-scale biorefineries. These plants require large capital investments and are not expected to break even for years, even with favorable economic conditions. Loan guarantees and tax incentives are helpful, but some impose onerous requirements,
DEMONSTRATION AND DEPLOYMENT STRATEGY WORKSHOP
3
such as high cost share or 30% mandated contingency funds. Often, these mechanisms result in funding pathways that are inappropriate for start-ups or smaller companies. As in the petrochemicals industry, large plant size appears to be a requisite for profitability, so the scale of plant operations continues to dominate plant economics. Nonetheless, innovative thinking could yield smaller, modular systems that could be produced and deployed in larger numbers to achieve economies of scale while exploiting geographically dispersed biomass. Potentially, such systems would require significantly smaller total investment and may avoid many of the difficulties inherent in financing larger, more expensive projects. Many financial institutions need to balance the large capital expenses and long payback periods of biorefineries with certainty about future production levels and market demand. The inability of many biorefineries to arrange long-term contracts for either supply or offtake increases the financial risk and may discourage decision makers in financial institutions from providing financing for biorefineries. Biorefineries need a buyer like the U.S. military, which has both a long-term interest in the space and the long-term vision to commercialize biofuels. Governmental support has been critical in helping the domestic bioindustry reach its current state, and high levels of federal funding will continue to drive this technology toward commercial self-sustainability. Additional economic barriers include high feedstock costs and the need to create market pull.
Education Educational needs fall into two main categories: educating the general public and developing the STEM workforce. The American public values sustainability, and the biofuels industry needs to align its messaging with this priority value. A strong and effective public education campaign can help to create market pull, educate lawmakers, and ultimately drive the industry forward. Educating the consumer accelerates development in this industry and helps bring affordable, sustainable biofuels to commercialization. The lack of an available STEM workforce presents a barrier to the construction of new biorefineries. While qualified individuals exist, manufacturers value their skills highly and few are unemployed. The siting of plants close to biomass sources, consumers, and qualified plant operators remains a non-trivial issue, especially while shale continues to bolster demand by the traditional chemicals sector.

DEMONSTRATION AND DEPLOYMENT STRATEGY WORKSHOP
4
2. Feedstocks
2.1 Overview
Commercial-scale biorefineries face numerous technical challenges in consistently getting the right quantity and quality of affordable biomass feedstocks to the plant gate. While some feedstocks can be handled by commercial logistics systems (e.g., white wood pellets or MSW), new and emerging crops under consideration as future feedstocks may pose logistical challenges. Successful commercialization of integrated biorefineries will require that feedstocks be developed in tandem with the logistics for handling them.
The lack of feedstock specifications and wide variability in the characteristics of biomass feedstock are among the most significant feedstock-related challenges. Producers need feedstock specifications to better understand biorefinery requirements and the characteristics of feedstocks that are important for processing. Biorefineries need an ample supply of feedstocks that are of consistent quality—every day of the year. Lack of blending capabilities and difficulties in processing multiple feedstocks intensify the challenges presented by feedstock variability.
Another major barrier is feedstock cost, which is exacerbated by the high cost of transporting bulky, but not energy dense biomass. The lack of an agreed-upon definition for sustainability presents yet another barrier for both producers and refiners. Further down the line, lignin is seen as a feedstock with high potential, but the lack of cost-effective conversion technologies for lignin restricts its use and limits resource efficiency.
Development and demonstration of advanced logistics systems will help to address the cost, availability, reliability, and consistency of feedstock supply. A two-pronged approach is proposed: (1) identify and develop innovative approaches to improve feedstock supply systems and (2) demonstrate and optimize commercial-ready equipment in functioning logistics systems. Integrated feedstock supply systems could be demonstrated in existing biomass markets, such as animal feed and heat/power markets—even if these markets are seen as competitors for biomass feedstocks in the near term. This approach will help to make feedstock systems deployment-ready when biorefineries need them.
Data needs related to feedstock quality vary by feedstock and by process. Feedstock characteristics needing quantification may include ash, moisture, carbohydrates, metals, ammonia, pH, and lignin. High priority should be placed on developing fast, simple, mobile, and inexpensive devices to measure feedstock quality. Successful development of these devices will require collaboration among suppliers, buyers, and OEMs.
Solutions to feedstock technologies call for enhanced collaboration among all stakeholders. The various government agencies that work on feedstock issues—such as BETO, the DOE Office of Science, U.S. Department of Agriculture (USDA), and Environmental Protection Agency (EPA)—could actively share information on their projects, objectives, barriers, and solutions. A “clearinghouse” could provide information on ongoing projects and provide information on where to find experts or specialized expertise. An interagency working group could coordinate federally funded work on feedstock issues.
One barrier impeding bioindustry development is the lack of widely available, reliable, comprehensive, and transparent information about the costs and conversion efficiencies of various technologies and feedstocks. When asked, everyone’s technology is “close to commercial.” A public reference for benchmarking and evaluating the various technologies and conversion pathways could help all stakeholders make better decisions. To create this reference, a team of subject matter experts, industry stakeholders, government representatives, and academics needs to objectively identify the relevant models of feedstock supply chains and processes. A single web portal could share this information and the assumptions used in the analysis. A public reference of this type will help to identify the top R&D challenges and opportunities and encourage investment in the most promising technologies.
DEMONSTRATION AND DEPLOYMENT STRATEGY WORKSHOP
5
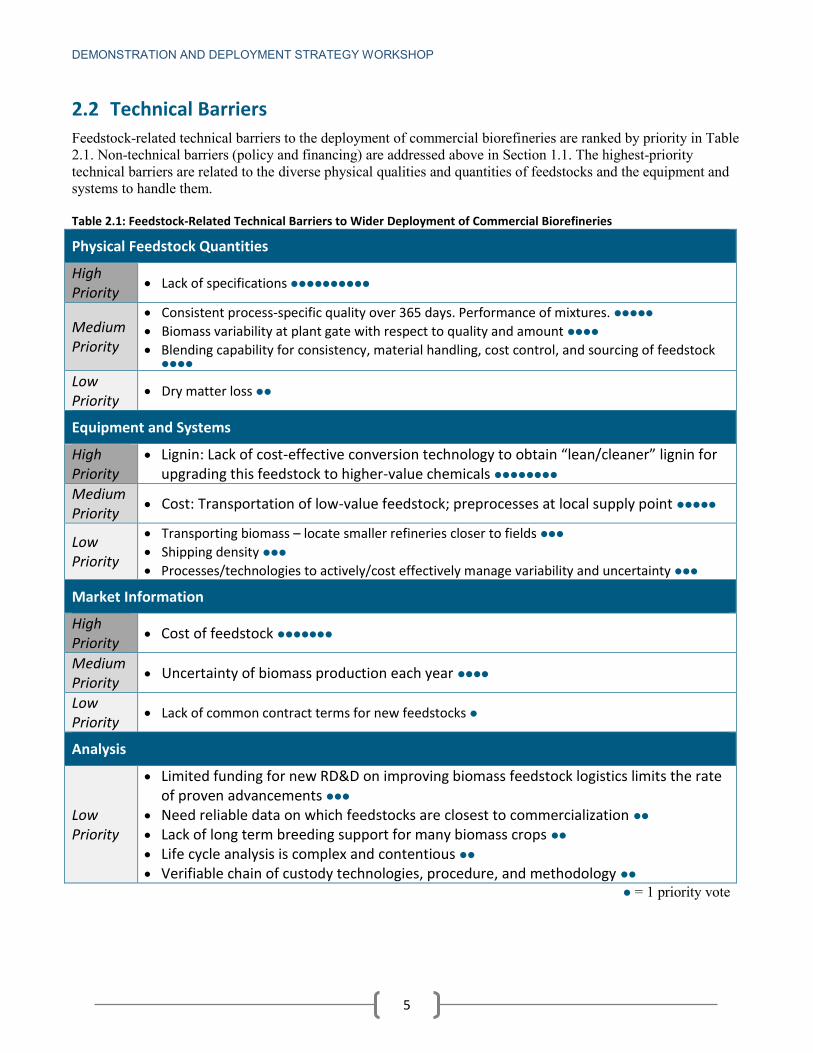
2.2 Technical Barriers
Feedstock-related technical barriers to the deployment of commercial biorefineries are ranked by priority in Table 2.1. Non-technical barriers (policy and financing) are addressed above in Section 1.1. The highest-priority technical barriers are related to the diverse physical qualities and quantities of feedstocks and the equipment and systems to handle them.
Table 2.1: Feedstock-Related Technical Barriers to Wider Deployment of Commercial Biorefineries
Physical Feedstock Quantities
High Priority
Lack of specifications
Medium Priority
Consistent process-specific quality over 365 days. Performance of mixtures.
Biomass variability at plant gate with respect to quality and amount
Blending capability for consistency, material handling, cost control, and sourcing of feedstock
Low Priority
Dry matter loss
Equipment and Systems
High Priority
Lignin: Lack of cost-effective conversion technology to obtain “lean/cleaner” lignin for upgrading this feedstock to higher-value chemicals
Medium Priority
Cost: Transportation of low-value feedstock; preprocesses at local supply point
Low Priority
Transporting biomass – locate smaller refineries closer to fields
Shipping density
Processes/technologies to actively/cost effectively manage variability and uncertainty
Market Information
High Priority
Cost of feedstock
Medium Priority
Uncertainty of biomass production each year
Low Priority
Lack of common contract terms for new feedstocks
Analysis
Low Priority
Limited funding for new RD&D on improving biomass feedstock logistics limits the rate of proven advancements
Need reliable data on which feedstocks are closest to commercialization Lack of long term breeding support for many biomass crops Life cycle analysis is complex and contentious Verifiable chain of custody technologies, procedure, and methodology
= 1 priority vote

DEMONSTRATION AND DEPLOYMENT STRATEGY WORKSHOP
6
2.3 Priorities for Advancement Activities
Advancement activities to address key barriers to the demonstration and deployment of drop-in hydrocarbon biofuels fit within four priority activities. These activities are listed below and described in more detail in Appendix D, Tables D-1.1 through D-1.4.
RD&D Priorities
Develop and demonstrate advanced logistics systems for biomass feedstocks: Accelerate the development of feedstock supply systems (i.e., test them in cattle feed and biopower/combined heat and power [CHP] markets) to achieve cost, availability/reliability, and consistency (quality) targets in parallel with the development of biorefineries, so that these systems will be ready for deployment when needed by the biorefineries. 12 votes
Develop fast, simple, and inexpensive devices/measures to accurately determine feedstock quality:
Develop instruments that can adapt to particular operations and are fast, reliable, mobile, low in cost, widely available, attachable to farm equipment, easy to use, and able to wirelessly transmit results/readings. 10 votes
Analysis and Outreach Priorities
Publish estimated costs and conversion efficiencies by feedstock and conversion process each year:
Provide public references for benchmarking, conversion economics, investment decisions, and R&D targets so that private companies can elaborate on them. 6 votes
Engage a broader spectrum of biomass feedstock development stakeholders to accelerate progress:
Develop a more integrated way to engage stakeholders (representing basic research through agronomic development) to facilitate rapid deployment of the feedstock supply chain for biorefinery projects. 5 votes
DEMONSTRATION AND DEPLOYMENT STRATEGY WORKSHOP
7
3. Products
3.1 Overview
Bioproducts other than fuels can improve the economic viability of biorefineries, regardless of the conversion pathway used. Bioproduct processing technologies that are ready for validation include syngas conversion, Fischer-Tropsch, esterification, reactive distillation, fermentation, pyrolysis, thermo catalysis, and advanced separation analytics. Although some of these technologies may be entering commercial application (some internationally), more demonstration and deployment activities are needed to help these technologies advance to market. In some cases, more testing or validation is needed to prove the benefits of scale up, system integration, operational robustness, and associated lifecycle emissions, such as GHG reduction.
Some of the barriers to successful scale-up of these technologies are non-technical in nature, such as limited workforce and education resources, cost parity with current products, and biomass acquisition costs. Technical solutions could potentially address some of these non-technical barriers (e.g., increasing theoretical yields could drive down costs to establish pricing parity). Major technical barriers include the lack of conversion equipment at the appropriate scale, the lack of distributed production technologies, the amount of energy required for processing (lack of low-energy separation alternatives), the high cost of water separation, downstream logistics, and the need to integrate unit operations for biofuels and biochemicals. Measurement barriers include the lack of metrics for product chemicals and the time and expense involved in testing products and developing these testing procedures.
Several activities to address these barriers closely align with BETO capabilities. A promising strategy is to target the economic production of specific platform chemical intermediates that, collectively, can replace the whole barrel. BETO has historically focused on fuels, but expanding the slate of biorefinery products will help to overcome some significant barriers; even today’s chemical industry could not function without co-products. This activity, potentially sponsored by DOE, may involve pairing research technologies with existing pilot plants. Better defining this focus on intermediate products to replace the whole barrel will also help meet deployment targets, assuming the presence of consistent policy to stimulate private investment.
The most technically challenging and expensive aspect of bioprocessing often involves process and water separations technologies. BETO could accelerate progress by supporting the demonstration and deployment of economically and environmentally optimized, integrated separations systems for processing diverse feedstocks into bio-based products. Analyses could evaluate dilute aqueous systems, dilute organic systems, chemical and physical properties of biomaterials, gross separations vs. polishing, and more. Promising separations innovations could be demonstrated at the optimum scale for the technology. BETO’s efforts in this area could produce a useful matrix of the separations technologies appropriate for various products or intermediates.
The economics of bioprocessing can improve significantly by “using the whole bale.” A significant portion of the feedstock traveling through today’s supply chain has a low-value end use; less than the entire bale is currently used to produce fermentable sugars. Further D&D for lignin conversion technologies will add value to the rest of the bale, beyond its heat content. Techno-economic analysis will help to identify barriers. Key needs include a framework and comprehensive report on the technical barriers and economic feasibility of various lignin conversion pathways. Such a publication could specify the contaminant tolerances and other relevant technical details of each conversion process (e.g., pyrolysis, gasification).
Increased awareness and education will assist in establishing broader support for and coordination of efforts to develop the bioproducts platform. Elevated consumer awareness will help to create market pull. A marketing campaign, for example, could expand today’s niche demand for environmentally friendly products to a broader consumer market that understands the diverse benefits of bioproducts (e.g., American grown). Improved dialogue
DEMONSTRATION AND DEPLOYMENT STRATEGY WORKSHOP
8
between those setting agendas and those acting on agendas could increase government recognition of the value of byproducts. This improved understanding, in turn, could lead to clear RD&D priorities, consistent choices by all market participants, and a robust infrastructure procurement strategy—amounting to a “Green Manhattan Project.” Ideally, this effort will create long-term tax incentives and consistent regulatory and permitting practices that favor a clear commercialization pathway for bioproducts.
Feedstock variability and biorefinery flexibility are crucial issues. A bale of corn stover alone can possess widely variable characteristics that are only multiplied by geographic diversity, seasonal changes, and distributed operating locations. Other feedstocks similarly introduce a myriad of potential variations. Well-designed technologies could handle such feedstock variability on the processing end. Such a robust, multi-feedstock process could also alleviate a bad feedstock year for any one bioproduct. The desired outcome to this feedstock variability challenge is a standardized design case for a biomass-to-intermediate process that accommodates widely variable feedstocks and the associated handling and recovery systems to feed material into the standardized design. A necessary first step in this effort is to demonstrate the robust co-feeding capability and techno-economic evaluation of the technology design.
Finally, the capital and operational costs of producing bioproducts will decrease as individual unit processes improve in performance and efficiency. Specific unit operations require value engineering and optimization for the bioenergy industry. To remove bottlenecks in downstream processing, DOE support can help to identify unit operations requiring optimization. As an actionable activity, this group recommends that unit operations be compared to process models (comparing performance and cost-effectiveness of technologies for separation, etc.), to identify candidate operations for further research and development.
3.2 Technical Barriers
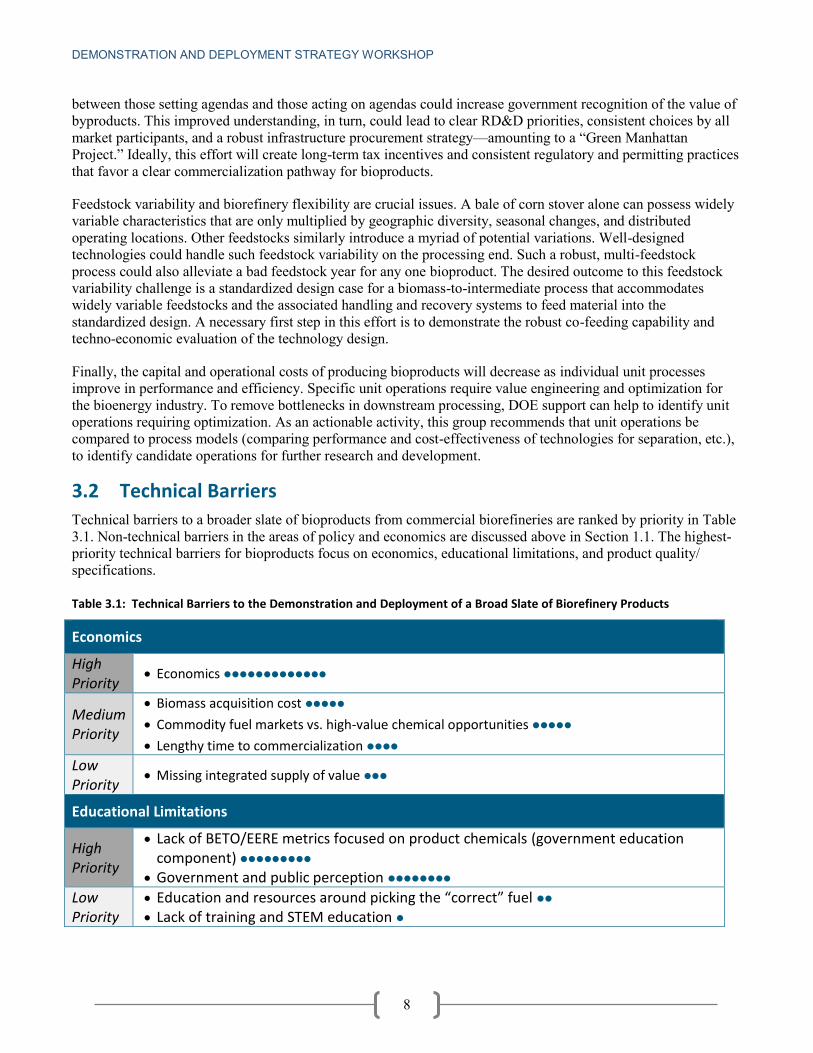
Technical barriers to a broader slate of bioproducts from commercial biorefineries are ranked by priority in Table 3.1. Non-technical barriers in the areas of policy and economics are discussed above in Section 1.1. The highest-priority technical barriers for bioproducts focus on economics, educational limitations, and product quality/ specifications. Table 3.1: Technical Barriers to the Demonstration and Deployment of a Broad Slate of Biorefinery Products
Economics
High Priority
Economics
Medium Priority
Biomass acquisition cost
Commodity fuel markets vs. high-value chemical opportunities
Lengthy time to commercialization
Low Priority
Missing integrated supply of value
Educational Limitations
High Priority
Lack of BETO/EERE metrics focused on product chemicals (government education component)
Government and public perception
Low Priority
Education and resources around picking the “correct” fuel Lack of training and STEM education

DEMONSTRATION AND DEPLOYMENT STRATEGY WORKSHOP
9
Product Quality/ Specifications
High Priority
Expense and time required for product testing/qualifications (need innovation and standard revision)
Low Priority
Setting and meeting product quality specifications, (e.g., jet fuel)
Logistics
Medium Priority
Distribution supply chain logistics downstream
Feedstock logistics
Low Priority
Lack of organized chain of commerce (field-to-wheels players)
Scale of Technology
Medium Priority
Paradigm shift from centralized to distributed production
Low Priority
Availability of conversion equipment at “biomass scale” [modularity]
Process Limitations
Medium Priority
Limitations in downstream processing (e.g., water and product separation, fermentation) technologies and cost
High energy input requirements for energy output, comparatively
Cost-competitive reduced energy separations technologies
Low Priority
Lack of integration between processes for biofuels and biochemicals hindering cost effectiveness
= 1 priority vote
3.3 Priorities for Advancement Activities
Six advancement activities could address priority barriers to the demonstration and deployment of bioproducts produced in tandem with drop-in hydrocarbon biofuels. These activities are introduced below and further described in Appendix D, Tables D-2.1 through D-2.6.
RD&D Priorities
Demonstrate separations technologies at pilot and demonstration scales: Demonstrate and deploy economically and environmentally optimized, integrated separations systems for processing a variety of feedstocks into bio-based products. 10 votes
Design robust processes to transform diverse biomass resources into homogeneous intermediates,
enabling component separation for further processing: Minimize raw material costs for a wide range of locations (opportunistic acquisition); enhance ability to operate year round; lower raw material storage and handling costs; and gain ability to tailor separation ratios to maximize plant revenues. 7 votes

DEMONSTRATION AND DEPLOYMENT STRATEGY WORKSHOP
10
Conduct value engineering on specific unit operations: Decrease capital and operational costs by increasing the performance capability and efficiency of individual units; develop standard performance metrics and accompanying analytical techniques for each unit operation. 8 votes
Add value to the rest of a bale, specifically lignin conversion: Enable economical production of high-value, lignin-based products to improve the profitability of biorefineries that can sell low-cost alternative fuels (lower CAPEX). 9 votes
Analysis and Outreach Priorities
Clarify an infrastructure procurement strategy for biorefineries (e.g., a Green Manhattan Project
Effort): Provide a combination of tax incentives and regulatory and permitting practices that favor this “Green Manhattan Project” and prioritize consistent choices by all market participants without forcing them. 8
votes
Target specific platform chemical intermediates that could collectively substitute for the whole barrel:
Sharpen the RD&D focus to help meet deployment targets for replacing the whole barrel. Consistent policy on this will stimulate private investment. 17 votes

DEMONSTRATION AND DEPLOYMENT STRATEGY WORKSHOP
11
4. Fuels via Biochemical Conversion
4.1 Overview
Barriers affecting biochemical conversion begin with the delivery of feedstock to the biorefinery and continue through shipping of the blend stock or drop-in fuel. A range of relevant technologies, many of which are close to commercialization, are now ready for technology validation. These include the catalytic conversion of lignin to fuel and bioreactors with immobilized bacteria and enzymes.
Issues impeding the commercialization of biochemical conversion processes for hydrocarbon fuels include investor confidence and market pull, technology robustness, feedstock flexibility, co-products, and the availability of technical information. Funding for commercialization is hard to obtain if investors cannot trust market assessments. Investors will be more willing to back a technology that has received a realistic and independent evaluation. The robustness of a process is also an issue—commercial deployment depends on the extent to which organisms can survive a range of operating conditions. Conversion processes will need to accommodate a range of feedstocks and wide variations in feedstock quality. In addition, the lack of co-products may threaten the economic viability of a biorefinery. Broader advancement of the technology is inhibited by both siloed technology development and inadequate information sharing.
To secure a commercial pathway for hydrocarbon fuels produced via biochemical conversion, BETO could underwrite the technical and economic validation of new technologies. This activity will bolster investor confidence by providing an “insurance fund” to address market acceptance. Credible metrics and evaluations are essential. Investors need concrete and credible information to make investment decisions. Overly optimistic evaluations have eroded investor confidence and reduced the credibility of information about a technology. BETO could help establish a new standard that provides a realistic view of the current state of technology and its future prospects (subject to broad industry review) and make sure that its reports reflect real-world yields and costs.
To address the lack of co-products, a single plant could house a small scale production demonstration facility showcasing output flexibility between fuel and co-products manufacturing. BETO could support the development of multiple-product processes on a scalable platform. This approach could bolster investor confidence by demonstrating an accelerated commercial pathway and providing product samples that are cost competitive in the market.
Finally, to break down the silos that hinder development and advancement, BETO could bring interested parties together. Specifically, BETO could facilitate partnering between lab developers and engineering firms to accelerate commercialization. BETO could also help create a development campus that co-locates developers of multiple technologies and serves as a cross-platform incubator. This activity could leverage common infrastructure and reduce costs.
4.2 Technical Barriers
A priority ranking of the technical barriers to increased commercial biochemical conversion of biomass to fuels is presented in Table 4.1. Non-technical barriers in the areas of policy and economics are discussed above in Section 1.1. The highest-priority technical barriers to biochemical conversion technologies focus on robustness, investor confidence, and market pull.

DEMONSTRATION AND DEPLOYMENT STRATEGY WORKSHOP
12
Table 4.1: Technical Barriers to Wider Deployment of Biochemical Conversion Technologies for Advanced Biofuels
Robustness
High Priority
Industrial/robustness of organisms and enzymes used in bioreactors
Medium Priority
Process robustness
Low Priority
Process flexibility to handle feedstocks of diverse chemical composition/structure
Hydrogenation product creation
“Clean” sugars cost of cleanup
Lack of stable feedstock yield and the supporting strategic research plan
Lack of reliable feedstocks, interruptions in scaling
Investor Confidence and Market Pull
High Priority
Lack of critical, realistic evaluation of technology processes. Impact: makes number of granters more cautious/skeptical
Medium Priority
Confidence in technology derisking investment interest
Challenge of finding partners at all stages of supply chain
Biomass sugar as new commodity product
Low Priority
Lack of firm contracts for products
Regulatory/Standards and Consistency Specifications
Medium Priority
Water
Low Priority
Volume requirements for certification
Lack of Co-products
Medium Priority
Co-products should be added into the biofuel process economics
Lignin to fuels
Low Priority
Lack of complete biomass usage, (e.g., lignin waste usage)
Lack of co-products with cellulosics
Carbon and Energy Efficiency
Medium Priority
Lack of carbon and energy efficiency cost
Discrete vs. Continuous
Low Priority
Take the technology to the biomass. Impact: new market
Feasible apparatus for distributed applications of process—small scale at many sites progression blocked
Silos
Medium Priority
Silos resource limitation. Need to partner and collaborate smartly
= 1 priority vote

DEMONSTRATION AND DEPLOYMENT STRATEGY WORKSHOP
13
4.3 Priorities for Advancement Activities
A broad discussion of the barriers to biochemical conversion technologies for drop-in hydrocarbon biofuels led to the identification of six priority activities. These activities are described below and in more detail in Appendix D, Tables D-3.1 through D-3.6.
RD&D Priorities
Create a cross-platform development incubator: Set up an incubator that facilitates partnerships and leverages existing infrastructure. 4 votes
Build on the existing ethanol infrastructure: Establish a commodity sugar platform to reduce risk for new biofuel production; leverage existing know-how to create new market opportunities for ethanol (corn ethanol industry); use CO2 and lignin to produce new fuels. 5 votes
Co-produce multiple bioproducts to enhance economic stability: Provide DOE support for technology development of co-products along with biofuel production on a “scalable” platform in order to demonstrate economic viability; secure investor(s) by demonstrating accelerated commercial pathway and providing product samples that show cost competitiveness in the market. 5 votes
Underwrite activities to bolster investor confidence and market pull; validate the technical and
economic performance of these technologies with a focus on the end customer: Create a model for successfully deploying technology in the market. 10 votes
Analysis and Outreach Priorities
Establish a new standard to guide the critical review of technical and economic metrics: DOE/BETO needs to set a standard for critical review of the current state of technology and abandon “nth Plant” economics. This will help to allocate resources where they can make the greatest economic impact. DOE could fund an EPC (engineering, procurement, and construction) consortium to evaluate processes. 4 votes
Develop metrics to indicate the technological robustness of organisms, enzymes, and processes: End point metrics and validation protocols for robustness. 4 votes

DEMONSTRATION AND DEPLOYMENT STRATEGY WORKSHOP
14
5. Fuels via Thermochemical Conversion: Group A
5.1 Overview
Many of the common barriers to the development and deployment of thermochemical conversion technologies could be addressed by the formation of large, interdisciplinary teams or cooperative partnerships that possess complementary expertise in all facets of the production pathway, from biomass acquisition to conversion into fuel and distribution by market participants. DOE and other government agencies have and will continue to play a key role in bringing these multidisciplinary groups together to apply their distinct core competencies and ultimately commercialize hydrocarbon biofuels. Collaborative activities that address key technical challenges could help achieve many shared goals in this field.
Beyond the known regulatory and financing issues, major technical barriers to the commercial deployment of drop-in hydrocarbon biofuels run the gamut from feedstock quality verification through technical certification of the fuel products. These technical barriers include short catalyst lifetimes, poor catalyst performance in syngas clean up and conversion, catalyst tolerance of impurities, failure of modeling software, need for large economies of scale (from a feedstock and capital perspective), feedstock handling, sourcing feedstocks of sufficient quality, fuel market acceptance criteria, and a general lack of operational knowledge of unit operations (see Table 5-1).
A cross-cutting knowledge database could be developed and would prove valuable in addressing many of these D&D issues. The goal of this database would be to accelerate development by leveraging lessons learned and knowledge gained through past projects. Even failures can be useful and instructive. Moving forward, researchers will face many potential pathways; eliminating those that are dead ends could expedite progress. This database would collect relevant experiences, allowing experts and the broader private sector to contribute their knowledge and insight. It would contain information about past ideas, projects, and possibly even the people responsible—helping to form the aforementioned partnerships key to D&D efforts. Although DOE and other government agencies have a long history of operating in this space, establishing database protocols is not a simple task. A complex balance will need to be struck between the open flow of information and the protection of business-sensitive data. Ultimately, this database could lead to widespread deployment and commercial growth. While admittedly difficult to implement, a smartly run knowledge database could underlie and support all D&D efforts.
Multi-disciplinary teams are needed specifically to address some of the key barriers surrounding catalysts. These teams would consist of the catalyst inventors, process engineers, and the companies that can mass produce the catalysts. Eventually, these entities are brought together on a project, but if BETO encourages their close interaction from the outset, many preventable issues could be avoided. In the future, after a number of successful collaborations, BETO would be able to readily identify potential partners to help the technology inventors advance their technology to commercial scale.
An integrated pilot-scale facility can be developed to validate technical data on catalysts for use in modeling larger scales and to enable construction of these larger plants. This data is critical to modeling and road mapping efforts. The development of a standardized pilot-scale testing facility would inform technologists, policy makers, and financiers about the technology. Such a facility could potentially lead to toll manufacturing as a commercialization method. This method obviates the vertical integration of biorefineries, instead allowing them to collect a flat fee per unit of product produced. Logistics and marketing would be handled by companies with expertise in the space, allowing biorefinery operators to focus on their core competency.
More broadly, a versatile user facility could be developed to validate scale-up activities. Regional facilities could leverage the purchase of both common and regional feedstock specific equipment. They would help subsidize development efforts and attract significant operational expertise. These pilot plant user facilities would validate technology for the developer, financiers, and partners, ultimately reducing risk and increasing the likelihood of
DEMONSTRATION AND DEPLOYMENT STRATEGY WORKSHOP
15
future successful commercialization efforts. This demonstration-scale partnership would have a plug-and-play aspect, whereby the technology developer would only need to provide equipment based on their technology, enabling a streamlined start up process.
5.2 Technical Barriers
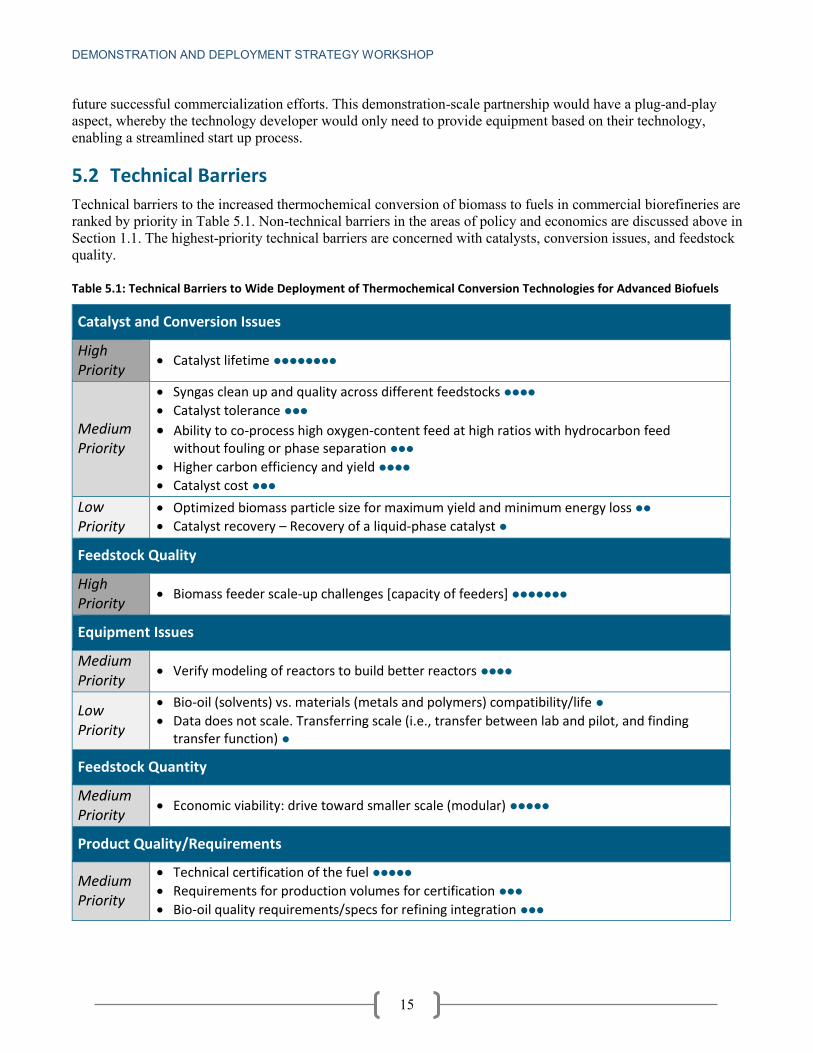
Technical barriers to the increased thermochemical conversion of biomass to fuels in commercial biorefineries are ranked by priority in Table 5.1. Non-technical barriers in the areas of policy and economics are discussed above in Section 1.1. The highest-priority technical barriers are concerned with catalysts, conversion issues, and feedstock quality. Table 5.1: Technical Barriers to Wide Deployment of Thermochemical Conversion Technologies for Advanced Biofuels
Catalyst and Conversion Issues
High Priority
Catalyst lifetime
Medium Priority
Syngas clean up and quality across different feedstocks
Catalyst tolerance
Ability to co-process high oxygen-content feed at high ratios with hydrocarbon feed without fouling or phase separation
Higher carbon efficiency and yield
Catalyst cost
Low Priority
Optimized biomass particle size for maximum yield and minimum energy loss
Catalyst recovery – Recovery of a liquid-phase catalyst
Feedstock Quality
High Priority
Biomass feeder scale-up challenges [capacity of feeders]
Equipment Issues
Medium Priority
Verify modeling of reactors to build better reactors
Low Priority
Bio-oil (solvents) vs. materials (metals and polymers) compatibility/life
Data does not scale. Transferring scale (i.e., transfer between lab and pilot, and finding transfer function)
Feedstock Quantity
Medium Priority
Economic viability: drive toward smaller scale (modular)
Product Quality/Requirements
Medium Priority
Technical certification of the fuel
Requirements for production volumes for certification
Bio-oil quality requirements/specs for refining integration

DEMONSTRATION AND DEPLOYMENT STRATEGY WORKSHOP
16
Infrastructure
Medium Priority
H2 demand/utilization
Low Priority
Supply chain development
Refinery integration – co-processing and distribution. Value chain integration
Biomass densification and upgrading – pretreatment
Waste Handling
Low Priority
Solid waste from pyrolysis and gasification – usage, reusability, disposal
Pyrolysis wastewater recycle reuse
Pyrolysis waste water characterization and treatment
Miscellaneous
Low Priority
Improved speed and reliability of trace contaminant analysis at TRL 5 and up
Flexibility in product slate: fuels versus biochemicals (overlapping barrier)
Feasibility of funding transition beyond lab technology readiness level 4/5
= 1 priority vote
5.3 Priorities for Advancement Activities
Advancement activities to address the key barriers to thermochemical processing of biomass into drop-in hydrocarbon biofuels fall within four priority topic areas. These topics are described below and in more detail in Appendix D, Tables D-4.1 through D-4.4.
RD&D Priorities
Conduct preliminary pilot-scale testing to measure the performance of catalysts: Technically feasible and economically viable (attractive) processes recommended for scale-up to demonstration. Catalyst performance is documented and validated for commercial catalyst production throughout the path to toll manufacturing. If integrated, pilot-scale testing is successful, it serves as a stage gate to future (unsolicited) funding for demonstrations. 8 votes
Encourage and support collaborative efforts to scale catalyst production and piloting: New catalysts will be scaled up by manufacturers and tested at pilot scale for yield and lifetime. 13 votes
Use the convening power of DOE to form technology development partnerships, further develop
existing pilot facilities, and expand them into demonstration-scale user facilities: Identify pilot plant user group facilities and coordinate research activities, reducing the risk for capital investors. Establish demonstration-scale user facilities, possibly by region or biomass type, that would leverage commonly needed equipment, such as water treatment or feed system operations. This should be done with private technology under development at reasonable cost. 18 votes
Analysis and Outreach Priorities
Develop a database of thermochemical technologies (by feedstock, process, and product) to enable
assembly of field and patent data from federally funded projects: Data gathered will support sharing lessons learned within the thermochemical working group to prevent “reinventing the wheel.” This will benefit biorefinery deployment by accelerating the discovery of compatible partners and technologies. 10
votes

DEMONSTRATION AND DEPLOYMENT STRATEGY WORKSHOP
17
6. Fuels via Thermochemical Conversion: Group B
6.1 Overview
Thermochemical conversion technologies can be categorized according to the fundamental fuel processing routes: pyrolysis, gasification, and other. The latter category includes such routes as hybrid thermochemical and biochemical processing, conversion of woody biomass to carbon, and conversion of ethanol to gasoline. Priority barriers to the increased deployment of thermochemical conversion technologies for biofuels include gas clean-up issues; the reliability and interoperability of unit operations; feedstock handling issues; catalyst development; economies of scale; intermediate handling; the unavailability of inexpensive renewable hydrogen (H2), and federal business processes. Exploration of these barriers reveals promising opportunities to facilitate advancements. Potential activities include efforts to improve or address (1) plant integration; (2) catalyst [development] issues; (3) feedstocks; (4) analytics to support scale-up demonstrations; (5) federal business processes; and (6) partnering (including foreign entities). BETO could expedite progress by expanding its support for the integration of thermochemical biomass conversion technologies at various scales. Operating integrated thermochemical technologies for an appropriate number of hours will generate the data and information needed to reduce technical and investment risk and foster increased support from the financial community.
Accelerating the development of catalysts will require an increase in catalyst manufacturing and demonstration activities at scale. Pilot- and commercial-scale catalyst manufacturing efforts are needed to move catalyst technologies from the lab bench to market. Support is also needed to test catalyst performance over the long term in realistic environments and to optimize catalysts, manufacturing processes and operations, and catalyst use.
Feedstock concerns focus on the lack of flexible processing systems and the inadequacy of current handling systems for loading biomass into thermochemical reactors, especially at the pilot scale or larger. All projects need systems that can handle biomass variations (e.g., in terms of shape/aspect ratio, grindability, density, contaminants, abrasiveness, moisture content, and ash [elemental components and volume]), yet no such systems/equipment are available. The federal government has an appropriate role in characterizing (as a baseline) existing feedstock systems (preprocessing, feeder) and in providing focused funding for improving system performance in this area. In addition, simulations and system studies are needed to identify the most efficient ways to use natural gas to supplement biomass or to improve conversion chemistry and/or heat integration. Other important needs are to characterize the materials of construction in existing processing plants (up to the reactor) and to collect/maintain information on problems or lessons learned with feedstock handling systems.
To assist new scale-up and demonstration efforts, improved system analytics could address the current inconsistencies in thermochemical processing technologies. In particular, the development of standards for techno-economic and process modeling could yield significant benefits for funded projects—avoiding the inconsistent results obtained when a variety of assumptions and methodologies are used. Examples from other DOE programs include Fuel Cell Technologies’ H2A model and Fossil Energy’s bituminous coal model.
The business processes of federal agencies (DOE, USDA, and EPA) can constitute a serious non-technical barrier. For example, the loan guarantee program is difficult to navigate, some projects present foreign investment strategies that do not fit federal guidelines, and standard industrial financing practices are often inconsistent with federal requirements. Improved federal business processes and best practices could help federal agencies keep pace with fast-moving changes in the business world and stay on the cutting edge of technology innovation. In

DEMONSTRATION AND DEPLOYMENT STRATEGY WORKSHOP
18
general, federal business processes should be streamlined as necessary or appropriate to align with the needs of the financial investment community, global business, and industry.
Success in the D&D Program requires the forging of strong partnerships and the development of large, interrelated teams with expertise in all facets of the biomass-to-biofuel supply chain. In evaluating proposals, DOE should give positive weighting to entities that strengthen competencies by forming partnerships, including partnerships with foreign firms—if that is the most effective way to acquire the best practices and/or financial support needed to lower project risks. Agencies could expedite D&D progress by revising application processes, exercising due diligence to identify gaps in applicant competencies, providing a global “dating service” for qualifying partners, and developing a library/clearinghouse to avoid redundancies in funded work.
6.2 Technical Barriers
Technical barriers to the increased thermochemical conversion of biomass to fuels in commercial biorefineries are ranked by priority in Table 6.1. Non-technical barriers in the areas of policy and economics are discussed above in Section 1.1. The highest-priority technical barriers to thermochemical conversion technologies are concerned with catalyst development, feedstock handling, the reliability and operability of unit operations, and gas clean-up. Table 6.1: Technical Barriers to Wide Deployment of Thermochemical Conversion Technologies for Advanced Biofuels
Reliability and Operability of Unit Operations
High Priority
Reliability or availability of operating unit
Medium Priority
Plant integration
Gas Clean-Up
High Priority
Ultra-hot syngas filtration
Medium Priority
Tar handling
Gasification – Syngas cleanup for downstream catalytic processes
Catalyst Development
High Priority
Catalyst robustness and stability: longevity cap ex and p ex
Feedstock Handling
High Priority
Feedstock handling system into gasifier/pyrolyzer
Intermediate Handling
Medium Priority
Stability-storage and corrosivity—material of construction compatible with HC’s phase separation

DEMONSTRATION AND DEPLOYMENT STRATEGY WORKSHOP
19
Economies of Scale
Medium Priority
Economics of scale
Availability of Cheap H2 (Renewable)
Medium Priority
Cheap H2 for onsite upgrade
Miscellaneous
Low Priority
Feedstock flexibility
Ash considerations with catalytic processing
Feedstock aggregation
P/G cost effective delivered biomass availability
Standardized, reviewed, third party techno-economic analysis-across platform
Concerns about complications of woody feedstocks/feedstock neutrality debate
Gasification; depends on type of gasifier, ash or slag variability, fusion temperature
Syngas to “whole barrel” drop-in product slate at reasonable cost
Understanding of co-processing of renewable and fossil intermediates
Water cleanup carbons contaminant removal
Gasification feedstock quality for consistent handling
= 1 priority vote
6.3 Priorities for Advancement Activities
A broad discussion of advancement activities needed to address barriers to the thermochemical conversion of biomass into drop-in hydrocarbon fuels resulted in five priority topic areas. These topics are described below and in more detail in Appendix D, Tables D-5.1 through D-5.5.
RD&D Priorities
Develop more versatile feedstock handling systems at pilot scale and larger: Strategies to ensure that the plant can operate at capacity, regardless of perturbances in the biomass (supply or physical/chemical characteristics). These strategies should consider new and better hardware, systems configuration, feedstock preprocessing, and/or procurement of better feedstock (including natural gas and coal as supplemental feeds). 8 votes
Provide facility or facilities for demonstrating catalyst manufacturing processes and evaluating catalyst
performance at scale: Validation of demonstration-scale performance (yield, selectivity, and lifetime) allowing/enabling financing of commercial plant. 8 votes
Establish plant integration facility for users to demonstrate acceptable plant uptime, product quality
and yield, and operating cost: Lower the risk of integrated plant operation so that investor funding becomes available for commercial deployment; investor funding is critical for initial deployment of multiple plants prior to large-scale commercialization. 14 votes
Analysis and Outreach Priorities
Establish best practices in partnering or gap filling to bolster experience, expertise, finances, etc.
(including foreign entities): In evaluations for funding, DOE should give positive weighting to entities that

DEMONSTRATION AND DEPLOYMENT STRATEGY WORKSHOP
20
source needed competencies from others by partnering, including outside the United States, if that is where best practices and/or financial support is most available; objective is to de-risk the development. 5 votes
Standardize analytics for techno-economic and process modeling: Better and consistent analytics will lower risks—both technical and economic—for project deployment; analytics would include standardized and consistent techno-economic analysis as well as process simulation and design. 5 votes

DEMONSTRATION AND DEPLOYMENT STRATEGY WORKSHOP
21
Appendix A: Attendee List
Breakdown by Affiliation: 110 Participants
Attendee List
First Name Last Name Affiliation
Zia Abdullah Battelle Memorial Institute
John Aikens Proterro
Masood Akhtar Bioenergy Deployment Consortium
Thomas Amidon SUNY-College of Environmental Science and Forestry
Amar Anumakonda UOP LLC, A Honeywell International Company
Rahul Basu DSM Bio-based Products & Services
Michael Bernstein* BCS, Incorporated
Wes Bolsen Cool Planet
Charles Bowman BCLF Corporation
Richard Brotzman Argonne National Laboratory
Craig Brown Catchlight Energy LLC
Robert Brown Iowa State University
Sabine Brueske* Energetics Incorporated
Bruce Bryan Gas Technology Institute
Marie Burkland BP
Vann Bush Gas Technology Institute
Ronald Cascone Nexant, Inc.
Mike Castle Strategic Solutions, LLC
Kevin Comer Antares Group Inc.

DEMONSTRATION AND DEPLOYMENT STRATEGY WORKSHOP
22
Anthony Crooks+ U.S. Department of Agriculture, Rural Development
Dan Cummings INEOS Bio
David Dayton RTI International
Dan Derr Logos Technologies
Richard Doctor E3Tec Services, LLC
Chris Doherty TRI, Inc.
Glenn Doyle U.S. Department of Energy, BETO
Jennifer Dunn Argonne National Laboratory
Jeffrey Elam Argonne National Laboratory
Christian Escher Husky Energy
Sidney Firstman ReGen Technology
Aaron Fisher* Energetics Incorporated
Gary Folkert Cargill
Jeff Fornero Glucan Biorenewables
Angela Foster-Rice+ United Airlines
Anthe George Sandia National Laboratories
Josh Gesick NREL
Paul Gilna Oak Ridge National Laboratory
David Glass Joule Unlimited Technologies, Inc.
Paul Grabowski U.S. Department of Energy, BETO
Kevin Gray+ BetaRenewables
William Gruber United Financial of Illinois, Inc.
Susan Hager Myriant Corporation
Fred Hansen* Energetics Incorporated
Donald Hanson Argonne National Laboratory
Alice Havill LanzaTech Inc
Paul Henkel DH Consulting
Jenny Herzfeld* Energetics Incorporated
Richard Hess Idaho National Laboratory
Stephen Hockett U.S. Department of Energy, BETO
Jennifer Holmgren+ LanzaTech Inc
John Howard III Coronal LLC
George Huff BP
Lonnie Ingram University of Florida
Douglas Jack Sundrop Fuels Inc.
Jeremy Javers ICM, Inc.
Edward Kalebich Sustainable Solutions 4E and QEST
Lisa Kamke Virent, Inc.
Kef Kasdin Proterro, Inc.
Stephen Kelley IBSS – NCSU
George Kervitsky* BCS, Incorporated
Jason Kester Southern Ohio Port Authority
Gozdem Kilaz Purdue University

DEMONSTRATION AND DEPLOYMENT STRATEGY WORKSHOP
23
Keith Kittrell KSE, Inc
Rick Knight Gas Technology Institute
Aspi Kolah Michigan State University
Stephen Korstad Coronal LLC
Caroline Kramer* Energetics Incorporated
Theodore Krause Argonne National Laboratory
Jason Kwiatkowski DSM
Shawn Lapean United Financial of Illinois, Inc.
Markus Lesemann RTI International
Elliott Levine U.S. Department of Energy, BETO
Sharyn Lie+ U.S. Environmental Protection Agency, Climate Econ
Yupo Lin Argonne National Laboratory
Christopher Lindsey Antares Group Inc.
Alex Macleod Natural Resources Canada
Tommi Makila* Energetics Incorporated
Jonathan Male+ U.S. Department of Energy, BETO
Terry Marker Gas Technology Institute
Ronald Meeusen+ Cultivian Sandbox Ventures, LLC
Loula Merkel Coskata
Landon Miller Aemerge
Liz Moore~ U.S. Department of Energy, BETO
Scott Morgan* Energetics Incorporated
Quang Nguyen Abengoa Bioenergy
Kevin O'Brien Illinois Sustainable Technology Center
Norm Olson Iowa Energy Center
George Parks FuelScience LLC
Kendra Parlock W.R. Grace
Hemant Pendse University of Maine
Chris Perkins Sundrop Fuels Inc.
Monica Peterlinz DSM
Mark Petri Iowa Energy Center
Craig Raddatz United Financial of Illinois, Inc.
Douglas Rivers ICM, Inc.
Michael Roberts Gas Technology Institute
Luis Rodriguez Illinois Sustainable Technology Center
Bob Rozmiarek Virent, Inc.
Kelly Russell INEOS Bio
Richard Simmons Purdue University
Samir Sofer ReGen Technology
Colin South Novogy Inc.
James Spaeth~+ U.S. Department of Energy, BETO
Bret Strogen DoD/Office of Operational Energy
Kimberly Swanson

DEMONSTRATION AND DEPLOYMENT STRATEGY WORKSHOP
24
Satish Tamhankar Linde LLC
Yannick Tamm* Energetics Incorporated
Travis Tempel~+ U.S. Department of Energy, BETO
Melissa Tiedeman > SRA International
Maobing Tu Auburn University
Meltem Urgun-Demirtas Argonne National Laboratory
Austin Vaillancourt Southern Research Institute
Hans van der Sluis+ POET-DSM
Michael Vevera Mercurius Biorefining
Paul Weider Shell International E&P
Paul Wever Chip Energy Inc.
Lysle Whitmer Iowa State University, BioEconomy Institute
Eric Wind Tyton BioEnergy Systems
Arthur Wiselogel CNJV
Elizabeth Woods Virent, Inc.
Patrick Woolcock Southern Research Institute
Mark Wright Iowa State University
May Wu Argonne National Laboratory
Bin Yang Washington State University
Jeffrey Yingling BCLF Corporation
Joshua Yuan Texas A&M Agrilife Synthetic and Systems Biology Innovation Hub
Kelly Zering North Carolina State University
Jenn ZiBerna > SRA International
* Facilitator + Speaker ~ Organizer > Support Staff
DEMONSTRATION AND DEPLOYMENT STRATEGY WORKSHOP
25
Appendix B: Acronyms BC Biochemical conversion BETO Bioenergy Technologies Office (EERE/DOE) CHP Combined heat and power DOE U.S. Department of Energy D&D Demonstration and deployment EERE Office of Energy Efficiency and Renewable Energy (DOE) EPA Environmental Protection Agency FOA Funding Opportunity Announcement gge Gallons of gas equivalent GHG Greenhouse gas IBR Integrated biorefineries MSW Municipal solid waste R&D Research and development RD&D Research, development, and demonstration RFI Request for Information RFS Renewable Fuels Standard RIN Renewable Identification Number STEM Science, Technology, Engineering, and Mathematics TC Thermochemical conversion TRL Technology readiness level USDA U.S. Department of Agriculture

DEMONSTRATION AND DEPLOYMENT STRATEGY WORKSHOP
26
Appendix C: Meeting Agenda Wednesday, March 12, 2014
Time Activity = auditorium = breakout rooms
7:30-8:30 am Registration and Coffee (APS Conference Center)
8:30 am Welcome and Opening Remarks
8:45 am
Bioenergy Technologies Office, Program Overview
Jonathan Male, Director, BETO: BETO Overview Jim Spaeth, Demonstration and Deployment Program Manager, BETO:
Successful IBR Demonstration: Lessons Learned, Challenges, and Future Needs
Travis Tempel, Technology Manager, BETO: Request for Information Results
9:45 am
Discussion Panel: Strategic Partnerships and Financing
Moderator: Jim Spaeth Kevin A. Gray, PhD, Vice President, Beta Renewables Ron Meeusen, Managing Partner, Cultivian Sandbox Ventures, LLC Hans van der Sluis, Joint Venture Director, POET-DSM Advanced Biofuels
10:45 am Break
11:00 am
Discussion Panel: D&D Industry Drivers
Moderator: Travis Tempel Anthony Crooks, PhD, Renewable Energy Policy Specialist, USDA Rural
Development Sharyn Lie, Director, U.S. EPA Climate Economics and Modeling Center Angela Foster-Rice, Managing Director Environmental Affairs &
Sustainability, United Airlines
12:00 pm Charge to Breakouts
12:15 pm Lunch (Gallery—Deli Buffet)
1:15 pm
Breakout Session I : State of Technology and Testing/Demonstration Needs
Five Breakout Groups: Feedstocks Products Fuels via Biochemical Conversion Fuels via Thermochemical Conversion, TC Group A Fuels via Thermochemical Conversion, TC Group B
2:15 pm Breakout Session II: Major Barriers to Advancement (same groups)
3:15 pm Break
3:30 pm Breakout Session III: Advancement Activities (same groups)
4:25 pm Transition to Main Room

DEMONSTRATION AND DEPLOYMENT STRATEGY WORKSHOP
27
4:35 pm Breakout Session Day 1 Reports
5:00 pm Adjourn Day 1
Thursday, March 13, 2014
Time Activity = auditorium = breakout rooms Starting 7:00am, pick up every 10 minutes
Shuttle Bus Transportation -- Argonne Guest House to Advanced Photon Source (APS) Conference Center
7:15-8:15 am Networking and Coffee
8:15 am Welcome Back
8:30 am Keynote Presentation
Jennifer Holmgren, Chief Executive Officer of LanzaTech
9:05 am Transition to Breakouts
9:15 am Breakout Session III Continued: Advancement Activities (same groups)
10:15 am Breakout Session IV: Advancement Activity Action Plans (same groups)
12:00 pm Lunch and Networking (Gallery—Boxed Lunch)
1:00 pm Breakout Session Day 2 Reports, Action Plans and Q&A
2:15 pm Closing Comments and Next Steps
2:30 pm Adjourn Workshop

DEMONSTRATION AND DEPLOYMENT STRATEGY WORKSHOP
28
Appendix D: Advancement Activities
Feedstocks
D-1.1: Publish Estimated Costs and Conversion Efficiencies by Feedstock and Conversion Process Each Year
D-1.2: Develop Fast, Simple, and Inexpensive Devices/Measures To Accurately Determine Feedstock Quality
D-1.3: Engage a Broader Spectrum of Biomass Feedstock Development Stakeholders To Accelerate Progress
D-1.4: Develop and Demonstrate Advanced Logistics Systems for Biomass Feedstocks
Products
D-2.1: Target Specific Platform Chemical Intermediates that Could Collectively Substitute for the Whole Barrel
D-2.2: Design Robust Processes To Transform Diverse Biomass Resources into Homogenous Intermediates, Enabling Component Separation for Further Processing
D-2.3: Clarify an Infrastructure Procurement Strategy for Biorefineries D-2.4: Demonstrate Separation Technologies at Pilot and Demonstration Scales D-2.5: Conduct Value Engineering on Specific Unit Operations D-2.6: Add Value to the Rest of the Bale, Specifically (Convert) Lignin
Fuels via Biochemical Conversion
D-3.1: Underwrite Activities To Bolster Investor Confidence and Market Pull; Validate the Technical and Economic Performance of These Technologies with a Focus on the End Customer
D-3.2: Establish a New Standard To Guide the Critical Review of Technical and Economic Metrics D-3.3: Co-Produce Multiple Bioproducts To Enhance Economic Stability D-3.4: Create a Cross-Platform Development Incubator D-3.5: Build on the Existing Ethanol Infrastructure D-3.6: Develop Metrics To Indicate the Technological Robustness of Organisms, Enzymes,
and Processes
Fuels via Thermochemical Conversion
D-4.1: Develop a Database of Thermochemical Technologies To Enable Assembly of Field and Patent Data from Federally Funded Projects
D-4.2: Encourage and Support Collaborative Efforts To Scale Up Catalyst Production and Piloting D-4.3: Conduct Preliminary Pilot-Scale Testing To Measure the Performance of Catalysts D-4.4: Use the Convening Power of DOE To Form Technology Development Partnerships,
Further Develop Existing Pilot Facilities, and Expand Them into Demonstration- Scale User Facilities
D-5.1: Establish Best Practices Partnering To Fill Gaps in Experience, Expertise, and Finances D-5.2: Develop More Versatile Feedstock Handling Systems at Pilot Scale and Larger D-5.3: Establish Plant Integration User Facility for Demonstrating finAcceptable Plant Uptime, Product
Quality, Yield, and Operating Costs D-5.4: Provide Facility or Facilities for Demonstrating Catalyst Manufacturing and
Evaluating Catalyst Performance at Scale D-5.5: Standardize Analytics for Techno-Economic and and Process Modeling

DEMONSTRATION AND DEPLOYMENT STRATEGY WORKSHOP
29
TABLE D-1.1 (FEEDSTOCKS): PUBLISH ESTIMATED COSTS AND CONVERSION EFFICIENCIES BY
FEEDSTOCK AND CONVERSION PROCESS EACH YEAR
Summary of Recommendation: Address lack of reliable, comprehensive, transparent, widely available information on costs and conversion efficiencies at each stage of the supply chain. Desired Outcome: Provide public references for benchmarking, conversion economics, investment decisions, and R&D targets so that private companies can elaborate on them.
Action Plan Steps
Near Term (0–3 years) Assemble a team of subject matter experts,
industry stakeholders, and representatives of government and academia to identify objective, relevant models of supply chains for a given end-product.
Create a single web portal for sharing the information and relevant assumptions (e.g., link to the Knowledge Discovery Framework [KDF]).
Longer Term (3+ years) Fund the program Maintain staff Continuously improve the models Validate the data and methods on an
ongoing basis/publish methodology document
Commission studies on emerging feedstocks, products, and markets
Interim Milestones and Results
Near Term (0–3 years) Identify entity to manage the program Identify models Circulate methodology for review by
stakeholders (public comment period) Agree on a methodology Integrate with EIA, USDA, and other existing
databases
Longer Term (3+ years) Routine updating Recurring validation of results Periodic reporting of trends or changes in
costs, efficiencies, and top opportunities and challenges—with links to existing product price reports
Metrics
Near Term (0–3 years) Team assembled Program manager appointed Funding received Team met Model and methodology accepted Results published
Longer Term (3+ years) Models and results updated every two years Additional process models published (on
feedstocks, logistics, conversion and product markets, prices)
Conduct annual situation and outlook meeting

DEMONSTRATION AND DEPLOYMENT STRATEGY WORKSHOP
30
TABLE D-1.2 (FEEDSTOCKS): DEVELOP FAST, SIMPLE, AND INEXPENSIVE DEVICES/MEASURES
TO ACCURATELY DETERMINE FEEDSTOCK QUALITY
Summary of Recommendation: Critical barriers: For all market participants in the biomass supply chain (regardless of
the feedstock being sold), the quality specifications are not readily understood by both parties. Simple, timely, verifiable
instruments are not available for use at points of collection, consolidation, delivery, or storage. [All-Customer Examples:
Ash, moisture, carbohydrates, metals, ammonia, chrome, pH, lignin. Specific-Customer Examples: Lipid content, water,
metal, (solution, cl) at all points of collection to delivery].
Desired Outcome: Instruments that can adapt to particular operations and are fast, reliable, mobile, low-cost, widely available, attachable to farm equipment, easy to use, and able to wirelessly transmit results/readings.
Action Plan Steps
Near Term (0–3 years) Participant agreement (suppliers and buyers) Develop a list of desirable specifications for each
feedstock and technology (conversion) For each property find proxy/surrogate that can be
tested easily and in a timely manner Set a standard specification (e.g., ASTM) Survey technology that can be quickly adopted Make sure the OEMs buy in Demonstrate biomass of a given specification or quality
in a pilot or commercial operation, (e.g., agricultural residue)
Longer Term (3+ years) Identify real time, cost effective, and
scalable solutions Develop national database for most
common feedstocks Identify best management practices
throughout supply chain Manufacturers expand tolerances to
increase feedstock volume Increase efficiency of collection to
meet the specifications
Interim Milestones and Results
Near Term (0–3 years) Lists of feedstock specs: 6 months Lists of proxy tests: 1 year Develop standard specs: 1 year Survey results of current technology that can be
adopted: 1.5 years Sign up OEM to perform demo: 2 years Demo results: 3 years
Longer Term (3+ years) Cost effective solutions Establishment of a regional or national
database Extensive education on best practices Expanded specs from users Improved collection/storage methods
Metrics
Near Term (0–3 years) Number of participants (buyer and supplier)
collaborating A joint specification Validated standard test method Number of OEMs signed up Number of demos
Longer Term (3+ years) Price of instruments Number of feedstock analyses/specs Number of farmers/suppliers adopting best the
practice New, more tolerant feedstock specs Improvement in quality of delivered feedstocks

DEMONSTRATION AND DEPLOYMENT STRATEGY WORKSHOP
31
TABLE D-1.3 (FEEDSTOCKS): ENGAGE A BROADER SPECTRUM OF BIOMASS FEEDSTOCK
DEVELOPMENT STAKEHOLDERS TO ACCELERATE PROGRESS
Summary of Recommendation: Coordinate development of feedstocks with input from multiple sectors,
including basic research through agronomic development to commercialization. DOE should serve as a nexus
to engage stakeholders and broaden their participation in planning and developing a reliable feedstock supply
chain
Desired Outcome: Develop a more integrated way to engage stakeholders to facilitate rapid deployment of the feedstock supply chain for biorefinery projects.
Action Plan Steps
Near Term (0–3 years) Convene a workshop (similar to this one) that brings
together other stakeholders (e.g., DOE Office of Science, USDA, EPA) to better inform BETO on feedstock objectives, barriers, and solutions
Develop, publish, and maintain a “clearing house” of information on:
− What research is ongoing − Who the experts are − Other D&D activities, etc.
Establish an interagency working group across all relevant agencies and R&D organizations
Longer Term (3+ years)
Interim Milestones and Results
Near Term (0–3 years) Publish outcomes of the workshop Release version 1.0 of website with
details Select working group expert members
Longer Term (3+ years)
Metrics
Near Term (0–3 years) Number of attendees Number of feedstocks evaluated Date released
Longer Term (3+ years)

DEMONSTRATION AND DEPLOYMENT STRATEGY WORKSHOP
32
TABLE D-1.4 (FEEDSTOCKS): DEVELOP AND DEMONSTRATE ADVANCED LOGISTICS SYSTEMS
FOR BIOMASS FEEDSTOCKS
Summary of Recommendation: Critical Barriers: Feedstock cost, the availability and reliability of supply, and
consistency of feedstock quality; the approach is two-pronged:
1. Incubation to identify, discover, & develop new approaches to supply feedstocks in the context of the critical barriers 2. Demonstration and optimization of near-term, commercial-ready equipment assembled in functioning logistic systems
Desired Outcome: Increase the rate of developing feedstock supply systems that can achieve cost, availability/
reliability and consistency (quality) in parallel (i.e., cattle feed and biopower/CHP markets) with the development of biorefineries, so the system is deployment-ready when the biorefinery is ready
Action Plan Steps
Near Term (0–3 years) Integrated feedstock supply system
demonstrations for existing biomass markets (i.e., animal feed, heat/power, etc.)
Identify and qualify acceptable markets for demonstrations at various scales
Quantify costs and opportunities to improve cost/quality at the demonstration scale
Identify “commercial ready” equipment/systems that can reliably supply the off-take market
Issue Incubator FOA for innovative feedstock supply processes and equipment
Longer Term (3+ years) Demonstrate “Advanced” supply designs for
existing biomass markets and identify available biorefinery opportunities
Develop and support advances in manufacturing of new technologies, processes, and equipment for supply systems
Develop the new support services industry for feedstock data collection, analysis, and quality assessment
Continue incubator activities for debugging advanced systems
Interim Milestones and Results
Near Term (0–3 years) Identify end users and off-take requirements Initiate demonstration/deployment feedstock supply projects Establish framework to collect and report project performance
data for modeling/analysis Qualify the biomass off-take market as to be used by
biorefineries Use of niche demonstration experiences to identify innovations
and targets for development
Longer Term (3+ years) Integration of biorefineries into
off-take markets Refine/modify specifications to
meet biorefinery requirements at scale
Achieve full biorefinery supply scale
Metrics
Near Term (0–3 years) Cost of supply system Reliability of system Quality of product supplied
Longer Term (3+ years) Same as left only with advanced system that
are better, faster, cheaper

DEMONSTRATION AND DEPLOYMENT STRATEGY WORKSHOP
33
TABLE D-2.1 (PRODUCTS): TARGET SPECIFIC PLATFORM CHEMICAL INTERMEDIATES THAT COULD COLLECTIVELY SUBSTITUTE FOR THE WHOLE BARREL
Summary of Recommendation: To focus chemicals from biomass on a shorter list of target products (primary
fuel, co-products) that can replace the whole barrel. Co-products drive economics and need acute focus.
Desired Outcome: Better defined focus will help us to meet deployment targets for replacing the whole barrel. Consistent policy on this will stimulate private investment.
Action Plan Steps
Near Term (0–3 years)
Determine specific chemicals to produce based on sound techno-economic analysisand current state of technology.
Pair research with existing pilots to demonstrate integrated operations
Longer Term (3+ years)
Hold course on 0–3-year focus Incentivize the build-out
Interim Milestones and Results
Near Term (0–3 years) Prioritize list and strategy to get there From the list, identify technologies that
should be moved to demonstrations Identify and publicize the available sites Define process for companies to interact,
leading to demonstrations
Longer Term (3+ years) Write policy that is stable through multiple
administrations
Metrics
Near Term (0–3 years) Set a date for producing a documented list Set a date for tech ID Set a date for others as well Determine when the entire process should
be completed (through the first round of demonstrations)
Longer Term (3+ years) Are we still focused and building out in 3+
years?
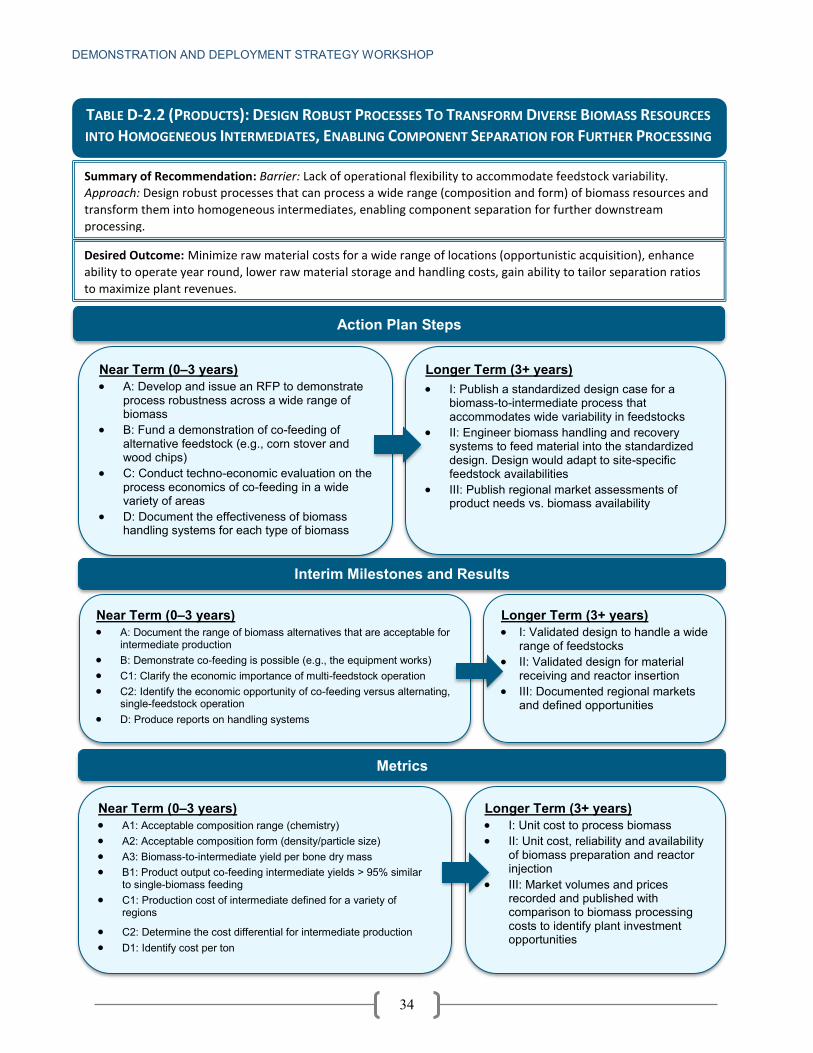
DEMONSTRATION AND DEPLOYMENT STRATEGY WORKSHOP
34
TABLE D-2.2 (PRODUCTS): DESIGN ROBUST PROCESSES TO TRANSFORM DIVERSE BIOMASS RESOURCES
INTO HOMOGENEOUS INTERMEDIATES, ENABLING COMPONENT SEPARATION FOR FURTHER PROCESSING
Summary of Recommendation: Barrier: Lack of operational flexibility to accommodate feedstock variability.
Approach: Design robust processes that can process a wide range (composition and form) of biomass resources and
transform them into homogeneous intermediates, enabling component separation for further downstream
processing.
Desired Outcome: Minimize raw material costs for a wide range of locations (opportunistic acquisition), enhance
ability to operate year round, lower raw material storage and handling costs, gain ability to tailor separation ratios
to maximize plant revenues.
Action Plan Steps
Near Term (0–3 years) A: Develop and issue an RFP to demonstrate
process robustness across a wide range of biomass
B: Fund a demonstration of co-feeding of alternative feedstock (e.g., corn stover and wood chips)
C: Conduct techno-economic evaluation on the process economics of co-feeding in a wide variety of areas
D: Document the effectiveness of biomass handling systems for each type of biomass
Longer Term (3+ years) I: Publish a standardized design case for a
biomass-to-intermediate process that accommodates wide variability in feedstocks
II: Engineer biomass handling and recovery systems to feed material into the standardized design. Design would adapt to site-specific feedstock availabilities
III: Publish regional market assessments of product needs vs. biomass availability
Interim Milestones and Results
Near Term (0–3 years) A: Document the range of biomass alternatives that are acceptable for
intermediate production B: Demonstrate co-feeding is possible (e.g., the equipment works) C1: Clarify the economic importance of multi-feedstock operation C2: Identify the economic opportunity of co-feeding versus alternating,
single-feedstock operation D: Produce reports on handling systems
Longer Term (3+ years) I: Validated design to handle a wide
range of feedstocks II: Validated design for material
receiving and reactor insertion III: Documented regional markets
and defined opportunities
Metrics
Near Term (0–3 years) A1: Acceptable composition range (chemistry) A2: Acceptable composition form (density/particle size) A3: Biomass-to-intermediate yield per bone dry mass B1: Product output co-feeding intermediate yields > 95% similar
to single-biomass feeding C1: Production cost of intermediate defined for a variety of
regions
C2: Determine the cost differential for intermediate production D1: Identify cost per ton
Longer Term (3+ years) I: Unit cost to process biomass II: Unit cost, reliability and availability
of biomass preparation and reactor injection
III: Market volumes and prices recorded and published with comparison to biomass processing costs to identify plant investment opportunities

DEMONSTRATION AND DEPLOYMENT STRATEGY WORKSHOP
35
Title 3 efforts
TABLE D-2.3 (PRODUCTS): CLARIFY AN INFRASTRUCTURE PROCUREMENT STRATEGY FOR
BIOREFINERIES (E.G., A GREEN MANHATTAN EFFORTS FOCUS)
Summary of Recommendation: Meeting the 2022 goal of 16 billion gallons per year of cellulosic biofuels will require
about 530 30-million-gallons-per-year plants; A) Current feedstock collection and consolidation companies and
equipment are insufficiently mechanized and organized; B) Basic materials suppliers and sub-systems are currently
insufficiently organized to build this number of plants within the context of the rest of the U.S. industrial base; C) No
defined, one-condition regulatory structure (standards, buyer and user incentives) currently exists to support this volume
of bio-fuels production. Thus, we need a plan (“a Green Manhattan Project”) focused on incentives that prioritize
consistent choices and capital allocations over a longer time horizon.
Desired Outcome: A combination of tax incentives and regulatory and permitting practices that favor this “Green
Manhattan Project” and prioritize consistent choices by all market participants—without forcing them.
Action Plan Steps
Near Term (0–3 years) 1: Realistically survey inventories of available technologies,
companies, and capacities that address A, B, and C (above)
2: Develop SWOTs (strengths, weaknesses, opportunities, and threats) for A, B, and C and facts required to support decisions
3: Develop tax incentive programs that induce choices without forcing (market-driven choices, not selecting winners and losers)
Fund (1) and (2): subsidize as necessary the development of some elements across A, B, and C
Longer Term (3+ years) Adjust incentives slowly
and carefully where choice disincentives materially distort other
Interim Milestones and Results
Near Term (0–3 years) 1: a) Understand the necessary conditions to get this “Green Manhattan
Project” qualified as a Title III project b) Get it qualified as a Title III project
2: Create the facts needed to determine and justify a program of tax incentives that “induce” priorities and choices across A, B, and C
3: Refine research objectives and project scope to increase “speed, breadth, and depth” of the program
Longer Term (3+ years) Minimized market
distortions, studies, and adjusted incentives
Metrics
Near Term (0–3 years) 1: Phase-gated plan and results
2: Phase–gated plan and results
3: Actions
Longer Term (3+ years) Cost of elements across A, B and C

DEMONSTRATION AND DEPLOYMENT STRATEGY WORKSHOP
36
TABLE D-2.4 (PRODUCTS): DEMONSTRATE SEPARATION TECHNOLOGIES AT PILOT AND DEMONSTRATION SCALES
Summary of Recommendation: Separations are often the most technically challenging and expensive aspects
of bioprocessing
Desired Outcome: Demonstrate and deploy economically and environmentally optimized, integrated separations systems for processing a variety of feedstocks into bio-based products.
Action Plan Steps
Near Term (0–3 years) Identify available separations technologies and the
attributes of analysis [for dilute aqueous systems, dilute organic systems, chemical and physical properties of biomaterials, gross separations vs. polishing, etc.].
Develop models/explore reactive separations Propose innovations to improve existing separations
technologies Establish optimum scale of the technology Demonstrate attractive innovations; champion
systems
Longer Term (3+ years) Validate models based on
demonstration data; demonstrate predictability and batch vs. continuous
Develop new separations systems
Demonstrate more reactive separations (process intensifications)
Demonstrate continuous processes
Interim Milestones and Results
Near Term (0–3 years) Benchmark current technologies Selection of widely applicable baseline for techno-economic
analysis (TEA), life-cycle assessment (LCA), and financial models allowing for comparisons between products and processes
Develop matrix of technologies vs. product or intermediate Evaluate scalability, select champion systems Operational data/control wide
Longer Term (3+ years) Articulated model options Prototypes/pilots/demonst
rations with improved energy efficiency
Established best practices (e.g., metal ions from water)
Metrics
Near Term (0–3 years) Efficiency, yield, cost (price), purity Interferences Scale factor Energy efficiency Demonstrate process in control reporting
Longer Term (3+ years) Capital cost Batch vs. continuous Preventative maintenance cycle

DEMONSTRATION AND DEPLOYMENT STRATEGY WORKSHOP
37
TABLE D-2.5 (PRODUCTS): CONDUCT VALUE ENGINEERING ON SPECIFIC UNIT OPERATIONS
Summary of Recommendation: Barrier: Current process units are not optimized for the bioenergy industry.
Approach: Decrease capital and operational costs and increase robustness through unit operations by the use
of equipment specifically tailored to the process.
Desired Outcome: Decreased capital and operational costs due to the increased performance capability and
efficiency of individual units. Development of standard performance metrics and accompanying analytical
techniques for each unit operation (e.g., NREL, LOPs)
Action Plan Steps
Near Term (0–3 years) Test unit operations to provide a basis for
comparing unit performance of model systems (comparing performance and cost-effectiveness of technologies for separation, etc.)
Establish clear accounting of the impacts of upstream process conditions on downstream performance and product quality
Develop prototype equipment that is specifically designed to address troubling or limiting unit operations
Longer Term (3+ years) Extend testing results to larger systems
for continuous improvement
Create a center of excellence for optimizing unit operations
Interim Milestones and Results
Near Term (0–3 years) Report on energy and material balances,
capital cost, and maintenance
List identifying “high intensity” unit operation in current processes
Longer Term (3+ years) Define categories for centers for excellence
Metrics
Near Term (0–3 years) Standard report at defined frequency to
measure pre-determined metrics
Standard analytic procedures for measuring performance
Measures of operational robustness (cost, maintenance, uptime)
Longer Term (3+ years) Implementation schedule with specific and
measurable items

DEMONSTRATION AND DEPLOYMENT STRATEGY WORKSHOP
38
of GHG emissions reductions schemes. Decreases capital cost of plant.
TABLE D-2.6 (PRODUCTS): ADD VALUE TO THE REST OF THE BALE, SPECIFICALLY LIGNIN CONVERSION
Summary of Recommendation: Conduct R&D on lignin conversion technologies so that a significant portion of feedstock moving through the supply chain will no longer have a low-value end use (i.e., “deadweight”).
Desired Outcome: Enable economical production of high-value lignin-based products to improve the profitability of biorefineries that can sell low-cost alternative fuels (lower CAPEX).
Action Plan Steps
Near Term (0–3 years) Improve technologies for the separation and clean-up/pretreatment of
lignin
Demonstrate pyrolysis and gasification units for lignin at TRL 7
Identify limitations to lignin conversion routes that are near commercial
Conduct comprehensive analysis of lignin conversion technologies
(including TRL level)
Create standard specifications for lignin that can be converted into high-
value products
Conduct techno-economic analyses of lignin conversion pathways
Make selling lignin to current users (power plants, pellet plants) a focus of
implementation in the near term and allow it to stay within the boundary
Longer Term (3+ years) Assess carbon and energy
performance of various lignin pathways
Develop robust catalyst(s) to convert lignin to high-value products
Identify key limitations of scaling up lignin conversion processes
Pilot lignin-based products in intended applications
Interim Milestones and Results
Near Term (0–3 years) Demonstrate separation technologies to meet specifications Demonstrate pyrolysis and gasification of lignin and assess product quality Produce framework and comprehensive report on technical barriers,
economic feasibility of lignin conversion pathways Publish specifications (e.g., tolerances of various contaminants) needed for
each conversion processes Develop preliminary techno-economic analysis (TEA) model for multiple
pathways
Longer Term (3+ years) Expand TEA to include carbon
and energy Identify viable catalyst(s) Develop comprehensive list of
limitations to scale up in plant Utilize half of lignin in biofuel
industry for a higher-value purpose
Metrics
Near Term (0–3 years) Identify pathway(s) to double the current value of
lignin (i.e., as a boiler feedstock)
Characterize quality of lignin input, product output, conversion efficiency for x hours and value
Publish report that clearly identifies technical barriers to multiple pathways with publicly available TEA model
Longer Term (3+ years) Catalyst lifetime of 1000 hours
Lignin is a value-added product for biorefineries contributing to success/profitability
(Economy-wide) Estimate market size and potential metrics for lignin-derived products
(Unit) Measure value and volume of lignin-derived product from demonstration unit

DEMONSTRATION AND DEPLOYMENT STRATEGY WORKSHOP
39
TABLE D-3.1 (FUELS VIA BC): UNDERWRITE ACTIVITIES TO BOLSTER INVESTOR CONFIDENCE AND MARKET PULL; VALIDATE THE TECHNICAL AND ECONOMIC PERFORMANCE
OF THESE TECHNOLOGIES WITH A FOCUS ON THE END CUSTOMER
Summary of Recommendation: The critical barrier to commercialization of new technologies is lack of investor confidence and lack of market pull for the technology. DOE BETO can support new technologies by underwriting the technical and economic validation of these technologies with an emphasis on end customer requirements. Desired Outcome: Creating a model for success tech to market deployment.
Action Plan Steps
Near Term (0–3 years) 1. Hold meeting to obtain input from market stakeholders
(buyers and sellers) on specific needs and hurdles (technical/regulatory/ economic) that can be overcome
1a. Use stakeholder input as a match-making tool to link buyers and sellers (e.g., matching interface)
2. Structure a program that takes existing grant funding and re-deploys it as an “insurance fund” to directly address market acceptance and investor confidence; this leverages existing funding for broader use (e.g., 5x nominal grant $ value)
Promulgate RFP and select awardees for “insurance policy”
Commercial (FOA) transactions performed under insurance fund
Longer Term (3+ years)
If model works, then funding is available for subsequent FOAs after a defined time period. Reassess available funds and repeat FOA process for new technologies
Interim Milestones and Results
Near Term (0–3 years) 1. Stakeholder meeting in the next month 2. Issue FOA in October 3. Select awardees by March 2015 4. By March 2017 have commercial volumes of high-quality, cost-effective
hydrocarbon biofuels ---------------------------------------------------
1. Obtain sufficient feedback 1a. Establish collaborations via interface 2. Write and issue FOA; 2a. Develop risk metrics for projects and to size program 3. Select and award 4. Volume flowing
Longer Term (3+ years)
Assess number of new commercial relationships and transactions
Count # of pathways funded
Metrics
Near Term (0–3 years) Number of stakeholders
Number of applications
Number of awardees
Volume of biofuels
Longer Term (3+ years) Metrics
− Biofuels commercially sold
− Efficiency of $ deployed (lost)
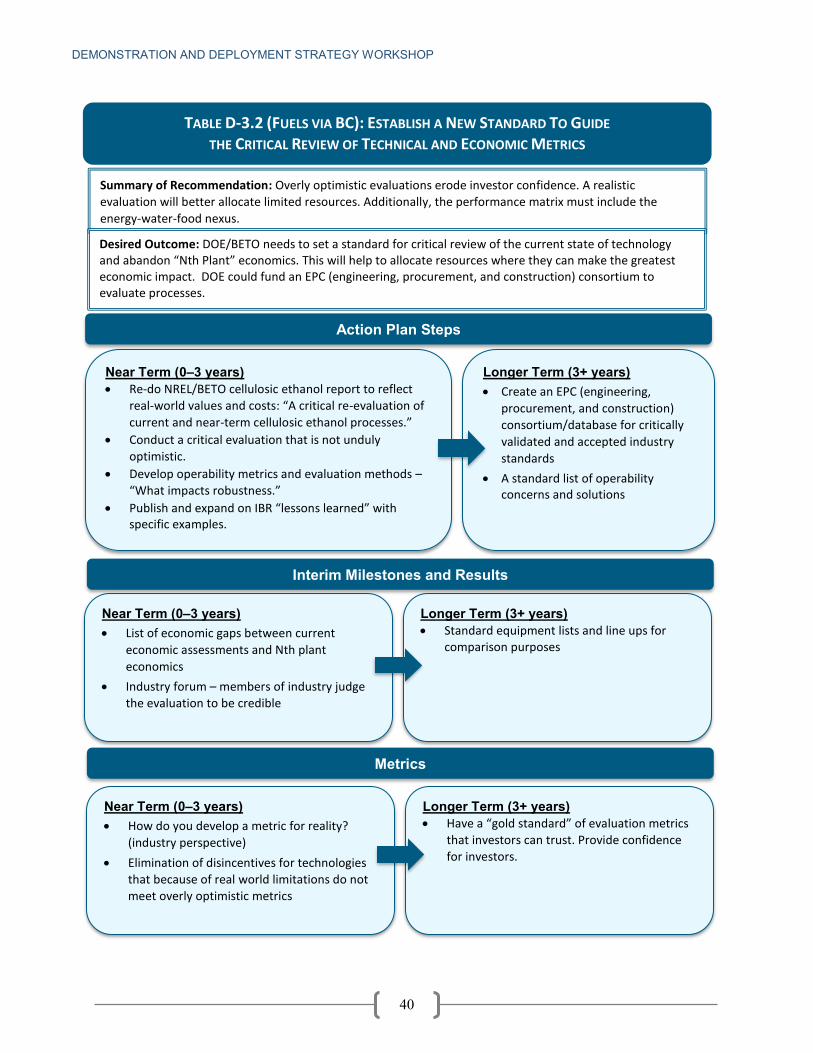
DEMONSTRATION AND DEPLOYMENT STRATEGY WORKSHOP
40
TABLE D-3.2 (FUELS VIA BC): ESTABLISH A NEW STANDARD TO GUIDE THE CRITICAL REVIEW OF TECHNICAL AND ECONOMIC METRICS
Summary of Recommendation: Overly optimistic evaluations erode investor confidence. A realistic
evaluation will better allocate limited resources. Additionally, the performance matrix must include the
energy-water-food nexus.
Desired Outcome: DOE/BETO needs to set a standard for critical review of the current state of technology and abandon “Nth Plant” economics. This will help to allocate resources where they can make the greatest economic impact. DOE could fund an EPC (engineering, procurement, and construction) consortium to evaluate processes.
Action Plan Steps
Near Term (0–3 years) Re-do NREL/BETO cellulosic ethanol report to reflect
real-world values and costs: “A critical re-evaluation of
current and near-term cellulosic ethanol processes.”
Conduct a critical evaluation that is not unduly
optimistic.
Develop operability metrics and evaluation methods –
“What impacts robustness.”
Publish and expand on IBR “lessons learned” with specific examples.
Longer Term (3+ years) Create an EPC (engineering,
procurement, and construction)
consortium/database for critically
validated and accepted industry
standards
A standard list of operability concerns and solutions
Interim Milestones and Results
Near Term (0–3 years) List of economic gaps between current
economic assessments and Nth plant
economics
Industry forum – members of industry judge
the evaluation to be credible
Longer Term (3+ years) Standard equipment lists and line ups for
comparison purposes
Metrics
Near Term (0–3 years) How do you develop a metric for reality?
(industry perspective)
Elimination of disincentives for technologies
that because of real world limitations do not
meet overly optimistic metrics
Longer Term (3+ years) Have a “gold standard” of evaluation metrics
that investors can trust. Provide confidence
for investors.

DEMONSTRATION AND DEPLOYMENT STRATEGY WORKSHOP
41
TABLE D-3.3 (FUELS VIA BC): CO-PRODUCE MULTIPLE BIOPRODUCTS TO ENHANCE ECONOMIC STABILITY
Summary of Recommendation: Economic limitations of a single-product line; co-production of multiple
bioproducts to enhance economic stability.
Desired Outcome: DOE supports technology development of co-products along with biofuel production on a
“scalable” platform to demonstrate economic viability. Secure investor(s) by demonstrating accelerated
commercial pathway and providing product samples that show cost competitiveness in the market.
Action Plan Steps
Near Term (0–3 years) Fund potential teams to participate in
developing multiple-product processes (new grand ideas).
Create consortium of manufacturers, suppliers, and users to help support multiple product development. It will provide advice and may bring potential financial support.
Longer Term (3+ years) Support industrial sector to install
technology demonstration at existing manufacturing sites.
Support large-volume product to validate potential consumer market.
Interim Milestones and Results
Near Term (0–3 years) Establish TRL 6 technology and process
pathways. Industrial groups adapt new technologies for
producing multiple co-products
Longer Term (3+ years) Prove economic viability by industrials. Secure market distribution pathway.
Metrics
Near Term (0–3 years) Demonstration of TRL 6 technology and
process with TEA Number of partnerships by industrials
Longer Term (3+ years) Commercial distribution of end products

DEMONSTRATION AND DEPLOYMENT STRATEGY WORKSHOP
42
TABLE D-3.4 (FUELS VIA BC): CREATE A CROSS-PLATFORM DEVELOPMENT INCUBATOR
Summary of Recommendation: Large volumes (e.g., >1000 gals.) are cost-prohibitive for a single entity to
produce; large volumes require partnering and access to appropriate intermediates or processing
technologies/operations.
Create a cross-platform development incubator to accelerate commercialization.
Desired Outcome: Incubator that facilitates partnerships and leverages existing infrastructure
Action Plan Steps
Near Term (0–3 years) Identify intermediates and existing process technology capabilities
Set aside funding for supplemental operations for 5 years
Assess location (entirely co-located vs. separate); greenfield and brownfield; and access to feedstocks
Establish framework for creating incubators: matchmaking, published list of capabilities (joint centers for scale-up)
Solicit users for incubator
Determine general features needed in an incubator that will inform site selection: onsite technical support, nearby companies, environmental permitting and feedstock offtake/ intake agreement availability
Longer Term (3+ years) Ongoing operations to support
supplemented activities
Support continuous improvement of site; fund modifications and operations
Maintain flexibility to repurpose as needs change
Assess technologies; hold review by cross-functional team
Benchmark facility to gauge relevance
Expand/facilitate additional interest in product samples
Interim Milestones and Results
Near Term (0–3 years) List of capabilities
Framework for centers
Locations
Funding
Users/”Customers” lined up
Framework for managing IP across participants
Longer Term (3+ years) One successful incubator (assess for feasibility
of expansion
Production volume target
Metrics
Near Term (0–3 years) Degree of flexibility
Number of potential users
Framework/charter
Diversity of partners
Longer Term (3+ years) Number of graduated technologies
Sustainable utilization (preferred growth
Hours of operation
Percentage of asset utilization
Number of parties served (tech developers, customers/end-users)

DEMONSTRATION AND DEPLOYMENT STRATEGY WORKSHOP
43
TABLE D-3.5 (FUELS VIA BC): BUILD ON THE EXISTING ETHANOL INFRASTRUCTURE
Summary of Recommendation: Develop cellulosic sugars as a commodity, catalytic upgrading of ethanol;
synergistic/co-development of other hydrocarbons. Identify and develop co-products.
Desired Outcome: Commodity sugar platform to reduce risk for new biofuel production. Leverage existing
know-how to create new market opportunities for ethanol (corn ethanol industry). Use CO2 and lignin to
produce new fuels.
Action Plan Steps
Near Term (0–3 years) Incentive to reduce risk for new users/adopters for
higher-value fuels and chemicals
Loan guarantees/limited tax credits
Process warranty (partial)/floor product price
Develop economic feasibility of catalytic upgrading
Fund at $10 MM over 3 years
Define lignin value for fuels, fibers, other co-products
Fund at $10 MM over 3 years
Longer Term (3+ years) Two platforms
− Ethanol to fuels + chemicals
− Sugars to fuels + chemicals
Replace the whole barrel
Interim Milestones and Results
Near Term (0–3 years) Develop 10 sugar facility projects
New products − Capex/Opex sugar production
− Capex/Opex “bioprocess” production or catalytic production
Longer Term (3+ years) Deploy 3-5 facilities Integrate catalytic upgrading and co-products
as feasible Develop fuels and fibers as market products
Metrics
Near Term (0–3 years) Evaluate project feasibility
Petroleum displaced
Carbon yield increase
Energy balance
Longer Term (3+ years) Facilities developed Reduced complexity Measure plant start to full operation Volume to value of products Price to value Potential to expand Compare capital and operating expenditures (Capex/Opex)

DEMONSTRATION AND DEPLOYMENT STRATEGY WORKSHOP
44
TABLE D-3.6 (FUELS VIA BC): DEVELOP METRICS TO INDICATE THE TECHNOLOGICAL ROBUSTNESS
OF ORGANISMS, ENZYMES, AND PROCESSES
Summary of Recommendation: Lack of useable and enforceable metrics for industrial robustness of
organisms, enzymes, and processes
Desired Outcome: End-point metrics and validation protocols for robustness
Action Plan Steps
Near Term (0–3 years) Support development and demonstration of
technologies that improve project robustness
Assess performance of organisms under process contaminant loading typically seen in industrial fermentation
Evaluate performance of enzyme systems under “dirty” process conditions
Ensure plant-wide modeling of reliability using industry specific data (mean time between failures, etc.)
Longer Term (3+ years) Support technology for genetic stability in
genetically modified organisms Develop new platforms operating over
broader process environment (temperature, pH, shear stress)
Establish tolerance to inhibitors to reduce upstream costs and increase robustness
Minimize by-product fermentation by organisms and enzymes
Interim Milestones and Results
Near Term (0–3 years) Share lessons learned on industrial
robustness in previous IBRs Publish roadmap for key technology targets
Longer Term (3+ years) Publish database of performance of key
technologies Incorporate metrics into plant reliability
modeling
Metrics
Near Term (0–3 years) Consistent process yield under expected
range of operating conditions and catalyst (enzyme) lifetime
Longer Term (3+ years) Tolerable operating range

DEMONSTRATION AND DEPLOYMENT STRATEGY WORKSHOP
45
TABLE D-4.1 (FUELS VIA TC A): DEVELOP A DATABASE OF THERMOCHEMICAL TECHNOLOGIES (BY FEEDSTOCK, PROCESS, AND PRODUCT) TO ENABLE ASSEMBLY OF FIELD AND PATENT DATA
FROM FEDERALLY FUNDED PROJECTS
Summary of Recommendation: Compatible partners and thermochemical technologies can be difficult to
find. Develop a “KDF” database of thermochemical technologies (targeted to different feedstocks, processes,
and products) that assembles field and patent data from DOE-funded projects and funding agencies.
Desired Outcome: Data gathered will support sharing lessons learned within the thermochemical working group to prevent “reinventing the wheel.” This will benefit biorefinery deployment by accelerating the discovery of compatible partners and technologies.
Action Plan Steps
Near Term (0–3 years) Scope out data collection and work plan Identify working group Populate database with publically available
data related to thermochemical data Identify data sources Analyze data gathered to provide guidance Secure federal funding over five years Provide secure access to the online
database
Longer Term (3+ years) Expand database to other BETO
technologies (biochemical conversion, hybrids, etc.)
Continue to update existing records Continue to add features and improve
usability Host workshops with modeling groups to
present the data
Interim Milestones and Results
Near Term (0–3 years) Assembled database Assembled working group Major pathways incorporated Interim report peer reviewed Identified hosting space/group Online database rollout
Longer Term (3+ years) Meeting with groups representing other
platforms in BETO Database expanded to other platforms Second version released National workshop hosted
Metrics
Near Term (0–3 years) Positive response from working group Number of database pathways incorporated Database access records
Longer Term (3+ years) Number of data base records and
technologies expanded Database access records

DEMONSTRATION AND DEPLOYMENT STRATEGY WORKSHOP
46
TABLE D-4.2 (FUELS VIA TC A): ENCOURAGE AND SUPPORT COLLABORATIVE EFFORTS TO SCALE UP CATALYST PRODUCTION AND PILOTING
Summary of Recommendation: Lack of connection among catalyst manufacturers, process inventors, and
developers in DOE-funded programs; high financial and technical risks for all parties on a team. Approach:
Encourage collaborative teams that enable catalyst developers to make meaningful contributions. Desired Outcome: New catalysts will be scaled up by manufacturers and tested at pilot scale for yield and lifetime.
Action Plan Steps
Near Term (0–3 years) BETO should issue FOAs requiring that proposed teams include
− Catalyst inventors/developers (may be the same
organization as below)
− Catalyst manufacturer with proven ability to scale up (may
be same organization as above)
− End user who can develop the technology (process using the
catalyst) at pilot scale and beyond
Project management structure should enable catalyst
manufacturer to be a service provider (minimize onerous
accounting audits and reporting)
Longer Term (3+ years) Develop a “stable” of
industrial catalyst
manufacturers similar to
EERE’s “SSL” (solid state
lighting) Program
Interim Milestones and Results
Near Term (0–3 years) Produce minimum quantity (e.g., 10–1000 kg) at
designated final particle size
Demonstrate stable, continuous operation of catalyst in
pilot (or larger-scale) process
Viable catalyst cost and total process operating cost
Longer Term (3+ years) List/database of
participating/approved catalyst
manufacturers and process
operators (catalyst users)
Metrics
Near Term (0–3 years) Quantity (mass or volume) of catalyst
Hours on stream at or above required
productivity
Total cost of production (e.g., $/gallon)
Longer Term (3+ years) Number of participants
Time to market
Percentage of projects reaching a certain TRL level

DEMONSTRATION AND DEPLOYMENT STRATEGY WORKSHOP
47
TABLE D-4.3 (FUELS VIA TC A): CONDUCT PRELIMINARY PILOT-SCALE TESTING TO MEASURE THE PERFORMANCE OF CATALYSTS
Summary of Recommendation: A variety of thermochemical pathways has been identified to help BETO achieve the $3/gge by 2017 target. These TC processes all require catalysts for conversion to liquids or upgrading intermediates to fuel. Integrated pilot-scale testing of catalyst performance is paramount for collecting reliable engineering data to validate technical and economic models to guide future engineering design for scale-up and demonstration. Desired Outcome: Technically feasible and economically viable (attractive) processes recommended for scale-up to demonstration. Catalyst performance is documented and validated for commercial catalyst production path to toll manufacturing. If integrated pilot-scale testing is successful, it serves as a stage gate to future (unsolicited) funding for demonstration.
Action Plan Steps
Near Term (0–3 years) RFI to identify suitable facilities for pilot-scale
catalyst testing (Regional Centers?)
Validate/identify catalyst performance metrics,
i.e., change in activity/time (equilibrium
catalyst performance), catalyst lifetime needs
(how long should a catalyst last?)
Catalyst manufacturers provide >100 kg of
catalyst for pilot-scale consortium?
Define catalyst regeneration needs and
replacement rates
Longer Term (3+ years) Long-duration, continuous pilot operation
to resolve reliability, operability, and
maintenance issues for scale up
− Public-private partnerships or
consortia − Involve state agencies?
Interim Milestones and Results
Near Term (0–3 years) Regional facilities for developing consortia for
pilot testing
Less than 10% change in activity for 100
hours at pilot scale
Convene a working group or consortium of catalyst vendors/developers/manufacturers
Longer Term (3+ years) Fixed bed catalyst replacement life at least
one year
Fluid bed catalyst replacement rates are economically viable
Metrics
Near Term (0–3 years) Catalyst cost and activity support $3/gge
modeled target for biofuel production
Minimum duration of 1,000 hours (at least 200 continuous)
Longer Term (3+ years) Commercially relevant time on-stream (e.g.,
4,000 hours) for future demonstrations
− 1,000 hours continuous
− 4,000 hours max
90% capacity factor for pilot operation
Modeled biofuel production of $3/gge

DEMONSTRATION AND DEPLOYMENT STRATEGY WORKSHOP
48
TABLE D-4.4 (FUELS VIA TC A): USE THE CONVENING POWER OF DOE TO FORM PARTNERSHIPS TO DEVELOP THE TECHNOLOGY, FURTHER DEVELOP EXISTING PILOT FACILITIES,
AND EXPAND THEM INTO DEMONSTRATION-SCALE USER FACILITIES
Summary of Recommendation: The several facilities capable of pilot-scale thermochemical testing and development are poorly identified and stop at the pilot scale as they receive sporadic and meager support. DOE is in a unique position to foster partnerships for developing the technology, developing these user facilities, and expanding them into demonstration-scale user facilities.
Desired Outcome: Identify these pilot plant user group facilities and coordinate research activities reduce risk for capital investors. Establish demonstration-scale user facilities, possibly by region or biomass type, that would leverage commonly needed equipment, such as water treatment or feed system operations. This should be done with private technology under development at reasonable cost.
Action Plan Steps
Near Term (0–3 years) Pilot plant identification for project coordination
− Establish a working group within DOE to coordinate pilot plant activities
Identify early-stage adopters of the demonstration facilities − Issue FOA
Identify site(s) that may take advantage of distressed assets or brownfield to reduce capital costs of demo user facility
− Site identification needs to address “feedstock” type (crop residue vs. wood wastes vs. MSW vs. other)
− Start building facility within three years
Longer Term (3+ years) Construct and begin
operation of several regional demo sites
Advertise success stories broadly!
Produce certification volumes of fuels across technology platforms
Interim Milestones and Results
Near Term (0–3 years) Establish working group within DOE to
coordinate pilot plant activities Release FOA Form team to support demo-scale front-end
engineering and design and specification Break ground on demonstration facility
site(s)
Longer Term (3+ years) Publish success stories Commercialize technologies that graduated
from pilot through demo sites into commercial
Meet RFS targets Improve capital efficiency
− Lower IRR (internal rate of return)
Metrics
Near Term (0–3 years) Established facilities officially recognized
and documented with the DOE with list of capabilities
Queue of users identified for both pilot and demo scale facilities
Percentage construction progress completed on demonstration facility
Longer Term (3+ years) Capital efficiency RFS target production

DEMONSTRATION AND DEPLOYMENT STRATEGY WORKSHOP
49
TABLE D-5.1 (FUELS VIA TC B): ESTABLISH BEST PRACTICES IN PARTNERING OR GAP FILLING TO BOLSTER EXPERIENCE, EXPERTISE, FINANCES, ETC. (INCLUDING FOREIGN PARTNERSHIPS)
Summary of Recommendation: Every organization has some “gaps” (areas of lower competency or
resources) for moving new technology into integrated commercialization (D&D).
Desired Outcome: In evaluating projects for funding, DOE should add positive weighting to entities that gain needed competencies by obtaining partners, including non-U.S. groups—if that is where best practices and/or financial support is most available; the objective is to de-risk the development.
Action Plan Steps
Near Term (0–3 years) Reconsider/re-design:
− Application processes and criteria for
funding
− Due diligence on applicants to determine if
gaps in competencies exist create risks to
moving forward
− Ability to find and qualify partners globally
(“dating service”)
Publicize that this is now DOE policy
Assure that new partners are truly committed
Longer Term (3+ years) Create library/clearinghouse of (non-
proprietary) best practices
Establish institutes (e.g., PSRI, FRI) that
are focused on expanding know-how in
generic technologies relevant to biomass
Interim Milestones and Results
Near Term (0–3 years) Application processes and criteria are
changed by 2015
Partner “dating service” established by 2015
Publicity on policy rolled out in 2015
Workshop for lessons learned in partnering
Longer Term (3+ years)
Metrics
Near Term (0–3 years) Assess extent to which funding applications
received by 2015 have filled all gaps in
competency and cost share internally or via
partners (count number of non-U.S. partners)
How many inquiries are made? How many
partnerships established?
Longer Term (3+ years)

DEMONSTRATION AND DEPLOYMENT STRATEGY WORKSHOP
50
TABLE D-5.2 (FUELS VIA TC B): DEVELOP MORE VERSATILE FEEDSTOCK HANDLING SYSTEMS AT PILOT SCALE AND LARGER
Summary of Recommendation: Lack of feedstock-flexible processing and handling systems, especially at pilot or larger scale. These systems need to handle differences in seasons, shape/aspect ratio; grindability; density; contaminants; abrasiveness; moisture content, ash (elemental components and volume); Inability to incorporate (optimally) natural gas into a biorefinery. Desired Outcome: Strategies to ensure that the plant can operate at capacity, regardless of biomass perturbances (supply or physical/chemical characteristics). These strategies should consider: new/better hardware, systems configuration, feedstock preprocessing, and/or procurement of better feedstocks (including natural gas and coal as supplemental feeds).
Action Plan Steps
Near Term (0–3 years) Identify and characterize (baseline) existing feedstock
systems (preprocessing, feeder). Provide funds for
feeder supplier to measure/monitor their system
performance.
Conduct simulations/system studies to identify optimal
use of natural gas to supplement biomass and/or
improve conversion chemistry and/or heat integration.
Define lifetime (benchmark) of currently used
materials of construction everywhere in the plant up to
the reactor.
Longer Term (3+ years)
Interim Milestones and Results
Near Term (0–3 years) Identify the aspects that affect feeder
performance
Obtain data on various feeder systems
Completion of X cases, implications of scaling
Longer Term (3+ years)
Metrics
Near Term (0–3 years) Flow rates, bulk density, “flowability,” energy
usage, time on-stream
Economics and LCA for various configurations
Corrosion rates, abrasion rates
Longer Term (3+ years)

DEMONSTRATION AND DEPLOYMENT STRATEGY WORKSHOP
51
TABLE D-5.3 (FUELS VIA TC B): ESTABLISH PLANT INTEGRATION USER FACILITY FOR DEMONSTRATING ACCEPTABLE PLANT UPTIME, PRODUCT QUALITY,
YIELD, AND OPERATING COSTS
Summary of Recommendation: Testing and validation of an economically viable, fully integrated plant-operation, from feedstock to end products. Demonstration of acceptable plant uptime, product quality and yield, and operating cost. Desired Outcome: De-risk integrated plant operation so that investor funding becomes available for commercial deployment. Investor funding is critical for initial deployment of multiple plants prior to large-scale commercialization.
Action Plan Steps
Near Term (0–3 years) Set TRL standards applicable to individual unit ops
as a screening criteria for plant integration FOA
Establish minimum funding level for a D&D
project
Establish an integrated, proven plant design
matrix to justify integrated demonstration trials
Verify economic viability on a standardized basis
Design and construct full demonstration unit
Longer Term (3+ years)
Interim Milestones and Results
Near Term (0–3 years) Set acceptable TRL level on each unit
Demonstrate robust, proven model with
sufficient data to validate cost basis
Demonstrated economics on DOE standard, pro forma
Longer Term (3+ years)
Metrics
Near Term (0–3 years) Demonstration in integrated plant of:
− 1,000 hours, availability 90% − 5,000 hours, > 90% − 8,000 hours, > 95%
Yield and quality meets pro forma assumptions
Longer Term (3+ years)

DEMONSTRATION AND DEPLOYMENT STRATEGY WORKSHOP
52
TABLE D-5.4 (FUELS VIA TC B): PROVIDE FACILITY OR FACILITIES FOR DEMONSTRATING CATALYST MANUFACTURING AND EVALUATING CATALYST PERFORMANCE AT SCALE
Summary of Recommendation: Critical Barrier: Demonstration- scale (low risk to commercial scale) confirmation of
catalyst performance (yield, selectivity, lifetime) in converting biomass to intermediates and upgrading those intermediates to “whole barrel” replacement hydrocarbons. Financial support for capital and operating costs of this demo-scale confirmation of manufacturing operations.
Desired Outcome: Validation of demonstration-scale performance (yield, selectivity, service lifetime, allowing/enabling financing of commercial plant
Action Plan Steps
Near Term (0–3 years) Provide funding support for pilot- and/or commercial-
scale catalyst manufacture.
Provide funding support for translational activities from
bench to industrial commercial scale.
Provide funding support for demonstration-scale
confirmation of pre-commercial catalyst and process
configuration for biomass to intermediates and/or
intermediates to hydrocarbons.
Provide funding support for long-term performance testing in a relevant environment.
Longer Term (3+ years) Optimize the catalyst and catalyst
manufacturing.
Optimize the process (reactor throughput, etc.): − Optimize operations (start-up,
regeneration)
Develop commercial arrangements
with catalyst manufacturer(s).
Interim Milestones and Results
Near Term (0–3 years) Catalyst production at sufficient scale for pilot
with commercial methods
Commercial-scale catalyst production
Developed catalyst cost (commercially relevant)
feed package for demonstration plant
Catalyst performance meets economic targets
Longer Term (3+ years) Commercial-scale catalyst production
Fully developed cost and pricing for
commercial catalyst
Optimized start-up and operations plan
Signed commercial catalyst agreement
Approval of performance by independent
engineers
Metrics
Near Term (0–3 years) Catalyst produced and provided
Cost estimates developed
Catalyst performance metrics met:
− Yield − Selectivity − Lifetime
Longer Term (3+ years) Commercial supply agreement/general
market supply

DEMONSTRATION AND DEPLOYMENT STRATEGY WORKSHOP
53
TABLE D-5.5 (FUELS VIA TC B): STANDARDIZE ANALYTICS FOR TECHNO-ECONOMIC AND PROCESS
MODELING
Summary of Recommendation: Technoeconomic modeling results may be inconsistent due to different assumptions and methodologies. DOE should facilitate the development of standards for techno-economic and process modeling. Examples that might serve as models for BETO include the DOE Fuel Cell Technologies Office’s H2A model and Fossil Energy’s bituminous coal model. Desired Outcome: Better and consistent analytics will lower risks—both technical and economic—for project deployment. Analytics would include standardized and consistent technoeconomic analysis as well as process simulation and design.
Action Plan Steps
Near Term (0–3 years) Engage stakeholders (industry; engineering, procurement, and
construction [EPC] contractors; etc.) to establish critical parameters and methodologies.
Develop methodology and tools using National Laboratories, outside contractors, universities, etc. Involve DOE system modelers to insure compatibility across offices.
Validate methodology and tools using existing projects and obtain buy-in from stakeholders.
Train program managers, grant recipients, and other stakeholders on models and tools.
Require use of DOE standard analysis methods for all grant and loan respondents and recipients.
Longer Term (3+ years) Update and revise model
periodically to accommodate new technologies and projects.
Incorporate feedback from users.
Interim Milestones and Results
Near Term (0–3 years) Workshop and subsequent reporting Report describing methodologies and tools Workshop held Revision of DOE reporting requirements.
Longer Term (3+ years) Model updates issued
Metrics
Near Term (0–3 years) Degree of participation of various
stakeholders in planning workshop Issuance of draft model and methodology Buy-in of stakeholders Final model/methodology approval Prediction of economics and performance
Longer Term (3+ years) Improved prediction of economics and
performance

DEMONSTRATION AND DEPLOYMENT STRATEGY WORKSHOP
54