demography & global issues
TRANSCRIPT

Demography & Global Issues

World Population Growth• In 6000 BCE the world’s population was 5
million.
• By 1 CE, the world’s pop was over 250 million.
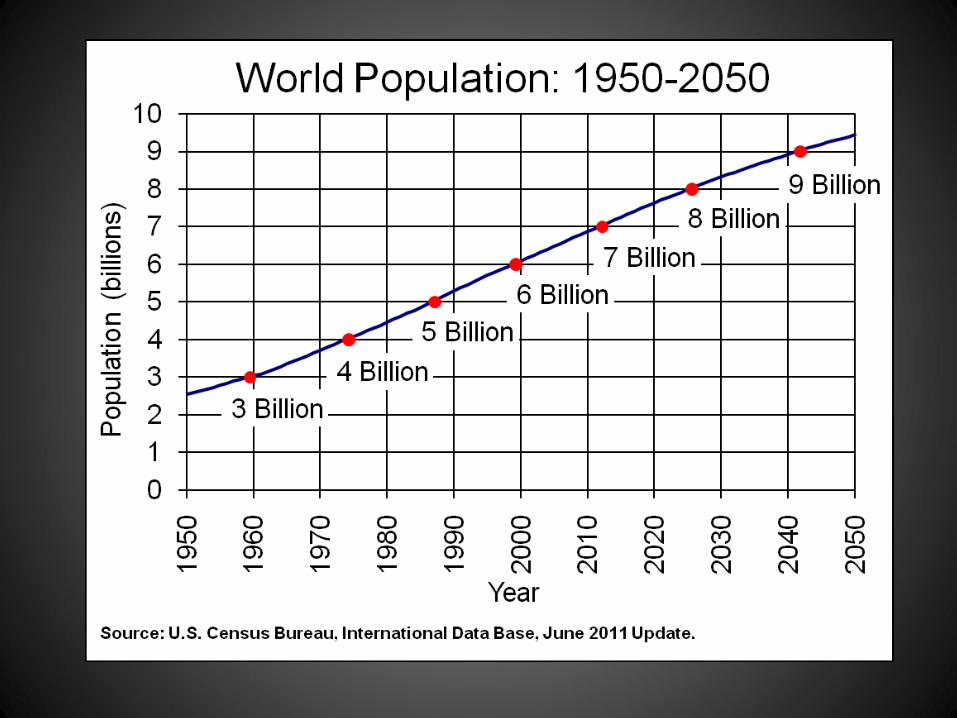
• 200 years ago, the world’s pop reached 1 billion.
• In 1960, the world’s pop was 3 billion.
• Today – over 7.2 billion, we reached 7 billion on Oct 31, 2011.
• The UN estimates that the world’s pop will increase to 10 billion by 2010.


Why is this important?• One of the greatest single factors affecting
quality of life around the world is population.
• As the populations of individual countries fluctuate, so must the social, economic, and political policies that are in place.
• With an increase in population, there is a greater demand for resources, which can often lead to environmental damage such as ozone depletion, deforestation, and soil erosion.
Demography• The study and analysis of trends relating to
human populations.
• This type of study dates all the way back to ancient times, but has changed considerably over the years.
• For example, most demographers today agree that the world’s rate of pop growth needs to slow down. But in ancient times, pop growth was beneficial.
• The most complete way to gather info about pop is to conduct a pop census.

Population Rates Components of population change are:· How many people are born
· How many people die, and
· How many move in or out of an area
Population Change Equation:
Births – deaths
+ immigrants (people moving INTO country)
– emigrants (people moving OUT OF country)
= increase or decrease in population

Rule of Seventy• a convenient way to express exponential population
growth – is to use the length of time it would take for a population to double in size – can apply the “rule of seventy”,
• It states that doubling time (the period of years it takes a country to double its population at its current birth rate) is approximately equal to 70 divided by the growth rate (in percent).
• Example: Gabon’s present rate of natural increase has a doubling time of approximately 47 years:
• • 70 divided by 1.5 (per cent growth per year) = 46.7
years

Life Expectancy• life expectancy – the average number of years that
an adult is expected to live • in 1700’s – people had a life expectancy of about 30
years• today in Canada (2012) – over 82 years• Factors contributing to death rate, thus shorter life
expectancy: disease, poor nutrition, poor medical care, unsanitary
living• before 1700’s - birth rates were high, but so were
death rates – so had several children to ensure that a few survived
• also needed more children to help farm the land and provide security to parents in their old age – this situation still common today in developing countries

Pop Growth after 1750• Rapid changes in population growth after 1750
– mainly due to falling death rates because:agricultural revolution – increased food
production, so people had better diets• -hygiene and medical knowledge improved • -clean drinking water, a more varied, nutritious
diet, and vaccination against infectious diseases meant far more children survived to become parents themselves
• -birth rates remained high for a number of years, producing a wide gap between birth and death rates and a rapid growth in population

• Shift in Population growth again when falling death rate was matched by decline in birth rate – reasons for decline:
1. - economic development
2. - move to cities
3. - rising standards of living• After WWII – World Heath Organization (WHO) and
aid programs made improved health measures available to all countries
• Result: death rates fell, but birth rates are still high in many developing countries – this explains the rapid growth in areas of the world, such as Africa, that do not have significant economic development

Demographic Transition Model
Canada’s Population• Canada’s birth and death rates have been
dropping in the past 30 years.
• This means the pop is getting older.
• 1951 – 1 in 10 cdns was over 65.
• 2020 – 1 in 5 will be over 65.
• Life expectancy in Cdn ↑ from an average of 45 years in 1900 to 65 by 1950 and to 79 in 2000.
• The increasing numbers of elderly people put immense strains on social and medical services.

Canada’s Immigration• The age structure of Cdn’s pop is one of the
main factors the federal govt considers when deciding on the number of immigrants Cdn should accept each year.
• Without immigration between 1991 and 1996, our pop would have shrunk by 750,000 instead of increasing by more than 1.6 million.
• The average age of the Cdn pop would have increased rapidly.
• The # of immigrants entering Cdn is around 200,000 per year.
• Govt’s goal of immigration is 1% of pop.

China• Largest group of refugees
comes from China.
• More money spent on refugee claims than on immigrant claims.
• The growing gap between rich and poor, unrest in the countryside, persistent government corruption, and staggering environmental challenges -- all threaten to derail the country's dreams.