democratic citizenship attitude scale: a validity and...
TRANSCRIPT
649
Democratic Citizenship Attitude Scale: A Validity and Reliability Study*
Cengiz YILDIRIM a**, Adil TÜRKOĞLU b
a Didim Efeler Ortaokulu, Aydın/Türkiye b Adnan Menderes Üniversitesi, Eğitim Fakültesi, Aydın/Türkiye
Article Info
Abstract
DOI: 10.14812/cuefd.303672 The aim of this study is to develop a scale with validity and reliability in order to
measure the democratic citizenship attitudes of secondary school students. 59 item were identified in the direction of data obtained from student interviews, teacher interviews and literature review and reduced to 45 items with expert opinions. The created test form was applied to 374 students who attended a secondary school in Aydin, Turkey. As a result of the explanatory factor analysis (EFA), a structure consisting of six factor and 29 items was obtained: culture of democracy (CD), democratic participation (DP), duties and responsibilities (DR), democratic rights and equality (DRE), values of citizenship (VC), and global citizenship (GC). The model fit indices examined in the Confirmatory Factor Analysis (CFA) confirmed the EFA results. The significance of the differences between the 27% lower and upper groups was evidence that the scale was distinctive. Cronbach’s Alpha coefficient was employed to determine if there was evidence that democratic citizenship attitude scale (DCAS) and each subscale were internally consistent. Cronbach’s Alpha varied between .60-.79 for DCAS sub-scales and was .78 for the total score.
Keywords: Democratic citizenship, Scale development, Attitude scale, Validity, Reliability.
Demokratik Vatandaşlık Tutum Ölçeği: Geçerlik ve Güvenirlik Çalışması
Makale Bilgisi Öz
DOI: 10.14812/cuefd.303672 Bu çalışmanın amacı, ortaöğretim öğrencilerinin demokratik vatandaşlık tutumlarının
belirlenebilmesi için geçerliği ve güvenirliği sağlanmış bir ölçek geliştirmektir. Öğrenci görüşmeleri, öğretmen görüşmeleri ve literatür taramasından elde edilen veriler doğrultusunda oluşturulan 59 maddelik madde havuzu uzman görüşüne sunulmuştur. Uzman görüşleri alınarak oluşturulan 45 maddelik deneme formu Aydın ilindeki bir ortaöğretim kurumunda okuyan 374 öğrenciye uygulanmıştır. Açımlayıcı Faktör Analizi (AFA) sonucunda “Temel Demokrasi Kültürü (TDK)”, ”Görev ve Sorumluluklar (GS)”, ”Demokratik Katılımcılık (DK)”, ”Demokratik Haklar ve Eşitlik (DHE)”, ”Vatandaşlık Değerleri (VD)” ve “Küresel Vatandaşlık (KV)” olmak üzere altı boyutlu ve 29 maddeden oluşan bir yapı elde edilmiştir. Doğrulayıcı Faktör Analizi kapsamında incelenen model uyum indeksleri AFA sonuçlarını doğrulamıştır. Alt ve üst grup arasındaki farklara ilişkin Demokratik Vatandaşlık Tutum Ölçeği (DVTÖ), alt ölçek ve madde değerlerinin anlamlı olması ölçeğin ayırt edici olduğunun bir kanıtı olarak gösterilebilir. DVTÖ ve alt ölçeklere ilişkin iç tutarlığın belirlenmesi amacıyla Cronbach Alpha katsayısı hesaplanmıştır. Ölçeğin iç tutarlık katsayısı (Cronbach Alpha) .78 olarak belirlenmiştir.
Anahtar Kelimeler: Demokratik vatandaşlık, Ölçek geliştirme, Tutum ölçeği, Geçerlik, Güvenirlik.
Introduction
The role of education is important in transferring democracy culture to individuals and future generations. The aim of education for democracy is to educated students who realize their own enlightenment and taking responsibilities. The important element for developing knowledge, skills, and
* This study consists of a part of the PhD thesis study have being written by Cengiz YILDIRIM and conducted under the consultancy
of Prof. Dr. Adil Türkoğlu. **
Author: [email protected]
Çukurova Üniversitesi Eğitim Fakültesi Dergisi
Vol: 46 No: 2 Sayfa: 649-664
www.cufej.com

Cengiz YILDRIM, Adil TÜRKOĞLU– Çukurova Üniversitesi Eğitim Fakültesi Dergisi, 46(2), 2017, 649-664
650
values in relation to citizenship and civic education is not only the activity, but also how this activity is presented in a specific context to the children; whether specific concepts and values are highlighted, emphasized, and explained; and if a follow-up activity to the learning situations is offered (Villegas-Reimers, 1994, p. 22). For a democratic management style, democratic citizenship must be gained through democratic process, structure and practices as it must be learned with the right information. While it is simply possible to define the concept of citizenship as the legal status of a country, much more can be said for the concept of democratic citizenship. Democratic citizenship is membership in a political democracy (Valelly, 2015). According to Portelli and Solomon (2001), it demands becoming informed about issues that affect you and participating with others in determining how society will resolve those issues. On the other hand, Turkoglu (2011) emphasized democratic values and defined the behaviors that individuals should have for democratic personality as follows:
• Respect and tolerance to thought • Accepting elections and see it as a remedy • Understand the necessity of organizing • Accept democracy as a way of life • Understanding of cooperation and sharing • Keeping society interests superior
Groot (2011) described elements that are prerequisite for a democratic citizenship-attitude to develop as follows:
• An elaborate understanding of the value of democracy and diversity for one’s own life and for the common good: reflection, moral sensitivity.
• Capacity: internal and external efficacy • Active relations: commitment and connection • The willingness to transform: open mindedness, doubt • The ability to engage in dialogue: empathy, dialogical competencies.
Researches point to the importance of democratic attitudes at all levels of education for a democratic society as one of the most important determinants of democratic values and attitudes is the education of the individuals. When investigating the related researches, we can say that the number of studies examining the democratic attitudes and behaviors of students and teachers has increased in recent years. Quantitative research methods have been used predominantly in these studies. In the survey conducted researches the democratic attitudes of teachers (Camkerten, 2001; Akyuzlu, 2005; Toper, 2007; Koc, 2008; Sahin, 2008; Yilmaz, 2009; Kurnaz, 2011; Telatar, 2012; Peker, 2012; Kaya, 2013, Yasar Ekici, 2014) and students (Saracaloglu, Evin & Varol, 2004; Guven, 2005; Fettahlioglu, 2005; Evcimik, 2009; Akin & Ozdemir, 2009; Ural, 2010; Gomleksiz & Cetintas, 2011) were examined according to different variables. The effect of teaching methods (Gomleksiz, 1993; Dilekmen, 1999; Sahiner, 2008; Demirsoz, 2010; Izgar, 2013) and prepared curriculum (Izgar, 2013) on democratic attitudes was investigated in researches using experimental model. The effect of teaching methods on the democratic attitude in higher education was investigated in numbered studies (Kerimgil, 2008; Duman, 2009) using mixed model. Sari (2007) studied the factors affecting the democratic attitudes and behaviors of students in middle school by using mixed model within the hidden curriculum. Similarly, in the case study conducted by Gundogdu (2004) on the middle school level, the democratic behaviors of students and teachers was examined within the scope of the hidden curriculum. Contrary to the increasing studies, we have identified a limited number of scale development studies to examine the attitudes of democratic citizenship. Gozutok (1995) adapted the scale 'Teacher Opinionaire on Democracy' to Turkish which was developed by ‘Published for the Attitude Research Laboratory’. Doganay and Sari (2004) developed The "Democratic Values Commitment Scale" to measure the attitudes of middle school students that includes values of independence, human dignity, friendship, equality, honesty, responsibility, justice, diversity, privacy and respect for the environment. Akbasli, Yanpar Yelken ve Sunbul (2010) developed the “Teacher candidate democratic tendency scale” to measure the attitudes of teacher candidates. This scale consists of a 4-factor structure including teacher democracy, student-
Cengiz YILDRIM, Adil TÜRKOĞLU– Çukurova Üniversitesi Eğitim Fakültesi Dergisi, 46(2), 2017, 649-664
651
oriented democracy, classroom management and freedom of expression. “Democratic value scale” was developed for teacher candidates by Cermik (2013) which is consists of a 4-factor structure: seeking rights, respecting differences, justice, equality. İlgan, Karayigit ve Cetin (2013) developed “Democratic values scale” which is consists of a 6-factor structure: equality and respect for others, respect for the rights of others, tolerance and diversity, freedom of others, respect for individual differences, and sensitivity to differences. Gafoor (2015) developed “Democratic values scale” to measure the attitudes of secondary students which is consists of a three factors: commitment to ideological democracy, commitment to critical participation in democracy and commitment to nationalist values in democracy. Attitude toward democracy scale (ATDS) was developed by Sarwar, Yousuf and Hussain (2010) to measure the attitudes of the teachers. The scale consists of acceptance of democracy, attitude toward government and attitude towards institutions subscales. Levinson and Huffman in 1955 developed Traditional Family Ideology scale to measure the democratic attitudes toward family relations. The scale intends to measure attitudes toward parent-child relationships, husband and wife roles and relationships, general male-female relationships and concepts of masculinity and femininity, and general male-female relationships (Markovik, 2010). International Association for the Evaluation of Educational Achievement (1999) designed the attitudes towards democratic citizenship questionnaire. The questionnaire consists of good citizenship, government responsibility, equal opportunities, trust, and maintaining national culture subscales (Burns-McFadden, 2011).
A review of the related literature revealed that there are few scales in international scope but no scale development study was conducted to examine the democratic citizenship attitudes of secondary school students in local scope. In this study, it is aimed to develop a scale with validity and reliability in order to determine the democratic citizenship attitudes of the secondary school students.
Method
In the study, exploratory mixed methods design (Creswell, 2005) was used to apply quantitative and qualitative research methods. Combination of multiple data types is needed in order to better understand the problem of mixed model research. According to Creswell (2005), a mixed methods research design is a procedure for collecting, analyzing, and "mixing" both quantitative and qualitative data in a single study to understand a research problem. The purpose of an exploratory mixed methods design is the procedure of first gather qualitative data to explore a phenomenon, and then collecting quantitative data to explain relationships found in the qualitative data.
Participants
The research group consists of 374 students studying at a secondary school in Aydin, Turkey: 92 (24.59%) were ninth grade students, 92 (24.59%) were tenth grade students, 91 (24.33%) were eleventh grade students and 99 (26.47%) 99 (26.47%) twelfth grade students. The study was carried out with students who were in the class at that moment by using cluster sampling. According to (Dhivyadeepa, 2015), in the field of educational research cluster sampling technique is most frequently used and it has some limitations but it has usability in teaching learning situations and educational research. Advantages of cluster sampling:
It is difficult to reach the entire participants,
Participants are in their natural environment,
Researcher saves time.
Procedure
Scale development studies were started by reviewing related literature and measurement instruments to prepare questions to be asked. Following the reviews, nine focus group interviews were made with the students consisting of four students and unstructured interviews were made with five teachers for determining the conceptual structures that students had in this regard. The following questions were discussed in focus group interviews with students:
Cengiz YILDRIM, Adil TÜRKOĞLU– Çukurova Üniversitesi Eğitim Fakültesi Dergisi, 46(2), 2017, 649-664
652
What do you think about democracy?
What do you think about democratic citizenship?
What do you think about global citizenship?
What values should a good citizen have?
What are the rights of citizenship in democratic societies?
What are the responsibilities of citizenship in democratic societies?
What should be the characteristics of democratic citizenship?
Firstly, student expressions were evaluated with teachers at unstructured interviews and then discussed with two field experts. 59 items were identified in the direction of data obtained from student interviews, teacher interviews and literature review and reduced to 45 items with expert opinions. A 5-point Likert-type grading scale was used for the DCAS responses: Strongly Agree (5), Agree (4), Unsure (3), Disagree (2), and Strongly Disagree (1). The items on the test form are randomly ordered to prevent a situation where students can respond without considering the items that can be collected under the same dimension. The test form was applied by the researcher to the students. The conduct of the research process by the researcher is important that participants do not influence each other, preventing missing values, making necessary explanations and immediate intervention of negative situations.
Data Analysis
One missing value in three participants filled by assigning the averages to the variables obtained from the data. Mahalanobis distance was calculated for each factor and the sum of the scale to determine the multivariate outliers. The χ2 values exceeding the critical value were examined according to the error in the data entry, whether they belonged to the sampling and differed from the rest of the sample. We decided not to remove these values from the data set because they affect the factor structures and the total variance negatively if they are deleted from the data set, belong to the sampling and really differed from the rest of the sample. The researcher did not make any error at the data entry.
The EFA, CFA, 27% Sub-Upper Group Comparisons and Cronbach’s Alpha were performed to examine the validity and reliability of the DCAS’s measures.
Results
Explanatory Factor Analysis (EFA)
The results of the Kaiser-Meyer-Olkin (KMO) value and the Bartlett test were examined to determine if the data were appropriate for factor analysis. KMO value (.726) and Bartlett test results (chi-square = 4,259E3, p = 0.000) showed that the data were appropriate for factor analysis.
According to the results of EFA, 14 factors with an eigenvalue greater than 1 were determined. 14 factors explain 59.40% of the total variance (Table 1).

Cengiz YILDRIM, Adil TÜRKOĞLU– Çukurova Üniversitesi Eğitim Fakültesi Dergisi, 46(2), 2017, 649-664
653
Table 1. Total Variance Explained
Eigenvalues
Component Total % of
Variance Cumulative
% Component Total
% of Variance
Cumulative %
1 5.31 11.80 11.80 8 1.36 3.03 43.74
2 3.27 7.26 19.06 9 1.31 2.92 46.66
3 2.71 6.02 25.09 10 1.27 2.82 49.48
4 2.13 4.75 29.83 11 1.21 2.68 52.16
5 1.72 3.83 33.66 12 1.16 2.58 54.74
6 1.70 3.78 37.44 13 1.06 2.36 57.09
7 1.47 3.27 40.71 14 1.04 2.31 59.40
Extraction Method: Principal Component Analysis
Fifteen items that were not loaded at any factor and below the factor load of .32 were removed from the analysis. The number of factors was determined as 6 by examining the Scree Plot (Graph 1). And the EFA was repeated. The scree plot shows the eigenvalues on the y-axis and the number of factors on the x-axis.
Graph 1. Scree Plot
The updated KMO value found .728 and Bartlett’s test found statistically significant (χ2=2.910E3, df=406, p=0.000). These findings indicated that the data were appropriate for exploratory factor analysis. Factor loads (at least .32) and the differences between the factor loads of the items loaded on more than one factor (at least .10) were examined and as a result of this examination one item had to be subtracted from the scale. These processes were carried out by using the “Principal Component Analysis” process considering the theoretical bases of the scale development process. When considering the theoretical structure, "Direct Oblimin" rotation process is used in the assumption that the factors are related to each other. Table 2 shows that the remaining 29 items were collected in six factors. And the total variance explained by the factors was 49.57%: the variance explained by the GC is 14.69%; the variance explained by the CD is 9.73%; the variance explained by the DR is 7.79%; the variance explained
Cengiz YILDRIM, Adil TÜRKOĞLU– Çukurova Üniversitesi Eğitim Fakültesi Dergisi, 46(2), 2017, 649-664
654
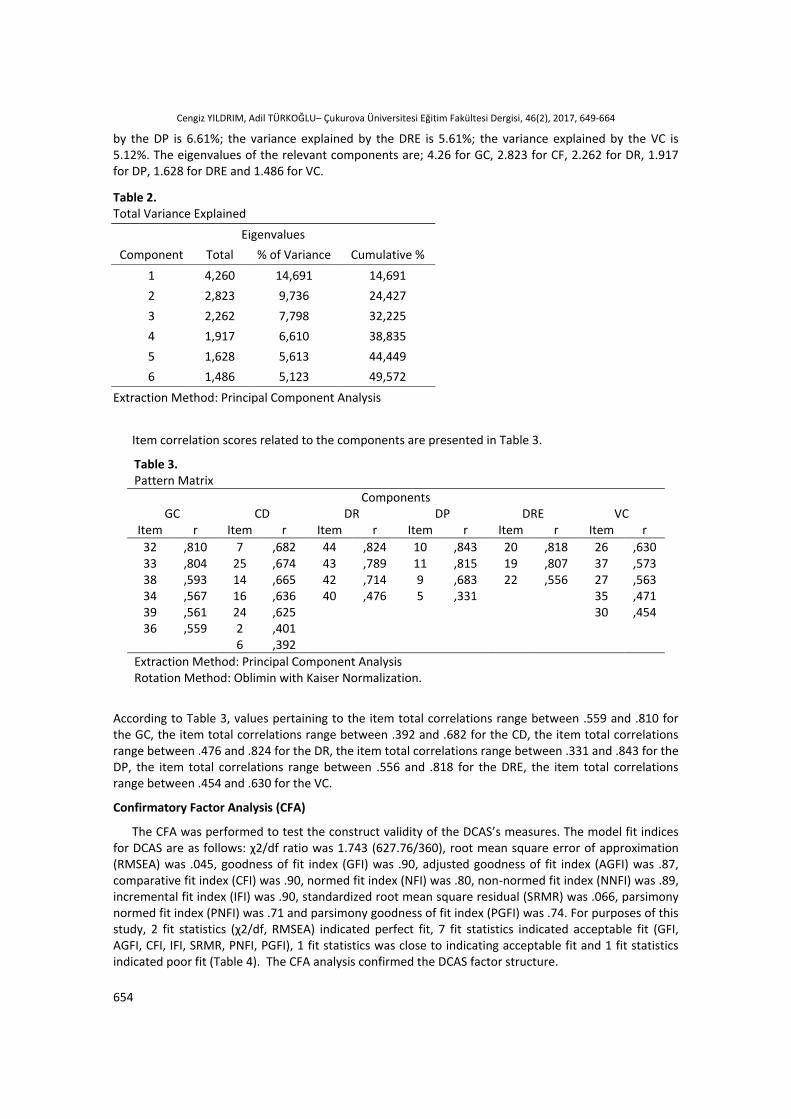
by the DP is 6.61%; the variance explained by the DRE is 5.61%; the variance explained by the VC is 5.12%. The eigenvalues of the relevant components are; 4.26 for GC, 2.823 for CF, 2.262 for DR, 1.917 for DP, 1.628 for DRE and 1.486 for VC.
Table 2. Total Variance Explained
Eigenvalues
Component Total % of Variance Cumulative %
1 4,260 14,691 14,691
2 2,823 9,736 24,427
3 2,262 7,798 32,225
4 1,917 6,610 38,835
5 1,628 5,613 44,449
6 1,486 5,123 49,572
Extraction Method: Principal Component Analysis
Item correlation scores related to the components are presented in Table 3.
Table 3. Pattern Matrix
Components GC CD DR DP DRE VC
Item r Item r Item r Item r Item r Item r
32 ,810 7 ,682 44 ,824 10 ,843 20 ,818 26 ,630 33 ,804 25 ,674 43 ,789 11 ,815 19 ,807 37 ,573 38 ,593 14 ,665 42 ,714 9 ,683 22 ,556 27 ,563 34 ,567 16 ,636 40 ,476 5 ,331 35 ,471 39 ,561 24 ,625 30 ,454 36 ,559 2 ,401
6 ,392
Extraction Method: Principal Component Analysis Rotation Method: Oblimin with Kaiser Normalization.
According to Table 3, values pertaining to the item total correlations range between .559 and .810 for the GC, the item total correlations range between .392 and .682 for the CD, the item total correlations range between .476 and .824 for the DR, the item total correlations range between .331 and .843 for the DP, the item total correlations range between .556 and .818 for the DRE, the item total correlations range between .454 and .630 for the VC.
Confirmatory Factor Analysis (CFA)
The CFA was performed to test the construct validity of the DCAS’s measures. The model fit indices for DCAS are as follows: χ2/df ratio was 1.743 (627.76/360), root mean square error of approximation (RMSEA) was .045, goodness of fit index (GFI) was .90, adjusted goodness of fit index (AGFI) was .87, comparative fit index (CFI) was .90, normed fit index (NFI) was .80, non-normed fit index (NNFI) was .89, incremental fit index (IFI) was .90, standardized root mean square residual (SRMR) was .066, parsimony normed fit index (PNFI) was .71 and parsimony goodness of fit index (PGFI) was .74. For purposes of this study, 2 fit statistics (χ2/df, RMSEA) indicated perfect fit, 7 fit statistics indicated acceptable fit (GFI, AGFI, CFI, IFI, SRMR, PNFI, PGFI), 1 fit statistics was close to indicating acceptable fit and 1 fit statistics indicated poor fit (Table 4). The CFA analysis confirmed the DCAS factor structure.

Cengiz YILDRIM, Adil TÜRKOĞLU– Çukurova Üniversitesi Eğitim Fakültesi Dergisi, 46(2), 2017, 649-664
655
Table 4. CFA fit indexes
Fit Indexes Examined
Criteria for perfect fit
Criteria for acceptable fit Obtained fit indexes
Results
χ2/df 0 ≤ χ2/df ≤ 2 2 ≤ χ2/df ≤ 3 1,743 (627,76/360) Perfect
RMSEA .00 ≤ RMSEA ≤ .05 .05 ≤ RMSEA ≤ .08 0.045 Perfect
GFI .95 ≤ GFI ≤ 1.00 .90 ≤ GFI ≤ 95 0.90 Acceptable
AGFI .90 ≤ AGFI ≤ 1.00 .85 ≤ AGFI ≤ .90 0.87 Acceptable
CFI .95 ≤ CFI ≤ 1.00 .90 ≤ CFI ≤ .95 0.90 Acceptable
NFI .95 ≤ NFI ≤ 1.00 .90 ≤ NFI ≤ .95 0.80 Poor
NNFI .95 ≤ NNFI ≤ 1.00 .90 ≤ NNFI ≤ .95 0.89 Poor
IFI .95 ≤ IFI ≤ 1.00 .90 ≤ IFI ≤ .95 0.90 Acceptable
SRMR .00 ≤ SRMR ≤ .05 .05 ≤ SRMR ≤ .10 0.066 Acceptable
PNFI .95 ≤ PNFI ≤ 1.00 .50 ≤ PNFI ≤ .95 0.71 Acceptable
PGFI .95 ≤ PGFI ≤ 1.00 .50 ≤ PGFI ≤ .95 0.74 Acceptable
χ2=627.76, df=360, 90% Confidence interval for RMSEA =(.045, .067)
The t values and factor loads for DCAS are presented in Table 5. As the table 5 shows, the t values range from 4 to 16.13 for the CD, the t values range from 5.29 to 16.01 for the DP, the t values range from 8.22 to 13.97 for the DRE, the t values range from 7.02 to 12.93 for the VC, the t values range from 9.47 to 16.35 for the DR, the t values range from 6.81 to 20.92 for the GC. The t values obtained from CFA are statistically significant (all with p<.001).
Table 5. The t-test values and factor loads for DCAS obtained from the CFA
Item no Factor load t Item no Factor load t
v1 0.36 5,76 v16 0.55 9,27
v2 0.23 4 v17 0.47 7,02
v3 0.39 7,46 v18 0.45 7,82
v4 0.43 7,2 v19 0.59 10,14
v5 0.52 8,37 v20 0.52 9,47
v6 0.76 14,78 v21 0.50 13,2
v7 0.82 16,13 v22 0.60 16,35
v8 0.29 5,29 v23 0.52 12,98
v9 0.63 9,17 v24 1,15 20,92
v10 1,06 16,01 v25 1,15 20,6
v11 0.89 14,42 v26 0.60 7,21
v12 0.63 10,6 v27 0.59 7,29
v13 0.7 13,97 v28 0.53 7,35
v14 0.32 8,22 v29 0.46 6,81
v15 0.62 12,93
t>1.92 (p<0.1)
The measurement model for the DCAS presented in Figure 1 (Annex 1).

Cengiz YILDRIM, Adil TÜRKOĞLU– Çukurova Üniversitesi Eğitim Fakültesi Dergisi, 46(2), 2017, 649-664
656
27% Sub-Upper Group Comparisons
Another study to determine the validity of the scale was the comparisons of the 27% sub-upper groups. According to Table 6, the t-test values range from 4.135 to 6.321 for the CD (df=115.224, p<0.01), the t-test values range from 5.937 to 10.275 for the DP (df=166.099, p<0.01), the t-test values range from 2.737 to 4.827 for the DRE (df=148.077, p<0.01), the t-test values range from 3.096 to 8.359 for the VC (df=143.345, p<0.01), the t-test values range from 3.8 to 7.567 for the DR (df=143.932, p<0.01) and the t-test values range from 9.143 to 10.476 for the GC (df=169, 303, p<0.01).
Table 6. 27% Sub-Upper Group Comparisons results related to DCAS, components and items
Scale df P Component df p Item t
DVTÖ 143,562 .000
CD 115,224 0.000
1 6.321
2 4.612
3 5.354
4 4.135
5 4.574
6 5.016
7 6.091
DP 166,099 0.000
8 5.937
9 6.151
10 10.275
11 7.666
DRE 148,077 0.000
12 2.737
13 4.827
14 3.354
VC 143,345 0.000
15 8.023
16 6.458
17 3.096
18 7.040
19 8.359
DR 143,932 0.000
20 7.567
21 5.562
22 5.461
23 3.800
GC 169,303 0.000
24 9.547
25 9.143
26 9.702
27 10.476
28 10.142
29 9.304
p<0.05
Reliability
Cronbach's Alpha, calculated as a measure of internal consistency, for the CD was .71, for the CD was .71, for the DP was .67, for the DRE was .62, for the VC was .60, for the DR was .71, for the GC was .79 and for the DCAS was .78 (Table 7).

Cengiz YILDRIM, Adil TÜRKOĞLU– Çukurova Üniversitesi Eğitim Fakültesi Dergisi, 46(2), 2017, 649-664
657
Table 7. Cronbach’s Alpha coefficients for the DCAS and sub-scales
Subscales Cronbach’s Alpha
DCAS .78 CD .71 DP .67 DRE .62 VC .60 DR .71 GC .79
Discussion, Conclusion and Suggestions
The aim of this study is to develop a valid and reliable scale in order to measure the democratic citizenship attitudes of secondary school students.
59 items were identified in the direction of data obtained from student interviews, teacher interviews and literature review and reduced to 45 items with expert opinions. The created test form was applied to 374 students who attended a secondary school. The results of the Kaiser-Meyer-Olkin (KMO) value and the Bartlett test were examined to determine if the data were appropriate for factor analysis. KMO value (.726) and Bartlett test results (chi-square = 4,259E3, p = 0.000) showed that the data were appropriate for factor analysis. The statistically significant Bartlett test results and the KMO value higher than .60 suggests that the data are appropriate for factor analysis (Çokluk, Şekercioğlu & Büyüköztürk, 2010). Fifteen items that were not loaded at any factor and below the factor load of .32 were removed from the analysis. And the EFA was repeated. KMO value (.728) and Bartlett test results updated (χ2=2.910E3, df=406, p=0.000). The differences between the factor loads of the items loaded on more than one factor should be at least .10, as a result of this examination one item had to be subtracted from the scale. The number of measurable variables collected under one factor varied between from 3 to 7. The lowest factor load is .33 and the highest factor load is .84 for the measurable variables. Fabrigar and Wegner (2011) have suggested that when communalities of the measured variables are high (an average of .70 or higher) and each factor is overdetermined (at least 3 to 5 measured variables with substantial loadings on each factor), good estimates can be obtained with comparatively small sample sizes. Under moderately good conditions (communalities of .40 to .70 and at least 3 measured variables loading on each factor), a sample of at least 200 should suffice; under poor conditions (communalities lower than .40 and some factors with only two measured variables loading on them), samples of at least 400 might be necessary. Comrey and Lee (1992) reported that 100=poor, 200=fair, 300=good, 500=very good, 1,000 or more=excellent in factor analysis. Gorsuch (1983) recommended that the ratio of participants to the measured variable should be at least 5 and the sample size should be more than 100. On the other hand, when the data have much less optimal properties, even very large samples may be inadequate (Fabrigar et all, 1999; Fabrigar & Wegener 2011). The Chi square value increases with sample size (Li, 2016, p. 134). In this study, the ratio of participants to the measured variable was 8.31 (374/29) for firs EFA and was 12.89 (374/29) for second EFA. And the factor load range was between .33 and .84. These findings indicate that the necessary conditions were met for good measurements to be made. These processes were carried out by using the PCA considering the theoretical bases of the scale development process. According to Sencan (2005), PCA reveals principal components that differentiate observation variables in equally spaced measuring instruments and PCA is a way of highlight similarities and differences in patterned and expresses data (Smith, 2002). For a systematic review of Fabrigar and Wenger (2011) the majority of studies use principal component analysis (PCA) rather than common factor methods.
The EFA resulted in a 6-factor structure consisting of 29 items with eigenvalues higher than 1 and explained total variance was 49.57%. These factors named as follow: culture of democracy (CD), democratic participation (DP), duties and responsibilities (DR), democratic rights and equality (DRE),

Cengiz YILDRIM, Adil TÜRKOĞLU– Çukurova Üniversitesi Eğitim Fakültesi Dergisi, 46(2), 2017, 649-664
658
values of citizenship (VC), and global citizenship (GC). Scherer, Wiebe, Luther, and Adams (1988) accept that between 40% and 60% of variance explained on multidimensional scales is sufficient. The number of eigenvalues that exceed one is used as the number of common factors (Fabrigar & Wenger, 2011, p.55).
Bollen (1989) recommended that researcher should complete the necessary procedures before the confirmatory factor analysis such as clear predictions about the number of common factors and the specific measures each common factor will influence. In this regard, the model fit indices examined in the Confirmatory Factor Analysis (CFA) confirmed the EFA results: χ2/df ratio was 1.743 (627.76/360), root mean square error of approximation (RMSEA) was .045, goodness of fit index (GFI) was .90, adjusted goodness of fit index (AGFI) was .87, comparative fit index (CFI) was .90, normed fit index (NFI) was .80, non-normed fit index (NNFI) was .89, incremental fit index (IFI) was .90, standardized root mean square residual (SRMR) was .066, parsimony normed fit index (PNFI) was .71 and parsimony goodness of fit index (PGFI) was .74. The CFA analysis confirmed the DCAS factor structure. The calculated t values higher than 1.96 are evidence of significance at .05 level and higher than 2.58 are evidence of significance at .01 level (Jöreskog & Sörbom, 1993; Kline, 2011; Khine, 2013). Byrne (2010) suggests that if the t values are non-significant, they should be removed from model or the number of participants in the study is insufficient for factor analysis. In this study, the t values obtained as a result of DFA confirm that the number of participants in the study is sufficient for factor analysis and that there is no item to be removed from the model.
Another study to determine the validity of the scale was the comparisons of the 27% sub-upper groups. According to Erkus (2012), the significance of the differences between the 27% lower and upper groups can provide evidence that the scale is distinctive. In this sense, we can say that DCAS is distinctive.
Cronbach's Alpha, calculated as a measure of internal consistency, for the DCAS was .776 and ranged from .600 to .792 for the subscales. Seker and Gencdogan (2006) recommended that the lowest Cronbach’s Alpha value is .70 with change according to the purpose of measurement.
Costello, Osborne and Kellow (2008, p.97) believed that optimal results will be achieved by use of a true factor analysis extraction method, oblique rotation, and use scree plots plus multiple test runs for information on how many meaningful factors might be in a data set. Findings from validity (EFA, CFA, 27% sub-upper group comparisons) and reliability (Cronbach’s Alpha) studies indicate that DCAS is a proven scale with validity and reliability to determining secondary school students' democratic citizenship attitudes.
Depending on the purpose of this study, new scale development and updating studies are needed in the fields when considering the conceptual structures and perceptions influenced by the changes and developments experienced in the fields (political, economical, technological, historical, geographical, etc.) affecting social structures.
Cengiz YILDRIM, Adil TÜRKOĞLU– Çukurova Üniversitesi Eğitim Fakültesi Dergisi, 46(2), 2017, 649-664
659
References
Akbasli, S., Yanpar Yelken, T., & Sunbul, O. (2010). A study to develop a scale for prospective teachers’ democratic tendency. International Eurasian Journal of Social Sciences, 1(1), 94–108.
Akin, U., & Ozdemir, M. (2009). The examination of teacher candidates ’ democratic values in terms of various variables : the case of faculty of educational sciences. Ankara University Journal of Faculty of Educational Sciences, 42 (2), 183–198.
Akyuzlu, K. A. (2005). Democratic attitudes and behaviours of the teachers who work in primary schools (example of Turkoglu). Unpublished master's thesis, Kahramanmaras Sutcu Imam University, Kahramanmaras.
Bollen , K. A. (1989) . Structural equations with latent variables. New York: Wiley.
Burns McFadden, R. (2011). Urban high school students' attitudes toward democratic citizenship: A comparison of students in the NJROTC program and students in traditional civics classes. (Order No. 3466640, Wayne State University). ProQuest Dissertations and Theses,, 135. Retrieved from http://search.proquest.com/docview/885187535?accountid=15331. (885187535).
Byrne, B. M. (2010). Structural equation modeling with AMOS: Basic concepts, applications, and programming (2nd edition). New York, NY: Routledge.
Camkerten, F. (2001). The Evaluation of pre-school education about relation of among the teachers democratic attitude and behaviors, children democratic behaviors and relevance of the curriculum. Unpublished master's thesis, Ankara University, Ankara.
Cermik, H. (2013). Pre-service teachers’ democratic values and investigation of these values based on some variables. E-Journal of New World Sciences Academy, 8(2), 261–274.
Cokluk, O., Sekercioglu, G., & Buyukozturk, Ş. (2012). Multivariate statistics for the social sciences. Ankara: Pegem Academy Publishing.
Comrey, A. L., & Lee, H. B. (1992). A first course in factor analysis. Hillsdale, NJ:Erlbaum.
Costello, A. B., Osborne, J. W., & Kellow, J. T. (2008). Best practices in exploratory factor analysis. J. W. Osborne (Ed.). In Best Practices in Quantitative Methods (pp. 86–102). California: Sage Publication.
Creswell, J. W. (2005). Educational Research: Planning, Conducting, and Evaluating Quantiative and Qualitative Research (Second Edition). Ohio: Pearson Education, Inc.
Demirsoz, E. S. (2010). The effects of the creative drama on the democratic attitudes, metacognitive awareness and emotional intelligence abilities of the teacher trainees. Unpublished doctorate thesis, Dokuz Eylul University, Izmir.
Dhivyadeepa, E. (2015). Sampling Techniques in Educational Research. New Delhi: Laxmi Book Publication
Dilekmen, M. (1999). The Effect of the psychological counseling on the democratic attitude and the emphatic skill levels of teacher candidates. Unpublished doctorate thesis, Ataturk University, Erzurum.
Doganay, A., & Sari, M. (2004). Elementary school students' devotion level to democratic values and comparison of the effect of overt and hidden curriculum on gaining democratic values in terms of students and teachers opinions. Eğitim Yönetimi, 10 (39), 356 – 383.
Duman, B. (2009). The effect of systematic teaching on student-teachers reflective thinking and democratic attitudes. Unpublished master's thesis, Firat University, Elazig.
Erkus, A. (2012). Measurement and scale development in psychology. Ankara: Pegem Academy Publishing.
Evcimik, S. C. (2009). An evaluation of democratic attitudes of the students in the faculty of education. Unpublished master's thesis, Firat University, Elazig.
Cengiz YILDRIM, Adil TÜRKOĞLU– Çukurova Üniversitesi Eğitim Fakültesi Dergisi, 46(2), 2017, 649-664
660
Fabrigar, L. R., Wegener, D. T., MacCallum, R.C., & Strahan, E. J. (1999). Evaluating the use of exploratory factor analysis in psychological research. Psychological Methods, 4, 272–299.
Fabrigar, L. R., & Wegener, D. T. (2011). Exploratory Factor Analysis. Oxford: Oxford University Press. ProQuest Ebook Central.
Fettahlioglu, M. S. (2005). The evaluating of the democratical behavior of the lecturers in the University of Kahramanmaraş Sutcu Imam. Unpublished master's thesis, Kahramanmaras Sutcu Imam University, Kahramanmaras.
Gafoor, K. A. (2015). Validation of Scale of Commitment to Democratic Values among Secondary Students. Guru Journal of Behavioral and Social Sciences, 3 (1), 361-373.
Gomleksiz, M. (1993). The effect of cooperative learning method and traditional method on democratic attitudes and success. Published doctoral thesis, Cukurova University, Adana.
Gomleksiz, M. N., & Cetintas, S. (2011). Democratic attitudes of prospective teachers (Case of Fırat, Dicle, 7 Aralık, Cumhuriyet and Erzincan Universities). Dicle University Journal of Ziya Gökalp Faculty of Education, 17, 1-14.
Gorsuch , R . L. (1983) . Factor analysis (2nd ed.). Hillsdale, NJ: Erlbaum.
Gozutok, F. D. (1995). Teachers' democratic attitudes. Ankara: Turkish Democracy Foundation Publications.
Groot, I. (2011). Why we are not democratic yet: the complexity of developing a democratic attitude. W. Veugelers (Ed.). In Education and Humanism: Linking Autonomy and Humanity. Rotterdam: Sense Publishers.
Gundogdu, K. (2004). A case study on democracy and human rights education in an elementary school. Published doctoral thesis, Middle East Technical University, Ankara.
Guven, A. (2005). The study of the democratic attitudes of students in history teaching in terms of different factors (Erzurum sample). Unpublished doctoral thesis, Ataturk University, Erzurum.
Ilgan, A., Karayigit, D., & Cetin, B. (2013). Examining democratic values of middle school students in terms of some variables. CBU Journal of Social Sciences, 11(2), 97-118.
Izgar, Gokhan (2013). The effect to democratic manners and behaviors of values education programme which is applied on 8. grades students at the primary school. Unpublished doctoral thesis, Necmettin Erbakan University, Konya.
Jöreskog, K. G., & Sörbom, D. (1993). LISREL 8: Structural equation modeling with the SIMPLIS command language. Chicago: Scientific Software International.
Kaya, C. (2013). Examining of democratic attitudes of class teachers in classroom management. Unpublished master's thesis, Ataturk University, Erzurum.
Kerimgil, S. (2008). The effect of a curriculum based upon constructivist learning on pre-service teachers? reflective thinking and democratic attitudes. Unpublished master's thesis, Firat University, Elazig.
Khine, M. S. (2013). Structural equation modeling approaches in educational. M.S. Khine (Ed.). In Application of Structural Equation Modeling in Educational Research and Practice (pp. 279-283). Rotterdam: Sense Publishers.
Kline, R.B. (2011). Principles and practice of structural equation modeling (3rd. Ed.). New York: Guilford Press.
Koc, Y. (2008). Determining and comparison of democratic attitudes of physical education teachers accordding to the different variables. Unpublished master's thesis, Abant Izzet Baysal University, Bolu.

Cengiz YILDRIM, Adil TÜRKOĞLU– Çukurova Üniversitesi Eğitim Fakültesi Dergisi, 46(2), 2017, 649-664
661
Kurnaz, A. (2011). The evaluation of the relationship between the creativity levels of the primary school teachers and their democratic attitudes. Unpublished master's thesis, Kahramanmaras Sutcu Imam University, Kahramanmaras.
Li, Y. (2016). Expatriate manager’s adaption and knowledge acquisition: Personal development in multi-national companies in china. Singapore: Springer Publications.
Markovik, M. (2010). Political attitude and personality in a democratic society. The Western Balkans Policy Review, 1(1), 168-184.
Peker, R. (2012). The assessment of te class teachers democratic attitudes and attitudes regarding childrens rights (Case Manisa). Unpublished master's thesis, Mehmet Akif Ersoy University, Burdur.
Portelli, J. P. & Solomon R. P. (Eds.). (2001). The erosion of democracy in education. Calgary, AB: Detselig Enterprises Ltd.
Sahin, G. (2008). Define the relationship between the democratic attitudes and dogmatic attitudes of primary school teachers, teachers in primary school mastering in a branch. Unpublished master’s thesis, Yeditepe University, Istanbul.
Sahiner, D. G. S. (2008). The effect of social science instruction based on active learning method toward democratic attitudes and achievement. Published master’s thesis, Dokuz Eylul University, Izmir.
Saracaloglu, A. S., Evin, I., & Varol, S. R. (2004). A comparative research on the democratic attitudes of the teachers and the prospective teachers. Educational scienses: Theory&Practice, 4 (2), 335-364.
Sari, M. (2007). The Effect of hidden curriculum on gaining democratic values: a qualitative study in two elementary schools having low and high quality of school life. Unpublished doctoral thesis, Cukurova University, Adana.
Sarwar, M., Yousuf, & Hussain, S. (2010). Attitude Toward Democracy In Pakistan: Secondary School Teachers’ Perceptions. Journal of College Teaching & Learning, 7(3), 33-38.
Scherer, R. F., Wiebe F. A., Luther, D. C. & Adams J. S. (1988). “Dimensionality of coping: Factor stability using the ways of coping questionnaire. Psychological”, Reports, 62, 763-770.
Seker, H., & Gencdogan, B. (2006). Developing measurement tools in psychology and education. Ankara: Nobel Publishing.
Smith, L. I. (2002). A tutorial on principal components analysis. Accessed from: http://www.cs.otago.ac.nz/cosc453/student_tutorials/principal_components.pdf
Telatar, S. (2012). The correlation between the democratic attitudes and the personality characteristics of class and branch teachers working in the elementary schools. Unpublished master’s thesis, Yeditepe University, Istanbul
Toper, T. (2007). Democracy education in second echelon of primary schools: Levels of exhibiting democratic attitudes and behaviors of second echelon of primary school teachers (Kars case). Unpublished master’s thesis, Kafkas University, Kars.
Turkoglu, A. (2011). 109 Soruda Eğitim Bilimine Giriş. İzmir: Teknofset Matbaacılık.
Ural, S. N. (2010). Democratic attitudes and empathy to primary school students level of influence of social science courses. Unpublished master’s thesis, Sakarya University, Sakarya.
Valelly, R. (2015). Democratic citizenship. Oxford Bibliographies. Accessed from: http://www.oxfordbibliographies.com/view/document/obo-9780199756223/obo-9780199756223-0013.xml#firstMatch
Villegas-Reimers, E. (1994). Education for democracy: The role of schools. Washington, DC: USAID.
Yaşar Ekici, F. (2014). Examining the relationship between democratic attitudes and demographic characteristics of the prospective teachers. International Periodical For The Languages, Literature and History of Turkish or Turkic, 9(11), 593–602.

Cengiz YILDRIM, Adil TÜRKOĞLU– Çukurova Üniversitesi Eğitim Fakültesi Dergisi, 46(2), 2017, 649-664
662
Yilmaz, K. (2009). The study of primary school teachers democratic attitudes according to perceived parental attitudes and some demographic variables. Unpublished master’s thesis, Maltepe University, Istanbul.

Cengiz YILDRIM, Adil TÜRKOĞLU– Çukurova Üniversitesi Eğitim Fakültesi Dergisi, 46(2), 2017, 649-664
663
Appendices
Appendix 1: CFA Measurement Model
Figure 1. CFA Measurement Model (f=374)

Cengiz YILDRIM, Adil TÜRKOĞLU– Çukurova Üniversitesi Eğitim Fakültesi Dergisi, 46(2), 2017, 649-664
664
Appendix 2: Democratic Citizenship Attitude Scale (DCAS)
1
Culture of democracy (CD)
I am prejudiced towards people who has different religion.
2 I am prejudiced towards people who has different ethnic background.
3 Political leaders should give privileges to their relatives.
4 People should continue to support, even if the administration of their home country makes the wrong decisions.
5 The top of income earners should have more political power than the rest of the others.
6 Women should not enter politics.
7 The judicial system should not be affected by politics.
8 Democratic rights and
equality (DRE)
Every individual has equal rights.
9 Men and women are equal.
10 Every individual has equal voting rights.
11
Duties and responsibilities (DR)
Every individual should contribute to national identity by protecting his or her own culture.
12 Every individual is responsible for protecting the natural, cultural and architectural heritage.
13 Every individual should take responsibility for himself and his community.
14 Good citizens should voluntarily take part in community services.
15
Democratic participation (DP)
Good citizens should participate in acts to improve human rights.
16 Good citizens should participate in acts to protect the environment.
17 Good citizens should participate the peaceful protest against the government's wrong decisions.
18 The government has a responsibility to provide job guarantees to every citizen.
19
Global citizenship (GC)
I follow international events.
20 I follow international developments.
21 I take part in community services to experience citizenship responsibilities.
22 I actively participate in democratic practices in society.
23 I communicate with people in other countries.
24 I participate in groups of people from different countries.
25
Values of citizenship (VC)
I put myself in other people's place even who are from another country.
26 I am tolerant of different opinions.
27 I respect other people's speaking their mother tongue.
28 The differences based on ethnic culture are wealth.
29 I see myself as a global citizen.