democracy’s effect on economic growth: a pooled...
TRANSCRIPT
Kurzman, Werum, Burkhart 3
Charles Kurzman is assistant professor of sociology at the University of North Carolina at Chapel Hill, and iscurrently studying modernist Islamic movements and democracy movements in the early 20th century.
Regina Werum is assistant professor of sociology at Emory University. Her research interests center on politi-cal sociology, sociology of education, and racial/ethnic stratification.
Ross E. Burkhart is assistant professor of political science at Boise State University, and his research interestsinclude cross-national democratization patterns, comparative political economy, and public policy.
Address for correspondence: Charles Kurzman, Department of Sociology, University of North Carolina, ChapelHill, CB#3210, 155 Hamilton Hall, Chapel Hill, NC 27599-3210.
Studies in Comparative International Development, Spring 2002, Vol. 37, No. 1, pp. 3-33.
Democracy’s Effect on EconomicGrowth: A Pooled Time-Series
Analysis, 1951-1980*Charles Kurzman, Regina Werum, and Ross E. Burkhart
The relationship between democracy and economic growth has concerned socialscientists since the 17th century, but recent democracy movements make this ques-tion especially important today. Do poor countries face a cruel trade-off betweendemocracy and growth? Do democracy and growth go together as a “win-win”proposition? Or is democracy irrelevant to growth? Using pooled annual time-seriesdata from 1951-1980 for 106 countries, including 88 non-core countries, we ex-plore long-term and short-term direct and indirect effects of democracy on growth.Little or no direct effect emerges, but positive indirect effects appear via two mecha-nisms: a marginally significant effect via investment and a robust effect via gov-ernment expenditure. Democracy also has a robust non-linear effect on economicgrowth via social unrest, inhibiting growth under non-democratic regimes and fur-thering it in highly democratic ones. Combining these findings, we conclude thatdemocracy does not significantly hamper economic growth, and under many cir-cumstances slightly boosts it.
Introduction
Democracy’s effect on economic growth constitutes one of the oldest re-search problems in social science. It dates back to the 17th century, when
the social sciences and the concepts of economic progress and democracy all
4 Studies in Comparative International Development / Spring 2002
began to take their modern form. Two of the main positions still debated todaywere staked out in the 1650s, one side arguing that democracy hinders eco-nomic growth, the other side arguing that democracy promotes economicgrowth. We will refer to these positions as the “trade-off” and “win-win” per-spectives—labels reflecting the positive normative connotations that democ-racy and economic growth both enjoy (Hirschman 1994).
Thomas Hobbes pioneered the “trade-off” perspective in The Leviathan(1651). Hobbes had little confidence in the farsightedness or benevolence ofrulers, but argued that absolutist regimes were more likely to improve the pub-lic welfare simply because they could not promote their own interests other-wise. Regimes where power was limited, by contrast, divided into factions thatstood to gain from the misfortune of the public. In Hobbes’s words,
no King can be rich, nor glorious, nor secure; whose subjects are either poore, or con-temptible, or too weak through want, or dissention, to maintain a war against their en-emies: Whereas in a Democracy, or Aristocracy, the publique prosperity conferres not somuch to the private fortune of one that is corrupt, or ambitious, as doth many times a perfidi-ous advice, a treacherous action, or a Civill warre. (Hobbes [1651] 1951: 241-42)
James Harrington’s response to Hobbes, The Commonwealth of Oceana(1656), pioneered the “win-win” perspective. Against Hobbes’s view of theshared interests of the absolute monarch with the country as a whole, Harringtonviewed rulers as potential looters who took what they could. The central con-cern, then, was to limit the ruler’s ability to beggar the country. In short, con-stitutional limits on power would protect the public welfare:
For whereas a prince in a commonwealth [a constitutional ruler] deriveth his greatnessfrom the root of his people, a monarch deriveth his from one of those balances whichnip them in the root; by which means the Low Countries [the Netherlands] under amonarch were poor and inconsiderable, but in bearing a prince, could grow unto amiraculous height. (Harrington [1656] 1992: 257)
Although the concepts of democracy and economic growth have changed inthe three centuries since, Hobbes’s “trade-off” and Harrington’s “win-win”positions continue to spar. Trade-off proponents—in both academic and politi-cal debates—argue that democracy is an inefficient luxury that only wealthycountries can afford. In this view, economic growth, especially among poorcountries, requires what Gregor (1979: 306) calls “developmental dictatorship,”in which “masses must be infused with a work, sacrifice, and obedience ethic,the dictatorship’s functional analogue of the protestant ethic so successful dur-ing the more leisurely development of northern Europe and North America.”Win-win proponents argue that dictatorship, however benevolent, underminesthe rule of law needed for routine economic activity. In this view, economicgrowth requires what Sklar (1987) calls “developmental democracy,” in whichlegal and electoral limits on arbitrary power give individuals the security toplan for their economic futures.
Kurzman, Werum, Burkhart 5
These two positions have been joined in debate by a third perspective ofmore recent origin, which holds that democracy has no significant effect oneconomic growth. This view, which we refer to as the “no-effect” position,suggests that economic growth is due primarily to economic production inputssuch as investment. The difference between democratic or non-democratic re-gimes is held to be less important than the existence of pro-growth govern-mental policies.
The theoretical debate between these three positions has become so vastthat no brief summary can do it justice. We refer readers instead to the mostextensive and sophisticated recent work on the subject, which reviews and ex-amines the three positions—though without the labels “trade-off,” “win-win,”and “no-effect”—and identifies several key debates within this literature(Przeworski et al. 2000). We turn next to these specific theoretical de-bates: democracy’s effect on investment, on government spending, and onsocial unrest.1 We then review the methodology of dozens of recent stud-ies on the topic and suggest an approach that builds on the experience ofthis earlier work—studying time-series as well as cross-sections, variable aswell as constant democracy levels, and indirect as well as direct effects. Fi-nally, we attempt to estimate democracy’s effect on growth—both direct andindirect—using a pooled time-series data set for 106 countries over 30 years(1951-1980).
Theorizing Democracy’s Effect
The theoretical literature on democracy’s effect on economic growth has fo-cused on several mechanisms in particular by which such an effect might betransmitted (Przeworski et al. 2000: Chaps. 3-5): economic (investment), po-litical (state expenditure), and social (social unrest). Though these are hardlythe only issues in this literature, they are among the most widely debated andempirically tested. These variables also have the additional value of beingmeasured in available pooled time-series data-sets. In this section, we reviewthe arguments made by selected representatives of the “trade-off” and “win-win” perspectives with regard to each of these indirect effects. The “no-effect”position holds in each case that democracy should have no significant effect onany of these mechanisms.
Investment
Investment has long been seen as the crucial ingredient for economic develop-ment—at least since John Law’s advice to King Louis XIV of France in 1715(Trintius 1950: 216). Following World War II, development economists beganto view investment as a virtual panacea. Although this is no longer the case, “itis nonetheless clear that even mildly robust growth rates in incomes can besustained over long periods only when societies are able to maintain invest-ment at a sizable proportion of GDP” (Gillis et al. 1992: 269). Sensitivity analy-ses of economic growth models have identified investment as the single strongestpredictor of economic growth (Levine and Renelt 1992; Sala-i-Martin 1997).

6 Studies in Comparative International Development / Spring 2002
The “trade-off” perspective argues that investment suffers in democraciesbecause people will not voluntarily curtail their consumption or increase theirsavings and investment. To do so would require a long-term vision and a will-ingness to sacrifice today in exchange for future benefits. Democracies, in thisview, dare not impose unpopular measures to increase investment. Only anauthoritarian regime will be able to do so: “The resources necessary for invest-ment cannot be accumulated by democratic means” (Rao 1984-1985: 74-75).From this point of view, economic growth should suffer in democracies be-cause investment suffers.
The “win-win” perspective argues, by contrast, that democracy is good forinvestment and, in turn, has a positive indirect effect on economic growth.Investment will grow in a climate of liberty, free-flowing information, andproperty rights secure from the arbitrary power of the state. Goodell (1985),for example, argues that autocratic governments generate unpredictable eco-nomic conditions because there is no check on the autocracy’s ability to changethe “rules of the game” at any time. Under conditions of unpredictability, en-trepreneurs will hesitate to invest.
State Expenditure
A second widely discussed mechanism for democracy’s effect on economicgrowth is the role of state expenditure. As with under-investment, there is anear consensus among economists that overly high state spending imposes aheavy burden on economic growth. It reduces the national savings rate, divertsresources into interest payments, and if left unchecked may ultimately lead todebilitating debt crises (Gillis et al. 1992: 278, 297, 397).
The “trade-off” perspective focuses on the need to limit state social spend-ing to facilitate economic growth. Yet social programs may be popular, andrecipient groups may be well organized to defend their benefits. Democracies,in this view, are vulnerable to pressure from such groups and find it difficult tobring social spending under control: “Since authoritarian political arrangementsgive political elites autonomy from distributionist pressures, they increase thegovernment’s ability to extract resources, provide public goods, and imposethe short-term costs associated with efficient economic adjustment” (Haggard1990: 262).
The “win-win” perspective, on the contrary, does not focus on social but onmilitary spending. The economic literature is less critical of military spendingthan of redistributionist expenditures, arguing that military spending may havesome positive side effects, such as research, employment, and infrastruc-ture construction. On balance, however, the economic literature argues thatthe net effect of military spending on growth appears to be negative (Deger1987; Gillis et al. 1992: 297). Autocracies, in this view, spend excessivelyon the military, raise taxes to pay for these expenditures, and thereby re-duce economic growth; democracies, on the other hand, rely on lower taxrates because they spend less on the military, and thus stimulate economicgrowth, even accounting for the burden of redistributionist social spending(Olson 1991).2
Kurzman, Werum, Burkhart 7
Social Unrest
A third widely noted mechanism for democracy’s effect on economic growthis via social unrest. These disruptions are universally held to have negativeeffects on economic growth: they halt the production process, produce disin-centives for long-term planning, and scare off potential investors (Gupta 1990).
As for democracy’s effect on social unrest, there appear to be three promi-nent positions. The “trade-off” position holds that autocratic government fa-cilitates growth through the forceful suppression of unrest. Hewlett’s (1980)study of Brazil is one of the most forthright statements of this argument. Thetitle of Hewlett’s book, The Cruel Dilemmas of Development, reflects the propo-sition that economic progress requires the coercive subjugation of a large partof the population. Hewlett argues that Brazil’s military government in the 1960swas able to stabilize the economy and achieve considerable economic growthonly because it prevented social unrest through autocratic repression. How-ever distasteful one may consider such tactics, Hewlett concludes, the govern-ment achieved its developmental goals.
The “win-win” perspective, by contrast, argues that democracies are able toavoid unrest by providing formal channels for the expression of grievances,thus affecting economic growth positively. The literature on this position de-rives from two lineages: (1) the liberal tradition, which argues that democracyallows increased political participation and therefore channels grievances intonon-confrontational forums (Hayek 1944), and (2) the recent Marxist litera-ture on class compromise, which argues that democracy allows mutually ben-eficial deals to be struck between capital and labor (Przeworski 1985).
A third perspective is the “inverted-U” relationship that social movementtheorists have identified between repressiveness and violent protest. Muller(1985) argues that highly repressive and highly non-repressive regimes faceless violent protest, while intermediate regimes face more. Mulleroperationalizes repressiveness using the Freedom House scales of political rightsand civil liberties, which others have taken as a proxy for democracy (see Table1). Combining this inverted-U effect on unrest with unrest’s predicted negativeeffect on economic growth—though Muller’s study does not make this stepitself—we may develop an indirect effect of democracy on growth that is nega-tive at low levels of democracy and positive at high levels of democracy.3
Recent Empirical Literature
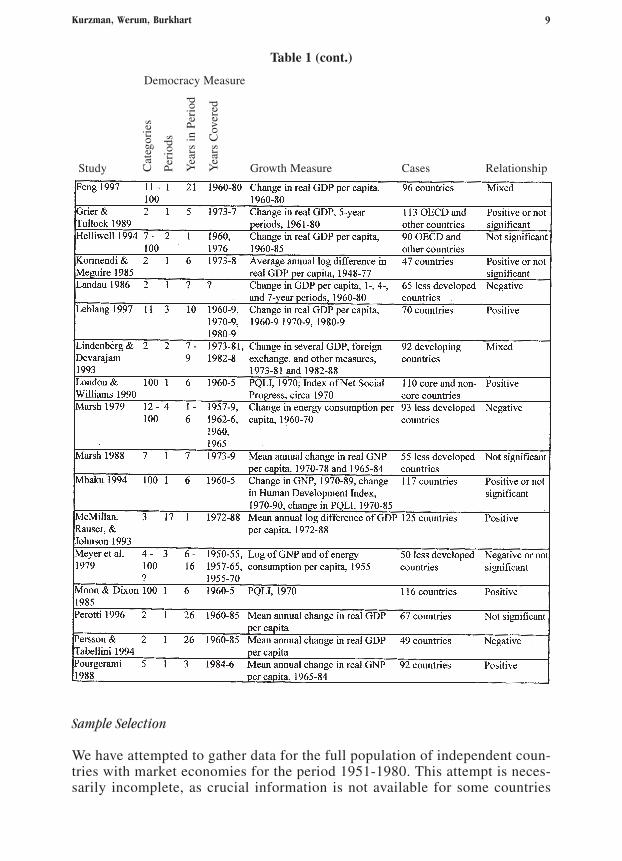
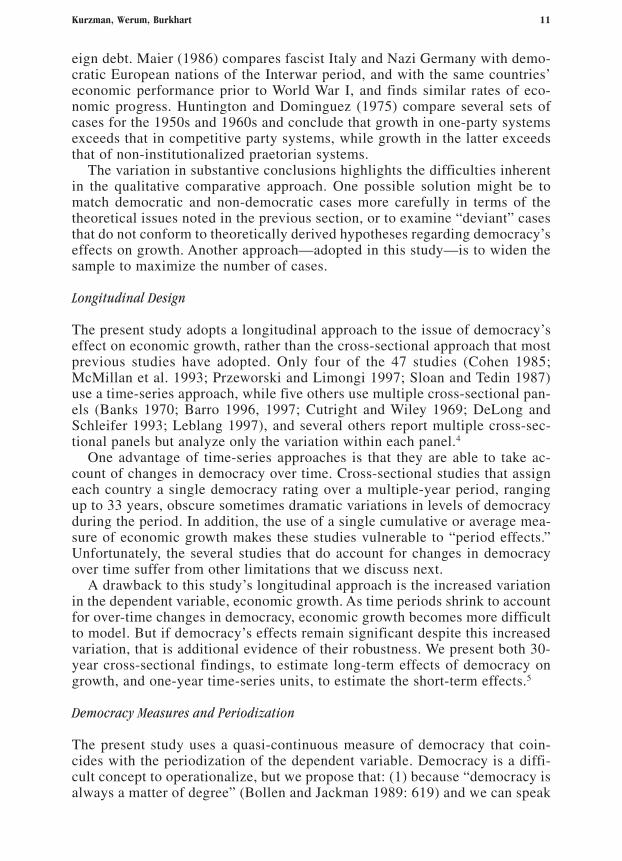
Our study aims to combine the best features of previous studies examiningdemocracy’s effect on economic growth and to overcome several of the meth-odological problems faced by previous studies. We suggest that methodologi-cal difficulties may explain the variation in findings of previous studies, someof which have been reviewed elsewhere (Brunetti and Weder 1995; De Haanand Siermann 1995b; Przeworski and Limongi 1993; Ruttan 1991; Siermann1998: 138-50; Sirowy and Inkeles 1990: 137-42). Of the 47 quantitative stud-ies reviewed for this study (see Table 1), 19 found a positive relationship be-tween democracy and growth, six found a negative relationship, and ten reported

8 Studies in Comparative International Development / Spring 2002
no statistically significant relationship. Seven studies found a combination ofpositive and non-significant results, depending on the model used and the casesincluded; two found a combination of negative and non-significant results; twofound mixed positive and negative results; and one (Barro 1996, 1997) reportedan inverted-U effect.
Table 1Quantitative Studies of Democracy’s Effect on Economic Growth
Cat
egor
ies
Per
iods
Yea
rs i
n Pe
riod
Yea
rs C
over
ed
Democracy Measure
Study Growth Measure Cases Relationship
Kurzman, Werum, Burkhart 9
Table 1 (cont.)
Sample Selection
We have attempted to gather data for the full population of independent coun-tries with market economies for the period 1951-1980. This attempt is neces-sarily incomplete, as crucial information is not available for some countries
Cat
egor
ies
Per
iods
Yea
rs i
n Pe
riod
Yea
rs C
over
ed
Democracy Measure
Study Growth Measure Cases Relationship

10 Studies in Comparative International Development / Spring 2002
and some years. However, our efforts are intended to address the difficulties ofcase selection that are present in smaller-N, case-oriented studies. For instance,Sorensen (1991) compares the democracies India and Costa Rica with the non-democracies China and Taiwan, and finds certain forms of autocracy better-suited to economic growth. Kohli (1986) examines a set of five democraticregimes in the developing world (Costa Rica, India, Malaysia, Sri Lanka, andVenezuela) with a set of five non-democratic regimes (Argentina, Brazil, Egypt,Morocco, and South Korea), and finds that democracies perform no worse interms of economic growth, and better in terms of economic equality and for-
Table 1 (cont.)
Cat
egor
ies
Per
iods
Yea
rs i
n Pe
riod
Yea
rs C
over
ed
Democracy Measure
Study Growth Measure Cases Relationship
Kurzman, Werum, Burkhart 11
eign debt. Maier (1986) compares fascist Italy and Nazi Germany with demo-cratic European nations of the Interwar period, and with the same countries’economic performance prior to World War I, and finds similar rates of eco-nomic progress. Huntington and Dominguez (1975) compare several sets ofcases for the 1950s and 1960s and conclude that growth in one-party systemsexceeds that in competitive party systems, while growth in the latter exceedsthat of non-institutionalized praetorian systems.
The variation in substantive conclusions highlights the difficulties inherentin the qualitative comparative approach. One possible solution might be tomatch democratic and non-democratic cases more carefully in terms of thetheoretical issues noted in the previous section, or to examine “deviant” casesthat do not conform to theoretically derived hypotheses regarding democracy’seffects on growth. Another approach—adopted in this study—is to widen thesample to maximize the number of cases.
Longitudinal Design
The present study adopts a longitudinal approach to the issue of democracy’seffect on economic growth, rather than the cross-sectional approach that mostprevious studies have adopted. Only four of the 47 studies (Cohen 1985;McMillan et al. 1993; Przeworski and Limongi 1997; Sloan and Tedin 1987)use a time-series approach, while five others use multiple cross-sectional pan-els (Banks 1970; Barro 1996, 1997; Cutright and Wiley 1969; DeLong andSchleifer 1993; Leblang 1997), and several others report multiple cross-sec-tional panels but analyze only the variation within each panel.4
One advantage of time-series approaches is that they are able to take ac-count of changes in democracy over time. Cross-sectional studies that assigneach country a single democracy rating over a multiple-year period, rangingup to 33 years, obscure sometimes dramatic variations in levels of democracyduring the period. In addition, the use of a single cumulative or average mea-sure of economic growth makes these studies vulnerable to “period effects.”Unfortunately, the several studies that do account for changes in democracyover time suffer from other limitations that we discuss next.
A drawback to this study’s longitudinal approach is the increased variationin the dependent variable, economic growth. As time periods shrink to accountfor over-time changes in democracy, economic growth becomes more difficultto model. But if democracy’s effects remain significant despite this increasedvariation, that is additional evidence of their robustness. We present both 30-year cross-sectional findings, to estimate long-term effects of democracy ongrowth, and one-year time-series units, to estimate the short-term effects.5
Democracy Measures and Periodization
The present study uses a quasi-continuous measure of democracy that coin-cides with the periodization of the dependent variable. Democracy is a diffi-cult concept to operationalize, but we propose that: (1) because “democracy isalways a matter of degree” (Bollen and Jackman 1989: 619) and we can speak

12 Studies in Comparative International Development / Spring 2002
of “shades of democracy” (Cutright 1963: 254), then for the purpose of inves-tigating democracy’s effect on economic growth, the measure of democracyshould properly be continuous; (2) the period covered by the democracy mea-sure should coincide temporally with the period covered by other measures.Nine of the studies under review measure democracy (the independent vari-able) after the beginning of the period measured for economic growth (thedependent variable), thus causing the causal arrow to run backwards (Sirowyand Inkeles 1990: 139-40). Seven studies use the near-continuousoperationalizations developed by Kenneth A. Bollen (1980, 1991), but do notmatch the dependent variable to the dates of the Bollen data, 1960, 1965, and1980 (Barro 1996, 1997; Helliwell 1994; London and Williams 1990; Marsh1979; Mbuku 1994; Moon and Dixon 1985; Weede 1983).6 Thirteen studiesmatch time periods but use categorical operationalizations of democracy(Alesina et al. 1996; Alesina and Rodrik 1994; Banks 1970; Cohen 1985;DeLong and Schleifer 1993; Lindenberg and Devarajam 1993; McMillan,Rausser, and Johnson 1993; Perotti 1996; Persson and Tabellini 1994;Przeworski and Limongi 1997; Przeworski et al. 2000; Remmer 1990; Sloanand Tedin 1987). Thirteen studies use the 13-category Freedom Houseoperationalization of democracy (a combination of two measures of politicalrights and civil liberties), which is reported annually and may represent a quasi-continuous scale (Gastil 1991). However, all of them reduce the Freedom Housescale to two or three categories, mismatch the period measured for economicgrowth, or fail to take account of changes in the scale over time. The onlystudy to use a continuous measure of democracy, matching time periods foreconomic growth, and a longitudinal design is three decades old and did nothave access to contemporary methodological tools (Cutright and Wiley 1969).
Indirect Effects
The present study differentiates between direct and indirect effects of democ-racy on economic growth. One quarter of the studies under review discuss thepossibility that democracy may have indirect effects on economic growth (Barro1997; Berg-Schlosser 1984; Dasgupta 1990, 1993; De Haan and Siermann1995a, 1995b; Feng 1997; Helliwell 1994; Lindenberg and Devarajam 1993;Marsh 1979, 1988; Pourgerami 1988, 1991; Przeworski and Limongi 1997;Przeworski et al. 2000; Siermann 1998; Sloan and Tedin 1987). The other studiesunder review examine only direct effects, administering statistical controls forinvestment rates and other potential mechanisms of democracy’s indirect ef-fect.
Data and Methods
Data Sources and Limitations
This study employs pooled time-series data on 106 countries with market econo-mies for the period 1951 to 1980. Examining this era is important for severalsubstantive reasons: (1) it constitutes the period during which international

Kurzman, Werum, Burkhart 13
development came to be a significant global norm and the subject of large-scale international efforts; (2) it encompasses the post-war period ofdecolonization; (3) it includes the oil boom and crisis of the 1970s; (4) it cov-ers the rise and decline of the second global “wave of democratization” (Hun-tington 1991; Kurzman 1998).7 However, the determining factor behind theselection of this time period was the availability of data on our theoreticallyrelevant variables: economic data, 1950-1992, in the Penn World Table (1994);literacy, 1945-1989, in UNESCO (1957, 1990) and World Bank (1990) publi-cations; life expectancy, 1950-1992, in World Bank (1993); several measuresof social unrest, 1948-1982, in Taylor and Jodice’s (1983) World Handbook ofPolitical and Social Indicators; and a democracy measure, 1800-1994, fromJaggers and Gurr’s (1996) Polity III dataset. The variables are described in thenext section of this article.
These data sources also determined our selection of cases. We intended tocover the universe of independent countries, on the premise that colonies andother sub-national units do not enjoy sufficient political autonomy to makedemocracy meaningful. Two sets of independent countries are also excluded.First are countries with a population under one-half million, which do not ap-pear in the Polity III dataset. The results presented here may not, then, beapplicable to very small nations. Second, we exclude socialist and communistregimes because most annual observations and economic variables for thesecountries are missing in our dataset, which relies on the Penn World Table, theleading source of cross-national economic data. Following Bollen, Entwisle,and Alderson (1993), we seek to avert selection bias by intentionally exclud-ing the remaining non-market economies. In analyses not reported here, weincluded these non-market economies and found results virtually identical tothose reported here.
We present findings for our full sample (minus the cases just noted) and fora sub-sample of non-core countries, as later defined. We do not present find-ings for the core countries because the patterns of their economic growth aretheoretically distinct from the issues of international development that moti-vate this article. In addition, the core countries have little variation on the de-mocracy measure and exhibit almost no democracy effect on economic growth.
Variables
We present standard econometric growth models, supplemented by three po-litical variables. While some cross-sectional studies of economic growth esti-mate economic production functions, we were unable to locate further time-series data that would allow us to maintain a majority of our observations fornon-core countries.8
Economic growth (dependent variable). Our measure of economic growth isannual log difference in the Penn World Table’s variable RGDPCH (real grossdomestic product per capita, Chain Index, 1985 international prices) (see Sum-mers and Heston 1991 for a description of this and other Penn World Table vari-ables). Our measure is constructed as GROWTHt = ln(RGDPCHt/RGDPCHt-1),where t is a year from 1951 to 1980. We use the log difference rather than

14 Studies in Comparative International Development / Spring 2002
annual percentage change in keeping with leading economic growth models(Barro 1997; Mankiw et al. 1992) and methodological arguments (Jackman1980; Firebaugh and Beck 1994). Some econometric analyses operationalizegrowth as GDP divided by the number of people age 18-65 in a given country;however, annual data on this age group are not available, so we fall back on theper capita measure.9 The mean annual growth rate in our sample is 0.026 (themean annual percentage change is 2.87). Although GDP per capita is a com-monly used proxy for economic development, this variable has several short-comings: (1) it biases production over consumption; (2) it does not take intoaccount the quality of production (self-sustaining, environmentally sound, etc.);and (3) it does not measure distributive or social aspects of development. Weuse GDP despite these drawbacks because theoretically preferable alternativeindicators such as the physical quality of life index (PQLI) are not available inthe same time-series format as our other variables (Morris 1979; Ragin andBradshaw 1992).
Investment. Following standard econometric growth models, we measureinvestment as the natural log of the Penn World Table’s I variable, the percent-age share of real gross domestic investment, public and private, in GDP (in1985 international prices). The mean in our sample is 2.616 (the mean of theunlogged variable is 16.7%); the single negative observation, Madagascar in1962, represents the log of an original I value of 1.0. Unfortunately, completedata are not available for foreign investment or different forms of private in-vestment, though these are of theoretical interest.
Government spending. We measure government spending as the natural logof the Penn World Table’s G variable, the percentage share of real governmentexpenditure in GDP (in 1985 international prices). The mean in our sample is2.750 (unlogged mean = 17.3%).
Social unrest. Taylor and Jodice (1983) offer three time-series indicators ofsocial unrest: political (as opposed to economic) strikes, non-violent protestdemonstrations, and riots. To correct for skewness, we took the natural log ofthese measures, first adding one to prevent the exclusion of the large numberof zero-value observations. After extensive experimentation with these mea-sures, singly and in combination, we present only results for the riots variable,because the three measures are moderately correlated with one another, mak-ing it unfeasible to use more than one of the measures in the same model, andbecause the strike and protest measures generated few readily interpretableresults.10 The mean of our logged riot indicator is 0.620 (unlogged mean =2.83 riots per country per year).
Human capital. Econometric growth models of the past decade insist on theinclusion of human capital indicators. We follow Barro (1996: 4; 1997: 19-22), who uses two human capital measures: school attainment as an indicatorof education levels, and life expectancy as an indicator of public health. Wetake the latter from the World Bank’s (1993) POPLIFE variable, which mea-sures life expectancy at birth, in years. Taking the natural log of this variable,we get a mean in our sample of 4.025 (unlogged mean = 56.4 years). Lackingannual data on school attendance, we use instead a rough measure of the stockof education, namely adult literacy, operationalized as the natural log of the

Kurzman, Werum, Burkhart 15
percent of the population age 15 and above that can read and write. Althoughannual data on literacy rates are not available, we were able to construct ourtime series literacy measure by interpolating from data points reported byUNESCO (1957, 1990) and the World Bank (1990). In several cases, we havealso used literacy rates reported in terms of the population age 10 and older,instead of 15 and older, in order to maximize data coverage. The mean in oursample is 3.878 (unlogged mean = 59.1%). An advantage of using literacy as ameasure of human capital is that literacy does not fluctuate much each year, aspeople tend to not lose their literacy skills. Therefore, we feel justified in esti-mating missing data points through interpolation. Unfortunately, the use ofinterpolation prevents us from constructing a meaningful flow variable of an-nual change in literacy. As a result, we are forced to use a stock measure ofhuman capital in equations that are otherwise made up of flow variables; fortu-nately, the bounded nature of the literacy variable is such that stock is stronglycorrelated with flow.11
Initial wealth. A country’s level of development (initial wealth) is measuredas the natural log of lagged real GDP per capita (as earlier), using a one-yearlag. This variable is logged in keeping with standard econometric practice andto correct for the skewed distribution of national wealth. The mean in oursample is 7.327 (unlogged mean = US$3,112). To check whether simulta-neous causation between the dependent variable and initial wealth wasaffecting our results, we replaced the one-year lag (t = n-1) with the valuefor t = 0 (1950 or first year of independence, whichever is later). The sub-stantive findings were unchanged, suggesting that the effects of democracyon economic growth are not biased by simultaneous causation between growthand initial wealth.12
Population growth. In keeping with leading econometric growth models, weemploy a flow measure for growth of the labor force, estimated by the annuallog difference of population, using the POP variable from the Penn World Table.Since censuses are not performed annually, these figures are based largely oninterpolations. The mean log difference in our sample is 0.022 (the mean an-nual percentage change is 2.2).
World system position. We adopted two binary variables—CORE andSEMIPER—proxying core and semiperipheral position in the world economicsystem from Snyder and Kick (1979), as amended by Bollen (1983). In analy-ses not reported here, we found that democracy’s effect is similar when weinclude the semi-periphery dummy variable, so we have combined peripheryand semi-periphery into a single category of non-core (CORE = 0).
Democracy. The Polity III democracy measure (Jaggers and Gurr 1996) usesa 21-point integer scale constructed from two subscales: DEMOC and AUTOC.DEMOC awards points (0 to 10) for various levels of Competitiveness of Po-litical Participation (0 to 3 points), Competitiveness of Executive Recruitment(0 to 2 points), Openness of Executive Recruitment (0 to 1 point), and Con-straint on Chief Executive (0 to 4 points). AUTOC (0 to 10) awards points forhigh levels of Regulation of Political Participation (0 to 2 points) and low lev-els of Competitiveness of Political Participation (0 to 2 points), Competitive-ness of Executive Recruitment (0 to 2 points), Openness of Executive

16 Studies in Comparative International Development / Spring 2002
Recruitment (0 to 1 point), and Constraint on Chief Executive (0 to 3 points).Subtracting AUTOC from DEMOC, as suggested by Polity III’s authors (Jaggersand Gurr 1995: 473), generates a summary measure we are calling DEMAUT,with a range from -10 (most autocratic) to +10 (most democratic). We added10 to DEMAUT to bring the minimum value to 0, avoiding complications inthe construction of the squared term.13 We find a mean level of 10.7 in oursample, close to the middle of the variable’s 0-20 range. We use this measureas a continuous variable, in keeping with its authors’ intentions (Gurr, Jaggers,and Moore 1991; Jaggers and Gurr 1995) and our theoretical conceptionof democracy, as discussed earlier.14 The variable is highly correlated withother measures of democracy (Jaggers and Gurr 1995: 475).15 However,the variable has been criticized for coding bias (Bollen 1993), and it islimited in that it captures only procedural aspects of democracy, focuses solelyon national-level politics, and privileges competitive over consensual demo-cratic procedures.
Modeling Issues and Estimation Procedures
In the sections that follow, we begin by replicating the cross-sectional designof previous studies, using ordinary least squares (OLS) procedures on 30-yearmeans in case there are long-term effects that the annual data may be missing.We average our variables over the entire 30-year period, except for humancapital and initial wealth, for which we follow Barro (1997) and standard econo-metric practice and use only the first year’s observation for each country. Thesemodels take the form:
Table 2, Models 1-2: MEAN(GROWTH) = CONSTANT + b1MEAN(LNINV) + b2LNLITt=0 +b3LNLIFEt=0 + b4LNWEALTHt=0 + b5MEAN(POPGROW) +b6MEAN(DEMAUT) + b7MEAN(LNGOV) + b8MEAN(LNRIOT) + e
where MEAN indicates the mean value for each country’s time series. We thenturn to the greater detail of the annual time series data. Breusch-Pagan LagrangeMultiplier tests for the OLS on means analyses (reported in Table 2, Models 1and 2), and also for OLS models using annual data (not reported), are not sig-nificant at the .05 level, indicating that heteroskedasticity is not a problem inthis data set. However, significant Durbin-Watson test scores in preliminarymodels using OLS with annual data indicated the presence of first-orderautocorrelation. To control for first-order autocorrelation, we have chosen amaximum likelihood estimation (MLE) procedure that allows us both to cor-rect for first-order autocorrelation and to deal with unbalanced time-series data.We use the AR1(TSCS) procedure in the TSP (version 4.4) software package,which differences each country observation except the first in the time seriesthrough the transformation Vt - rho(Vt-1), where V is the current observed vari-able, Vt-1 is the observed variable for the previous year, and rho is the estimateof autocorrelation (that is, the regression coefficient of the lagged error term).The first observation for each country is transformed by the square root of (1-rho2) and the maximum-likelihood Jacobian term. Parameter estimates based
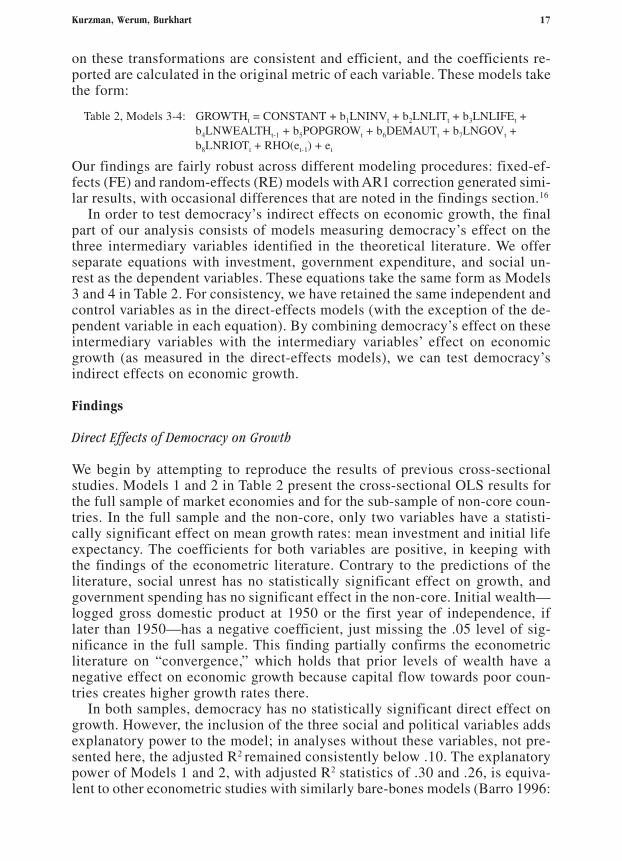
Kurzman, Werum, Burkhart 17
on these transformations are consistent and efficient, and the coefficients re-ported are calculated in the original metric of each variable. These models takethe form:
Table 2, Models 3-4: GROWTHt = CONSTANT + b1LNINVt + b2LNLITt + b3LNLIFEt +b4LNWEALTHt-1 + b5POPGROWt + b6DEMAUTt + b7LNGOVt +b8LNRIOTt + RHO(et-1) + et
Our findings are fairly robust across different modeling procedures: fixed-ef-fects (FE) and random-effects (RE) models with AR1 correction generated simi-lar results, with occasional differences that are noted in the findings section.16
In order to test democracy’s indirect effects on economic growth, the finalpart of our analysis consists of models measuring democracy’s effect on thethree intermediary variables identified in the theoretical literature. We offerseparate equations with investment, government expenditure, and social un-rest as the dependent variables. These equations take the same form as Models3 and 4 in Table 2. For consistency, we have retained the same independent andcontrol variables as in the direct-effects models (with the exception of the de-pendent variable in each equation). By combining democracy’s effect on theseintermediary variables with the intermediary variables’ effect on economicgrowth (as measured in the direct-effects models), we can test democracy’sindirect effects on economic growth.
Findings
Direct Effects of Democracy on Growth
We begin by attempting to reproduce the results of previous cross-sectionalstudies. Models 1 and 2 in Table 2 present the cross-sectional OLS results forthe full sample of market economies and for the sub-sample of non-core coun-tries. In the full sample and the non-core, only two variables have a statisti-cally significant effect on mean growth rates: mean investment and initial lifeexpectancy. The coefficients for both variables are positive, in keeping withthe findings of the econometric literature. Contrary to the predictions of theliterature, social unrest has no statistically significant effect on growth, andgovernment spending has no significant effect in the non-core. Initial wealth—logged gross domestic product at 1950 or the first year of independence, iflater than 1950—has a negative coefficient, just missing the .05 level of sig-nificance in the full sample. This finding partially confirms the econometricliterature on “convergence,” which holds that prior levels of wealth have anegative effect on economic growth because capital flow towards poor coun-tries creates higher growth rates there.
In both samples, democracy has no statistically significant direct effect ongrowth. However, the inclusion of the three social and political variables addsexplanatory power to the model; in analyses without these variables, not pre-sented here, the adjusted R2 remained consistently below .10. The explanatorypower of Models 1 and 2, with adjusted R2 statistics of .30 and .26, is equiva-lent to other econometric studies with similarly bare-bones models (Barro 1996:
Table 2, Models 3-4: GROWTHt = CONSTANT + b1LNINVt + b2LNLITt + b3LNLIFEt +b4LNWEALTHt-1 + b5POPGROWt + b6DEMAUTt + b7LNGOVt +b8LNRIOTt + RHO(et-1) + et

18 Studies in Comparative International Development / Spring 2002
6; De Haan and Siermann 1995a; Helliwell 1994; Soysa and Oneal 1999). Add-ing the Penn World Table’s capital-labor ratio to the model raises the adjustedR2 statistic to .39, with little change in the coefficients of the other variables;but including this variable removes more than half of our observations.
If we tune down the time periods—from one 30-year period to three 10-yearperiods (1951-60, 1961-70, 1971-80), then six five-year periods (1951-5, ...,
Table 2Direct Effects on Economic Growth in Market Economies, 1951-1980
OLS coefficients and maximum likelihood estimation (MLE) with first-order autocorrelation cor-rection (rho indicates remaining autocorrelation); standard errors in parentheses.
+ marginally significant at the p < .1 level, * significant at the p < .05 level, ** significant at the p< .01 level (all tests two-tailed).

Kurzman, Werum, Burkhart 19
1976-80), then 30 one-year periods—we find increasingly significant resultsat each step. The annual-data time-series results are presented in Table 2, Models3 and 4. The adjusted R2 is quite low, just under .05, reflecting the tremendousamount of “noise” in annual economic growth rates and possibleunderspecification of the model due to data constraints. However, we believethat the models are worthy of substantive interpretation, for several reasons:(1) Including additional econometric variables such as the capital-labor ratio,an indicator of market openness (imports plus exports as a percentage of GDP),and/or the lagged dependent variable does not raise the adjusted R2 above .10,even with the drastic reduction in observations. We conclude from this that the“noise” in our models is not simply the result of missing variables. (2) Includ-ing these additional econometric variables does not change the direction orsignificance levels of our key variables’ direct effects on growth, so we inter-pret these findings as relatively insensitive to model specification. (3) Similarsubstantive findings emerge with FE and RE methods, with an exception notedlater, so we interpret our findings as relatively robust across statistical meth-ods. (4) Running the same models with data averaged over five- and 10-yearperiods generates many of the same substantive findings, and does not removethe “noise” (R2 higher, but still less than the 30-year cross-sectional analyses).We conclude that our findings are not simply an artifact of the annualized timeseries format. (5) Six of the eight independent variables have statistically sig-nificant coefficients in the directions predicted by the literature, including allthree of the variables most commonly discussed as mechanisms of democracy’seffect on economic growth: investment positive, government expenditure, andsocial unrest negative. The directionality holds for both the full sample (Model3) and for non-core countries (Model 4).
Among the control variables, population growth has a negative and signifi-cant effect on economic growth, as is commonly reported in the econometricliterature. Among the human capital indicators, life expectancy continues tohave a positive effect, and literacy continues to have virtually no effect, evenwhen the political variables are excluded from the model (equations not re-ported in this article). Initial wealth has a firmly significant negative effect oneconomic growth, confirming the “convergence” hypothesis for both samples.
Democracy has a small but significant negative direct effect on economicgrowth in the full sample and a marginally significant negative direct effect inthe non-core sample, confirming the “trade-off” perspective. However, thisnegative effect is not confirmed in fixed-effect and random-effect models, notreported here, so we consider this evidence for the “trade-off” position lessthan robust. In addition, as we show in the next section, these direct effectsmust be weighed against statistically significant indirect effects of democracyon growth.
Indirect Effects of Democracy on Growth
Table 3 reports the effects that democracy and a set of other variables have oninvestment, government spending, and social unrest—the three factors identi-fied in the theoretical literature as possible conduits for democracy’s indirect

20Studies in Com
parative International Developm
ent / Spring 2002
Table 3Intermediary Effects on Economic Growth in Market Economies, Annual Data, 1951-1980
Maximum likelihood estimation (MLE) with first-order autocorrelation correction (rho indicates remaining autocorrelation); standard errors in parentheses.
+ marginally significant at the p < .1 level, * significant at the p < .05 level, ** significant at the p < .01 level (all tests two-tailed).
**

Kurzman, Werum, Burkhart 21
effect on economic growth. Again, we discuss results for the full sample ofmarket economies (Models 1-4) as well as the subset of non-core countries(Models 5-8). Multiplying the effects of democracy in these models with thedirect effects of the hypothesized intervening variables, as presented in Table2, enables us to gauge the presence and magnitude of indirect effects.17
Investment (Table 3, Models 1 and 5). As expected, literacy has a significantpositive effect on levels of investment (though life expectancy’s effect is notstatistically significant), and riots have a negative relationship with investment.Government spending’s coefficient is also negative, but is statistically signifi-cant only in the full sample. Population growth has no significant effect oninvestment in these equations. Contrary to what we would expect from its nega-tive direct effect on growth in Table 3, initial wealth has a positive relationshipwith investment.
Democracy has only a marginally significant positive effect on levels ofinvestment (p = .066 in Model 1, p = .078 in Model 5) and therefore a margin-ally positive indirect effect on economic growth via investment (p = .077 in thefull sample, p = .081 in the non-core). This “win-win” effect drops out of sta-tistical significance, however, in fixed-effects and random-effects models notpresented here, and we consider it less than robust.18
Government expenditure (Table 3, Models 2 and 6). Among the control vari-ables, we find that population growth (in the full and non-core samples) andinvestment (only in the full sample) have a significant effect on governmentexpenditure, with negative coefficients.
Democracy has a statistically significant negative effect on government ex-penditure in both the full and the non-core samples. Combined with govern-ment expenditure’s negative effect on economic growth, we find a statisticallysignificant double-negative relationship between democracy and growth viareduced state spending. This finding also confirms the “win-win” perspective.This finding is confirmed in the fixed-effect and random-effect models, notreported here, except that the random-effect model’s coefficient for the non-core sample just misses standard levels of significance (p = .061).
Social unrest (Table 3, Models 3-4 and 7-8). The adjusted R2 for these mod-els is lower than for the other indirect-effect models, suggesting that our vari-ables do not predict social unrest as well as investment and governmentspending. Among the control variables, only literacy and population growthare significant at the .05 level for the full sample, as well as government spend-ing for the non-core sample. Literacy and government spending effects losestatistical significance when we include the quadratic term (democracy squared)in the model.
In keeping with the theoretical literature, we attempt to model both lineareffects of democracy on social unrest (Models 3 and 7) and curvilinear effects(Models 4 and 8). The linear effects are positive and significant for both thefull sample and non-core sub-sample. Combining this positive effect with so-cial unrest’s negative effect on growth in the full sample and the non-corecountries, we find a negative indirect effect of democracy on growth via in-creased social unrest. The curvilinear model, however, finds both democracyand democracy-squared to be significant in both samples (Models 4 and 8),

22 Studies in Comparative International Development / Spring 2002
confirming the inverted-U relationship between democracy and unrest hypoth-esized by Muller (1985): middling levels of democracy are unable to reduceunrest through harsh repression, as in undemocratic regimes, or by channelinggrievances into routine political institutions, as in full democracies. This in-verted-U finding is confirmed also by fixed-effect and random-effect models.
Taking the derivative of Models 4 and 8 (Berry and Feldman 1985: 59), wecalculate the tipping point—the democracy score that produces the most ri-ots—at 12.54 for the non-core and 13.29 for the full sample. This tipping pointis just above the middle of the democracy scale; it lies less than one decileabove the median observed democracy score for all cases and less than twodeciles above the median for the non-core. This finding suggests that democra-tization begins to have a dampening effect on social unrest at moderate levelsof democracy, not just at the extreme end of the scale. Combining this findingwith unrest’s negative effect on economic growth, we find an indirect effect ofdemocracy on growth via unrest that is negative below the tipping-point valueof democracy and positive above this value: at low levels of democracy, in-creases in democracy are associated with higher levels of unrest and thereforelower rates of economic growth, while at high levels of democracy, increasesin democracy generate less unrest and therefore more growth. This findingconfirms the “win-win” perspective for high levels of democracy and the “trade-off” perspective for low levels of democracy.
Combining Direct and Indirect Effects
In all models, democracy’s effect is small. A change of one standard deviationin the Polity III democracy scale generates a direct effect of -0.00382 on loggeddifference of economic growth in the full sample, or six percent of one stan-dard deviation of the dependent variable (four percent and marginally signifi-cant in the non-core). The positive indirect effects are even smaller. Acomparable change in democracy generates indirect effects on growth of0.000451 (p = .077) via investment and 0.000329 (p = .020) via governmentspending in the full sample, less than one percent of the standard deviation ofthe dependent variable (similar in the non-core).
Democracy’s non-constant indirect effect via riots makes a comparable stan-dard-deviation change difficult to conceptualize. Instead, Figures 2a and 2bvisually contrast the scale of the direct and indirect effects at different levelsof democracy, plus the combined effect of direct and indirect effects. The co-efficients for the indirect effect via riots appear as an upward sloping line,crossing from negative to positive at the tipping point of democracy’s curvilin-ear effect on riots. The heavy solid line indicating direct + indirect effects(summing only those coefficients significant at the standard .05 level) slopesupward at low and high levels of democracy, and plateaus in the middle rangeof the democracy scale where the indirect effect via riots is not statisticallysignificant (see Table 4).
Interestingly, these extremes correspond somewhat to the Polity III authors’heuristic division of their scale into “coherent autocracies” (DEMAUT<4) and“coherent democracies” (DEMAUT>16) (Jaggers and Gurr 1995: 474), sug-
Kurzman, Werum, Burkhart 23
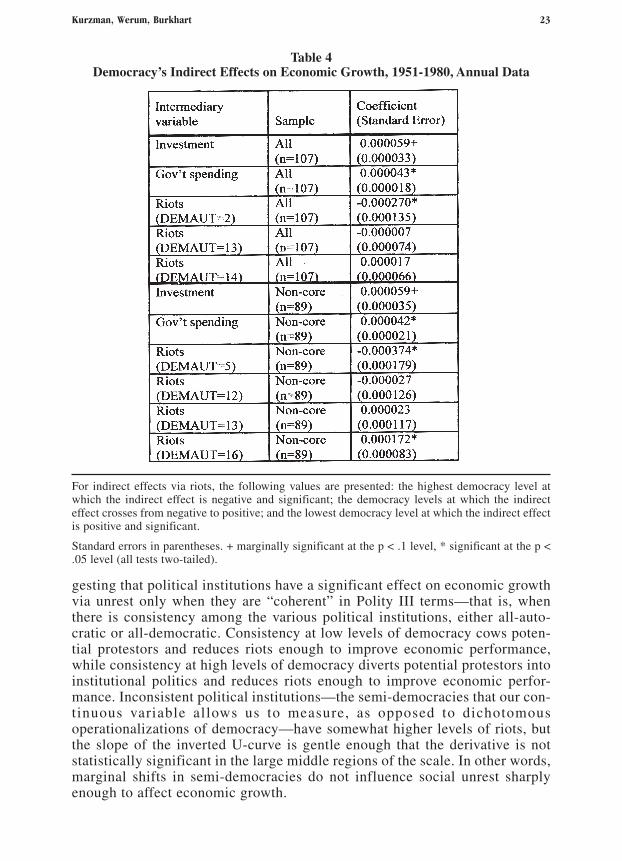
gesting that political institutions have a significant effect on economic growthvia unrest only when they are “coherent” in Polity III terms—that is, whenthere is consistency among the various political institutions, either all-auto-cratic or all-democratic. Consistency at low levels of democracy cows poten-tial protestors and reduces riots enough to improve economic performance,while consistency at high levels of democracy diverts potential protestors intoinstitutional politics and reduces riots enough to improve economic perfor-mance. Inconsistent political institutions—the semi-democracies that our con-tinuous variable allows us to measure, as opposed to dichotomousoperationalizations of democracy—have somewhat higher levels of riots, butthe slope of the inverted U-curve is gentle enough that the derivative is notstatistically significant in the large middle regions of the scale. In other words,marginal shifts in semi-democracies do not influence social unrest sharplyenough to affect economic growth.
Table 4Democracy’s Indirect Effects on Economic Growth, 1951-1980, Annual Data
For indirect effects via riots, the following values are presented: the highest democracy level atwhich the indirect effect is negative and significant; the democracy levels at which the indirecteffect crosses from negative to positive; and the lowest democracy level at which the indirect effectis positive and significant.
Standard errors in parentheses. + marginally significant at the p < .1 level, * significant at the p <.05 level (all tests two-tailed).

24 Studies in Comparative International Development / Spring 2002
-0.0008
-0.0006
-0.0004
-0.0002
0.0000
0.0002
0.0004
0 2 4 6 8 10 12 14 16 18 20
Democracy (DEMAUT)
Coe
ffici
ent o
f Dem
ocra
cy’s
Effe
ct o
n G
row
th�����������
�������� ���� �������
�������� ����� �����������
�������� ����������������������
��������������������� !���"#$
-0.0008
-0.0006
-0.0004
-0.0002
0.0000
0.0002
0.0004
0 2 4 6 8 10 12 14 16 18 20
Democracy (DEMAUT)
Coe
ffici
ent o
f Dem
ocra
cy’s
Effe
ct o
n G
row
th
�����������
�������� ���� �������
�������� ����� �����������
�������� ����������������������
��������������������� !���"#$
Figure 1aDemocracy’s Effect on Economic Growth, All Market Economies
Figure 1bDemocracy’s Effect on Economic Growth, Non-Core Market Economies
Note: The line for Direct + Indirect effects sums only coefficients that are significant at the .05level, and thus excludes direct effects, indirect effects via investment, and indirect effects via riotsbetween democracy ratings of 5 and 16.
Note: The line for Direct + Indirect effects sums only coefficients that are significant at the .05level, and thus excludes indirect effects via investment and indirect effects via riots above the de-mocracy rating of 2.

Kurzman, Werum, Burkhart 25
�
In the full sample, direct + indirect effects are negative at all levels of de-mocracy, implying support for the “trade-off” perspective; but the trade-off isreduced at the highest levels of democracy. That is, democratization hurts eco-nomic growth least at the highest levels of democracy. In the core countries, notreported here, democracy has no statistically significant effect on economic growth,direct or indirect—possibly because the variation in democracy is so small in thecore. In the non-core sample, where the direct negative effect is excluded from theoverall sum because it is only marginally statistically significant, the overall ef-fects are positive for all but the lowest values of democracy; confirming the“win-win” perspective.19 The upward slope among “coherent democracies” im-plies accelerating economic benefits generated by complete democratization.
Discussion
These findings illustrate the potential and the difficulties involved in usingtime-series data to solve methodological problems in the classic debate overdemocracy’s effect on economic growth. This article identifies three areas formethodological improvement. First, we use a near-continuous measure of de-mocracy, the Polity III scale, which allows for the conceptualization of semi-democracies and proves to be more sensitive to democracy’s effect on growththan a categorical measure. Second, rather than using static indicators em-ployed in cross-sectional studies, we employ pooled time-series data that ac-count for the rise and fall of democracy during the period under study. However,this step imposes analytical constraints and may create misspecification prob-lems because relatively few variables are available in annual time-series for-mat. As a result of this limitation, the explanatory power of several of themodels discussed in this article is less than it is sometimes observed in cross-sectional analyses of economic growth. Third, we distinguish betweendemocracy’s direct effect on growth and its indirect effects on growth via threemechanisms identified in the theoretical literature: economic (investment),political (state expenditure), and social (social unrest).
The direct-effects models using 30-year cross-sections find no long-termrelationship between democracy and economic growth. As we scale down thetime series into more finely grained units, taking account of year-to-year varia-tions in democracy, significant effects emerge. Direct-effects MLE models us-ing annual time-series data corrected for autocorrelation find a marginallystatistically significant negative short-term relationship among the non-core coun-tries—even this marginal finding, however, is not robust over fixed-effects andrandom-effects models corrected for autocorrelation, which are not shown here.(When core countries are included in the time series models along with the non-core, however, democracy has a significant negative direct effect on growth.) Themarginal and non-robust significance of democracy’s coefficients among non-corecountries is theoretically significant, confirming econometric theories that de-emphasize political factors in the economic development of poor countries.
The indirect-effects models, by contrast, suggest that democracy may alsohave statistically significant and generally positive effects on economic growth,in both the full sample of market economies and in the non-core sample:
26 Studies in Comparative International Development / Spring 2002
� Democracy has a marginally significant positive effect on investment, which inturn has a positive effect on economic growth, generating a positive but only mar-ginally significant indirect effect via investment. This finding is not robust acrossfixed-effects and random-effects models.
� Democracy has a negative effect on government expenditure, which in turn has anegative effect on economic growth, combining to produce a small but robustlysignificant positive indirect effect of democracy on growth.
� Democracy has a robust non-linear, inverted-U effect on social unrest, which inturn has a negative effect on growth, producing an indirect effect of democracy oneconomic growth that is negative and significant at low levels of democracy(DEMAUT<=5 in the non-core, <=2 in the full sample, on a scale of 0 to 20); positiveand significant at high levels of democracy (DEMAUT>=16 in the non-core, >=17 inthe full sample); and close to zero and not significant in middle levels of democracy.
Combining the statistically significant effects, we find opposite effects inthe full sample and the non-core sample. In the full sample, the statisticallysignificant effects combine to an overall effect that is negative at all levels of de-mocracy. In the non-core sample, the statistically significant effects combine to anoverall effect that is tiny but positive at all levels of democracy except the lowest(DEMAUT<=5). In other words, democracy has more positive effects in the non-core than in market economies as a whole. This finding runs counter to “trade-off” theories that call democracy a luxury that only wealthy countries can afford.
These findings have interesting implications for the long debate ondemocracy’s effect on economic growth. They show that democracy has itsgreatest effect in the short term, while economic growth is better understood inlonger terms (as indicated by higher R2 values). They suggest that the scale ofdemocracy’s short-term effects is relatively small: the net coefficient is on theorder of 10-4 (with a democracy scale that runs from 0 to 20), while mean loggedgrowth is on the order of 10-2. Moreover, democracy has a variety of contradic-tory implications for economic growth that may contribute to the disparatefindings in the literature reviewed in Table 1. For example, the “win-win” per-spective on democracy and growth is confirmed for middle and high levels ofdemocracy in non-core countries (DEMAUT>5). A normative reading of thisfinding suggests that complete democratization has more favorable economicrepercussions than partial democratization. Finally, where democracy has anegative overall effect on growth, the “trade-off” is greatest at the lowest lev-els of democracy. A normative interpretation might conclude that less and lessgrowth is sacrificed as democratization proceeds.
These complex findings do not settle the dispute over democracy’s effect oneconomic growth, though small “win-win” results predominate in non-corecountries. Democracy appears to have complex multiple effects on growth thatwill need to be further parsed as new variables become available in time-seriesformat and new estimation procedures are developed for this work.
Notes
* The authors thank Kenneth Bollen, Guang Guo, Alexander Hicks, Michael Lewis-Beck, BrianPowell, Eric Riles, numerous other colleagues, and the anonymous reviewers for their assis-tance in the preparation of this article.

Kurzman, Werum, Burkhart 27
1. Przeworski et al. (2000) offer a further mechanism for democracy’s effect on growth: the nega-tive effect that it appears to have on population growth. We control for this factor but do notexamine it as an intermediary variable because democracy’s indirect effect on growth via popu-lation growth is only marginally significant in our data.
2. Olson’s earlier work (1982: 38-47), by contrast, sounds a “trade-off” theme, suggesting that de-mocracies become economically inefficient over time. This argument refers more to democraticstability than to democracy per se, however, and we follow Bollen and Jackman (1989) in view-ing these variables as separate. In runs not presented here, we dichotomized our Polity III democ-racy measure and found no significant effects of age-of-democracy. Including age-of-democracydid not affect the direction or significance level of democracy’s effects on economic growth.
3. As later described, the product of an inverted-U effect (democracy’s relationship with riots)and a negative linear effect (riots’ relationship with growth) is not an inversion of the U-curve,but an indirect effect that changes from negative to positive at the tipping point of democracy’scurvilinear effect.
4. Research on economic development’s effect on democracy has also largely relied on cross-sectional data (see Diamond 1992; Lipset 1959; Lipset, Seong, and Torres 1993). Only re-cently has a literature emerged that uses longitudinal data to examine economic development’seffect on democracy (see Burkhart and Lewis-Beck 1994). This research tradition dealsprimarily with the level, not the rate, of economic development. We do not attempt toinclude simultaneous equations because (1) the determinants of democracy involve sepa-rate theoretical issues that we are addressing in other work, and (2) we are unable to identifysuitable instrumental variables to specify a two-stage least squares model based on availablepooled time series data.
5. As later noted, 5- and 10-year time-series units tell a similar story, with shorter periods ap-proximating the 1-year short-term effects and longer periods approximating the 30-year long-term effects.
6. Helliwell (1994) acknowledges the temporal mismatch in his study and adopts statistical pro-cedures to minimize its impact.
7. We tested for period effects, using annual, half-decade, and decade dummy variables, andfound very few effects, and little change in our findings. Therefore we have omitted thesedummy variables from our final models.
8. We tested the following variables but do not present our findings because of gaps in datacoverage:
� Capital stock per worker: KAPW in the Penn World Table, and a time series generatedfrom 1965 capital stock (Benhabib and Spiegel 1994: 170-1) on a per-capita basis usingthe perpetual inventory method and a constant annual depreciation rate of 7 percent (Berndt1996: 229).
� Market openness: imports plus exports as a percentage of GDP (OPEN in the Penn WorldTable).
� Technology: two indexes developed by Reynolds and Krivo (1996), which has few casesbefore 1970.
� Foreign investment: data from IMF (1999) and the United Nations (1992-1996), alsoused by Kentor (1998) and Soysa and Oneal (1999), which have few cases before 1970.
� School attendance: Barro and Lee (1994) and World Bank (1993) present data only in 5-year intervals beginning in 1960, and interpolation and extrapolation seem inappropriategiven potential annual fluctuation.
� Government military expenditure as a percentage of GDP: annual data reported by theStockholm International Peace Research Institute (for 1952-1971, SIPRI 1974: 208-28;for 1972-1980, SIPRI 1982: 150-53) and 5-year data by Barro and Lee (1994) interpo-lated annually.
� Government educational expenditure as a percentage of GDP: 5-year data reported byBarro and Lee (1994) interpolated annually, data beginning in 1960.
� Alternative democracy measures: Arat (1991), which is constructed in part from the so-cial unrest indicators that our model treats as separate variables; and the Freedom House(1987, 1989) scales of political rights and civil liberties, combined as suggested by thescales’ founder (Gastil 1991: 24), which begin only in 1972.
28 Studies in Comparative International Development / Spring 2002
9. We excluded one outlier, Oman in 1968, as its GDP appears to have more than doubled in oneyear. The findings are not affected by this omission.
10. We excluded three outlier observations for riots, India in 1966 and the U.S.A. in 1966 and1967. The findings are not affected by this omission.
11. Literacy has a strong bivariate correlation (.74 to .86) with interpolated versions of the educa-tional variables presented in Barro and Lee (1994) and World Bank (1993). Multicollinearitydoes not appear to be a problem with models including both literacy and life expectancy asmeasures of human capital because (1) removing either variable does not affect the direction orsignificance level of the remaining variable; and (2) regressing each variable on the remainingindependent variables generates adjusted R-squared statistics of .49 and .43, below the levelthat would raise multicollinearity concerns.
12. In other analyses not reported here, we replaced the lagged GDP per capita variable with thecore dummy variable later described, with virtually identical substantive results.
13. An alternative method—leaving DEMAUT with its original range of -10 to +10 and multiply-ing the squared term by the sign of DEMAUT—generates the same substantive findings.
14. We tested a dichotomized version of DEMAUT (1 if DEMAUT >= 16, in keeping with the cut-off point recommended by the scale’s authors), which confirmed the continuous variable’sdirect effects, but was not sensitive to the indirect-effect findings.
15. We tested an alternative continuous measure, the Polyarchy Scale (Vanhanen 2000, 2001),which is constructed as the product of suffrage rates and electoral performance of non-rulingparties (range: 0-43). It confirmed DEMAUT’s direct effects and the curvilinear indirect effectvia unrest, but did not pick up the indirect effects via investment and government spending.
16. We ran the random-effects model in SAS because TSP does not include a random-effectsprocedure with autocorrelation correction.
17. The non-standardization of the variables presents no barrier to this calculation (Stolzenberg1980). The equation for calculating indirect effects is simple for linear paths: dY/dX = b1×g1,where b1 is the coefficient of the intermediary variable’s effect on Y (the dependent variable,economic growth) and g1 is the coefficient of X’s (the antecedent variable, democracy’s) effecton the intermediary variable. We calculated standard error via the delta method (Bollen 1987:62; 1989: 391). The equation for the quadratic indirect effect via riots is somewhat more com-plicated: dY/dX = b1×g1 + b1×g2×2X, where g2 is the coefficient of the quadratic term X2
(democracy-squared). Details on the estimation of the standard error for the quadratic indirecteffect are available upon request.
18. Barro (1997: 34) reports an inverted-U indirect effect of democracy on investment that wewere unable to reproduce.
19. If coefficients with p<.10 are allowed, the marginally significant negative direct effect in thenon-core pulls the sum of direct + indirect effects down below zero for all values of democracy.
References (Data Sources)
Arat, Zehra F. 1991. Democracy and Human Rights in Developing Countries. Boulder, CO: LynneRienner.
Barro, Robert J. and Jong-Wha Lee. 1994. Data Set for a Panel of 138 Countries. Revised Version.Computer-Readable Format. Cambridge, MA: National Bureau for Economic Research [Dis-tributor].
Benhabib, Jess and Mark M. Spiegel. 1994. “The Role of Human Capital in Economic Develop-ment.” Journal of Monetary Economics 34 (October): 143-73.
Bollen, Kenneth A. 1983. “World System Position, Dependency, and Democracy: The Cross-Na-tional Evidence.” American Sociological Review 48 (August): 468-79.
Freedom House. 1987, 1989. Freedom in the World. New York: Freedom House.Jaggers, Keith and Ted Robert Gurr. 1996. Polity III: Political Structures and Regime Change,
1800-1994. Computer-Readable Format. ICPSR 6695. Boulder, CO: Keith Jaggers. CollegePark, MD: Ted Robert Gurr [Producers]. Ann Arbor, MI: Inter-University Consortium forPolitical and Social Research [Distributor].
Penn World Table (Mark 5.6). 1994. Computer-Readable Format. Cambridge, MA: National Bu-reau of Economic Research [Distributor].

Kurzman, Werum, Burkhart 29
Reynolds, John R. and Lauren J. Krivo. 1996. “Change in Societal Technology and Development,1950-1990.” Social Science Research 25 (June): 95-124.
Snyder, David and Edward L. Kick. 1979. “Structural Position in the World System and EconomicGrowth, 1955-1970: A Multiple-Network Analysis of Transnational Interactions.” AmericanJournal of Sociology 84 (March): 1096-126.
Stockholm International Peace Research Institute (SIPRI). 1974. SIPRI Yearbook 1974. Cambridge,MA: The MIT Press; Stockholm, Sweden: Alqvist & Wiksell.
_________. 1982. SIPRI Yearbook 1982. London, UK: Taylor & Francis; Cambridge, MA:Oelgeschlager, Gunn & Hain.
Taylor, Charles Lewis and David A. Jodice. 1983. World Handbook of Political and Social Indica-tors, 3rd Edition. New Haven: Yale University Press.
United Nations Educational, Social, and Cultural Organization. 1957. World Illiteracy at Mid-Cen-tury, A Statistical Study. Paris, France: UNESCO.
United Nations Educational, Social, and Cultural Organization. 1990. Compendium of Statistics onIlliteracy, 1990 Edition. Paris, France: UNESCO.
World Bank. 1990. World Development Report 1990. New York: Oxford University Press._________. 1993. World Tables of Economic and Social Indicators, 1950-1992. Computer Read-
able Format. ICPSR 6159. Washington, DC: World Bank, International Economics Dept. [Pro-ducer]. Ann Arbor, MI: Inter-University Consortium for Political and Social Research[Distributor].
References
Adelman, Irma and Cynthia Taft Morris. 1967. Society, Politics and Economic Development: AQuantitative Approach. Baltimore, MD: Johns Hopkins University Press.
Alesina, Alberto, Sule Özler, Nouriel Roubini and Phill Swagel. 1996. “Political Instability andEconomic Growth.” Journal of Economic Growth 1 (June): 189-211.
Alesina, Alberto and Dani Rodrik. 1994. “Distributional Politics and Economic Growth.” QuarterlyJournal of Economics 109 (May): 465-90.
Banks, Arthur S. 1970. “Modernization and Political Change: The Latin American and Amer-Euro-pean Nations.” Comparative Political Studies 2 (January): 405-18.
Barro, Robert J. 1996. “Democracy and Growth.” Journal of Economic Growth 1 (March): 1-27._________. 1997. Determinants of Economic Growth. Cambridge, MA: The MIT Press.Berg-Schlosser, Dirk. 1984. “African Political Systems: Typology and Performance.” Comparative
Political Studies 17 (April): 121-51.Berndt, Ernst R. 1996. The Practice of Econometrics. Revised ed. Reading, MA: Addison-Wesley.Berry, William D. and Stanley Feldman. 1985. Multiple Regression in Practice. Beverly Hills, CA:
Sage.Bhalla, Sujrit S. 1994. “Freedom and Economic Growth: A Virtuous Cycle?” Pp. 195-241 in
Democracy’s Victory and Crisis, ed. Axel Hadenius. Cambridge, UK: Cambridge UniversityPress.
Bollen, Kenneth A. 1980. “Issues in the Comparative Measurement of Political Democracy.” AmericanSociological Review 45 (June): 370-90.
_________. 1987. “Total, Direct, and Indirect Effects in Structural Equation Models.” SociologicalMethodology 17: 37-69.
_________. 1989. Structural Equations with Latent Variables. New York: John Wiley & Sons._________. 1991. “Political Democracy: Conceptual and Measurement Traps.” Pp. 3-20 in Inkeles
(1991)._________. 1993. “Liberal Democracy: Validity and Method Factors in Cross-National Measures.”
American Journal of Political Science 37 (November): 1207-30.Bollen, Kenneth A., Barbara Entwisle and Arthur S. Alderson. 1993. “Macrocomparative Research
Methods.” Annual Review of Sociology 19: 321-51.Bollen, Kenneth A. and Robert W. Jackman. 1989. “Democracy, Stability, and Dichotomies.” Ameri-
can Sociological Review 54 (August): 612-21.Brunetti, Aymo and Beatrice Weder. 1995. “Political Sources of Growth: A Critical Note on Mea-
surement.” Public Choice 82 (January): 125-34.

30 Studies in Comparative International Development / Spring 2002
Burkhart, Ross and Michael Lewis-Beck. 1994. “Comparative Democracy: The Economic Devel-opment Thesis.” American Political Science Review 88 (December): 903-10.
Chatterji, Monojit, Brian Gilmore, Kurt Strunk and Jon Vanasin. 1993. “Political Economy, Growthand Convergence in Less-Developed Countries.” World Development 21 (December): 2029-38.
Cohen, Youssef. 1985. “The Impact of Bureaucratic-Authoritarian Rule on Economic Growth.”Comparative Political Studies 18 (April): 123-36.
Cutright, Phillips. 1963. “National Political Development: Measurement and Analysis.” AmericanSociological Review 28 (April): 253-64.
Cutright, Phillips and James A. Wiley. 1969. “Modernization and Political Representation: 1927-1966.” Studies in Comparative International Development 5: 23-44.
Dasgupta, Partha. 1990. “Well-Being and the Extent of Its Realisation in Poor Countries.” TheEconomic Journal 100 (Supplement):1-32.
_________. 1993. An Inquiry into Well-Being and Destitution. Oxford, UK: Clarendon Press.De Haan, Jakob and Clemens L. J. Siermann. 1995a. “A Sensitivity Analysis of the Impact of
Democracy on Economic Growth.” Empirical Economics 20 (2): 197-215._________. 1995b. “New Evidence on the Relationship between Democracy and Economic Growth.”
Public Choice 86 (January): 175-98.DeLong, J. Bradford and Andrei Shleifer. 1993. “Princes and Merchants: European City Growth
Before the Industrial Revolution.” Journal of Law and Economics 36 (October): 671-702.Deger, Saadet. 1987. Military Expenditure in Third World Countries: The Economic Effects. Lon-
don, UK: Routledge & Kegan Paul.Diamond, Larry. 1992. “Economic Development and Democracy Reconsidered.” American Behav-
ioral Scientist 35 (March): 450-99.Dick, G. Williams. 1974. “Authoritarian versus Nonauthoritarian Approaches to Economic Devel-
opment.” Journal of Political Economy 82 (July): 817-27.Feierabend, Ivo K. and Rosalind L. Feierabend. 1972. “Coerciveness and Change: Cross-national
Trends.” American Behavioral Scientist 15 (July): 911-27.Feng, Yi. 1997. “Democracy, Political Stability and Economic Growth.” British Journal of Political
Science 27 (July): 391-418.Firebaugh, Glenn and Frank Beck. 1994. “Does Economic Growth Benefit the Masses? Growth,
Dependence, and Welfare in the Third World.” American Sociological Review 59 (October):631-53.
Gasiorowski, Mark J. 1993. The Political Regime Change Dataset. Baton Rouge, LA: LouisianaPopulation Data Center, Louisiana State University.
Gastil, Raymond Duncan. 1991. “The Comparative Survey of Freedom: Experiences and Sugges-tions.” Pp. 21-46 in Inkeles ed. (1991).
Gillis, Malcolm, Dwight H. Perkins, Michael Roemer and Donald R. Snodgrass. 1992. Economicsof Development, 3rd Edition. New York: W.W. Norton.
Goodell, Grace. 1985. “The Importance of Political Participation for Sustained Capitalist Develop-ment.” Archives Européennes de Sociologie 26 (1): 93-127.
Gregor, A. James. 1979. Italian Fascism and Developmental Dictatorship. Princeton, NJ: PrincetonUniversity Press.
Grier, Kevin B. and Gordon Tullock. 1989. “An Empirical Analysis of Cross-national EconomicGrowth, 1951-80.” Journal of Monetary Economics 24 (September): 259-76.
Gundlach, Erich. 1993. “Empirical Evidence for Alternative Growth Models: Time-Series Results.”Weltwirtschaftliches Archiv—Review of World Economics 129 (1): 103-19.
Gupta, Dipak K. 1990. The Economics of Political Violence: The Effect of Political Instability onEconomic Growth. New York: Praeger.
Gurr, Ted Robert, Keith Jaggers and Will H. Moore. 1991. “The Transformation of the WesternState: The Growth of Democracy, Autocracy, and State Power Since 1800.” Pp. 69-104 inInkeles ed. (1991).
Haggard, Stephan. 1990. Pathways From the Periphery: The Politics of Growth in the Newly Indus-trializing Countries. Ithaca, NY: Cornell University Press.
Harrington, James. [1656] 1992. The Commonwealth of Oceana and A System of Politics, ed. J. G.A. Pocock. Cambridge, UK: Cambridge University Press.

Kurzman, Werum, Burkhart 31
Hayek, Friedrich. 1944. The Road to Serfdom. Chicago, IL: University of Chicago Press.Helliwell, John F. 1994. “Empirical Linkages Between Democracy and Economic Growth.” British
Journal of Political Science 24 (April): 225-48.Hewlett, Sylvia Ann. 1980. The Cruel Dilemmas of Development: Twentieth Century Brazil. New
York: Basic Books.Hirschman, Albert O. 1994. “The On-and-Off Connection Between Political and Economic Progress.”
American Economic Review 84 (May): 343-48.Hobbes, Thomas. [1651] 1951. Leviathan, ed. C. B. Macpherson. Harmondsworth, UK: Penguin.Huntington, Samuel P. 1991. The Third Wave: Democratization in the Late Twentieth Century.
Norman, OK: University of Oklahoma Press.Huntington, Samuel P. and Jorge I. Dominguez. 1975. “Political Development.” Pp. 1-114 in Hand-
book of Political Science, Vol. 3, Macropolitical Theory, eds. Fred I. Greenstein and NelsonW. Polsby, Reading, MA: Addison-Wesley.
Inkeles, Alex, ed. 1991. On Measuring Democracy: Its Consequences and Concomitants. NewBrunswick, NJ: Transaction.
International Monetary Fund. 1999. International Financial Statistics (October). Computer-Read-able Format. Washington, DC: International Monetary Fund.
Jackman, Robert W. 1980. “A Note on the Measurement of Growth Rates in Cross-National Re-search.” American Journal of Sociology 86 (November): 604-07.
Jaggers, Keith and Ted Robert Gurr. 1995. “Tracking Democracy’s Third Wave with the Polity IIIData.” Journal of Peace Research 32 (November): 469-82.
Kentor, Jeffrey. 1998. “The Long-Term Effects of Foreign Investment Dependence on EconomicGrowth, 1940-1990.” American Journal of Sociology 103 (January):1024-46.
Kohli, Atul. 1986. “Democracy and Development.” Pp. 153-82 in Development Strategies Recon-sidered, eds. John Lewis and Valeriana Kallab. New Brunswick, NJ: Transaction Books.
Kormendi, Roger C. and Philip G. Meguire. 1985. “Macroeconomic Determinants of Growth: Cross-Country Evidence.” Journal of Monetary Economics 16 (September): 141-63.
Kurzman, Charles. 1998. “Waves of Democratization.” Studies in Comparative International De-velopment 33 (Spring): 37-59.
Landau, Daniel. 1986. “Government and Economic Growth in the LDC’s: An Empirical Study for1960-1980.” Economic Development and Cultural Change 35 (October): 35-75.
Leblang, David A. 1997. “Political Democracy and Economic Growth: Pooled Cross-Sectional andTime-Series Evidence.” British Journal of Political Science 27 (July): 453-72.
Levine, Ross and David Renelt. 1992. “A Sensitivity Analysis of Cross-Country Growth Regres-sions.” American Economic Review 82 (September): 942-63.
Lindenberg, Marc and Shantayanam Devarajam. 1993. “Prescribing Strong Economic Medicine:Revisiting the Myths About Structural Adjustment, Democracy, and Economic Performancein Developing Countries.” Comparative Politics 25 (July): 169-82.
Lipset, Seymour Martin. 1959. “Some Social Requisites of Democracy: Economic Developmentand Political Development.” American Political Science Review 53 (March): 69-105
Lipset, Seymour, Kyoung-Ryung Seong and John Charles Torres. 1993. “A Comparative Analysis ofthe Social Requisites of Democracy.” International Social Science Journal 136 (May): 155-75.
London, Bruce and Bruce A. Williams. 1990. “National Politics, International Dependency, andBasic Needs Provision: A Cross-National Analysis.” Social Forces 69 (December): 572-87.
Maier, Charles. 1986. “The Economics of Fascism and Nazism: Premises and Performance.” Pp.57-88 in Development, Democracy, and the Art of Trespassing, eds. Alejandro Foxley, MichaelS. McPherson and Guillermo O’Donnell. Notre Dame, IN: University of Notre Dame Press.
Mankiw, N. Gregory, David Romer and David N. Weil. 1992. “A Contribution to the Empirics ofEconomic Growth.” The Quarterly Journal of Economics 107 (May): 407-37.
Marsh, Robert M. 1979. “Does Democracy Hinder Economic Development in Latecomer Develop-ing Nations?” Comparative Social Research 2:215-48.
_________. 1988. “Sociological Explanations of Economic Growth.” Studies in Comparative In-ternational Development 23 (Winter): 41-76.
Mbaku, John Mukum. 1994. “Political Economy of Development: An Empirical Analysis of theEffects of the Institutional Framework on Economic Development.” Studies in ComparativeInternational Development 29 (Summer): 3-21.
32 Studies in Comparative International Development / Spring 2002
McMillan, John, Gordon Rausser and Stan Johnson. 1993. “Freedoms and Economic Growth: Tran-sitional and Permanent Components.” Washington, DC: Institute for Policy Reform, IPR27.
Meyer, John W. et al. 1979. “National Economic Development, 1950-1970: Social and PoliticalFactors.” Pp. 85-116 in National Development and the World System, eds. John Meyer andMichael Hannan. Chicago, IL: University of Chicago Press.
Moon, Bruce E. and William J. Dixon. 1985. “Politics, the State, and Basic Human Needs: A Cross-National Study.” American Journal of Political Science 29 (November): 661-94.
Morris, Morris D. 1979. Measuring the Condition of the World’s Poor: The Physical Quality of LifeIndex. New York: Pergamon Press.
Muller, Edward N. 1985. “Income Inequality, Regime Repressiveness, and Political Violence.”American Sociological Review 50 (February): 47-61.
Olson, Mancur. 1982. The Rise and Decline of Nations. New Haven, CT: Yale University Press._________. 1991. “Autocracy, Democracy, and Prosperity.” Pp. 131-57 in Strategy and Choice, ed.
Richard J. Zeckhauser. Cambridge, MA: MIT Press.Perotti, Roberto J. 1996. “Growth, Income Distribution, and Democracy.” Journal of Economic
Growth 1, 2: 149-87.Persson, Torsten and Guido Tabellini. 1994. “Is Inequality Harmful for Growth?” American Eco-
nomic Review 84 (June): 600-21.Pindyck, Robert and Daniel Rubinfeld. 1998. Econometric Models and Economic Forecasts. New
York: McGraw-Hill.Pourgerami, Abbas. 1988. “The Political Economy of Development.” Public Choice 58 (August):
123-41._________. 1991. Development and Democracy in the Third World. Boulder, CO: Westview Press._________. 1992. “Authoritarian Versus Nonauthoritarian Approaches to Economic Development:
Update and Additional Evidence.” Public Choice 74 (October): 365-77.Przeworski, Adam. 1985. Capitalism and Social Democracy. Cambridge, UK: Cambridge Univer-
sity Press.Przeworski, Adam, Michael E. Alvarez, José Antonio Cheibub and Fernando Limongi. 2000. De-
mocracy and Development: Political Institutions and Well-Being in the World, 1950-1990.Cambridge, UK: Cambridge University Press.
Przeworski, Adam and Fernando Limongi. 1993. “Political Regimes and Economic Growth.” Jour-nal of Economic Perspectives 7 (Summer): 51-69.
_________. 1997. “Democracy and Development.” Pp. 163-94 in Democracy’s Victory and Crisis,ed. Axel Hadenius. Cambridge, UK: Cambridge University Press.
Ragin, Charles C. and York W. Bradshaw. 1992. “International Economic Dependence and Hu-man Misery, 1938-1980: A Global Perspective.” Sociological Perspectives 35 (Summer):217-47.
Rao, Vaman. 1984-1985. “Democracy and Economic Development.” Studies in Comparative Inter-national Development 19 (Winter): 67-81.
Remmer, Karen. 1990. “Democracy and Economic Crisis: The Latin American Experience.” WorldPolitics 42 (April): 315-35.
Russett, Bruce M. and R. Joseph Monsen. 1975. “Bureaucracy and Polyarchy as Predictors ofPerformance: A Cross-National Examination.” Comparative Political Studies 8 (April): 5-31.
Ruttan, Vernon W. 1991. “What Happened to Political Development?” Economic Development andCultural Change 39 (January): 265-92.
Sala-i-Martin, Xavier X. 1997. “I Just Ran Two Million Regressions.” American Economic Review87 (March): 178-83.
Scully, Gerald W. 1988. “The Institutional Framework and Economic Development.” Journal ofPolitical Economy 96 (June): 652-62.
_________. 1992. Constitutional Environments and Economic Growth. Princeton, NJ: PrincetonUniversity Press.
Siermann, Clemens L. J. 1998. Politics, Institutions, and the Economic Performance of Nations.Cheltenham, UK: E. Elgar.
Sirowy, Larry and Alex Inkeles. 1990. “The Effects of Democracy on Economic Growth andInequality: A Review.” Studies in Comparative International Development 25 (Spring): 126-57.

Kurzman, Werum, Burkhart 33
Sklar, Richard L. 1987. “Developmental Democracy.” Comparative Studies in Society and History29 (October): 686-714.
Sloan, John and Kent L. Tedin. 1987. “The Consequences of Regime Type for Public Policy Out-puts.” Comparative Political Studies 20 (April): 98-124.
Sørensen, Georg. 1991. Democracy, Dictatorship and Development. London: Macmillan.Soysa, Indra de and John R. Oneal. 1999. “Boon or Bane? Reassessing the Productivity of Foreign
Direct Investment.” American Sociological Review 64 (October): 766-82.Stolzenberg, Ross M. 1980. “The Measurement and Decomposition of Causal Effects in Nonlinear
and Nonadditive Models.” Sociological Methodology 1980: 459-88.Summers, Robert and Alan Heston. 1991. “The Penn World Table (Mark 5): An Expanded Set of
International Comparisons, 1950-1988.” Quarterly Journal of Economics 106 (May): 327-68.
Trintzius, René. 1950. John Law et la naissance du dirigisme. Paris, France: SFELT.United Nations. 1992-1996. World Investment Directory, 6 Vols. New York: United Nations.Weede, Erich. 1983. “The Impact of Democracy on Economic Growth.” Kyklos 36 (February): 21-
39._________. 1993. “The Impact of Democracy or Repressiveness on the Quality of Life, Income
Distribution, and Economic Growth Rates.” International Sociology 8 (June): 177-95.World Bank. 1991. World Development Report 1991: The Challenge of Development. Oxford, UK:
Oxford University Press.