demand side management intervention on a large …
TRANSCRIPT

DEMAND SIDE MANAGEMENT
INTERVENTION ON A LARGE SCALE
CANAL PUMPING SCHEME
T.N.J. Zwiegers
22118624
Dissertation submitted in fulfilment of the requirements for
the degree Magister in Mechanical Engineering at the
Potchefstroom Campus of the North-West University
Supervisor: Dr. R. Pelzer
November 2015

DEMAND SIDE MANAGEMENT INTERVENTION ON A LARGE SCALE CANAL PUMPING SCHEME
i
Abstract
Title: Demand Side Management intervention on a large scale canal pumping
scheme
Author: TNJ Zwiegers
Promoter: Dr. R Pelzer
Faculty: Mechanical Engineering
Degree: Master of Engineering (Mechanical)
Key words: DSM interventions, ESCo, Eskom, Canal pumping scheme, load shifting
South Africa is the thirtieth driest country in the world and is classified as a semi-arid area.
The annual rainfall differs from less than 200 mm at the west coast to more than 1000 mm
on the east coast. The primary use of fresh water is for agricultural purposes.
It is necessary for large scale canal pumping schemes that enable the transfer of water over
vast distances. Canal pumping schemes are energy intensive systems. It is therefore
necessary to operate these schemes efficiently. From the investigation of DSM
interventions on other similar systems in the industry, it has been identified that it is possible
to implement a load shift intervention.
To ensure that a canal pumping scheme operates efficiently and cost effectively, the chosen
Demand Side Management (DSM) intervention is optimised and implemented on such a
site. An investigation was conducted to determine the possibility of an evening peak load
shift project. A proposed integrated strategy was simulated and an optimised approach was
developed. It was found plausible to implement a load shift intervention on the proposed
site.
The proposed load shift intervention was implemented on a large scale canal pumping
scheme in South Africa. An average evening peak period load shift impact of 4.67 MW was
achieved over a three month period, despite the seasonal effect during the implementation.
Load shift initiatives also realise the cost savings due to the pricing structure during peak
periods and off peak periods. The intervention resulted in an annual cost savings of
R3.2-million.

DEMAND SIDE MANAGEMENT INTERVENTION ON A LARGE SCALE CANAL PUMPING SCHEME
ii
It is concluded that the implementation of the control philosophy developed was successful.
Recommendations are made regarding the baseline as well as opportunities for further
research.

DEMAND SIDE MANAGEMENT INTERVENTION ON A LARGE SCALE CANAL PUMPING SCHEME
iii
Acknowledgements
This dissertation represents my own research. Various others also contributed through
discussions, cooperation, etc. As far as possible, recognition was given to all sources of
information.
I apologise if the necessary recognition was not given. If anyone is of the opinion that I did
not acknowledge their input, please contact me to make the necessary corrections.
Firstly, I would like to thank my parents, Jas and Zelda Zwiegers, for their encouragement,
love and support during this study.
I would like to use this opportunity to thank TEMMI and Enermanage for funding this
research and express my gratitude to Prof E.H. Mathews, Prof M. Kleingeld and Dr R. Pelzer
for giving me the opportunity to complete this study under their guidance and support.
Abrie Schutte, thank you for your valuable inputs and motivation throughout this study.
I would like to thank colleagues at TEMMI and Enermanage for their contributions
throughout the course of this study.
I thank my family and friends for all their ongoing love and support throughout my life.
Second to last, a special thanks to Amoré Kruger for all your love, support and motivation
during the study.
Finally, I thank God for the abilities given to me to complete this study. It would not have
been possible without His unconditional love and strength.

DEMAND SIDE MANAGEMENT INTERVENTION ON A LARGE SCALE CANAL PUMPING SCHEME
iv
Table of contents
Abstract ................................................................................................................... i
Acknowledgements .............................................................................................. iii
Table of contents .................................................................................................. iv
List of figures ........................................................................................................ vi
List of tables ......................................................................................................... ix
Nomenclature ........................................................................................................ x
Abbreviations ...................................................................................................... xii
CHAPTER 1 - INTRODUCTION ............................................................................. 1
1.1 Background ........................................................................................................ 2
1.2 Electricity situation in South Africa ...................................................................... 2
1.3 Need for DSM interventions ................................................................................ 7
1.4 Canal schemes in South Africa ..........................................................................11
1.5 Objectives of this study ......................................................................................14
1.6 Dissertation overview .........................................................................................14
CHAPTER 2 - Overview of DSM interventions and canal schemes ................ 16
2.1 Introduction ........................................................................................................17
2.2 Large scale irrigation canal pumping schemes ..................................................17
2.3 Existing DSM strategies on large pumping systems ...........................................32
2.4 Implications and risks associated with DSM interventions..................................39
2.5 Conclusion .........................................................................................................42
CHAPTER 3 - DSM methodology on large canal pumping schemes .............. 44
3.1 Introduction ........................................................................................................45
3.2 Investigation methodology .................................................................................45
3.3 Baseline verification and calculation ..................................................................50

DEMAND SIDE MANAGEMENT INTERVENTION ON A LARGE SCALE CANAL PUMPING SCHEME
v
3.4 Simulation of control philosophy ........................................................................55
3.5 Control philosophy verification ...........................................................................63
3.6 Conclusion .........................................................................................................68
CHAPTER 4 - Results .......................................................................................... 69
Introduction ........................................................................................................70
Implementation ..................................................................................................70
Performance assessment ..................................................................................74
Impact of this study ............................................................................................80
Potential for further optimisation ........................................................................81
Conclusion .........................................................................................................82
CHAPTER 5 - Conclusion and recommendations ............................................ 83
5.1 Conclusion .........................................................................................................84
5.2 Recommendations for further research ..............................................................86
References ........................................................................................................... 87

DEMAND SIDE MANAGEMENT INTERVENTION ON A LARGE SCALE CANAL PUMPING SCHEME
vi
List of figures
Figure 1: Breakdown of generating capacity of Eskom ...................................................... 3
Figure 2: SA vs UK sectorial electricity usage ................................................................... 4
Figure 3: Illustration of a typical residential load profile ..................................................... 5
Figure 4: Eskom Megaflex TOU periods ........................................................................... 6
Figure 5: Overview of workflow between the client and ESCo ........................................... 8
Figure 6: Typical energy-efficiency profile ......................................................................... 9
Figure 7: Typical load shifting profile ................................................................................10
Figure 8: Typical peak clipping profile ..............................................................................11
Figure 9: South Africa water use percentage per sector ...................................................11
Figure 10: Annual precipitation in South Africa.................................................................12
Figure 11: Orange River Basin layout ..............................................................................13
Figure 12: Basic layout of a typical canal pumping scheme .............................................18
Figure 13: Cross-section of variant canal shapes .............................................................19
Figure 14: Trapezoidal canal measurements ...................................................................19
Figure 15: Example of a free board ..................................................................................20
Figure 16: Free board height in relation to the flow rate ...................................................21
Figure 17: Overflowing canal ...........................................................................................21
Figure 18: Side slope .......................................................................................................22
Figure 19: Principle of a centrifugal pump ........................................................................24
Figure 20: Multistage centrifugal pump ............................................................................24
Figure 21: Split case centrifugal pump .............................................................................25

DEMAND SIDE MANAGEMENT INTERVENTION ON A LARGE SCALE CANAL PUMPING SCHEME
vii
Figure 22: Series pump configuration of flow vs head ......................................................26
Figure 23: Parallel pump configuration of flow vs head ....................................................27
Figure 24: Squirrel-cage induction motor .........................................................................28
Figure 25: Effect of cavitation on a centrifugal impeller ....................................................30
Figure 26: Complete system overview of case study control ............................................32
Figure 27: Motor current at start-up ..................................................................................41
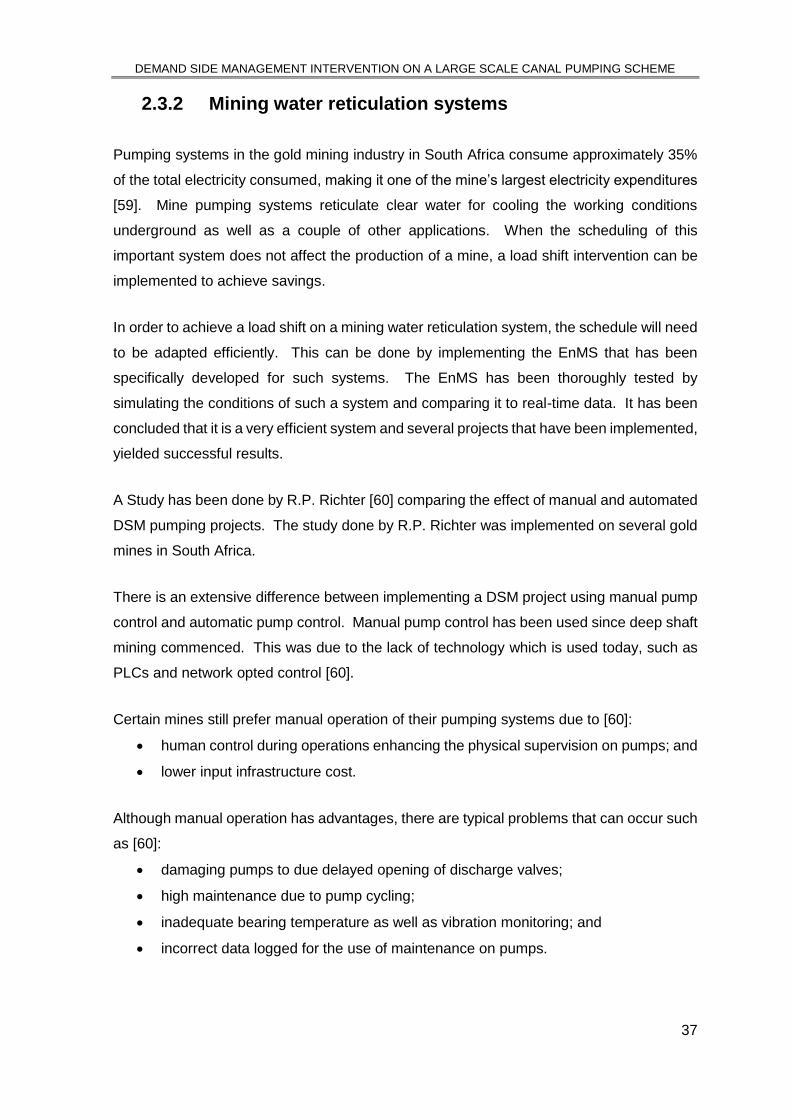
Figure 28: Basic site layout ..............................................................................................46
Figure 29: Satellite view of canal scheme S .....................................................................47
Figure 30: Canal scheme S layout ...................................................................................48
Figure 31: Electricity demand profile for the pump station ................................................50
Figure 32: Portable logger ...............................................................................................51
Figure 33: Voltage transformers (left) and current transformers (right) .............................51
Figure 34: Weekday, Saturday and Sunday baselines .....................................................52
Figure 35: Proposed load shifting profile ..........................................................................54
Figure 36: Inlet canal to pump station ..............................................................................56
Figure 37: Screenshot of reservoir in simulation ..............................................................56
Figure 38: Average monthly rainfall data 2008 – 2013 .....................................................58
Figure 39: Average monthly rainfall data 2014 .................................................................59
Figure 40: Annual water demand on canal scheme S ......................................................60
Figure 41: EnMS layout ...................................................................................................61
Figure 42: EnMS Simulation profile ..................................................................................62
Figure 43: Upstream reservoir level simulation result .......................................................63

DEMAND SIDE MANAGEMENT INTERVENTION ON A LARGE SCALE CANAL PUMPING SCHEME
viii
Figure 44: Weekday drop test results ...............................................................................64
Figure 45: Average drop test power profile result .............................................................65
Figure 46: Inlet canal drop test result ...............................................................................66
Figure 47: Saving results according to the water flow ......................................................67
Figure 48: Peak period power reduction possible per month ............................................67
Figure 49: EnMS layout used at canal scheme S .............................................................72
Figure 50: Ultrasonic flow meter ......................................................................................73
Figure 51: Daily power profile used in daily report ............................................................75
Figure 52: September performance assessment result ....................................................77
Figure 53: October performance assessment result .........................................................77
Figure 54: November performance assessment result .....................................................78
Figure 55: Performance assessment comparison ............................................................79
Figure 56: Average savings profile ...................................................................................79
Figure 57: Potential profile ...............................................................................................81

DEMAND SIDE MANAGEMENT INTERVENTION ON A LARGE SCALE CANAL PUMPING SCHEME
ix
List of tables
Table 1: Megaflex tariff structure 2014/2015 ..................................................................... 7
Table 2: Side slope ratio ..................................................................................................22
Table 3: Load Shift savings achieved by A. Nortjé ...........................................................36
Table 4: Load shift achieved by N.J.C.M de Kock ............................................................39
Table 5: Pump specifications ...........................................................................................49
Table 6: Dam/reservoir control levels ...............................................................................55
Table 7: Typical water use efficiencies of several crops in South Africa ...........................57
Table 8: Performance assessment savings ......................................................................76

DEMAND SIDE MANAGEMENT INTERVENTION ON A LARGE SCALE CANAL PUMPING SCHEME
x
Nomenclature
c/kWh cent per kilowatt hour (c/kWh)
g gravity constant (m/s2)
h hydraulic rate (m)
ha hectare (ha)
I supply current (A)
kg/m3 kilogram per cubic meter (kg/m3)
km kilometer (km)
kVA kilovolt-ampere (kVA)
kW kilowatt (kW)
l/s liter per second (l/s)
m3/s cubic meter per second (m3/s)
mm millimeter (mm)
MVA megavolt-ampere (MVA)
MW megawatt (MW)
η efficiency (%)
Ρ density of liquid (kg/m3)
Pelec electric power (Watt)
P power (W)
Pf power factor (-)

DEMAND SIDE MANAGEMENT INTERVENTION ON A LARGE SCALE CANAL PUMPING SCHEME
xi
Ph hydraulic power (Watt)
T torque (Nm)
𝜔 angular velocity (rad/s)
Q flow rate (m3/s)
R rand ®
R/kVA rand per kilovolt ampere (R/kVA)
R/kW rand per kilowatt (R/kW)
V supply voltage (V)

DEMAND SIDE MANAGEMENT INTERVENTION ON A LARGE SCALE CANAL PUMPING SCHEME
xii
Abbreviations
CT current transformer
DSM Demand Side Management
DWA department of water affairs
EE Energy Efficiency
EnMS energy management system
ESCo energy services company
GSM global system for mobile
HMI Human Machine Interface
IDM Industrial Demand Management
MPC model predictive control
M&V measurement and verification
NMD notified maximum demand
OLE Object Linking & Embedding
OPC OLE for Process Control
PLC Programmable Logic Controller
SCADA supervisory control and data acquisition
TDS total dissolved solids
TOU time of use
VCB vacuum circuit breaker

DEMAND SIDE MANAGEMENT INTERVENTION ON A LARGE SCALE CANAL PUMPING SCHEME
xiii
VSD Variable Speed Drive
VT voltage transformer
WFD water flow demand

DEMAND SIDE MANAGEMENT INTERVENTION ON A LARGE SCALE CANAL PUMPING SCHEME
1
CHAPTER 1 - INTRODUCTION
Chapter 1 provides a brief description of the electricity situation in South Africa and the need
for DSM interventions. Canal schemes in South Africa are also discussed briefly.

DEMAND SIDE MANAGEMENT INTERVENTION ON A LARGE SCALE CANAL PUMPING SCHEME
2
1.1 Background
Irrigation canal pumping schemes supply water to remote tillage land that has little to
no water access. Land is made available to produce food and thus ensures national
food security in South Africa.
Water is an essential resource to the economy and its people. Water needs to be
pumped over vast distances for different applications such as public water supply,
industry and agriculture.
Water distribution schemes are very energy intensive systems. By regulating the usage
of electricity for this industry, large savings can be obtained. Eskom’s Demand-Side
Management (DSM) initiatives encourage very large electricity users to reduce peak
demand.
1.2 Electricity situation in South Africa
South Africa’s primary electricity provider, Eskom, supplies approximately 45% of Africa’s
electricity as well as 95% of South Africa’s electricity [1]. Eskom generates and distributes
electricity to more than 5 million households and industries [2]. It is important for Eskom to
ensure that sufficient supply of electricity is available to meet the demand of the consumers.
The problem that Eskom experiences is to ensure sufficient demand to the consumer at all
times. It is difficult to ensure consistent supply due to:
the continuous growth of consumers requiring the electricity services; and
the peak periods when the demand is at a maximum.
When Eskom cannot provide the required demand for electricity, load shedding or load
reduction is implemented. This means that a certain amount of electricity is taken out of the
entire electricity grid to stabilise the system. This is implemented countrywide as a
controlled option to protect the total electricity power grid from a total blackout [2].
A total blackout means that the power system will trip, taking the entire power grid offline.
Load shedding is implemented to temporarily lower the demand for electricity.
South Africa started experiencing load shedding in the year 2007. Since then Eskom
implemented measures to ensure maintenance of their power plants, increasing coal supply

DEMAND SIDE MANAGEMENT INTERVENTION ON A LARGE SCALE CANAL PUMPING SCHEME
3
and improving plant performance. These measures led to the suspension of load shedding
in May 2008 and onwards [3].
Coal is the world’s most used primary fuel, accounting 36% of total fuel consumption
internationally [4]. South Africa contains the world’s ninth-largest amount of recoverable
coal reserves and 95% of Africa’s coal reserves [5].
The installed capacity of Eskom’s electricity generation is a total of 44 084 MW, from which
37 745 MW is coal fired [1]. The remaining 6 339 MW is generated through nuclear stations,
hydro stations, gas fired stations and pumped storage schemes. Figure 1 below illustrates
the generation capacity of Eskom.
Figure 1: Breakdown of generating capacity of Eskom (adapted from [1])
In 2014, load shedding was reintroduced. Several electricity generation plants were forced
to shut down due to the maintenance backlog. Poor management implicated a generation
capacity short come [6].
The first big six-unit coal-fired stations were built in the 1970’s with an expected life of 40
years [7]. The average age of all Eskom’s power stations are approximately 30 years.
DEMAND SIDE MANAGEMENT INTERVENTION ON A LARGE SCALE CANAL PUMPING SCHEME
4
1.2.1 Time of Use (TOU)
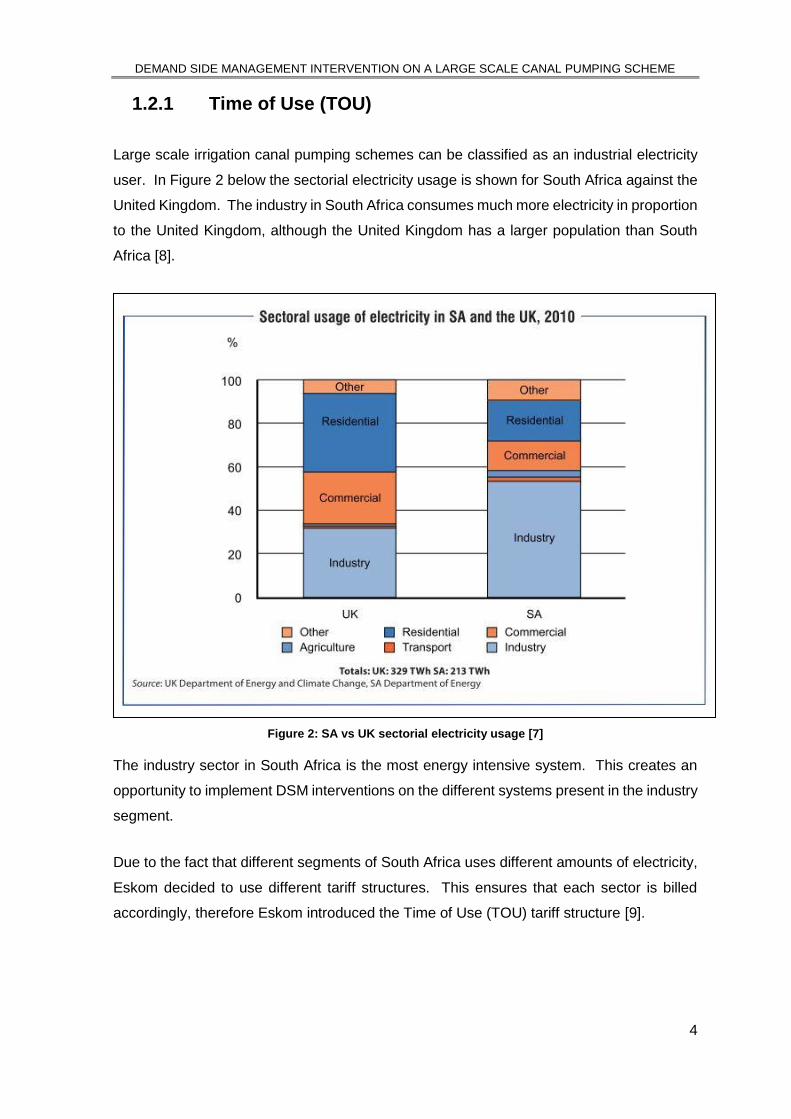
Large scale irrigation canal pumping schemes can be classified as an industrial electricity
user. In Figure 2 below the sectorial electricity usage is shown for South Africa against the
United Kingdom. The industry in South Africa consumes much more electricity in proportion
to the United Kingdom, although the United Kingdom has a larger population than South
Africa [8].
Figure 2: SA vs UK sectorial electricity usage [7]
The industry sector in South Africa is the most energy intensive system. This creates an
opportunity to implement DSM interventions on the different systems present in the industry
segment.
Due to the fact that different segments of South Africa uses different amounts of electricity,
Eskom decided to use different tariff structures. This ensures that each sector is billed
accordingly, therefore Eskom introduced the Time of Use (TOU) tariff structure [9].

DEMAND SIDE MANAGEMENT INTERVENTION ON A LARGE SCALE CANAL PUMPING SCHEME
5
TOU tariffs are a mechanism utilised by utilities to influence behavioural change in terms of
electricity use, in this case the morning and evening peak periods of the low and high
demand seasons.
The TOU tariff structure bills each consumer according to the electricity used at different
times of a 24-hour profile day. Every electricity consumer has a different load profile. Figure
3 illustrates a typical residential load profile.
Figure 3: Illustration of a typical residential load profile (adapted from [10])
It can be seen in Figure 3 that there are two peak periods. One in the morning and another
in the afternoon. There are also two different demand seasons during a year. The charges
during each season and time period differ as well.
These charges differ between the high demand winter schedule (June to August) and low-
demand summer schedule (September to May) as well as the different peak, off-peak and
standard peak rates during a day. Eskom uses different TOU tariffs in line with developed
countries worldwide, namely, Miniflex (>25 kVA and <5 MVA), Ruraflex (>25 kVA) and
Megaflex (>1 MVA) [11].
Only the Megaflex TOU tariff structure is applicable to this dissertation and will be discussed
briefly. The Megaflex TOU tariff is relevant to customers with a notified maximum demand
0
1
2
3
4
5
6
7
0 1 2 3 4 5 6 7 8 9 10 11 12 13 14 15 16 17 18 19 20 21 22 23
Ave
rag
e L
oa
d (
kW
)
Time of day (hour)
Typical residential load profile

DEMAND SIDE MANAGEMENT INTERVENTION ON A LARGE SCALE CANAL PUMPING SCHEME
6
(NMD) greater than 1 MVA that are able to save electricity through different electricity saving
interventions such as load shifting.
Figure 4 shows the Megaflex TOU periods as stipulated by Eskom. The following charges
are applicable according to Eskom [12]:
seasonally and time-of-use differentiated c/kWh active energy charges including
losses, based on the supply voltage as well as the transmission zone;
the three time-of-use periods namely peak, off-peak and standard;
an ancillary service charge (c/kWh) based on supply voltage during all time
periods;
demand charge (R/kVA or R/kW) differentiated seasonally;
percentage surcharge for transmission or discount for high voltage; and
basic charge per month (R).
In Figure 4 below, the TOU periods, namely peak, standard and off-peak periods are shown.
Each of these mentioned periods has its own tariff structure. Thus electricity costs are not
the same in the different time periods of a 24-hour daily profile.
Figure 4: Eskom Megaflex TOU periods [13]

DEMAND SIDE MANAGEMENT INTERVENTION ON A LARGE SCALE CANAL PUMPING SCHEME
7
Indicated in Table 1 below is the tariff structure for the Megaflex TOU periods 2014/2015.
It can be noted that the energy charge for the peak period during the high demand season
is more than three times than the standard energy charge. Large cost savings can be
obtained by implementing electricity saving interventions.
Table 1: Megaflex tariff structure 2014/2015 (adapted from [12])
Megaflex Active energy charge [c/kWh]
Transmission zone
Supply voltage
High demand season [Jun - Aug]
Low demand season [Sept - May]
Peak Standard Off-peak Peak Standard Off-peak
≤ 300km ≥ 500V & < 66kV 222.73 67.48 36.64 72.66 50.01 31.73
The electricity situation in South Africa was discussed. It is clear that Eskom lacks on the
supply side of their electricity network. Eskom introduced TOU tariff structures to bill each
client according to their electricity usage. The TOU tariff structure most applicable to this
dissertation has also been discussed.
In order to minimise the demand for electricity during the peak periods, Eskom introduced
the DSM programme. This will be discussed in section 1.3.
1.3 Need for DSM interventions
From Section 1.2 it is known that there is an electricity supply problem in South Africa. In
this section the need for DSM interventions will be looked at.
DSM was initially set in place to reduce the peak electricity demand in order for utilities to
delay the building of further generation capacity. DSM reduces the overall electricity load
of a power grid network. Implementing DSM also benefits the user with cost savings [14].
In order to implement DSM interventions on certain sectors, an Energy Services company
(ESCo) is necessary.
ESCos play a significant role in the successful implementation of DSM projects. ESCos act
as project managers to manage a specific project. Typically, ESCos will offer the following
services [15]:
feasibility studies;
design, develop and arrange financing for energy efficiency projects;
install and maintain the energy-efficient equipment relevant to application;
monitor, measure and verify the energy savings achieved; and

DEMAND SIDE MANAGEMENT INTERVENTION ON A LARGE SCALE CANAL PUMPING SCHEME
8
take on all or part of the risk of savings that each project will achieve during
implementation.
When Eskom announces funding availability for DSM initiatives, ESCos submit tenders for
possible electricity savings projects. Thus ESCos must ensure savings through successful
implementation and monitoring of a specific project. An example of the project steps
required to implement such a project can be seen in Figure 5 below [16]:
Figure 5: Overview of workflow between the client and ESCo
This process ensures the validity of the project implemented. The documentation,
therefore, supplies Eskom with substantial proof that the ESCo implemented the project
with the savings indicated. Due to the large electricity consumption of the water distribution
utilities, there are significant opportunities to implement DSM projects.
1. Project Development (Pre-Procurement)
2A. Tender announcement & ESCo qualification
2B. Tender documents
2C. ESCo offer
2D. Negotiations, tender evaluation
2E. Awarding of contract
3. Detailed planning, implementation and commisioning
4A. Service delivery
4B. Controlling, M&V and quality assurance, reporting and invoicing
2 Months
1,5 months
1 – 2 months
1 – 1,5 months
3 x 0,5 months
0,5 – 1 months
Construction
Contract term
Contract term
Black = Client (& Facilitator); Red = ESCo

DEMAND SIDE MANAGEMENT INTERVENTION ON A LARGE SCALE CANAL PUMPING SCHEME
9
As the demand for electricity increases annually, different Industrial Demand Management
(IDM) initiatives were launched such as energy efficiency (EE) initiatives as well as DSM.
The need for EE/DSM led to the formulation of specific policies and regulations as stipulated
in the Regulatory Policy on Energy Efficiency and Demand Side Management [17]. Among
the outcomes to be achieved through the EE/DSM policy are [18]:
quick power system relief;
relative cost effectiveness;
quick deployment of interventions across residential, commercial and industrial
sectors as well as quality employment;
mitigation of greenhouse gas emissions and the resulting climate change impacts;
and
participants will realise relief from their electricity bills.
There are three different electricity saving initiatives set in place, namely energy efficiency,
load shifting and peak clipping. The peak periods as stipulated in Megaflex tariffs, are
highlighted below in Figure 6, Figure 7 and Figure 8. Each of the three initiatives will be
discussed briefly.
Energy efficiency is the application of reducing energy usage to result in the same amount
of work previously done. This can be achieved by replacing equipment with more efficient
equipment, resulting in less electricity consumed to perform the same work output. In Figure
6, a typical profile of energy efficiency is shown.
Figure 6: Typical energy-efficiency profile (adapted from [19])
05
101520253035404550
0:0
0
1:0
0
2:0
0
3:0
0
4:0
0
5:0
0
6:0
0
7:0
0
8:0
0
9:0
0
10
:00
11
:00
12
:00
13
:00
14
:00
15
:00
16
:00
17
:00
18
:00
19
:00
20
:00
21
:00
22
:00
23
:00
Dem
an
d [
MW
]
Time [Hour]
Electrical demand profile
Eskom peak period Normal profile Energy efficiency profile

DEMAND SIDE MANAGEMENT INTERVENTION ON A LARGE SCALE CANAL PUMPING SCHEME
10
Load shifting takes place when electricity usage is shifted from the peak periods to non-
peak periods to result in a better load distribution for Eskom, as well as better pricing for the
consumer. It is important to note that this does not result in electricity savings and only cost
savings. In Figure 7 a typical load shift profile is shown.
Figure 7: Typical load shifting profile (adapted from [19])
With peak clipping, electricity consumption is reduced during the peak periods. This
consumption is not recovered in the off-peak periods. Figure 8 below indicates a typical
peak clipping profile. Electricity savings as well as cost savings are realised with this
intervention.
05
101520253035404550
0:0
0
1:0
0
2:0
0
3:0
0
4:0
0
5:0
0
6:0
0
7:0
0
8:0
0
9:0
0
10
:00
11
:00
12
:00
13
:00
14
:00
15
:00
16
:00
17
:00
18
:00
19
:00
20
:00
21
:00
22
:00
23
:00
Dem
an
d [
MW
]
Time [Hour]
Electrical demand profile
Eskom peak period Normal profile Load shift profile

DEMAND SIDE MANAGEMENT INTERVENTION ON A LARGE SCALE CANAL PUMPING SCHEME
11
Figure 8: Typical peak clipping profile (adapted from [19])
1.4 Canal schemes in South Africa
South Africa is the 30th driest country in the world [20], making it a semi-arid area. From
these available water resources, approximately 60% of the available water is used for
agricultural irrigation purposes. Figure 9 below illustrates the water usage per sector.
Figure 9: South Africa water use percentage per sector [21]
05
101520253035404550
0:0
0
1:0
0
2:0
0
3:0
0
4:0
0
5:0
0
6:0
0
7:0
0
8:0
0
9:0
0
10
:00
11
:00
12
:00
13
:00
14
:00
15
:00
16
:00
17
:00
18
:00
19
:00
20
:00
21
:00
22
:00
23
:00
Dem
an
d [
MW
]
Time [Hour]
Electrical demand profile
Eskom peak period Normal profile Peak clip profile
58%
5%
20%
3%
14%
Water use per sector
Agriculture
Commercial
Industry
Mining
Water supply service

DEMAND SIDE MANAGEMENT INTERVENTION ON A LARGE SCALE CANAL PUMPING SCHEME
12
South Africa has rich amounts of fertile soil, which is underutilised due to the lack of water
access. Certain parts of South Africa utilise canal schemes to solve this problem. A canal
system will typically be built from one water source (dam, river or lake) over a vast dry or
water scarce area and then ending in another water source. There are various water
irrigation schemes located in the semi-arid areas of South Africa.
South Africa is classified as a semi-arid area. The total amount of land in South Africa is
approximately 102 million ha. South Africa receives an annual average rainfall of 501 mm
[22].
In Figure 10 it is illustrated that less than 200 mm rainfall is experienced along the arid west
coast. In the east coast side of South Africa, as much as 1 000 mm and more is experienced
annually. The problem with this type of climate is that the more fertile ground for crops is
located to the west side of South Africa, where less rainfall is experienced.
Figure 10: Annual precipitation in South Africa [23]

DEMAND SIDE MANAGEMENT INTERVENTION ON A LARGE SCALE CANAL PUMPING SCHEME
13
The area in South Africa where the largest fresh water system is located, has an annual
rainfall of 600mm [23]. In Figure 11 the Orange River basin is shown, which stretches
throughout South Africa and in parts of Namibia and Botswana. This basin is one of the
largest river basins south of the Zambezi and has a catchment area of about
0.9 million km2 [22].
Figure 11: Orange River Basin layout [22]
Most of the irrigation schemes are sourced out of this river basin. This includes very large
areas of the Northern and Western Cape as well as the Free State province. Due to the
topography of most irrigation schemes, water needs to be pumped to a higher point of
elevation to ensure sufficient water flow. These pump stations usually require large pumps
to ensure a sufficient head. These pump stations are energy intensive and therefore this
creates viable opportunities for ESCos to implement DSM initiatives.

DEMAND SIDE MANAGEMENT INTERVENTION ON A LARGE SCALE CANAL PUMPING SCHEME
14
In 2010, there was a recorded total of 302 small scale irrigation canals in South Africa.
These irrigation canal schemes had a command area with a total of 47 667 ha. The primary
water source for these small scale irrigation canal schemes is 96.7 % from rivers [24].
1.5 Objectives of this study
The objectives of this study are summarised below:
investigate and understand different DSM interventions on pumping systems and
the effect on a typical canal scheme;
develop a DSM intervention strategy and the control system for implementation;
simulate the control system and verify the results with a drop test;
optimise the control system for a specific case study;
implement the control system on specific case study;
validate the results obtained from the implemented control system;
discuss the results obtained; and
make recommendations for further optimisation as well as further research.
1.6 Dissertation overview
In Chapter 1 the energy generation and electricity demand of South Africa was discussed.
It is also identified that South Africa has an uneven water distribution. It was concluded that
canal pumping schemes are necessary for water distribution. Canal schemes in South
Africa are also discussed in Chapter 1.
In Chapter 2, typical large scale canal pumping schemes will be discussed. It will be
followed with the investigation of DSM strategies implemented on large scale pumping
systems. From the literature survey implications and risks of these DSM strategies
implemented will be discussed.
Chapter 3 will focus on the development and implementation of the proposed control
philosophy specific to the case study chosen for this dissertation. A simulation will be
developed for the control philosophy. The reader will also be introduced to the case study
plant and its unique challenges.
Chapter 4 focuses on the implementation and verification of the proposed control
philosophy on the case study. The results obtained will be discussed in comparison with
the results of the simulation for this case study. From here the impact of the study as well

DEMAND SIDE MANAGEMENT INTERVENTION ON A LARGE SCALE CANAL PUMPING SCHEME
15
as the unique challenges faced during the implementation of this study will be discussed.
The potential for further optimisation will be discussed.
Chapter 5 will conclude the study as well as recommend further research on this topic.

DEMAND SIDE MANAGEMENT INTERVENTION ON A LARGE SCALE CANAL PUMPING SCHEME
16
CHAPTER 2 - Overview of DSM
interventions and canal
schemes
Chapter 2 focuses on large scale irrigation canal schemes worldwide. Existing DSM
strategies implemented on similar systems are also discussed as well as the implications
and risks thereof.

DEMAND SIDE MANAGEMENT INTERVENTION ON A LARGE SCALE CANAL PUMPING SCHEME
17
2.1 Introduction
In Chapter 1, the electricity situation in South Africa was discussed, and it was concluded
that there is an electricity shortage. The importance of DSM initiatives was discussed. It
was determined in Chapter 1 that South Africa is a semi-arid area. Water needs to be
distributed over vast distances. Canal schemes in South Africa were subsequently
discussed.
In Chapter 2 the entire working of canal pumping schemes will be discussed. Information
is provided regarding studies done on similar systems. The existing DSM strategies on
pumping systems in the industry are discussed to provide a solid background. The
implications and risks of DSM initiatives are also discussed.
2.2 Large scale irrigation canal pumping schemes
2.2.1 Canals
Irrigation uses a total of 70% of the freshwater available in the world, resulting in the largest
user of freshwater. These irrigation practices produce up to 40% of the world’s food crops
on only 17% of all arable land available [25].
With the ever growing demand for food and increasingly scarce water supply, it is very
important to manage water resources sustainably. Large scale irrigation canal pumping
schemes, therefore, need to be designed, built and managed efficiently. Minimum loss of
water throughout the transfer and management thereof is crucial.
Irrigation schemes are divided into two categories namely large– and medium irrigation
schemes. A large irrigation scheme can be defined as a scheme that has a culturable
command area of more than 10 000 ha, whereas a medium irrigation scheme is defined as
a scheme that has a culturable command area of between 1 000 and 2 000 ha [26]. For
the purposes of this dissertation, the focus is on large scale irrigation schemes.
Each canal scheme has its own design specifications according to the water demand. Thus
the water flow and supply capacity needs to meet the demand. The increasing water
demand is also taken into consideration.

DEMAND SIDE MANAGEMENT INTERVENTION ON A LARGE SCALE CANAL PUMPING SCHEME
18
The starting point of an irrigation canal pumping scheme is a water source such as a river,
dam, lake, storage basin, mountain flow, etc. [27]. From there, the water is transferred by
means of a canal. Water can either be gravity fed to a certain point of elevation from where
the water is pumped; or pumped directly out of the water source. From the pump station,
water is then pumped to a higher geographical area from where it is then gravity fed over
vast distances.
Alongside the flow of the canal, water is then extracted for agricultural use or it is pumped
into a balancing dam/reservoir from where water is extracted. The remainder of the water
which is not extracted, is usually transferred to another water source such as a river. The
canal system will always end up flowing into another water source. In Figure 12, a basic
layout of a typical canal pumping scheme is shown. The black arrows indicate the direction
of flow of the fresh water.
Figure 12: Basic layout of a typical canal pumping scheme
Canal designs can vary based on the shape of its cross-section. These shapes are
numbered and shown in Figure 13, below. The forms include:
square (A);
triangular (B);
trapezoidal (C);
circular (D);
parabolic (E); and
Fresh
water
dam
River
Canal
River
Balancing dam
Canal outflow
Pump station
Canal outflow
Culturable land
Culturable land
Culturable land
River

DEMAND SIDE MANAGEMENT INTERVENTION ON A LARGE SCALE CANAL PUMPING SCHEME
19
irregular (F).
Figure 13: Cross-section of variant canal shapes [28]
The most common shape used is the trapezoidal cross-section (C). Trapezoidal cross-
section canals can again be divided into a symmetrical and non-symmetrical shape. For
the purposes of this dissertation, only trapezoidal symmetrical cross-section canals will be
discussed. A typical trapezoidal canal is shown below in Figure 14.
Figure 14: Trapezoidal canal measurements [28]
From Figure 14 above:
a = top width of the canal
a1 = top width of water level
h = height of the canal
h1 = height or depth of the water in the canal
b = bottom width of the canal
h;w = side slope of the canal
f = free board (h - h1)

DEMAND SIDE MANAGEMENT INTERVENTION ON A LARGE SCALE CANAL PUMPING SCHEME
20
Free board refers to the extra depth of a canal section which is above the water surface. A
free board will ensure a 100% flow rate capacity in a canal. To allow for certain conditions,
a free board value is required to be added extra for the maximum expected depth. The
conditions include [29]:
difference or deviations between design and construction;
operational flexibility (as well as operator mistakes);
hydraulic jumps;
uneven land settlement after construction due to earth composition;
accommodation of transient flow conditions;
increasing hydraulic roughness due to lining deterioration, weed growth; and
wind loading.
An example of a free board is shown in Figure 15. It can be observed that the design of
this specific canal was done sufficiently.
Figure 15: Example of a free board [29]
It is therefore important to keep the free board height in consideration during the design
phases of a canal. In Figure 16, the relation of the free board height and the flow rate of
water is shown. It can be seen that the higher the flow rate of a canal, the higher the bank
height or free board needs to be.

DEMAND SIDE MANAGEMENT INTERVENTION ON A LARGE SCALE CANAL PUMPING SCHEME
21
Figure 16: Free board height in relation to the flow rate [29]
Upon choosing the correct free board height, it needs to be operated within its design
parameters. When a canal is flooded, damage can be caused. An overflowing canal,
shown below in Figure 17 can have various negative effects. Firstly the precious water
resource is being wasted. Enormous erosive damage is also caused alongside the canal
walls. This damage can lead to significant amounts of financial expenditure.
Figure 17: Overflowing canal [29]

DEMAND SIDE MANAGEMENT INTERVENTION ON A LARGE SCALE CANAL PUMPING SCHEME
22
The side slope of the canal which, is not illustrated in Figure 14, is calculated in ratio. There
are different ratios applicable to the type of material used for the lining of the canal. In Table
2 below the ratio of the acceptable slope is shown in relation to the material choice [30].
Table 2: Side slope ratio [30]
Material Side slope (Ratio)
Rock Nearly vertical
Muck and peat soils ¼:1
Stiff clay or earth with concrete lining ½:1 to 1:1
Earth with stone lining or each for large channels 1:1
Firm clay or earth for small ditches 1 ½:1
Loose, sandy earth 2:1
Sandy loam or porous clay 3:1
The side slope’s ratio is compared to the vertical height of the canal. An example of a loose,
sandy earth slope (2:1) can be observed below in Figure 18. The ratio 2:1 means that the
length of the slope is two times the distance of the vertical height (w:h = 2:1)
Figure 18: Side slope [28]
Two types of canals are used to transfer water, namely earthen canals and lined canals.
Earthen canals are basically dug in the ground and the bank of the canal is made up of the
removed earth. These type of canals require high maintenance and has high water loss
due to seepage. Earthen canals are not an effective solution for long distance water
transfers and is not considered for large scale canal pumping schemes.
As seen in Table 2, there are many different types of lined canals. Lined canals are built
for five primary reasons namely:

DEMAND SIDE MANAGEMENT INTERVENTION ON A LARGE SCALE CANAL PUMPING SCHEME
23
transmission of water at high velocities through areas of difficult excavation in a
cost effective fashion;
transmission of water at high velocities at a reduced construction cost;
to decrease canal seepage, which conserves water;
to reduce annual operation and maintenance costs; and
to ensure stability of the canal section.
In South Africa, canals are maintained, kept operational and as efficient as possible. Canal
inspections are done annually, which is referred to as the “dry week”. During this period no
water is transferred and inspection is done on the lining of the canal. Any cracks formed
are fixed accordingly and weed growth in the canal is removed.
2.2.2 Pumps
Pump stations used in the canal schemes are operated to deliver constant flow rates.
Typical pumps and the electric motors will be discussed. As well as typical problems
encountered with such systems.
For applications such as water distribution, centrifugal pumps are the most widely used [31].
The different types of centrifugal pumps will be discussed.
The principle of the centrifugal pump is to increase the pressure from the pump inlet to the
outlet. This is done by transferring mechanical energy from the motor to the fluid by means
of the rotating impeller [32].
The operation of the centrifugal pump starts with the rotation of the impeller. As the impeller
rotates, liquid starts to move, guided by the shape of the inlet vanes. These vanes force
the liquid through the impeller vanes to the outlet of the pump. This flow causes a partial
vacuum at the inlet and atmospheric pressure causes the system to rotate continuously.
As the liquid exits the vanes of the pump, the desired velocity is reached.[33]
As a result of this operation, pressurized fluid exits the pump discharge at a certain delivery
pressure [34]. In Figure 19 the principle of a centrifugal pump is shown.

DEMAND SIDE MANAGEMENT INTERVENTION ON A LARGE SCALE CANAL PUMPING SCHEME
24
Figure 19: Principle of a centrifugal pump [32]
If the delivery pressure required is more than the efficient design of a single stage centrifugal
pump, multiple stages are added. This is known as a multistage centrifugal pump. A
multistage centrifugal pump has more than one impeller on a single shaft. The impellers
are consequently arranged in series. The discharge of one impeller is the suction for the
next impeller, meaning the water is pumped from one impeller to the next. This provides a
much larger pump head [35]. The multistage centrifugal pump is presented in Figure 20.
Figure 20: Multistage centrifugal pump [36]

DEMAND SIDE MANAGEMENT INTERVENTION ON A LARGE SCALE CANAL PUMPING SCHEME
25
Another widely used type of centrifugal pump, is the double-suction single stage pump. It
consists of two general single stage centrifugal pumps mounted back-to-back, each with its
own impeller. An example is shown in Figure 21, where the two impellers are driven by the
same shaft. Two types, namely vertical and horizontal split case pumps are available. They
differ from each other in respect of the manner in which their volute casings open. These
casings are also referred to as a split casing centrifugal pump [37].
Figure 21 indicates a horizontal split case centrifugal pump. This pump has a better head
delivery and is more efficient in transferring large amounts of water. Centrifugal pumps are
also available with submerging capabilities. These submersible centrifugal pumps are not
commonly used in large scale canal scheme applications.
Figure 21: Split case centrifugal pump [36]
Transferring water through a canal scheme usually requires the capability to overcome high
static pressure heads. A high flow rate is also required to meet the demand for water for all
the irrigated crops. Proportionally high power is also required. This can be determined by
using the hydraulic power equation (1).
𝑃ℎ = 𝜌∗𝑔∗𝑄∗ℎ
η (1)
IMPELLER
SHAFTBEARING
SUCTION
DISCHARGE

DEMAND SIDE MANAGEMENT INTERVENTION ON A LARGE SCALE CANAL PUMPING SCHEME
26
Where:
Ph = Hydraulic power (Watt)
ρ = Density of liquid (kg/m3)
g = Gravity constant (m/s2)
Q = Flow rate (m3/s)
h = Hydraulic rate (m)
η = Efficiency (dimensionless)
The configuration of centrifugal pump sets can differ from site to site. It can either be set
up in series, parallel or a combination of series and parallel. Pumps set up in series deliver
a better pressure head.
Each pump handles the same flow rate, but the total head produced is an additive of the
pumps used [38]. This is often done to ensure a better inlet pressure for the secondary
pump when pump set configurations are set up. In Figure 22, the difference between a
single and double series pump configuration is shown.
Figure 22: Series pump configuration of flow vs head [39]
A configuration of parallel pumps increases the flow rate. This means that the flow rates
are additive with a common head [38]. This configuration is the most often used in the water

DEMAND SIDE MANAGEMENT INTERVENTION ON A LARGE SCALE CANAL PUMPING SCHEME
27
pumping industry. In Figure 23, the difference between a single and double parallel pump
configuration is shown.
Figure 23: Parallel pump configuration of flow vs head [39]
It is thus important to choose the most applicable pump for the specific application. It is
also important to select the correct configuration upon the choice of head or flow. Following
on the choice of a pump, it is also necessary to use the correct motor to power the pump.
This will be discussed in the following section.
2.2.3 Motors
In order to supply the necessary electrical energy to these pumps, the correct electric motor
is required. The most commonly used electric motor is the squirrel-cage induction motor.
Electrical energy is converted into mechanical energy from the magnetic flux through the
magnetic circuits. The circuit is formed by the stator and rotor [40].
In order for torque to be created on the motor shaft, a moment of force is created by the
magnetic flux linkage between the stator and rotor. The power output is defined by the
speed of rotation on the shaft given in (2) [41]. This power drives the shaft and transfers
energy to the pump.
𝑃 = 𝑇 ∗ 𝜔 (2)
DEMAND SIDE MANAGEMENT INTERVENTION ON A LARGE SCALE CANAL PUMPING SCHEME
28
Where:
P = Power
T = Torque
𝜔 = Angular velocity
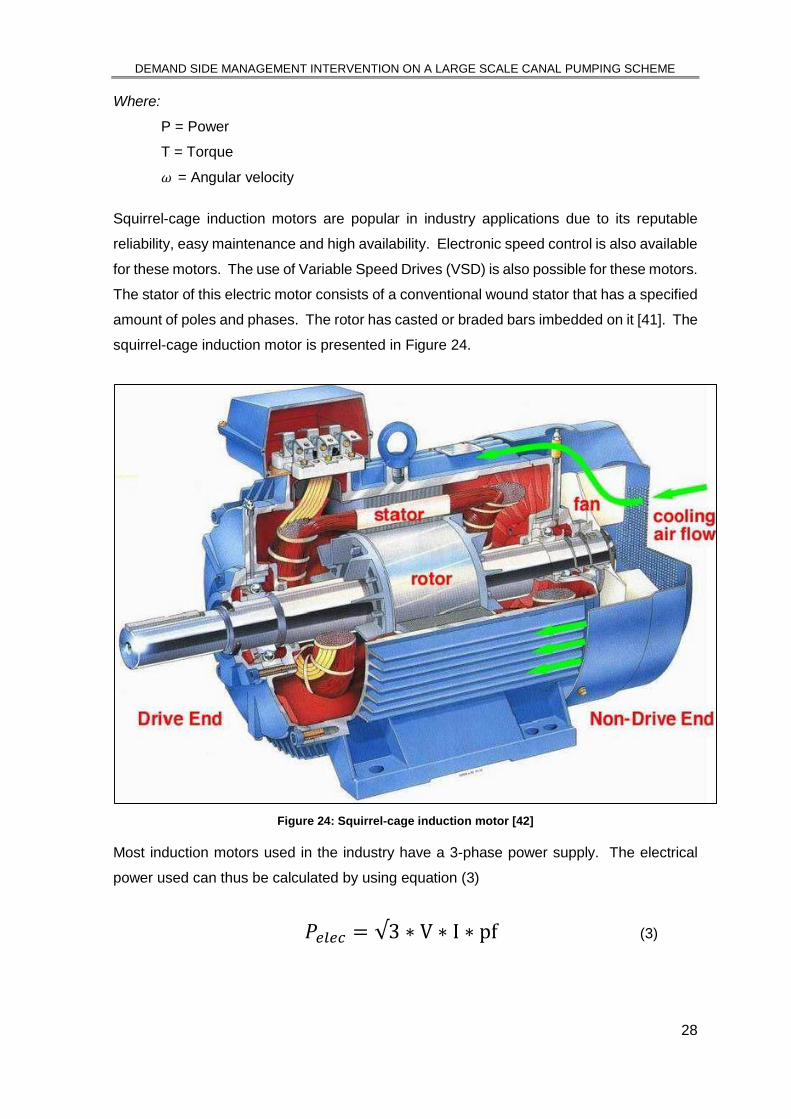
Squirrel-cage induction motors are popular in industry applications due to its reputable
reliability, easy maintenance and high availability. Electronic speed control is also available
for these motors. The use of Variable Speed Drives (VSD) is also possible for these motors.
The stator of this electric motor consists of a conventional wound stator that has a specified
amount of poles and phases. The rotor has casted or braded bars imbedded on it [41]. The
squirrel-cage induction motor is presented in Figure 24.
Figure 24: Squirrel-cage induction motor [42]
Most induction motors used in the industry have a 3-phase power supply. The electrical
power used can thus be calculated by using equation (3)
𝑃𝑒𝑙𝑒𝑐 = √3 ∗ V ∗ I ∗ pf (3)

DEMAND SIDE MANAGEMENT INTERVENTION ON A LARGE SCALE CANAL PUMPING SCHEME
29
Where:
Pelec = Electric power (Watt)
V = Supply voltage (V)
I = Supply current (A)
pf = Power factor (dimensionless)
In order to determine the efficiency, the pump and motor need to be taken into
consideration. Therefore a combination of equations (1) and (3) can be used. The
efficiency of the pump and motor can be defined in equation (4).
η =𝑃ℎ
𝑃𝑒𝑙𝑒𝑐 (4)
Using the mentioned equations namely (1), (3) and (4), the most applicable motor can be
chosen for the pump. If the selections are made to be sufficient, the entire system will be
more efficient and there will be less unnecessary maintenance.
2.2.4 Problems encountered
Various problems have been encountered on the water transfer systems in canal schemes.
The problems include cavitation, choked flow and water hammering.
Cavitation is a phenomenon that is encountered when the suction pressure drops below the
vapor pressure of the liquid. This causes vapor bubbles to form in the liquid. These bubbles
are formed at the inlet of the impeller when the pressure drops as the velocity increases.
The liquid stage of the fluid changes to the gas stage. The bubbles formed at the inlet of
the impeller then move to a higher pressure range alongside the impeller vanes. There they
collapse and a large force is exerted on the impeller. This results in pitting on the impeller
vanes [43].
The impeller can be damaged to such an extent that the pump’s efficiency decreases
dramatically [43]. Presented in Figure 25, the effect of cavitation on an impeller of a
centrifugal pump can be observed.

DEMAND SIDE MANAGEMENT INTERVENTION ON A LARGE SCALE CANAL PUMPING SCHEME
30
Figure 25: Effect of cavitation on a centrifugal impeller [44]
Two problems are usually encountered in the pipe systems at the outlet of pump systems.
The first problem usually encountered is choked flow. This is due to the Venturi effect. The
Venturi effect is caused when a fluid flows through a constricted section in a pipeline. At
that point, the cross sectional area decreases causing an increase of velocity in the fluid
and a decrease in pressure [45].
Keeping the Venturi effect in mind, choked flow occurs when the pressure drop across the
pipe section is increased. The flow then reaches its maximum flow rate capacity. When
this occurs, there will be no additional flow in the pipeline. The pumps, therefore, provide
more flow than what the pipeline was initially designed for [46].
The second problem encountered in water systems, is called water hammering. Water
hammering occurs when a sudden drop in the flow of fluid is experienced. This causes a
pressure wave to be transmitted alongside the pipe section damaging the equipment. An
example causing water hammering can be by rapidly closing a water valve [47]. Large scale
canal pumping schemes use open canals mainly in the transfer of water where this does
not occur; however, water hammering can be experienced in the short pipelines in and
out of the pump stations.
All of the above mentioned problems need to be taken into consideration when
attempting to perform safe load management on a canal pumping scheme.

DEMAND SIDE MANAGEMENT INTERVENTION ON A LARGE SCALE CANAL PUMPING SCHEME
31
2.2.5 Typical large scale irrigation canals
Typical large scale irrigation canal pumping schemes can vary extensively in length,
size and capacity. In South Africa, the largest canal scheme has a network of 1 176 km
long canals. These canals irrigate 29 181 ha [48].
The Narmada main canal in India is the largest lined irrigation canal in the world. The main
canal has a total length of 458 km and a normal flow rate of 32 m3/s. However, the canal
has a design capacity flow rate of 1 132 m3/s which irrigates an area of approximately 1.8
million ha [49]. The canal network has 2 500 km of branch canals and an additional 5 500
km of smaller distributaries and other associated canals [50].
The largest irrigation canal in the southern hemisphere is located in Australia namely the
Mulwala canal. It extracts water from Lake Muwala and distributes water in a 2 880 km long
canal network. The main canal has a flow rate of up to 115 m3/s. The Mulwala canal
irrigates an area of about 700 000 ha [51].
2.2.6 Water management on irrigation pumping canal
schemes
A study has been done on the control of the water level in large scale irrigation canal
schemes by R.R. Negenborn, P.J. van Overloop, T. Keviczky and B. De Schutter [52]. A
case study was chosen from where their model predictive control (MPC) was implemented
on; this case study had 7 different canal systems within the large scale canal scheme.
This was also done by a control program in order to control the inflow and outflow
parameters in order to maintain the desired water level in a large scale canal [52]. The
proposed MPC was compared to a centralized control system. Thus the MPC system can
control multiple water systems in a large area whereas the centralized control system is
only able to control a single water system [52].
Another study has been done by D. Dolezilek and A. Kalra [53] to automate canal schemes
for management of the water as well as the power. The conventional flow monitoring and
control system used for open canals in India was discussed as well as the requirements for
the automation of a canal scheme system. The proposed result for total automation of such
a system is presented in Figure 26.

DEMAND SIDE MANAGEMENT INTERVENTION ON A LARGE SCALE CANAL PUMPING SCHEME
32
Figure 26: Complete system overview of case study control [53]
By implementing the automation on the water and power management of a canal scheme
system, several benefits can be realised over conventional systems which include [53]:
improved safety;
reliability;
effectiveness; and
controllability.
The performance of a canal scheme can be improved if the irrigation boards of each district
understand the future challenges of the increasing water demand and scarcity of the
resource [53].
2.3 Existing DSM strategies on large pumping systems
In Section 1.3, the different DSM interventions were discussed namely energy efficiency,
peak clipping and load shifting.
Due to the fact that the primary goal of canal systems is to move a specified amount of
water on a daily basis, load shifting will be the best DSM intervention to implement. The
principle of load shifting is to move the electricity load out of peak periods into off-peak
periods. By doing this, the amount of water moved over a 24-hour period should still be the
same.

DEMAND SIDE MANAGEMENT INTERVENTION ON A LARGE SCALE CANAL PUMPING SCHEME
33
Energy efficiency interventions on pumping systems will not be that sufficient. This is due
to the fact that energy efficiency lowers the energy usage over a 24-hour profile. Thus less
water will be pumped over a 24-hour profile resulting in an insufficient amount of water
transferred for the day. This causes that the energy saved will be needed to use to deliver
the water needed thus concluding in little to no energy saved. Installing new, more efficient
pumps as part of an energy efficiency intervention will also not be a solution. This is due to
the high input cost which will not rectify the savings achieved from the implementation
thereof.
The implementation of a peak clipping will also not be that effective. Load clipping will only
reduce the electricity usage during the peak periods, but no comeback load will be provided
throughout the off-peak periods. Thus less water will also be pumped over a 24-hour profile.
In order to maintain the same amount of water to be moved over a 24-hour profile, as well
as achieving cost savings, load shifting will be the most applicable intervention to use.
The advantage of using a load shift intervention is that it does not require costly equipment
to be installed in order to achieve significant electricity savings. Changing the operation
schedule is a very effective way to realise load shifting savings. Load shifting projects
previously done on similar systems will be reviewed and discussed. These similar systems
include water pumping systems, mining water reticulation systems and inter basin transfer
schemes.
2.3.1 Water pumping systems
Water pumping systems supply potable water from treatment plants. A supervisory control
and data acquisition (SCADA) system is installed on most of these pump stations. These
water pumping systems are dependent on systems such as SCADAs for control purposes.
These systems read and log valuable historic information for parameters such as flow,
pressure and reservoir levels. This information is useful to support performance
improvements of these processes [54].
A study has been done by M.P. Slade [55] on the cost optimisation of surface potable water
pump system. A load shift project was implemented on a potable water pumping system in
the Northern Cape, South Africa [55].

DEMAND SIDE MANAGEMENT INTERVENTION ON A LARGE SCALE CANAL PUMPING SCHEME
34
M.P. Slade identified the relation of mine pumping systems and water distribution systems.
These systems all work on the same principle, namely extracting water from a source,
ensuring a sustainable high flow rate at a high pressure head which requires large reservoir
storage capacities as well as large installed capacity of pumps. The pumps are used to
transfer water to higher elevation points over a certain distance [55].
The study by M.P. Slade was done on a water pumping system that extracts water from a
fresh water river, purifying the water for human consumption and pumps the water over vast
distances with the help of booster pumps and holding reservoirs. The systems contain three
high lift pump sets, and each motor with an installed capacity of 780 kW and a flow rate of
270 l/s [55].
Apart from only investigating the electricity usage, other factors also need to be investigated
to ensure a better understanding and to ensure efficient operation of the system [56]. This
includes:
all the installed capacities of pumps;
reservoir capacities;
available flow rates of pumps;
available flow rates of the connecting pipelines;
control levels of reservoirs;
control levels of intake river; and
amount of pumps simultaneously operational.
All these factors were considered during the simulation to ensure that a load shift saving is
possible. Part of such a water distributing system is that a certain amount of water needs
to be transferred on a daily basis. Targets are set out to ensure that these amounts of water
are moved within a 24-hour profile. This ensures that the projected demand is met [55].
During the implementation of such a project, the client usually wants the system automated.
The automation of such a system ensures that the agreed savings target is met. Another
benefit of automation is that the human factor is taken out of the equation. By doing this,
more sustained savings will be possible if the operator is taken out of the decision making
process of switching a pump on or off [55].
The Energy Management System (EnMS) receives data through a common network from
the SCADA. The SCADA is a system operating with coded signals over communication
channels to provide control to remote equipment such as pumps. The SCADA system can

DEMAND SIDE MANAGEMENT INTERVENTION ON A LARGE SCALE CANAL PUMPING SCHEME
35
indicate all the important information such as flow rate, pump statuses and important
reservoir levels [55].
If there is a SCADA system online, all the information is available for an EnMS. An EnMS
can be programmed to take all the control parameters into account and follows a specified
control philosophy. The control philosophy is developed in relation to the specific needs
and requirements of a site or system. For instance, a load shift intervention can be
programmed into the EnMS. If all the control parameters are within the desired range before
the peak period, the EnMS will automatically control the pumps [55].
The EnMS is then capable of gathering all the information from the SCADA, analyse the
data through mathematical models and then schedule the time and use of the pumps. This
scheduling can be used in real-time to effectively monitor the system. The EnMS sends the
information to the SCADA which then relays it to the PLCs and finally to the relevant
equipment [55].
The EnMS system was implemented on the water pumping system. Through the
scheduling which was done, savings of 3.6 MW during the morning peak as well as 3 MW
during the evening peak were realised. This in return resulted in an annual cost saving of
R 825 000 in the year 2007 [55].
It was also noted by M.P. Slade that the load shifting initiative was achieved mostly every
weekday. This is due to the fact that the pumping system usually operates 24-hours per
day as well as the extra pumps available, therefore more water was pumped during the off-
peak periods to meet the daily quota [55].
A load shift study was done by A. Nortjé [57] on a water transfer scheme in Mpumalanga,
South Africa. This scheme provides water to Eskom power stations as well as Sasol
technologies. Large amounts of water are required for the supply to the end user as
well as to other users along the pipeline [57].
During the implementation phase of the study done by Nortjé, various infrastructure
upgrades were completed. This included the replacement of relay logic controls with
PLC’s, Human Machine Interface (HMI) as well as a SCADA system [57].
All of this was done through the ESCo and the financial support of a typical DSM project by
Eskom. This ensured a much more efficient and effective way of the pump control on these

DEMAND SIDE MANAGEMENT INTERVENTION ON A LARGE SCALE CANAL PUMPING SCHEME
36
various sites. In addition to these infrastructure upgrades, an EnMS was also installed on
the various sites [57].
This implicated that schedules were able to be generated through all the available
information. The schedule generated by the EnMS ensured that the minimum amount of
pumps were operated during the peak periods resulting in a good load shift opportunity [57].
An annual cost saving of R 4.765 million was achieved through the implementation of this
DSM intervention. The cost savings were due to a successful load shift initiative with a total
of 12.6 MW. In Table 3 below the load shift achieved on the different pump stations is
presented. Note that a combined saving was achieved at pump station 1 and 2, because
they operate in collaboration with each other.
Table 3: Load Shift savings achieved by A. Nortjé (adapted from [57])
Pump Station (PS) Number of Pumps Installed
Capacity [kW]
Load shift
Achieved
1 4 1 650
3.7 (Combined) 2 4 1 725
3 5 2 150 3.1
4 4 3 050 5.9
Similarly the EnMS was implemented on six pumping schemes in South Africa in a study
done by Prof M. Kleingeld, Dr G. Bolt and C. Scheepers [58]. Part of the pumping schemes
was a 40 km canal. During the implementation of the study new infrastructure was installed
to enable pump control through the EnMS. A new control philosophy was also developed
and implemented for efficient operation. The target of 10.15 MW was comfortably achieved
by using the new control philosophy [58].
The implementation of load shifting interventions on water pumping systems is very
successful, as can be noted from several case studies. The system which was implemented
on water pumping systems was optimised from mining water reticulation systems. Mining
water reticulation systems will subsequently be discussed.
DEMAND SIDE MANAGEMENT INTERVENTION ON A LARGE SCALE CANAL PUMPING SCHEME
37
2.3.2 Mining water reticulation systems
Pumping systems in the gold mining industry in South Africa consume approximately 35%
of the total electricity consumed, making it one of the mine’s largest electricity expenditures
[59]. Mine pumping systems reticulate clear water for cooling the working conditions
underground as well as a couple of other applications. When the scheduling of this
important system does not affect the production of a mine, a load shift intervention can be
implemented to achieve savings.
In order to achieve a load shift on a mining water reticulation system, the schedule will need
to be adapted efficiently. This can be done by implementing the EnMS that has been
specifically developed for such systems. The EnMS has been thoroughly tested by
simulating the conditions of such a system and comparing it to real-time data. It has been
concluded that it is a very efficient system and several projects that have been implemented,
yielded successful results.
A Study has been done by R.P. Richter [60] comparing the effect of manual and automated
DSM pumping projects. The study done by R.P. Richter was implemented on several gold
mines in South Africa.
There is an extensive difference between implementing a DSM project using manual pump
control and automatic pump control. Manual pump control has been used since deep shaft
mining commenced. This was due to the lack of technology which is used today, such as
PLCs and network opted control [60].
Certain mines still prefer manual operation of their pumping systems due to [60]:
human control during operations enhancing the physical supervision on pumps; and
lower input infrastructure cost.
Although manual operation has advantages, there are typical problems that can occur such
as [60]:
damaging pumps to due delayed opening of discharge valves;
high maintenance due to pump cycling;
inadequate bearing temperature as well as vibration monitoring; and
incorrect data logged for the use of maintenance on pumps.

DEMAND SIDE MANAGEMENT INTERVENTION ON A LARGE SCALE CANAL PUMPING SCHEME
38
Using an automated system would require more infrastructure. As previously mentioned,
additional infrastructure such as a SCADA system, fibre optic cables for communication and
an EnMS system will be required. Using an automated system to control the pumping
reticulation system will have several benefits such as [60]:
very accurate and reliable data at pre-set time intervals;
pump control can be achieved by predefined schedules;
longer pump cycle life due to precise control; and
continuous monitoring which can respond with immediate feedback ensuring
preventive damage.
There are certain disadvantages as well when using automated control, which includes [60]:
additional maintenance on the control systems mentioned;
costly infrastructure; and
inadequacy of automated system under emergency conditions.
Keeping the above mentioned into consideration, R.P. Richter concluded the study on
various deep level mines. It was found that automated projects performed consistently
better than manually operated projects. An increase in the load shift performance of 38%
was recorded when manual operation of these pumping systems was upgraded to
automated systems [60].
The data obtained from the various implemented projects between manual and automated
systems were compared based on [60]:
engineering economic methods;
consistency thereof; and
cost savings including maintenance and labour costs.
It was found that automated systems delivered accurately predictable results that were
more consistently recorded. Additional cost savings that vary between 36% and 45% can
be expected with the automation of a system [60].
N.C.J.M de Kock [61] conducted a study of the load shift impact on six mines. The
substantial benefits realised on case studies conducted on the mines were highlighted.
When taking all of the results obtained from N.C.J.M de Kock’s study into consideration,
they account for approximately 85% of additional benefits in electricity cost savings from
the DSM pumping projects implemented [62].

DEMAND SIDE MANAGEMENT INTERVENTION ON A LARGE SCALE CANAL PUMPING SCHEME
39
A combined evening load shift of 33.8 MW was realised on average during the DSM
intervention. Which resulted in an annual cost saving of R 4.32-million in the year 2006.
The savings are due to the effective implementation of an EnMS specifically designed for
water pumping systems. The results of the study are shown in Table 4 below [61].
Table 4: Load shift achieved by N.J.C.M de Kock (adapted from [61])
Mine Installed Capacity
[MW]
Load shift
Achieved [MW]
1 26.0 4.5
2 27.0 3.5
3 23.8 7.0
4 18.8 4.0
5 11.0 3.8
6 47.2 11.0
A. Prinsloo [63] conducted a study to optimise a complex mining reticulation system for the
realising of electricity cost savings. The study was conducted on a gold mine in South
Africa. The implementation of an EnMS on this complex water reticulation system yielded
an average saving of 3.66 MW. The EnMS had the capability to be programmed to control
almost any type of system regardless of the complexity. An annual cost saving of R300 000
was achieved for the year 2003/2004 [63].
After considering the results of the different case studies discussed, the implementation of
DSM interventions on mining water reticulation is very successful. Mining water reticulation
systems are basically very similar to canal schemes in the sense that the primary purposes,
namely water transfer for a specific application are achieved.
2.4 Implications and risks associated with DSM interventions
2.4.1 Infrastructure
DSM interventions implemented on a specific site usually require infrastructure upgrades.
These infrastructure upgrades are paid by Eskom. Eskom awards a project to a certain
ESCo on a tender basis. The funds for the implementation of the project is provided by
Eskom.

DEMAND SIDE MANAGEMENT INTERVENTION ON A LARGE SCALE CANAL PUMPING SCHEME
40
These funds are used to upgrade or repair the infrastructure on site to realise savings.
Relevant to this study, only load shifting will be discussed. The aim of the infrastructure is
to realise sustainable load shift savings.
After the implementation has been completed as well as the performance assessment
period is finalised, the client takes ownership of the infrastructure. An independent entity
called the Measurement and Verification (M&V) team verifies the impact of the
implementation done by the ESCo.
The client is then responsible for the maintenance of the infrastructure as well as for
showing the impact of the implementation for a certain period set by Eskom. This in return
helps Eskom to reduce the load during peak times, especially when the power network is
under pressure.
The type of infrastructure needed varies from each site due to the difference in layout as
well as the condition the existing infrastructure is in. When the implementation of a DSM
initiative commences, the automation of such a system is very important. Automation of
such a system can improve savings and the operation to a point of sustainability. The
automation of a system depends on different aspects of each independent system.
Automating the system thus varies with each project implemented.
Additional to the infrastructure installed, an EnMS is also funded by Eskom. The EnMS has
the capability to log important condition monitoring data, which can be viewed by operators
as well as logged for maintenance purposes. The main aim of the EnMS is to schedule the
operation of energy users such as pumps out of peak periods. The scheduling is also done
as safely and efficiently as possible.
2.4.2 Maintenance
The EnMS that is installed on site also requires a backbone to work from. This includes the
communications network including PLC’s, optic fibre and a SCADA system. The mentioned
infrastructure needs to be in a working condition if it is already installed. It is therefore
necessary to ensure that it is operational.
With the help of this system, it is possible to do condition monitoring on the energy intensive
equipment used. It is then possible to provide a sustainable method to prevent any
unnecessary maintenance on complete failure of the equipment used.

DEMAND SIDE MANAGEMENT INTERVENTION ON A LARGE SCALE CANAL PUMPING SCHEME
41
The EnMS aids in this regard where real-time information can be observed by the operators
which includes important information such as bearing temperatures, flow rate, efficiency of
equipment, etc.
The EnMS can be programmed to issue an alarm if the equipment falls short of pre-set
operating parameters. This will minimise maintenance as well as improve the efficiency of
the energy intensive equipment. This will return better plant availability as well as improved
savings of the DSM initiative.
2.4.3 Effect of stopping/starting
When a load shift project is implemented on a specific operation system, the equipment is
stopped and started more frequently. For instance the motors of pumps at a pumping
station which are stopped and started more often can be damaged over the long term.
Overloading of the motor, starter and contactor are experienced.
As a motor is started, the current experienced during the starting period can reach up to 7
times the operating current of the motor. The machine loads experienced before start-up
are due to the locked rotor torque that needs to be overcome. In Figure 27 below the
difference between the start-up current and normal operating current of a typical motor is
shown [64].
Figure 27: Motor current at start-up [64]

DEMAND SIDE MANAGEMENT INTERVENTION ON A LARGE SCALE CANAL PUMPING SCHEME
42
There are different methods and techniques to counter the effect of high current at motor
start-up. Each has its own advantages and limitations. The more commonly used methods
of motor starting are:
electronic soft start;
rotor resistance;
primary resistance;
auto-transformer;
Star Delta;
direct online.
From these different methods, electronic soft starters are the most widely used in pumping
applications. Electronic soft starters control the start-up of the motor by controlling starting
current, acceleration time and the overload current. The electronic soft starter reduces
stress on the mechanical systems as well as limiting the current during the starting process
[65].
The lifetime of the equipment used can be dramatically increased by utilising the starting
systems mentioned. Although it is only for the short period during the start-up, huge costs
of maintenance on the motors and pumps are reduced. When the operators control the
pumps, they must be wary not to switch pumps on or off unnecessarily. The EnMS can aid
with the scheduling of pumps so that they are switched on and off as efficiently as possible.
2.5 Conclusion
In Chapter 2 the various systems of a typical large scale irrigation pumping scheme were
discussed, including the equipment and the possible results of insufficient management
thereof. DSM initiatives implemented on similar systems, such as water pumping systems
for potable and clear water purposes, as well as mine reticulation systems, were discussed.
It was clear that large energy savings as well as substantial cost savings were achieved
annually.
From studies mentioned in Chapter 2, it can be concluded that load shifting initiatives on a
large scale canal pumping scheme can be viable. The EnMS implemented on the various
sites can be easily adopted to function on a canal pumping scheme. Certain alterations will
be required to be effective on the chosen case study.

DEMAND SIDE MANAGEMENT INTERVENTION ON A LARGE SCALE CANAL PUMPING SCHEME
43
By effectively shifting the load from the peak period to the off peak period, substantial energy
savings, as well as cost savings, will be possible. The implications and risks of
implementing a load shift on the equipment were also discussed briefly.

DEMAND SIDE MANAGEMENT INTERVENTION ON A LARGE SCALE CANAL PUMPING SCHEME
44
CHAPTER 3 - DSM methodology on large canal
pumping schemes
Chapter 3 provides information regarding the investigation methodology, the simulation
thereof as well as the verification process. The verification and the calculation of the
baseline are also discussed.

DEMAND SIDE MANAGEMENT INTERVENTION ON A LARGE SCALE CANAL PUMPING SCHEME
45
3.1 Introduction
After briefly discussing the background in Chapter 1, Chapter 2 consisted of an extensive
discussion on different DSM interventions as well as canal pumping schemes. The focus
in Chapter 3 is about the development of an implementation methodology for a DSM
intervention on a large scale canal pumping scheme.
The DSM intervention chosen for the specific application is a load shift during the evening
peak period of Eskom. To implement such an intervention, a simulation needs to be
compiled to investigate the feasibility thereof. After the simulation has been completed, it
will be practically implemented on the pumping station to validate the simulation. A test will
be done over a seven day period to test the system for a full operational cycle.
During this period, data will be obtained to verify the simulation. The proposed control
strategy will be discussed as well as the implementation thereof.
3.2 Investigation methodology
The investigation was done on a case study in the form of a canal pumping scheme situated
in the upper Orange catchment scheme as defined by the Department of Water Affairs. The
investigation of this plant is required to confirm all the relevant data as well as to identify
possible constraints and variables. The findings will be discussed below in the following
sections.
3.2.1 Site description and layout
The purpose of obtaining a site description and layout is to get a better understanding of
how the site operates. It is also necessary to obtain any site specific challenges in terms of
operation or maintenance.
The main purpose of this canal pumping scheme is to provide water for irrigation
applications. The water is drawn from a fresh water dam where an annual quota of 250
million cubic meter is set out by the Department of Water Affairs. In Figure 28 below, the
basic layout of canal scheme S is presented. Due to client confidentiality the case study
will be referred to as canal scheme S.
DEMAND SIDE MANAGEMENT INTERVENTION ON A LARGE SCALE CANAL PUMPING SCHEME
46
Figure 28: Basic site layout
Water is drawn through a 13.6 km, 18 m wide gravity fed canal line with a capacity of 54 m3/s
from the fresh water dam to the pumping station. There is no capacitance before the pump
station. Water is pumped directly out of the canal into the pump station.
The pumps feed water into two 900 m long, 1.8 m diameter pipelines with a total head of 47
m. From there on the water is gravity fed down a canal for 112 km which includes two
balancing dams until it flows into a river. This river eventually flows back into the Vaal River
again. This stretch of canal has capacities of 15.2 m3/s (before the balancing dam) and
13.2 m3/s (after the balancing dam) respectively.
In Figure 29 a satellite view of the pump station is presented. This only presents the pump
station, inlet and outlet canals to and from the pump station.
Fresh
water dam
Balancing dam
Gravity fed canal to pump station
Canal to riverPipeline to canal
LEGEND
Fresh water dam
Canal
Pump Valve
Balancing dam
Pipe line

DEMAND SIDE MANAGEMENT INTERVENTION ON A LARGE SCALE CANAL PUMPING SCHEME
47
Figure 29: Satellite view of canal scheme S
Water is pumped from the pump station to a high geographical area from where the water
is gravity fed to the balancing dam referred to as BDS2. This balancing dam has a depth
of 3.75 m and a volume of 1.5 million cubic meter. Balancing dam BDS2 has a storage
capacity of one day (24-hours) if no water is pumped into the canal.
Another balancing dam referred to as BDS1, has been built between BDS2 and the pump
station with a capacity of 750 000 m3. The construction of BDS1 was completed after the
implementation of this case study had been implemented. It will therefore not be considered
in the simulation model.
Water is split into numerous smaller canal branches after BDS2, but will not be taken into
consideration in the simulation. The focus will only be from the pump station to balancing
dam BDS2. This is due to the fact that the flow requirements of the pump station are only
taken into account to the point of BDS2. Balancing dam BDS2 level is monitored and can
be seen as the end point of water in the simulation.
The goal of balancing dam BDS1 was to ensure a larger buffer capacity of water if no water
can be pumped due to unforeseen circumstances. This enables the pumping scheme to
provide water at a constant rate to the client. The constraint that arises when no water is
pumped, is the time it takes for the water to reach the balancing dams due to the length of
the canal.
Pipeline to canal
Pumpstation
Gravity fed canal
Canal to balancing
dam

DEMAND SIDE MANAGEMENT INTERVENTION ON A LARGE SCALE CANAL PUMPING SCHEME
48
A basic layout of canal scheme S is presented in Figure 30. In the figure BDS1 is also
indicated. Figure 30 does not represent the true distances between the pump station and
the two balancing dams. This is due to the extensive length of the canal. Each balancing
dam can communicate with the pump station as well as each canal section. The
telecommunications system installed, ensures sufficient information to control the pump
station.
Figure 30: Canal scheme S layout
3.2.2 Pump station
The pump station consists of seven pumps (Sulzer and Mather & Plat) with electrically
actuated intake and outlet valves. The water is pumped from the inlet canal through a split
case centrifugal pump into a common manifold. The water is then pumped from the
common manifold through two pipelines up to a higher geographical area from where the
water is gravity fed to the balancing dams.
A power factor is maintained at 0.92 and the pump station makes use of a capacitor bank.
The intervals for switching pumps on and off take an estimated time of 10 minutes. This is
due to precaution checks taken by the personnel. These precautions include:
avoid water hammering in the pipelines;
protection of the transformer;
preserving lifetime of the switch gear due to mechanical degradation.
The pump specifications are summarised below in Table 5.
Balancing dam Balancing damBalancing dam 1
Pipeline
Balancing dam 2
River
Pump station
Inlet canalLEGEND
Pump station
Canal
Telecommunications Direction of flow
Balancing dam
Pipe line
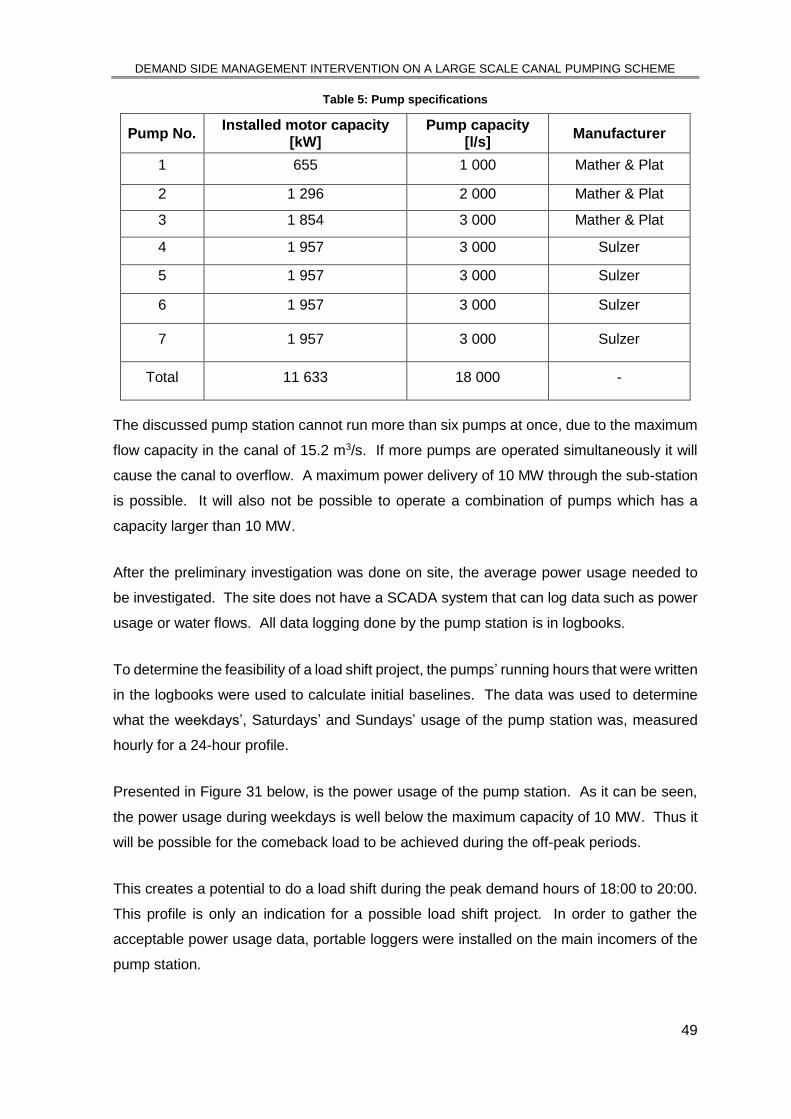
DEMAND SIDE MANAGEMENT INTERVENTION ON A LARGE SCALE CANAL PUMPING SCHEME
49
Table 5: Pump specifications
Pump No. Installed motor capacity
[kW] Pump capacity
[l/s] Manufacturer
1 655 1 000 Mather & Plat
2 1 296 2 000 Mather & Plat
3 1 854 3 000 Mather & Plat
4 1 957 3 000 Sulzer
5 1 957 3 000 Sulzer
6 1 957 3 000 Sulzer
7 1 957 3 000 Sulzer
Total 11 633 18 000 -
The discussed pump station cannot run more than six pumps at once, due to the maximum
flow capacity in the canal of 15.2 m3/s. If more pumps are operated simultaneously it will
cause the canal to overflow. A maximum power delivery of 10 MW through the sub-station
is possible. It will also not be possible to operate a combination of pumps which has a
capacity larger than 10 MW.
After the preliminary investigation was done on site, the average power usage needed to
be investigated. The site does not have a SCADA system that can log data such as power
usage or water flows. All data logging done by the pump station is in logbooks.
To determine the feasibility of a load shift project, the pumps’ running hours that were written
in the logbooks were used to calculate initial baselines. The data was used to determine
what the weekdays’, Saturdays’ and Sundays’ usage of the pump station was, measured
hourly for a 24-hour profile.
Presented in Figure 31 below, is the power usage of the pump station. As it can be seen,
the power usage during weekdays is well below the maximum capacity of 10 MW. Thus it
will be possible for the comeback load to be achieved during the off-peak periods.
This creates a potential to do a load shift during the peak demand hours of 18:00 to 20:00.
This profile is only an indication for a possible load shift project. In order to gather the
acceptable power usage data, portable loggers were installed on the main incomers of the
pump station.

DEMAND SIDE MANAGEMENT INTERVENTION ON A LARGE SCALE CANAL PUMPING SCHEME
50
Figure 31: Electricity demand profile for the pump station
In Figure 31 the average weekdays’, Saturdays’ and Sundays’ profiles are shown. These
profiles represents the power usage during a day. The data represented in Figure 31 was
taken out of the logbooks for a period of three months. From the data, it is evident that the
weekend power demand was higher than the weekday demand. This can be due to the
demand for power for the specific season or the type of crop which needs a constant high
amount of water.
3.3 Baseline verification and calculation
In order to verify the results and savings of the implementation of such a project, a baseline
needs to be calculated. The baseline data is then compared to the data during the testing
phase after the implementation. This testing phase is called performance assessment.
In order to compile a baseline, the normal power usage of a typical month is required. The
site on which the case study is implemented does not have a SCADA system that can log
data, such as power usage and water flow. In order to accurately measure the power usage
of the pumps, portable loggers needed to be installed. The data collected will then be
summarised in a profile over a 24-hour period.
The portable Dent logger, as shown in Figure 32 below, is used to log the power usage.
Loggers are then connected with clamps called current transformers (CTs) and voltage
transformers (VTs). These clamps are presented in Figure 33.
5000
6000
7000
8000
9000
0:0
0
1:0
0
2:0
0
3:0
0
4:0
0
5:0
0
6:0
0
7:0
0
8:0
0
9:0
0
10
:00
11
:00
12
:00
13
:00
14
:00
15
:00
16
:00
17
:00
18
:00
19
:00
20
:00
21
:00
22
:00
23
:00
De
ma
nd
[kW
]
Time [Hour]
Electricity demand profile
Weekdays Saturdays Sundays

DEMAND SIDE MANAGEMENT INTERVENTION ON A LARGE SCALE CANAL PUMPING SCHEME
51
Figure 33: Voltage transformers (left) and current transformers (right)
Using these portable loggers is easy and safe when working with high voltage stations. A
dent logger derives the data from the voltage and current inputs close to a dedicated circuit
disconnect breaker [66].
The portable Dent logger is calibrated to ensure that the correct data is recorded. A
calibration certificate is required to provide sufficient proof of verification. All of the portable
loggers used to log data are certified with a calibration certificate.
The baseline developed in this dissertation is verified by an independent group known as
the M&V team. The calibration certificates of the loggers used are documented as proof of
the verification process.
The M&V team ensures that the equipment used to calculate the baseline is also used
during the assessment period of the project performance. The performance assessment
period mentioned is a three month period in which the performance of the implemented
project is measured. This period is also verified by the M&V team.
Figure 32: Portable logger

DEMAND SIDE MANAGEMENT INTERVENTION ON A LARGE SCALE CANAL PUMPING SCHEME
52
When a baseline is calculated, it must adhere to certain regulations [67]:
the data obtained needs to be summarised in 30 minute intervals and compiled in
a 24-hour daily profile;
the data used must consist of a complete cycle of operations, usually identified as
at least three consecutive months; and
the baseline must include all the equipment affected by the load shift procedure.
The baselines calculated from the recorded data are shown in Figure 34. These baselines
represent an average weekday’s, Saturday’s and Sunday’s profile.
Figure 34: Weekday, Saturday and Sunday baselines
These baselines are scaled energy neutral in relation to actual values for a specific day or
period. Now that the baselines are identified, the next step is to calculate the potential load
shift impact on the power profile. The impact is defined by the average weekday profile
minus the actual power usage during the peak period. The load is then shifted from the
peak period to the off-peak period. Important to note is that the comeback load does not
exceed the installed capacity of the pump station or the designed flow capacity of the canal.
The period referred to as the comeback load is the off-peak period where the load from the
peak period is shifted to. The total load during 18:00 to 20:00 will be divided into an eight
hour interval after the peak period. When the proposed profile is scaled, it is important to
scale it energy neutral to the average weekday profile. This means that the same amount
of energy is used in the proposed profile as in the baseline profile. Another popular scaling
5000
5500
6000
6500
7000
7500
8000
0:0
0
1:0
0
2:0
0
3:0
0
4:0
0
5:0
0
6:0
0
7:0
0
8:0
0
9:0
0
10
:00
11
:00
12
:00
13
:00
14
:00
15
:00
16
:00
17
:00
18
:00
19
:00
20
:00
21
:00
22
:00
23
:00
Po
wer
[kW
]
Time [Hour]
Electricity demand profile
Weekday Saturday Sunday

DEMAND SIDE MANAGEMENT INTERVENTION ON A LARGE SCALE CANAL PUMPING SCHEME
53
method, is scaling according to the required volume of water to be pumped per day. As
mentioned, this case study’s baseline will be scaled energy neutral.
To scale the data used energy neutral, the following equation is used:
𝐷𝑎𝑖𝑙𝑦 𝑆𝑐𝑎𝑙𝑖𝑛𝑔 𝐹𝑎𝑐𝑡𝑜𝑟 = ∑ 𝑎𝑣𝑒𝑟𝑎𝑔𝑒 𝑤𝑒𝑒𝑘𝑑𝑎𝑦 ℎ𝑎𝑙𝑓 ℎ𝑜𝑢𝑟 𝑑𝑎𝑡𝑎
∑ 𝑙𝑜𝑎𝑑 𝑠ℎ𝑖𝑓𝑡 𝑎𝑣𝑒𝑟𝑎𝑔𝑒 𝑤𝑒𝑒𝑘𝑑𝑎𝑦 ℎ𝑎𝑙𝑓 ℎ𝑜𝑢𝑟 𝑑𝑎𝑡𝑎 (1)
Each half hourly data point of the actual data used is then multiplied by the factor calculated
in (1). Thus this ensures that the total actual data is the same as the total scaled load shift
data making the two sets of data energy neutral.
In order to investigate the effect of a load shift on the pumping station, a proposed profile
needs to be created. The proposed profile consists of two consecutive weeks (7 day
profiles) of data. Firstly, a typical week of operation is logged through the portable loggers.
Then, during the following week, the load shift intervention is implemented and the data is
logged on the portable loggers.
To perform a load shift, the operating pumps are shifted from the evening peak period
(18:00 to 20:00) to the off-peak period (00:00 to 06:00). This means pumps are switched
off during the peak period and switched on during the off-peak periods. Thus the work done
by the pumps is still the same in a 24-hour day, it is just shifted to another time.
The amount of electricity not used during the two hour peak period is divided into the six
hour period evenly to perform the comeback load.
The proposed profile with a total potential impact of 5 MW is shown in Figure 35. This
proposed profile indicates that a minimum of one pump can be operated during the peak
period of 18:00 to 20:00, which was specified by the client to protect the pipeline as well as
the canal. A larger load shift saving is possible due to the variant of pump sizes.

DEMAND SIDE MANAGEMENT INTERVENTION ON A LARGE SCALE CANAL PUMPING SCHEME
54
Figure 35: Proposed load shifting profile
The daily demand differs continuously, implicating that it is important to shift load as much
as possible. Depending on the water demand, not every day will reflect such a load shift
as observed in the proposed profile. During the weekend periods, there is no restriction on
the amount of water being pumped, because the cost of electricity is at a flat rate during
weekends.
Unforeseen circumstances can relate to the high demand for water where no pumps can
be switched off, or a very low demand where only one or two pumps are running. Therefore
it is important to achieve a sustainable average impact.
0
1000
2000
3000
4000
5000
6000
7000
8000
9000
10000
12:3
0
1:0
0
1:3
0
2:0
0
2:3
0
3:0
0
3:3
0
4:0
0
4:3
0
5:0
0
5:3
0
6:0
0
6:3
0
7:0
0
7:3
0
8:0
0
8:3
0
9:0
0
9:3
0
10:0
0
10:3
0
11:0
0
11:3
0
0:0
0
Po
wer
[kW
]
Time [Halfour intervals]
Proposed profile
Baseline Proposed profile

DEMAND SIDE MANAGEMENT INTERVENTION ON A LARGE SCALE CANAL PUMPING SCHEME
55
3.4 Simulation of control philosophy
3.4.1 Control strategy design
In order to design a control strategy, the following factors need to be taken into account:
minimum and maximum operation of pumps;
flow rates of the pumps;
installed capacities of the pumps;
inlet and outlet capacities of the canal;
minimum and maximum operation levels of the inlet canal;
minimum and maximum operation levels of balancing dam BDS2.
The following constraints listed in Table 6 were specified by the client. This will be used as
the control levels in the simulation. If the water reaches a point higher than the maximum
control level, each of the dams / reservoirs mentioned will overflow. If the water goes below
the minimum control level, different effects will occur.
The fresh water dam will not have sufficient pressure to provide water to the inlet canal.
The balancing dam and the canal will not provide sufficient flow to the system as well as
not enough water will be available for the extraction methods, resulting in small pumps
sucking in air. The inlet canal will cause choked flow in the pipeline causing cavitation in
the pumps. It is therefore very important to simulate, and thus control, these levels correctly.
Table 6: Dam/reservoir control levels
Dam / Reservoir Maximum control level Minimum control level
Fresh water dam 100% 43%
Balancing dam BDS2 100% 30%
Canal 100% 30%
Inlet canal 95% 83%
The simulation that will be done, will not take the fresh water dam’s control levels into
account due to the size of the fresh water dam. The dam has a capacity of 3 187.56 million
cubic meters. As mentioned, an annual quota of 250 million cubic meters is set out by the
department of water affairs (DWA) for the canal scheme to be withdrawn. This withdrawal
amounts to 12% of water.

DEMAND SIDE MANAGEMENT INTERVENTION ON A LARGE SCALE CANAL PUMPING SCHEME
56
The dam’s water level has kept a level of 85% and more for the last three years [68]. This
can be ascribed to the good rain the area experienced during the last couple of years. The
pump station pumps directly out of the inlet canal that is gravity fed from the fresh water
dam. For simulation purposes, a reservoir will be simulated as the inlet parameter of the
pump station.
Indicated in Figure 36 below is a picture of the inlet canal which transfers water directly into
the pumping station. Presented in Figure 37 is an illustration of where the reservoir is used
for the simulation purposes. It will have the same effect as the inlet canal, due to the fact
the both are controlled by a minimum and maximum set point.
Figure 36: Inlet canal to pump station
Figure 37: Screenshot of reservoir in simulation
Water pumped from the inlet canal is kept between depth levels of 2.5m and 3m. It is also
converted to percentage in Table 6 above. If the level of the canal drops below 2.5m it will
Reservoir used for simulation purposes Inlet canal

DEMAND SIDE MANAGEMENT INTERVENTION ON A LARGE SCALE CANAL PUMPING SCHEME
57
cause low suction on the pumps, causing pumps to trip. If the level rises above 3.2m, the
canal will flood and a large quantity of water will be wasted.
Canal scheme S has several constraints that need to be considered in the simulation
process. Thus the information provided can now be taken into consideration with the
development and testing of the simulation model.
3.4.2 External considering factors
Other factors can also influence the result of a project other than the control set points of
the canal scheme. These factors include the type of crop planted, the rainfall for this area
as well as the water demand throughout the year.
In the area where canal scheme S is located, the two most common types of crops planted
are wheat and maize. Other types of crops are also planted, but wheat and maize are the
preferred crop planted by the farmers in this area. Each type of crop uses different amounts
of water to grow up to the optimum size.
In Table 7 below the water usage efficiencies are shown for a couple of crop types. Maize
and wheat have the highest water use on an area of kilogram per cubic meter. The
temperatures during the summer season in this area can reach maximums of up to 40°C.
Thus the evaporation rate is at its maximum resulting in a high demand for water.
Table 7: Typical water use efficiencies of several crops in South Africa (adapted from [69])
Crop Water use Efficiency
(kg/m3)
Maize 0.8 – 1.6
Wheat 0.8 – 1.4
Seed cotton 0.4 – 0.6
Sugarcane 0.6 – 1.0
Maize and wheat require a sufficient amount of water to reach their optimum stage from
where they can be harvested [70]. It is therefore necessary to ensure that sufficient water
is provided to the crops during the growing period. It will not always be possible to switch
off pumps and perform a load shift when the demand for water is very high.

DEMAND SIDE MANAGEMENT INTERVENTION ON A LARGE SCALE CANAL PUMPING SCHEME
58
The rainfall in this area can also have an effect on the load shift performance at canal
scheme S. On average the most rain is experienced during the months of December to
March. The most rain is experienced during the summer periods. In Figure 38 below, the
average rainfall in the case study area is shown from 2008 to 2013.
Figure 38: Average monthly rainfall data 2008 – 2013
Rainfall on such an irrigation system has a vast effect. A high demand for water is needed
for the crops, but with this amount of rain experienced, the crops do not need irrigation water
from the canal scheme for a certain period. This period is dependent of the evaporation
rate. In return, this creates a very low demand for water for the canal scheme. The pump
station is then not required to use a large amount of pumps. The power profile is so low
that very little to no savings can be achieved.
Presented in Figure 39 is the rainfall data for the year 2014. The amount of rainfall
measured in mm is plotted against the average rain for each month of the year. The rainfall
observed can relate to the previous rain of each month in Figure 38, except for the month
of November. An abnormal high amount of rain was experienced during November 2014.
0
20
40
60
80
100
120
Rain
[ m
m]
Month
Rainfall
Rainfall

DEMAND SIDE MANAGEMENT INTERVENTION ON A LARGE SCALE CANAL PUMPING SCHEME
59
Figure 39: Average monthly rainfall data 2014
The area in which the case study is located, is a water scarce area. In the year of
implementation the total annual rainfall was 312 mm. This again indicates the importance
of water provision through this canal pumping scheme for the crops.
Another factor to keep in mind when constructing a simulation model, is the annual water
flow demand (WFD). The WFD differs each month. In Figure 40 the annual WFD is
indicated for canal scheme S. The WFD is plotted on each month of the year on the x-axis
against the required water flow measured in m3/s on the y-axis.
It can be clearly observed that the WFD is very low during the winter season and increases
dramatically during the summer season. The fluctuation in the water flow directly influences
the power usage of the pump station at canal scheme S. If the WFD is low, fewer pumps
will be required to operate and vice versa.
The demand for water that fluctuates throughout the year as illustrated in Figure 40, is due
to different reasons. The annual rainfall has an effect because the amount of rain
experienced is a substantial amount in a certain time such as a day, week or month. This
dramatically changes the WFD to the consumer. Another factor is the type of crop planted
in a specific season of the year. Each crop requires a certain amount of water for optimal
growth as discussed. The season the crop grows in also has its own temperature variations
that directly affects the evaporation rate of the water.
0
10
20
30
40
50
60
70
80
90
100R
ain
[ m
m]
Month
Rainfall
Rainfall

DEMAND SIDE MANAGEMENT INTERVENTION ON A LARGE SCALE CANAL PUMPING SCHEME
60
Figure 40: Annual water demand on canal scheme S
The amount of savings achieved each month will fluctuate as well. It is therefore necessary
to take the effect of the WFD into consideration when selecting a target load shift saving for
canal scheme S. The seasonal rainfall effect and crop type planted also need to be taken
into account in the selection of the target.
3.4.3 Simulation
Taking all the factors and constraints of canal scheme S into consideration, firstly a period
in the seasonal WFD must be chosen to be simulated. If the focus is only on a certain part
of the season where the WFD is within a specified range calculated from historic data, a
more accurate simulation can be done. The period chosen is in the last trimester of the
year, namely September to December. During this time, the WFD increases, moderate rain
is experienced and new crops are planted which initiate the increase in the WFD.
An EnMS will be used for simulation purposes. The EnMS package used for simulation
purposes, has been used in previous studies and proved to be a viable system to use [57].
The system is able to simulate in real-time. This function is also accommodated with a
second per interval control, enabling the option of simulating actual conditions of week to
week scenarios. The layout in Figure 41 will be used to simulate the pump station.
0
2
4
6
8
10
12
14
16W
ate
r fl
ow
[m
3 /s
]
Month
Average demand of water annually
Flow rate [m3/s]

DEMAND SIDE MANAGEMENT INTERVENTION ON A LARGE SCALE CANAL PUMPING SCHEME
61
Figure 41: EnMS layout
As illustrated in Figure 41, Pump 7 is locked and will not be used in the simulation. This is
due to the fact that it acts as a backup pump. The length of the canal, which stretches from
the outlet at the pump station to BDS2, causes water to take approximately 24-hours to
reach BDS2. The capacity of BDS2, when converted to time, relates to approximately 24-
hours. The time that it takes to reach the BDS2, and the capacity converted to time, are
roughly the same and an assumption is made that these two aspects cancel each other out.
Therefore, these times will not be taken into consideration in the simulation.
After the simulation in the EnMS was allowed to operate for a certain time to result in real-
time data for a four month period, the power usage data was analysed to construct a
proposed profile. The power usage from the peak demand period to the off-peak demand
period was analysed in the simulation.
During this simulation period, it was found that it is possible to do a load shift with the
constraints given. The average weekday power usage profile for four months is plotted

DEMAND SIDE MANAGEMENT INTERVENTION ON A LARGE SCALE CANAL PUMPING SCHEME
62
against the baseline profile which was scaled energy neutral in relation to the power usage
profile. The power usage profile is plotted in red and the scaled baseline in blue.
Figure 42: EnMS Simulation profile
Presented in Figure 42, it is possible to achieve the comeback load needed to ensure
enough water is pumped during the off-peak period. The power usage is below the
maximum capacity of 10 MW.
A saving of 5.4 MW is achievable from the simulation done. Note that this saving is possible
for the period in the last third of the year. The upstream dam levels were also simulated to
ensure that they stay in the control levels set out in this dissertation.
Figure 43 indicates the upstream level as well as the maximum and minimum control levels.
The upstream dam level is plotted in blue, the maximum control level in red and the
minimum control level in black. It is observed that the level during the simulation was well
within the parameters.
This ensures that load shift will not have a negative effect on the operating level of the inlet
canal. The five days as illustrated in Figure 43, are the weekday averages of the 3 month
simulation period.
0100020003000400050006000700080009000
10000
0:0
0
1:0
0
2:0
0
3:0
0
4:0
0
5:0
0
6:0
0
7:0
0
8:0
0
9:0
0
10
:00
11
:00
12
:00
13
:00
14
:00
15
:00
16
:00
17
:00
18
:00
19
:00
20
:00
21
:00
22
:00
23
:00
Po
wer
[kW
]
Time [Hour]
EMS Simulation profile
Scaled baseline Average power usage
Peak Period

DEMAND SIDE MANAGEMENT INTERVENTION ON A LARGE SCALE CANAL PUMPING SCHEME
63
Figure 43: Upstream reservoir level simulation result
The results discussed indicated that it was all within the constraints selected for the
simulation model. In order to verify if the simulation model was done successfully and within
the parameters, a drop test is required.
3.5 Control philosophy verification
The next step is to verify if the simulation model is viable. A basic drop test was done to
verify the simulation model. A drop test is where data is logged for a normal operation week
where simulation DSM methodology is implemented on site to verify the results found in the
simulation. Any unforeseen technical issues that were not included in the simulation model,
should arise in the drop test.
In order to initiate the test, the personnel at the pump station need to be notified in advance.
They must ensure that the canal and reservoir levels are in the required control parameters.
The drop test was done in a typical week of operation during the summer season.
Presented in Figure 44 below are the results obtained from the drop test. Every weekday
is plotted in Figure 44 on a 24-hour profile against the power measured in kW used. It was
possible to do a load shift every day of the five weekday period.
80
82
84
86
88
90
92
94
96
98
100
1 2 3 4 5
Reserv
oir
lev
el [%
]
Day
Upstream canal simulation profile
Upstream dam Max control Min control

DEMAND SIDE MANAGEMENT INTERVENTION ON A LARGE SCALE CANAL PUMPING SCHEME
64
Figure 44: Weekday drop test results
Due to the variations of pump sizes at the pump station, the profiles for each weekday differ
from one another. The power usage profile of each weekday also differs from another
weekday because of the different water demands set out for each day. Overall, good load
shifting was achieved every day of the week during this drop test period.
In Figure 45 below a saving of 5.6 MW was achieved. It is 4% higher than the 5.4 MW
estimated by the simulation model. The difference in results is due to the variation in pump
sizes as well as the demand flow for the two different periods. During the drop test period,
another combination of pumps was used, different to those of the simulation model. The
demand water flow differs as well.
0
1000
2000
3000
4000
5000
6000
7000
8000
9000P
ow
er
[kW
]
Time [Hour]
Drop test profiles
Weekday 1 Weekday 2 Weekday 3 Weekday 4 Weekday 5
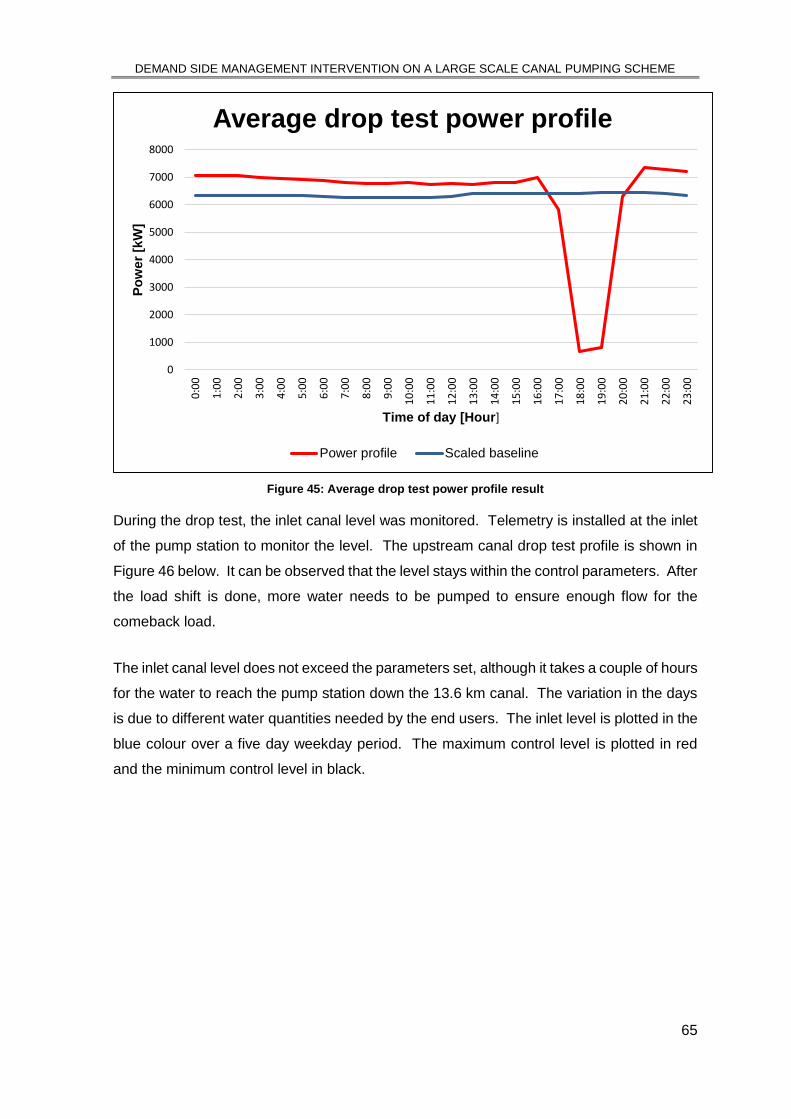
DEMAND SIDE MANAGEMENT INTERVENTION ON A LARGE SCALE CANAL PUMPING SCHEME
65
Figure 45: Average drop test power profile result
During the drop test, the inlet canal level was monitored. Telemetry is installed at the inlet
of the pump station to monitor the level. The upstream canal drop test profile is shown in
Figure 46 below. It can be observed that the level stays within the control parameters. After
the load shift is done, more water needs to be pumped to ensure enough flow for the
comeback load.
The inlet canal level does not exceed the parameters set, although it takes a couple of hours
for the water to reach the pump station down the 13.6 km canal. The variation in the days
is due to different water quantities needed by the end users. The inlet level is plotted in the
blue colour over a five day weekday period. The maximum control level is plotted in red
and the minimum control level in black.
0
1000
2000
3000
4000
5000
6000
7000
8000
0:0
0
1:0
0
2:0
0
3:0
0
4:0
0
5:0
0
6:0
0
7:0
0
8:0
0
9:0
0
10
:00
11
:00
12
:00
13
:00
14
:00
15
:00
16
:00
17
:00
18
:00
19
:00
20
:00
21
:00
22
:00
23
:00
Po
wer
[kW
]
Time of day [Hour]
Average drop test power profile
Power profile Scaled baseline

DEMAND SIDE MANAGEMENT INTERVENTION ON A LARGE SCALE CANAL PUMPING SCHEME
66
Figure 46: Inlet canal drop test result
From the drop test done, it is possible to do a successful load shift with the simulation model
at hand. The upstream canal fluctuates just within the parameters and the comeback load
is below the pump station’s maximum capacity.
Results from the simulation and verification of the simulation indicate that it was successful.
If the simulation is applied to the other periods of the year, the effect will be the same, but
the load shift saving results will differ.
If the simulation results are extrapolated to the WFD profile, which is based on historic data,
a trend can be realised. This trend can then be used as a baseline from where results can
be obtained. By using this method, a more realistic target can be set to achieve in the
performance assessment period and thereafter on canal scheme S.
Presented in Figure 47 is the average achievable peak period power reduction in relation
to the demand for water flow required. The profile plotted is the water flow on the x-axis
measured in m3/s against the savings on the y-axis measured in MW. The savings increase
in relation to the increase of the demand, but only to a certain point. From there on the
savings decrease dramatically. This is due to the high demand for water that results in no
pumps being able to be switched off. Water is needed urgently and cannot be delayed.
80
82
84
86
88
90
92
94
96
98
100
1 2 3 4 5
Can
al
lev
el
[%]
Day
Upstream canal drop test profile
Inlet level Max level Min level

DEMAND SIDE MANAGEMENT INTERVENTION ON A LARGE SCALE CANAL PUMPING SCHEME
67
Figure 47: Saving results according to the water flow
Now that the average peak period power reduction is defined over the demand for water, it
can be quantified in relation to Figure 40. Illustrated in Figure 48, is the quantified results
of the simulation profile. The blue line indicates the peak period reduction saving calculated
in MW over each month of a year. It can be noted that the peak period reduction varies
with the WFD. The red line indicates the average profile that can be achieved for the year.
Figure 48: Evening period power reduction possible per month
0
1
2
3
4
5
6
0 2 4 6 8 10 12 14 16
Dem
an
d r
ed
ucti
on
[M
W]
Demand [m3/s]
Demand vs Avg. peak period reduction profile
0
1
2
3
4
5
6
De
man
d r
ed
uct
ion
[M
W]
Month
Evening period power reduction per month
Monthly peak period power reduction Average profile

DEMAND SIDE MANAGEMENT INTERVENTION ON A LARGE SCALE CANAL PUMPING SCHEME
68
Taking the findings into consideration, an average evening peak reduction of 2.6 MW is set
to be achieved at canal scheme S. The target is calculated using the annual saving possible
and taking the average thereof. Thus the target is able to be achieved throughout the year.
From the results shown, it is thus possible to apply the simulation to any season or period
of a year. This indicates that it is viable to apply the load shift intervention on canal scheme
S.
3.6 Conclusion
In Chapter 3 the investigation of the chosen case study was discussed in more detail. The
constraints and operations of the canal pumping scheme were identified and discussed.
Portable loggers were installed to identify a baseline. The development of a DSM
methodology on a large scale canal pumping scheme was developed.
External factors which can influence the outcome of the simulation were also discussed. It
was taken into consideration and a simulation was done on a specified period in the year.
The simulation conducted resulted in a demand reduction of 5.4 MW. The drop test average
profile of the five weekdays showed a demand reduction of 5.6 MW and a definite validation
of the simulation model. During this test period, the comeback load was below the indicated
maximum capacity and the inlet canal level was kept between the defined operation
parameters.
A target of 3 MW is set to be achieved in the performance assessment period of canal
scheme S. The target is lower than the simulation results, which reflects an average annual
load shift intervention saving.
The control philosophy reflects a load shift during the evening peak period including all the
constraints provided. The control philosophy proved to be viable on canal scheme S.

DEMAND SIDE MANAGEMENT INTERVENTION ON A LARGE SCALE CANAL PUMPING SCHEME
69
CHAPTER 4 - Results
Chapter 4 discusses the implementation of the control philosophy on canal scheme S. The
performance assessment period, impact of the study as well as the potential for further
optimisation are also discussed.

DEMAND SIDE MANAGEMENT INTERVENTION ON A LARGE SCALE CANAL PUMPING SCHEME
70
Introduction
After the DSM methodology was developed, tested and simulated in Chapter 3, it is
implemented in Chapter 4. The results of this implementation are also discussed which is
known as the performance assessment period.
The Measurement and Verification teams’ roles are briefly discussed. The impact of
implementing this strategy on the chosen case study is discussed. Realising what the most
effective scaling method is, better and more savings are possible.
Implementation
After a successful simulation and verification of the DSM methodology, it is now possible to
be implemented on the canal scheme S. The load shift will be done with the implementation
of the control philosophy on the canal pumping scheme via the EnMS.
4.2.1 Pump station
The EnMS can stop and start pumps. The pumps in operation will not be stopped and
started by the EnMS. This will be done manually by the operators due to the complexity of
the system, although the EnMS will only recommend the stopping and starting of pumps.
The main priority for load shifting is to shift the load from the peak period (18:00 to 20:00)
to the off-peak period (22:00 to 05:00). If it is not possible to put the load back in the system
during the off-peak period, it may be done during the standard tariff period.
Pumps 1 to 6 are used to pump, where Pump 7 acts as a backup pump. All the pumps
need a 10 minute interval between each other when switched on or off. The EnMS
calculates the time intervals that the pumps need to be switched off, in order that only one
pump is operating from 18:00 to 20:00.
It is not possible to stop and start the pumps from the SCADA system. This needs to be
done at the Human Machine Interface (HMI) located close to the pumps. This ensures that
the operators check the conditions of each pump before starting it. This creates a safe
environment through visually observing that no one is near the pumps. It also enhances
the pump’s operation life through ensuring the oil levels are correct, valves are in the correct
positions, etc.

DEMAND SIDE MANAGEMENT INTERVENTION ON A LARGE SCALE CANAL PUMPING SCHEME
71
4.2.2 EnMS system
The EnMS calculates how much time is needed before 18:00 and starts recommending to
switch off the pumps. Due to the complexity of the pumping system, the EnMS will not be
doing automated control. Rather, an operating schedule will be recommended to the
operators who will switch the pumps on and off from the HMI control. During the
implementation of the control philosophy, the philosophy was updated according to any
problems encountered. This ensured the most effective implementation of the control
philosophy.
The EnMS is the chosen control system to be used. The EnMS communicates with the
SCADA system through an Object Linking & Embedding (OLE) for Process Control (OPC).
This enables the capability of the EnMS to operate the pumps automatically. As previously
mentioned, the EnMS will only recommend the most efficient control to the operators. The
EnMS is also capable of displaying alarms to assist the operators in effective control of the
pumps. Another function of the EMS is to log the operation data.
A simplified layout of the canal pumping scheme used for the EnMS is shown in Figure 49.
The EnMS has a pump controller function, enabling it to program according to the specified
DSM methodology with all the constraints. It is also possible to program the EnMS to
recommend the most efficient pump to use during load shifting. Note that again this will
only be a recommendation and not be specifically used due to the change of the water flow
required.

DEMAND SIDE MANAGEMENT INTERVENTION ON A LARGE SCALE CANAL PUMPING SCHEME
72
Figure 49: EnMS layout used at canal scheme S
The EnMS has different advantages if used to automatically control the pump operations:
selecting the most efficient pumps to operate;
more sustainable load shift profiles due to no human interference;
better and more efficient starting and stopping of desired pumps;
safer and more sustainable pump operation.
The EnMS can also cause disadvantages such as:
when incorrect lockout of pumps are done and maintenance is under way, it could
start a pump causing serious damage;
operators need training in new system;
if a network failure occurs the EnMS will not be able to control the pumps;
different complex algorithms need to be programmed to provide total automatic
control and alarm the operators when a system is malfunctioning or close to an
operating parameter.
The EnMS provides a big advantage to the canal pumping scheme in terms of better control
and easier observation in terms of reporting to the plant managers. The EnMS also acts as
a logging system to ensure feasible data for further research and better control.
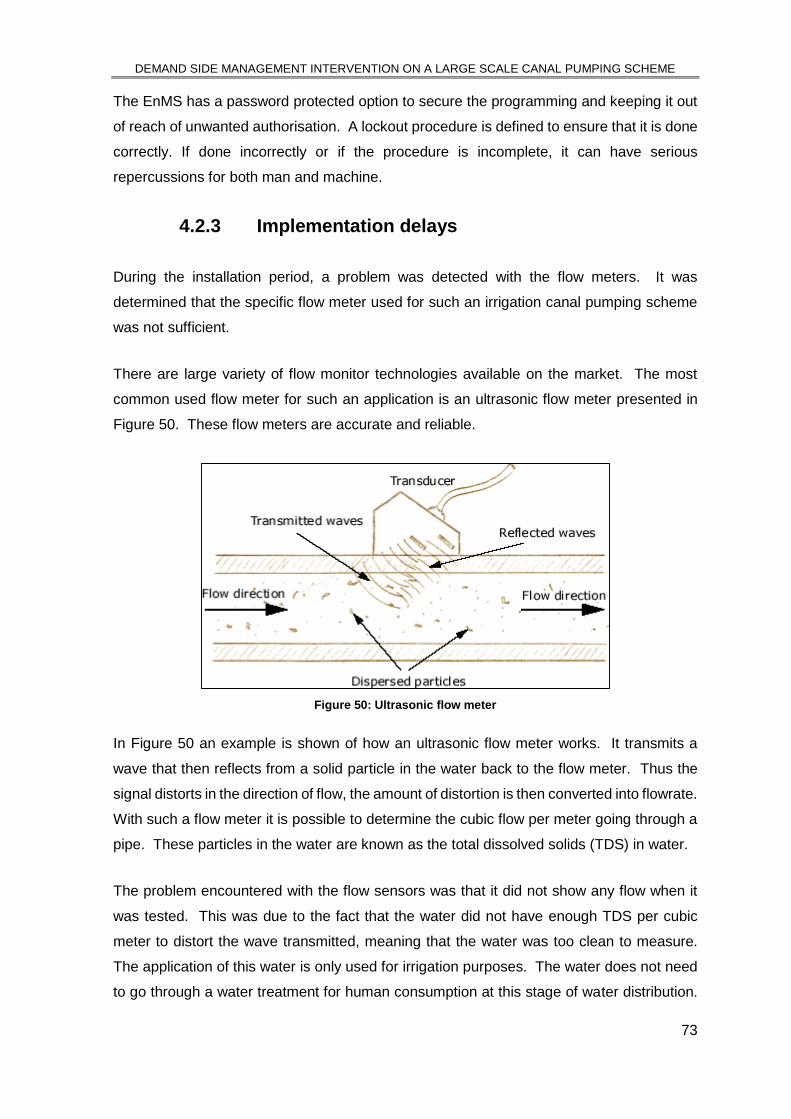
DEMAND SIDE MANAGEMENT INTERVENTION ON A LARGE SCALE CANAL PUMPING SCHEME
73
The EnMS has a password protected option to secure the programming and keeping it out
of reach of unwanted authorisation. A lockout procedure is defined to ensure that it is done
correctly. If done incorrectly or if the procedure is incomplete, it can have serious
repercussions for both man and machine.
4.2.3 Implementation delays
During the installation period, a problem was detected with the flow meters. It was
determined that the specific flow meter used for such an irrigation canal pumping scheme
was not sufficient.
There are large variety of flow monitor technologies available on the market. The most
common used flow meter for such an application is an ultrasonic flow meter presented in
Figure 50. These flow meters are accurate and reliable.
Figure 50: Ultrasonic flow meter
In Figure 50 an example is shown of how an ultrasonic flow meter works. It transmits a
wave that then reflects from a solid particle in the water back to the flow meter. Thus the
signal distorts in the direction of flow, the amount of distortion is then converted into flowrate.
With such a flow meter it is possible to determine the cubic flow per meter going through a
pipe. These particles in the water are known as the total dissolved solids (TDS) in water.
The problem encountered with the flow sensors was that it did not show any flow when it
was tested. This was due to the fact that the water did not have enough TDS per cubic
meter to distort the wave transmitted, meaning that the water was too clean to measure.
The application of this water is only used for irrigation purposes. The water does not need
to go through a water treatment for human consumption at this stage of water distribution.

DEMAND SIDE MANAGEMENT INTERVENTION ON A LARGE SCALE CANAL PUMPING SCHEME
74
Thus the assumption was made that the water will have enough TDS per cubic meter, and
the appropriate flow meters were then chosen upon the TDS range of a water sample taken
to ensure correct operation.
During the completion of installations and moving to the implementation phase, the power
factor correction switchgear failed. More specifically a vacuum circuit breaker (VCB) failed.
This happened due to aging infrastructure. The damaged equipment was then replaced,
delaying the implementation phase once again.
Performance assessment
As part of the total bill of quantities of infrastructure installed, monitoring equipment forms
part of it. This offers the capability to log important data such as the power usage, etc. All
the relevant data is then sent from the EnMS via GSM networks to a local database. Data
is sent daily after midnight ensuring a full 24-hour cycle of data for each day.
This data is then automatically processed through pre-set algorithms to generate a daily
report with all the relevant data such as the power consumption. The daily report can be
customised as needed. The report is then sent to all relevant personnel on a daily basis.
An example of the power consumption graph included in the daily report, is presented in
Figure 51 below.
The baseline, optimised baseline, as well as the actual profile for the specified period are
plotted on the graph. It is plotted over a 24-hour daily profile against the power used which
is measured in kW.
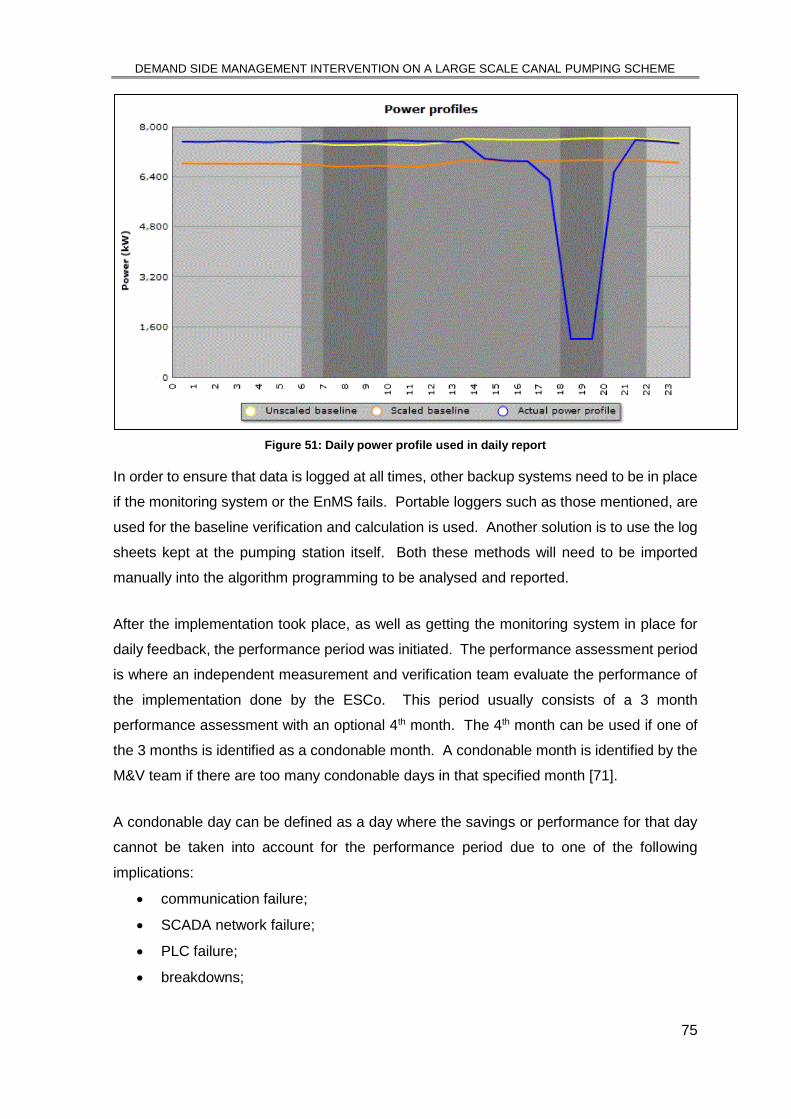
DEMAND SIDE MANAGEMENT INTERVENTION ON A LARGE SCALE CANAL PUMPING SCHEME
75
Figure 51: Daily power profile used in daily report
In order to ensure that data is logged at all times, other backup systems need to be in place
if the monitoring system or the EnMS fails. Portable loggers such as those mentioned, are
used for the baseline verification and calculation is used. Another solution is to use the log
sheets kept at the pumping station itself. Both these methods will need to be imported
manually into the algorithm programming to be analysed and reported.
After the implementation took place, as well as getting the monitoring system in place for
daily feedback, the performance period was initiated. The performance assessment period
is where an independent measurement and verification team evaluate the performance of
the implementation done by the ESCo. This period usually consists of a 3 month
performance assessment with an optional 4th month. The 4th month can be used if one of
the 3 months is identified as a condonable month. A condonable month is identified by the
M&V team if there are too many condonable days in that specified month [71].
A condonable day can be defined as a day where the savings or performance for that day
cannot be taken into account for the performance period due to one of the following
implications:
communication failure;
SCADA network failure;
PLC failure;
breakdowns;

DEMAND SIDE MANAGEMENT INTERVENTION ON A LARGE SCALE CANAL PUMPING SCHEME
76
equipment maintenance;
dry week;
very high water demand.
The achieved savings for the performance assessment from September to November are
summarised below in Table 8:
Table 8: Performance assessment savings
Month Saving (MW)
September 5.20
October 5.47
November 3.34
Average 4.67
Excellent savings were achieved during the first two months of performance assessment,
September and October. In the last month of performance assessment, November month
resulted in lower savings.
This was due to the higher amount of rain experienced during this month which resulted in
a lower water demand. On average, an impact of 4.67 MW was achieved during the
performance assessment period as shown in Table 8.
The independent M&V team published the monthly performance assessment reports for the
assessment period. In these reports all the results that were achieved are shown. These
reports are certified and verified by the M&V team.
All relevant parties also sign the documents as proof of agreement on these published
documents. The weekday performance assessment profiles of the respective months are
shown in Figure 52, Figure 53 and Figure 54.

DEMAND SIDE MANAGEMENT INTERVENTION ON A LARGE SCALE CANAL PUMPING SCHEME
77
Figure 52: September performance assessment result
During the month of September, evening peak demand reduction of 5.2 MW were achieved.
The red line indicates the actual profile achieved and it is plotted against the scaled baseline
in blue. The savings achieved can be ascribed to a sufficient demand for water and good
cooperation from the personnel of canal scheme S.
Figure 53: October performance assessment result
0
1000
2000
3000
4000
5000
6000
7000
8000
0 1 2 3 4 5 6 7 8 9 10 11 12 13 14 15 16 17 18 19 20 21 22 23
Po
wer
[kW
]
Time [Hour]
September performance assessment
Scaled baseline Actual profile
0
1000
2000
3000
4000
5000
6000
7000
8000
9000
0 1 2 3 4 5 6 7 8 9 10 11 12 13 14 15 16 17 18 19 20 21 22 23
Po
wer
[kW
]
Time [Hour]
October performance assessment
Scaled baseline Actual profile

DEMAND SIDE MANAGEMENT INTERVENTION ON A LARGE SCALE CANAL PUMPING SCHEME
78
During the month of October, evening demand reduction of 5.47 MW were achieved. The
red line indicates the actual profile achieved and it is plotted against the scaled baseline in
blue. The evening peak demand reduction achieved can be ascribed to a sufficient demand
for water and good cooperation from the personnel of canal scheme S.
Figure 54: November performance assessment result
During the month of November, an evening demand reduction of 3.34 MW were achieved.
The red line indicates the actual profile achieved and it is plotted against the scaled baseline
in blue. Less, but still an acceptable amount of savings was achieved during the month of
November. The drop in savings is due to the high amount of rain in the area, which can be
observed in Figure 39.
Each actual power profile result from the three performance assessment periods is
presented in Figure 55. The power usage for the last month is much lower in comparison
to the other months. This can be ascribed to the amount of rain experienced during the
month of November. This lowered the demand for water and resulted in fewer pumps being
operated.
0
1000
2000
3000
4000
5000
6000
0 1 2 3 4 5 6 7 8 9 10 11 12 13 14 15 16 17 18 19 20 21 22 23
Po
wer
[kW
]
Time [Hour]
November performance assessment
Scaled baseline

DEMAND SIDE MANAGEMENT INTERVENTION ON A LARGE SCALE CANAL PUMPING SCHEME
79
Figure 55: Performance assessment comparison
From Figure 55 it can be observed that a load shift was possible in every month of the
performance assessment period. This was possible despite the fluctuation of the water
demand each month. The personnel from canal scheme S followed the recommendations
reported by the EnMS to achieve load shift profiles.
Figure 56: Average savings profile
0
1000
2000
3000
4000
5000
6000
7000
8000
9000
1 2 3 4 5 6 7 8 9 10 11 12 13 14 15 16 17 18 19 20 21 22 23 24
Po
wer
[kW
]
Time [Hour]
Performance assessment
September October November
0
1000
2000
3000
4000
5000
6000
7000
8000
9000
0 1 2 3 4 5 6 7 8 9 10 11 12 13 14 15 16 17 18 19 20 21 22 23
Po
wer
[kW
]
Time [Hour]
Average load shift vs proposed profile
Simulation Implementation

DEMAND SIDE MANAGEMENT INTERVENTION ON A LARGE SCALE CANAL PUMPING SCHEME
80
The average performance assessment period profile for the combined three month period
is plotted against the proposed profile in Figure 56. Both profiles were scaled energy neutral
in relation to each other.
The actual profile’s comeback load is distributed throughout the rest of the day and not just
during the off peak period as in the proposed profile. The reason for that is due to the high
demand for water. The balancing dam’s level needs to be kept between the control levels
and water is drawn from the balancing dam throughout the day to ensure optimal growth for
the crops. An annual cost saving resulted in a total of R 3.2-million using 2014/2015 Eskom
tariffs.
Impact of this study
From the results obtained in the performance assessment period, the implementation of the
DSM methodology deemed to be successful.
Several benefits were observed during the implementation of the load shift initiative at the
canal pumping scheme which included:
improved infrastructure;
improved maintenance;
better personnel decision making;
more effective pump station control;
improved energy usage awareness;
improved energy savings; and
improved knowledge in terms of power consumption.
The external factors mentioned played a big role in the result of the performance achieved.
These external factors include:
water supply;
water demand;
seasonal rainfall;
temperature and humidity; and
sowing and harvesting of crops yearly timeline.
With the external factors kept in mind, the implementation of the DSM methodology resulted
in an over achievement of 55% from the target set for canal scheme S.
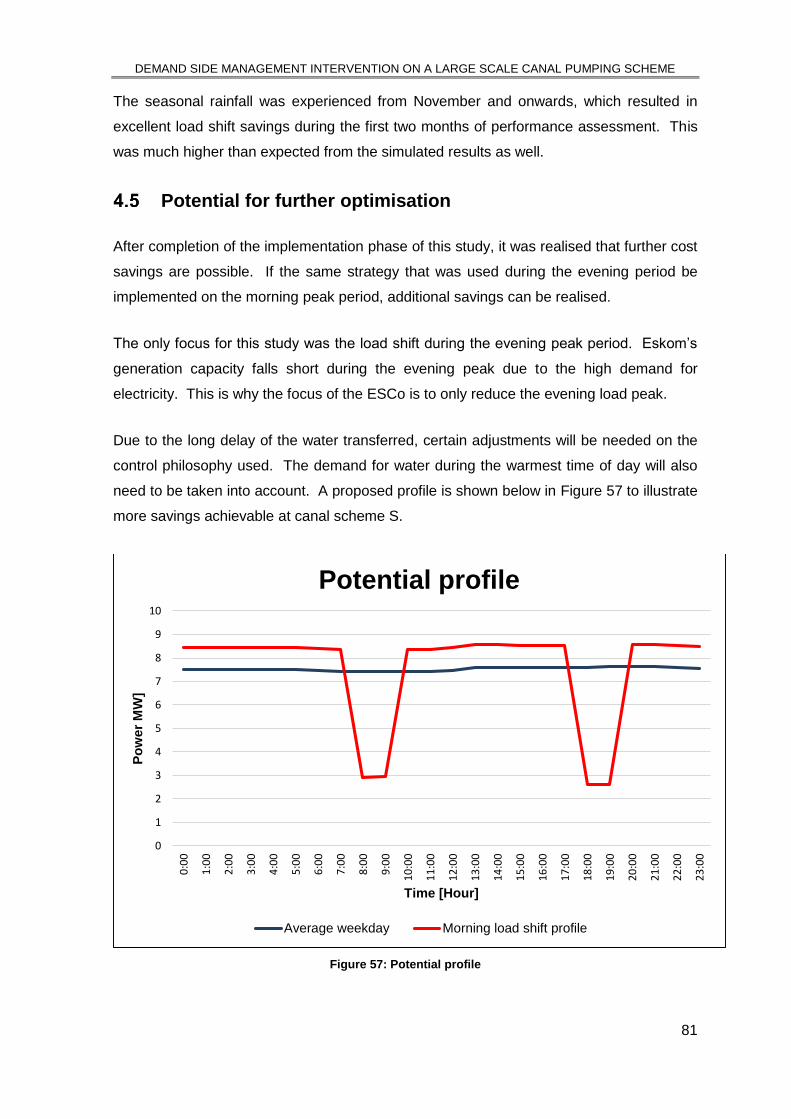
DEMAND SIDE MANAGEMENT INTERVENTION ON A LARGE SCALE CANAL PUMPING SCHEME
81
The seasonal rainfall was experienced from November and onwards, which resulted in
excellent load shift savings during the first two months of performance assessment. This
was much higher than expected from the simulated results as well.
Potential for further optimisation
After completion of the implementation phase of this study, it was realised that further cost
savings are possible. If the same strategy that was used during the evening period be
implemented on the morning peak period, additional savings can be realised.
The only focus for this study was the load shift during the evening peak period. Eskom’s
generation capacity falls short during the evening peak due to the high demand for
electricity. This is why the focus of the ESCo is to only reduce the evening load peak.
Due to the long delay of the water transferred, certain adjustments will be needed on the
control philosophy used. The demand for water during the warmest time of day will also
need to be taken into account. A proposed profile is shown below in Figure 57 to illustrate
more savings achievable at canal scheme S.
Figure 57: Potential profile
0
1
2
3
4
5
6
7
8
9
10
0:0
0
1:0
0
2:0
0
3:0
0
4:0
0
5:0
0
6:0
0
7:0
0
8:0
0
9:0
0
10
:00
11
:00
12
:00
13
:00
14
:00
15
:00
16
:00
17
:00
18
:00
19
:00
20
:00
21
:00
22
:00
23
:00
Po
wer
MW
]
Time [Hour]
Potential profile
Average weekday Morning load shift profile

DEMAND SIDE MANAGEMENT INTERVENTION ON A LARGE SCALE CANAL PUMPING SCHEME
82
The morning load shift profile indicates an added morning peak reduction of 4.5 MW. This
morning peak load reduction will not only benefit Eskom, but also the client. The total load
reduction for the morning and evening peak periods will result in 9.5 MW of power savings.
The comeback load is implemented throughout the day and not just in the off-peak period
as in the case study implemented. The comeback load will be possible due to the fact that
the total power usage will be below the 10 MW constraint.
Conclusion
In Chapter 4 the implementation of the load shift project was discussed. Time delays were
also discussed in the chapter. During the performance assessment period savings of 4.67
MW were realised. This was 55% more than the 3 MW target which was set.
It was determined in the impact of the study done that it would be possible to achieve the
target savings. The external factors which had the biggest impact on the outcome of the
project were discussed and considered throughout the implementation of the study. Several
other benefits were also realised in the impact of the study.
Even more savings are possible when further optimisation is done. An additional morning
load reduction of 4.5 MW is possible when implementing a morning load reduction as well.
During the implementation and conclusion of this project, delays were experienced and
constraints were identified. Other hidden benefits were also discussed as well as further
power savings for the canal pumping scheme.

DEMAND SIDE MANAGEMENT INTERVENTION ON A LARGE SCALE CANAL PUMPING SCHEME
83
CHAPTER 5 - Conclusion and
recommendations
Chapter 5 concludes the study and recommendations for further study are discussed.

DEMAND SIDE MANAGEMENT INTERVENTION ON A LARGE SCALE CANAL PUMPING SCHEME
84
5.1 Conclusion
In this dissertation it has been determined that the demand for electricity is exceeding the
generation capacity of Eskom. It is known that in South Africa the annual precipitation is
very uneven. The distribution of water is therefore necessary for the economy of South
Africa as well as food security.
Therefore, water needs to be pumped over vast distances to provide water in the needs for
agricultural purposes. These water transfer schemes require high flow rates to function
effectively. Parallel with these requirements, the equipment used is energy intensive.
DSM interventions, more specifically load shifting interventions, have already been
implemented on various pumping systems and have proven to be highly effective. The
implementation of load shifting interventions has long term financial implications as well as
responsibilities for the client and Eskom. Therefore, it is important to ensure that load
shifting results are kept sustainable throughout the lifetime of the DSM project.
It was found viable to implement a load shift intervention on a large scale canal pumping
scheme. Shifting the load out of the evening peak period to the off peak period proved to
result in sufficient evening load reduction without compromising the water supply target.
The need for an EnMS was identified to recommend a schedule for pump control.
An in-depth investigation was conducted on canal scheme S to determine the operating
parameters, system variables as well as constraints. The different elements which were
important to consider were discussed. Portable loggers were installed to determine the
basic electricity usage of the pumping station. After the calculations were completed, a
weekday baseline for load shifting during the evening peak period of 3 MW was proposed.
A simulation model was built to determine the effect of a load shift on canal scheme S. It
was determined that an evening load reduction of 5.4 MW was able to be achieved. The
comeback load during the off-peak period was possible due to the comeback load being
below the maximum capacity of 10 MW of the transformer. To verify the simulation model,
a drop test was done over a typical operation week. It was determined that an average
evening load reduction of 5.6 MW was possible during this week period.
The simulation which was done, was only for a certain period of the year. The simulation
provided evidence that the DSM methodology was viable to be implemented. The results

DEMAND SIDE MANAGEMENT INTERVENTION ON A LARGE SCALE CANAL PUMPING SCHEME
85
of the simulation model were extrapolated to forecast results for the rest of the year. An
average target was calculated from the season evening load reduction in a year. This
resulted in the target of 3 MW.
It was considered applying an automated system with the use of the EnMS, but due to the
lack of infrastructure it was decided to rather implement manual control. The EnMS only
provided a recommendation schedule to switch pumps off during the peak period.
During the performance assessment period of canal scheme S, the average evening load
reduction for the three month performance assessment period was 4.67 MW. This resulted
in 55% higher evening load reduction than the target of 3 MW.
Potential for further optimisation concluded that additional load reduction can be realised.
This can be done by implementing a load shift intervention in the morning peak period as
well.
The implementation of the DSM methodology which was developed, proved to be
successful as predicted by the simulation model. An annual cost saving of R 3.2-million
was realised.

DEMAND SIDE MANAGEMENT INTERVENTION ON A LARGE SCALE CANAL PUMPING SCHEME
86
5.2 Recommendations for further research
The control philosophy which was developed, based on the implementation of a DSM
initiative, proved to be very successful. An evening peak load shift was achieved during
this implementation which benefited not only Eskom, but the client as well.
It is, therefore, recommended that the strategies and control be implemented on other canal
pumping schemes as well. Each scheme where it will be implemented on, will have its own
constraints and limitations upon investigation. Effectively, the principle will remain the same
and it would be possible to use the EnMS with great success.
It will be important to take the seasonal effect into consideration for each canal pumping
scheme independently. Each canal scheme is located in an area that differs from the
others. The location of a canal scheme influences the rainfall profile throughout the year,
the type of crop planted as well as the WFD needed to ensure sufficient growth of a crop.
It is also recommended to investigate the effect of the seasonal changes on the canal
scheme. This will provide better forecasting for the WFD as well as the type of crop to plant
and which time in the season will be the most ideal. This will increase the effective use of
water which is a very scarce and important resource.

DEMAND SIDE MANAGEMENT INTERVENTION ON A LARGE SCALE CANAL PUMPING SCHEME
87
References
[1] Eskom Holdings Limited, ‘Eskom’s generation plant mix’, Sunninghill, Johannesburg,
South Africa, 2014.
[2] Eskom, ‘What is load shedding.’ [Online]. Available:
http://loadshedding.eskom.co.za/loadshedding/description. [Accessed: 01-Jan-
2015].
[3] G. Van der Nest, ‘The economic consequences of load shedding in South Africa and
the state of the electrical grid’, 2015. [Online]. Available:
http://www.tralac.org/discussions/article/7000-the-economic-consequences-of-load-
shedding-in-south-africa-and-the-state-of-the-electrical-grid.html.
[4] C. P. Snyman and W. J. Botha, ‘Coal in South Africa’, Journal of African Earth
Sciences (and the Middle East), vol. 16, pp. 171–180, 1993.
[5] ‘U.S. Energy Information Administration, “Independent Statistics and Analysis:South
African Energy Overview.”’ [Online]. Available:
http://www.eia.gov/countries/cab.cfm?fips=SF. [Accessed: 14-Mar-2015].
[6] news24, ‘Eskom implements load shedding’, 2014. [Online]. Available:
http://www.fin24.com/Economy/Eskom-implements-load-shedding-20141102.
[7] A. Kenny, F. Cronje, L. Moloi, T. Dimant, J. Kane-berman, M. Matsokotere, and S.
Zwane, ‘The rise and fall of Eskom — and how to fix it now’, no. 2, pp. 1–22, 2015.
[8] FindTheData, ‘United Kingdom vs South Africa’, Graphiq Inc., 2015. [Online].
Available: http://country-facts.findthedata.com/compare/28-133/United-Kingdom-vs-
South-Africa.
[9] NERSA (National Energy Regulator of South Africa), ‘Eskom 2015/2016 time of use
(TOU) structural adjustment’, 2015.
[10] S. De, V. Letschert, G. Leventis, and T. Covary, ‘Energy Efficiency country study :
Republic of South Africa’, Ernest Orlando Lawrence Berkeley National Laboratory,
2013.

DEMAND SIDE MANAGEMENT INTERVENTION ON A LARGE SCALE CANAL PUMPING SCHEME
88
[11] J. T. Cousins, ‘Using time of use (TOU) tariffs in industrial, commercial and residential
applications effectively’, TLC Engineering Solutions, 2009.
[12] Eskom Holdings Limited, ‘Schedule of standard prices for Eskom tariffs 1 April 2014
to 31 March 2015 for non-local authority supplies, and 1 July 2014 to 31 June 2015
for local authority supplies’, Megawatt Park, Sunning hill, Johannesburg, South
Africa, 2014.
[13] Eskom Holdings SOC Limited, ‘Eskom Charges Booklet 2014/2015’, 2015.
[14] UNIDO, ‘Demand-side management sustainable energy regulation and policymaking
for africa.’
[15] D. Crossley and W. Xuan, ‘ESCOs as a delivery mechanism for grid company DSM
in China ESCOs as a delivery mechanism for grid company DSM in China’, RAP, no.
2, 2013.
[16] J. W. Bleyl, M. Bareit, N. Adilipour, and J. Coolen, ‘ESCo market development : A
role for facilitators to play’, eceee 2013 Summer Study: Rethink, renew, restart, pp.
921–933, 2013.
[17] ESMAP, ‘Implementing Energy Efficiency and Demand Side Management South
Africa ’ s Standard Offer Model’, Low Carbon Growth Country Studies Program,
2014.
[18] Department of Energy, ‘South Africa policy to support the Energy Efficiency and
Demand Side Management program for the electricity sector through the standard
offer incentive scheme.’ 2010.
[19] A. Botha, Optimising the demand of a mine water reticulation system to reduce
electricity consumption. Masters dissertation, North-West University, Pochefstroom
Campus.
[20] J. Harte and M. El-Gasseir, ‘Energy and Water’, Science, vol. 199, no. 4329, pp.
623–634.
[21] Water Management, ‘The national state of water resources quarterly report July to
September 2014’, 2014.

DEMAND SIDE MANAGEMENT INTERVENTION ON A LARGE SCALE CANAL PUMPING SCHEME
89
[22] H. Mare and A. Jeleni, ‘Review of Existing Infrastructure in the Orange River
Catchment’, Water Surveys Botswana, 2007.
[23] ‘Atlas of South Africa’, 2015. [Online]. Available:
http://www.hoeckmann.de/karten/afrika/suedafrika/index-en.htm.
[24] W. Van Averbeke and J. Denison, ‘Smallholder irrigation schemes in South Africa :
A review of knowledge generated by the Water Research Commission’, vol. 37, no.
5, pp. 797–808, 2011.
[25] W. G. M. Bastiaanssen, D. J. Molden, and I. W. Makin, ‘Remote sensing for irrigated
agriculture: examples from research and possilbe applications’, Agricultural Water
Management, vol. 46, pp. 137–155, 2000.
[26] Irrigation Engineering, ‘Module 3: Irrigation Engineering Principles’, Version 2 CE IIT,
Kharagpur.
[27] I. J. Miltenburg, ‘Determination of canal characteristics with experimental modeling’,
Delft University of Technology, 2008.
[28] ‘Irrigation Water Management: Introduction to irrigation’, Natural Resources
Management and Enviroment Department. [Online]. Available:
http://www.fao.org/docrep/r4082e/r4082e38.gif.
[29] G. P. Merkley, ‘Channel Cross Sections’, BIE 5300/6300 Lectures, pp. 171 – 190.
[30] B. Thandaveswara, ‘Design of Canals’, in Hydraulics, Indian Institute of Technology
Madras.
[31] M. R. Olesen and C. R. Bech, Grundfos Industry Pump Handbook. 2004.
[32] C. B. Jacobsen, ‘The Centrifugal Pump’, Bjerringbro, Denmark, 2008.
[33] J. Evans, ‘Pump Ed 101: Centrifugal Pump Dynamics’, Rhododendron, OR, United
States of America, 2005.
[34] D. Kernan, ‘Pumps 101 : Operation , Maintenance and Monitoring Basics’, pp. 1–10.
[35] E. Lindeque, ‘Pumps and driving systems’, ARC-Instute for Agricultaral Engineering,
2006.

DEMAND SIDE MANAGEMENT INTERVENTION ON A LARGE SCALE CANAL PUMPING SCHEME
90
[36] S. Wu, ‘Reciprocating Pumps vs. Multi-Stage Centrifugal Pumps.’ [Online]. Available:
http://www.pumpsandsystems.com/topics/pumps/reciprocating-
pumps/reciprocating-pumps-vs-multi-stage-centrifugal-pumps.
[37] J. B. Rishel, ‘Horizontal Split-Case Centrifugal Pumps’, vol. 1, 2007.
[38] N. H. C. Hwang, R. J. Houghtalen, A. O. Akan, and N. H. C. Hwang, Fundamentals
of hydraulic engineering systems. Prentice-Hall Englewood Cliffs (NJ), 1987.
[39] CheCalc, ‘Pump Operation Series & Parallel’, 2014. .
[40] R. Maier, ‘Protection of squirrel-cage induction motor utilizing instantaneous power
and phase information’, Industry Applications, IEEE Transactions on, vol. 28, no. 2,
pp. 376–380, 1992.
[41] I. J. Karassik, J. P. Messina, P. Cooper, and C. C. Heald, ‘Chapter 6: Pump Drives’,
in Pump Handbook, 3rd ed., D. Fogarty, Ed. New York, NY, United States of America:
McGraw-Hill, 2001, pp. 6.1–6.35.
[42] D. Wright, ‘Squirrel cage motors’, 2005. [Online]. Available: http://www-
mdp.eng.cam.ac.uk/web/library/enginfo/textbooks_dvd_only/DAN/motors/steady/st
eady.html.
[43] A. T. Sayers, Hydraulic and compressible flow turbomachines. London: McGraw-Hill,
1990.
[44] J. Anspach, ‘Solving a cavitation problem’, John Anspach Consulting, 2011. .
[45] ‘Venturi effect.’ [Online]. Available:
https://uqu.edu.sa/files2/tiny_mce/plugins/filemanager/files/4282164/Venturi
effect.pdf.
[46] J. Monsen, ‘Liquid Flow in Control Valves – Choked flow, Cavitation and Flashing’,
Valin Corporation, 2013. .
[47] M. Kay and M. Kay, ‘Water hammer’, in Practical Hydraulics, United States of
America: Taylor & Francis, 2008, pp. 118–123.
[48] ‘A garden in the desert: Vaalharts’, The Water Wheel, pp. 20–24, 2010.

DEMAND SIDE MANAGEMENT INTERVENTION ON A LARGE SCALE CANAL PUMPING SCHEME
91
[49] ‘Components of Project’, Sardar Sarovar NArmada Nigam Ltd. A Wholly owned
Goverment of Gujarat undertaking CIN No. U45200GJ1988SGC01493. [Online].
Available: http://www.sardarsarovardam.org/components-of-project.aspx.
[50] ‘Sardar Sarovar Dam, Gujarat, India’, water-technology.net. [Online]. Available:
http://www.water-technology.net/projects/sardar-sarovar-dam-gujarat/.
[51] ‘Lake Mulwala.’ [Online]. Available:
http://www.lakemulwala.org.au/management.aspx.
[52] R. R. Negenborn, P. J. van Overloop, T. Keviczky, and B. De Schutter, ‘Distributed
model predictive control for irrigation canals’, Networks and Heterogeneous Media,
vol. 4, no. 2, pp. 359–380.
[53] D. David and A. Kalra, ‘Power Management and Automation Scheme for Water Canal
Networks’, 2015.
[54] S. Bunn and L. Reynolds, ‘The energy-efficiency benefits of pump-scheduling
optimization for potable water supplies’, IBM Journal of Research and Development,
vol. 53, no. 3, pp. 1–13, 2009.
[55] M. Slade, ‘Electricity cost optimisation of a surface potable water pump system’,
Master’s Dissertation, Department of Electrical Engineering, North West University,
Potchefstroom Campus, 2007.
[56] R. Pelzer and M. Slade, ‘Electricity cost optimisation of a surface potable water pump
system’, Industrial & Commercial Use of Energy (ICUE), vol. 5, 2008.
[57] A. Nortje, ‘DSM strategy for national water pumping systems’, Master’s dissertation,
Department of Mechanical Engineering, North-West University: Potchefstroom
Campus, 2012.
[58] C. F. Scheepers, G. D. Bolt, and M. Kleingeld, ‘Load management projects at the
Department of Water Affairs through an integrated systems approach’, Proceedings
of the 9th conference on the industrial and commercial use of energy, pp. 41–45,
2012.
[59] A. Hughes, M. I. Howells, A. Trikam, A. R. Kenny, and D. van Es, ‘A study of demand
side management potential in South African industries’, Energize, pp. 16–22, 2006.

DEMAND SIDE MANAGEMENT INTERVENTION ON A LARGE SCALE CANAL PUMPING SCHEME
92
[60] R. P. Richter, ‘Comparison between automated and manual DSM pumpin projects’,
Master’s Dissertation, North West University, Potchefstroom Campus, 2008.
[61] N. De Kock, ‘Researching the long-term impact of load management projects on
South African Mines’, Master’s dissertation, North-West University, Potchefstroom
Campus, 2006.
[62] M. Kleingeld, N. J. C. M. De Kock, and E. H. Mathews, ‘Real benefits of DSM projects
on mines’, in Industrial & Commercial Use of Energy (ICUE), 2009.
[63] A. Prinsloo, ‘Energy cost optimisation of a complex mine pumping system’, Master’s
dissertation, North-West University, Potchefstroom Campus, 2004.
[64] S. Mcfadyen, Motor starting and control primer: An introduction to the starting
techniques and control of electric motors, 1st ed. Steven Mcfadyen, 2014.
[65] EATON, ‘Solid-state soft start motor controller and starter’, Cleveland, OH, United
States of America, 2011.
[66] DENT, ‘Operator’s guide Elitepro XC and ELOG 14 Software’, 2014.
[67] IPMVP, ‘Concepts and Options for Determining Energy and Water Savings’, 2011.
[68] ‘Vanderkloof dam’, 2015. [Online]. Available: https://www.dwa.gov.za/Hydrology/.
[69] M. Schur, ‘Pricing of irrigation water in South Africa’, Country Report, Guidelines for
Pricing Irrigation Water, World Bank, Washington, DC, 2000.
[70] V. O. Sadras, P. Grassini, and P. Steduto, ‘Status of water use efficiency of main
crops.’
[71] W. L. den Heijer and P. L. J. Grobler, ‘The Measurement and verification Guideline:
Mine Pumping Projects’, Potchefstroom, South Africa, 2006.