demand for green finance - iisd.org the demand for green finance over the next five years, ......
TRANSCRIPT

CHAPTER 2:
DEMAND FOR GREEN FINANCEZHENG ZHENG, NATIONAL DEVELOPMENT AND REFORM COMMISSION
WITH SUPPORT FROMIN ASSOCIATION WITH
45
GREE
NIN
G CH
INA’
S FI
NAN
CIAL
SYS
TEM SE
CTIO
N 2:
CHI
NES
E EX
PERT
PER
SPEC
TIVE
S
EXECUTIVE SUMMARY 46
1 GREEN INVESTMENT AND FINANCING IN CHINA TO DATE 47
1.1 Development of Green Investment 47
1.2 Financial Structure 48
2 FUTURE DEMAND FOR GREEN INVESTMENT 51
2.1 Policy Targets of China’s Green Development 51
2.2 Evolution of China’s Green Development Policies 51
2.3 Future Requirements for Green Investment 52
2.4 Estimates on Growth of Green Investment Demand 54
3 INSTITUTIONAL CONSTRAINTS AND DIRECTION OF IMPROVEMENT IN GREEN INVESTMENT AND FINANCING 56
3.1 Institutional Constraints 56
3.2 Direction for Institutional Improvement of Supply of Green Finance 57
REFERENCES 58
APPENDIX A 59
CONT
ENTS
46
CHAP
TER
2: D
EMAN
D FO
R GR
EEN
FIN
ANCE
EXECUTIVE SUMMARYThis paper reviews the statistics on investment in fixed assets of key green sectors in China to date and estimates the demand for green finance over the next five years, from 2015 to 2020.
The sectors it focuses on are: environmental pollution control (waste gas, wastewater and solid wastes), forestry, recycling and waste management, low-carbon power generation (including nuclear power) and urban environmental infrastructure, such as sewage treatment. It also looks at future demand in areas such as green buildings and green transport.
We estimate over 3 per cent of GDP—RMB 1,642 billion (USD 260 billion)—was invested into these core green sectors in 2012. Market-based green finance (from loans, bonds, equities other private financing) contributed around 70 per cent of these funds, approximately RMB 1,126 billion (USD 180 billion), with the rest coming from public budgets and the self-owned capital of enterprises.
The policy targets of China’s green development for the period from 2015 to 2020 are likely to intensify focus on industrial pollution control and greenhouse gas emission reduction. We estimate that demand for green investment to meet China’s green policy goals will be growing to approximately RMB 2,908 billion (USD 465 billion) a year, requiring approximately RMB 2,000 billion (USD 320 billion) of market-based green finance each year.
Increasingly, government fiscal support should stimulate the development of market-based green finance, instead of directly meeting the demand for green investment on behalf of the financial system.

47
GREE
NIN
G CH
INA’
S FI
NAN
CIAL
SYS
TEM SE
CTIO
N 2:
CHI
NES
E EX
PERT
PER
SPEC
TIVE
S
1GREEN INVESTMENT AND FINANCING IN CHINA TO DATE In order to assess the scale of green investment, this paper looks at official statistics on investment into core “green sectors”: environmental protection (including pollution control, water treatment and urban environmental infrastructure and green spaces), low-carbon electricity generation (including hydro, nuclear, solar and wind) and forestry. Although these sectors do not cover the full scope of green investment in China, they are important areas linked to policy targets and on which there is macro data available.
1.1 DEVELOPMENT OF GREEN INVESTMENT
Investment in pollution control in China can be traced back to 1973 (Zhang & Zhao, 2003). Between 1973 and 1981, public investment in pollution control was low, amounting to RMB 504 million over 8 years (around USD 40 million a year 1) accounting for only 0.05 per cent of the national fiscal expenditures (Twenty Years of Environmental Protection Administration in China Committee, 1994). After environmental protection was formally included in China’s Sixth Five-Year Plan in 1982, investment levels rose, reaching RMB 16 billion (USD 3 billion) by 1991. By 1999 environmental protection amounted to 1 per cent of GNP, equivalent for the first time to the level that many developed countries had reached in the 1970s (China Environment Yearbook Committee, 2001). By 2012 investment in pollution control had reached RMB 825.3 billion (USD 132 billion) or 1.6 per cent of GDP.
FIGURE 1: INVESTMENT IN ENVIRONMENT POLLUTION CONTROL
Source: CEIC (n.d.)
1 All historic exchange rates from: http://en.wikipedia.org/wiki/List_of _renminbi_exchange_rates
48
CHAP
TER
2: D
EMAN
D FO
R GR
EEN
FIN
ANCE
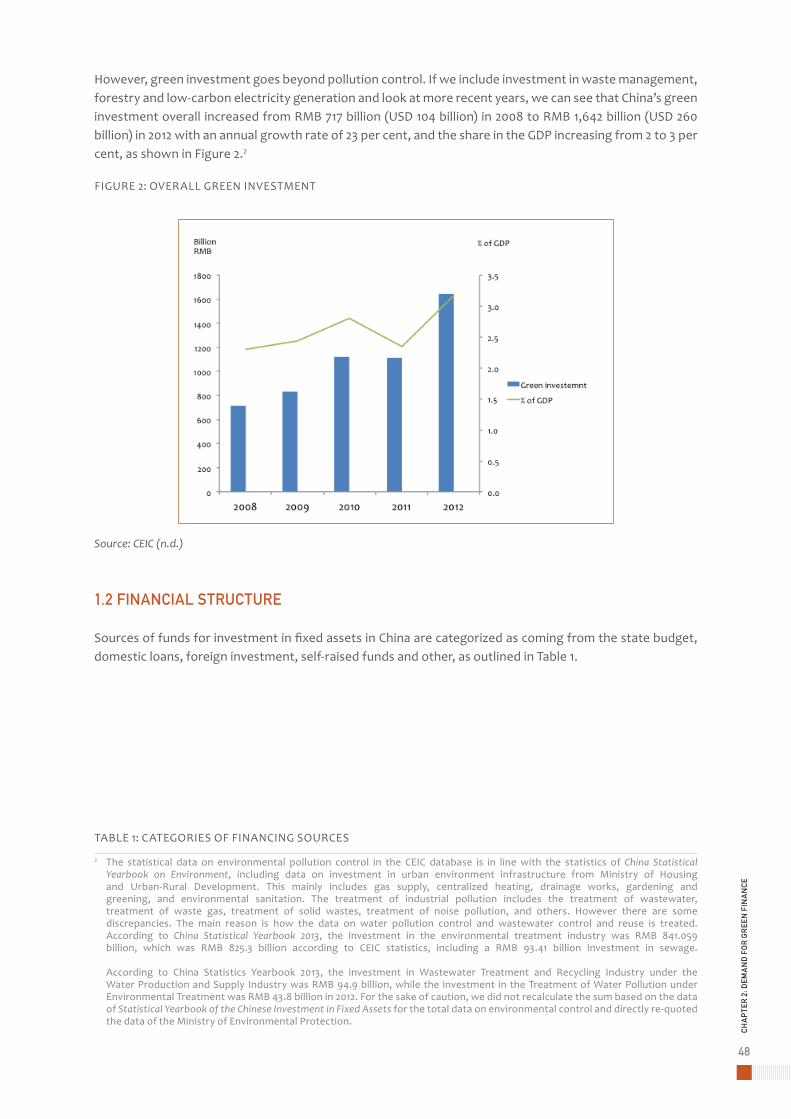
However, green investment goes beyond pollution control. If we include investment in waste management, forestry and low-carbon electricity generation and look at more recent years, we can see that China’s green investment overall increased from RMB 717 billion (USD 104 billion) in 2008 to RMB 1,642 billion (USD 260 billion) in 2012 with an annual growth rate of 23 per cent, and the share in the GDP increasing from 2 to 3 per cent, as shown in Figure 2.2
FIGURE 2: OVERALL GREEN INVESTMENT
Source: CEIC (n.d.)
1.2 FINANCIAL STRUCTURE
Sources of funds for investment in fixed assets in China are categorized as coming from the state budget, domestic loans, foreign investment, self-raised funds and other, as outlined in Table 1.
TABLE 1: CATEGORIES OF FINANCING SOURCES
2 The statistical data on environmental pollution control in the CEIC database is in line with the statistics of China Statistical Yearbook on Environment, including data on investment in urban environment infrastructure from Ministry of Housing and Urban-Rural Development. This mainly includes gas supply, centralized heating, drainage works, gardening and greening, and environmental sanitation. The treatment of industrial pollution includes the treatment of wastewater, treatment of waste gas, treatment of solid wastes, treatment of noise pollution, and others. However there are some discrepancies. The main reason is how the data on water pollution control and wastewater control and reuse is treated. According to China Statistical Yearbook 2013, the investment in the environmental treatment industry was RMB 841.059 billion, which was RMB 825.3 billion according to CEIC statistics, including a RMB 93.41 billion investment in sewage. According to China Statistics Yearbook 2013, the investment in Wastewater Treatment and Recycling Industry under the Water Production and Supply Industry was RMB 94.9 billion, while the investment in the Treatment of Water Pollution under Environmental Treatment was RMB 43.8 billion in 2012. For the sake of caution, we did not recalculate the sum based on the data of Statistical Yearbook of the Chinese Investment in Fixed Assets for the total data on environmental control and directly re-quoted the data of the Ministry of Environmental Protection.

49
GREE
NIN
G CH
INA’
S FI
NAN
CIAL
SYS
TEM SE
CTIO
N 2:
CHI
NES
E EX
PERT
PER
SPEC
TIVE
S
Category Description
State budget General budget, government fund budget, state-owned capital operation budget and social insurance fund budget. Government bonds at all levels shall also be included in state budgetary funds
Domestic loans Loans borrowed by investing units from banks and non-bank financial institutions, including loans issued by banks from their self-owned funds and deposits, special loans by government, and loans arranged by local government from special funds
Foreign investment Overseas (including Hong Kong, Macao and Taiwan) funds including loans from governments, international financial organizations, export credit, commercial loans from foreign banks, bonds and stocks issued in foreign exchanges, foreign direct investment and other foreign investment
Self-raised funds Funds received and raised by enterprises including self-owned funds and funds raised from other enterprises and institutions, but excluding the various types of fiscal funds, fund borrowed from various types of financial institutions (FIs) and foreign funds
Other Funds not included in the above-mentioned sources, including mass financing, individual funds, donations
Source: National Bureau of Statistics of the People’s Republic of China (2014)
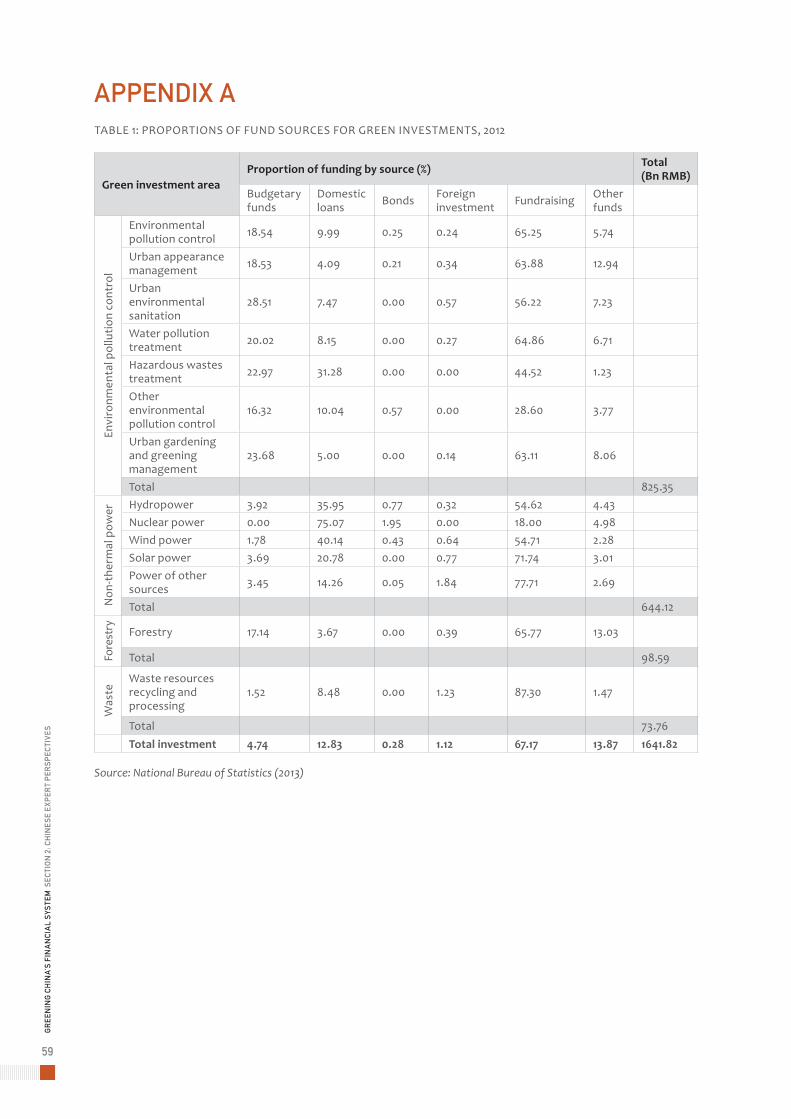
Using these categories, the sources of investment for different green sectors in 2012 are shown in Figure 3 (also see tables 1 and 2 in the Appendix)
FIGURE 3: PROPORTIONS OF FUNDING SOURCES FOR GREEN INVESTMENT, 2012
Source: National Bureau of Statistics (2013).

50
CHAP
TER
2: D
EMAN
D FO
R GR
EEN
FIN
ANCE
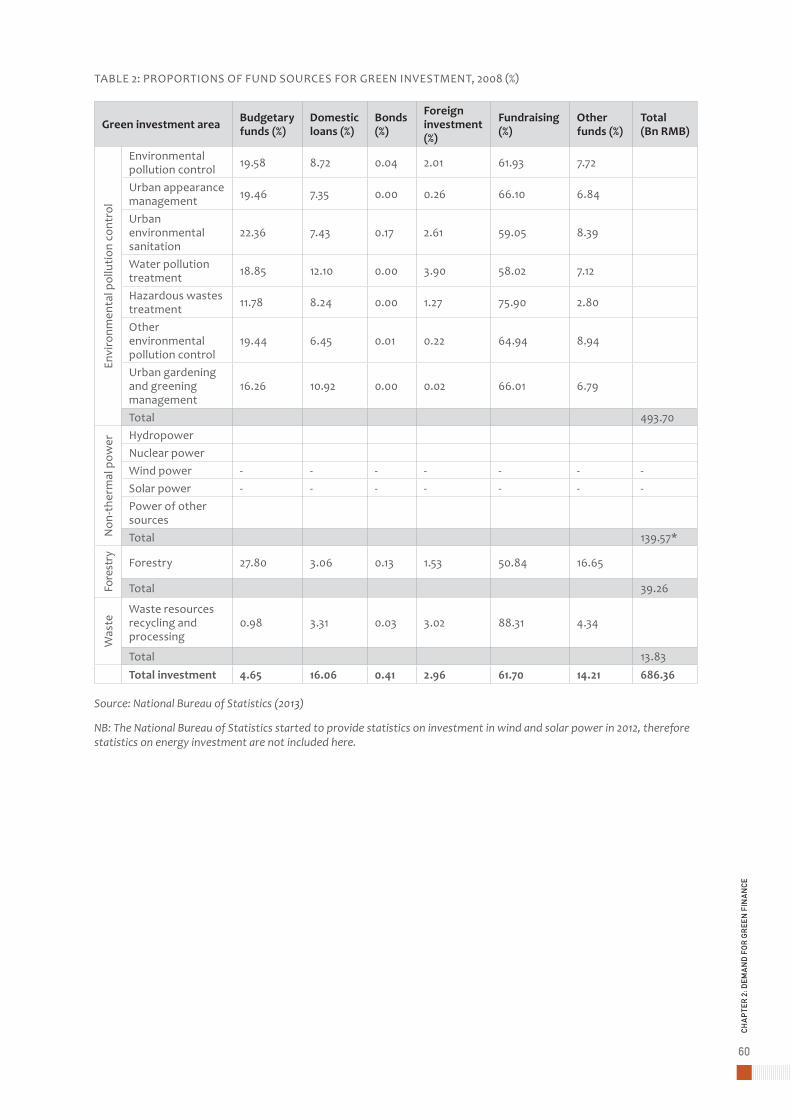
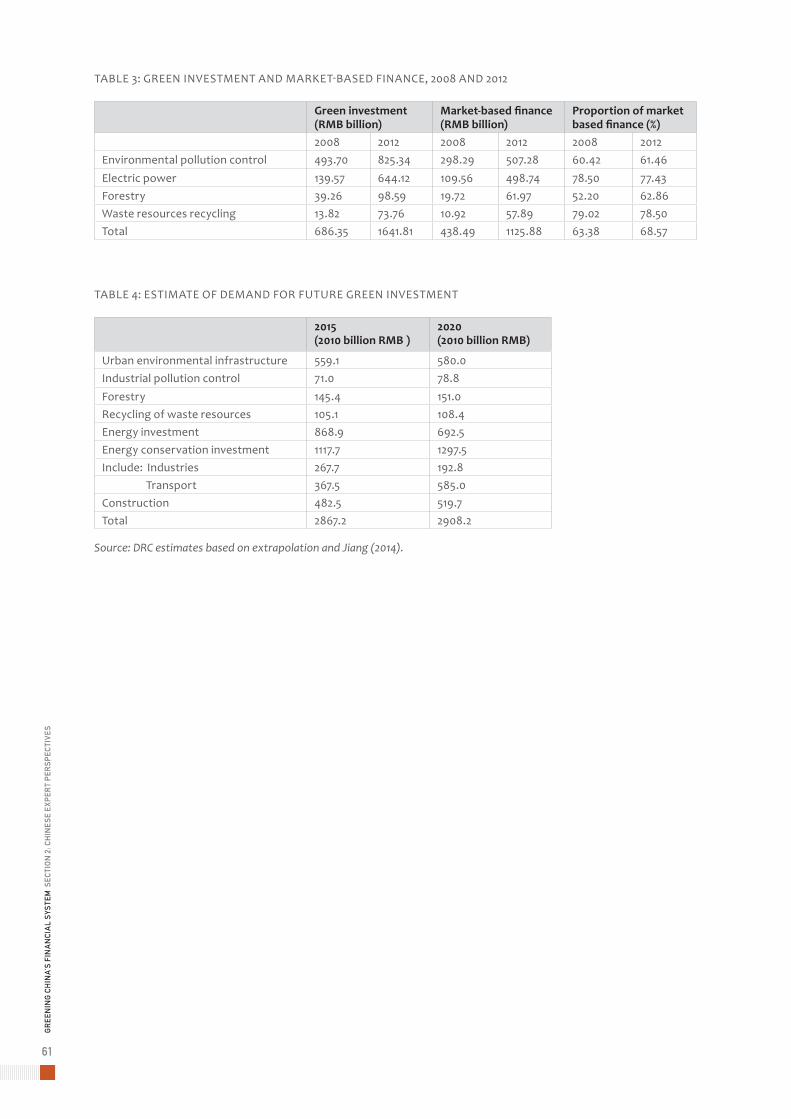
As shown in Figure 4, and in Table 3 in the Appendix, overall we estimate that market-based financing mobilized RMB 438 billion of green investment (USD 70 billion) in 2008 (67 per cent of the total), rising to RMB 1,126 billion (USD 180 billion) in 2012 (70 per cent of the total).3
FIGURE 4: OVERALL VOLUMES OF MARKET-BASED FUNDING
As shown in Figure 5, market-based financing provided the greatest proportion of investment in each sector; ranging from 78 per cent in renewable power projects to 61 per cent in environment protection.
FIGURE 5: MARKET-BASED AND NON-MARKET-BASED FINANCING BY GREEN INVESTMENT SECTOR
3 Market-based financing covers loans, bonds and equity investment sourced from financial institutions and through capital markets, and from other private sources. Within the existing statistical categories, these are mainly captured as data on domestic loans, foreign investment, self-raised funds and others. The Notice of the State Council on Adjusting the Capital Ratios for Fixed Asset Investment Projects sets minimum ratios for self-owned versus externally raised funds for different sectors ranging from 40 per cent for iron and steel; 35 per cent for cement projects; 30 per cent for coal, airports, ports, coastal and inland water transport projects; 25 per cent for railway, expressway, urban rail transit; 20 per cent for housing and regular commercial residence projects; and 20per cent for other projects. For simplicity we use 20 per cent as an estimate for self-owned capital across all sectors.

51
GREE
NIN
G CH
INA’
S FI
NAN
CIAL
SYS
TEM SE
CTIO
N 2:
CHI
NES
E EX
PERT
PER
SPEC
TIVE
S
2FUTURE DEMAND FOR GREEN INVESTMENT 2.1 POLICY TARGETS OF CHINA’S GREEN DEVELOPMENT
The green development aspirations of China’s government are reflected in commitments and goals at various levels.
¥ Strategic resolutions by the Chinese Communist Party (CPC) without specific targets. The Eighteenth National Congress of the CPC resolved that: “we must raise our ecological awareness of the need to respect, accommodate to and protect nature. We must give high priority to making ecological progress and incorporate it into all aspects and the whole process of advancing economic, political, cultural, and social progress, work hard to build a beautiful country, and achieve lasting and sustainable development of the Chinese nation” (Hu, 2012).
¥ High-level targets set within the national Five-Year Plans. The 12th Five-Year Plan (2009–2015) includes targets to increase the share of non-fossil fuel resources to 11.4 per cent of primary energy consumption; reduce energy consumption per unit of GDP by 16 per cent and carbon dioxide emissions per unit of GDP by 17 per cent; reduce chemical oxygen demand (COD) and sulphur dioxide emission by 8 per cent; and reduce both ammonia nitrogen and nitrogen oxide emissions by 10 per cent. The forestry target is to increase forested areas by 600 million cubic metres, reaching a coverage rate of 21.66 per cent. Further targets on solid waste utilization, air quality, urban noise and sewage treatment were also set (National People’s Congress, 2011) .
¥ Technical targets in the specific development plans formulated for the implementation of the Five-Year Plan. Relevant plans include the 12th Five-Year Plan for Environmental Protection Work Plan for Greenhouse Gas Emission Control, Guiding Opinion of Resource Comprehensive Utilization during the 12th Five-Year Plan Period, National Implementation Plan for Clean Energy Initiative and other plans, all of which have specific targets.
¥ Commitments made to the international community, mainly including the carbon dioxide emission target set in 2009 at the United Nations Climate Change Conference in Copenhagen (National Development and Reform Commission, 2013). This commitment has been integrated into the National Climate Change Plan (2014–2020) recently approved by the State Council. It states that by 2020, effort will be made to reduce carbon dioxide emissions per unit of GDP by 40–45 per cent compared to that of 2005, increase the ratio of non-fossil fuel energy in primary energy consumption to about 15 per cent, and increase the forest area and national forest stocks by 40 million hectares and 1.3 billion cubic metres respectively compared with 2005 (State Council, 2014a).
For accuracy of analysis, the specific development targets are more reliable, but for the purpose of generating an estimate of the general scale of demand for green investment, the high-level targets are mainly used in this analysis.
2.2 EVOLUTION OF CHINA’S GREEN DEVELOPMENT POLICIES
China’s green development policies have tended to have the following characteristics.
1. The pursuit of green and ecological development is gradually becoming one of the core themes for China’s development. This is reflected in its progression from a technical sub-component of previous Five-Year Plans, to the development of a comprehensive environmental protection system, to high-level targets on ecological improvement being placed at the forefront of the most recent Five-Year Plan.
2. The scope of green targets has grown, reflecting shifting domestic concerns as well as international responsibilities and obligations. China’s green development targets have developed from the simple concept of pollution control to broader environmental protection and to the joint

52
CHAP
TER
2: D
EMAN
D FO
R GR
EEN
FIN
ANCE
efforts to deal with global climate change. The scope and influence of the targets has expanded along with a deepened understanding of environmental issues on one hand and international engagement on the other.
3. The development targets based on each five-year period are important binding developments. We can clearly see that China’s green development targets, up to now, are broken down and implemented by stage in five-year periods. Therefore, we believe that the development targets of the next five years shall be the more operable policy targets under the practical national conditions and the major prediction interval for the analysis of this report.
2.3 FUTURE REQUIREMENTS FOR GREEN INVESTMENT
We conducted an analysis of progress towards China’s green policy targets, as outlined in Table 2.
TABLE 2: CHINA’S GREEN DEVELOPMENT TARGETS AND PROGRESS
Area Actual values Targets
State budget 2005 2010 2012 2015 (over 2010) 2020 (over 2005)
Carbon dioxide emissions (billion tonnes)1
5.51 7.00 7.95 Emissions per CNY 10,000 of GDP shall decrease by 17%
Emissions per CNY 10,000 of GDP shall decrease by 40–45%Emissions (Kg/CNY
10,000 of GDP)0.30 0.18 0.15
Proportion of non-fossil energy consumption2
2.50% 3.50% 3.90% 11.40% 15%
Forest area3 Na na 195.45 million hectares (20.36%)
21.66% Additional 40 million (hectare)
State forest stocks Na na 13.72 billion cubic meters
Increase by 600 million cubic metres
Increase by 1.3 billion cubic metres
Recycling rate of solid industrial wastes4
57% 67% 61% 72% tbd
Treatment rate of urban sewage5
56% (2006) 82% na 85% tbd
Municipal solid waste harmless treatment rate6
52% 78% 84% 80% tbd
Expected to exceed Target Expected to meet target
(1) Carbon dioxide emissions are estimated according to the consumption of coal, petroleum and natural gas; using the General Principles for Calculation of Total Production Energy Consumption (GB/T 2589-2008) and the Guidelines for Preparation of Provincial-level Greenhouse Gas Inventories (F.G.B.Q.H. [2011] No.1041); energy data come from China Energy Yearbook and GDP from China Statistics Press (2014).
(2) Non-fossil energy mainly includes hydropower, nuclear power and other sources of power; data are taken from China Energy Statistical Yearbook 2013 (China Statistics Press, 2014).
(3) Data of forest area and coverage rate are up to 2008. Data are taken from China Statistics Press (2014).
(4) Recycling rate of solid industrial wastes is calculated based on the data of the CEIC database.
(5) Treatment rate of urban sewage is quoted from the Report on Drainage and Waste Water Treatment in China’s Urban Areas (2006-2010). See the Ministry of Housing and Urban-Rural Development’s website for the Chinese version of this report: www.mohurd.gov.cn
(6) Municipal solid waste harmless treatment rate is taken from the CEIC database.

53
GREE
NIN
G CH
INA’
S FI
NAN
CIAL
SYS
TEM SE
CTIO
N 2:
CHI
NES
E EX
PERT
PER
SPEC
TIVE
S
Based on this we made qualitative predictions of future trends, finding that:
1. Current low-carbon policy targets are readily achievable, but further efforts will be needed if more ambitious targets are agreed. The current targets for the GHG emissions intensity of the economy can be accomplished based on the existing energy structure, energy technologies and energy consumption efficiency. It is likely that these targets can be accomplished, but further efforts might be needed for more ambitious targets to keep the global temperature increase at less than two degrees Celsius.
2. Renewable energy will be a major policy focus of China’s future low-carbon and green development. To reduce fossil fuel use, key investments are likely to be in nuclear, hydro, wind and solar energy. Although there is significant uncertainty, it is likely that the growth rate of investment in the non-thermal power in the 13th Five-Year Plan shall at least exceed the average growth rate of the 12th Five-Year Plan period.
3. There is a substantial likelihood of accomplishing the targets of forestry development and there is not much space to set higher or novel targets in the future. Starting from 2005, China’s newly added forest land has been growing by 4,924 thousand hectares annually; since 2010 it has grown by over 5,500 hectares annually. With such a growth rate, it is anticipated that the forestry targets for 2015 and 2020 will be achieved. The 13th Five-Year Plan might not raise higher development targets because of a lack of further areas suitable for forest development. Maintaining the existing forest with slow-level growth is the expected reasonable target. However, the total investment in forestry will not see a high growth rate.
4. The planned targets for the recycling of solid industrial wastes and resources are expected, but more development targets will focus on the treatment and control of other industrial discharges and emissions in the future. Recycling of metal, paper and plastics are well developed, and we believe the recycling of solid wastes will maintain the current trend of development, without seeing higher targets. There is greater pressure for the control and treatment of other industrial discharges. With the implementation of more stringent laws on environmental protection, stronger targets might be raised during the 13th Five-Year Plan period, and there will be greater demands for the investment in the corresponding control and treatment of pollution discharge.
5. The development targets on the treatment of urban sewage and wastes have been accomplished, but the development of the urban environmental infrastructure will be further enhanced with the progress of urbanization. The targets in the national urban sewage and waste treatment plans have been largely accomplished. It is predicted that, with the continued growth in urbanization, demand and investment will continue to grow. There are also great differences in the treatment of urban sewage and domestic refuse in different areas, and significant investment will be needed to improve underdeveloped areas.
In addition to the these areas, which were already explicitly listed as the targets of national policy development, China is also likely to continue to promote the development of such fields as green buildings, electric vehicles and urban rail transit. Therefore, the investment requirements for China’s green development in the future is likely to extend into broader fields.
TABLE 3: ANALYSIS OF THE FACTORS INFLUENCING CHINA’S GREEN INVESTMENT, 2015–2020
Green investment area Prediction
Pollution control Urban environmental infrastructure StableIndustrial pollution control Enhanced
Electric power
Nuclear power EnhancedHydropower StableSolar power StablePower of other sources Stable
Forestry StableWaste recycling EnhancedGreen building EnhancedElectric vehicles StableUrban rail transit Stable

54
CHAP
TER
2: D
EMAN
D FO
R GR
EEN
FIN
ANCE
2.4 ESTIMATES ON GROWTH OF GREEN INVESTMENT DEMAND
We extrapolated current trends to estimate investment in urban environmental infrastructure, industrial pollution control, forestry and recycling of waste resources, while at the same time considering possible factors that might change the trend. The main modifications to the extrapolation were in industrial pollution control and urban environmental infrastructure. For low-carbon investments (renewable energy and energy conservation investment in electric vehicles, rail transit and green buildings), we based demand estimates on the low-carbon scenario developed by the Energy Research Institute, National Development and Research Commission of China (Jiang, 2013).
Overall, we estimate China’s green investment demand in 2015 at RMB 2,867 billion (USD 450 billion), growing to RMB 2,908 billion (USD 465) by 2020 (see Figure 6 below and Table 4 in the appendix).4 Although the annual growth rate is not large, the average size of the annual investment is high, exceeding 3 per cent of GDP.
FIGURE 6: PREDICTED DEMAND FOR GREEN INVESTMENT
These estimates should be regarded as somewhat conservative and can be taken as the minimum investment demand.
The slowdown of China’s GDP growth rate and reforms to local government debt financing are putting pressure on the availability of fiscal funds for infrastructure development (State Council, 2014b). While government funding is not likely to increase, green investment and infrastructure will remain a key focus for the provision for “special debts” of local governments. Therefore, we estimate that the overall drop in public funding will not be large. We assume that the proportion of investment provided by public budgets shall remain at the average of 10 per cent of the total as in 2012.
4 There might be some double counting between investment for energy conservation investment and industrial pollution.
55
GREE
NIN
G CH
INA’
S FI
NAN
CIAL
SYS
TEM SE
CTIO
N 2:
CHI
NES
E EX
PERT
PER
SPEC
TIVE
S
Based on this and assuming that self-owned capital will continue to provide 20 per cent, we estimate that around RMB 2,007 billion (USD 320 billion) of market-based green finance is needed in 2015, rising to RMB 2,036 billion (USD 326 billion) by 2020.
Within this, the proportions of market-based financing of different types of green investments are different. One of our basic assumptions is that, as for all the fields with high proportions of state budgetary funds currently, when the budgetary funds drop, they will be replaced with market-based financing.

56
CHAP
TER
2: D
EMAN
D FO
R GR
EEN
FIN
ANCE
3INSTITUTIONAL CONSTRAINTS AND DIRECTION OF IMPROVEMENT IN GREEN INVESTMENT AND FINANCING 3.1 INSTITUTIONAL CONSTRAINTS
The largest portion of market-based financing to date comes through commercial loans. This is reflected both in the “loans” category, and also we believe through the “self-raised funds,” since in practice a substantial part of self-raised funds, excluding the project capital fund involved, are obtained through bank loans.5
Therefore, as a whole, self-raised finance, commercial loans and state budgetary funds are currently the most important financing channels. Other market-based financing channels such as bonds and equity markets are less well developed.
Compared with the demands for green investment and financing, we believe the existing financial infrastructure is inadequate. For example, in relation to the construction of urban environmental infrastructure, urban sewage treatment facilities and pipelines have reached a very high coverage, but the operation and utilization rates of the treatment facilities are quite low. One of the reasons for this is that during the 11th and 12th Five-Year Plan periods, central government promoted their development through its economic stimulus plan. However, due to the various institutional issues related to the operation, management and maintenance expenditures, local governments have not been using the facilities they constructed to their full capacity. An important reason for this is that the cash flow generated by these facilities is relatively low and cannot fully cover their operation costs, so that fiscal subsidies must be provided to keep the discharges and emissions to national and local standards.
Although commercial loans contribute a large share of green investment, it is noteworthy that most of the users are state-owned enterprises or investment or financing companies that are backed by additional capital from the state budget. These commercial loans always carry with them high financial risks. Though most of these investments will generate environmental benefits and make major contributions to the achievement of green development targets, the debt-paying capacity of these investment projects are always connected to the fiscal capacity of the local governments of the place where the projects are located. The most developed areas, therefore, have a relatively higher proportion of debt financing than the areas with underdeveloped economies, but they have the approximately same possibility of the breakout of debt risks caused by the fiscal capacity of the local governments.
Given existing technological and market conditions, green investments tend to have large up-front investment needs and low cash flow. Investment by governments, especially of the local governments, therefore, plays an important role. The existing structure of investment and financing subjects is the second-best choice for the current fiscal system, especially the fiscal system of local governments. Local governments therefore operate with institutional restrictions that conflict with their need to finance green investment. Therefore, further institutional innovation is needed to balance the risks and stimulate green development institutionally.
5 We compared the loans issued in the current years published by the People’s Bank of China in the past and the banking loans recorded in the fixed assets of the corresponding year and found that during the period from 2006 to 2008, the former was about 1.4 larger. It can be concluded that significant bank loans are recorded as “self-raised” funding, a substantial part of which were the loans obtained through the fiscal credit of the local governments, with some funds directly falling under fiscal funds. The major subjects realizing such financing are the financing platform companies of the local governments.

57
GREE
NIN
G CH
INA’
S FI
NAN
CIAL
SYS
TEM SE
CTIO
N 2:
CHI
NES
E EX
PERT
PER
SPEC
TIVE
S
3.2 DIRECTION FOR INSTITUTIONAL IMPROVEMENT OF SUPPLY OF GREEN FINANCE
Overall, the supply of finance through dependence on commercial loans and fiscal funds does not adequately meet the investment needs for green development, and more diversified market-based financing will be needed to meet the targets.
As can be seen in Figure 1, in the practice of China’s green investment, the scale of investment in urban environmental infrastructure is significantly higher than in industrial pollution control. State-owned enterprises are the major users of capital in this sector. Fiscal credit plays a key role in their investment and financing activities.
The majority of users of capital for industrial pollution control are non-state-owned enterprises. However, according to the official statistics, a high proportion of the funds for industrial pollution control come from public funds, given as direct investment or another subsidy, to support and encourage the enterprises’ treatment of pollution. Moreover, even banking loans in the investment and financing for the industrial pollution control are often entitled to preferential policies backed by governmental credit.
In other words, although market-based pricing appears to contribute a large proportion of green investment, little in the areas of urban environmental infrastructure and industrial pollution control is purely market-driven.
It is clear that purely market-guided green financing faces great difficulties, and the support of government-subsidized credit and other fiscal funds have been a key factor in green investment. A key driver for reform and innovation is the need to better and more efficiently use public funds, and more reliably avoid fiscal liability risks, while guiding private funds to support the development of green investments with greater efficiency.
Our basic assumption is that, while continuing to encourage and support green investment through fiscal, price and land policies, the scale of the need for green financing will overcome the capacity of government budgets. Therefore, government funding will shift from providing direct investment as a substitute for private finance to seeking to catalyze the expansion and innovation of market-based green finance.

58
CHAP
TER
2: D
EMAN
D FO
R GR
EEN
FIN
ANCE
REFERENCES
CEIC. (n.d.). China economic and industry database. Retrieved from https://www.ceicdata.com/en/countries/china
China Environment Yearbook Committee. (2001). China environment yearbook 2001. Beijing, China.
China Statistics Press. (2014). China energy statistical yearbook 2013. Beijing, China.
Hu, J. (2012). Report at the 18th Party Congress. Retrieved from http://news.xinhuanet.com/english/special/18cpcnc/2012-
11/17/c_131981259_9.htm
Jiang, K. (2013). China’s pathway to low-carbon finance. London: E3G.
Jiang, K.J. (2014). China’s pathway to low-carbon finance. Annex of E3G Report. Retrieved from http://e3g.org/docs/
Annex_A_China%E2%80%99s_Investment_Pathways_to_2030.pdf
Ministry of Housing and Urban-Rural Development. (2011). Report on drainage and waste water treatment in China’s
urban areas (2006–2010). Beijing, China.
National Bureau of Statistics of the People’s Republic of China. (2002). Fixed asset investment: Definitions. Retrieved
from http://www.stats.gov.cn/english/ClassificationsMethods/Definitions/200205/t20020517_72389.html
National Development and Reform Commission. (2013). China’s policies and actions for addressing climate change: 2013
annual report. Beijing: NDRC
National Bureau of Statistics. (2013). Statistical yearbook of investment in fixed assets. Retrieved from http://www.stats.
gov.cn/tjsj/ndsj/2013/indexeh.htm
National Bureau of Statistics of the People’s Republic of China. (2014). Statistical yearbook of investment in fixed assets.
Retrieved from http://www.stats.gov.cn/tjsj/zbjs/201310/t20131029_449538.html
National Development and Reform Committee. (2011). Guidelines for preparation of provincial-level greenhouse gas
inventories (F.G.B.Q.H. [2011]No.1041). Beijing: NDRC.
National People’s Congress. (2011). 12th Five-Year Plan for National Economic and Social Development of the People’s
Republic of China. Translation available from http://www.britishchamber.cn/content/chinas-twelfth-five-year-
plan-2011-2015-full-english-version
Standardization Administration of China. (2008). General principles for calculation of total production energy consumption
(GB/T 2589-2008). Beijing, China.
State Council. (2014b). Guiding opinions on innovating the investment and financing mechanisms in key areas and encour-
aging social investment. State Council Document [21014] No. 60. Beijing, China: State Council.
State Council. (2014a). Approval reply of the State Council on the National Climate Change Plan (2014-2020). State Council
[2014] Document No.126. Beijing, China: State Council.
Twenty Years of Environmental Protection Administration in China Committee. (1994). Twenty years of environmental
protection administration in China. Beijing, China: China Environmental Sciences Press.
Zhang, L. & Zhao, L. (2003). Historical evolution of China’s environmental protection policies from 1953–2003 (1953–
2003). Research in Chinese Economic History, 4.
59
GREE
NIN
G CH
INA’
S FI
NAN
CIAL
SYS
TEM SE
CTIO
N 2:
CHI
NES
E EX
PERT
PER
SPEC
TIVE
S
APPENDIX ATABLE 1: PROPORTIONS OF FUND SOURCES FOR GREEN INVESTMENTS, 2012
Green investment areaProportion of funding by source (%) Total
(Bn RMB)Budgetary funds
Domestic loans Bonds Foreign
investment Fundraising Other funds
Envi
ronm
enta
l pol
lutio
n co
ntro
l
Environmental pollution control 18.54 9.99 0.25 0.24 65.25 5.74
Urban appearance management 18.53 4.09 0.21 0.34 63.88 12.94
Urban environmental sanitation
28.51 7.47 0.00 0.57 56.22 7.23
Water pollution treatment 20.02 8.15 0.00 0.27 64.86 6.71
Hazardous wastes treatment 22.97 31.28 0.00 0.00 44.52 1.23
Other environmental pollution control
16.32 10.04 0.57 0.00 28.60 3.77
Urban gardening and greening management
23.68 5.00 0.00 0.14 63.11 8.06
Total 825.35
Non
-the
rmal
pow
er Hydropower 3.92 35.95 0.77 0.32 54.62 4.43Nuclear power 0.00 75.07 1.95 0.00 18.00 4.98Wind power 1.78 40.14 0.43 0.64 54.71 2.28Solar power 3.69 20.78 0.00 0.77 71.74 3.01Power of other sources 3.45 14.26 0.05 1.84 77.71 2.69
Total 644.12
Fore
stry Forestry 17.14 3.67 0.00 0.39 65.77 13.03
Total 98.59
Was
te
Waste resources recycling and processing
1.52 8.48 0.00 1.23 87.30 1.47
Total 73.76Total investment 4.74 12.83 0.28 1.12 67.17 13.87 1641.82
Source: National Bureau of Statistics (2013)
60
CHAP
TER
2: D
EMAN
D FO
R GR
EEN
FIN
ANCE
TABLE 2: PROPORTIONS OF FUND SOURCES FOR GREEN INVESTMENT, 2008 (%)
Green investment area Budgetary funds (%)
Domestic loans (%)
Bonds (%)
Foreign investment (%)
Fundraising (%)
Other funds (%)
Total (Bn RMB)
Envi
ronm
enta
l pol
lutio
n co
ntro
l
Environmental pollution control 19.58 8.72 0.04 2.01 61.93 7.72
Urban appearance management 19.46 7.35 0.00 0.26 66.10 6.84
Urban environmental sanitation
22.36 7.43 0.17 2.61 59.05 8.39
Water pollution treatment 18.85 12.10 0.00 3.90 58.02 7.12
Hazardous wastes treatment 11.78 8.24 0.00 1.27 75.90 2.80
Other environmental pollution control
19.44 6.45 0.01 0.22 64.94 8.94
Urban gardening and greening management
16.26 10.92 0.00 0.02 66.01 6.79
Total 493.70
Non
-the
rmal
pow
er Hydropower Nuclear powerWind power - - - - - - -Solar power - - - - - - -Power of other sources Total 139.57*
Fore
stry Forestry 27.80 3.06 0.13 1.53 50.84 16.65
Total 39.26
Was
te
Waste resources recycling and processing
0.98 3.31 0.03 3.02 88.31 4.34
Total 13.83Total investment 4.65 16.06 0.41 2.96 61.70 14.21 686.36
Source: National Bureau of Statistics (2013)
NB: The National Bureau of Statistics started to provide statistics on investment in wind and solar power in 2012, therefore statistics on energy investment are not included here.
61
GREE
NIN
G CH
INA’
S FI
NAN
CIAL
SYS
TEM SE
CTIO
N 2:
CHI
NES
E EX
PERT
PER
SPEC
TIVE
S
TABLE 3: GREEN INVESTMENT AND MARKET-BASED FINANCE, 2008 AND 2012
Green investment (RMB billion)
Market-based finance (RMB billion)
Proportion of market based finance (%)
2008 2012 2008 2012 2008 2012 Environmental pollution control 493.70 825.34 298.29 507.28 60.42 61.46Electric power 139.57 644.12 109.56 498.74 78.50 77.43Forestry 39.26 98.59 19.72 61.97 52.20 62.86Waste resources recycling 13.82 73.76 10.92 57.89 79.02 78.50Total 686.35 1641.81 438.49 1125.88 63.38 68.57
TABLE 4: ESTIMATE OF DEMAND FOR FUTURE GREEN INVESTMENT
2015 (2010 billion RMB )
2020 (2010 billion RMB)
Urban environmental infrastructure 559.1 580.0Industrial pollution control 71.0 78.8 Forestry 145.4 151.0 Recycling of waste resources 105.1 108.4Energy investment 868.9 692.5Energy conservation investment 1117.7 1297.5Include: Industries 267.7 192.8 Transport 367.5 585.0Construction 482.5 519.7Total 2867.2 2908.2
Source: DRC estimates based on extrapolation and Jiang (2014).