demand and supply of wood in kerala and their future …docs.kfri.res.in/kfri-rr/kfri-rr067.pdf ·...
TRANSCRIPT
KFRI Research Report 6 7
DEMAND AND SUPPLY OF WOOD IN KERALA
AND THEIR FUTURE TRENDS
C.N.Krishnankutty
KERALA FOREST RESEARCH INSTITUTE PEECHI, THRISSUR
September 1990 Pages: 66

CONTENTS
Page File
Abstract ix r.67.2
1 Introduction 1 r.67.3
2 Profile of Kerala 2 r.67.4
3 Methodology and database 6 r.67.5
4 Demand, supply and wood-balance 16 r.67.6
5 Distribution of growing stock of trees in homesteads
25
r.67.7
6 Future trends in the demand and supply of wood
29
r.67.8
7 Conclusions 37 r.67.9
8 References 39 r.67.10
9 Appendices 42 r.67.11
ABSTRACT
This study is an attempt to estimate the demand for wood by various sectors and supply from different sources in Kerala during the year 1987-88. Wood includes timber, industrial wood poles, fuelwood and charcoal. Demand for wood is defined as the effective demand which is domestic consumption plus exports. Production of wood and imports constitute supply. Inventory of wood is not estimated but is considered to be in dynamic equilibrium over time. Demand and supply are therefore equal at any point of time. Future trends in the demand and supply of wood up to the year 2004-05 are projected based on certain as sumptions. Pattern of growing stock distribution of trees in homesteads is also analyzed to estimate the stock and to understand the species preference. Supply of wood is from homesteads, estates and forests, and by imports. Demand for wood is by households, industries and tertiary sectors, and for export. Field surveys were carried out for estimating the quantity of wood used by households in rural areas for construction, furniture, etc., by small industries as timber, fuelwood and charcoal, by households in urban areas, tea- shops, restaurants, hostels, etc. as fuel; as well as for estimating the growing stock of trees in homesteads. Relevant registers, files and publications of various government depart ments were used as sources for other data. The study reveals that the effective demand for wood during the year 1987-88 was 14.645 million m3 round wood equivalent, of which household demand for wood as fuel and timber accounted for 50 percent. Demand for wood from the tertiary sector as fuel in tea-shops, restaurants, hostels, etc. and as timber and poles in non-residential building and other constructions constituted 28.3 percent. Fuel and industrial wood used in the industries sector accounted for 21.2 percent of the total demand and export only 0.5 percent. Wood as fuel constituted 83 percent of the total demand. Timber, industrial wood and poles accounted for only 17 percent of the total. In spite of the difficulties in estimating the contribution of different sources of supply, the share of each source is given in a range. Homesteads contributed 74.4 to 83.6 percent, estates 9.3 to 11.8 percent and imports 2.4 percent of the total supply of wood. Natural forests and plantations are estimated to contribute 4.7 to 11.4 percent, although the recorded production of wood from forests is only 1.9 percent of the total supply. Total number of trees in homesteads of Kerala during 1988-89 is estimated as 442 million. It includes coconut but excludes trees in plantations and other palms. Trees in the lowest diameter class account for 55 percent of the total number which shows that efforts are being made by households in planting trees. The study reveals that multiple-use trees such as coconut, jack, mango, cashew, tamarind, etc. are preferred for planting and maintaining in homesteads. Anjily, teak and matty are the species preferred among trees grown exclusively for wood. Projections for the future indicate that the likely supply-demand disparity can be neutralized by increasing efficiency in fuelwood-use, reducing consumption of wood by substitution and economising timber-use in construction. Over-exploitation of wood-resources and increasing imports can also augment supply of wood in the short run.

Comprehensive and reliable data base on the demand and supply of wood is essential for formulating programmes in production and social forestry. Although it is generally believed that wood, whatever be the quantity produced, is bound to be absorbed in the market, for long-term planning, broad magnitudes of supply and demand are necessary. The real prices of most construction timbers in Kerala have registered a phenomenal increase, particularly after 1976-77. The increase in demand for timber both from within and outside the State and a reduction in supply of timber from the forests of Kerala have cumulatively contributed to the rapid increase in price (Krishnankutty et al., 1985). A preliminary assessment of con- sumption of wood in Kerala for the year 1981-82 w a s made by Muraleedharan et al.. (1984 mimeo) using secondary data. I t is necessary to identify the demand and supply situation in different districts of Kerala so tha t afforestation programmes can be directed towards solving problems in critical areas. The present study on 'Demand and supply of wood in Kerala and their future trends' w a s taken up in this context.
1.1 Objectives
The objectives of the present study are (1) to estimate the demand for wood by various sectors and supply from different sources in Kerala during the year 1987-88 and to examine their future trends and (2) to analyse the pattern of growing stock distribution of trees in homesteads and to identify the species preference and potential for the future.
1.2 Plan of the Report
The report is presented in seven sections. Section 2 gives a profile of Kerala and the need for the present study. Methodology and sources of data for the estimation of demand and supply of wood in Kerala and growing stock of trees in homesteads are discussed in section 3. Demand, supply and wood-balance are dealt with in the fourth section. Growing stock and species preference in homesteads are analysed in the fifth section. Future trends in the demand and supply of wood in Kerala are examined in section 6. Conclusions emerging from the study are given in the last section.
2
Kerala State is si tuated on the South Western part of India. The geographical area of the Sta te is 38,855 km*, of which about 10 per cent comes under lowland region, 42 per cent under midland region and the remaining under highland region (State Land Use Board, 1980)1. Kerala has an equable climate and t h e day temperature varies from 20 to 3 5 o C . The mean annual rainfall is about 3,000 mm.
2.1 Socio-economic Conditions
Kerala is the most densely populated State in India. The population density of t he State and the Country were 655 and 216 persons per km2 respectively according to 1981 Census (Government of India, 1984). The population of Kerala in 1961 was 16.91 million arid this increased to 21.38 million in 1971 and to 25.45 millton in 1981. The compound growth ra tes during 1961-71 and 1971-81 are 2.4 and 1.8 per cent per annum respectively. The population growth ra te during 1981-91 and thereafter is expected to decline. The projected population during 1987-88 was 28.58 million (Department of Economics and Statistics, 1988a).
The net S ta te domestic product in 1987-88 was Rs.74,263 million at current prices and the per capita income was Rs.2598 (State Planning Board, 1989). The contribution of forestry and logging to the net S ta te domestic product at 1970-71 prices has declined from 1.96 per cent in 1980-81 to 0.21 per cent in 1986-87(Department of Economics & Statistics,l988a).
2.2 Agricultural Land-Use
Of the total geographical area of the State 56.8 per cent was used for agricultural purposes durlng 1986-87. Coconut accounts for 32 per cent of the net cultivated area, rubber 16 per cent, tea, coffee and cardamom 7 per cent and rice 14 per cent (Department of Economics and Statistics, 1988a). Mixed cropping is a characteristic feature of land-use in Kerala which integrates agricultural crops with several perennial tree crops.
2.3 Forest Resources
Forests in Kerala are under public ownership and cover an area of 11225 km2 (Kerala Forest Department, 1987-88). The district-wise break up of area under forests by legal status for t he year 1987-88 is given in Appendix-1. A l l t he districts except Alappuzha have forests. The effective forest area in Kerala and the growing stock of wood in the forests have been estimated as 9400 kmo and 185 million m3 underbark respectively in t h e year 1970 (Chandrasekharan,l973).
~The lowland and midland and highland regions are the three broad natural regoins based on altitude. Tbe land lying below 7.6 m elevation is lowland, between 7.6 to 76 m midland and above 76 m highland.
3
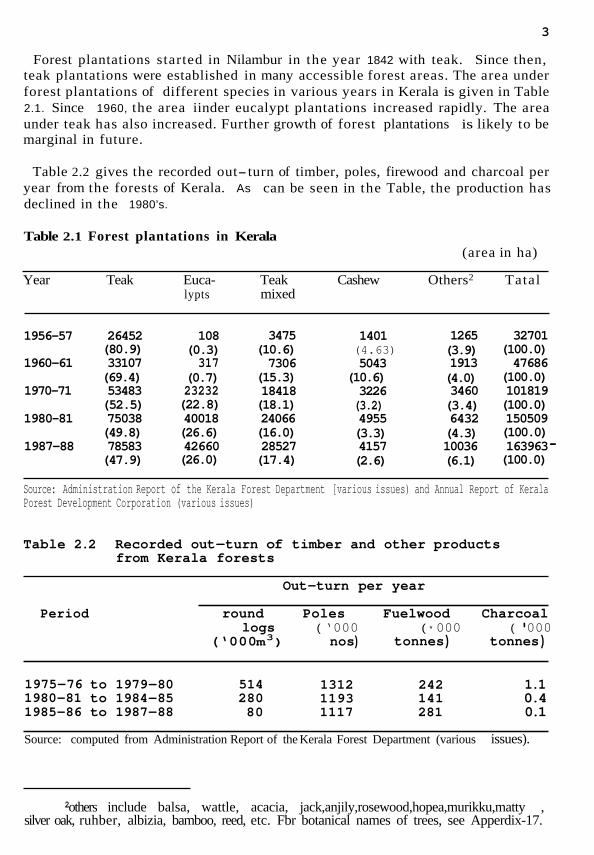
Forest plantations started in Nilambur in the year 1842 with teak. Since then, teak plantations were established in many accessible forest areas. The area under forest plantations of different species in various years in Kerala is given in Table 2.1. Since 1960, the area iinder eucalypt plantations increased rapidly. The area under teak has also increased. Further growth of forest plantations is likely to be marginal in future.
Table 2.2 gives the recorded out-turn of timber, poles, firewood and charcoal per year from the forests of Kerala. As can be seen in the Table, the production has declined in the 1980’s.
Table 2.1 Forest plantations in Kerala (area in ha)
Year Teak Euca- Teak Cashew Others2 Tatal lypts mixed
1956-57 26452 (80.9)
1960-61 33107 (69.4)
1970-71 53483 (52.5)
1980-81 75038 (49.8)
1987-88 78583 (47.9)
108 (0.3) 317
(0.7) 23232 (22.8) 40018 (26.6) 42660 (26.0)
3475 (10.6) 7306
(15.3) 18418 (18.1) 24066 (16.0) 28527 (17.4)
1401 (4.63) 5043
(10.6) 3226 (3.2) 4955 (3.3) 4157 (2.6)
1265 (3.9) 1913 (4.0) 3460 (3.4) 6432 (4.3) 10036 (6.1)
32701 (100.0) 47686
(100.0) 101819 (100.0) 150509 (100.0) 163963 - (100.0)
Source: Administration Report of the Kerala Forest Department [various issues) and Annual Report of Kerala Porest Development Corporation (various issues)
Table 2.2 Recorded out-turn of timber and other products from Kerala forests
Period
Out-turn per year
round Poles Fuelwood Charcoal
(‘000 m3) nos) tonnes ) tonnes )logs ( ‘000 ( * 000 ( ‘000
1975-76 to 1979-80 514 1312 242 1.1 1980-81 to 1984-85 280 1193 141 0.4 1985-86 to 1987-88 80 1117 281 0.1
Source: computed from Administration Report of the Kerala Forest Department (various issues).
2others include balsa, wattle, acacia, jack,anjily,rosewood,hopea,murikku,matty , silver oak, ruhber, albizia, bamboo, reed, etc. Fbr botanical names of trees, see Apperdix-17.
4
2.4 Social Forestry in Kerala
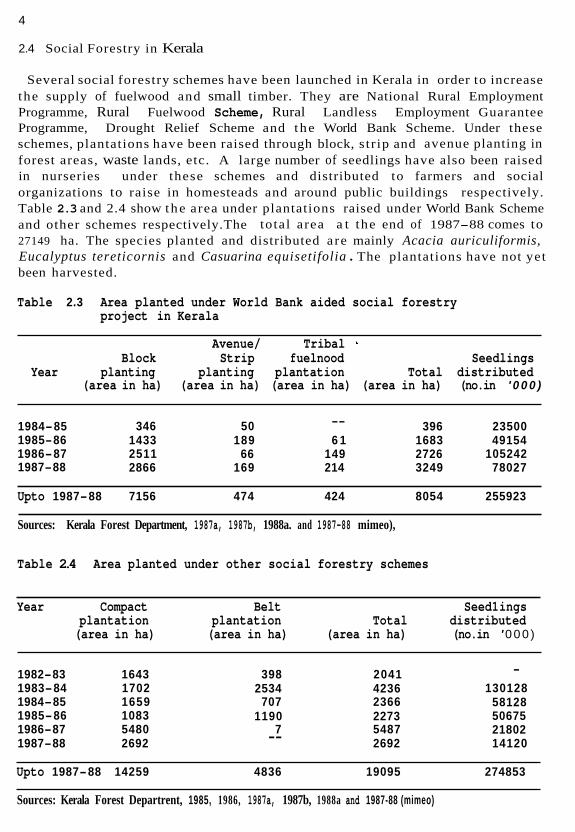
Several social forestry schemes have been launched in Kerala in order to increase the supply of fuelwood and small timber. They are National Rural Employment Programme, Rural Fuelwood Scheme, Rural Landless Employment Guarantee Programme, Drought Relief Scheme and the World Bank Scheme. Under these schemes, plantations have been raised through block, s tr ip and avenue planting in forest areas, waste lands, etc. A large number of seedlings have also been raised in nurseries under these schemes and distributed to farmers and social organizations to raise in homesteads and around public buildings respectively. Table 2.3 and 2.4 show the area under plantations raised under World Bank Scheme and other schemes respectively.The total area a t the end of 1987-88 comes to 27149 ha. The species planted and distributed are mainly Acacia auriculiformis, Eucalyptus tereticornis and Casuarina equisetifolia . The plantations have not yet been harvested.
Table 2.3 Area planted under World Bank aided social forestry project in Kerala
Avenue/ Tribal Block Strip f uelnood Seedlings
Year planting planting plantation Total distributed (area in ha) (area in ha) (area in ha) (area in ha) (no.in ' 0 0 0 )
1984-85 346 50 396 23500 1985-86 1433 189 6 1 1683 49154 1986-87 2511 66 149 2726 105242 1987-88 2866 169 214 3249 78027
--
Upto 1987-88 7156 474 424 8054 255923
Sources: Kerala Forest Department, 1987a, 1987b, 1988a. and 1987-88 mimeo),
Table 2.4 Area planted under other social forestry schemes
Year Compact Belt Seed1 ings plantation plantation Total distributed (area in ha) (area in ha) (area in ha) (no.in '0 0 0 )
1982-83 1643 1983-84 1702 1984-85 1659 1985-86 1083 1986-87 5480 1987-88 2692
398 2041 2534 4236
707 2366 1190 2273
7 5487 2692 --
- 130128
58128 50675 21802 14120
Upto 1987-88 14259 4836 19095 274853
Sources: Kerala Forest Departrent, 1985, 1986, 1987a, 1987b, 1988a and 1987-88 (mimeo)

5
2.6 Wood-Based Industries
There are many wood-based industries in Kerala. A t the end of 1987, there were 2916 registered industrial units which include saw mills and units which produce plywood, splints and veneers, furniture and fixtures, packing case, pulp and paper, etc. (Department of Factories and Boilers, Thiruvananthapuram). Several large and small industrial units use wood as fuel. Besides, there are a large number of small scale units including household enterprises using wood as timber and fuel. Most of the wood-based and fuel-using industries depend on wood from homesteads and estates.
2.6 Need for the Present Study
The pattern of wood consumption by various sectors and the contribution of different sources of supply in Kerala have not been studied so far. Supply of wood from the forests of Kerala has declined during the 1980s. Homesteads appear to be an important source of wood supply,but the available data on land use do not reveal the composition of tree crops and the growing stock distribution in homesteads. In this context, the present study on 'Demand and supply of wood in Kerala and their future trends' is of great relevance in planning wood-resource development in the state.
6
3. METHODOLOGY AND DATA BASE
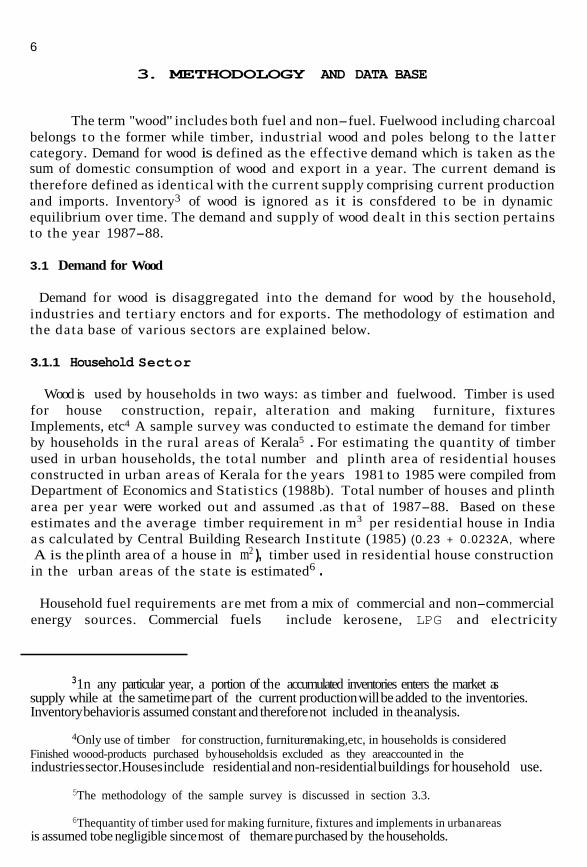
The term "wood" includes both fuel and non-fuel. Fuelwood including charcoal belongs to the former while timber, industrial wood and poles belong to the lat ter category. Demand for wood is defined as the effective demand which is taken as the sum of domestic consumption of wood and export in a year. The current demand is therefore defined as identical with the current supply comprising current production and imports. Inventory3 of wood is ignored as it is consfdered to be in dynamic equilibrium over time. The demand and supply of wood dealt in this section pertains to the year 1987-88.
3.1 Demand for Wood
Demand for wood is disaggregated into the demand for wood by the household, industries and tertiary enctors and for exports. The methodology of estimation and the data base of various sectors are explained below.
3.1.1 Household Sector
Wood is used by households in two ways: as timber and fuelwood. Timber is used for house construction, repair, alteration and making furniture, fixtures Implements, etc4 A sample survey was conducted to estimate the demand for timberby households in the rural areas of Kerala5 . For estimating the quantity of timber used in urban households, the total number and plinth area of residential houses constructed in urban areas of Kerala for the years 1981 to 1985 were compiled from Department of Economics and Statistics (1988b). Total number of houses and plinth area per year were worked out and assumed .as that of 1987-88. Based on these estimates and the average timber requirement in m3 per residential house in India as calculated by Central Building Research Institute (1985) (0.23 + 0.0232A, where A is the plinth area of a house in m2 ), timber used in residential house construction in the urban areas of the state is estimated6 .
Household fuel requirements are met from a mix of commercial and non-commercial energy sources. Commercial fuels include kerosene, LPG and electricity
31n any particular year, a portion of the accumulated inventories enters the market as supply while at the same time part of the current production will be added to the inventories. Inventory behavior is assumed constant and therefore not included in the analysis.
4Only use of timber for construction, furniture making,etc, in households is considered Finished woood-products purchased by households is excluded as they are accounted in the industries sector.Houses include residential and non-residential buildings for household use.
5The methodology of the sample survey is discussed in section 3.3.
6Thequantity of timber used for making furniture, fixtures and implements in urban areas is assumed to be negligible since most of them are purchased by the households.

7
Non-commercial fuels are fuelwood and crop residues7. However, fuelwood can be both commercial and non-commercial depending on the source of supply. Therefore fuelwood is considered as semi-commercial. Fuel-use depends mainly on size and the socio-economic s t a tus of the household. Availability of fuelwood also significantly influences i t s consumption. Measurement of fuel-use involving a large sample of households is quite problematic and 'recall method' is unreliable when non-standardized fuels from non-commercial sources predominate. Studies on household fuel use in Kerala have been done by Thampi (1983), Sta te Planning Board (1986) and ANERT (1987). Among these, only Thampi has actually measured the quantity of fuel used, based on a survey in three villages. The other studies have adopted the recall method. The State Planning Board's s tudy which is based on a survey in 50 sample villages in 8 districts has been used t o estimate the per capita fuelwood and non-wood biomass fuel consumption by households in the rural areas of Kerala, primarily due to the wider coverage.The fuelwood consumption in Kerala during 1987-88 is estimated based on the per capita fuelwood consump- tion and the estimated rural population of Kerala in 1987-88. For estimating the per capita fuelwood consumption by urban households, one cluster, consisting of 150 households, each was selected from four municipal areas and one town village in Thrissur District and surveyed (see Appendix- 15). The per capita fuelwood consumption estimated for households in the urban areas of Thrissur District is assumed to hold good in other districts also. Fuelwood consumption by households in the urban areas is estimated based on the per capita fuelwood consumption and the estimated urban population in 1987-88.
3.1.2 Industries Sector
Industries sector consists of all industries which use wood as raw material and or as fuel8. Industries such as packing case, plywood, match, furniture, pencil, photo frames. boat making, handicrafts, pulp and paper, etc. use wood as raw material. Industries like tile-manufacturing, brick-making, tea-processing, automobile workshops, metal industries, textile mills, production of hand tools, rubber goods etc., consume wood and or charcoal as fuel. Industries sector is comprised of two broad groups: organized and unorganized sectors. All ind ustrial units registered under sections 2(m) and 85 of the Factories Act are included in the organized sectors. The unorganized sector consists of u n i t s registered as
7 Fuelwood includes chopped woood, lopping of trees, off-cuts, saw-dust, industrial wood- waste, etc. Crop residues include dryleaves and palm by-products such as coconut leaf, sheath, husk, shell, etc.
8 In this study, wood processd in saw mills has been accounted in their finished state in huilding construction, furniture, fixtures, etc. Therefore, in order to avoid double counting, wood used by saw milling industry has not been separately sbown.
9Factories which are using powerand employing 10 or more workers and those which are not using power and employing 20 or more workerson any day during the accounting year come under Section2(m. Factories employing less than 10 workers and working with the aid of power and those employing less than 20 workers and working without the aid of power on any day during the year come under Section 85.

8
small-scale industry and other unregistered industrial units.
Annual Survey of Industries (ASI) .provide valuable information on consumption of raw materials including timber, fuelwood and charcoal. The factories registered under Section 2(m) are subclassified in the AS1 into census and non-census sectors10, The AS1 covers all units in the census sector every year. Half of t he units in each industry in the non-census sector is surveyed in each year by rotation so as to cover all units within a period of two years. The AS1 da ta pertaining to the years from 1979-80 to 1985-86 except 1982-83 were collected Prom the Department of Economics and Statistics, Thiruvananthapuram11 Based on the number of units and the quanti ty consumed in each year, weighted average consumption of timber, fuelwood and charcoal by different industries in the census and non-census sectors in each district were worked out. The mean consumption of wood by industries coming under Section 86 is taken t o be the same as tha t for industries in t he non-census sector12. An attempt was made to collect da ta on wood consumption in certain industries by a survey for t he year 1987-88. This da ta was 'used to cross-check with the norms of consumption derived from the AS1 da ta and it was found t h a t in many cases, they are in broad agreement. I t was therefore decided to use the AS1 da ta in view of wider coverage. The number of factories functioned during 1987-88 in respect of census, non-census sectors and Section 86 in each district were compiled from Department of Factories and
Boilers(1984 and 1987) and from registers maintained by t h a t Department. The wood consumption by different industries in each district during 1987-88 is estimated on the basis of the number of units and average wood consumption per unit.
Data on the number of various small-scale industrial units were collected from the Small Industries Service Institute, Thrissur. Sample units were surveyed to estimate the average consumption of wood. Consumption of wood by small-scale industries is arrived at based on the number of units in each category and the average consumption per unit. Wood consumption by other unregistered industrial units including household enterprises is estimated based on the data on the number and consumption of wood per unit in the selected villages of the sample survey.
3.1.3 Tertiary Sector
Tertiary sector is defined to include all wood using agencies other than households and Industries. Business establishments, restaurants , hostels, hospitals, government departments, railways, road construction, etc. come in this sector. Wood consumption in the ter t iary sector is in the form of construction timber, fuelwood, charcoal,
10 The units employing 50 or more workers With the aid of power and those employing 100 or more workers without using power come under census sector. The non-census sectorincludes the remaining factories coming under section 2(m).
11 The data for the year 1982-83 were not available. 12Since the technology used in both the groups of wood-based industries is the same,
there is not such difference in the consumption of wood.

9
electricity transmission poles, railway sleepers, etc.
3.1.3.1 Non-residential Building Construction
From the data on number and plinth area of non-residential buildings constructed in the private and public sectors in the urban areas for the period 1981 to 1985 according to type of buildings, compiled from Department of Economics and Statistics (1988b), the total number and plinth area per year are worked out and assumed as the total number and plinth area of non- residential buildings constructed during 1987-88 in the urban areas. Timber consumption is worked out on the basis of the estimated total number and plinth area for 1987-88 and the average timber requirement per house provided by the Central Building Research Institute. Timber consumption in the rural areas is estimated based on the number of newly built non- residential buildings in the desoms of the selected villages of the sample survey (meant for the estimation of timber-use for house construction and other purposes by households in the rural areas) and the average quantity of timber used. The actual timber consumption for buildings constructed by the Central Public Works Department is added to give the total timber-use in the non-residential construction sector.
3.1.3.2 Tea shops, hostels, hospitals, etc.
Tea-shops and restaurants form the principal component consuming a substantial quantity of fuelwood and charcoal in the tertiary sector13. There exists a large number of such establishments both in rural and urban areas catering to the floating population and those who take food outside the households. According to the 1980 Economic Census, there were 74737 and 15178 tea-shops and restaurants in the rural and urban areas of the State respectively (Department of Economics and Statistics, 1987). The number of such units in the rural and urban areas during 1987-88 is estimated to be 83927 and 17044 respectively taking the same growth rate as that of the population. The break-up of the number of tea-shops and restaurants in the rural and urban areas in different districts is done in proportion to the projected rural and urban population of 1987-88 in different districts. The total consumption of fuelwood and charcoal by them in the rural and urban areas during 1987-88 is estimated based on the number of units in rural a n d urban areas and the average quantity of fuelwood and charcoal consumed per unit in the rural and urban areas respectively14.
13Consumption of fuelwood by such establishments would have been accounted for i f per capita fuelwood consumption for the State had been estimated from total consumption. But, the consumption of fuelwood by households is estimated based on the per capita consumption which is derived from the actual consumption of fuelwood by households.
14 Randomsamples of 62 establishments fran rural areas and 56 urban areas of Thrissur District were selected fran exhaustive lists maintained by Panchayats and Muncipalities, and were surveyed on fuelwood and charcoal consumption. The consumption per unit estimated for the rural and urban areas of Thrissur District is assumed to hold good i n other districts also.
10
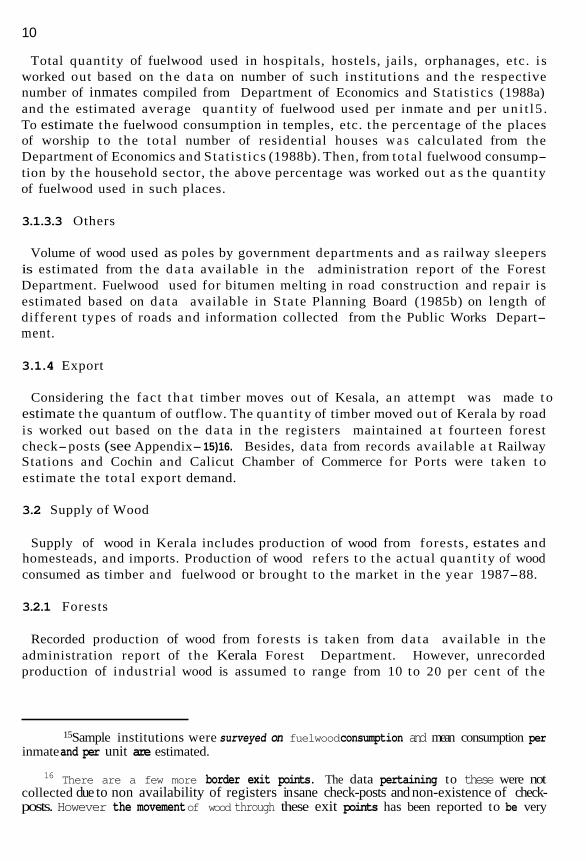
Total quantity of fuelwood used in hospitals, hostels, jails, orphanages, etc. i s worked out based on the da ta on number of such institutions and the respective number of inmates compiled from Department of Economics and Statistics (1 988a) and the estimated average quanti ty of fuelwood used per inmate and per uni t l5 . To estimate the fuelwood consumption in temples, etc. the percentage of the places of worship to the total number of residential houses w a s calculated from the Department of Economics and Stat is t ics (1988b). Then, from total fuelwood consump- tion by the household sector, the above percentage was worked out a s the quantity of fuelwood used in such places.
3.1.3.3 Others
Volume of wood used as poles by government departments and a s railway sleepers is estimated from the da t a available in the administration report of the Forest Department. Fuelwood used for bitumen melting in road construction and repair is estimated based on da ta available in State Planning Board (1985b) on length of different types of roads and information collected from the Public Works Depart- ment.
3.1.4 Export
Considering the fact t ha t timber moves out of Kesala, an attempt was made to estimate the quantum of outflow. The quanti ty of timber moved out of Kerala by road is worked out based on the da ta in the registers maintained a t fourteen forest check-posts (see Appendix- 15)16. Besides, data from records available a t Railway Stations and Cochin and Calicut Chamber of Commerce for Ports were taken to estimate the total export demand.
3.2 Supply of Wood
Supply of wood in Kerala includes production of wood from forests, estates and homesteads, and imports. Production of wood refers to the actual quanti ty of wood consumed as timber and fuelwood or brought to the market in the year 1987-88.
3.2.1 Forests
Recorded production of wood from forests i s taken from data available in the administration report of the Kerala Forest Department. However, unrecorded production of industrial wood is assumed to range from 10 to 20 per cent of the
15Sample institutions were surveyed on fuelwood consumption and mean consumption per inmate and per unit are estimated.
16 There are a few more border exit points. The data pertaining to these were not collected due to non availability of registers in sane check-posts and non-existence of check- posts. However the movement of wood through these exit points has been reported to be very negligible.
11
recorded production l7. Unrecorded production of fuelwood from forests used by households is taken as the sum of consumption of fuelwood by t h e population living within forests and 5 to 20 per cent of t he requirement of t he population living in villages adjoining forests 18 Unrecorded production of fuelwood from forests used in tea shops, hotels etc. in the ter t iary sector is calculated t o range from 10 t o 20 percent of t he quanti ty of fuelwood used in t he te r t ia ry sector in villages adjoining l9. Unrecorded production of charcoal from forests is worked out to range from 15 to 75 per cent of t he difference between t h e to ta l consumption of charcoal and t h e sum of t he recorded production from forests and import of charcoal.
3.2.2 Estates
Estates include plantations of rubber, cardamom, coffee and tea. The supply of wood from rubber plantations is arrived a t based on the area replanted per annum and the yield of wood per ha. I t is estimated by the officials of t he Rubber Board tha t about 5000 ha a r e replanted annually and the yield of rubber wood is 199.76 m3 per ha. The distribution of s t e m wood (timber) and branch wood (fuelwood) is 60 and 40 per cent respectively (see Haridasan et al., 1985). The Rubber Board permits a maximum of 20 trees per ha other t han rubber to be retained in rubber plantations. Valuable t rees of medium growth are usually retained by farmers at t he time of planting rubber. Assuming t h a t two t o four trees of dbh above 65 cm are felled during replantation of rubber, t he volume of such trees is taken to range from 8.638 to 17.256 m3 per ha. A s regards coffee, tea and cardamom plantations, t he wood supply is calculated assuming t h a t one to two trees above 45 em dbh are felled producing 1.953 to 3.906 m3 per ha in al l plantations.
3.2.3 Imports
Quantity of timber imported t o Kerala from outside t he S ta te and from other countries is arrived a t by perusing the records available at fourteen border forest check-posts (see Appendix- 15), Railway Stations, and Cochin and Calicut Chambers of Commerce for Ports.
17Unrecorded production of wocd from forests is assumed as 10 percent of the recorded production for the estimation of state income by the Department of Economrcs and Statistics (1986: p4),
18It is assumed that the population living within forests fully depend on fuelwood collected directly. Further, the population in villages adjoining the forests are assumed to collect 5 to 20 percent of their requirement fran the forests. The population for 1987-88 is projected based on the 1981 census. The fuelwocd consumption is estimated on the basis of the projected population of both of the groups and the per capita fuelwood consumption in the rural areas of Kerala, including the fuelwocd equivalent of fuel fran coconut/palmyra trees and crop residues.
19The total fuelwood used i n the tertiary sector i n villages adjoiningforests is taken as the same percentage as that of the population i n these villages.
12
3.2.4 Homesteads
A sample survey w a s conducted during 1988-89 to estimate the volume of growing stock of trees in homesteads, the crop-mix and the preference for particular species. Homesteads include house compounds and farm lands. Dry land area under agricultural use (see foot-note 18) less area under estates is defined as the area under hamesteads. A survey on tree-felling in homesteads w a s also attempted to quantify the wood production from homesteads. There is lack of information regarding the restrictions imposed by the government on felling of certain trees in private lands. The respondents were found to conceal actual tree-felling due to fear of bureaucratic harassment later. Also the recall method adopted for the survey had several defects, the most important being the non-availability of exact dimensions of the already felled trees. Due to unreliability in the data, i t w a s not used for further analysis. Wood production from homesteads is therefore taken as the difference between the demand for wood and the sum of wood production from forests and estates, and imports.
3.3 Methodology of the Sample Survey
A stratified three-stage sampling procedure was adopted for the selection of samples. For each revenue village in Kerala, the percentage of dryland (garden land) area under agricultural use to the total area under agricultural use20 and popuIation density were calculated from the data available with the State Land-use Board and in the 1981 Census report respectively. By forming 5 classes for the percentage of dryland area under agricultural use to total area under agricultural use and 3 classes for the population density, 15 s t ra ta were formed and the villages were classified in different strata accordingly21 . Revenue villages in each stratum were treated as first-stage units of sampling. Out of the total number of villages in Kerala according to 1981 census, 2.5 per cent were distributed in different s t r a t a approximately in proportion to the dryland area under agricultural use in each stratum ensuring that at least one village was included from each stratum. The villages in each stratum were chosen at random and in all 30 villages were selected (see Appendix- 16). Census villages or desoms were taken as second stage units of sampling since several desoms form a revenue village. One desom each was randomly selected from the chosen revenue villages and all the households in the selected desom were visited to collect information such as year of house construc- tion, whether there was any construction activity using timber in the year 1987-88,
2O In this study the total area under agricultural use is defined to include land under miscellaneous tree crops, cultivable waste, current and other fallow and net area sown. The dryland area under agricultural use equals the total area under agricultural use less the area under wet land (paddy fields). Fur each Village the data is available in the files of State Land Use Board, Thiruvanthapuram.
2 1 A two way stratification was adopted since the wood availability depends on the extent
of dry lands where trees are maintained and the wood consumption depends on population density. Different classes of percentage of dryland area under agricultural use to total area under agricultural use are: 0-50, 50-70, 70-80, 80-90 and 90-100 and various classes of population density are: below 500, 500-1OOO and above l000 persons per lad.
13
size of dryland holding22. etc.
3.3.1 Estimation of timber-use in rural households
The households, where timber was utilized during 1987-88 for (i) new house construction, (ii) house repair and alterations, (iii) making furniture, fixtures, implements, etc., were the third-stage units of sampling for estimating the quantity of timber used for various purposes by households in rural areas. In a selected desom, 10 households were randomly and independently chosen from the list of households of the above three categories. Actual quantity of timber used was measured in each selected households.
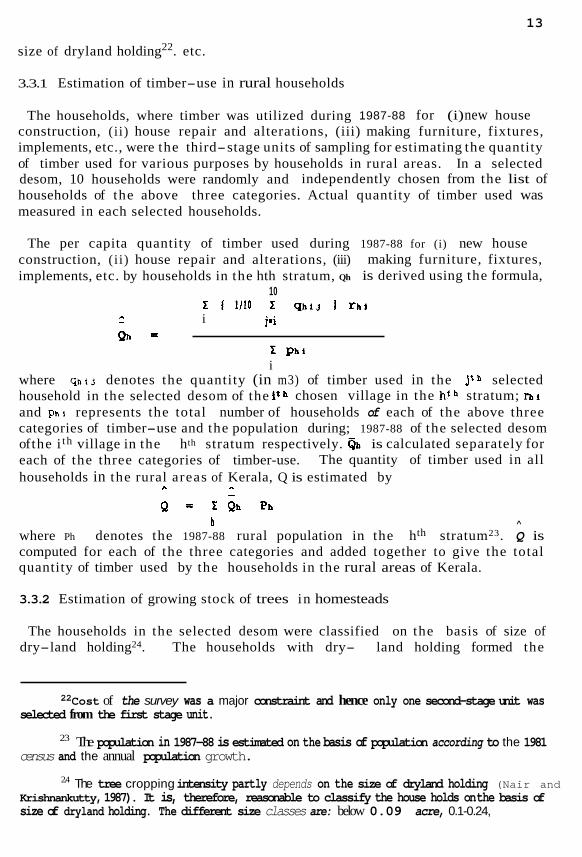
The per capita quantity of timber used during 1987-88 for (i) new house construction, (i i) house repair and alterations, (iii) making furniture, fixtures, implements, etc. by households in the hth stratum, Qh is derived using the formula,
10 1 1/18 1 q h i j 1 r h l
A - i j z i Qb =
1 p h i
i where q h i j denotes the quantity (in m3) of timber used in the j t h selected household in the selected desom of the i t h chosen village in the htb stratum; hi
and phi represents the total number of households of each of the above three categories of timber-use and the population during; 1987-88 of the selected desom of the i t h village in the hth stratum respectively. Bh is calculated separately for each of the three categories of timber-use. The quantity of timber used in all households in the rural areas of Kerala, Q is estimated by
A A - Q = 1 Qh Ph
h ^
where Ph denotes the 1987-88 rural population in the hth stratum23. Q is computed for each of the three categories and added together to give the total quantity of timber used by the households in the rural areas of Kerala.
3.3.2 Estimation of growing stock of trees in homesteads
The households in the selected desom were classified on the basis of size of dry-land holding24. The households with dry- land holding formed the
22Cost of the survey was a major constraint and hence only one second-stage unit was selected from the first stage unit.
census and the annual population growth.
2.4 The tree cropping intensity partly depends on the size of dryland holding (Nair andKrishnankutty, 1987). It is, therefore, reasonable to classify the house holds onthe basis of size of dryland holding. The different size classes are: below 0.09 acre, 0.1-0.24, 0.25-0.49,
23 The population in 1987-88 is estimated on the basis of population according to the 1981
14
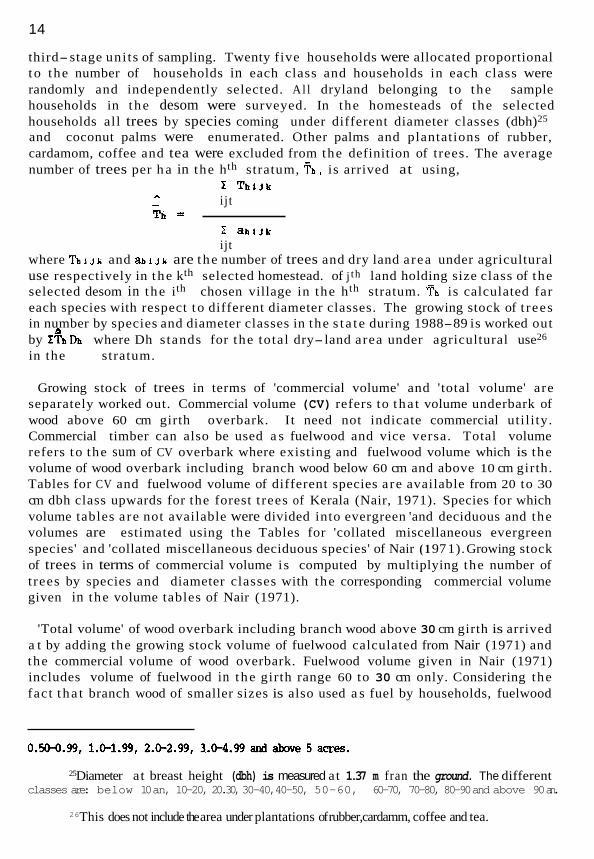
third-stage units of sampling. Twenty five households were allocated proportional t o the number of households in each class and households in each class were randomly and independently selected. Al l dryland belonging to the sample households in t he desom were surveyed. In the homesteads of the selected households all trees by species coming under different diameter classes (dbh)25 and coconut palms were enumerated. Other palms and plantations of rubber, cardamom, coffee and tea were excluded from the definition of trees. The average number of trees per h a in the hth stratum, ?b, is arrived at using,
T h l j k i j t
1 a h l j k
ijt
6 - Th =
where Ta i j L: and ab i j L: are the number of trees and dry land area under agricultural use respectively in t he kth selected homestead. of j th land holding size class of the selected desom in the ith chosen village in the h th stratum. T h is calculated far each species with respect t o different diameter classes. The growing stock of t rees in number by species and diameter classes in the s t a t e during 1988-89 is worked out by 1&Dh where Dh stands for the total dry-land area under agricultural use26 in the htb stratum.
Growing stock of trees in terms of 'commercial volume' and 'total volume' are separately worked out. Commercial volume (CV) refers to t ha t volume underbark of wood above 60 cm girth overbark. It need not indicate commercial utility. Commercial timber can also be used a s fuelwood and vice versa. Total volume refers t o the sum of CV overbark where existing and fuelwood volume which is the volume of wood overbark including branch wood below 60 cm and above 10 cm girth. Tables for CV and fuelwood volume of different species a re available from 20 to 30 cm dbh class upwards for the forest t rees of Kerala (Nair, 1971). Species for which volume tables a re not available were divided into evergreen 'and deciduous and the volumes are estimated using the Tables for 'collated miscellaneous evergreen species' and 'collated miscellaneous deciduous species' of Nair ( 1 97 1). Growing stock of trees in terms of commercial volume i s computed by multiplying the number of t rees by species and diameter classes with the corresponding commercial volume given in the volume tables of Nair (1971).
'Total volume' of wood overbark including branch wood above 30 cm girth is arrived a t by adding the growing stock volume of fuelwood calculated from Nair (1971) and the commercial volume of wood overbark. Fuelwood volume given in Nair (1971) includes volume of fuelwood in t he girth range 60 to 30 cm only. Considering the fact t ha t branch wood of smaller sizes is also used a s fuel by households, fuelwood
25Diameter at breast height (dbh) is measured at 1.37 m fran the ground. The different classes are: below 10 an, 10-20, 20.30, 30-40,40-50, 50-60, 60-70, 70-80, 80-90 and above 90 an.
26This does not include the area under plantations of rubber,cardamm, coffee and tea.
15
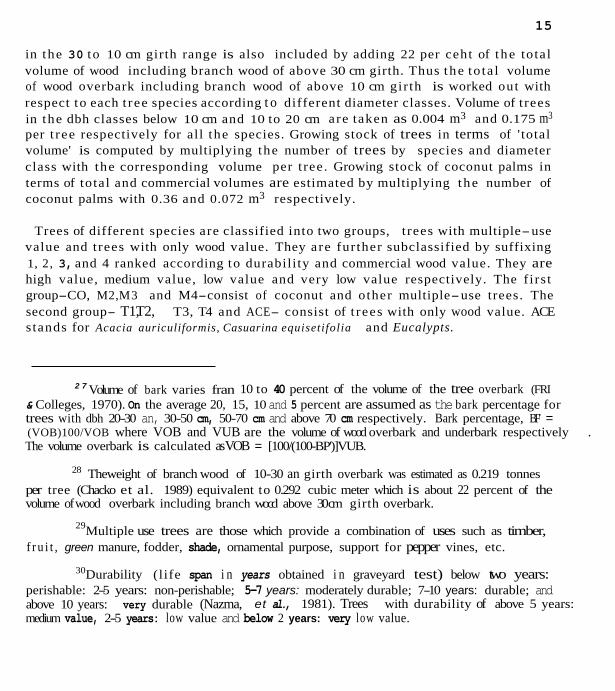
in the 30 to 10 cm girth range is also included by adding 22 per ceht of t he total volume of wood including branch wood of above 30 cm girth. Thus t he to ta l volume of wood overbark including branch wood of above 10 cm gir th is worked out with respect to each t ree species according t o different diameter classes. Volume of t rees in the dbh classes below 10 cm and 10 to 20 cm are taken as 0.004 m3 and 0.175 m3 per t ree respectively for all the species. Growing stock of trees in terms of ' total volume' is computed by multiplying the number of trees by species and diameter class with the corresponding volume per t ree. Growing stock of coconut palms in terms of total and commercial volumes are estimated by multiplying the number of coconut palms with 0.36 and 0.072 m3 respectively.
Trees of different species are classified into two groups, t rees with multiple-use value and trees with only wood value. They are further subclassified by suffixing 1, 2, 3, and 4 ranked according to durability and commercial wood value. They are high value, medium value, low value and very low value respectively. The f i rs t group-CO, M2, M3 and M4-consist of coconut and other multiple-use trees. The second group- T1, T2, T3, T4 and ACE- consist of t rees with only wood value. ACE stands for Acacia auriculiformis, Casuarina equisetifolia and Eucalypts.
2 7 Volume of bark varies fran 10 to 40 percent of the volume of the tree overbark (FRI
&Colleges, 1970). On the average 20, 15, 10 and 5 percent are assumed as the bark percentage for trees with dbh 20-30 an, 30-50 cm, 50-70 cm and above 70 cm respectively. Bark percentage, BF' = (VOB)100/VOB where VOB and VUB are the volume of wood overbark and underbark respectively . The volume overbark is calculated as VOB = [100/(100-BP')]VUB.
28 Theweight of branch wood of 10-30 an girth overbark was estimated as 0.219 tonnes per tree (Chacko et al. 1989) equivalent to 0.292 cubic meter which is about 22 percent of the volume of wood overbark including branch wocd above 30 cm girth overbark.
29Multiple use trees are those which provide a combination of uses such as timber, f ru i t , green manure, fodder, shade, ornamental purpose, support for pepper vines, etc.
30Durability (life span i n years obtained i n graveyard test) below two years:perishable: 2-5 years: non-perishable; 5-7 years: moderately durable; 7-10 years: durable; and above 10 years: very durable (Nazma, et al., 1981). Trees with durability of above 5 years:medium value, 2-5 years: low value and below 2 years: very low value.

16
The wood-balance in Kerala for t he year 1987-88 is presented in th i s section. The demand for wood in t he household, industries and ter t iary sectors is analysed followed by the supply of wood from different internal sources and imports. Export of wood from Kerala is included in t he demand side.
4.1 Demand for Wood 4.1.1 Household sector
The per capita annual consumption of sawn timber in t he household sector of Kerala is estimated as 0.0195 m3 2nd t h a t for the rural and urban areas are 0.0225 m3 and 0.0067 m3 respectively. The total quanti ty of sawn timber used for house construction, repair, a l terat ions and making furniture, fixtures, implements, etc. is estimated as 0.558 million m3 of which coconut wood accounted for 27.0 per cent. In round wood equivalent, the total quanti ty is worked out to be 1.133 million m3 of which coconut wood accounted for 52.1 per cent31, Coconut, jack and anjily a r e t he most common timbers used in house construction. Teak wood i s used in small quantities by the household sector for furniture, door and window shutters .
The per capita annual consumption of fuelwood by households in t he rural and urban areas of Kerala are worked out a s 0.178 and 0.151 tonnes respectively. The total demand for fuelwood in t he household sector of Kerala is estimated as 4.943 million tonnes (4.134 and 0.809 million tonnes in the rural and urban areas respec- tively), or 6.591 million m3 round wood equivalent. This does not include coconut palm by-products and crop residues used by households as fuel. The total quanti ty of such non-wood biomass fuel materials accounts for 7.32 million tonnes in rural areas and 0.72 million tonnes in urban areas.
Among t h e districts, household sector of Thiruvananthapuram had the highest demand for wood. (The district-wise household demand for timber and fuelwood is given in Appendix-2).
4.1.2 Industries sector
Table 4.1 gives the industrial demand for wood in Kerala32. The total quanti ty of wood used in t he industries sector is estimated a s 1.061 million m3 round wood.
31lhe sawn wood recovery of lm2 of round leg of coconut wood is 0.255m1 (Gnanaharan et al., 1988). For other timber it is taken as 0.75 m‘ . See also Forestry Commission (1965).
32Saw~ milling is the most important wood-using industry in Kerala. Wood processed i n sawmills is estimated as 1.572 million m2 during 1987-88. Of this, 0.75 million m 2 represents custom sawing of wood brought by users directly. Sawn timber from sawmills is used in the household, industries and tertiary sectors and for export is accounted for i n the total demand for wood. Therefore to avoid double counting, wood used in saw milling is not shown separately.

17
Table 4.1 Industrial demand for wood in Kerala during 1987-88
Wood (round Percentage Industry logs in m3) to total
Packing case 319 , 224 30.1 Match 283,346 26.7 Furniture 152 , 437 14.4 Plywood and veneer 131,998 12.4 Pulp and paper33 111,374 10.5 Others34 62 , 562 5.9
Total 1,060,941 100.0
The highest demand for wood is in the packing case industry. Match industry ranked next followed by furniture industry. Wood-based industries in Kottayam had the highest demand for wood among districts (see Appendix-3). mainly because of one pulp and paper unit.
Industrial demand for fuelwood and charcoal is 'given in Table 4.2 and 4.3respectively. The estimated total demand for fuelwood is 1.298 million tonnes
Table 4.2 Industrial demand for fuelwood in Kerala during 1987-88
Fuelwood Percentage Industry (tonnes35 ) to total
Tile and brick-making 795,200 Chemical industries 153 , 315 Tea and coffee processing 144,157 Rubber products 29,990 Ayyrvedic medicines 28,199 Textiles 26 , 092 Others36 120 , 791
61.3 11.8 11.1 2.3 2.2 2.0 9.3
Total 1,297,744 100.0
33 Two pulpbased units were lyins closed during the reporting year.
34Others include industries producing hand tools, agricultural implements, industrial goods, wooden structural goods, pencil, photo frames, wooden toys, wooden boats, transport eqipments,etc.
35For conversion fromtonne to n$ equivalent, see foot-note 41. 3 6
Others include industries such as plywood, dairy products, spirit distilling, printing and binding, allopathic medicines, agricultural implements and hand tools, casting of iron and steel, metal utensils, bakery products, soap, matches, knitting mills, repair of motor vehicles, etc.
18
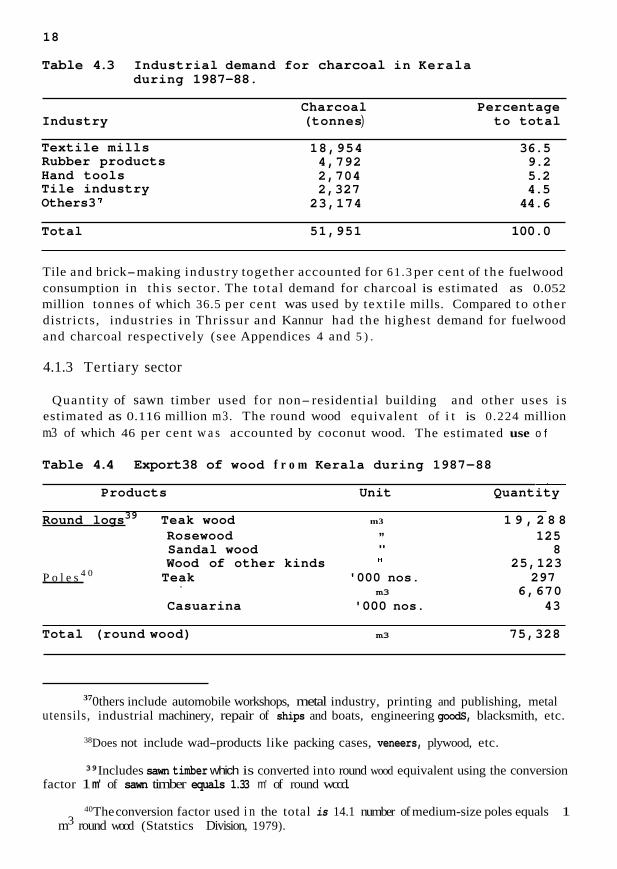
Table 4.3 Industrial demand for charcoal in Keraladuring 1987-88.
Charcoal Percentage Industry (tonnes ) to total
Textile mills 18,954 36.5 Rubber products 4,792 9.2 Hand tools 2,704 5.2 Tile industry 2,327 4.5 Others3 23,174 44.6
Total 51,951 100.0
Tile and brick-making industry together accounted for 61 .3 per cent of t he fuelwood consumption in th i s sector. The to ta l demand for charcoal is estimated as 0.052 million tonnes of which 36.5 per cent was used by text i le mills. Compared t o other districts, industries in Thrissur and Kannur had the highest demand for fuelwood and charcoal respectively (see Appendices 4 and 5 ) .
4.1.3 Tertiary sector
Quanti ty of sawn timber used for non- residential building and other uses i s estimated as 0.116 million m3. The round wood equivalent of i t is 0.224 million m3 of which 46 per cent w a s accounted by coconut wood. The estimated use o f
Table 4.4 Export38 of wood f r o m Kerala during 1987-88 -
Products Unit Quantity
Round logs39 Teak wood m3 1 9 , 2 8 8 ,, " I,
Rosewood 125 Sandal wood 8 Wood of other kinds 25,123
P o l e s 4 0 Teak '000 nos. 297 m3 6,670
Casuarina '000 nos. 43
Total (round wood) m3 75,328
"
370thers include automobile workshops, metal industry, printing and publishing, metal utensils, industrial machinery, repair of ships and boats, engineering goodS, blacksmith, etc.
38Does not include wad-products like packing cases, veneers, plywood, etc.
39 Includes sawn timber which is converted into round wood equivalent using the conversion factor 1 m' of sawn timber equals 1.33 m' of round wccd.
40The conversion factor used i n the total is 14.1 number of medium-size poles equals 1 m3 round wood (Statstics Division, 1979).

19
fuelwood and charcoal in the tertiary sector is 2.870 and 1.045 million m3 round wood equivalent respectively. Among the districts, tertiary sector of Ernakulam accounted for the largest use of wood (see Appendix 6).
4.1.4 Export of wood from Kerala
Sawn timber, round logs and poles are being exported from Kerala to other States in India and sawn timber to other countries (see Appendix 7). Table 4.4 provides the data on export wood from Kerala. A quantity of 0.075 million m3 round wood equivalent of timber and poles has moved out of Kerala during 1987-88. Poles in round wood equivalent contributed to 41 per cent. Teak wood accounted for the major share of export of sawn timber.
4.1.6 Demand for wood: An overview
Table 4.6 shows the demand for wood in Kerala. The estimated demand for wood
Table 4.5 Demand for wood in Kerala during 1987-88
(in million m3 round wood equivalent41)
Fue 1 Non-fuel42 Sectors Total
quantity ( % I quantity ( % I wood
Household43 6.195 51.0 1.133 45.4 7.328 (42.3) (7.7) (50.0)
Industries 2.042 16.8 1.061 42.6 3.103 (13.9) (7.3) (21.2)
Tertiary 3.915 32.2 0.224 9.0 4.139 (26.8) (1.5) (28.3)
Export 0.000 0.0 0.075 3.0 0.075 (0.0) (0.5) (0.5)
Total demand 12.152 100.0 2.493 100.0 14.645 (83.0) (17.0) (100.0 )
41 The conversion factors adopted are for fuelwood 0.750 tonnes equivalent to 1 m' and for
charcoal 1 tonne equivalent to 6m3 (FAO, 1979).
42 Includes conversion waste from round wood to sawn sizes and other industrial wood- waste.
43Household fuelwood demand would actually be higher by 0.3% million m'3 as half the estimated quantity of 0.685 million of sawmill waste and 0.053 million m' of wood waste from other industries (5 percent of industrial wood used) used as fuel in households is not included. Further 8.04 million tonnes (approximately 8.04 million of fuelwood equivalent) of non-wood biomass materials used by households as fuel is not included (see Thampi, 1983 for fuelwood equivalent of coconut palm by-products).
20
is 14.645 million m3 round wood equivalent. Of the demand. household sector accounted for the major share (50.0 per cent), tertiary sector ranked next (28.3 per cent) followed by industries sector (21.2 per cent). Wood exported was relatively negligible (0.5 per cent). Of the household demand. wood as fuel accounted for 84.5 per cent and as non-fuel(timber) 15.5 per cent. Of the industrial demand, wood as fuel constituted 66.8 per cent and as non-fuel (industrial wood) 34.2 per cent. The demand for wood as fuel was 94.6 per cent and as non-fuel (timber and poles) 6.4 per cent of the demand for wood in the tertiary sector.
Of the total demand, wood as fuel accounted for 83.0 per cent and as non-fuel (timber, industrial wood and poles) for industries, construction, etc. 17.0 per cent. Of the fuel demand, household sector accounted for the major share (51.0 per cent), tertiary sector ranked next (32.2 per cent) followed by the industries sector (16.8 per cent). Household sector accounted for 45.4 per cent of the non-fuel (timber) demand, industries sector 42.6 per cent, tertiary sector 9.0 per cent and export only 3.0 per cent. Coconut wood contributed to 27.8 per cent of wood used as. timber in Kerala indicating the importance of coconut wood in the timber economy of Kerala.
4.2 Supply of Wood 4.2.1 Homesteads
.
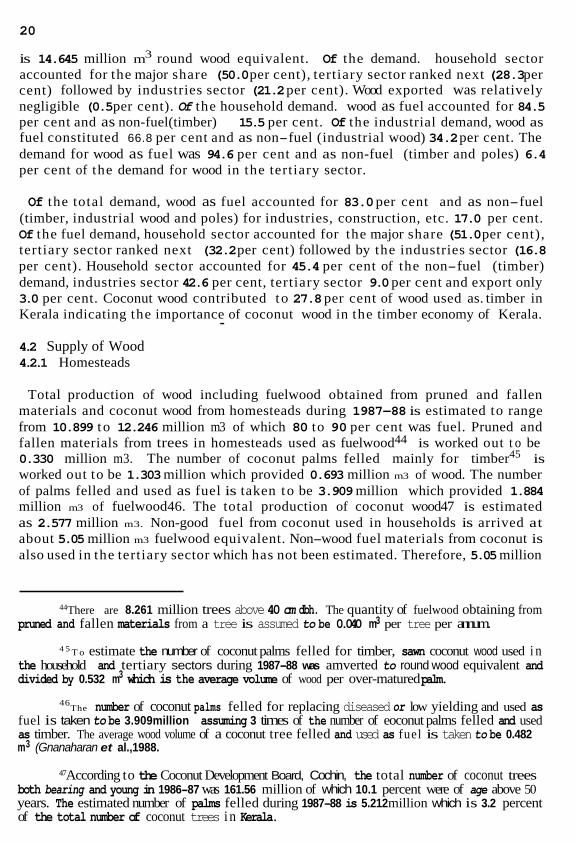
Total production of wood including fuelwood obtained from pruned and fallen materials and coconut wood from homesteads during 1987-88 is estimated to range from 10.899 to 12.246 million m3 of which 80 to 90 per cent was fuel. Pruned and fallen materials from trees in homesteads used as fuelwood44 is worked out t o be 0.330 million m3. The number of coconut palms felled mainly for timber45 is worked out to be 1.303 million which provided 0.693 million m3 of wood. The number of palms felled and used as fuel is taken to be 3.909 million which provided 1.884 million m3 of fuelwood46. The total production of coconut wood47 is estimated as 2.577 million m3. Non-good fuel from coconut used in households is arrived at about 5.05 million m3 fuelwood equivalent. Non-wood fuel materials from coconut is also used in the tertiary sector which has not been estimated. Therefore, 5.05 million
44There are 8.261 million trees above 40 cm dbh. The quantity of fuelwood obtaining from pruned and fallen materials from a tree is assumed to be 0.040 m3 per tree per annum.
4 5 T o estimate the number of coconut palms felled for timber, sawn coconut wood used i n the household and tertiary sectors during 1987-88 was amverted to round wood equivalent and divided by 0.532 m3 which is the average volume of wood per over-matured palm.
46The number of coconut palms felled for replacing diseased or low yielding and used as
fuel is taken to be 3.909million assuming 3 times of the number of eoconut palms felled and used as timber. The average wood volume of a coconut tree felled and used as fuel is taken to be 0.482 m 3 (Gnanaharan et al.,1988.
47According to the Coconut Development Board, Cochin, the total number of coconut trees both bearing and young in 1986-87 was 161.56 million of which 10.1 percent were of age above 50 years. The estimated number of palms felled during 1987-88 is 5.212 million which is 3.2 percent of the total number of coconut trees i n Kerala.

21
m3 can be taken as the minimum production of non-wood coconut fuel. However, t he non-wood component of fuel has not been included in the present analysis.
The upper limit of 12.246 million m3 of wood production represents 8.3 m3 per h a of homestead lands used exclusively for agriculture or 7m3 per h a of homestead lands plus area under non-agricultural uses within homesteads. The definition of wood used in this s tudy is different from the conventional definition where, usually, only wood above 60 cm girth i s considered. Our definition of wood includes woody materials up to 10 cm girth in the case of fuelwood. Therefore 7 m3 per ha can not be considered to be a very high figure. No attempt has been made t o assess the sustainability of wood production from homesteads considering the present level of production.
4.2.2 Estates
Wood production from rubber plantations including small holdings during 1987-88 is estimated as 0.999 million m3. In addition t o rubber wood, wood of other trees like anjily, jack, etc. is also obtained during felling of rubber plantations. The quanti ty of such wood i s estimated to range from 0.043, t o 0.086 million m3 of which 42.2 per cent is timber and the balance fuelwood. The supply of timber and fuelwood from plantations of tea, coffee and cardamom is worked out t o range from 0.318 t o 0.686 million m3 of which 49.7 per cent timber. The to ta l supply of wood from all estates is thus arrived at to range from 1.360 t o 1.721 million m3 round wood.
4.2.3 Forests Supply of wood from the natural forests and plantations of Kerala during 1987-88
is presented in Table 4.6. The supply of wood is calculated to range from 0.686 t o
Table 4.6 Supply of w o o d from forests of Kerala during 1987-88
Produc t s Unit Recorded Unrecorded Total production production production
(in range) (in range)
Timber logs m3 51,151 5,115 - 10,230 56,266 - 61,381 Eucalypt wood tonnes 97,815 9,782 - 19,563 107,597 - 117,378 Puelwood ,, 25,438 151,639 - 335,596 177,077 - 361,034 Sandalwood I f 123 12 - 25 135 - 148 Poles '000 nos. 957 96 - 192 1,053 - 1,149 Charcoal tonnes 19 29,851 - 149,255 29,870 - 149,274 Total48 (in round wood equivalent) 1113 280,194 405,928 - 1,392,266 686,122 - 1,672,460
48The round wood equivalent has been worked out using oonversion factors 1 d equals 0.740 tonnes for Eucalyptus grandis wood, 0.980 for E. tereticornis wood and 0.945 tonnes for sandalwood (Nazma et al., 1981)

22
1.672 million m3 round wood equivalent. The recorded production i s worked out t o range from 16.8 t o 40.8 per cent of the total supply from the forests. Eucalypt wood accounted for t he major share (45.3 percent) of t he recorded production. Of t he to ta l unrecorded production, fuelwood and charcoal constituted 94 t o 97 per cent. Fuelwood and charcoal accounted for 61 t o 82 per cent of t he to ta l supply of wood from the forests.
4.2.4 Imports
A substant ial quant i ty of wood is being imported t o Kerala (see Appendix 8). Table 4.7 presents t he detai ls regarding t he import of wood to Kerala from other s t a t e s in India and abroad in 1987- 88. The to ta l quant i ty of wood imported w a s 0.353 million m3 of which 46.2 per cent was round wood equivalent of charcoal. Timber imported from Malaysia w a s about 0.104 million m3 which i s about 55 per cent of t he total timber imported.
Table 4.7 Impor t 4 9 of wood to Kerala during 1987-88
Products Unit Quantity
Round logs Eucalypt wood tonnes 4,678 Rosewood m3 2,023
1,553 Teak wood 552 Sandalwood
173,331 Wood other kinds50
11
,I
11
,I
1 .
I I
I ,
156 1 1 Sawn timber Wood other kinds
Poles Casuarina '000 nos. 81
Charcoal tonnes 27,122
Total (round wood equivalent) m3 352,518
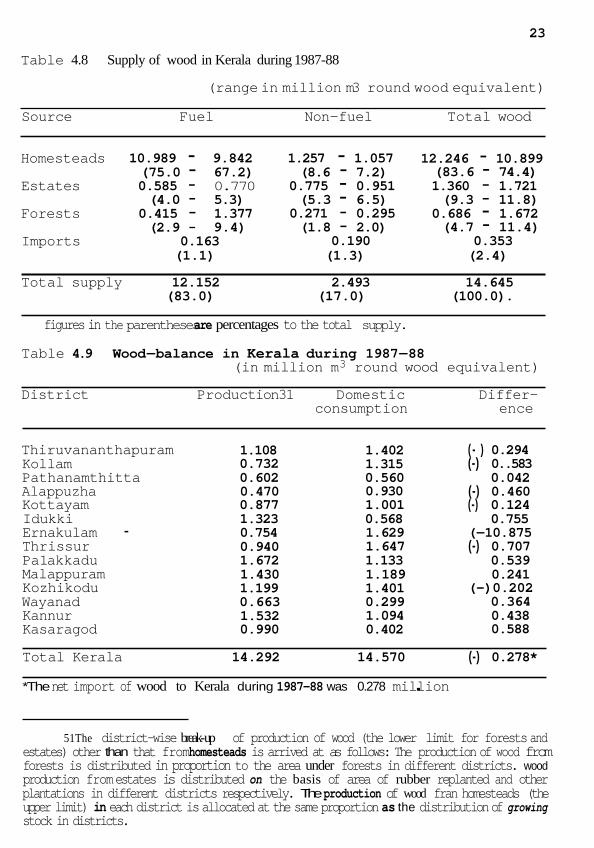
4.2.5 Supply of wood in Kerala: An overview
The supply of wood in Kerala from different sources i s shown in Table 4.8. Homesteads contributed 74.4 t o 83.6 per cent of t he to ta l wood supply and estates 9.3 t o 11.8 per cent . Forests produced only 4.7 t o 11.4 per cent of t he to ta l supply although the recorded production was only 1.9 percent. Wood imported from other s t a t e s and countries was 2.4 per cent. Of t he to ta l supply of timber, industrial wood and poles, homesteads produced 42.4 t o 50.4 per cent. Of t he to ta l fuelwood supply, homesteads provided 81.0 t o 90.4 per cent. Fuel from coconut includjng both wood
49Timber logs of 898 rd imported by rail is also included. Wood-pulp of 5259 tonnes imported fran New Zealand, Norway, USA, etc. is excluded.
50Of the total quantity of wood other kinds, 60 per cent was imported fran Malaysia.
23
Table 4.8 Supply of wood in Kerala during 1987-88
(range in million m3 round wood equivalent)
Source Fuel Non-f uel Total wood
Homesteads 10.989 - 9.842 1.257 - 1.057 Estates 0.585 - 0.770 0.775 - 0.951 Forests 0.415 - 1.377 0.271 - 0.295 Imports 0.163 0.190
(75.0 - 67.2) (8.6 - 7.2) (4.0 - 5.3) (5.3 - 6.5) (2.9 - 9.4) (1.8 - 2.0)
(1.1) (1.3)
12.246 - 10.899 (83.6 - 74.4) 1.360 - 1.721 (9.3 - 11.8)
0.686 - 1.672 (4.7 - 11.4)
(2.4) 0.353
Total supply 12.152 2.493 14.645 (83.0) (17.0) (100.0).
figures in the parentheses are percentages to the total supply.
Table 4.9 Wood-balance in Kerala during 1987-88 (in million m3 round wood equivalent)
District Produc tion31 Domestic Differ- consumption ence
Thiruvananthapuram Kollam Pathanamthitta Alappuzha Kot tayam Idukki Ernakulam - Thr issur Pa 1 akkadu Malappuram Kozhikodu Wayanad Kannur Kasaragod
1.108 0.732 0.602 0.470 0.877 1.323 0.754 0.940 1.672 1.430 1.199 0.663 1.532 0.990
1.402 1.315 0.560 0.930 1.001 0.568 1.629 1.647 1.133 1.189 1.401 0.299 1.094 0.402
( - ) 0.294 (-) 0..583
0.042 (-) 0.460 (-) 0.124
0.755 (-10.875 (-) 0.707
0.539 0.241
(-)0.202 0.364 0.438 0.588
Total Kerala 14.292 14.570 (-) 0.278*
*The net import of wood to Kerala during 1987-88 was 0.278 million .
51The district-wise break- up of production of wood (the lower limit for forests and estates) other than that from homesteads is arrived at as follows: The production of wood from forests is distributed in proportion to the area under forests in different districts. wood production from estates is distributed on the basis of area of rubber replanted and other plantations in different districts respectively. The production of wood fran homesteads (the upper limit) in each district is allocated at the same proportion as the distribution of growing stock in districts.
24
and non-wood materials comes to 7.172 million m3 fuelwood equivalent. Even when excluding the contribution of coconut to the ter t iary sector, this is 69.8 .per cent of the combined production of fuelwood and charcoal from al l other t rees and all sources in Kerala put together. The importance of trees in homesteads, particularly coconut, in the wood economy of Kerala is thus very obvious.
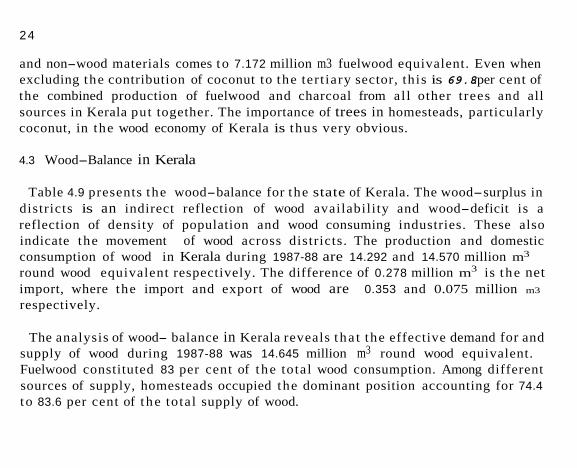
4.3 Wood-Balance in Kerala
Table 4.9 presents the wood-balance for the state of Kerala. The wood-surplus in districts is an indirect reflection of wood availability and wood-deficit is a reflection of density of population and wood consuming industries. These also indicate the movement of wood across districts. The production and domestic consumption of wood in Kerala during 1987-88 are 14.292 and 14.570 million m3
round wood equivalent respectively. The difference of 0.278 million m3 is t he net import, where the import and export of wood are 0.353 and 0.075 million m3
respectively.
The analysis of wood- balance in Kerala reveals t ha t the effective demand for and supply of wood during 1987-88 was 14.645 million m3 round wood equivalent. Fuelwood constituted 83 per cent of t he total wood consumption. Among different sources of supply, homesteads occupied the dominant position accounting for 74.4 t o 83.6 per cent of t he total supply of wood.

25
Growing stock of t rees in number and volume and t he species preference in homesteads of Kerala a re analysed in th i s section. Palms other than coconut a r e not included in t he growing stock of t rees . Neither are t rees in plantat ions of rubber, coffee, tea and cardamom.
5.1 Growing Stock of Trees
Tables 5.1 presents t he number of trees in t he growing stock in homesteads during 1988-89. The estimated to ta l number of t rees i s 443.165 million of which trees below 10 cm dbh account for 42.91 per cent. When coconut palms are excluded trees in t he lowest class comes t o 54.63 per cent of t he to ta l number. While trees above 30
Table 5.1 Number of trees i n t h e growing s tock i n homesteads of Kerala during 1988-89
(number i n '000)
Diameter a t b r ea s t height ( i n cm) Trees Tota l
(10 10-20 20-30 30-40 40-50 50-60 60-70 70-80 >80
- - - - - - co 52 - 94920 - 94920
M2
M3
M4
T1
T2
T3
T4
ACE
11550
19700
87456
14069
9869
9242
29970
7860
8624
12856
42322
5607
7901
8007
17877
150
5837
5908
12126
1709
3475
1870
3790
30
3146
2497
2652
376
1347
242
919
0
(21.47) 1699 938 195 67 50 32106
(7.26) 1191 560 216 70 100 43098
(9.75) 937 208 116 28 0 145845
(32 - 98) 148 15 0 0 5 2192'
(4.96) 588 423 114 7 12 23736
(5.37) 84 24 4 5 0 19478
(4.40) 226 160 50 8 13 53013
(11.99) 0 0 0 0 0 8040
(1.82)
Total 189716 103344 129665 11179 4873 2328 695 185 180 442165 (42.91)*(23.37) (29.32) (2.53) (1.10) (0.53) (0.16) (0.04) (0.04) (100.00)
CO stands for coconut palms, M2 for jack, M3 for mango, tamarind, gooseberry, etc., M4 for cashew, breadfruit, guava, etc., Tl for teak, rosewood and sandal, T2 for anjily, chadachy, i r u l , etc., T3 for kanjiram, manjakadmbu, thanni, etc., T4 for matty, mullilavu,ezhilampala etc., ACE for Acacia auriculiformis, Casuarina and Eucalypts. For complete list see Appendix_17.*The figures in parentheses are percentages to total.
52Include only those coconut palms above 5years old which have stem wccd. The average diameter of coconut palm is assumed t o be i n 20-30 cm class.

26
cm dbh account.for only 4.4 per cent of the total number, new plantings of trees (less than 10 cm dbh) other than coconut palms account for 54.63 per cent. This shows that efforts are being made at the homestead level in planting of trees.
The volume of growing stock of treers in total volume is estimated as 104.248 million m3 overbark including volume of branch wood above 10 cm girth. The commercial volume is estimated as 28.526 million m3 underbark (see Tables 5.2 and 6.3). The commercial volume accounts for 27.4 per cent of the total volume. The remaining 72.6 per cent is the growing stock of fuelwood. However, commercial volume also includes volume of trees with only fuelwood value, when felled, such as tamarind.
5.2 Species preference
Trees with multiple uses account for 71 per cent of the total number of trees, 81 per cent of the total volume overbark of all trees and 83 per cent of the total commercial volume (see Tables 5.1, 5.2 and 5.3). Also among trees above 60 cm dbh, trees providing multiple benefits constitute 74 per cent of the total number, 83 per cent of the total volume overbark of all trees and 85 per cent of total
Table 5.2 Total volume of growing stock of trees in homesteads of Kerala during 1988-89
(volume i n '000 m3 overbark including branch wood of lOcm and above g i r t h )
Diameter a t breast height ( i n cm) Trees Total
(10 10-20 20-30 30-40 40-50 50-60 60-70 70-80 >80
co M2
M3
M4
T1
T2
T3
T4
ACE
-
46
79
350
56
39
37
120
33
-
1509
2250
7406
981
1383
1401
3129
26
34171
2422
2576
6801
767
1568
951
1974
18
-
3072
2469
2845
372
1290
248
1009
0
-
3484
2417
1784
266
986
164
450
0
-
3126
1834
609
45
1061
73
513
0
-
968
1060
529
0
407
17
242
0
-
447
455
164
0
33
27
51
0
-
489
908
0
38
98
0
107
0
34171 (32.78) 15563 (14.93) 14048 (13.48) 20488 (19.66) 2525 (2.42) 6865 (6.58) 2918 (2.80) 7595 (7.28)
75 (0.07)
Total 758 18085 51248 11305 9551 7261 3223 1177 1640 104248 !0.73)* (17.34) (49.16) (10.84) (9.16) (6.97) (3.09) (1.23) (1.57) (100.00)
Figcres in p a r e n t h e s e s a r e p e r c e n t a g e s t o t o t a l .

27
Table 5.3 Commercial volume of growing stock of trees in homesteads of Kerala during 1988-89
(volume in '000 m3 underbark)
Diameter at breast height (in cm) Trees Total ( % I
20-30 30-40 40-50 50-60 60-70 74-80 >80
co 6834 M2 817 M3 844 M4 1941 T1 406 T2 475 T3 285 T4 616 ACE 4
Total 12222 (%I 42.85
0 1605 1274 1352 144 390 122 519 0
5406 18.95
0 1767 1220 863 112 318 80 232 0
4592 16.10
0 1586 921 284 18 367 34 280 0
3490 12.23
0 0 0 477 222 236 512 219 440 216 67 0 0 0 20
157 14 39 7 11 0
114 25 40 0 0 0
1483 558 775 5.20 1.95 2.72
6834 23.96 6710 23.52 5430 19.02 4723 16.55 700 2.45 1760 6.17 539 1.90 1826 . 6.41
4 0.02
28526 100.00
commercial volume. These indicate the preference for planting and maintaining trees having multiple uses. Such a marked preference for multiple-use trees can be seen in every district (see Appendices 9.10 and 11). Trees such as Acacia auriculiformis, Casuarina equisetifolia and Eucalypts account only for 1.82 per cent of the total number, 0.07 per cent of the total volume of all trees and 0.02 per cent of the total commercial volume. Timber and multiple-use trees in the high value classes contribute to the timber supply and those in the low value classes contribute to both timber and fuelwood supply.
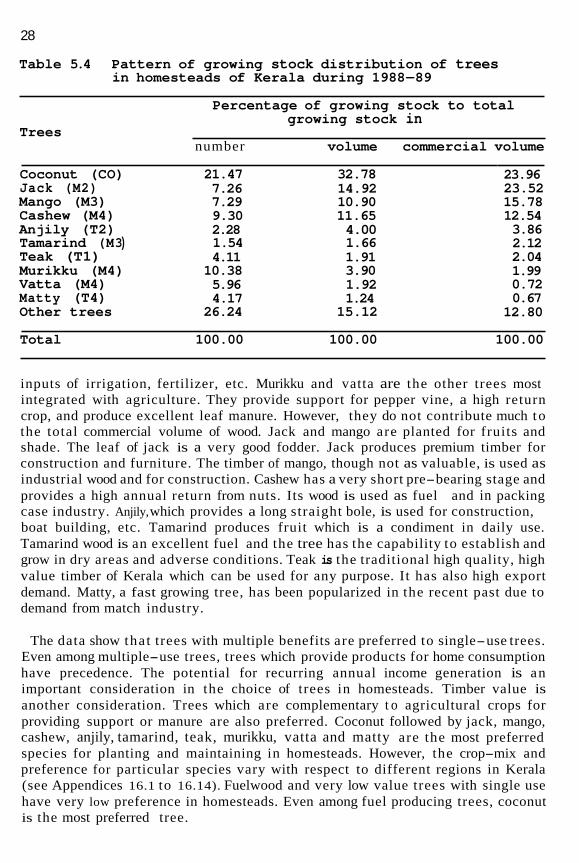
5.3 Pattern of Growing Stock Distribution
The pattern of growing stock distribution of trees in the homesteads of Kerala gives a very interesting picture of the preference for different trees for planting by households (see Table 5.4 and Appendices 12, 13, and 14). Just 10 species account for 74 per cent of total number, 85 per cent of total wood volume and 87 per cent of the commercial timber volume of trees in homesteads. Among the species, the prominent position of coconut is very clearly brought out. It may be recalled that coconut provides about 28 per cent of total timber consumption and about 16 per cent of the total fuelwood consumption. When non-wood fuel from coconut is also considered, the contribution of coconut is 69.8 per cent of the total consumption of fuelwood and charcoal from all other trees and all sources put together even when excluding the contribution of coconut to the tertiary sector in the state. After a pre-bearing stage of about 6 years, the continuous production of nut for home consumption and sale and continuous production of fuel in the form of leaf, sheath, husk, shell, etc. for over 60 years are important advantages. Coconut combines the benefits of an agricultural crop and a tree in the sense tha t even a low input passive management brings in a fair return while it is very responsive to increased
28
Table 5.4 Pattern of growing stock distribution of trees in homesteads of Kerala during 1988-89
Percentage of growing stock to total growing stock in
Trees number volume commercial volume
Coconut (CO) 21.47 32.78 Jack (M2) 7.26 14.92 Mango (M3) 7.29 10.90 Cashew (M4) 9.30 11.65 Anjily (T2) 2.28 4.00 Tamarind (M3 ) 1.54 1.66 Teak (T1) 4.11 1.91 Murikku (M4) 10.38 3.90 Vatta (M4) 5.96 1.92 Matty (T4) 4.17 1.24 Other trees 26.24 15.12
23.96 23.52 15.78 12.54 3.86 2.12 2.04 1.99 0.72 0.67
12.80
Total 100.00 100.00 100.00
inputs of irrigation, fertilizer, etc. Murikku and vatta are the other trees most integrated with agriculture. They provide support for pepper vine, a high return crop, and produce excellent leaf manure. However, they do not contribute much to the total commercial volume of wood. Jack and mango are planted for fruits and shade. The leaf of jack is a very good fodder. Jack produces premium timber for construction and furniture. The timber of mango, though not as valuable, is used as industrial wood and for construction. Cashew has a very short pre-bearing stage and provides a high annual return from nuts. Its wood is used as fuel and in packing case industry. Anjily, which provides a long straight bole, is used for construction, boat building, etc. Tamarind produces fruit which is a condiment in daily use. Tamarind wood is an excellent fuel and the tree has the capability to establish and grow in dry areas and adverse conditions. Teak is the traditional high quality, high value timber of Kerala which can be used for any purpose. It has also high export demand. Matty, a fast growing tree, has been popularized in the recent past due to demand from match industry.
The data show that trees with multiple benefits are preferred to single-use trees. Even among multiple-use trees, trees which provide products for home consumption have precedence. The potential for recurring annual income generation is an important consideration in the choice of trees in homesteads. Timber value is another consideration. Trees which are complementary t o agricultural crops for providing support or manure are also preferred. Coconut followed by jack, mango, cashew, anjily, tamarind, teak, murikku, vatta and matty are the most preferred species for planting and maintaining in homesteads. However, the crop-mix and preference for particular species vary with respect to different regions in Kerala (see Appendices 16.1 to 16.14). Fuelwood and very low value trees with single use have very low preference in homesteads. Even among fuel producing trees, coconut is the most preferred tree.
29
In this section future trends in the demand and supply of wood in Kerala a re examined. Based on the present (1987-88) data, forecasting is attempted for three time points namely 1994-1995, 1999-2000 and 2004-2006. Several constraints, particularly the absence of t ime series da ta on demand and supply of wood in Kerala. have necessitated the use of certain assumptions which are explained in the appropriate places. The forecasts give only a general indication of t he possible range in the fu ture demand for wood by various sectors and supply from different sources in t he State.
6.1 Future Trend8 in the Demand for Wood
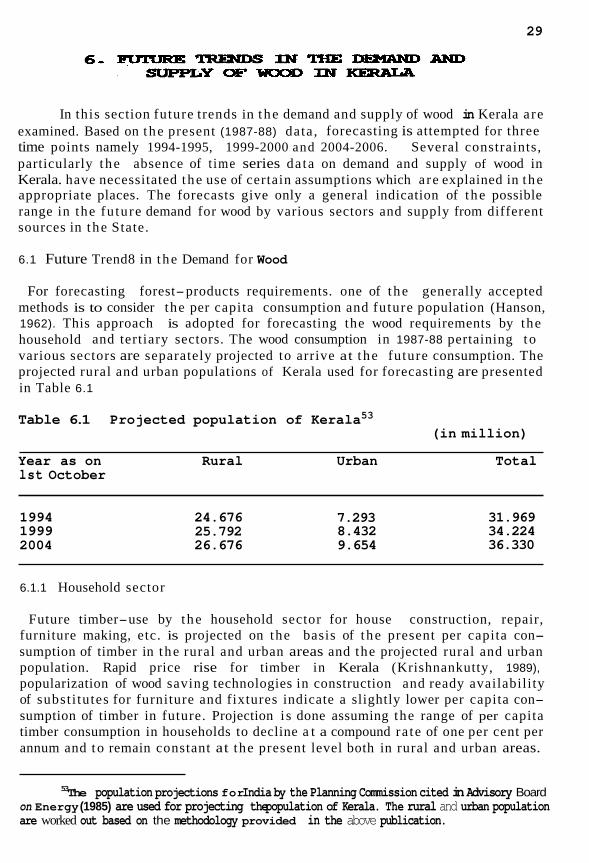
For forecasting forest-products requirements. one of t he generally accepted methods is to consider the per capita consumption and future population (Hanson, 1962). This approach is adopted for forecasting the wood requirements by the household and tertiary sectors. The wood consumption in 1987-88 pertaining to various sectors are separately projected to arrive at t he future consumption. The projected rural and urban populations of Kerala used for forecasting are presented in Table 6.1
Table 6.1 Projected population of Kerala53 (in million)
Year as on Rural Urban Total lst October
1994 1999 2004
24.676 25.792 26.676
7.293 8.432 9.654
31.969 34.224 36.330
6.1.1 Household sector
Future timber-use by the household sector for house construction, repair, furniture making, etc. is projected on the basis of t he present per capita con- sumption of timber in t he rural and urban areas and the projected rural and urban population. Rapid price rise for timber in Kerala (Krishnankutty, 1989), popularization of wood saving technologies in construction and ready availability of subst i tutes for furniture and fixtures indicate a slightly lower per capita con- sumption of timber in future. Projection i s done assuming the range of per capita timber consumption in households to decline a t a compound ra te of one per cent per annum and to remain constant at the present level both in rural and urban areas.
53The population projections for India by the Planning Commission cited in Advisory Board on Energy (1985) are used for projecting the population of Kerala. The rural and urban population are worked out based on the methodology provided in the above publication.
30
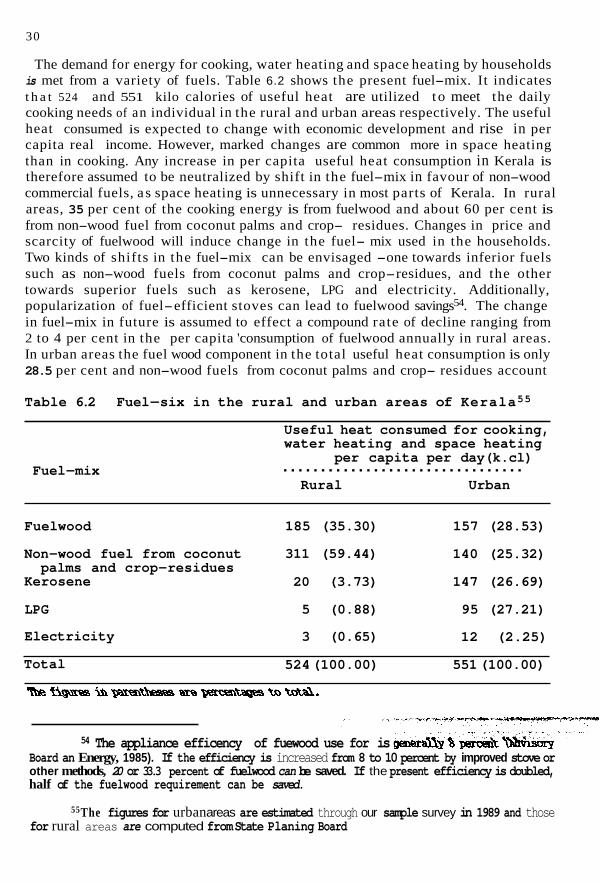
The demand for energy for cooking, water heating and space heating by households is met from a variety of fuels. Table 6.2 shows the present fuel-mix. It indicates t h a t 524 and 551 kilo calories of useful heat are utilized t o meet the daily cooking needs of an individual in the rural and urban areas respectively. The useful heat consumed is expected to change with economic development and rise in per capita real income. However, marked changes are common more in space heating than in cooking. Any increase in per capita useful heat consumption in Kerala is therefore assumed to be neutralized by shift in the fuel-mix in favour of non-wood commercial fuels, a s space heating is unnecessary in most parts of Kerala. In rural areas, 35 per cent of the cooking energy is from fuelwood and about 60 per cent is from non-wood fuel from coconut palms and crop- residues. Changes in price and scarcity of fuelwood will induce change in the fuel- mix used in the households. Two kinds of shifts in the fuel-mix can be envisaged -one towards inferior fuels such as non-wood fuels from coconut palms and crop-residues, and the other towards superior fuels such as kerosene, LPG and electricity. Additionally, popularization of fuel-efficient stoves can lead to fuelwood savings54. The change in fuel-mix in future is assumed to effect a compound rate of decline ranging from 2 to 4 per cent in the per capita 'consumption of fuelwood annually in rural areas. In urban areas the fuel wood component in the total useful heat consumption is only 28.5 per cent and non-wood fuels from coconut palms and crop- residues account
Table 6.2 Fuel-six in the rural and urban areas of Kerala55
Useful heat consumed for cooking, water heating and space heating
per capita per day(k.cl) ................................ Fuel-mix Rural Urban
Fuelwood 185 (35.30) 157 (28.53)
Non-wood fuel from coconut 311 (59.44) 140 (25.32)
Kerosene 20 (3.73) 147 (26.69) palms and crop-residues
LPG 5 (0.88) 95 (27.21)
Electricity 3 (0.65) 12 (2.25)
Total 524 (100.00) 551 (100.00)
54 The appliance efficency of fuewood use for is Board an Energy, 1985). If the efficiency is increased from 8 to 10 percent by improved stove or other methods, 20 or 33.3 percent of fuelwood can be saved. If the present efficiency is doubled, half of the fuelwood requirement can be saved.
55The figures for urban areas are estimated through our sample survey in 1989 and those for rural areas are computed from State Planing Board (1986).

31
for 25 per cent. The same type of shift in fuel-mix as in rural areas is expected in urban areas also. Further, kerosene and LPG are increasingly available and used in urban areas. Future trend in their supply is crucial to fuel shifts. Considering an annual increase of 6 to 10 per cent in the supply of LPG56, 5 per cent increase per annum in the supply of kerosene in Kerala and the effects of shift in the fuel-mix and popularization of fuel-efficient stoves, decline in the per capita fuelwood consumption ranging from 3 to 5 per cent compound rate per annum in urban areas is expected in the coming years. The fuelwood consumption by the households is projected on the basis of the projected rural and urban population and the assumed level of per capita fuelwood consumption in rural and urban areas.
6.1.2 Industries sector
Wood-use in the industries sector is not expected to increase substantially as government supplies from forest areas has declined drastically. Several industries are switching over from wood to other forms of packing materials and several industrial units are shifting to neighbouring s ta tes due to various reasons. Fuelwood and charcoal requirements in industries depend largely on the type of industry and processing involved, and hence in Kerala the scope of substitution between fuelwood and alternative formn of fuel is rather limited. Growth of number of industrial units using fuelwood and or charcoal is not expected to continue as in the past. The net effect of these processes is expected to decrease wood consumption by industries in Kerala. However, increasing imports of wood to Kerala may prevent the drastic fall in industrial timber consumption. Therefore the range of wood consumption in the industries sector57 in future is assumed to be constant at the present level and to increase by a compound rate of one per cent per annum.
6.1.3 Tertiary sector
The forecast of timber-use in the tertiary sector is based on two factors. One, increase in consumption due to increased commercial activities and two, decline in consumption due to substitution of wood owing to disproportionate increase in price of wood in relation to its substitutes such as cement, steel, aluminum, etc. It is therefore expected tha t in the tertiary sector both will almost cancel out leaving a range of per capita timber consumption constant and a possible decline of one per cent per annum in future. With regard to the future consumption of fuelwood in tea- shops and restaurants, the present per capita consumption is assumed to decline at tho same rate in the rural and urban areas similar to those in the household sector
56The LPG supplied by the Indian Oil Corporation in Kerala has increased by 8.3 percent compound per annum during the period 1986-87 to 1988-89.
57For projecting the consumption of wood by industries,the annual reqirement of the two pulp and paper industries which were not functioning during 1987-88 are added to the quantity of
wood consumed by idustries in the reference year.

32
as mentioned earlier58. The trend of per capita consumption of charcoal in the tertiary sector is assumed to range from the current level to a decline of 1 per cent and 2 per cent in rural and urban areas respectively, Most of this charcoal is used in tea shops for boiling water in samovar which has little substitutes. Fuelwood for cooking in non-commercial establishments such as hostels, hospitals, jails, temples, etc. and in road construction is assumed to decline at a range of 2 to 4 per cent compound per capita per annum due to substitution and fuel saving effects.
6.1.4 Export
The trend in the exports of timber from Kerala during 1980-81 to 1987-88 shows a compound rate of decline59 of 20.67 per cent per annum (see Appendix 7 ) . The range of exports in future is expected to continue at the above rate and to remain at the current level.
Table 6.3 Projected demand for wood in Kerala (range in million m3 round wood equivalent)
Years .................................................... Sectors 2004-05 1994-95 1999-2000
Household Fuel 5.019 t o 5.833 4.261 to 5.521 3.569 to 5.166
Timber & poles 1.143 to 1.226 1.145 to 1.292 1.137 to 1.349
Industries Fuel 2.042 to 2.189 2.042 to 2.301 2.042 to 2.418
Indust r ia l rood 1.241 t o 1.331 1.241 to 1.398 1.241 to 1.470
Tert iary F u e l ' 3.603 to 4.115 3.311 to 4.151 3.031 to 4.166
Timber & poles 0.229 to 0.246 0.231 to 0.260 0.231 to 0.274
Export Timber & poles 0.015 to 0.075 0.005 to 0.075 0.001 to 0.075
Total fuel 10.664 to 12.137 9.614 to 11.973 8.642 to 11.750
Total non-fuel 2.628 to 2.878 2.622 to 3.025 2.610 to 3.168
Total wood 13.292 to 15.015 12.236 to 14.998 11.252 to 14.918
5 8 D e c l i n e i n fuelwood consmption is assumed considering a shift from fuelwood to fuel from coconut and cropresidues and increase in the use of commercial fuels such as LPG and kerosene.
5 9 Time series data from 7 major exit points were analyzed. The estimated equation is 1og E = 12.~1.:r)~).23ki.oi), 1.0.80 where E export of timber and t the years.

33
The projected demand for wood in Kerala for t he years 1994-95, 1999-2000 and 2004-05 is presented in Table 6.3.
6.2 Future Rends in t h e Supply of Wood
Supply of wood in Kerala from different sources is projected for t he same years as for the demand projection based on the lower l imi t of wood production for forests and estates , upper l imi t for homesteads and keeping imports same for the year 1987-88.
6.2.1 Homesteads
The methodology adopted for projecting the availability of wood from homesteads i s as follows. To estimate the annual volume increment of trees in homesteads, volume of trees in different diameter class are tabulated and the total volume of trees in each diameter class is divided by the estimated average age of trees in each class, and then aggregated. Average age of trees ,in each diameter class is calculated by dividing the mid girth of each class with the mean annual girth increment which was calculated from FRI & Colleges (1980 and 1983). The range of mean annual girth increment in different species for different ages w a s reported as 7.2 cm to 1.7 cm. The mean annual girth increment used in the present study takes 5 and 6 cm for the diameter class below 20 cm based on the relative rates of growth. For dbh classes 20-30, 30-50, 50-70 and above 70 cm, mean annual girth increment of 5, 4,3 and 2 cm are taken respectively. For coconut, the mean annual volume increment is assumed as 0.02 m3 per tree. The estimated annual volume increment of the growing stock during 1988-89 is 6.293 million m3 which accounts for 6.037 per cent of the growing stock of trees in homesteads. The wood production from homesteads during 1987-88 was 11.916 million m3 which represents 10.258 per cent of the growing stock60. Two scenarios using different rates of volume increment and production are presented. For the lower limit of wood production the current increment rate of 6.037 per cent is expected to increase by 3 per cent per annum to 9.688 per cent in 2004-05 and the current rate of wood production which i s 10.258 per cent is expected to decline by 4 per cent per annum to 5.125 per cent in 2004-05. For the upper limit of production, the current increment rate is expected to increase by 4 per cent to 11.307 per cent in 2004-05 and the ra te of wood production is expected also to rise by 1 per cent t o 12.149 per cent of the current level in 2004-05. The f irs t scenario implies t ha t the growing stock of wood in homesteads would approximate the current level in 2004-05 (ie., from 104 a t present to 103 million m3 then). The second scenario implies t ha t the growing stock is depleted to 54 million m3 in 2004-05. Additionally, availability of fuelwood from fallen branches and pruned materials from trees other than coconut i s expected to range from the level of 1987-88 to decline at the ra te of 2 per cent per annum in future considering change in the age composition of trees.
60The production of wood, excluding the Quantity of fuelwood obtained from pruned and fallen materials from trees,from homesteads during 1987-88 was 11.916 million n! which account for 10.258 percent of the growing stock of the estimated 116.164 million m' in 1987-88 which is the sum of the growing stock in 1988-89 and production during 1987-88.
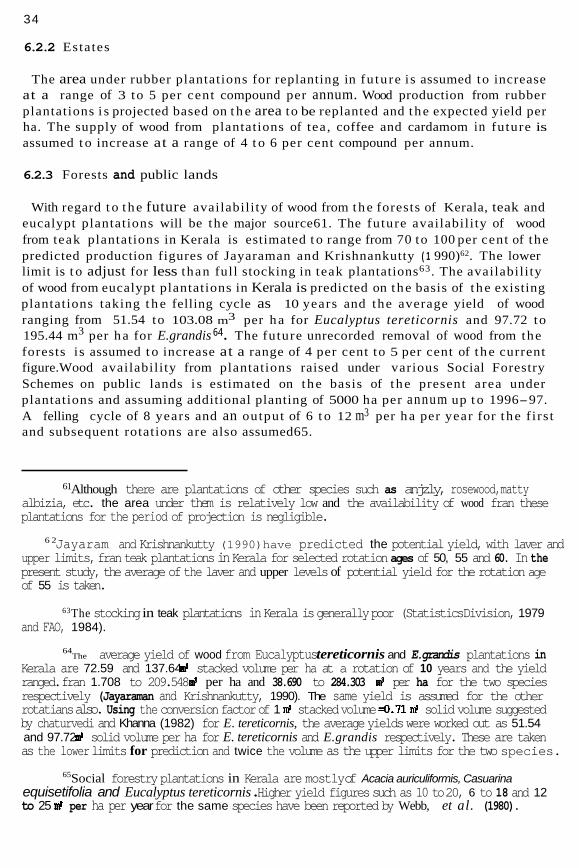
34
6.2.2 Estates
The area under rubber plantations for replanting in fu ture is assumed to increase at a range of 3 to 5 per cent compound per annum. Wood production from rubber plantations i s projected based on t h e area to be replanted and the expected yield per ha. The supply of wood from plantations of tea, coffee and cardamom in future is assumed t o increase at a range of 4 t o 6 per cent compound per annum.
6.2.3 Forests and public lands
With regard t o t he future availability of wood from the forests of Kerala, teak and eucalypt plantations will be the major source61. The future availability of wood from teak plantations in Kerala is estimated t o range from 70 to 100 per cent of the predicted production figures of Jayaraman and Krishnankutty ( 1 990)62. The lower limit is t o adjust for less than full stocking in teak plantations63. The availability of wood from eucalypt plantations in Kerala is predicted on the basis of t he existing plantations taking t h e felling cycle as 10 years and the average yield of wood ranging from 51.54 to 103.08 m3 per ha for Eucalyptus tereticornis and 97.72 to 195.44 m3 per ha for E.grandis 64 . The future unrecorded removal of wood from the forests is assumed t o increase at a range of 4 per cent to 5 per cent of t he current figure.Wood availability from plantations raised under various Social Forestry Schemes on public lands i s estimated on the basis of t he present area under plantations and assuming additional planting of 5000 ha per annum up t o 1996-97. A felling cycle of 8 years and an output of 6 t o 12 m3 per ha per year for t he f i rs t and subsequent rotations are also assumed65.
61Although there are plantations of other species such as anjzly, rosewood,matty albizia, etc. the area under them is relatively low and the availability of wood fran these plantations for the period of projection is negligible.
6 2 Jayaram and Krishnankutty (1990)have predicted the potential yield, with laver and upper limits, fran teak plantations in Kerala for selected rotation ages of 50, 55 and 60. In the present study, the average of the laver and upper levels of potential yield for the rotation age of 55 is taken.
63The stocking in teak plantations in Kerala is generally poor (Statistics Division, 1979 and FAO, 1984).
64The average yield of wood from Eucalyptus tereticornis and E.grandis plantations in
Kerala are 72.59 and 137.64 m' stacked volume per ha at a rotation of 10 years and the yield ranged. fran 1.708 to 209.548 m' per ha and 38.690 to 284.303 m' per ha for the two species respectively (Jayaraman and Krishnankutty, 1990). The same yield is assumed for the other rotatians also. Using the conversion factor of 1 m' stacked volume 4 . 7 1 m' solid volume suggested by chaturvedi and Khanna (1982) for E. tereticornis, the average yields were worked out as 51.54 and 97.72 Id solid volume per ha for E. tereticornis and E.grandis respectively. These are taken as the lower limits for prediction and twice the volume as the upper limits for the two species.
65Social forestry plantations in Kerala are mostly of Acacia auriculiformis, Casuarina equisetifolia and Eucalyptus tereticornis . Higher yield figures such as 10 to 20, 6 to 18 and 12 to 25 8d per ha per year for the same species have been reported by Webb, et al. (1980).
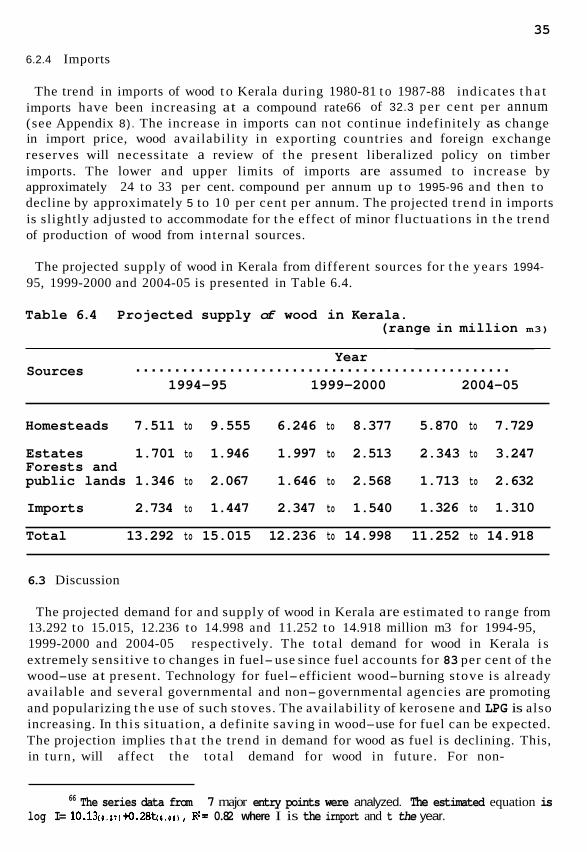
35
6.2.4 Imports
The trend in imports of wood t o Kerala during 1980-81 t o 1987-88 indicates t h a t imports have been increasing at a compound rate66 of 32.3 per cent per annum (see Appendix 8). The increase in imports can not continue indefinitely as change in import price, wood availability in exporting countries and foreign exchange reserves will necessitate a review of t he present liberalized policy on timber imports. The lower and upper limits of imports are assumed to increase by approximately 24 to 33 per cent. compound per annum up t o 1995-96 and then to decline by approximately 5 to 10 per cent per annum. The projected t rend in imports is slightly adjusted to accommodate for t he effect of minor fluctuations in t he trend of production of wood from internal sources.
The projected supply of wood in Kerala from different sources for t h e years 1994- 95, 1999-2000 and 2004-05 is presented in Table 6.4.
Table 6.4 Projected supply of wood in Kerala. (range in million m3)
~~~
Year ................................................ Sources 1994-95 1999-2000 2004-05
Homesteads 7.511 to 9.555 6.246 to 8.377 5.870 to 7.729
Estates 1.701 to 1.946 1.997 to 2.513 2.343 to 3.247 Forests and public lands 1.346 to 2.067 1.646 to 2.568 1.713 to 2.632
Imports 2.734 to 1.447 2.347 to 1.540 1.326 to 1.310
Total 13.292 to 15.015 12.236 to 14.998 11.252 to 14.918
6.3 Discussion
The projected demand for and supply of wood in Kerala are estimated t o range from 13.292 to 15.015, 12.236 to 14.998 and 11.252 to 14.918 million m3 for 1994-95, 1999-2000 and 2004-05 respectively. The total demand for wood in Kerala i s extremely sensitive to changes in fuel-use since fuel accounts for 83 per cent of t he wood-use at present. Technology for fuel-efficient wood-burning stove is already available and several governmental and non-governmental agencies are promoting and popularizing t h e use of such stoves. The availability of kerosene and LPG is also increasing. In th i s situation, a definite saving in wood-use for fuel can be expected. The projection implies t h a t t he trend in demand for wood as fuel is declining. This, in turn, will affect the total demand for wood in future. For non-
66 The series data from 7 major entry points were analyzed. The estimated equation is log I= 10.1~0.~,)+0.28tr(.(l,, Rz= 0.82 where I is the irnport and t the year.
36
fuel wood such as construction timber, industrial wood, etc., no decline in demand is anticipated.
The supply from forests is expected to increase due t o large areas of plantations raised in various Social Forestry Schemes, teak plantations and the earlier industrial plantations of eucalypts which are due for felling during the period of projection. The production of wood from non-forest plantations, particularly rubber,, is also expected to increase. But the wood production from homesteads is expected to decline. This is even af te r providing for a n increase over time in volume increment of the growing stock in homesteads. The increment can be improved by intensifying planting and by ensuring the survival of seedlings and saplings. The largest proportion of trees in the lowest diameter class in t he distribiition of trees in homesteads (Table 5.1 in section 5) i s a positive indicator of the interest shown by households for regenerating the stock of tree crops. The potential for increasing the growing stock of wood is very high if the survival rate of the existing seedling and sapling crop i s improved. The effect of improving survival can contribute to increasing growing stock faster than new planting activities since the young trees are already established and no additional investment i s required.
Imports, both from other states in India and from foreign countries, a re expected to increase conspicuously in t he medium te rm and decline in the long term. However, even in 2004-05 the level of imports will be much higher than the present. The existing international market for timber i s very favourable for importing countries. Even India imports substant ial quanti ty of timber from tropical countries as far away as Brazil, Papua New Guinea, etc. and from Malaysia. The liberal import policy of India also contributes t o the prospects of rise in imports in the medium term.
The total quantities of demand and supply in the years of projection are shown a s identical. This is due to inclusion of projections of exports and imports also in the analysis.

37
Demand for wood by various sectors and supply from different sources in Kerala for t he year 1987-88, growing stock of tree crops and species preference in homesteads are summarized below. Future t rends in t h e demand and supply of wood are also indicated.
The effective demand for wood in Kerala during 1987-88 i s estimated as 14.645 million m3 round wood equivalent. Of t he demand, household sector accounted for 50 per cent and ter t iary sector for 28.3 per cent followed by industries sector, 21.2 per cent. Export accounted for only a small quanti ty (0.6 per cent). Wood used a s fuel accounted for 83 per cent of t he to ta l demand for wood and as timber, industrial wood and poles for 17 per cent . Of t he supply of wood from different sources, homesteads in Kerala accounted for 74.4 t o 83.6 per cent. Estates contributed 9.3 to 11.8 per cent of t h e total supply and imports 2.4 per cent. Supply of wood from forests including plantations and illicit felling accounted for only 4.7 to 11.4 per cent although t h e recorded production from forests was only 1.9 percent of the total supply. The wood-balance in Kerala shows t h a t t he production and domestic consumption of wood are 14.292 and 14.570 million m3 round wood equivalent respectively and the difference of 0.278 million m3 was the ne t imports.
Total number of trees in homesteads excluding t h a t in plantations and palms other than coconut is estimated as 442 million in 1988-89. Coconut palms constituted 21.5 per cent of t he to ta l number. Trees in t he lowest diameter class accounted for 55 per cent of t he total number of trees which shows t h a t efforts are being made a t t he homestead level in planting trees. Multiple use t rees such as coconut, jack, mango, cashew and tamarind are t h e most preferred species for planting in homesteads. Anji ly, t eak and matty are the species preferred among trees grown exclusively for wood. However, t he crop-mix and preference for particular species vary with respect to different regions.
Projections for t he fu ture indicate t h a t t h e likely supply-demand disparity can be neutralized by increasing fuel efficiency in wood-burning stoves, economising timber-use in construction, reducing consumption of wood by substitution and by increasing imports. Accelerated depletion of growing stock of wood in homesteads and estates can also increase production in t he short run.
One of the important functions of forests is to provide wood. Rut forests in Kerala accounted for only 4.7 to 11.4 per cent of t he to ta l supply during 1987-88. I t is now possible to consider t he option of conserving the remaining natural forests a s t he supply of wood from forests is not critical in t he total supply. However, t he potential t ha t exist for achieving drastic increases in production from plantations and public lands by improving stocking, etc. should be exploited. Homesteads provided 74.4 t o 83.6 per cent of the total supply of wood during 1987-88. Rut wood-resources in homesteads may continue to be depleted. Therefore, i t is essential to improve the survival of the young trees which are already established and to promote planting of multiple-use t rees in homesteads and fallow lands for enhancing the s tock of wood-resources for the future.

38
Although the outlook for supply and demand for wood in Kerala is no t alarming, i t is important to augment t he growing stock of wood to avoid depletion of a resource which has several environmental benefits also. Increasing the stock of wood is not easy in the short run. But considering t h a t wood saved is wood produced, vas t potential exis ts for economising wood-use byincreasing t h e efficiency of wood- burning stoves and by appropriate design innovations in construction which should be utilized t o t he fullest extent in the short run.
39
Advisory Board on Energy 1985. Towards a perspective on energy demand and supply in India in 2004-05. Government of India, New Delhi.
Central Building Research Inst i tute ,Roorkee 1985. Manpower and material requirements in residential buildings. Building research note 3 1
Chandrasekharan, C. 1973. Forest resources of Kerala: A quanti tat ive assessment. Kerala Forest Department, Thiruvananthapuram
Chacko, K.C.,Sankar, S.,Pandalai, R.C. and Nandakumar, U.N. 1989. Studies on the effect of slash burning on planting s i te for teak. KFRI Research report No. 61, Kerala Forest Research Inst i tute , Peechi.
Chaturvedi, A. N. and Khanna, L. S 1982. Forest mensuration. International Book Distributors, Dehra Dun.
Department of Economics and Statistics (formerly Bureau of-) 1975. Agricultural s tat is t ics in Kerala. Government of Kerala, Thiruvananthapuram.
Department of Economics and Statistics 1986. State income and related aggregates of Kerala,1983-84. Government of Kerala, Thiruvananthapuram.
Department of Economics and Stat is t ics 1987. Report on Economic Census 1980. Government of Kerala, Thiruvananthapuram
Department of Economics and Statistics 1988a. Statistics for planning 1988. Government of Kerala, Thiruvananthapuram
Department of Economics and Statistics 1988b. Brochure on housing stat is t ics 1987.Government of Kerala, Thiruvananthapuram.
Department of Factories and Boilers 1984. Lis t of factories a s on 31st December 1982. Government of Kerala, Thiruvananthapuram .
Department of Factories and Boilers 1987. Division-wise l is t of registered (2m) factories in Kerala. Government of Kerala, Government Press, Ernakulam.
F.A.O. 1979. Yearbook of Serest products 1966-1977, Rome.
F.A.O. 1984. Intensive multiple-use forest management in Kerala. FA0 Forestry Paper 53
Forestry Commission 1965. Conversion tables for research workers in forestry and agriculture. Booklet No.5

4 0
FRI & Colleges 1970. Growth and yield s tat is t ics of common Indian timber species,Volume-11. Dehra Dun.
FRI & Colleges 1980. The Silviculture of Indian Trees, Vol.11. Controller of Publica tions. New Delhi.
FRI & Colleges 1983. The Silviculture of Indian Trees. Vol.IV. Controller of Publications, New Delhi.
Cnanaharan, R. and Dhamodaran, T.K. 1988. Comparison of wilt-diseased and non-diseased (overaged) coconut stem wood with respect to their utilization potential. Kerala Forest Research Institute, Peechi.
Government of India 1984. Census of India 1981. Directorate of census operations, Kerala.
Hanson, A. G. 1962. Method of forecasting demand of forest products. Forestry and Timber Bureau, Canberra.
Haridasan. V. and Sreenivasan, K. G.1985. Rubber wood: A study of supply and demand in India. Rubber Board Bulletin, V01.20, No.4, pp 19-21.
Hindustan Newsprint Limited 1988. 5th Annual Report 1987-88, Newsprint Nagar, Kot tayam.
Jayaraman, K. and Krishnankutty, C. N. 1990. Data bank for forestry sector in Kerala. KFRI Research Report No.66, Kerala Forest Research Institute, Peechi.
Kerala Forest Department 1956-57 to 1981 -82. Administration report (various issues). Government of Kerala, Thiruvananthapuram
Kerala Forest Department 1985. Administration report for the year 1982-83. Government of Kerala, Government Press, Ernakulam.
Kerala Forest Department 1986. Administration report for t he year 1983-84. Government of Kerala, Government Press, Ernakulam.
Kerala Forest Department 1987a. Administration report for the year 1984-85, Government of Kerala, Government Press, Ernakulam.
Kerala Forest Department 1987b. Administration report for the year 1985-86. Government of Kerala, Government Press, Ernakulam.
Kerala Forest Department 1987-88. Administration report for the year 1987-88 (mimeo). Government of Kerala, Thiruvananthapuram .
Kerala Forest Department 1988a. Administration report for the year 1986-87. Government of Kerala, Government Press, Ernakulam.

41
Kerala Forest Department 1988b. Forest s ta t i s t i cs 1988. Government of Kerala, Thiruvananthapuram .
Krishnankutty. C. N. 1989. Long-term price trend of timber in Kerala. Indian Journal of Forestry, Vol. 12(1), 7-12.
Krishnankutty, C.N.,Rugmini, P. and Rajan, A. R. 1985. Analysis of factors influencing timber prices in Kerala. KFRI Research Report No.34, Kerala Forest Research Inst i tute , Peechi.
Muraleedharan, P.K., Rugmini,P. and Nair, C.T.S. 1984. A preliminary assessment of t he consumption of wood in Kerala (mimeo). K F R I, Peechi.
Nair, N.R.1971. Commercial volume tables for t he forest t rees of Kerala. Kerala Forest Department, Thiruvananthapuram.
Nair, C.T.S. and Krishnankutty, C.N. 1987. Socio-economic factors influencing farm forestry: A case s tudy of t ree cropping in t he homesteads in Kerala, India. In Community forestry: socio-economic aspects. Edited by Rao, Y.R., Vergara, N.T., and Lovelace, G .W. F.A.O. and East-West Center, Bangkok.
Nazma., Ganapathy, P.M., Sasidharan, N. , Bhat, K. M. and Gnanaharan, R. 1981. Ahandbook of Kerala timbers. Research Report No. 9, KFRI, Peechi.
Sasidharan, N. 1987. Forest Trees of Kerala: A checklist with a n index t o important exotic. KFRI Handbook 1, Kerala Forest Research Inst i tute , Peechi.
S ta te Land Use Board 1980. Land resources and land use in Kerala. Government of Kerala, Thiruvananthapuram .
State Planning Board 1985. Rural roads in Kerala. Government of Kerala, Thiruvananthapuram .
State Planning Board 1986. Rural energy generation and use pat tern: Southern Kerala. Government of Kerala, Thiruvananthapuram .
Sta te Planning Board 1989. Economic Review 1988. Government of Kerala, Thiruvananthapuram .
Statistics Division 1979. Yield from teak piantatiohs in Kerala (mimeo). Kerala Forest Research Inst i tute , Peechi
Thampi, K. B. 1983. Pat terns of domestic energy consumption in rural Kerala: Ast udy of selected villages. M.Phil Dissertation, C D S , Thiruvananthapuram.
Webb, D.B., Wood, P.J. and Smith, J . 1980 A guide t o species selection for tropical and subtropical plantations. Department of Forestry, Commonwealth Forestry Inst i tute , University of Oxford.
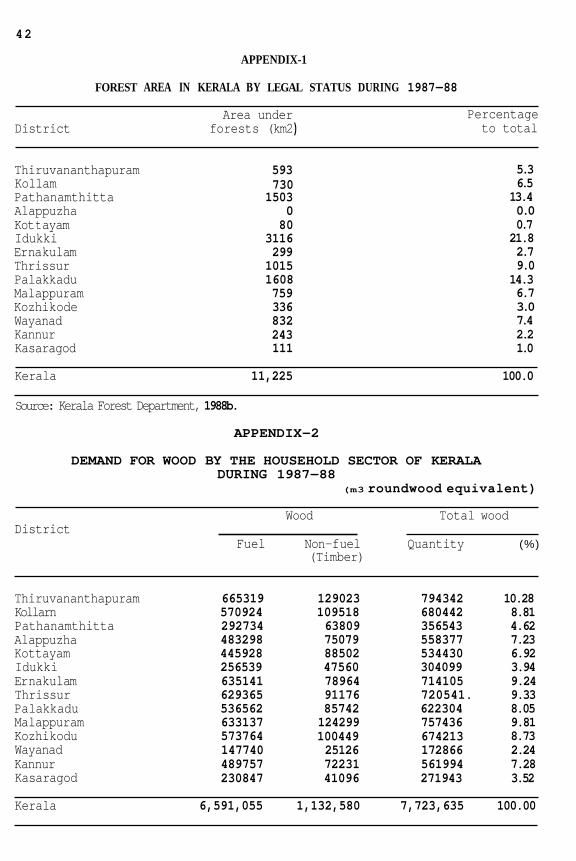
42
APPENDIX-1
FOREST AREA IN KERALA BY LEGAL STATUS DURING 1987-88
Area under Percentage District forests (km2 ) to total
Thiruvananthapuram Kollam Pathanamthitta Alappuzha Kot t ayam Idukki Er na kul am Thrissur Palakkadu Malappuram Kozhi kode Wayanad Kannur Kasaragod
593 730 1503
0 80
3116 299 1015 1608 759 336 832 243 111
5.3 6.5 13.4 0.0 0.7 21.8 2.7 9.0 14.3 6.7 3.0 7.4 2.2 1.0
Kerala 11,225 100.0
Source: Kerala Forest Department, 1988b.
APPENDIX-2
DEMAND FOR WOOD BY THE HOUSEHOLD SECTOR OF KERALA DURING 1987-88
(m3 roundwood equivalent)
Wood Total wood District
Fuel Non-f uel Quantity (%) (Timber)
Thiruvananthapuram Kollarn Pathanamthitta Alappuzha Kottayam Idukki Er nakul am Thrissur Palakkadu Malappuram Kozhi kodu Wayanad Kannur Kasaragod
665319 570924 292734 483298 445928 256539 635141 629365 536562 633137 573764 147740 489757 230847
129023 109518 63809 75079 88502 47560 78964 91176 85742 124299 100449 25126 72231 41096
794342 680442 356543 558377 534430 304099 714105 720541. 622304 757436 674213 172866 561994 271943
10.28 8.81 4.62 7.23 6.92 3.94 9.24 9.33 8.05 9.81 8.73 2.24 7.28 3.52
Kerala 6,591,055 1,132,580 7,723,635 100.00
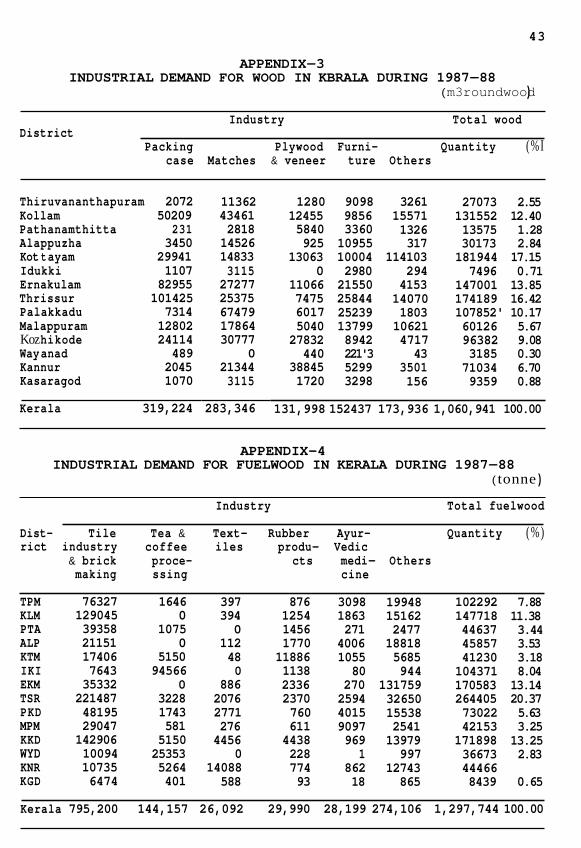
43
APPENDIX-3 INDUSTRIAL DEMAND FOR WOOD IN KBRALA DURING 1987-88
( m3roundwood )
Industry Total wood District
Packing Plywood Furni- Quantity (%I case Matches & veneer ture Others
Thiruvananthapuram 2072 Kollam 50209 Pathanamthitta 231 Alappuzha 3450 Kot t ayam 29941 Idukki 1107 Ernakulam 82955 Thrissur 101425 Palakkadu 7314 Malappuram 12802 Koz hi kode 24114 Way anad 489 Kannur 2045 Kasaragod 1070
Kerala 319,224
11362 43461 2818 14526 14833 3115 27277 25375 67479 17864 30777
0 21344 3115
283,346
1280 12455 5840 925
13063 0
11066 7475 6017 5040 27832 440
38845 1720
9098 9856 3360 10955 10004 2980 21550 25844 25239 13799 8942 221'3 5299 3298
3261 15571 1326 317
114103 294 4153 14070 1803 10621 4717 43
3501 156
27073 2.55 131552 12.40 13575 1.28 30173 2.84 181944 17.15 7496 0.71
147001 13.85 174189 16.42 107852' 10.17 60126 5.67 96382 9.08 3185 0.30 71034 6.70 9359 0.88
131,998 152437 173,936 1,060,941 100.00
APPENDIX-4 INDUSTRIAL DEMAND FOR FUELWOOD IN KERALA DURING 1987-88
( tonne )
Industry Total fuelwood
Dist- Tile Tea & Text- Rubber Ayur- Quantity ( % ) rict industry coffee iles produ- Vedic
making ssing cine & brick proce- cts medi- Others
TPM 76327 1646 397 876 3098 19948 102292 7.88 KLM 129045 0 394 1254 1863 15162 147718 11.38 PTA 39358 1075 0 1456 271 2477 44637 3.44 ALP 21151 0 112 1770 4006 18818 45857 3.53 KTM 17406 5150 48 11886 1055 5685 41230 3.18 IKI 7643 94566 0 1138 80 944 104371 8.04 EKM 35332 0 886 2336 270 131759 170583 13.14 TSR 221487 3228 2076 2370 2594 32650 264405 20.37 PKD 48195 1743 2771 760 4015 15538 73022 5.63 MPM 29047 581 276 611 9097 2541 42153 3.25 KKD 142906 5150 4456 4438 969 13979 171898 13.25 WYD 10094 25353 0 228 1 997 36673 2.83 KNR 10735 5264 14088 774 862 12743 44466 3.43 KGD 6474 401 588 93 18 865 8439 0.65
Kerala 795,200 144,157 26,092 29,990 28,199 274,106 1,297,744 100.00

44
APPENDIX-5 INDUSTRIAL DEMAND FOR CHARCOAL IN KERALA DURING 1987-88
(tonne)
Industry Total charcoal District
Textile Rubber Hand Others Quantity (%) mills goods t oo1s
Thiruvananthapuram KO 1 1 am Pathanarnthitta Alappuzha Kot tayam Idukki Ernakulam Thrissur
Kozhi kode Wayanad Kannur Kasaragod
2133 3 0 1 1 0
5167 98 11 16
1544 0
9891 89
639 260 115 215 990 181 301 636 140 538 474 64 216 23
186 215 1
126 41 20 158 116 1728 51 1 0 40 21
419 1232 696 2136 2059 1455 2059 3441 5765 1876 1319 7 44 1291 1009
3377 6.50 1710 3.29 812 1.56 2478 4.77 3091 5.95 1656 3.19 7685 14.79 4291 8.26 7644 14.71 2481 4.78 3338 6.42 808 1.56
11438 22.02 1142 2.20
Kerala 18,954 4,792 2,704 25,501 51,951 100.00
APPENDIX-6 DEMAND FOR WOOD BY THE TERTIARY SECTOR* OF KERALA DURING 1987-88
(m3 roundwood equivalent)
Fuel Non-f uel Total wood Distr ict (timber,
Fuelwood Charcoal Quantity (%)
Thiruvananthapurarn 327640 Kollam 226625 Pathanamthitta 95049 Alappuzha 205335 Kot t ayam 160511 Idukki 80474 Er nakulam 376588 Thrissur 287076 Palakkadu 203692 Malappuram 230974 Kozhi kode 288157 Wayanad 57258 Kannur 251671. Kasar agod 78365
117738 85188 35916 76248 59220 30768 138828 103956 72330 80718 104658
95802 27885
15918
19642 18541 10535 13329 17099 11921 17917 20182 16358 25438 21594 5016 15608 9873
465020 330354 141500 294912 236830 123163 533333 411214 292380 3318130 414409
78192 3 6 3 08 I 116727
11.24 7.98 3.42 7.12 5.72 2.98 12.89 9.93 7.06 8.17 10.01 1.89 8.77 2.82
ll_-___l-
Kerala 2,870.016 1,045,176 2 2 4,O 5 3 4,139,245 100.00
*Tertiary sector includes all-wood using agencies other than households and industries
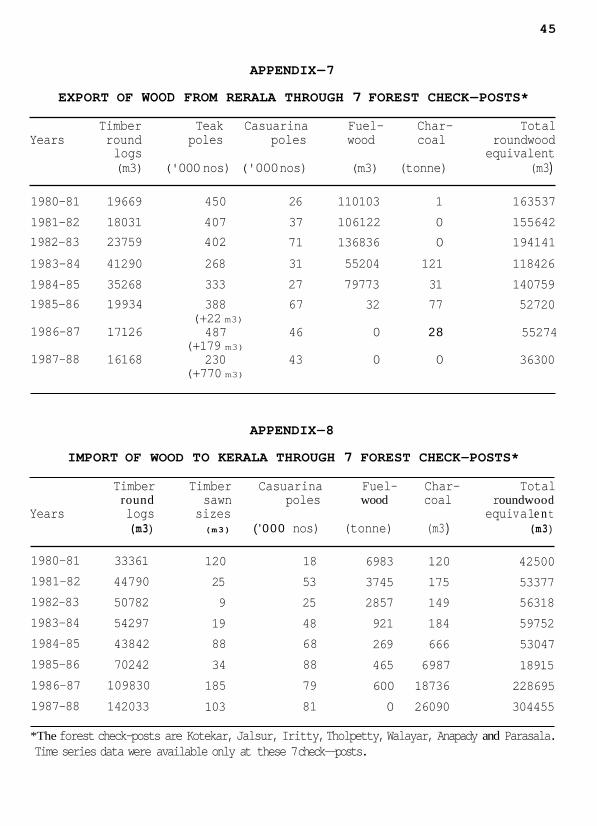
45
APPENDIX-7
EXPORT OF WOOD FROM RERALA THROUGH 7 FOREST CHECK-POSTS*
Timber Teak Casuarina Fuel- Char- Total Years round poles poles wood coal r oundwood
logs equivalent (m3) ('000 nos) ('000 nos) (m3) (tonne) (m3 )
1980-81 19669 450 26 110103 1 163537 1981-82 18031 407 37 106122 0 155642
71 136836 0 194141 1982-83 23759 402
1983-84 41290 268 31 55204 121 118426 1984-85 35268 333 27 79773 31 140759 1985-86 19934 388 67 32 77 52720
1986-87 17126 487 46 0 28 55274
1987-88 16168 230 43 0 0 36300
(+22 m3)
(+179 m3)
(+770 m3)
APPENDIX-8
IMPORT OF WOOD TO KERALA THROUGH 7 FOREST CHECK-POSTS*
Timber Timber Casuarina Fuel- Char- Total round sawn poles wood coal r oundw oo d
Years logs sizes equ i v a 1 e n t (m3 ) (m3) ( '000 nos) (tonne) (m3 ) (m3 )
1980-81 1981-82 1982-83 1983-84 1984-85 1985-86
1986-87 1987-88
33361 44790 50782 54297 43842 70242 109830
142033
120 25 9 19 88
34 185
103
18 53 25 48 68 88
79 81
6983 120 3745 175 2857 149 921 184 269 666 465 6987 600 18736 0 26090
42500 53377 56318 59752 53047
18915 228695 304455
*The forest check-posts are Kotekar, Jalsur, Iritty, Tholpetty, Walayar, Anapady and Parasala. Time series data were available only at these 7 check--posts.
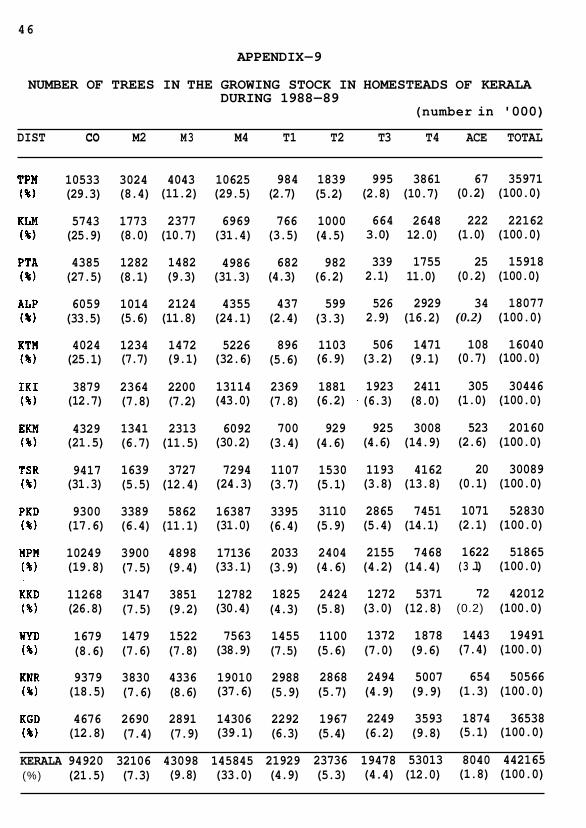
46
APPENDIX- 9
NUMBER OF TREES IN THE GROWING STOCK IN HOMESTEADS OF KERALA DURING 1988-89
(number in '000)
DIST co M2 M3 M4 T1 T2 T3 T4 ACE TOTAL
10533 3024 4043 10625 984 1839 995 3861 67 35971 (29.3) (8.4) (11.2) (29.5) (2.7) (5.2) (2.8) (10.7) (0.2) (100.0)
5743 1773 2377 6969 766 1000 (25.9) (8.0) (10.7) (31.4) (3.5) (4.5)
4385 1282 1482 4986 682 982 (27.5) (8.1) (9.3) (31.3) (4.3) (6.2)
6059 1014 2124 4355 437 599 (33.5) (5.6) (11.8) (24.1) (2.4) (3.3)
4024 1234 1472 5226 896 1103
664 2648 222 22162 3.0) 12.0) (1.0) (100.0)
339 1755 25 15918 2.1) 11.0) (0.2) (100.0)
526 2929 34 18077 2.9) (16.2) (0.2) (100.0)
506 1471 108 16040 (25.1) (7.7) (9.1) (32.6) (5.6) (6.9) (3.2) (9.1) (0.7) (100.0)
3879 (12.7)
2364 2200 (7.8) (7.2)
13114 (43.0)
2369 (7.8)
1881 (6.2)
1923 2411 (6.3) (8.0)
305 30446 (1.0) (100.0)
523 20160 (2.6) (100.0)
4329 (21.5)
1341 2313 (6.7) (11.5)
6092 (30.2)
700 (3.4)
929 (4.6)
925 3008 (4.6) (14.9)
9417 (31.3)
1639 3727 (5.5) (12.4)
7294 (24.3)
1107 (3.7)
1530 (5.1)
1193 4162 (3.8) (13.8)
20 30089 (0.1) (100.0)
9300 (17.6)
3389 5862 (6.4) (11.1)
16387 (31.0)
3395 (6.4)
3110 (5.9)
2865 7451 (5.4) (14.1)
1071 52830 (2.1) (100.0)
10249 (19.8)
3900 4898 (7.5) (9.4)
17136 (33.1)
2033 (3.9)
2404 (4.6)
2155 7468 (4.2) (14.4)
1622 51865 (3 .l) (100.0)
1272 5371 (3.0) (12.8)
72 42012 (0.2) (100.0)
11268 (26.8)
3147 3851 (7.5) (9.2)
12782 (30.4)
1825 (4.3)
2424 (5.8)
1679 (8.6)
1479 1522 (7.6) (7.8)
7563 (38.9)
1455 (7.5)
1100 (5.6)
1372 1878 (7.0) (9.6)
1443 19491 (7.4) (100.0)
9379 (18.5)
3830 4336 (7.6) (8.6)
19010 (37.6)
2988 (5.9)
2868 (5.7)
2494 5007 (4.9) (9.9)
654 50566 (1.3) (100.0)
1874 36538 (5.1) (100.0)
4676 (12.8)
2690 2891 (7.4) (7.9)
14306 (39.1)
2292 (6.3)
1967 (5.4)
2249 3593 (6.2) (9.8)
KERALA 94920 32106 43098 145845 21929 23736 19478 53013 8040 442165 (%) (21.5) (7.3) (9.8) (33.0) (4.9) (5.3) (4.4) (12.0) (1.8) (100.0)

4 7
APPENDIX-10
TOTAL VOLUME OF GROWING STOCK OF TREES IN HOMESTEADS OF KERALA DURING 1988-89
(volume in '000 m3 overbark including branchwood of 10 cm and above girth)
DIST co M2 M3 M4 T 1 T2 T3 T4 ACE TOTAL
TPM (%)
KLM ( % )
PTA ( % )
ALP ( % )
KTM ( % )
I K I (%)
EKM (%)
TSR ( % )
PKD (%)
MPM ( % )
KKD (%)
WYD ( % )
KNR ( % )
KGD ( % )
3792 1331 1235 1585 142 506 130 520 2 9243 (41.0) (14.4) (13.4) (17.1) (1.5) (5.5) (1 .4) (5.7) (0.0) (100.0)
2067 (38.7)
1579 (41.3)
2181 (49.8)
1449
803 15.0)
572 15.0)
453 10.4)
582 (33.1) (13.3)
1396 1299 (19.0) (17.7)
1558 (32.4)
3390 (45.2)
3348 (26.8)
3689 (32.8)
4057 (40.6)
604
695 14.4)
807 10.7)
1752 14.0)
1801 16.0)
1448 14.5)
720
683 934 101 12.8) (17.5) (1.9)
410 567 82 10.7) (14.9) (2.1)
689 485 40 15.9) (11.1) (0.9)
910 665 98
326 97 328 3 6.1) (1.8) (6.1) (0.1)
352 49 211 1 9.2) (1.3) (5.5) (0.0)
107 87 331 1 2.4) (2.0) (7.5) (0.0)
381 70 219 1
5342 100.0)
3823 100.0)
4383 100.0)
4375 20.8) (15.3) (2.2) (8.6) (1.6) (5.1) (0.0) (100.0)
740 2338 274 597 251 438 7 7340 10.1) (31.9) (3.7) (8.1) (3.4) (6.0) (0.1) (100.0)
827 805 92 17.2) (16.7) (1.9)
1224 879 118 16.3) (11.7) (1.6)
2154 17.2)
1356 12.0)
1027 10.3)
476 (16.0) (19.0) (12.6)
3377 1948 1391 (27.9) (16.1) (11.5)
1684 1352 917
2490 334 20.0) (2.7)
2062 274 18.4) (2 .4)
1676 217 16.8) ( 2 . 2 )
943 145 25.0) (3.8)
3011 352 24.9) (2.9)
2048 256
236 4.8)
340 4.5)
782 6.3)
722 6.4)
738 7.4)
320 8.5)
890 7.4)
568
158 (3.3)
180 (2.4)
425 (3 .4)
375 (3.3)
173 (1.7)
228 (6.0)
345 (2.8)
350
442 3 4846 (9.2) (0 .1) (100.0)
573 0 7511 (7.6) (0.0) (100.01
1196 9 12490 (9.5) (0 .1) (100.0)
964 1 2 11255 (8 .6) (0.1) (100.0)
663 4 10003 (6 .5) (0.0) (100.0)
339 9 3784 (8 .9) (0.2) (100.0)
766 9 12089 (6.4) (0.1) (100.0)
605 1 4 7794 (21.6) (17.3) (11.8) (26.3) (3.3) (7.3) (4.5) (7.7) (0.2) (100.0)
KERALA 34171 15563 14048 20488 2525 6865, 2918 7595 75 104248 ( % ) (32.7) (15.0) (13.5) (19.6) (2.4) (6.6) (2.8) (7.3) (0.1) (100.0)
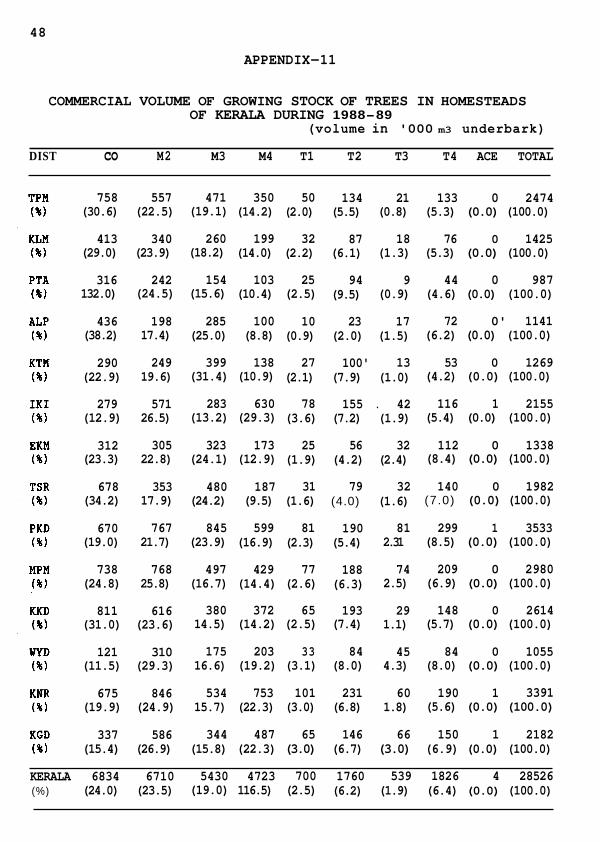
48
APPENDIX-11
COMMERCIAL VOLUME OF GROWING STOCK OF TREES IN HOMESTEADS OF KERALA DURING 1988-89
(volume in '000 m3 underbark)
DIST co M2 M3 M4 T1 T2 T3 T4 ACE TOTAL
758 557 471 350 50 134 21 133 0 2474 (30.6) (22.5) (19.1) (14.2) (2.0) (5.5) (0.8) (5.3) (0.0) (100.0)
413 340 260 199 32 87 18 76 0 1425 (29.0) (23.9) (18.2) (14.0) (2.2) (6.1) (1.3) (5.3) (0.0) (100.0)
316 242 154 103 25 94 9 44 0 987 132.0) (24.5) (15.6) (10.4) (2.5) (9.5) (0.9) (4.6) (0.0) (100.0)
436 (38.2)
290 (22.9)
279 (12.9)
312 (23.3)
678 (34.2)
670 (19.0)
738 (24.8)
198 17.4)
249 19.6)
571 26.5)
305 22.8)
353 17.9)
285 100 (25.0) (8.8)
399 138 (31.4) (10.9)
283 630 (13.2) (29.3)
323 173 (24.1) (12.9)
480 187 (24.2) (9.5)
10 (0.9)
27 (2.1)
78 (3.6)
25 (1.9)
31 (1.6)
23 (2.0)
100' (7.9)
155 (7.2)
56 (4.2)
79 (4.0)
767 845 599 81 190 21.7) (23.9) (16.9) (2.3) (5.4)
768 497 429 77 188 25.8) (16.7) (14.4) (2.6) (6.3)
380 372 65 193 811 616 (31.0) (23.6)
121 310 (11.5) (29.3)
675 846 (19.9) (24.9)
337 586
14.5) (14.2) (2.5) (7.4)
175 203 33 84 16.6) (19.2) (3.1) (8.0)
534 753 101 231 15.7) (22.3) (3.0) (6.8)
344 487 65 146
17 (1.5)
13 (1.0)
. 42 (1.9)
32 (2.4)
32 (1.6)
81 2.31
74 2.5)
29 1.1)
45 4.3)
60 1.8)
66
72 0' 1141 (6.2) (0.0) (100.0)
53 0 1269 (4.2) (0.0) (100.0)
116 1 2155 (5.4) (0.0) (100.0)
112 0 1338 (8.4) (0.0) (100.0)
140 0 1982 (7.0) (0.0) (100.0)
299 1 3533 (8.5) (0.0) (100.0)
209 0 2980 (6.9) (0.0) (100.0)
148 0 2614 (5.7) (0.0) (100.0)
84 0 1055 (8.0) (0.0) (100.0)
190 1 3391 (5.6) (0.0) (100.0)
150 1 2182 (15.4) (26.9) (15.8) (22.3) (3.0) (6.7) (3.0) (6.9) (0.0) (100.0)
KERALA 6834 6710 5430 4723 700 1760 539 1826 4 28526 (%) (24.0) (23.5) (19.0) 116.5) (2.5) (6.2) (1.9) (6.4) (0.0) (100.0)

49
APPENDIX-12
NUMBER OF IMPORTANT TREES IN THE GROWING STOCK IN HOMESTEADS OF KERALA DURING 1988-89
(number in '000)
Diameter at breast height (in cm) Trees Total
<10 10-20 20-30 30-40 40-50 50-60 60-70 70-80 >80 (%)
Coconut -
Murikku 30434
Cashew 14700
Mango 13641
Jack 11549
Vatta 17999
Tamarind 4040
Teak 11776
Matty 13240
Anjily 4132
Other 68205 trees
- 94920
13034 2053
15109 8207
10168 4672
8624 5837
7362 899
1454 730
4638 1368
4658 356
2415 1672
35882 8951
- -
287 58
1959 857
1983 961
3146 1699
89 12
314 155
262 112
114 25
892 480
2133 514
- -
30 0
155 116
445 190
939 195
5 0
71 , 26
4 0
17 11
369 109
293 48
-
0
21
56
67
0
14
0
0
14
13
- 94920 (21.47)
0 45896 (10.38)
0 41124 (9.30)
98 32214 (7.29)
50 32106 (7.26)
0 26366 (5.96)
1 6805 (1 .54)
0 18160 (4.11)
0 18421 (4.17)
0 10083 (2.28)
31 116070 (26.25)
Total 189716 103344 129665 11179 4873 2328 695 185 180 442165 (%) (42.91) (23.37) (29.32) (2.53) (1.10) (0.53) (0.16) (0.04) (0.04) (100.00)
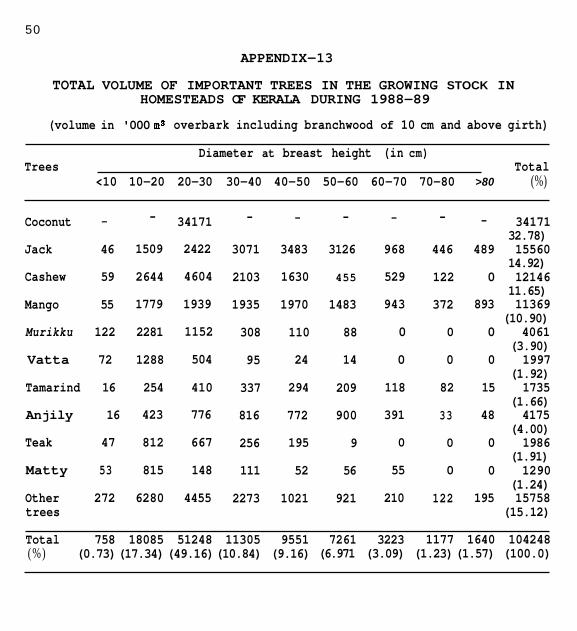
50
APPENDIX-13
TOTAL VOLUME OF IMPORTANT TREES IN THE GROWING STOCK IN HOMESTEADS OF KERALA DURING 1988-89
(volume in '000 m3 overbark including branchwood of 10 cm and above girth)
Diameter at breast height (in cm) Trees Total
<10 10-20 20-30 30-40 40-50 50-60 60-70 70-80 >80 (%)
Coconut -
Jack 46
Cashew 59
Mango 55
Murikku 122
Vatta 72
Tamarind 16
Anjily 16
Teak 47
Matty 53
Other 272 trees
-
1509
2644
1779
2281
1288
254
423
812
815
6280
34171
2422
4604
1939
1152
504
410
776
667
148
4455
-
3071
2103
1935
308
95
337
816
256
111
2273
-
3483
1630
1970
110
24
294
772
195
52
1021
-
3126
455
1483
88
14
209
900
9
56
921
-
968
529
943
0
0
118
391
0
55
210
-
446
122
372
0
0
82
33
0
0
122
- 34171 32.78)
489 15560 14.92)
0 12146 11.65)
893 11369 (10.90)
0 4061 (3.90)
0 1997 (1.92)
15 1735 (1.66)
48 4175 (4.00)
0 1986 (1.91)
0 1290 (1.24)
195 15758 (15.12)
Total 758 18085 51248 11305 9551 7261 3223 1177 1640 104248 (%) (0.73) (17.34) (49.16) (10.84) (9.16) (6.971 (3.09) (1.23) (1.57) (100.0)
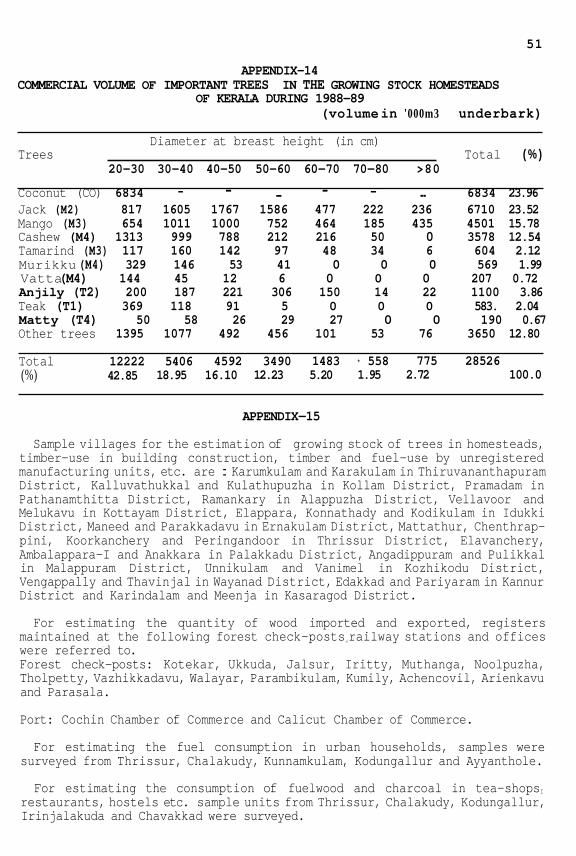
51
APPENDIX-14
OF KERALA DURING 1988-89 COMMERCIAL VOLUME OF IMPORTANT TREES IN THE GROWING STOCK HOMESTEADS
(volume in '000m3 underbark)
Diameter at breast height (in cm) Trees Total ( % )
20-30 30-40 40-50 50-60 60-70 70-80 >80
Coconut (CO) 6834 - - I - - .. 6834 23.96 Jack (M2) 817 1605 1767 1586 477 222 236 6710 23.52 Mango (M3) 654 1011 1000 752 464 185 435 4501 15.78 Cashew (M4) 1313 999 788 212 216 50 0 3578 12.54 Tamarind (M3) 117 160 142 97 48 34 6 604 2.12 Murikku (M4) 329 146 53 41 0 0 0 569 1.99 Vatta (M4) 144 45 12 6 0 0 0 207 0.72 Anjily (T2) 200 187 221 306 150 14 22 1100 3.86 Teak (T1) 369 118 91 5 0 0 0 583. 2.04 Matty (T4) 50 58 26 29 27 0 0 190 0.67 Other trees 1395 1077 492 456 101 53 76 3650 12.80
Total 12222 5406 4592 3490 1483 * 558 775 28526 (%) 42.85 18.95 16.10 12.23 5.20 1.95 2.72 100.0
APPENDIX-15
Sample villages for the estimation of growing stock of trees in homesteads, timber-use in building construction, timber and fuel-use by unregistered manufacturing units, etc. are : Karumkulam and Karakulam in Thiruvananthapuram District, Kalluvathukkal and Kulathupuzha in Kollam District, Pramadam in Pathanamthitta District, Ramankary in Alappuzha District, Vellavoor and Melukavu in Kottayam District, Elappara, Konnathady and Kodikulam in Idukki District, Maneed and Parakkadavu in Ernakulam District, Mattathur, Chenthrap- pini, Koorkanchery and Peringandoor in Thrissur District, Elavanchery, Ambalappara-I and Anakkara in Palakkadu District, Angadippuram and Pulikkal in Malappuram District, Unnikulam and Vanimel in Kozhikodu District, Vengappally and Thavinjal in Wayanad District, Edakkad and Pariyaram in Kannur District and Karindalam and Meenja in Kasaragod District.
For estimating the quantity of wood imported and exported, registers maintained at the following forest check-postsfrailway stations and offices were referred to. Forest check-posts: Kotekar, Ukkuda, Jalsur, Iritty, Muthanga, Noolpuzha, Tholpetty, Vazhikkadavu, Walayar, Parambikulam, Kumily, Achencovil, Arienkavu and Parasala.
Port: Cochin Chamber of Commerce and Calicut Chamber of Commerce.
For estimating the fuel consumption in urban households, samples were surveyed from Thrissur, Chalakudy, Kunnamkulam, Kodungallur and Ayyanthole.
For estimating the consumption of fuelwood and charcoal in tea-shopsI
restaurants, hostels etc. sample units from Thrissur, Chalakudy, Kodungallur, Irinjalakuda and Chavakkad were surveyed.
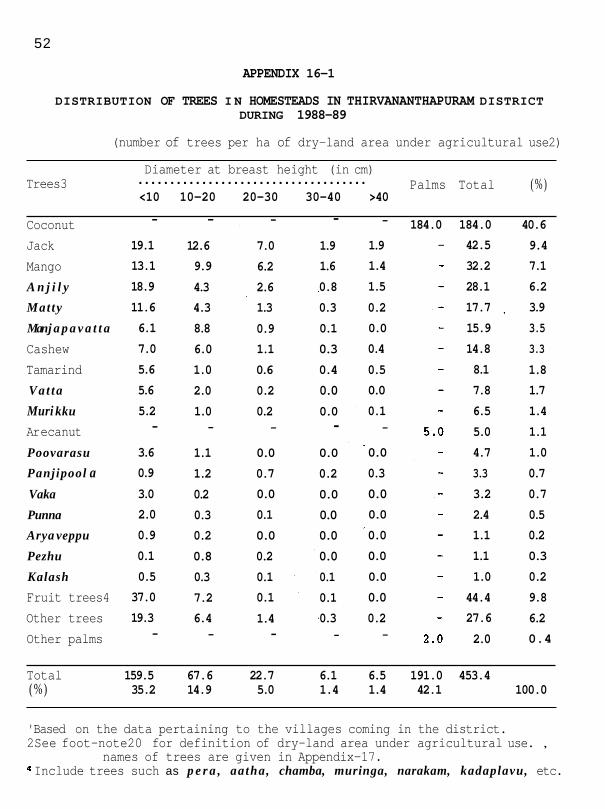
52
APPENDIX 16-1
DISTRIBUTION OF TREES I N HOMESTEADS IN THIRVANANTHAPURAM DISTRICT DURING 1988-89
(number of trees per ha of dry-land area under agricultural use2)
Diameter at breast height (in cm) Palms Total ( % ).................................... Trees3
<10 10-20 20-30 30-40 >40
184.0 184.0 40.6 Coconut Jack Mango A n j i l y
Mat ty
Man j a p a v a t t a
Cashew Tamarind Vat ta
Muri kku
Ar ecanu t Poovarasu
Panjipool a Vaka
Punna
Arya veppu
Pezhu
Kalash
Fruit trees4 Other trees Other palms
- 19.1 13.1 18.9 11.6 6.1 7.0 5.6 5.6 5.2
- 3.6 0.9 3.0 2.0 0.9 0.1 0.5 37.0 19.3
-
- 12.6 9.9 4.3 4.3 8.8 6.0 1.0 2.0 1.0
-
1.1 1.2 0.2 0.3 0.2 0.8 0.3 7.2 6.4
-
- 7.0 6.2 2.6 1.3 0.9 1.1 0.6 0.2 0.2
-
0.0 0.7 0.0 0.1 0.0 0.2 0.1 0.1 1.4
-
- 1.9 1.6 0.8 0.3 0.1 0.3 0.4 0.0 0.0
- 0.0
0.2 0.0 0.0 0.0 0.0 0.1 0.1 0.3
-
-
1.9 1.4 1.5 0.2 0.0
0.4 0.5 0.0 0.1
-
0.0 0.3 0.0 0.0
0.0 0.0 0.0
0.0 0.2
-
42.5 32.2 28.1 17.7 15.9 14.8 8.1 7.8 6.5 5.0 4.7 3.3 3.2 2.4 1.1 1.1 1.0
44.4 27.6 2.0
9.4 7.1 6.2 3.9 3.5 3.3
1.8 1.7 1.4 1.1 1.0 0.7 0.7 0.5 0.2 0.3 0.2 9.8 6.2 0.4
Total 159.5 67.6 22.7 6.1 6.5 191.0 453.4 ( % ) 35.2 14.9 5.0 1.4 1.4 42.1 100.0
'Based on the data pertaining to the villages coming in the district. 2See foot-note20 for definition of dry-land area under agricultural use. , 3Botanical names of trees are given in Appendix-17. Include trees such as p e r a , aatha, chamba, muringa, narakam, kadaplavu, etc.
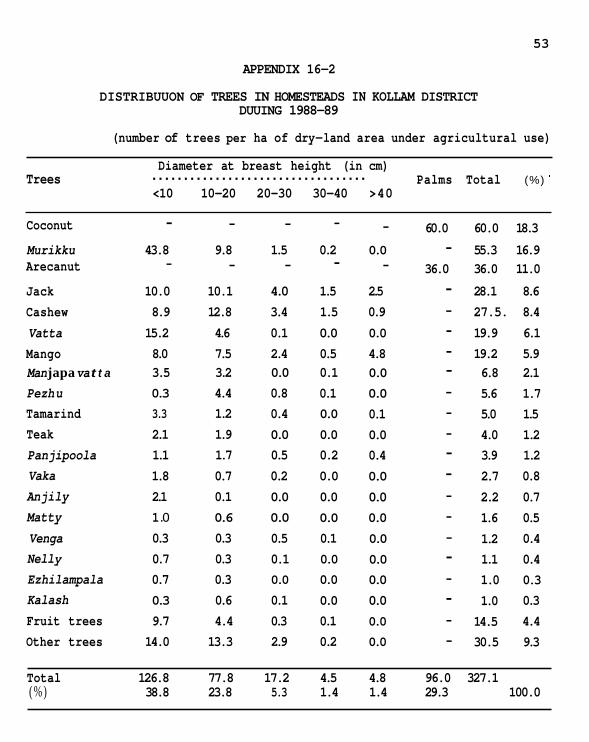
53
APPENDIX 16-2
DISTRIBUUON OF TREES IN HOMESTEADS IN KOLLAM DISTRICT DUUING 1988-89
(number of trees per ha of dry-land area under agricultural use)
Diameter at breast height (in cm) Palms Total (%) .................................. Trees
<10 10-20 20-30 30-40 >40
- - 60.0 60.0 18.3 Coconut - - - Murikku 43.8 9.8 1.5 0.2 0.0 - 55.3 16.9
36.0 36.0 11.0 Arecanut - - - Jack 10.0 10.1 4.0 1.5 2.5 - 28.1 8.6 Cashew 8.9 12.8 3.4 1.5 0.9 - 27.5. 8.4 Vatta 15.2 4.6 0.1 0.0 0.0 - 19.9 6.1
- -
Mango 8.0 7.5 2.4 0.5 4.8 - 19.2 5.9 Man japa va t t a 3.5 3.2 0.0 0.1 0.0 - 6.8 2.1 Pezh u 0.3 4.4 0.8 0.1 0.0 - 5.6 1.7 Tamarind 3.3 1.2 0.4 0.0 0.1 - 5.0 1.5 Teak 2.1 1.9 0.0 0.0 0.0 - 4.0 1.2 Panjipoola 1.1 1.7 0.5 0.2 0.4 - 3.9 1.2 Vaka 1.8 0.7 0.2 0.0 0.0 - 2.7 0.8 An jily Matty Venga Nell y Ezhilampala Kalash Fruit trees Other trees
2.1 0.1 0.0 0.0 0.0 1 .o 0.6 0.0 0.0 0.0 0.3 0.3 0.5 0.1 0.0 0.7 0.3 0.1 0.0 0.0 0.7 0.3 0.0 0.0 0.0 0.3 0.6 0.1 0.0 0.0 9.7 4.4 0.3 0.1 0.0 14.0 13.3 2.9 0.2 0.0
- 2.2 0.7 - 1.6 0.5 - 1.2 0.4 - 1.1 0.4 - 1.0 0.3 - 1.0 0.3 - 14.5 4.4 - 30.5 9.3
Total 126.8 77.8 17.2 4.5 4.8 96.0 327.1 (%) 38.8 23.8 5.3 1.4 1.4 29.3 100.0
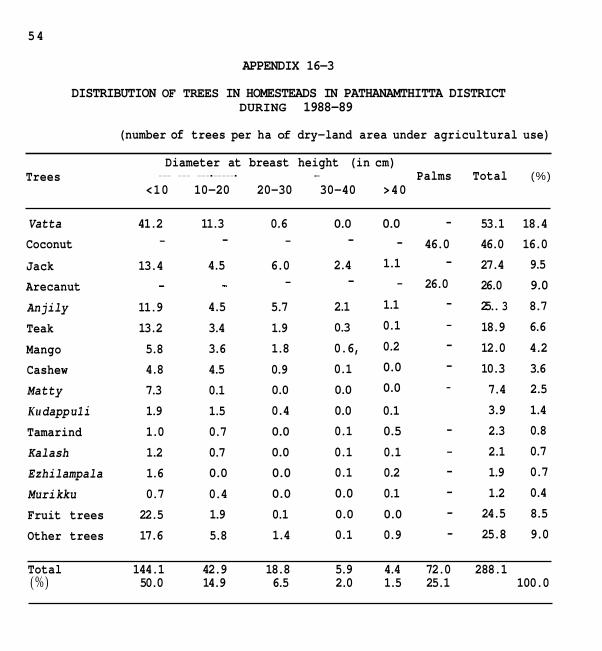
54
APPENDIX 16-3
DISTRIBUTION OF TREES IN HOMESTEADS IN PATHANAMTHITTA DISTRICT DURING 1988-89
(number of trees per ha of dry-land area under agricultural use)
Diameter at breast height (in cm) Palms Total (%) __---_---_---l-----l___________c_____ Trees
<10 10-20 20-30 30-40 >40
Vatta 41.2 11.3 0.6 0.0 0.0 - 53.1 18.4 Coconut - 46.0 46.0 16.0 - - - - Jack Arecanut
Anjily Teak
Mango Cashew Matty Ku dapp u 1 i Tamarind Kalash Ezhilampala Muri kku Fruit trees Other trees
13.4
11.9 13.2 5.8 4.8 7.3 1.9 1.0 1.2 1.6 0.7 22.5 17.6
4.5
4.5 3.4 3.6 4.5 0.1 1.5 0.7 0.7 0.0
0.4 1.9 5.8
6.0 -
5.7 1.9 1.8 0.9 0.0 0.4 0.0
0.0
0.0 0.0 0.1 1.4
2.4 1.1 - - - 26.0
2.1 1.1 - 0.3 0.1 - 0.6, 0.2 - 0.1 0.0 - 0.0 0.0 - 0.0 0.1 0.1 0.5 - 0.1 0.1 - 0.1 0.2 - 0.0 0.1 - 0.0 0.0 - 0.1 0.9 -
27.4 26.0 25.. 3 18.9 12.0 10.3 7.4 3.9 2.3 2.1 1.9 1.2 24.5 25.8
9.5 9.0 8.7 6.6 4.2 3.6 2.5 1.4 0.8 0.7 0.7 0.4 8.5 9.0
Total 144.1 42.9 18.8 5.9 4.4 72.0 288.1 ( % ) 50.0 14.9 6.5 2.0 1.5 25.1 100.0

55
APPENDIX 16-4 DISTRIBUTION OF TREES IN HOMESTEADS IN ALAPPUZHA DISTRICT
DURING 1988-89 (number of trees per ha of dry-land area under agricultural use)
Diameter at breast height (in cm) Palms Total (%) ................................... Trees
<10 10-20 20-30 30-40 >40
Coconut - - - - - 137.0 137.0 42.1 Mat t y 9.6 21.3 7.0 1.0 0.7 - 39.6 12.2 Arecanut Mango Poovarasu Jack Punna Cashew Pan j i p o o l a Murikku An] ily Ezhilampala Fruit trees Other trees
- - 8.6 7.3 7.0 10.7 5.2 3.4 0.7 1.6 1.0 1.0 0.0 0.8 0.0 0.5 0.3 0.5 0.3 0.5 6.8 8.6 5.0 6.3
- - - 6.2 4.7 4.4 4.2 1.0 0.0 3.4 2.1 0.2 0.0 0.3 0.0 0.0 0.0 0.3 0.5 0.0 0.3 0.3 0.0 0.5 0.0 0.2 0.0 0.0 0.0 0.2 1.6 0.0 0.7 2.1 1.8 0.8
37.0 37.0 11.4 - 31.2 9.6 - 22.9 7.0 - 14.3 4.4 - 2.6 0.8 - 2.3 0.7 1.6. 0.5 - 1.3 0.4
- 1.0 0.3 - 1.0 0.3 - 17.7 5.4 - 16.0 4.9
-
Total 44.5 62.5 25.3 11.1 8.2' 174.0 325.5 (%) 13.7 19.2 7.8 3.4 2.5 53.4 100.0
APPENDIX 16-5 DISTRIBUTION OF TREES IN HOMESTEADS IN KOTTAYAM DISTRICT
DURING 1988-89 (number of trees per ha of dry-land area under agricultural use)
Diameter at breast height (in cm)
<10 10-20 20-30 30-40 >40 Palms Total ( % )
Teak 22.8 8.7 2.7 0.6 0.1 - 34.9 20.1 Coconut - - 34.0 34.0 19.6 Anj ily 6.0 5.0 2.6 2.1 2.0 - 17.7 10.2
- 16.0 16.0 9.2 Arecanut - Jack 3.3 3.4 3.1 2.2 2.0 14.0 8.1 Murikku 4.9 7.9 0.3 0.1 0.0 13.2 7.6 Vat t a 3.1 2.4 0.5 0.0 0.0 6.0 3.5 Mango 2.3 1.9 0.6 0.3 0.2 - 5.3 3.1 Mat t y 3.4 0.9 0 .0 0.0 0.1 - 4.4 2.5 Cashew 1.4 1.2 0.1 0.1 0.0 - 2.8 1.6 Pullamaruthu 0.7 1.1 0.6 0.1 0.1 - 2.6 1.5 Mu1 il a vu 0.2 1.0 0.3 0.1 0.0 - 1.6 0.9 Fruit trees 6.5 2.7 0.2 0.1 0.0 - 9.5 5.5 Other trees 3.9 4.3 0.9 0.4 0.9 10.4 6.0
1 1.0 0.6 Other palms - -
Total 58.5 40.5 11.9 6.1 5.4 51.0 173.4 (%) 33.7 23.4 6.9 3.5 3.1 29.4 100.0
.................................. Trees
- - - - - -
- - -
- - - -
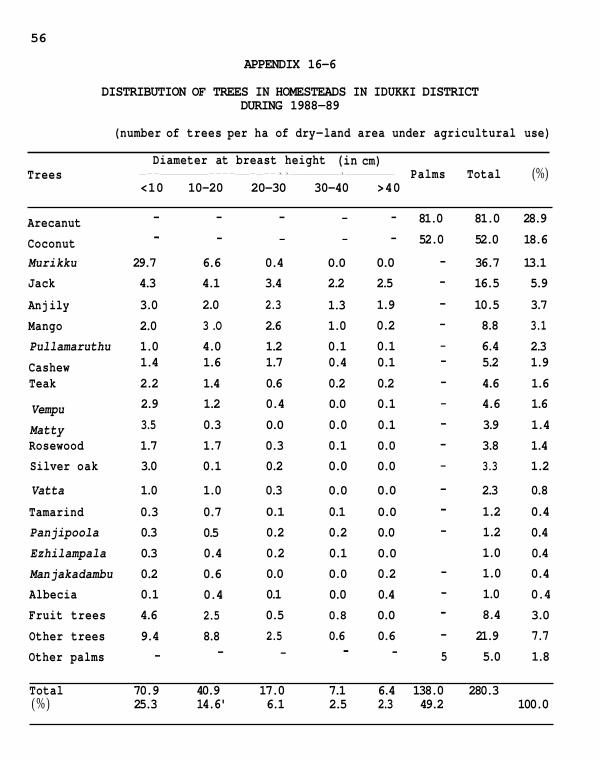
56
APPENDIX 16-6
DISTRIBUTION OF TREES IN HOMESTEADS IN IDUKKI DISTRICT DURING 1988-89
(number of trees per ha of dry-land area under agricultural use)
Diameter at breast height (in cm) Palms Total (%) _--_______----__-_--ll_______l_______ Trees
<10 10-20 20-30 30-40 >40
- - - - - 81.0 81.0 28.9 Arecanut - - - - - 52.0 52.0 18.6 Coconut
Muri kku 29.7 6.6 0.4 0.0 0.0 - 36.7 13.1 Jack 4.3 4.1 3.4 2.2 2.5 - 16.5 5.9
Anj ily 3.0 2.0 2.3 1.3 1.9 - 10.5 3.7 Mango 2.0 3 .O 2.6 1.0 0.2 - 8.8 3.1 Pullamaruthu 1.0 4.0 1.2 0.1 0.1 - 6.4 2.3
1.4 1.6 1.7 0.4 0.1 - 5.2 1.9 Cashew Teak 2.2 1.4 0.6 0.2 0.2 - 4.6 1.6
2.9 1.2 0.4 0.0 0.1 - 4.6 1.6 3.5 0.3 0.0 0.0 0.1 - 3.9 1.4
Rosewood 1.7 1.7 0.3 0.1 0.0 - 3.8 1.4 Silver oak 3.0 0.1 0.2 0.0 0.0 - 3.3 1.2
Vatta 1.0 1.0 0.3 0.0 0.0 - 2.3 0.8
Vempu Matty
Tamarind 0.3 Panjipoola 0.3 Ezhilampala 0.3 Man jakadambu 0.2 Albecia 0.1 Fruit trees 4.6 Other trees 9.4 Other palms -
0.7 0.5 0.4 0.6 0.4 2.5 8.8
-
0.1 0.1 0.0
0.2 0.2 0.0 0.2 0.1 0.0
0.0 0.0 0.2 0.1 0.0 0.4 0.5 0.8 0.0
2.5 0.6 0.6 - - -
- 1.2 0.4 - 1.2 0.4
1.0 0.4 - 1.0 0.4 - 1.0 0.4 - 8.4 3.0 - 21.9 7.7 5 5.0 1.8
Total 70.9 40.9 17.0 7.1 6.4 138.0 280.3 ( % ) 25.3 14.6' 6.1 2.5 2.3 49.2 100.0

57
APPENDIX 16-7
DISTRIBUTION OF TREES IN HOMESTEADS IN ERNAKULAM DISTRICT DURING 1988-89
(number of trees per ha of dry-land area under agricultural use)
Diameter at breast height (in cm) Palms Total (%) ..................................... Trees
<10 10-20 20-30 30-40 >40
Coconut Matty Arecanut
Mango Jack
Vatta Cashew
Muri kku Teak Kalash Tamarind Panjipoola
Ezhilampala Anjily Marotty Mu1 1 i 1 a vu
Kanjiram Fruit trees Other trees Other palms
-
35.7 -
8.9 5.9 10.5 6.9 5.7 5.7 2.4 2.8 1.6 1.3 1.0 0.3 0.4 0.5 9.5 6.5
-
- 16.4
- 7.3 5.0 3.2 4.2 3.8 2.4 2.6 0.8 1.5 1.1 1.0 0.8 1.2 0.4 3.5 6.0
-
-
0.3 -
2.9 3.3 0.0
1.8 0.1 0.4 1.0 0.8 0.1 0.1 0.3 0.2 0.1 0.1 0.3 0.7
-
-
0.3 -
1.4 2.5 0.0
0.4 0.0 0.0 0.3 0.4 0.1 0.0 0.1 0.2 0.0
0.0
0.1 0.4
-
- 0.1
- 2.0 1.8 0.0 0.3 0.0 0.0 0.0 0.0 0.2 0.0 0.0 0.4 0.0 0.0 0.0 0.3
-
58.0 52.8 30.0 22.5 18.5. 13.7 13.6 9.6 8.5 6.3 4.8 3.5 2.5 2.4 1.9 1.7 1.0 13.4 13.9 2.0
20.7 18.8 10.7 8.0 6.6 4.9 4.8 3.4 3.0 2.2 1.7 1.2 0.9 0.9 0.7 0.6 0.4 4.8 4.9 0.8
Total 105.6 61.2 12.5 6.2 5.1 90.0 280.6 ( % ) 37.6 21.8 4.5 2.2 1.8 32.1 100.0

58
APPENDIX 16-8
DISTRIBUTION OF TRESS IN HOMESTEADS IN THRISSUR DISTRICT DURING 1988-89
(number of trees per ha of dry-land area under agricultural use)
Arecanut Coconut Muri kku Mango Cashew Jack Vatta Mu1 1 i l avu Tamarind Mat t y Pan j i p o o l a Teak Kalash Anjily Man japava t t a Njaval Va ka Pullamaru tbu Ungu Kudappuli Ezhilampala Kanjiram Sandal Rosewood Nel l y Fruit trees Other trees Other plams
- - - - - 125.0 125.0 25.6 - -
17.4 15.2 10.0 7.4 6.3 6.4 6.0 2.5 10.1 5.0 7.1 4.8 5.4 3.1 10.1 0.9 2.7 3.3 4.6 1.9 2.6 2.6 1.8 1.0 2.2 0.7 1.5 0.8 1.3 0.9 0.7 1.0 1.1 0.9 1.1 0.4 0.9 0.5 0.8 0.6 1.1 0.1 0.2 0.1 0.2 0.0 14.5 7.3 20.3 7.5 - -
- 0.7 6.0 5.5 4.0 1.5 2.1 2.4 0.0 3.0 1.0 0.2 0.6 0.5 0.7 0.5 0.6 0.2 0.1 0.2 0.2 0.0 0.2 0.3 2.4 2.2 -
- - 101.0 101.0 20.7 0.0 0.0 - 33.3 6.8 3.1 0.9 - 27.4 5.6 3.0 1.0 - 22.2 4.5 3.0 1.7 - 17.2 3.5 0.1 0.0 - 16.7 3.4 0.4 0.1 - 14.5 3.0 1.1 0.5 - 12.5 2.6 0.1 0.0 - 11.1 2.3 0.4 0.0 - 9.4 1.9 0.2 0.0 - 7.7 1.6 0.0 0.0 - 5.4 1.2 0.2 0.0 - 3.6 0.7 0.0 0.0 - 3.4 0.7 0.0 0.2 - 3.2 0.7 0.2 0.0 - 2.9 0.6 0.0 0.0 - 2.3 0.5 0.0 0.0 - 2.2 0.5 0.2 0.0 - 1.8 0.4 0.0 0.0 - 1.6 0.3 0.0 0.0 - 1.6 0.3 0.0 0.0 - 1.2 0.2 0.1 0.4 - 1.0 0.2 0.0 0.5 - 1.0 0.2 0.6 0.1 - 24.9 5.1 0.1 0.9 - 31.0 6.3 - - 3.0 3.0 0.6
Total 130.0 74.9 35.1 12.8 6.3 229.0 488.1 (%) 26.6 15.3 7.2 2.6 1.3 47.0 100.0

59
APPENDIX 16-9
DISTRIBUTION OF TREES IN HOHESTEADS IN PALAKKADU DISTRICT DURING 1988-89
(number of trees per ha of dry-land area under agricultural use)
Palms Total (%) Diameter at breast height (in cm) ..................................... Trees
<10 10-20 20-30 30-40 >40
Arecanut Teak coconut Mango Tamarind Cashew Nan j a p a va t t a Sandal Kanji ram Jack Mu1l i l avu Mat t y V a t t a Njaval Arya veppu Vaka Pan j i p o o l a Venga Poovam Ezhilampala Ungu Nel1 y Pul lamaru thu Manchady Kalash Fruit trees Other trees Other palms
- 50.4
14.1 19.6 11.5 13.8 11.6
9.8 4.9 6.6 6.7 6.0 1.2 3.9 3.7 2.4 2.4 2.1 0.8 0.6 0.6 0.8 0.7 0.3 9.3
25.8
-
-
- 12.2
12.9 6.2
10.4 8.8 3.0 4.5 2.8 5.5 5.1 5.5 7.3 3.7 1.4 1.5 0.8 1.0 1.1 0.7 0.4 0.3 0.4 0.5 4.8
13.9
-
-
- 0.7
5.6 1.7 2.1 0.9 0.0 0.3 2.7 0.9 0.1 0.5 2.7 1.0 0.6 0.8 0.1 0.2 0.2 0.0 0.5 0.0 0.0 0.1 0.9 1.6
-
-
- 0.0
2.4 1.0 0.3 0.0 0.0 0.0 1.3 0.1 0.0 0.0 0.1 0.1 0.0 0.0 0.2 0.0 0.0 0.0 0.0 0.0 0.0 0.0 0.2 0.7
-
-
- 75.0 0.0 - - 53.0 2.5 0.8 0.1 - 0.0 0.0 0.0 - 1.8 - 0.1 - 0.1 - 0.0 0.0 - 0.2 - 0.1 - 0.2 - 0.0 - 0.1 - 0.2 0.2 - 0.0 - 0.0 - 0.0 - 0.1 - 0.0 - 1.0 - 16.0
- - - -
-
-
-
75.0 14.8 63.3 12.5 53.0 10.5 37.5 7.4
24.4 4.7 23.5 4.6 14.6' 2.9 14.6 2.9 13.5 2.7 13.2 2.5 12.0 2.4 12.0 2.4 11.3 2.2
8.9 1.8 5.8 1.1 4.9 1.0 3.5 0.7 3.4 0.7 2.3 0.5 1.5 0.3 1.5 0.3 1.1 0.2 1.1 0.2 1.0 0.2
15.2 3.0 43.0 8.5 16.0 3.2
29.3 5.8
Total 209.6 114.7 24.2 6.4 7.5 144.0 506.4 (%) 41.4 22.6 4.8 1.3 1.5 28.4 100.0

60
APPENDIX 16-10
DISTRIBUTION OF TREES IN HOMESTEADS IN MALAPPURAM DISTRICT DURING 1988-89
(number of trees per ha of dry-land area under agricultural use)
Diameter at breast height (in cm) Palms Total (%) -------------r------_Ll____________l__ Trees
<10 10-20 20-30 30-40 ) 40
Coconut V a t t a
Cashew
Matty Mango Jack Arecanut
Teak Murikku
Mu11 i l a vu
Tamarind
Sandal Kanjiram
Vaka
Pan j i p o o l a
E l an ji
Venga
Fruit trees
Other trees Other palms
- 37.9 16.4 21.5 15.5 12.3
- 6.9 6.0 4.3 4.0 2.7 1.5 1.8 1.2 0.9 0.7 17.7 26.8
-
- 20.3 9.2 5.0 5.8 7.4
- 2.0 2.1 2.8 0.9 0.1 1.1 0.7 0.8 0.3 0.4 2.9 15.1
-
-
1.4 3.8 0.3
1.9 2.4
-
0.1 0.3 0.7 0.3 6.0
0.2 0.0
0.1 0.0 0.0
0.5 1.7
-
- - 81.0 81.0 21.3 0.0 0.1 - 59.7 15.7 1.0 0.0 - 30.4 8.0
0.0 0.0 - 26.8 7.1 1.1 0.5 - 24.8 6.5 0.9 0.9 - 23.9 6.3
- 23.0 23.0 6.1 0.0 0.0 - 9.0 2.4 0.1 0.0 8.5 2.2 0.1 0.0 7.9 2.1 0.0 0.2 5.4 1.4 0.0 0.0 2.8 0.7 0.0 0.0 2.8 0.7 0.0 0.0 2.5 0.7 0.2 0.0 2.3 0.6 0.0 0.0 - 1.2 0.3 0.0 0.0 1.1 0.3 0.0 0.0 - 21.1 5.6 0.1 0.0 - 43.7 11.5
2.0 2.0 0.5
-
- - - - - - -
-
- -
Total 178.1 76.9 13.7 3.5 1.7 106.0 379.9 (%) 46.9 20.2 3.6 0.9 0.4 28.0 100.0
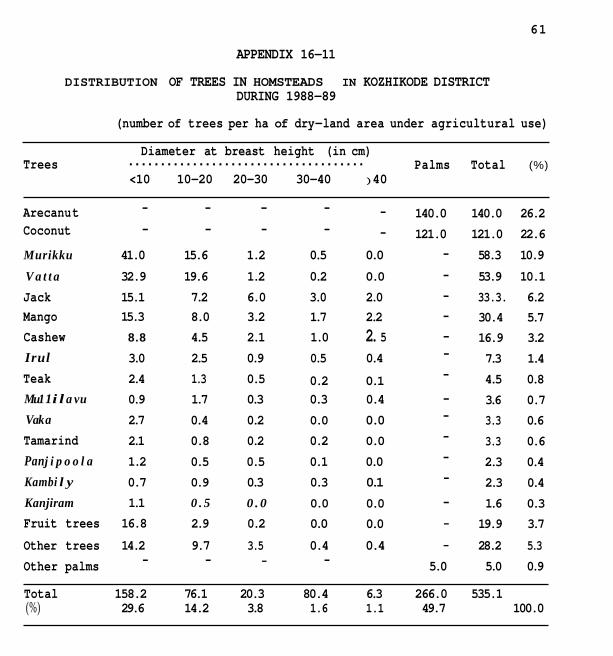
61
APPENDIX 16-11
DISTRIBUTION OF TREES IN HOMSTEADS IN KOZHIKODE DISTRICT DURING 1988-89
(number of trees per ha of dry-land area under agricultural use)
Diameter at breast height (in cm) Palms Total (%) ..................................... Trees
<10 10-20 20-30 30-40 ) 40
- - - - - 140.0 140.0 26.2 Arecanu t Coconut - - - - - 121.0 121.0 22.6 Murikku 41.0 15.6 1.2 0.5 0.0 - 58.3 10.9
V a t t a 32.9 19.6 1.2 0.2 0.0 - 53.9 10.1 Jack 15.1 7.2 6.0 3.0 2.0 - 33.3. 6.2 Mango Cashew Irul Teak Mu1 1 i l a vu
Va ka
Tamarind Pan j i p o o l a
Kambi l y
15.3 8.8
3.0 2.4 0.9 2.7 2.1 1.2 0.7
8.0 3.2 4.5 2.1 2.5 0.9 1.3 0.5 1.7 0.3 0.4 0.2 0.8 0.2 0.5 0.5 0.9 0.3
1.7 2.2 1.0 2. 5
0.2 0.1
0.5 0.4
0.3 0.4 0.0 0.0 0.2 0.0
0.1 0.0 0.3 0.1
- 30.4 5.7 - 16.9 3.2
7.3 1.4 4.5 0.8
- 3.6 0.7 3.3 0.6 3.3 0.6 2.3 0.4 2.3 0.4
- -
- - - -
Kanjiram 1.1 0 . 5 0 . 0 0.0 0.0 - 1.6 0.3 Fruit trees 16.8 2.9 0.2 0.0 0.0 - 19.9 3.7
Other trees 14.2 9.7 3.5 0.4 0.4 - 28.2 5.3 Other palms 5.0 5.0 0.9
Total 158.2 76.1 20.3 80.4 6.3 266.0 535.1 (%) 29.6 14.2 3.8 1.6 1.1 49.7 100.0
- - - - -

62
APPENDIX 16-12
DISTRIBUTION OF TREES IN HOMESTEADS IN WAYANAD DISTRICT DURING 1988-89
(number of trees per ha of dry-land area under agricultural use)
Diameter at breast height (in cm) Palms Total (%) ...................................... Trees
<10 10-20 20-30 30-40 >40
Muri kku
Arecanut Cashew Jack Silver oak Mango Vetty Rosewood Coconut Anj i 1 y
Thanni
Vaka
V a t t a
Kalash
Pezhu
Mat t y Nja val
Kambi 1 y
Kudappuli
Venteak Teak Pan j i p o o l a
Fruit trees Other trees Other palms
68.5 -
20.2 11.6 18.8 6.3 4.2 6.7
- 2.8 1.1 1.6 1.3 0.6 0.7 1.7 0.3 0.4 0.4 0.2 0.6 0.2 1.5 6.9
-
25.8 -
13.3 10.5 5.8 6.9 10.7 3.5
- 3.0 1.8 1.2 1.7 1.5 1.3 0.1 1.7 0.8 0.6 0.6 0.5 0.6 1.2 11.8
-
4.8 -
5.4 6.8 0.3 3.5 2.4 1.4
- 1.9 0.9 0.5 0.7 0.7 0.1 0.0 0.4 0.2 0.4 0.2 0.1 0.1 0.3 3.0
-
0.9 0.2 - -
0.9 0.0 3.4 2.4 0.0 0.0 1.1 0.5 0.5 0.0 0.6 0.3
- - 0.9 '0.5 0.2 0.0 0.3 0.2 0.1 0.0 0.2 0.0
0.0 0.0 0.0 0.0 0.2 0.1 0.0 0.1 0.0 0.1 0.2 0.1 0.0 0.0 0.1 0.0 0.0 0.0 0.8 0.7
- -
100.2 27.1 47.0 12.7 39.8 10.8 34.7 9.4 24.9 6.7 18.3 5.0 17.8 4.8 12.5 3.4 10.0 2.7 9.1 2.5 4.0 1.1 3.8 1.0 3.8 1.0 3.0 0.8 2.1 0.6 1.8 0.5 2.7 0.7 1.5 0.4 1.5 0.4 1.3 0.4 1.2 0.3
1.0 0.3 3.0 0.8 23.2 6.3 1.0 0.3
Total 156.6 104.9 34.1 10.4 5.2 58.0 369.2 ( 0 ) 42.5 28.4 9.2 2.8 1.4 15.7 100.0

63
APPENDIX 16-13
DISTRIBUTION OF TREES IN HOMESTEAD IN KANNUR DISTRICT DURING 1988-89
(number of trees per ha of dry-land area under agricultural use)
Diameter at breast height (in cm) Trees ...................................... Palms Total (%)
<10 10-20 20-30 30-40 > 40
Cashew Coconut Murikku Mango Jack Arecanut Vatta Teak Kanji ram Tamar inti Irul Mu1 1 il a vu Ezhilampala Vaka Sandal Kalash Fruit trees Other trees Other palms
36.0 -
23.4 18.9 7.6
- 19.1 11.9 9.8 3.6 2.6 1.0 1.2 0.7 1.3 0.5 5.2 34.8
-
50.1 33.7 - -
14.0 3.2 13.8 3.7 7.3 4.6
- - 2.9 0.8 5.8 2.3 5.6 1.8 1.1 0.7 1.7 0.0 0.6 0.5 0.1 0.2 0.6 0.2 0.1 0.0 0.5 0.2 1.2 0.3 15.2 4.6
- -
5.5 2.9 - 128.2 27.4 - - 66.0 66.0 14.1
0.1 0.0 - 40.7 8.7 1.6 2.7 - 40.7 8.7 2.3 2.7 - 24.5' 5.2
- - 24.0 24.0 5.1 0.0 0'. 0 - 22.8 4.9 0.3 0.2 - 20.5 4.4 0.1 0.1 - 17.4 3.7 0.2 0.3 - 5.9 1.3 0.0 0.0 - 4.3 0.9 0.1 0.0 - 2.2 0.5 0.0 0.1 - 1.6 0.3 0.0 0.0 - 1.5 0.3 0.0 0.0 - 1.4 0.3 0.1 0.0 - 1.3 0.3 0.0 0.0 - 6.7 1.4 0.6 0.4 - 55.6 11.9
- - 3.0 3.0 0.6
Total 177.6 120.6 56.8 10.9 9.4 93.0 468.3 (%) 37.9 25.8 12.1 2.3 2.0 19.9 100.0
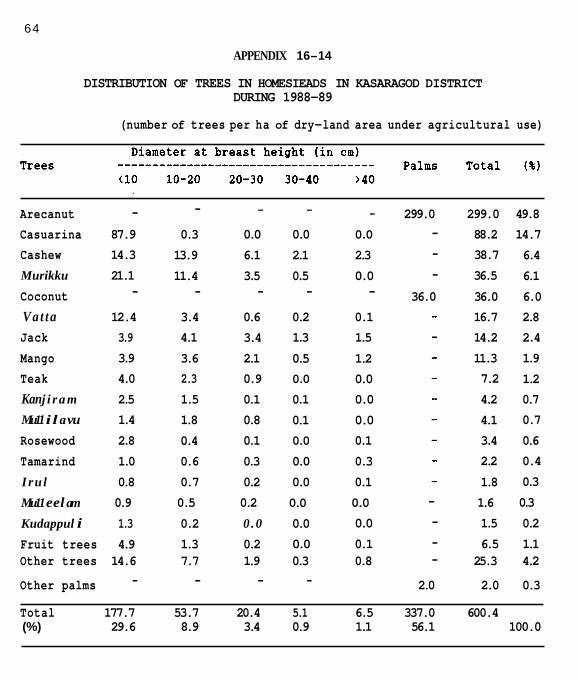
64
APPENDIX 16-14
DISTRIBUTION OF TREES IN HOMESIEADS IN KASARAGOD DISTRICT DURING 1988-89
(number of trees per ha of dry-land area under agricultural use)
- - - Arecanut - - 299.0 299.0 49.8 Casuarina 87.9 0.3 0.0 0.0 0.0 - 88.2 14.7 Cashew Murikku
Coconut Vat ta Jack Mango Teak Kan j i r a m
Mu11 i l a vu Rosewood Tamarind I ru l
14.3 21.1
- 12.4 3.9 3.9 4.0 2.5 1.4 2.8 1.0 0.8
13.9 6.1 2.1 2.3 - 11.4 3.5 0.5 0.0 -
36.0 - - - - 3.4 0.6 0.2 0.1 4.1 3.4 1.3 1.5 3.6 2.1 0.5 1.2 2.3 0.9 0.0 0.0 1.5 0.1 0.1 0.0 1.8 0.8 0.1 0.0 0.4 0.1 0.0 0.1 0.6 0.3 0.0 0.3 0.7 0.2 0.0 0.1
38.7 36.5 36.0 16.7 14.2 11.3 7.2 4.2 4.1 3.4 2.2 1.8
6.4 6.1 6.0 2.8 2.4 1.9 1.2 0.7 0.7 0.6 0.4 0.3
Mu11 eel am 0.9 0.5 0.2 0.0 0.0 - 1.6 0.3 Kudappul i 1.3 0.2 0 .0 0.0 0.0 - 1.5 0.2 Fruit trees 4.9 1.3 0.2 0.0 0.1 - 6.5 1.1 Other trees 14.6 7.7 1.9 0.3 0.8 - 25.3 4.2
Other palms 2.0 2.0 0.3
Total 177.7 53.7 20.4 5.1 6.5 337.0 600.4 (%) 29.6 8.9 3.4 0.9 1.1 56.1 100.0
- - - -
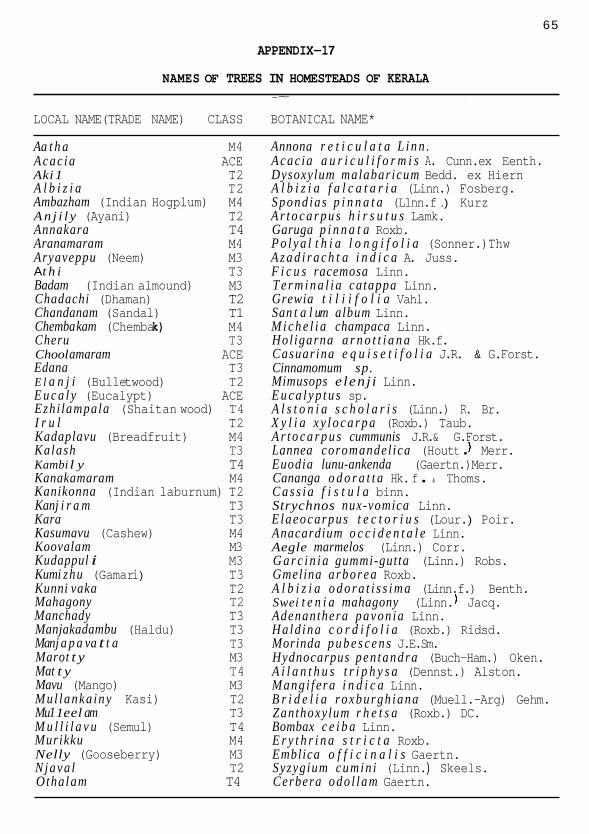
65
APPENDIX-1 7
NAMES OF TREES IN HOMESTEADS OF KERALA ~~ ~ ~~ ~ -~
LOCAL NAME(TRADE NAME) CLASS BOTANICAL NAME*
Aa t h a M4 Annona r e t i c u l a t a L i n n . Acac ia ACE Aki 1 T2 A l b i z i a T2 Ambazham (Indian Hogplum) M4 A n j i l y (Ayani) T2 Annakara T4 Aranamaram M4 Aryaveppu (Neem) M3 A t h i T3 Badam (Indian almound) M3 Chadachi (Dhaman) T2 Chandanam (Sandal) T1 Chemba kam (Chemba k) M4 Cheru T3 Chool amaram ACE Edana T3 E l a n j i (Bulle twood) T2 E u c a l y (Eucalypt) ACE Ezhi lampala (Shaitan wood) T4 I r u l T2 Kadaplavu (Breadfruit) M4 Kalash T3 Kambi l y T4 Kanakamaram M4 Kanikonna (Indian laburnum) T2 Kan j i r a m T3 Kara T3 Kasumavu (Cashew) M4 Koovalam M3 Kudappul i M3 Kumi zhu (Gamar i ) T3 Kunni vaka T2 Mahagony T2 Manchady T3 Manjakadambu (Haldu) T3 Man j a p a va t t a T3
Mat t y T4 Mavu (Mango) M3 Mul lanka iny Kasi) T2 Mu1 1 eel am T3 M u l l i l a v u (Semul) T4 Murikku M4 Nelly (Gooseberry) M3 Njava l T2 Othal am T4
Marot t y M3
Acac ia a u r i c u l i f o r m i s A. Cunn.ex Eenth. Dysoxylum malabar icum Bedd. ex Hiern A l b i z i a f a l c a t a r i a (Linn.) Fosberg. Spond ias p i n n a t a (L1nn.f .) Kurz A r t o c a r p u s h i r s u t u s Lamk. Garuga p i n n a t a Roxb. P o l y a l t h i a l o n g i f o l i a (Sonner.)Thw A z a d i r a c h t a i n d i c a A. Juss. F i c u s racemosa Linn. T e r m i n a l i a ca tappa Linn. Grewia t i l i i f o l i a Vahl. San t a l um album Linn. M i c h e l i a champaca Linn. Hol igarna a r n o t t i a n a Hk.f. Casuar ina e q u i s e t i f o l i a J.R. & G.Forst. Cinnamomum sp. Mimusops e lenj i Linn. E u c a l y p t u s sp. A l s t o n i a s c h o l a r i s (Linn.) R. Br. X y l i a x y l o c a r p a (Roxb.) Taub. A r t o c a r p u s cummunis J.R.& G.Forst. Lannea coromandel ica (Hout t . Merr. Euodia lunu-ankenda (Gaertn.)Merr. Cananga o d o r a t t a Hk. f . & Thoms. C a s s i a f i s t u l a binn. Strychnos nux-vomica Linn. Elaeocarpus t e c t o r i u s (Lour. ) Poir. Anacardium o c c i d e n t a l e Linn. Aegle marmelos (Linn.) Corr. G a r c i n i a gummi-gutta (Linn.) Robs. Gmelina a rborea Roxb. A l b i z i a o d o r a t i s s i m a (Linn.f.) Benth. Swei t e n i a mahagony (Linn. Jacq. Adenanthera pavon ia Linn. Hald ina c o r d i f o l i a (Roxb.) Ridsd. Morinda p u b e s c e n s J.E.Sm. Hydnocarpus pen tandra (Buch-Ham.) Oken. A i l a n t h u s t r i p h y s a (Dennst.) Alston. Mang i f e ra i n d i c a Linn. B r i d e l i a roxburgh iana (Muell.-Arg) Gehm. Zanthoxy lum r h e t s a (Roxb.) DC. Bombax c e i b a Linn. E r y t h r i n a s t r i c t a Roxb. Emblica o f f i c i n a l i s Gaertn. Syzygium cumin i (Linn. ) Skeels. Cerbera odo l lam Gaertn.
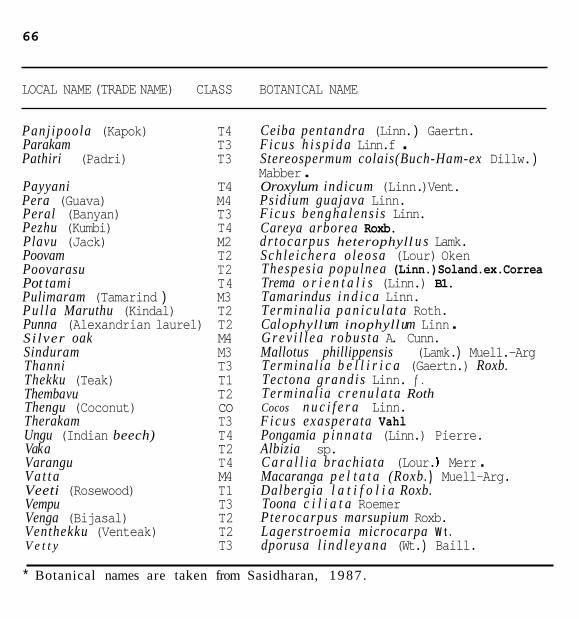
66
LOCAL NAME (TRADE NAME) CLASS BOTANICAL NAME
Panj ipoola (Kapok) T4 Parakam T3 Pathiri (Padri) T3
Payyani T4 Pera (Guava) M4 Peral (Banyan) T3 Pezhu (Kumbi) T4 Plavu (Jack) M2 Poovam T2 Poovarasu T2 Pot tami T4 Pulimaram (Tamarind ) M3 Pul la Maruthu (Kindal) T2 Punna (Alexandrian laurel) T2 Si lver oak M4 Sinduram M3 Thanni T3 Thekku (Teak) T1 Themba vu T2 Thengu (Coconut) co Therakam T3 Ungu (Indian beech) T4 Va ka T2 Varangu T4 V a t t a M4 Veeti (Rosewood) T1 Vempu T3 Venga (Bijasal) T2 Venthekku (Venteak) T2 V e t t y T3
Ceiba pentandra (Linn. ) Gaertn. Ficus h i s p i d a Linn.f . Stereospermum colais(Buch-Ham-ex Dillw. )Mabber . Oroxylum indicum (Linn. )Vent. Psidium guajava Linn. F i c u s bengha lens i s Linn. Careya arborea Roxb. dr tocarpus heterophyll u s Lamk. Sch le ichera o leosa (Lour) Oken Thespesia populnea (Linn.)Soland.ex.Correa Trema o r i e n t a l i s (Linn.) B1. Tamarindus i n d i c a Linn. Terminal ia p a n i c u l a t a Roth. Cal ophyll um inophyll um Linn . G r e v i l l e a robus ta A. Cunn. Mallotus phillippensis (Lamk. ) Muel1.-Arg Terminal ia b e l l i r i c a (Gaertn.) Roxb. Tectona grand i s Linn. f . Terminal ia c r e n u l a t a Roth Cocos n u c i f e r a Linn. F i c u s exasperata Vahl Pongamia p i n n a t a (Linn.) Pierre. Albizia sp. C a r a l l i a brachiata (Lour. Merr . Macaranga p e l t a t a (Roxb. ) Muell-Arg. Dalbergia l a t i f o l i a Roxb. Toona c i l i a t a Roemer Pterocarpus marsupium Roxb. Lagerstroemia microcarpa W t . dporusa l i n d l e y a n a (Wt. ) Baill.
* Botanical names are taken from Sasidharan, 1987 .