delta tmdl review v2 - waterboards.ca.gov€¦ · 1 technical review of delta mercury tmdl tetra...
TRANSCRIPT

1
TECHNICAL REVIEW OF DELTA MERCURY TMDL
Tetra Tech, Inc.
3746 Mt. Diablo Blvd., Suite 300 Lafayette, CA 94549
December 12, 2006
Tetra Tech has performed a technical review of the two draft reports prepared by the Central Valley Regional Water Quality Control Board that present the staff recommendations for establishing a Total Maximum Daily Load for methylmercury in the Sacramento-San Joaquin Delta Estuary:
• Sacramento – San Joaquin Delta Estuary TMDL for Methylmercury, Staff Report, June 2006
• Amendments to the Water Quality Control Plan for the Sacramento River and San Joaquin River Basins for the Control of Methylmercury in the Sacramento-San Joaquin Delta Estuary, Staff Report, June 2006
This review, conducted for the Delta Mercury TMDL Collaborative, is presented in two parts. In Part 1, general comments are presented on the development of the TMDL implementation goals. Since the implementation goals provide the basis of proposed allocation and source controls, it is important to consider the steps involved in setting the implementation goals, the uncertainties that exist, and the limitations inherent in the methodology adopted to develop these goals. In Part 2, the review questions presented in the Delta Mercury TMDL Collaborative’s August 31, 2006 letter are addressed. Each question is re-stated and the responses are presented.
Part 1. General Review Comments
Implementation Goal The linkage analysis and the selected implementation goal in the Delta TMDL were based on the development of a predictive relationship between aqueous methylmercury concentration and mercury concentration in fish tissue. However, it is noted in the staff report (p. 57) that the water and fish data, that were used to develop this predictive relationship and the numeric target for aqueous methylmercury, were not collected specifically for the analyses conducted to support the linkage analysis. These analyses relied on existing data from several sources that were collected at different times and at different locations. The sources, magnitude, and consequences of the uncertainty associated with these analyses and on the effect on the predicted relationships were not thoroughly addressed.
There were several key steps in the development of the selected implementation goals. At each step, decisions were required on the use of predictive tools, on the selection of parameter values, and in the interpretation of the analysis results. This review focuses on the decisions associated

2
with the development of human-health targets, wildlife health targets, and the interpretation of the relationships between aqueous methylmercury concentrations and mercury levels in fish tissue.
In this review we have addressed the role of some of the key uncertainties in the calculation, specifically assumptions about different fish consumption rates, and uncertainties in the relationship between water column mercury and fish mercury.
An additional feature of the Delta and an uncertainty that is not considered in the TMDL analysis is the hydrodynamics of the Delta, and the complexity of mixing of inflows from different sources. An understanding of Delta hydrodynamics in the context of mercury chemistry is critical to understand how different areas of the Delta will respond to load reductions in the tributaries and in the Delta watershed. Detailed models of Delta hydrodynamics exist, and have been used for water quality modeling, although not for mercury modeling. Future efforts to evaluate the benefits of mercury reduction from individual types of sources, including local sources near the Delta, should consider the development of a model that incorporates Delta hydrodynamics to better understand the methylmercury response that might be expected in various subregions of the Delta. This modeling is especially important because current data show the variability of the responses in different regions, and not all subregions may show a response to possible load reduction efforts.
Human Health Target The human health target for the Delta TMDL was derived from the federal Ambient Water Quality Criterion (AWQC) for methylmercury (US EPA, 2001). The water quality criterion is a fish tissue criterion (0.3 mg/kg wet wt.) -- the estimated safe methylmercury exposure level for fish consumption for a specified set of exposure conditions.
The equation for calculating the methylmercury fish tissue concentration is:
CRBWRSCRfDTRC ×−
=)(
(Equation G-1) where: TRC= Fish tissue criterion (mg methylmercury/kg fish in diet) for freshwater
and estuarine fish, also the safe MeHg concentration for Delta fish RfD= Reference Dose (mg/kg-bw/day) of 0.0001 mg methylmercury/kg body
weight-day RSC= Relative source contribution (subtracted from the RfD to account for
marine fish consumption) estimated to be 2.7 x 10⁻⁵ mg methylmercury/kg body weight-day
BW= Human Body Weight default value of 70 kg (for adults) CR = Consumption Rate or Fish Intake (kg/day)
The CR can be expressed in terms of the sum of the fish intake from different trophic levels
(∑ iFI ), where
3
FIi = Fish Intake, trophic level (TL)i, i = 2, 3, 4 (kg fish/day) In this form of the consumption rate, the consumption of fish from different trophic levels by the target population can be used to compute the average methylmercury concentration in the diet. The national value for the consumption rate is 17.5 grams (0.0175 kg) fish/day. The fish intake rates or consumption rates for the general population assumed by EPA for the three trophic levels are:
• FI2 = 0.0038 kg fish/day
• FI3 = 0.0080 kg fish/day
• FI4 = 0.0057 kg fish/day
In other words, the proportion of TL2, TL3 and TL4 fish assumed to be in the diet is 0.22 : 0.46 : 0.32, respectively. A series of analyses were presented in the Delta TMDL in which following parameters were varied:
• Consumption Rate: 17.5 g/day and 32 g/day
• Proportion of fish consumed in each of three tophic levels: the national values (0.22, 0.46, 0.32) and 2 Delta-specific values (0.0, 0.50, 0.50) and (0.0, 0.0, 1.0)
• Relative Source Contribution: the national value (2.7 x 10⁻⁵ mg methylmercury/kg body weight-day) and a Delta-specific value of 0.0 (this assumes that no commercial fish consumption occurs and that all fish consumed are from the Delta)
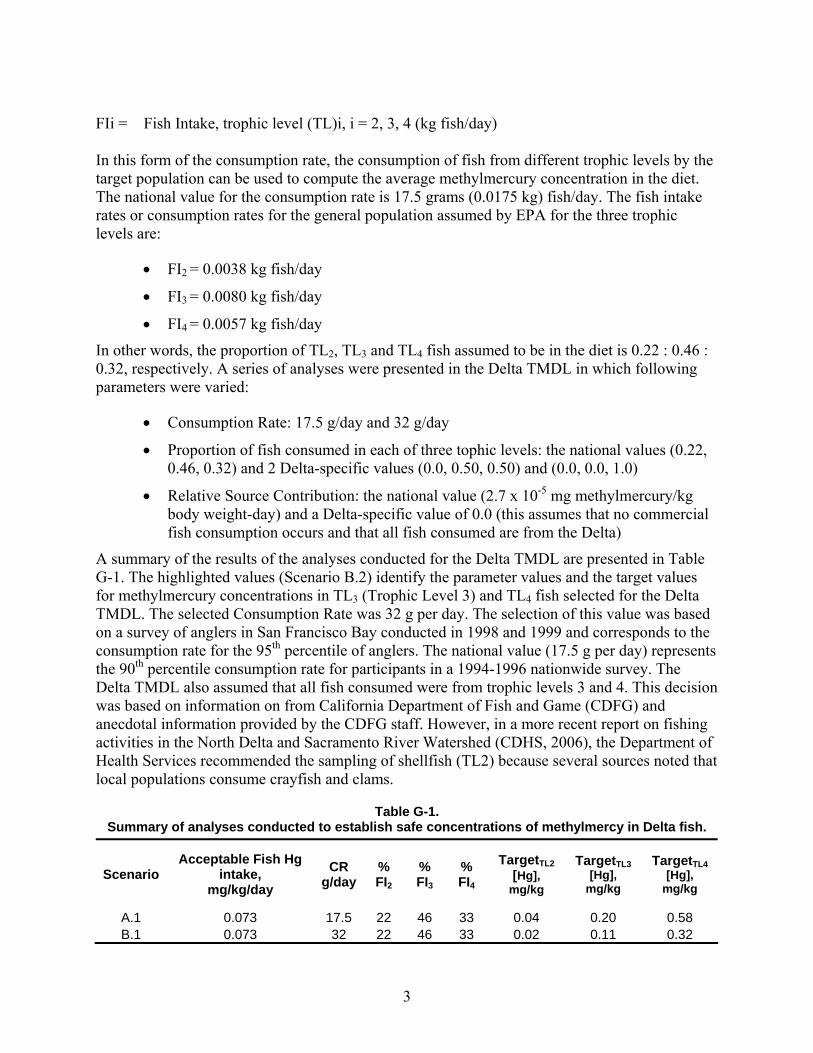
A summary of the results of the analyses conducted for the Delta TMDL are presented in Table G-1. The highlighted values (Scenario B.2) identify the parameter values and the target values for methylmercury concentrations in TL3 (Trophic Level 3) and TL4 fish selected for the Delta TMDL. The selected Consumption Rate was 32 g per day. The selection of this value was based on a survey of anglers in San Francisco Bay conducted in 1998 and 1999 and corresponds to the consumption rate for the 95th percentile of anglers. The national value (17.5 g per day) represents the 90th percentile consumption rate for participants in a 1994-1996 nationwide survey. The Delta TMDL also assumed that all fish consumed were from trophic levels 3 and 4. This decision was based on information on from California Department of Fish and Game (CDFG) and anecdotal information provided by the CDFG staff. However, in a more recent report on fishing activities in the North Delta and Sacramento River Watershed (CDHS, 2006), the Department of Health Services recommended the sampling of shellfish (TL2) because several sources noted that local populations consume crayfish and clams.
Table G-1. Summary of analyses conducted to establish safe concentrations of methylmercy in Delta fish.
Scenario Acceptable Fish Hg
intake, mg/kg/day
CR g/day
% FI2
% FI3
% FI4
TargetTL2 [Hg],
mg/kg
TargetTL3 [Hg],
mg/kg
TargetTL4 [Hg],
mg/kg
A.1 0.073 17.5 22 46 33 0.04 0.20 0.58 B.1 0.073 32 22 46 33 0.02 0.11 0.32

4
C.1 0.100 17.5 22 46 33 0.06 0.28 0.80 D.1 0.100 32 22 46 33 0.03 0.15 0.44
A.2 0.073 17.5 50 50 0.15 0.43 B.2 0.073 32 50 50 0.08 0.24 C.2 0.100 17.5 50 50 0.21 0.59 D.2 0.100 32 50 50 0.11 0.33
A.3 0.073 17.5 100 0.29
The consequence of the selected parameters is a conservative set of target values for TL3 and TL4 fish species. The results presented in Table G-1 also show how the selection of the national fish intake rate of 17.5 g/day and the Delta-specific fish preference assumption (Scenario A.2) results in TL3 and TL4 target values of 0.15 and 0.43 mg/kg, respectively. Selection of the national values for both the fish intake rate and the distribution of fish in three trophic levels (Scenario A.1) results in TL3 and TL4 target values of 0.20 and 0.58 mg/kg, respectively. The San Francisco Bay Mercury TMDL (Johnson and Looker, 2004) selected the higher consumption rate (32 g/day) and also assumed that 100% of the fish ingested were from trophic level 4 (Scenario A.3). The Draft TMDL for the Guadalupe River Watershed (Austin, 2006) set an overall goal of 0.3 mg/kg for all fish consumed, but specified monitoring of 400 mm largemouth bass and comparison to the USEPA default TL4 mercury concentrations of 0.66 mg/kg. The decision to monitor mercury concentrations in the 400 mm largemouth bass in the Guadalupe Watershed was based on (1) the estimated fish consumption by recreational fishermen in the watershed, (2) the existence of a large database for mercury concentrations in largemouth bass that could be used as a basis of comparison, and (3) the fact that the estimated background concentration for 400 mm largemouth bass in the reference reservoir was 0.6 mg/kg.
The selected target values for methylmercury in fish incorporated in the Delta TMDL are conservative. The selected consumption rate (32 g/day) corresponds to the upper 95th percentile of anglers. It is also assumed that all fish consumed were from trophic level 3 and 4, yet there is evidence that the total intake of fish and shellfish could also include trophic level 2 organisms. The selection of the fish target values provides the basis for the proposed aqueous methylmercury water quality criterion. The adoption of the resulting methylmercury water quality criterion (0.06 ng/L) will have significant effects on the overall management strategy for the Delta. It is important not to lose sight of the level of uncertainty that exists in the selected fish target values when later considering the consequence of the proposed water quality criterion on habitat maintenance and restoration activities. Additionally, the analyses presented in the TMDL should address the difference between the target tissue concentrations selected and the background concentrations in trophic level 3 and 4 fish in the Delta as well as the ability to meet the specified target concentrations.
Wildlife Health Targets Acceptable fish tissue levels of mercury for birds and mammals were calculated using daily intake levels, body weights, consumption rates, and a reference dose (RfD) that is defined as the daily exposure to mercury at which no adverse effects are expected.

5
The calculation of the total diet safe level (wildlife value, WV) in the Delta TMDL is analogous to the TRC for the human health target (Equation G-1):
The WV is calculated using the following equation:
iFIRBWRfDWV ×
= (Equation G-2)
WV = Wildlife Value (mg/kg in diet) RfD = Reference Dose (mg/kg-bw/day) BW = Body Weight (in kg) for species of concern FIRi = Total Food Ingestion Rate (kg food/day), from the ith trophic level for the
species of concern Setting the values of the RfD, BW and total FIR, Equation G-2 can be used to generate a relationship between the Wildlife Value (WV), the proportion of fish intake in each trophic level, and the mercury concentration in each trophic level [Hg]TLi:
WV mg/kg = ∑(proportion TLi fish in diet * TLi, Hg conc) (Equation G-3) Where: TLi, Hg conc = mercury concentration in TLi fish
The solution for Equation G-3 depends on specifying the ratio of the mercury concentrations between trophic levels (TLR, trophic level ratios). This allows the equation to be expressed in terms of a single unknown.
The value for total diet safe level for the osprey is one of the most important calculations for the determination of wildlife health targets in the Delta TMDL. The underlying assumptions for the body weight (1.75 kg) and the total food ingestion rate (350 g/day) shown in Table 4.2 of the Delta TMDL, as well as the assumptions regarding the proportion of the diet consisting of TL3 and TL4 fish are reasonable. The calculations used in the determination of the health targets for the osprey were presented in Section 4.5.3.2 of the Delta TMDL:
0.105 mg/kg = (% diet TL3) * TL3, Hg conc + (% diet TL4) * TL4, Hg conc = 0.9 * TL3, Hg conc + 0.10 TL4, Hg conc Expressing the TL4, Hg conc in terms of TL3, Hg conc TL4, Hg conc = TLR 4/3 * TL3, Hg conc = 3.0 * TL3, Hg conc Solving for TL3, Hg con = 0.9 * TL3, Hg conc + 0.1 * (3.0 * TL3, Hg conc) TL3, Hg conc = 0.088 mg/kg TL4, Hg conc = 0.088 mg/kg * 3.0 = 0.26 mg/kg

6
In his comments on the Analysis of TMDL Mercury Criterion Calculations for Cache Creek Fish and Water, Darell Slotton (2005) calculated alternative TL4 fish mercury concentrations (higher values) protective of wildlife based on different inter-trophic mercury multipliers (trophic level ratios) and different assumptions regarding diet proportions. The osprey calculation is highlighted in this review because both the trophic-level ratio utilized in the calculation (TLR 4/3 = 3.0) and the diet proportions (90 % TL3 and 10% TL4) are reasonable estimates. The protective concentration for TL4 fish (0.26 mg/kg) represents a lower boundary on the wildlife health target and a critical outcome of the Delta TMDL analysis.
The value of the reference dose (RfD in Equation G-2) is arguably the most critical factor in the analysis of toxicity to all birds and the setting of the Wildlife Health Target. The RfD is the daily exposure to MeHg intake (mg/kg body weight/day) at which no adverse effects are expected. The starting point for estimating the RfD is the lowest toxicity test dose (TD) used in controlled laboratory studies referred to as the Lowest Observable Adverse Effects Level (LOAEL) dose. The value of the test dose used in the Delta TMDL was 0.064 mg/kg/d and is based on the study of mercury toxicity in mallard ducks based on a 3-year feeding study (Heinz 1979). The reference dose is calculated from the LOAEL values reported in the literature. These reported LOAEL values are also adjusted by uncertainty factors (UF) to account for uncertainty due to:
1) use of data derived from subchronic trials, where the dosing is conducted for a short period of time (UFS),
2) inter-species sensitivity extrapolation from toxicity studies on a non-target species to the species of concern, (UFA), and
3) LOAEL to No Observed Adverse Effects Level (NOAEL) extrapolation (UFL).
The equation for RfD calculation is:
LS UFUFUFTDRfD
A××=
(Equation G-4)
Each of these uncertainty factors can vary between 1 and 10, and the RfD may be a small fraction of the lowest tested dose.
In the Delta TMDL, the RfD was set at 0.021 mg/kg body weight/day. Data from long-term dosing studies were used and UFS was set equal to 1. The species used in the toxicity tests, were for the most part, assumed to be as sensitive as the Delta species, and UFA was also held equal to 1. UFL was set at 3 for all species considered.
The reference dose of 0.021 mg/kg body weight/day is based on a multi-generation study of mallard ducks exposed to a diet containing 0.5 mg/kg methylmercury, and this study remains the best chronic avian methylmercury toxicity trial. However, there are very few published studies that can be used to set a reference dose for mammalian or avian species. The value of the reference dose in the Delta TMDL methodology is critical to the determination of the Wildlife Health Target . There is a need for additional toxicity testing to more precisely define the avian reference dose for avian species.

7
Aqueous Methylmercury Goal The recommended implementation goal for aqueous methylmercury was developed using the empirical relationship between the calculated mercury concentration in standard 350 mm largemouth bass and average methylmercury concentrations in unfiltered water samples. Figure G-1 presents the relationship between these concentrations. The five data points on the graph are the paired average values for aqueous methylmercury (MeHg) and the total mercury concentrations in 350 mm largemouth bass (LMB) calculated for each of the five regions of the Delta.
0.04 0.06 0.08 0.10 0.12 0.14 0.16Aqueous [MeHg] (ng/L)
0.0
0.2
0.4
0.6
0.8
1.0
1.2
LMB
[Hg]
(mg/
kg)
Implementation goal
Scenario A.2
Scenario A.1
0.066 0.095 0.114
Figure G-1. Relationship between standard 350 mm LMB Hg concentration and aqueous MeHg
concentration in five Delta regions.
The selection of the aqueous methylmercury goal was a two-step process. First, the aqueous methylmercury concentration on the regression line corresponding to the selected human-health based implementation goal for a standard 350 mm largemouth bass (0.24 mg/kg) was calculated. Next, this value (0.066 ng/L) was adjusted to incorporate a margin of safety. The recommended value for the methylmercury implementation goal for the determination of load calculation was 0.06 ng/L.
Alternative aqueous MeHg concentrations corresponding to the target trophic level 4 fish mercury concentrations for Scenarios A.1 and A.2 from Table G-1 are shown in Figure G-1 for comparison. Scenarios A.1 and A.2 are not the scenarios selected for the Delta TMDL, but these scenarios represent alternatives that could be applied to this or other TMDLs.

8
Aqueous methylmercury is directly incorporated into plankton, and a close relationship has been demonstrated between aqueous MeHg concentrations and invertebrate and small fish. The linkage between aqueous MeHg and TL4 fish has also been observed. However, the linkage between aqueous MeHg concentrations and TL4 fish is spatially and temporally variable and involves numerous dynamic ecosystem interactions. There is significant uncertainty associated with the analyses conducted to select the methylmercury criterion. This uncertainty and the effect on the proposed aqueous methylmercury criterion is not addressed. The following concerns should be addressed explicitly in the TMDL and considered in evaluating implementation actions:
1. Deterministic Calculations. The MeHg implementation goal (0.06 ng/L) is based on the relationship predicted by the regression equation that captures the empirical relationship observed between average Hg concentrations in largemouth bass and aqueous MeHg concentrations in the Delta. However, the inherent variability in this relationship is not addressed. For example, Figure G-2 shows the 95% confidence interval for the mean fish mercury concentrations predicted by aqueous MeHg concentrations. The range of the predicted fish mercury concentrations for the MeHg value of 0.066 ng/L is 0.14 to 0.42 mg/kg (values on the confidence intervals). The horizontal line added to Figure G-2 also shows the range of aqueous MeHg values corresponding to the selected human health target. These values range from 0.03 to 0.085 ng/L.
2. Data Used in Establishing the Aqueous Methylmercury Goal. The data used in constructing the predictive relationship captured in Figures G-1 and G-2 were not collected for the purpose of examining this relationship. Out of necessity, existing data were used, but these data are not ideal. For example, as shown in Figure 5.1 of the staff report, the largemouth bass data for the Central Delta (Region 5) were collected from Mildred Island and the aqueous MeHg data were collected from the Delta Mendota Canal. The data from these locations do not adequately represent the diverse habitats of the Central Delta. Yet these data were extremely important to the linkage analysis and the implementation strategy.
3. Data Merging. The construction of the regression relationship shown in Figure G-1 involved the calculation of average values for both the aqueous MeHg concentrations and the mercury concentrations for standard 350 mm largemouth bass from all five Delta regions. The underlying assumption is that the same relationship between aqueous MeHg and LMB mercury concentrations exists in all five regions, e.g., a 25 % reduction in aqueous MeHg concentration will have the same effect in each of the five Delta Regions. The transfer of MeHg from the uptake by phytoplankton, the transfer to herbivorous zooplankton, to invertebrates, to small TL3 fish to the indicator species (350 mm LMB) and the seasonal dynamics of these factors are complex, and it is an important assumption that the same response to MeHg reductions would be observed in each Region.

9
0.02 0.04 0.06 0.08 0.10 0.12 0.14 0.16Aqueous [MeHg] (ng/L)
0.0
0.2
0.4
0.6
0.8
1.0
1.2
1.4LM
B [H
g] (m
g/kg
)
Figure G-2. Confidence intervals for standard 350 mm LMB mercury and aqueous MeHg
concentrations.
Part 2. Response to Questions Question 1. The Delta TMDL conclusion that 16% of all methylmercury is from wetland environments is a special concern of the Collaborative. This conclusion appears to be based on one study of wetlands at Twitchell Island. Ongoing studies suggest that the methylation and demethylation process varies by wetland location. The Collaborative would like Tetra Tech to evaluate the technical basis for this conclusion. The Collaborative would also like Tetra Tech to summarize and comment on existing data on the variability of methylation and demethylation in wetland environments in other locations.
Response The calculation of the percentage of wetland methylmercury contributions depends most on the estimate of the wetland flux1 (in the TMDL this was estimated from a study in Twitchell Island and extrapolated to all wetlands in the Delta) and on the estimate of tributary loads computed from the stream flows and in-stream methylmercury concentrations. Both of these components of
1 In the context of this discussion, flux refers to the movement of a chemical from one compartment to another, in this case the movement of mercury or methylmercury from sediments to the overlying water column and are normally represented in units of mass per unit area per unit time. Fluxes can be computed for different types of sources, including, for example, fluxes from wetland areas, fluxes from the open water areas in the Delta, and fluxes from other vegetated areas that form the edges between water and land.

10
the methylmercury loads are highly variable. The role of the variability in wetland sources is discussed in response to Question 3. The variability of the tributary loads is discussed below.
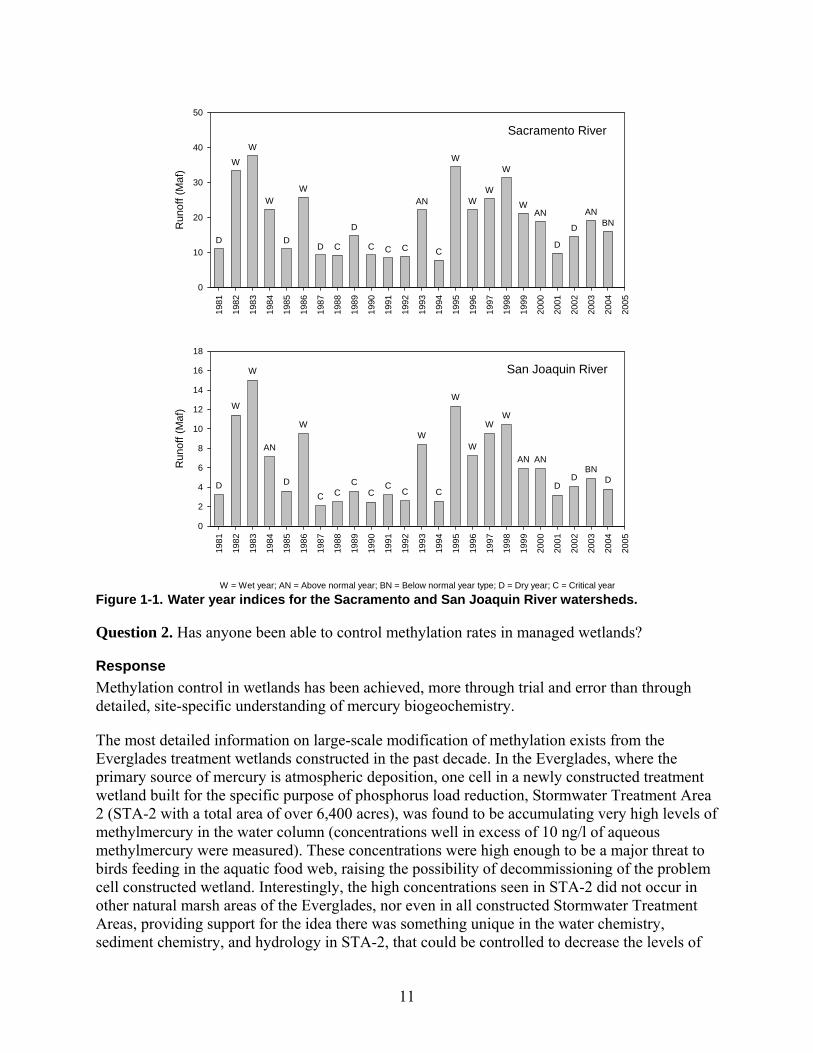
The statement that sediment flux from wetlands represents 16 percent of the total methylmercury load to the Delta was derived using tributary data for water years 2000-2003 (the major source of methylmercury to the Delta). As shown in Figure 1-1, runoff in these years was classified as two dry years and two above normal years for the Sacramento River. Runoff for the San Joaquin River was classified as two dry years, one below normal year, and one above normal year. No wet years were included when the flows on both rivers can increase substantially and within Delta sources such as urban runoff and atmospheric deposition can also increase. An evaluation was conducted for the period from 1984-2003 but only for water volumes, total mercury, and suspended sediment. Runoff during the period from 1984 to 1999 had 7 wet years, 5 critical dry years, 3 dry years, and 1 above normal year on the Sacramento River and a similar mix of wet and critical dry years on the San Joaquin River. Table 7.18 of the TMDL noted that total mercury has a significant relationship with flow in the Sacramento River and Yolo Bypass.
A long-term evaluation, similar to the one conducted for total mercury, should be conducted for methylmercury, because there are other factors that influence methylmercury loads during the course of a year. In particular, the flows are routed differently in wet years, and flows pass through the Yolo and Sutter Bypasses (as shown in Figure 7.1 of TMDL), where wetlands and intermittently flooded areas may contribute additional methylmercury. In wet years, tributary loads would increase, as would urban runoff, direct and indirect atmospheric deposition, and possibly wastewater flows. In contrast, sediment fluxes from wetlands may not increase. Thus, the percent loading from sediment in wetlands is likely to decrease. While the plots in Appendix F of the TMDL showed only weak relationships between flow and methylmercury, the monthly average methylmercury concentrations in Table F.1 showed that methylmercury was higher in January and February in the Sacramento, San Joaquin, and Mokelumne Rivers when high flows are more likely. In addition, Tables D.2 and D.3 in Appendix D of the TMDL showed that in some months only one sample per river was available, and that often more samples were available for the dry season than the wet season. The methylmercury tributary load in the wet season could therefore be underestimated, making the wetland load larger in comparison.
Furthermore, there are great variations in methylmercury fluxes from wetlands, even when the total mercury and the climatic conditions are similar. Wetland specific issues are discussed in more detail in response to Question 3 below.
11
Sacramento River
1981
1982
1983
1984
1985
1986
1987
1988
1989
1990
1991
1992
1993
1994
1995
1996
1997
1998
1999
2000
2001
2002
2003
2004
2005
Run
off (
Maf
)
0
10
20
30
40
50
D
W
W
W
D
W
D C
D
C C C
AN
C
W
WW
W
WAN
D
D
ANBN
San Joaquin River
1981
1982
1983
1984
1985
1986
1987
1988
1989
1990
1991
1992
1993
1994
1995
1996
1997
1998
1999
2000
2001
2002
2003
2004
2005
Run
off (
Maf
)
0
2
4
6
8
10
12
14
16
18
D
W
W
AN
D
W
C CC
CC
C
W
C
W
W
WW
AN AN
DD
BND
W = Wet year; AN = Above normal year; BN = Below normal year type; D = Dry year; C = Critical year Figure 1-1. Water year indices for the Sacramento and San Joaquin River watersheds.
Question 2. Has anyone been able to control methylation rates in managed wetlands?
Response Methylation control in wetlands has been achieved, more through trial and error than through detailed, site-specific understanding of mercury biogeochemistry.
The most detailed information on large-scale modification of methylation exists from the Everglades treatment wetlands constructed in the past decade. In the Everglades, where the primary source of mercury is atmospheric deposition, one cell in a newly constructed treatment wetland built for the specific purpose of phosphorus load reduction, Stormwater Treatment Area 2 (STA-2 with a total area of over 6,400 acres), was found to be accumulating very high levels of methylmercury in the water column (concentrations well in excess of 10 ng/l of aqueous methylmercury were measured). These concentrations were high enough to be a major threat to birds feeding in the aquatic food web, raising the possibility of decommissioning of the problem cell constructed wetland. Interestingly, the high concentrations seen in STA-2 did not occur in other natural marsh areas of the Everglades, nor even in all constructed Stormwater Treatment Areas, providing support for the idea there was something unique in the water chemistry, sediment chemistry, and hydrology in STA-2, that could be controlled to decrease the levels of
12
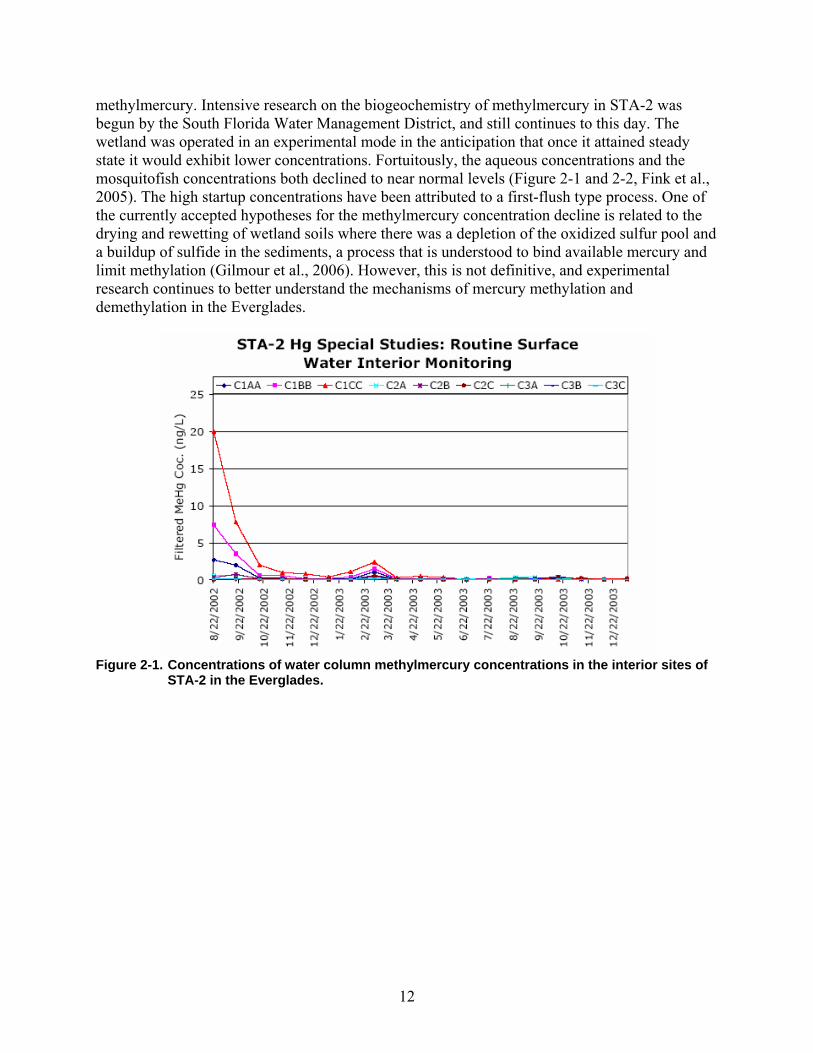
methylmercury. Intensive research on the biogeochemistry of methylmercury in STA-2 was begun by the South Florida Water Management District, and still continues to this day. The wetland was operated in an experimental mode in the anticipation that once it attained steady state it would exhibit lower concentrations. Fortuitously, the aqueous concentrations and the mosquitofish concentrations both declined to near normal levels (Figure 2-1 and 2-2, Fink et al., 2005). The high startup concentrations have been attributed to a first-flush type process. One of the currently accepted hypotheses for the methylmercury concentration decline is related to the drying and rewetting of wetland soils where there was a depletion of the oxidized sulfur pool and a buildup of sulfide in the sediments, a process that is understood to bind available mercury and limit methylation (Gilmour et al., 2006). However, this is not definitive, and experimental research continues to better understand the mechanisms of mercury methylation and demethylation in the Everglades.
Figure 2-1. Concentrations of water column methylmercury concentrations in the interior sites of
STA-2 in the Everglades.

13
Figure 2-2. Concentrations of mosquitofish mercury concentrations in the interior sites of STA-2
in the Everglades.
In the Delta, albeit on a much smaller scale than the Everglades STAs, it has been found with experiments on adjacent wetland cells in Twitchell Island, that the difference in vegetation cover and water depth can make a nearly 10-fold difference the export of methylmercury. The differences in the two ponds primarily relate to their water depth and vegetation cover. Although this empirical finding is useful, this work is currently in progress, and specific biochemical mechanisms associated with these superficial differences have not been reported. Nonetheless, comments in the grey literature (such as the May 2005 issue of the CALFED ScienceAction Newsletter) suggest that enough might be known about the fundamental processes that someday wetlands may be designed to minimize methylmercury production.
In general, our review finds that there are opportunities to influence methylation in wetlands through factors such as water depth, wetting and drying cycles, and vegetation, although the results are site specific. There are ongoing studies in the Bay-Delta ecosystem and elsewhere, that seek to identify natural conditions that are associated with different levels of mercury methylation (such as in Petaluma Marsh, Yee et al., 2005, and in Franks Tract, Gill et al. 2003) that will eventually provide information that can be used for methylation control in wetlands, but as our review of more than a decade’s work in the Everglades indicates, mercury behavior is influenced by a multitude of factors, and can be very difficult to estimate a priori.
Besides the field studies noted above, there are early reports in the literature on controlling methylation through chemical amendments, such the addition of iron to wetland sediments in laboratory tests to minimize methylation (Mehrotra and Sedlak, 2003, 2005). Similarly, other tests have been performed using the addition of activated carbon to reduce methylmercury production and biological uptake in sediments from tidal marshes (Richard Luthy, personal communication). Although plausible on a small-scale, there are no reported data on these chemical amendments having had success at the field scale.

14
Question 3. Do methylmercury production rates vary within each wetland type (e.g., permanent wetlands, spring-summer wetlands, and moist soil wetlands flooded fall through spring), or the type of restoration environments (e.g., open water, high marsh, low marsh)? Have flux loads been measured for each habitat type? What factors influence these variances?
Response In the extensive scientific literature on wetland mercury processes, there is a great deal of information to show that wetland methylmercury contributions even with similar total mercury sources and similar climates can vary substantially from wetland to wetland. The most common sources of difference are the extent of vegetation coverage and the average and variability of water depth. Specific data from Delta Islands, including direct methylmercury flux measurements are discussed below.
The estimate for the sediment flux from wetlands is based on the measured difference between inflows and outflows of water in one experimental pond on Twitchell Island (Heim et al, 2004 and Sassone et al, 2004). Two flux rates were used: 41 ng/m2/day for the warm season, defined as March through September (214 days) and 3 ng/m2/day for the cool season from October to February (115 days). These two rates were based on data in the shallower pond that had greater vegetation coverage (West Pond) in June and October 2003, respectively. Methylmercury concentrations varied over time and were less than 0.9 ng/L in the East Pond and up to 3.4 ng/L in the West Pond (Stephenson et al, 2004), which illustrates the difference in methylmercury production in the two ponds (Figure 3-1). The seasonal production of methylmercury in export water from summer 2003 to summer 2005 was 10 times higher in West Pond (Sassone et al, 2006), which is consistent with the observed difference in methylmercury concentrations in the export water from the two ponds.
Figure 3-1. Comparison of two ponds in Twitchell Island. Unpublished results from a presentation
by Mark Marvin-DiPasquale, with graphic attributed to Mark Stephenson.

15
The acreage of wetland coverage was derived from a 1997 National Wetland Inventory for the Delta (Figure 6.4 of the TMDL). No distinction was made between freshwater, tidal, or brackish wetlands and no correction was made for seasonal wetlands. The higher flux rate from the two ponds was used for all wetlands without accounting for differences in vegetation coverage or water depth, both important factors that influence production potential in wetlands. In addition to variations between wetland types, there can also be differences within a given wetland as seen in Figure 3-2.
Figure 3-2. Methyl mercury concentrations in surficial sediments collected from three wetland
areas and one control area outside the wetland area. Dark colored bars are from the interior of the wetlands, medium colored bars are mid way between the interior and fringe of the wetland, and the light colored bars are from the outer fringe of the wetland areas. (Source: Heim et al., 2003)
The sediment flux from open water habitat in the TMDL was estimated as 10 ng/m2/day based on benthic flux chamber measurements (Gill et al, 2003). Similar measurements were made for wetland areas in the same study. Sediment flux rates were estimated in wetland and open water habitats using benthic flux chambers at nine sites in the Delta (Gill et al, 2003). One of the conclusions from this work was that “sediment-water exchange rates of both total and methylmercury appear to vary significantly throughout the Delta, both temporally and spatially” (Gill et al, 2003). An example of variability of measured flux rates at a marsh is shown in Figure 3-3 and 3-4. This figure shows variations in flux rates in both marsh and open water sites, and that even at a marsh site there can be a net downward flux into the sediment. Figure 3-5 shows that flux rates vary across sites and season and that some locations may be net sinks for methylmercury rather than sources. The flux rates from the marsh sites were higher than a peat site (12 ng/m2/day). Gill estimated the total sediment flux rate to the Delta using 40 ng/m2/day for two areas with more wetlands (Cosumnes and Mokelumne Rivers), 5 ng/m2/day for the Sherman Island area, and 10 ng/m2/day for the remaining 11 areas. The total flux using this approach was 6 g/day of methylmercury, compared to 4.1 g/day in the Delta TMDL.

16
Date
May 2000 Sept 2000 Feb 2001 May 2001 Oct 2001
Met
hylm
ercu
ry F
lux
(ng/
m2 /d
ay)
-15-10-505
1015202530
100
120
140
160
180
Frank's Tract Frank's Tract Marsh
ND ND ND
ND = Not Determined
Figure 3-3. Mercury cycling in Frank’s Tract in the San Francisco Bay Delta. Grey bars indicate the
methylmercury flux from a wetland site compared to an open water site (black bars). The flux from the marsh site in October, 2001 was substantially greater than measured at the open water site during the different sampling periods. Based on data from Gill et al., 2003.
Figure 3-4. Concentration of methylmercury in the vicinity of a wetland (Frank’s Tract Marsh,
shown as FTM in the figures above. Source: Gill et al., 2003.

17
Figure 3-5. Comparison of Sediment-Water Exchange fluxes of Monomethyl Mercury in the San
Francisco Bay Delta Determined by Benthic Flux Chamber (FC) and Interstitial Pore Water Concentration Gradients (FD). CC = Columbia Cut, CR = Cosumnes River, FT = Frank’s Tract, FTM = Frank’s Tract Marsh, LH = Little Holland, PS = Prospect Slough, SI = Sherman Island, and WS = White Slough. (Source: Gill et al. 2003)
Laboratory experiments have also demonstrated the variability in methylation rates between marsh and open water habitats. For example, Slotton et al (2002) showed that flooded organic-rich wetland sediments had 2 to 30 times greater methylation potential than sediment from channels or mud/ sand flats. His work found that areas with sandy sediments and turbid water in the North Delta had lower methylmercury concentrations in the sediment and lower methylation potential than the organic-rich, heavily-vegetated sediments in the Central and West Delta.
Question 4. The cornerstone assumption of the TMDL is that fish tissue methylmercury is directly proportional to aqueous methylmercury concentration , yet this relationship is not well understood. What factors (e.g., local food web variations, water chemistry, hydrology, vegetation type) would affect this relationship and how?

18
Response The factors that control the relationship between aqueous methylmercury concentrations and fish-tissue mercury concentrations are not well described in general and can vary between locations. The relationships between the controlling factors are complex, and interactions between individual factors can affect the relationship between measured values of aqueous methylmercury and fish-tissue mercury concentrations. In this TMDL this relationship is assumed to be constant throughout the Delta. The potential differences between the hydrology-based subregions of the Delta are not addressed, and the factors that control the relationship between aqueous methylmercury concentrations and fish-tissue mercury concentrations are not adequately described.
Numerous factors can cause variability among sites regarding the ratio of MeHg concentrations in fish and water, even if using a specific fish species and standard size. Fish obtain most of their MeHg from the diet. Factors affecting the uptake of methylmercury from water to the base of the food web or uptake at higher trophic levels all have the ability to affect the ratio of MeHg in fish/MeHg in water. For example, Back and Watras (1995) reported ratios of MeHg concentrations in zooplankton/MeHg in water spanning more than 2 orders of magnitude for a set of 12 Wisconsin lakes. Different water chemistry may have contributed to differences in MeHg bioavailability for uptake by zooplankton. Pickhardt et al (2005) demonstrated the effects of zooplankton composition, algal abundance and mercury speciation on the accumulation of mercury in zooplankton. The length of the food web has the potential to affect the amount of overall MeHg biomagnification from water to predatory fish. This is because each trophic step involves an increase in MeHg concentration as fish retain the MeHg in their food more effectively than they use food for growth. Fish growth rates, fish activity levels and water temperatures also have the potential to change the ratio of MeHg in fish/MeHg in food (e.g. Harris and Bodaly 1998, Simoneau et al 2005) due to effects on the relative amount of food consumption devoted to growth. Lower growth efficiency tends towards higher fish mercury levels. Finally, the concept of a constant ratio of MeHg concentrations in fish and water may be most relevant for pelagic based food webs. MeHg concentration in fish from benthic-based foodwebs reflect exposure to MeHg in sediments as well as the water column. The ratio of MeHg in fish to MeHg in water would only remain constant for a new Hg loading scenario if sediment MeHg concentrations changed by the same proportion as MeHg concentration in water. Whether this is always the case is unknown. Overall these factors combine to result in a wide range of ratios for MeHg concentrations in fish and water, even for a standard fish species and size. Brumbaugh et al. (2001) reported a range of BAFs (MeHg in fish/MeHg water) spanning several orders of magnitude across a range of land use types.
The evidence from the literature and from our own modeling efforts suggests that fish tissue concentration is proportional to aqueous methylmercury concentrations within a homogeneous system. As a first approximation, a proportional response is a practical assumption.
The derivation of the aqueous methylmercury implementation goal to achieve the specified human health and wildlife targets in the Delta TMDL assumes the existence of a constant relationship between aqueous methylmercury concentration and fish tissue mercury concentrations across all five regions of the Delta. Yet in the five regions of the Delta there is a

19
substantial range in the factors, described above, that can cause variability in the ratio of MeHg concentrations in fish and water.
An alternative assumption is that the relationship between aqueous methylmercury concentration and fish mercury concentration in each region is linear. The consequence of this assumption is represented in Figure 4-1, where a line is drawn between the point representing the paired fish-tissue - aqueous methylmercuy concentration and the origin. For three of the five regions the predicted concentration in the fish tissue for an aqueous methylmercury concentration of 0.066 ng/L is substantially greater than the human-health target concentration of 0.24 mg/kg.
0.00 0.02 0.04 0.06 0.08 0.10 0.12 0.14 0.16Aqueous [MeHg] (ng/L)
0.0
0.2
0.4
0.6
0.8
1.0
1.2
LMB
[Hg]
(mg/
kg)
Mokelumne River
Sacramento River
San Joaquin River
West Delta
Central Delta
Figure 4-1. Representation of linear relationship between aqueous methylmercury concentration
and fish tissue mercury concentration in five regions of the Delta. Bold line represents the relationship presented in the Delta TMDL.
Question 5. Has anyone been able to demonstrate, or is it possible to make the case, that placement of dredge material on levees (or in spoil sites on islands) is a net reduction of mercury from the aquatic ecosystem? Where or how might material be placed, so it would not cause a problem when using the material to maintain levees (i.e., place on the landside back slope and/or cap it with other material, or place the material into ponds and then once the water decants off, use the material in an upland location)? Can Tetra Tech offer any suggestions for workable solutions?
Response A case was made that removing mercury-bearing sediment from the active stream channel was a reduction in mercury to the aquatic system in the Guadalupe River watershed. A guideline was developed by the RWQCB in San Francisco in August 2000 to assist several stream restoration

20
projects in the Guadalupe River watershed. This guideline specified that if the soil or sediment total mercury concentration was >1 mg/kg, but less than 20 mg/kg, it could be reused in the watershed if it was placed above the active flow channel or as backfill away from the channel. The active flow channel was specified as the channel perimeter below the water surface elevation defined by the 3-year flood recurrence interval. Soil or sediment that exceeded hazardous waste levels (e.g., greater than the TTLC of 20 mg/kg and less than the STLC criteria for leachate) had to be removed and disposed at a Class 1 landfill as hazardous waste. At present the TTLC criteria for metals are under review, so the value of 20 mg/kg for total mercury could change in the future. This reuse guideline was developed to help reduce total mercury in locations where the mercury in soil and sediment often exceeds Basin Plan criteria.
Guidelines were also developed for use of soil or sediment for wetland cover or foundation soils from the SF RWQCB Draft Beneficial Reuse of Dredged Materials: Sediment Screening and Testing Guidelines (May 2000). These guidelines specified a maximum concentration of total mercury of 0.43 mg/kg for cover soil and 0.7 mg/kg for foundation soil (not exposed to water).
The data for dredged material in Table 6.18 of the Delta TMDL show that the mean total mercury concentrations for eight areas range from 0.027 to 0.37 mg/kg, which are less than the criteria discussed above. Most of the dredged material comes from the Sacramento River and Stockton Deep Water Channel. There were only two samples from the Sacramento River Deep Water Channel (0.06 and 0.68 mg/kg), both less than the draft criteria for foundation soil that would not be exposed in the aquatic system. Current practice for dredged material in the Delta is to place the dredged sediment in ponds on Delta islands or upland areas. Two out of eight sites had return flow to the Delta, as the material dewatered.
The Implementation Plan specifies that after 2007 sediment with total mercury greater than 0.2 mg/kg (dry weight, in fine material <0.63 microns) needs to be protected from erosion due to 100-year precipitation or flooding. The criteria of 0.2 mg/kg is based on the allowable suspend sediment mercury concentration developed in the San Francisco Bay TMDL. Return flows would be allowed only if the methylmercury concentration in the water was less than the receiving water and release of sediment is minimized. Meeting these requirements is likely to require placement in a bermed area with a pond to retain the water.
Examples of other possible disposal options include placement of dewatered, dredged material on the upper part of levees on the island side only or in upland areas as fill. Material on the lower part of the island side could be affected by seepage, if it occurs. Use of material on the upper part of the river side of the levees could be subject to erosion or flooding, which could result in the material being placed back in the aquatic system. Placement on the island side of levees or in upland areas would keep the materials out of the aquatic system. However, these options are unlikely to meet the above requirements, unless covered by soil to prevent erosion during the 100-year precipitation or flood event. Another provision in the Implementation Plan related to dredged material may hinder dredging projects. This provision is that before and after sediment monitoring must be conducted to show that the newly-exposed sediment has less average total mercury than the previous material. This provision could require overexcavation and placement of clean sediment in areas where old hydraulic mine tailings or contaminated sediment are encountered, which could occur on the Sacramento River and at other locations draining the Sierras.
21
In February 2006, a State of Emergency was declared for California’s Levee System. Of 24 critical erosion sites identified in the Central Valley, 11 were located within the legal Delta boundary. Funding for levee repairs is included in the proposed November 2006 bond measure. CalFed developed a Delta Levee Emergency Management and Response Plan and a Levee System Integrity Program Plan. The plans did not include detailed guidelines on disposal of dredged material or assessment of mercury concentrations in borrow material used for the delta levees. However, development of such guidelines could streamline repair and maintenance work on the levees. The importance of repair and maintenance of the levees is paramount, and thus necessary work is likely to be conducted, but costs may increase to meet the above new requirements in addition to the requirement for sampling of both total and methylmercury before and after the dragging is conducted.
Question 6. A fundamental deficiency in the TMDL linkage analysis is the effects of source control, which is the focus of the implementation plan. What is our current understanding of the effects of the source controls stipulated on methylmercury in fish tissue?
Response The 0.06 ng/l methylmercury implementation goal and the 110 kg/yr reduction in total mercury loading to the San Francisco Bay provide the basis of the stipulated source controls. Control actions based on existing estimates of methylmercury concentrations are specified for seven source categories. The primary concern regarding the stipulated controls is captured in the response to Question 4. The methylmercury implementation goal assumes the existence of a constant relationship between aqueous methylmercury concentration and fish tissue mercury concentrations across all five regions of the Delta. However, the data suggest that the difference in the ability to translate MeHg concentration in water into MeHg in fish tissue between sites is greater than a factor of 2. Additionally, the data upon which the relationship between aqueous MeHg and fish tissue mercury concentrations is derived may not correctly represent conditions in each region. A second concern with the stipulated source controls is the need to account for mercury behavior within and between individual regions of the Delta. For example, achieving aqueous MeHg reductions through source control alone may not be sufficient to meet the specified implementation goal. Studies showing declines in fish tissue mercury concentrations with the implementation of source controls sometimes exhibit a plateau effect. Methylmercury production occurs within the system, and further source controls do not lead to comparable reductions in fish tissue concentrations. More emphasis should be placed on identifying internal sources of methylmercury production in the Delta. The source control strategy does not account for the effect of methylmercury production in one region and transport to adjacent regions.
These concerns point to the importance of the Characterization and Control Studies that are a requirement of the TMDL. These studies need to be carefully designed and implemented to address the concerns with the relationship upon which the implementation goals are based and to identify the internal processes controlling MeHg production and fate within the Delta.
Question 7. Given that 60% of the methylmercury loads are from tributary sources not addressed in this TMDL, what studies would be necessary to determine how much source reduction from the entire watershed in total (all sources within the entire Sacramento River watershed, including those in the Delta TMDL boundary) is necessary to achieve the 0.06 ng/l aqueous methylmercury goal?

22
Response For the purpose of this analysis, we think the Regional Board should consider looking at the Department of Water Resources Delta Simulation Model (DSM2) to estimate the nature of water flows in the Delta in wet and dry years and in the wet and dry seasons. Because of the importance of water flows in the Delta to water quality for many purposes, in particular the withdrawal of Delta water for municipal water supply, the DSM2 has been applied extensively, and is the best representation of Delta hydrodynamics that we know of. An example of the estimated flow contribution by different sources to the Banks pump stations from 1990-2004 is shown in Figure 7-1. Similar estimates can be made for other locations and the relative contributions of tributary flows to each of the 8 Delta subareas identified in the TMDL can be inferred. Loads can be estimated using average monthly or seasonal concentrations. These loads can be coupled with estimates of net sediment flux rates, photodemethylation rates, and other estimates of in-Delta methylmercury loads, to compute mass balances for each of the 8 subareas. An estimate of photodegradation was made in the TMDL of 4 g/day (~60% of the total unknown loss term in the Delta methylmercury budget). Further investigation of photodegradation in the tributaries and Delta sloughs is important. To a certain extent, this mass balance has been performed, but for the Delta as a whole and not for individual subareas. Performing this evaluation at the subarea level is important, because there are clear differences in mercury processes in each. This approach will identify the nature of tributary contributions in different subareas, as well as the unknowns in the different source/sink terms, and can be used to quantify the extent that tributary loads contribute to the methylmercury problem, and the extent of load reduction that might be required to attain a 0.06 ng/l target. To the best of our knowledge these calculations can be performed, at least as a first approximation, using existing data and model runs.
The computed loads for the years 2000 to 2003 show that 60 percent is from tributaries, but this percentage applies only to that period. Because of the large increases in flows during wet years, the percentage of tributaries is likely to increase for longer periods with several wet years. The Sacramento River is the largest contributing tributary (41%) and is part of the flow to the Yolo Bypass (11%). Thus, control of sources could focus on that watershed. In addition, there is an important difference between calculations and actual influx of methylmercury into the interior portion of the Delta. Figure 6.12 in the TMDL shows decreases in methylmercury concentrations as the Sacramento River flows downstream. There are several processes that contribute to this loss, photodegradation, uptake by biota, and binding to particles and subsequent sedimentation. The detailed flow modeling and subarea budget analyses discussed above, would help to determine actual inputs to the subareas.

23
Volume Fingerprint at Banks Pumping Plant (SWP)
0%
20%
40%
60%
80%
100%
J-90
J-91
J-92
J-93
J-94
J-95
J-96
J-97
J-98
J-99
J-00
J-01
J-02
J-03
J-04Pe
rcen
t of W
ater
by
Sour
ce
Other Ag Central Ag East Mtz Sac SJR
Figure 7-1. Long-term percentage contribution of flows at the Banks Pumping Plant (data provided
by DWR).
The Implementation Plan has actions that apply to the legal Delta area and 30 miles upstream of the Delta boundary. Specific allocations to various sources are listed for most sources in the Implementation Plan. What is missing is how these load reductions can be accomplished. The same percent reduction is given to agriculture, wetlands, and wastewater plants within a given subarea, regardless of what is feasible or the size of the wetland or wastewater plant. For example, a review of methylmercury concentrations and flow rates by plant in Appendix G and information on processes used may identify some plants where controls may be able to achieve significant reductions. With respect to agriculture and wetlands, more detailed characterization of methylmercury discharges is needed. Factors that influence agricultural drains include crop, timing of irrigation of crops and method, and soil type. Factors that influence wetland discharges include extent and type of vegetation, water depth, water composition (i.e. fresh, brackish, or tidal), and soil type. Following the characterization studies, revised loadings could be estimated based on the data for agricultural drains and extent of the different types of wetlands.
Another factor that makes methylmercury different from other parameters addressed in TMDLs is that there can be direct sources of methylmercury (e.g. from a wastewater treatment plant discharge) or it can be produced from inorganic mercury in sediment or water under the appropriate geochemical conditions. Thus, source reduction can be accomplished in different ways: decreasing a direct methylmercury source, reducing input of inorganic mercury sediment into wetlands such as by adding sedimentation basins to capture suspended sediment prior to flow into the interior Delta, or altering the geochemical conditions in an area such as decreasing extent of the vegetation cover or decreasing the hydraulic residence time in a slough or wetland.
To identify feasible ways to reduce methylmercury from the tributaries, the first step would be to conduct a watershed assessment to determine if there are specific point sources that could be reduced, the extent of riparian wetlands along the river which could be generating methylmercury, and evidence of mine tailings or contaminated sediments in the channel or along the banks. The next step would be to compile existing water quality and sediment data to verify if elevated mercury concentrations were detected in water or sediment in the observed wetlands

24
or in the reaches with tailings. Sampling should be conducted to supplement available data. The combined new and existing data sets would be used to identify areas that represent methylmercury sources or areas where high inorganic mercury is present that could be protected from erosion, covered, or removed. The purpose of these investigations would be to identify the most feasible areas for source reduction. The Implementation Plan requires development of a control program for methylmercury in the tributaries to the Delta for each source category, but does not describe what the study would entail.
Question 8. Given that mercury is naturally occurring in the highly erosive Coastal Range, what studies could be added to this TMDL to address the expected background methylmercury concentration in Delta waters and Delta fish?
Response Determining natural background concentrations in the Delta area is difficult due to the extensive mercury and gold mining activities that occurred. Gold mining occurred throughout the Sierra foothills drained by a series of rivers to the Delta, while mercury mines in the Coast Range were more isolated. An estimate of natural background concentrations could be obtained by sampling water, sediment, and fish in creeks draining the Coast Range that have not been affected by mercury mines or geothermal hot springs that also can contain mercury. Candidate creeks would need to be south of the Putah and Cache Creek watersheds, which are affected by mercury mines. Examples of creeks that could be sampled after a detailed check to be sure that no mines were present in their watersheds include: McCune, Sweeney, Ulatis, and Alamo Creeks, which all drain to the Delta through Cache Slough. Ulatis Creek was sampled and the data used in the TMDL (6 samples for methylmercury from 0.004 to 0.32 ng/L with a median of 0.24 ng/L). These data show comparable concentrations to Marsh Creek (See Table 6.3 in the TMDL). These limited data suggest that tributaries of the Coast Range have elevated mercury, which is then converted to methylmercury in the downstream tributaries. Alternative tributaries west of the Delta boundary include Suisun and Green Valley Creeks. The selected creeks could be sampled at multiple locations for total and methylmercury in water, sediment, and small fish at each location.
To complement the field study, existing data could be compiled and evaluated for other water bodies draining the Coast Range that were not influenced by mercury mining. Napa and Sonoma Counties may have a number of creeks that may meet these criteria. A detailed check would be conducted first to identify creeks with mercury mines in their watersheds, and those creeks would not be evaluated. Existing water, sediment, and fish data for creeks without mine influences in the Napa and Sonoma River watersheds could be compiled to determine the range of mercury concentrations observed. Statistical comparisons could then be compared to data from tributaries draining to the Delta and data from within the Delta boundary. This information could be used to evaluate the likelihood of achieving the TMDL goal for methlymercury in water of 0.06 ng/L and the specified fish targets.
Question 9. Impacts on Beneficial Uses of Wetlands/habitat creation, flood control, and agriculture

25
Response The Implementation Plan states that “it is not their intent to inhibit habitat restoration, flood conveyance, water management and other beneficial projects”. However, such projects may be more expensive to implement and there could be restrictions, if the TMDL is implemented. Examples of extra costs include contributions to the required characterization and control studies, additional treatment if needed to meet the requirement that the methlymercury in the discharge water be equal or less than the source water after adoption of the Basin Plan Amendment and 2014, and additional costs for soil or sediment disposal if the mercury concentration is greater than 0.2 mg/kg. The data from the characterization studies will be used by the Board to develop detailed allocations by December 31, 2013. If these studies show that the allocations are infeasible, a mercury offset program may be implemented.
Existing wetland restoration projects could be impacted by two of the Implementation requirements: 1) participation in characterization and control studies, and 2) the requirement that the methylmercury concentration in the discharge water be less than or equal to the source water. Meeting the discharge criteria will require water quality monitoring of methylmercury and total mercury to show that the CTR criteria of 50 ng/L is also met. If the discharge criterion is not met, treatment or BMPs such as sedimentation basins or routing the discharge through an underdrain may need to be implemented prior to discharge. Such requirements may be difficult for small agencies or land owners to meet due to funding constraints.
New wetland or habitat restoration projects would be affected by the above discharge quality criteria, and the proposed sediment criteria. The Implementation Plan specifies that after 2007 sediment with total mercury greater than 0.2 mg/kg (dry weight, in fine material <0.63 microns) needs to be protected from erosion due to 100-year precipitation or flooding. The criteria of 0.2 mg/kg is based on the allowable mercury concentration of suspended sediment developed in the San Francisco Bay TMDL. In addition, there is another provision that before and after sediment monitoring must be conducted to show that the newly-exposed sediment has less average total mercury than the previous material. This provision could require overexcavation and placement of clean sediment in areas where old hydraulic mine tailings or contaminated sediment are encountered. Locations along the Sacramento River and at other locations draining the Sierras could have deeper mercury in the subsurface sediment. Wetland restoration projects proposed by non-profit organizations such as The Nature Conservancy, Ducks Unlimited, or individual cities may not have sufficient funds to address the new requirements. The additional costs may make some projects economically infeasible.
The Implementation Plan takes a position that methylmercury concentrations will be decreased by given dates, but does not take into the account the practicality of achieving the proposed reductions. Agricultural discharges will need to meet the requirement that the methylmercury concentration in the discharge water be less than or equal to the source water and the CTR criteria of 50 ng/L for total mercury. Characterization and control studies are needed to determine the seasonal water quality of agricultural drains and new BMPs may need to be developed. BMPs need to consider the different irrigation practices of various crops and the ability to change current practices. For vegetable crops or orchards, a shift to drip irrigation may help to reduce both the quantity and mercury concentrations of the discharge, in that the water is more likely to seep into the soil where it can be adsorbed to particles, rather than run off. Drip irrigation would need to be evaluated to see if it is cost-effective for a given crop and property.

26
For rice fields where the current practice is flood irrigation, suitable BMPs may require sedimentation basins or other treatment methods prior to discharge, since drip irrigation is not appropriate.
Flood control projects could be impacted by the new requirements for dredging. New disposal sites may be needed to meet the requirement that after 2007 sediment with total mercury greater than 0.2 mg/kg (dry weight, in fine material <0.63 microns) needs to be protected from erosion due to 100-year precipitation or flooding. Return flows from dredged material disposal sites must have methylmercury concentrations that are less than the receiving water, which could require a sedimentation basin or other treatment method. The other new provision is that before and after sediment monitoring must be conducted to show that the newly-exposed sediment has less average total mercury than the previous material. This provision could require overexcavation and placement of clean sediment in areas where old hydraulic mine tailings or contaminated sediment are encountered, which could occur on the Sacramento River where much of the dredging takes place. Because of the importance of levee protection and flood controls, projects are unlikely to be stopped, but costs may increase.
References Austin, C. 2006. Guadalupe River Watershed Mercury Total Maximum Daily Load (TMDL) Project Report. San Francisco Bay Regional Water Quality Control Board.
Back, R.C. and C.J. Watras (1995) Mercury in Zooplankton of Northern Wisconsin Lakes: Taxonomic and Site-Specific Trends. Water, Air and Soil Pollution 80:931-938
Brumbaugh, W. G., D. P. Krabbenhoft, et al. 2001. A National Pilot Study of Mercury Contamination of Aquatic Ecosystems Along Multiple Gradients: Bioaccumulation in Fish, U. S. Geological Survey: iii + 25.
CALFED (2005) ScienceAction—News from the California Bay-Delta Authority Science Program, May 2005 issue. Available on the Internet at http://www.southbayrestoration.org/pdf_files/national_sci_panel/CalfedSciActMay2005-final.pdf#search=%22twitchell%20island%20mercury%22.
CDHS, 2006. Fish Mercury Project: Fishing activities in the North Delta and Sacramento River Watershed 2006. California Department of Health Services. June 6, 2006.
Fink, L., J. King, P. Adak, and F. Matson (2005) Appendix 2B-2: STA-2 Mercury Special Studies Project Report, South Florida Environmental Report.
Gill, G.A., K-Y Choe, R. Lehman, and S. Han, 2003. Water Exhange and Estuarine Mixing Fluxes of Mercury and Monomethylmercury in the San Francisco Bay Estuary and Delta (Task 4B). Final Report. CALFED Bay-Delta Mercury Project Final Report
Gilmour, C., D. Krabbenhoft, W. Orem, G. Aiken, E. Roden and I. Mendelssohn (2006) Appendix 2B-2: Status Report on ACME Studies on the Control of Hg Methylation and Bioaccumulation in the Everglades, 2006 South Florida Environmental Report, prepared by the South Florida Water Management District.

27
Harris, R.C. and R.A. Bodaly (1998) Temperature, growth and dietary effects on fish mercury dynamics in Two Ontario Lakes. Biogeochemistry 40(2/3):175-187.
Heim, W.A., E.R. Sassone, and K.H. Coale. 2004. Mono-Methylmercury production within the Bay-Delta. Abstract in Northern California chapter of the Society of Environmental Toxicology and chemistry (SETAC), Hot Topics in Environmental Toxicology and chemistry, 14th Annual meeting, May 11-12, 2004, Davis, CA. SETAC press, pp:18-19.
Heim, W.A., K. Coale, M. Stephenson, 2003. Methyl and Total Mercury Spatial and Temporal Trends in Surficial Sediments of the San Francisco Bay-Delta Assessment of Ecological and Human Health Impacts of Mercury in the Bay-Delta Watershed, CALFED Bay-Delta Mercury Project Final Report.
Heinz G.H., 1979. Methylmercury: reproductive and behavioral effects on three generations of mallard ducks. J. Wildlife Management. 43(2):394-401.
Looker, R. and B. Johnson. 2004. Mercury in San Francisco Bay: Total Maximum Daily Load (TMDL) Proposed Basin Plan Amendment and Staff Report. San Francisco Bay Regional Water Quality Control Board.
Mehrotra, A.S. A. J. Horne, and D. L. Sedlak (2003). Reduction of Net Mercury Methylation by Iron in Desulfobulbus propionicus (1pr3) Cultures: Implications for Engineered Wetlands, Environ. Sci. Technol., 37 (13), 3018 -3023.
Mehrotra, A.S. and D. L. Sedlak (2005). Decrease in Net Mercury Methylation Rates Following Iron Amendment to Anoxic Wetland Sediment Slurries, Environ. Sci. Technol., 39 (8), 2564 -2570.
Pickhardt, P. C., C. L. Folt, et al. 2005. Impacts of zooplankton composition and algal enrichment on the accumulation of mercury in an experimental freshwater food web. Science of the Total Environment 339(1-3): 89-101.
Sassone, E.R., W.A. Heim, A. Byington, M. Stephenson, and K.H. Coale. 2004. Methylmercury export from two experimental ponds on Twitchell Island, California. Poster Presentation, Northern California chapter of the Society of Environmental toxicology and chemistry (SETAC), Hot Topics in Environmental toxicology and chemistry, 14th Annual Meeting, May 11-12, 2004. Davis, CA.
Sassone E., M. Stephenson, and K. Coale, 2006. Abstract Methyl Mercury Production in two California Delta Freshwater Ponds. 8th International Conference on Mercury as a Global Pollutant. Madison, WI Aug 6-11, 2006.
SF RWQCB, 2000. Draft Staff Report Beneficial Reuse of Dredged materials: Sediment Screening & Testing Guidelines. May 2000.
Simoneau, M., M. Lucotte, S. Garceau, and D. Laliberté (2005). "Fish growth rates modulate mercury concentrations in walleye (Sander vitreus) from eastern Canadian lakes". Environmental Research 92:73-85.

28
Slotton, D.G., S.M. Ayers, T.H. Suchanek, R.D. Weyand, and A.M. Liston, C. Asher, D.C. Nelson, and C. Asher. 2002. The effects of wetlands restoration on the production and bioaccumulation of methylmercury in the Sacramento-San Joaquin Delta, California. Report for the CALFED Bay-Delta Agency. 76 pp.
Slotton, D., S. M. Ayers, T. H. Suchanek, R.D. Weyand, and A. M. Liston. 2004. Mercury bioaccumulation and trophic transfer in Cache Creek watershed of California in relatin to diverse aqueous mercury exposure conditions. CALFED Bay-Delta Program Project Final Report. January 25, 2004.
Slotton, D. 2005. Analysis of TMDL mercury criterion calculations for Cache Creek Fish and Water. Technical Review for Yolo County. April 3, 2005
Special Studies Project Report, 2005 South Florida Environmental Report, prepared by the South Florida Water Management District.
Stephenson, M. Undated. Data in Presentation “Understanding Mercury in the San Francisco Bay Watershed: Synthesis of scientific findings from CALFED funded projects.”
US EPA (2001). Water Quality Criterion for the Protection of Human Health: Methylmercury, EPA-823-R-01-001. Office of Science and Technology, Office of Water, Washington, DC.
Yee, D., Collins, J., Grenier, L. et al. (2005) Mercury and Methylmercury Processes in North San Francisco Bay Tidal Wetland Ecosystems- CalFed ERP02D-P62 Annual Project Report 2005. Available on the Internet at http://calwater.ca.gov/Programs/EcosystemRestoration/Mercury_Project/2005_AnnualReport/ERP02D_P62_PetalumaHg2005.pdf#search=%22%22mercury%20and%20methylmercury%22%20%22North%20San%20Francisco%22%20Yee%22