deloitte us - performance magazine | issue 31...4 performance magaine issue 31 2020 will be a year...
TRANSCRIPT

A triannual topical digest for investment management
professionals
January 2020
EMEA
#31
Value-Added Services (VAS) is the new banking battlefield
Page 06
Data sharing in financial services Five techniques to enhance privacy and confidentiality
Page 10
Shareholders’ Rights regulation The undercover game changer
Page 22
Asset management disruptedUnlocking the potential of artificial intelligence in fixed income investing
Page 52
2
Performance magazine issue 31
In this issue
Page 6 Page 18 Page 22
06Value-Added Services (VAS) is the new banking battlefield
34PRIIPs & MiFID 2 transaction costs for funds Behind the scene of the drama

3
Performance magazine issue 31
Page 34 Page 40 Page 52
10Data sharing in financial services Five techniques to enhance privacy and confidentiality
40The Italian asset management sector An attractive market
18An interview with Blackstone’s head of Real Estate Europe
48Building a robust model risk management framework in financial institutions
22Shareholders’ Rights regulation The undercover game changer
52Asset management disruptedUnlocking the potential of artificial intelligence in fixed income investing
28Industry interested in technological developmentDeloitte European Operations & Technology Survey

4
Performance magazine issue 31
2020 will be a year to remember. It is the start of a brand-new decade full of opportunities and challenges, Deloitte as a global firm will be celebrating its 175th anniversary, Deloitte Luxembourg will be marking its 70th birthday and finally, Performance is 10 years old. As we mentioned in the previous edition (our 30th!), we will continue to provide pearls of wisdom to you, our readers, and this edition is no exception.
In continuing our world tour, this time we have landed in Poland and have leapt straight into discovering the new banking battlefield of Value Added Services. Apparently, some banks are already assisting customers in booking holidays! Maybe one day soon, we could buy public transport tickets whilst conducting our online banking transactions. Exploring this theme further leads us to the thorny issue of privacy and confidentiality; keeping any data secure is a challenge but one which is significantly magnified in the domain of financial services. Deloitte has worked with The World Economic Forum since 2015 on this very topic and in this edition, we are thrilled to share with you five privacy enhancing techniques including federated analysis, homomorphic encryption and secure multiparty computation. Will these become the buzz phrases of the decade?
From Poland, we fly to Italy to discover that the booming Italian asset management industry set a new record for assets under management in the third quarter of 2019. According to the authors, a key factor for this record is the Italian population’s propensity for saving. Many studies have shown that even in today’s low interest rate environment, savings should remain a fundamental part of our financial narrative. Studies aside, basic mathematics shows us that even without factoring in compound interest, by setting aside €20 every week
for one year, you will save €1,040 to treat yourself or your loved ones.
No edition of Performance is complete without readers’ contributions; this time we spoke to Blackstone to delve into real estate management with their thoughts on leveraging data analytics, reviewing operational models, and people development being on the agenda.
As part of our real estate focus and as befits the start of a new year, Deloitte conducted its European Operations and Technology Survey. Unsurprisingly, the key challenges of adapting to evolving market conditions, changing regulatory environment, and fast changing technological landscape dominated the results. However, despite these challenges, the sector remains optimistic with strong intentions to invest in technology and innovation.
One theme that is sure to dominate our industry during the next decade is the continued advance of technological innovation, automation, artificial intelligence, and machine learning technology. However, this comes with a substantial price tag–that of ensuring the existence of robust risk management frameworks coupled with experienced personnel to assess, monitor, and mitigate the risks. Our experts are on hand to provide not only guidance and support, but can also help you unlock the potential of these advances to enhance your business strategy and models.
Exceptionally for a foreword, we’d like to close this particular anniversary edition with an inspirational quote from Robert Burns, the famous Scottish poet: “dare to be honest and fear no labor.”
Foreword
Vincent Gouverneur EMEA Investment Management Co-Leader
Tony GaughanEMEA Investment Management Co-Leader

5
Performance magazine issue 31
Dear Readers,
The investment fund industry in Poland is small, but has significant growth potential. It is currently undergoing a transformation, particularly in the development of third pillar pensions. At the same time, intensifying pressure on distribution fees in the wake of MIFID 2, is seeing banks favor their own asset management subsidiaries and challenging insurer-owned and independent players to develop other channels.
With €60 billion-worth of net assets (UCITS and AIFs) at the end of 2018, Poland has a share of just 0.4 percent in the European investment fund industry. By comparison, Poland’s GDP accounts for 3.1 percent of the EU28 total. Net assets have grown at a five-year CAGR of 6 percent in local currency terms, only slightly ahead of nominal GDP, but growth should accelerate over the next few years.
Investment funds in Poland have faced net outflows in two of the last five years (including minus €3 billion in 2018). The biggest factor in the past year has been the withdrawal of funds from corporate investments in non-public assets. At the same time, the decline of the equity market (Poland’s WIG index fell 9.5 percent in 2018) increased risk aversion among retail investors, driving a switch to money market funds as well as deposits.
The net replacement ratio in Poland is just 39 percent (vs. 71 percent EU average), which is one of the lowest in Europe, indicating a need for a much higher level of private savings to maintain living standards in retirement. Other major countries with lower replacement ratios based on mandatory systems (i.e. UK and Germany), have well-developed voluntary pensions.
Meanwhile, structural reforms are underway in Poland that will boost
investment funds. Employer sponsored pension plans (PPK) have been made mandatory for employers (of >11 million employees). Defined contributions for PPK are between 2-8 percent of wages. Implementation of PPK has already kicked off for Poland’s largest firms (>250 employees) in H2 2019 and the obligation will be extended to smaller employers in 2020 and early 2021.
In 2020, the Polish government also plans to transform the country’s second pillar pension funds (OFE), which counted €38 billion in net assets at the end of 2018. The default option for fund participants will be a transfer into investment-fund-company-managed third pillar individual retirement accounts (IKE).
Investment fund management fees in Poland have been relatively high historically (~3.3 percent on average for equity funds; ~2.6 percent for absolute return and mixed funds) and must fall according to Poland’s FSA. The regulator has set a cap of 3 percent in 2020 that will be reduced to 2.5 percent in 2021 and 2 percent in 2022. Fees for newly launched PPK are statutorily capped at just 0.5 percent. Moreover, due to MIFID 2, distributors’ fees for investment funds should now be based on a cost-up analysis, tied to client services.
As investment managers contend with pressure on fees and vie to take advantage of market opportunities, the competitive landscape is changing. Players are seeking advantage in scale or considering an exit, which is driving industry consolidation. Banks, which dominate distribution, must decide whether to favor their own investment management subsidiaries. This in turn is posing a challenge to insurer-owned and independent asset managers to develop alternative distribution channels, including corporate sales and intermediaries.
Editorial
Please contact:
Simon Ramos Partner Advisory & ConsultingDeloitte Luxembourg 20 Boulevard de KockelscheuerL-1821 Luxembourg Grand Duchy of Luxembourg
Tel: +352 451 452 702 Mobile: +352 621 240 616 [email protected] www.deloitte.lu
Simon RamosEditorialist
Grzegorz Cimochowski Strategy & Operations | CE FSI Strategy Consulting Leader | FSI Leader in Poland

6
Performance magazine issue 31
7
Performance magazine issue 31
Value-Added Services (VAS) is the new banking battlefieldGrzegorz Cimochowski Partner Consulting Deloitte
Daniel Majewski Senior Manager Consulting Deloitte
Nowadays, it is hard to find a bank or FinTech unaware of the importance and impact of digitalization on the financial sector. For years, the focus was put on a simple transition of traditional banking operations from branches through the internet and then through mobile channels. However, as customers’ needs have evolved, it has become clear that clients expect digital customer experience vastly exceeding basic “branch” functionalities. In other words, simply putting a branch into the internet or mobile channel was not good enough.
The pressure to move beyond banking comes not only from clients, but also from two other sources. Firstly, it is fueled
by incumbents searching to differentiate. Our recent research has shown that only 20 percent of retail customers believe that digital channels differ significantly between banking
institutions. Secondly, regulators force banks to open up their infrastructure to third parties (e.g. PSD2). As a result, banks have been keen to look for differentiation opportunities outside of the traditional banking realm, mainly in non-financial services that focus on beyond-banking functionalities; value-added services.

8
Performance magazine issue 31
A myriad of VAS ideas, yet a lack of coherent visionThe discussion about VAS is hindered by the lack of clear structuring. On the one hand, we are talking about services that have been available at some banks for a long time, and on the other hand, we face different definitions of VAS. The complexity is driven also by the sheer number of VAS use cases, as we have identified as many as 200 different services on a global scale. Some are more obvious, such as the sale of public transport tickets, but some are not. To cut through the noise, Deloitte experts analyzed VAS among global digital financial champions and identified five categories of such services: loyalty (loyalty programs), commercial offers (purchase platforms, discounts), consultancy (tax, cybersecurity), digital administration (eGovernment services), and mobility services (e.g. car rentals). To understand the customers’ point of view, we carried out quantitative research and surveyed more than 1,000 digital banking users in Poland questioning about VAS usage, channel preferences, and monetization potential. The analysis has clearly shown that beyond-banking services can be the next big game changer in the financial sector, but the success will depend on incumbents’ ability to find functionalities, which are at the same desired by customers, feasible for implementation and viable from business perspective.
Three different models of VAS integration into the banking value propositionIn such a diversified VAS ecosystem, banks are introducing different models that are able to adapt new possibilities into an existing offering. Depending on the role of beyond-banking offerings vs. core services, there are three common archetypes:
• VAS as an add-on to a core banking value proposition
• VAS as complementary features to cover comprehensive customer journey
• VAS as a core value proposition, with financial offering as an add-on
In markets in which beyond-banking features are still a novelty, VAS is typically introduced next to core financial services as differentiators. They do not yet play a critical role in the customer value proposition, but are rather leveraged as differentiators or acquisition hooks for the sake of marketing activities. The most common examples of such features include the integration of public transport tickets and loyalty cards within digital channels of financial institutions. The demand for such services was also confirmed in our research, as 61 percent of customers would like to buy public transport tickets on banking platforms. However, selective inclusion of individual VAS use cases is
not enough to positively impact customer experience. This is why leading banks have decided to pursue the second model of beyond-banking services integration: VAS as a solution to comprehensively cover customer journey.
In markets like Nordic countries or Singapore, VAS has already become a standard in banking and are present in customers’ common life. Banks offer, for example, advice on real estate purchase, career development, assist in dealing with public admin matters, or booking holidays. In the Scandinavian markets, virtual government services (based on an identification scheme) are particularly advanced and banks are trying to position themselves as “go-to” advisers for every stage of the client's life. On the banking websites, you can find the "My Life" tab, where, for example, career counseling is offered (i.e. you can make an appointment with an adviser at a bank branch) in order gain support in finding suitable job opportunities. VAS is combined with financial services to build integrated offerings, which are reflected in end-to-end coverage of customer journey. It is especially visible in the case of real estate transactions (a combination of mortgage products with advisory services offered by solicitors and valuators) and SME segment (current accounts integrated through digital banking with accounting services and invoicing systems).
VAS models focused on the customer journey provide strong differentiation potential, and financial institutions are successfully leveraging it to innovate banking products that otherwise could be treated as commodities. However, even in this archetype, beyond-banking services are still integrated to support financial services and they do not drive customer engagement on their own. To change this status quo, Asian players followed a different approach: they embedded financial services into e-commerce, instant messages, or internet services. For many years it was hard to find such platforms in Europe, hence many market commentators suggested that VAS-powered ecosystems would not be successful in this region. OTP,

9
Performance magazine issue 31
the largest Hungarian bank, proved them wrong. A few years ago, the bank created the “Simple” platform, which aggregates over 40 VAS in one application. This solution is available to both OTP clients and other banks' clients. The success of such an approach and high demand for VAS is evidenced by the fact that the application is used by over 700,000 people—almost twice as many as the traditional mobile banking application of the OTP bank and the majority of clients have no relationship with OTP.
Watch out for privacy issues, yet financial institutions have advantageOur recent survey also shows that more and more people are paying attention to privacy issues. In the case of VAS, the benefit for the bank's client is that the client has access to various services in one place and that only one trusted entity guards the data. Thus, the customer gains both the convenience and security benefits. These aspects are very important for the young generation, but the older generation also appreciates them. In the study, we see that the most open to digital services are affluent clients, those who have a larger number of banking products and often an account at several different financial institutions.
Banking institutions are in a convenient position to solve the biggest problems users associated with digital services. As much as 59 percent of the respondents are irritated by the need to open multiple new accounts via websites to use services or offers. In turn, 56 percent of the respondents rejected using a digital service at least once for fear of the privacy breach. Banks have a unique advantage in that customers trust them. 67 percent of the respondents think that the banks can take better care of their data privacy than technology companies can. Therefore, VAS may be what allows financial institutions to stand out, especially as nearly half of the respondents believe that, at the moment, the online banking and mobile banking services of individual institutions do not differ significantly. Entering non banking services appears inevitable scenario for banks. The only question is "how".
To the point
• A myriad of VAS ideas, yet a lack of coherent vision
• Three different models of VAS integration into the banking value proposition
• Watch out for privacy issues, yet financial institutions have advantage
• Banking institutions are in a convenient position to solve the biggest problems users associated with digital services

10
Performance magazine issue 31
Data sharing in financial services Five techniques to enhance privacy and confidentiality
Ishani MajumdarSenior ConsultantOmnia AIDeloitte
Bob Contri PartnerGlobal Financial Services Industry LeaderDeloitte
Rob GalaskiPartnerGlobal Managing Partner, Banking & Capital Markets Deloitte
In financial services, data sharing is fraught with tension. On the one hand, it can help fight transaction fraud, deliver more personalized advice to customers, and detect the buildup of systemic risks. On the other hand, customers are increasingly wary about how their data is stored and used—and, as reforms like the EU’s General Data Protection Regulation and the UK’s Open Banking show, regulators are inclined to agree.
That, in a nutshell, highlights the competing obligations surrounding privacy: there’s value in sharing data, but protecting privacy and confidentiality is a critical responsibility of any financial institution.

11
Performance magazine issue 31
Since 2015, Deloitte has worked with The World Economic Forum to gauge the forces of change in financial services. In the most recent phase—which will be reported in the forthcoming report Navigating uncharted waters: A roadmap to responsible innovation with AI in financial services—we discovered these competing obligations surrounding privacy and data sharing. This in turn led to a deeper examination of ways to unlock the value that shared data can provide without threatening privacy and confidentiality.

12
Performance magazine issue 31
Where noise is added to a dataset so that it
is impossible to reverse-engineer the
individual inputs.
Differential privacy
Where data is encrypted before
sharing, such that it can be analyzed but not decoded into the original information.
Homomorphic encryption
Where data analysis is spread across multiple
parties such that no individual party can
see the complete set of inputs.
Secure multiparty computation
Where parties share the insights from the analysis of their data without sharing the
data itself.
Federated analysis
Where users can prove their knowledge
of a value without revealing the value
itself.
Zero-knowledge proofs
Privacy enhancing techniquesThis report explores five key “privacy enhancing techniques”.
The report also provides a high-level overview of how each technique works, the types of data sharing problems they can be used to solve, and the subsectors of financial services in which they are most immediately applicable.
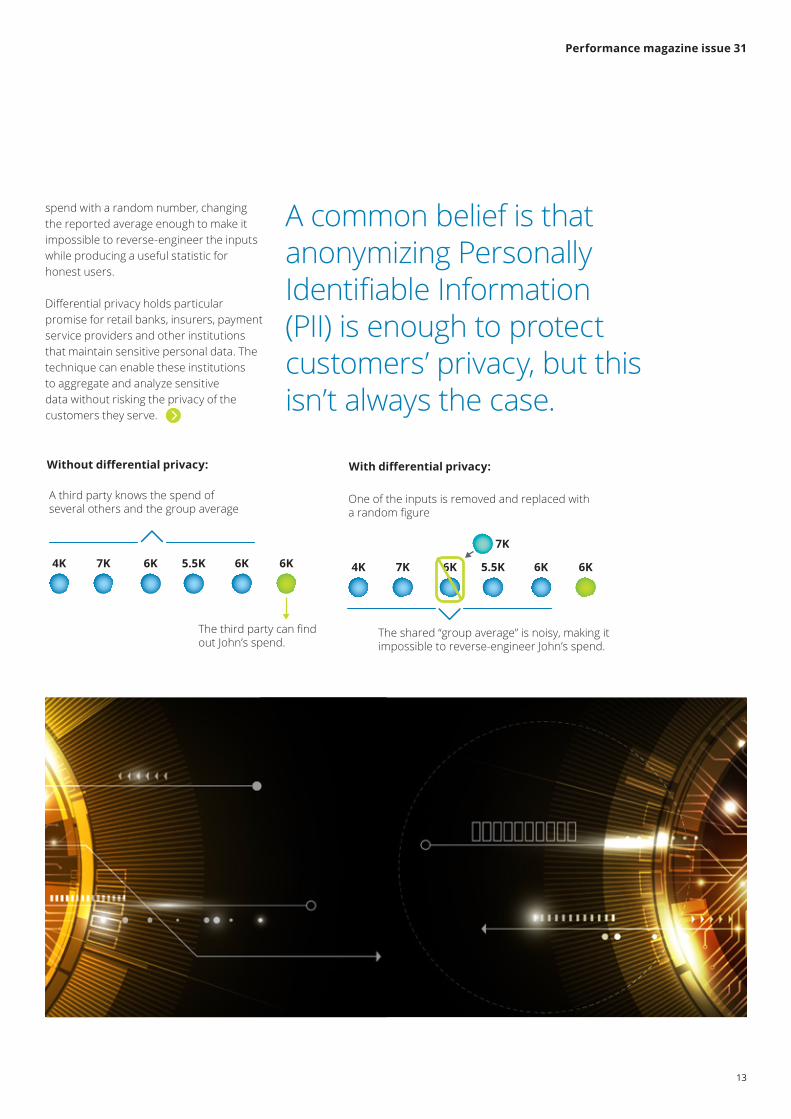
Differential privacyA common belief is that anonymizing Personally Identifiable Information (PII) is enough to protect customers’ privacy, but this isn’t always the case.
To understand why, suppose John Doe shares his bank account data with a ersonal financial advisory app. This app makes it easier for customers to manage their spending and compare it with similar customers. John asks the app to compare what he spends in bars annually with the average for his demographic. The app returns an aggregate response: “Males aged 25-29 in this zip code generally spend $5,750 a year in bars.”
Five key “privacy enhancing techniques”
However, suppose a bad actor wanted to find out how much John is spending in bars. The bad actor could accomplish this by, for example, changing their own address to fit within John’s demographic. By then querying the system again knowing some of the inputs (i.e., their own) and cross-referencing with other data (e.g., census data), this third party could breach John’s privacy and deduce his bar spend.
To prevent this kind of breach, the system can add noise to its calculation of the average, using differential privacy to measure how much noise is necessary to achieve the desired level of privacy. For instance, it could replace one customer’s
...overview of how each technique works, the types of data sharing problems they can be used to solve, and the subsectors of financial services...
13
Performance magazine issue 31
spend with a random number, changing the reported average enough to make it impossible to reverse-engineer the inputs while producing a useful statistic for honest users.
Differential privacy holds particular promise for retail banks, insurers, payment service providers and other institutions that maintain sensitive personal data. The technique can enable these institutions to aggregate and analyze sensitive data without risking the privacy of the customers they serve.
A common belief is that anonymizing Personally Identifiable Information (PII) is enough to protect customers’ privacy, but this isn’t always the case.
Without differential privacy:Without differential privacy:
A third party knows the spend of several others and the group average
The third party can find out John’s spend.
4K 7K 6K 5.5K 6K 6K
With differential privacy:
One of the inputs is removed and replaced with a random figure
The shared “group average” is noisy, making it impossible to reverse-engineer John’s spend.
4K 7K 6K 5.5K
7K
6K 6K
With differential privacy:Without differential privacy:
A third party knows the spend of several others and the group average
The third party can find out John’s spend.
4K 7K 6K 5.5K 6K 6K
With differential privacy:
One of the inputs is removed and replaced with a random figure
The shared “group average” is noisy, making it impossible to reverse-engineer John’s spend.
4K 7K 6K 5.5K
7K
6K 6K
14
Performance magazine issue 31
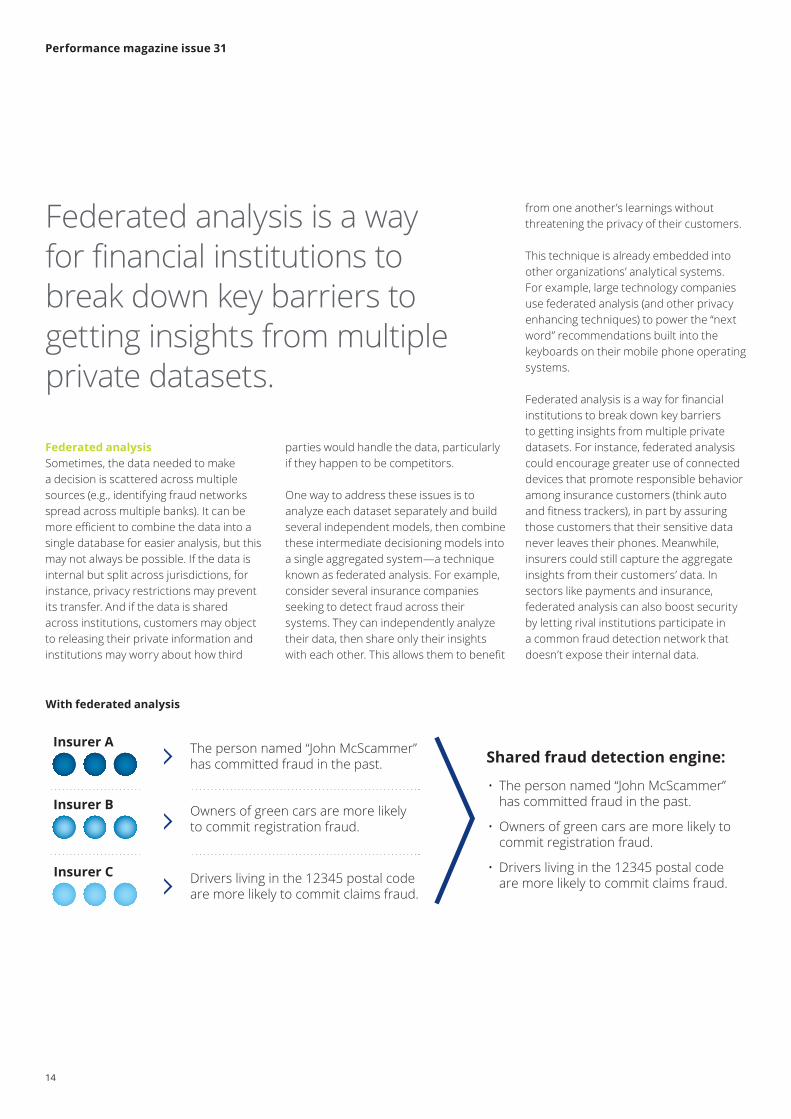
Federated analysisSometimes, the data needed to make a decision is scattered across multiple sources (e.g., identifying fraud networks spread across multiple banks). It can be more efficient to combine the data into a single database for easier analysis, but this may not always be possible. If the data is internal but split across jurisdictions, for instance, privacy restrictions may prevent its transfer. And if the data is shared across institutions, customers may object to releasing their private information and institutions may worry about how third
• The person named “John McScammer” has committed fraud in the past.
• Owners of green cars are more likely to commit registration fraud.
• Drivers living in the 12345 postal code are more likely to commit claims fraud.
Shared fraud detection engine:Insurer A The person named “John McScammer”
has committed fraud in the past.
Insurer B Owners of green cars are more likely to commit registration fraud.
Insurer C Drivers living in the 12345 postal code are more likely to commit claims fraud.
With federated analysis
Federated analysis is a way for financial institutions to break down key barriers to getting insights from multiple private datasets.
parties would handle the data, particularly if they happen to be competitors.
One way to address these issues is to analyze each dataset separately and build several independent models, then combine these intermediate decisioning models into a single aggregated system—a technique known as federated analysis. For example, consider several insurance companies seeking to detect fraud across their systems. They can independently analyze their data, then share only their insights with each other. This allows them to benefit
from one another’s learnings without threatening the privacy of their customers.
This technique is already embedded into other organizations’ analytical systems. For example, large technology companies use federated analysis (and other privacy enhancing techniques) to power the “next word” recommendations built into the keyboards on their mobile phone operating systems.
Federated analysis is a way for financial institutions to break down key barriers to getting insights from multiple private datasets. For instance, federated analysis could encourage greater use of connected devices that promote responsible behavior among insurance customers (think auto and fitness trackers), in part by assuring those customers that their sensitive data never leaves their phones. Meanwhile, insurers could still capture the aggregate insights from their customers’ data. In sectors like payments and insurance, federated analysis can also boost security by letting rival institutions participate in a common fraud detection network that doesn’t expose their internal data.

15
Performance magazine issue 31
Homomorphic encryptionSometimes a financial institution—or one of its customers—would like to engage a third party for data analysis. The third party might have complementary data or proprietary analytics the institution doesn’t have. However, the data steward or owner may lack permission to transfer the data or have concerns about keeping the data safe.
Homomorphic Encryption (HE) can bridge this gap by encrypting data so that it can be analyzed without knowing the underlying information. With HE, it isn’t necessary to decrypt the data first. Neither can anyone other than the intended party read the results of the analysis.
Consider a situation where John Doe would like to see if his medical history reveals any potential health risks. His health insurance provider has a technology services unit with the capabilities to run such an analysis, but John Doe wants to maintain the confidentiality of his health records.
With HE, John Doe can encrypt the data and send it to his insurer while holding on to the key. The technology unit can run the data through its models without having to know what is in the records or the results, then return both to John Doe to unlock and read.
HE is potentially useful to any financial institution interested in analyzing sensitive data on the cloud or via third-party capabilities. Today, these options are limited due to concerns about data breaches, localization requirements, and privacy regulation. But that could change with HE solutions that provide a practical way to keep data encrypted and safe from prying eyes, even while it’s in use.
Without homomorphic encryption
Homomorphic Encryption (HE) can bridge this gap by encrypting data so that it can be analyzed without knowing the underlying information.
With homomorphic encryptionWithout homomorphic encryption:
John places his health records in a box, ships them to the company, which analyzes them to produce a report and ships it back to John.
John’s health records are homomorphically encrypted prior to sharing, making it difficult for anyone but him to see the data or the results of any subsequent analysis.
Data could be maliciously accessed in transportation.
Data is secure during transporation.
The company conducts its analysis without being able to see the underlying data at any point.
Data could be maliciously accessed by the company itself or an external bad actor who gains access to the office.
With homomorphic encryption:
J Insurance Co. J Insurance Co.
Without homomorphic encryption:
John places his health records in a box, ships them to the company, which analyzes them to produce a report and ships it back to John.
John’s health records are homomorphically encrypted prior to sharing, making it difficult for anyone but him to see the data or the results of any subsequent analysis.
Data could be maliciously accessed in transportation.
Data is secure during transporation.
The company conducts its analysis without being able to see the underlying data at any point.
Data could be maliciously accessed by the company itself or an external bad actor who gains access to the office.
With homomorphic encryption:
J Insurance Co. J Insurance Co.
16
Performance magazine issue 31
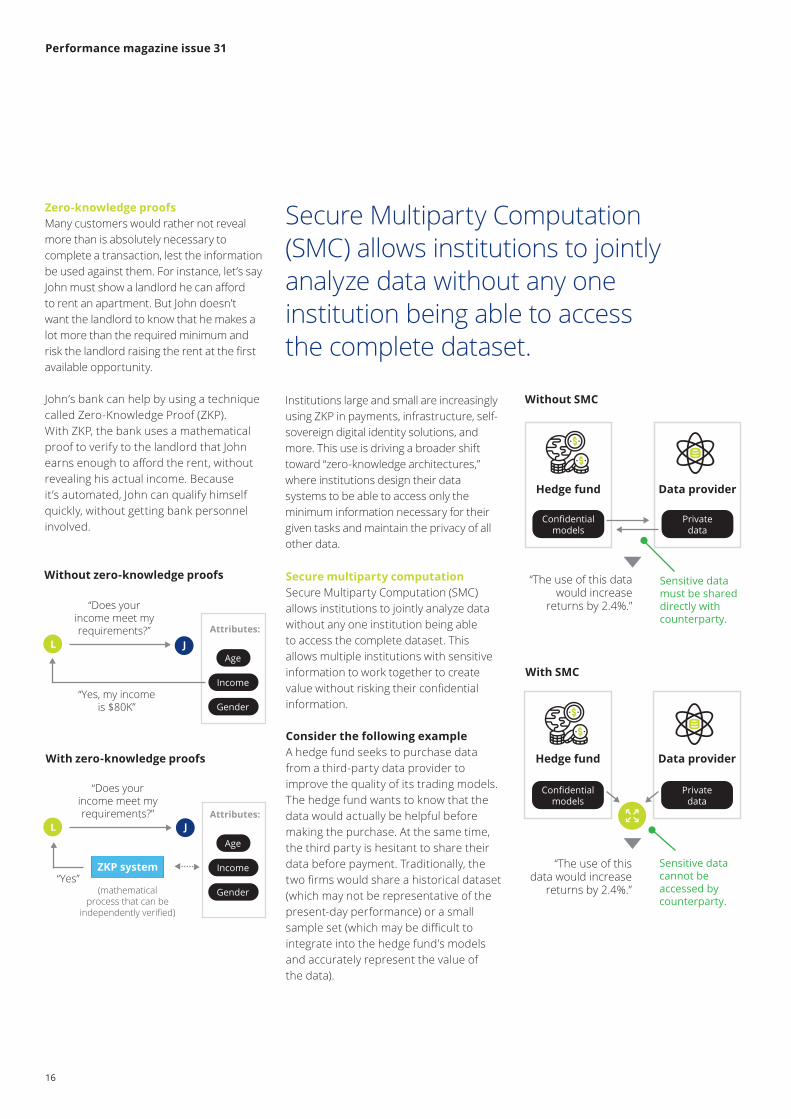
Secure multiparty computationSecure Multiparty Computation (SMC) allows institutions to jointly analyze data without any one institution being able to access the complete dataset. This allows multiple institutions with sensitive information to work together to create value without risking their confidential information.
Consider the following exampleA hedge fund seeks to purchase data from a third-party data provider to improve the quality of its trading models. The hedge fund wants to know that the data would actually be helpful before making the purchase. At the same time, the third party is hesitant to share their data before payment. Traditionally, the two firms would share a historical dataset (which may not be representative of the present-day performance) or a small sample set (which may be difficult to integrate into the hedge fund’s models and accurately represent the value of the data).
Zero-knowledge proofsMany customers would rather not reveal more than is absolutely necessary to complete a transaction, lest the information be used against them. For instance, let’s say John must show a landlord he can afford to rent an apartment. But John doesn’t want the landlord to know that he makes a lot more than the required minimum and risk the landlord raising the rent at the first available opportunity.
John’s bank can help by using a technique called Zero-Knowledge Proof (ZKP). With ZKP, the bank uses a mathematical proof to verify to the landlord that John earns enough to afford the rent, without revealing his actual income. Because it’s automated, John can qualify himself quickly, without getting bank personnel involved.
Secure Multiparty Computation (SMC) allows institutions to jointly analyze data without any one institution being able to access the complete dataset.
Without SMC
With SMC
Without zero-knowledge proofs
With zero-knowledge proofs
Without zero-knowledge proofs:
“Does your income meet my requirements?”
“Yes, my income is $80K”
L JAge
Income
Gender
Attributes:
Age
Income
Gender
Attributes:
“Does your income meet my requirements?”
(mathematical process that can be
independently verified)
“Yes”
L J
ZKP system
With zero-knowledge proofs:
Institutions large and small are increasingly using ZKP in payments, infrastructure, self-sovereign digital identity solutions, and more. This use is driving a broader shift toward “zero-knowledge architectures,” where institutions design their data systems to be able to access only the minimum information necessary for their given tasks and maintain the privacy of all other data.
“The use of this data would increase
returns by 2.4%.”
Hedge fund
Confidentialmodels
Data provider
Privatedata
“The use of this data would increase
returns by 2.4%.”
Hedge fund
Confidentialmodels
Data provider
Privatedata
Sensitive datamust be shareddirectly with counterparty.
Sensitive datacannot be accessed by counterparty.
“The use of this data would increase
returns by 2.4%.”
Hedge fund
Confidentialmodels
Data provider
Privatedata
“The use of this data would increase
returns by 2.4%.”
Hedge fund
Confidentialmodels
Data provider
Privatedata
Sensitive datamust be shareddirectly with counterparty.
Sensitive datacannot be accessed by counterparty.

17
Performance magazine issue 31
Taking privacy to the next levelFinancial institutions have a long history of weighing the utility of data sharing with the obligation to maintain privacy and confidentiality. Now, five relatively nascent technologies have the potential to fundamentally alter these dynamics.
What they have in common is an ability to allow institutions, customers, and regulators to analyze data and distribute the resulting insights without having to share the underlying data itself. This way, they can greatly reduce the risks associated with data sharing. The result? New ways for financial institutions to address their biggest, most pressing problems in a way that is acceptable to customers, regulators, and societies at large.
This article is derived from The Next Generation of Data-Sharing in Financial Services: Using Privacy Enhancing Techniques to Unlock New Value, prepared by the World Economic Forum in collaboration with Deloitte. The World Economic Forum will continue to explore the effects of change in financial services. If you’d like to discuss the ideas in this report—formally or informally—we’d like to hear from you.
Now, five relatively nascent technologies have the potential to fundamentally alter these dynamics.
To the pointFive techniques to enhance privacy and confidentiality:
• Differential privacy, where noise is added to an analytical system so that it is impossible to reverse-engineer the individual inputs
• Federated analysis, where parties share the insights from their analysis without sharing the data itself
• Homomorphic encryption, where data is encrypted before it is shared, such that it can still be analyzed but not decoded into the original information
• Zero-knowledge proofs, where users can prove their knowledge of a value without revealing the value itself
• Secure multiparty computation, where data analysis is spread across multiple parties such that no individual party can see the complete set of inputs

18
Performance magazine issue 31
An interview with Blackstone’s head of Real Estate Europe
David BrownHead of Real EstateNorth and South EuropeDeloitte
James SeppalaHead of Real Estate EuropeBlackstone
Matt TownsendPartnerReal Estate TaxDeloitte
19
Performance magazine issue 31
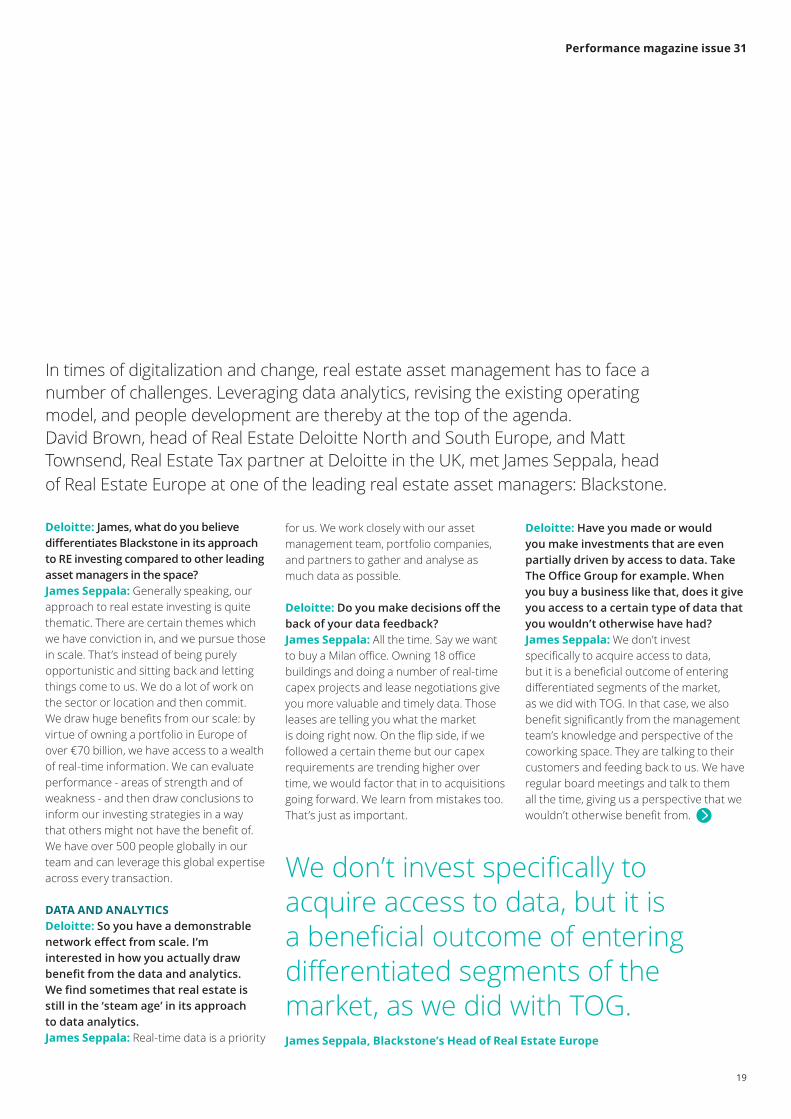
In times of digitalization and change, real estate asset management has to face a number of challenges. Leveraging data analytics, revising the existing operating model, and people development are thereby at the top of the agenda. David Brown, head of Real Estate Deloitte North and South Europe, and Matt Townsend, Real Estate Tax partner at Deloitte in the UK, met James Seppala, head of Real Estate Europe at one of the leading real estate asset managers: Blackstone.
Deloitte: James, what do you believe differentiates Blackstone in its approach to RE investing compared to other leading asset managers in the space?James Seppala: Generally speaking, our approach to real estate investing is quite thematic. There are certain themes which we have conviction in, and we pursue those in scale. That’s instead of being purely opportunistic and sitting back and letting things come to us. We do a lot of work on the sector or location and then commit. We draw huge benefits from our scale: by virtue of owning a portfolio in Europe of over €70 billion, we have access to a wealth of real-time information. We can evaluate performance - areas of strength and of weakness - and then draw conclusions to inform our investing strategies in a way that others might not have the benefit of. We have over 500 people globally in our team and can leverage this global expertise across every transaction.
DATA AND ANALYTICSDeloitte: So you have a demonstrable network effect from scale. I’m interested in how you actually draw benefit from the data and analytics. We find sometimes that real estate is still in the ‘steam age’ in its approach to data analytics. James Seppala: Real-time data is a priority
for us. We work closely with our asset management team, portfolio companies, and partners to gather and analyse as much data as possible.
Deloitte: Do you make decisions off the back of your data feedback?James Seppala: All the time. Say we want to buy a Milan office. Owning 18 office buildings and doing a number of real-time capex projects and lease negotiations give you more valuable and timely data. Those leases are telling you what the market is doing right now. On the flip side, if we followed a certain theme but our capex requirements are trending higher over time, we would factor that in to acquisitions going forward. We learn from mistakes too. That’s just as important.
We don’t invest specifically to acquire access to data, but it is a beneficial outcome of entering differentiated segments of the market, as we did with TOG.James Seppala, Blackstone’s Head of Real Estate Europe
Deloitte: Have you made or would you make investments that are even partially driven by access to data. Take The Office Group for example. When you buy a business like that, does it give you access to a certain type of data that you wouldn’t otherwise have had?James Seppala: We don’t invest specifically to acquire access to data, but it is a beneficial outcome of entering differentiated segments of the market, as we did with TOG. In that case, we also benefit significantly from the management team’s knowledge and perspective of the coworking space. They are talking to their customers and feeding back to us. We have regular board meetings and talk to them all the time, giving us a perspective that we wouldn’t otherwise benefit from.

20
Performance magazine issue 31
CULTURE AND PEOPLE DEVELOPMENTDeloitte: Blackstone has been at the top of the tree in the RE field1 for a decade or more, in terms of fund and deal size and overall AUM. Tell us something about the culture of the firm that allows to maintain this performance.James Seppala: Across the firm, there is an enormous sense of ownership and responsibility which tends to inspire all of us to do more. We also invest personally in the transactions, aligning our interests with those of our investors and reinforcing the sense of ownership. We are a meritocracy, rewarding people who perform well, giving them access to opportunities, such as moving to different groups or offices for periods of time, accelerating their careers, giving them a new challenge, or encouraging them to help grow a new business. That creates a lot of energy, and by virtue of people always seizing opportunities in different sectors or moving to different offices, it also allows younger, talented people to move up quickly.
Deloitte: Given the growth in the size and specialisms within your team, what is your strategy around people development to ensure future succession in your business? James Seppala: We frequently give team members new opportunities, pushing people out of their comfort zone, and very often we are positively surprised by the outcome. Suddenly a relatively junior person has exceeded expectations and we’re much more productive in a certain region, for example. When the team see others around them always try and deliver their best that becomes the standard that everyone expects of themselves.
Deloitte: To touch on people development, are there specific programmes that you do here, or is it case by case that you look at what is best for people’s development?James Seppala: We are quite programmatic about moving people around the world. We try to move a certain number of our professionals around every year, for example always having someone
from London in New York and someone from New York in London. We do that in a disciplined way. Several times a year, we also think a lot about moving people into certain positions across groups, how they would perform, and how we can help accelerate their career progression. With the continued expansion of our business lines we are also able to offer people increased responsibilities in these new areas of growth.
OPERATING ON A MULTIDISCIPLINARY PLATFORMDeloitte: Blackstone continues to evolve its business, from PE, to RE, hedge fund, and now growing credit and infrastructure strategies. How does the firm derive benefits from operating on a multidisciplinary platform? Is the intelligence from different strategies deployed all across the organisation? James Seppala: That is absolutely what we are striving to do. At our review and investment committee meetings, for example, as well as at our regional strategy sessions, if we are able to share any
1. Source: IPE, RE Asset Managers Ranking 2018; https://deloi.tt/387ToYB
Across the firm, there is an enormous sense of ownership and responsibility which tends to inspire all of us to do more.James Seppala, Blackstone’s Head of Real Estate Europe

21
Performance magazine issue 31
intelligence that might support another region or business division and there are no MNPI [Material Non-Public Information] considerations, we will do so.
Deloitte: Do you have the sort of situation where you would like to invest in something, but can’t invest because another part of the business is doing it?James Seppala: Not really. The way things are structured, certain funds or strategies often have exclusivity on a certain space should they want to pursue an opportunity in that space, and we have very differentiated strategies when it comes, for example, to opportunistic vs. core-plus investing. There are also times when we co-invest, for example when we bought Hilton, Real Estate and Corporate Private Equity co-invested because we believed our strategies and skill sets were complementary in this situation.
THE INTEREST RATE CYCLEDeloitte: Your Q2 earnings report mentioned that the low interest rate environment played a part in driving demand for Blackstone funds. How do you think the end of QE (Quantitative Easing), and ultimately its reversal, will play out for your business? James Seppala: There is a difference between the US and Europe, obviously, because rates in Europe are likely to stay lower for longer. Reversing QE, or rising interest rates, is typically driven by GDP growth, which then tends to lead to top-line revenue growth. We are always looking to invest in sectors and markets that we expect to have outsized growth. This is ever more important in a rising rate environment, such as the one we have been anticipating in the US.
Deloitte: You have been very successful in growing new ‘perpetual’ capital sources alongside your series of classic fixed life funds. How does the Blackstone model flex to deal with the different discipline of underwriting in the core space?James Seppala: It’s one investment committee, one approach to underwriting, and one approach to the themes we
like. The different vehicles may have different holding periods, different leverage structures, and of course there is a different risk profile for core-plus or opportunistic, but it’s exactly the same approach to sourcing and underwriting.
Deloitte: So what would you say is different, other than the holding period?James Seppala: Core-plus assets have a stable cash flow profile and an ability to increase revenues over longer periods of time, but not through intensive near-term asset management or capital investment. So, the management required is more modest, and so is the leverage. The bar is higher for core-plus and the amount of lift required is lower. For example, investments that require relatively limited asset management over the hold period may fit well in core-plus.
Deloitte: In terms of sourcing those deals, are you effectively relying on the same network?James Seppala: Yes, all we are doing is broadening our teams’ spectrum of potential activity.
Deloitte: So is this a question of Blackstone publicising to the market that you’re interested in core-plus and opportunistic deals? James Seppala: Yes, and that tends to open more doors and is therefore helpful for both businesses.
IMPACT OF TECHNOLOGYDeloitte: Can we discuss the impact of technology on your business and your investments. What impact do you consider digitization will make to construction and the built environment? How do you consider the impact of wider technological change – such as driverless cars – on your investments? How is digital transformation affecting your own operations?James Seppala: Technology is impacting everything in our world, including real estate. Our recent investment activity has been concentrated in logistics assets globally, which we believe are benefitting from the global trend in consumption
patterns toward e-commerce. Also, cities that are attracting companies focused on tech and media are doing particularly well today in our opinion. We as a business are also investing to improve our technology, across each business division and at group level. We have dedicated professionals within the team focussing on tech applications and tech companies and we are deploying prop tech to seek to make us better investment managers. At a portfolio company level, there is a lot of investment too and we share that across portfolio companies where it makes sense. So in aggregate, the investment is quite significant.
Deloitte: Is central location increasingly a driver of value in Europe, as well as London?James Seppala: Yes, that’s why we have a focus on tier-one cities in Europe where innovation is happening – such as Berlin, Stockholm, Amsterdam, Paris, and Barcelona. These cities are benefitting disproportionally because it seems that is largely where young educated people want to be, where employers want to be, and that is what’s driving growth and incremental demand.
Deloitte: How do you view London’s competitiveness going forward?James Seppala: Despite political uncertainty, we are long-term believers in London and it retaining its place as the truly global city in Europe. Certain investment banks may be increasing their space requirements in other cities such as Paris, Milan and Frankfurt, but that doesn’t mean they are halving their space in London, far from it.
Deloitte: Does Europe retain its attractiveness against Asia and North America?James Seppala: Yes, it has been amongst our most active regions globally in the last seven years and we believe a number of interesting investment opportunities still remain across the real estate spectrum for us. That said, given our differentiated approach and positioning, we continue to see compelling opportunities in Asia and North America as well.Deloitte: Thanks for your time today James.

22
Performance magazine issue 31

23
Performance magazine issue 31
Shareholders’ Rights regulation The undercover game changerPascal Eber PartnerOperations Excellence & Human capitalDeloitte
Astrid BrandyManager Operations Excellence & Human CapitalDeloitte
Pascal Martino PartnerBanking Leader Deloitte
Philippe Hijazin Senior Manager Strategy Regulatory & Corporate Finance Deloitte
Simon Ramos PartnerIM Advisory & Consulting Leader Deloitte
Benoit Sauvage Director RegWatch, Strategy & ConsultingDeloitte
The Shareholders’ Rights Directive II (SRD II) is an example of a regulation that flew just under the radar for all stakeholders, ever since its negotiation phase before 2017.
The purpose of SRD II is to allow retail investors to participate in the life of the companies in which they invest, and ensure long-term engagement. The EU Commission was of the view that investors were not well informed about their investments, hence too easily willing to dispose of them if news (and stock prices)
were not satisfactory. This phenomenon easily created a short-term view of investments, which is adverse to the development of strong EU firms. SRD II is therefore designed to help investors develop long-term involvements and become active in the companies they invest in.

24
Performance magazine issue 31
How to meet the goals of SRD IIThe scope of SRD II concerns all investors holding EU equity shares or equivalent instruments. Beyond that, SRD II builds on 5 fundamental axes:
• Information should reach all investors, large and small
• Investment firms have to communicate their “engagement policies” when they act on behalf of investors through financial product management services
20 July 2007Entry into force of SRDI
10 June 2017Entry into force of SRDII
3 September 2018Publication of implementing acts
10 June 2019SRDII transposition deadline
Implementation period – Preparation phase 2
Implementation period – Preparation phase 1
Local transposition deadline
Start of exchange of information
03 September 2020Start of message exchanges based on the requirements of the Implementing Acts
01 August 2019Grand Ducal transposition Law Amending Law of 24 May 2011
SRD II ChallengesA two-phased implementation timeline
• Issuers have a right to know who their investors are
• Issuers have to disclose adequate information (e.g.: directors’ remuneration and material transactions bearing potential conflicts of interests)
• Intermediaries of the investment process have to cooperate
In a nutshell, SRD II implies that all investors should have access to information about a general assembly meeting, should be able to vote and see the result of their vote. All of these prerogatives must be complied with within pre-determined time frames that are close to real time.
Similarly, in order to better engage with their investors, issuers might wish to ask financial intermediaries if they have investors in their company. The latter will have to process and answer the request for information, within the day following its reception.
In a nutshell, SRD II implies that all investors should have access to information about a general assembly meeting, should be able to vote and see the result of their vote.
Issuers have a right to know who their investors are.

25
Performance magazine issue 31
On paper, SRD II seems pretty simple, as it aims to facilitate communication between issuers and investors. Nonetheless, the first challenge is often to identify the information to share regarding annual general meetings (AGM) by the issuer itself, although for this article we will assume that this is adequately produced, and move on the next steps.
So, we assume the issuer has the information, and has to pass it to the different intermediaries. The normal process entails that the issuer informs its Central Securities Depositary (CSD), its issuing agent. The CSD connects with its clients, the custodian banks. These custodians pass the information down the chain, until it finally reaches the “ultimate” shareholder, who often is an individual, although it could be a fund, a pension plan or any other legal entity. This requires that at any time, all investors (including ones who may only possess one share) can be identified.
Then a second challenge arises: investors might wish to vote. So far, unfortunately, when (and if) the information reaches the investors, the process often stops there. Investors, unless particularly willing to be active, rarely vote and do not take part in the AGM, which might even be held in a different Member State as a further deterrent. With SRD II, financial intermediaries will have to track information recipients, propose voting options, and ensure that a mechanism to vote exists for all investors, either through traditional voting, or via a proxy arrangement that must be created and formalized.
As a third challenge, when firms manage client assets, they now have to define and disclose their engagement policy (beginning in June 2019), explaining how financial intermediaries, asset managers,
and other parties involved will vote when they represent investors. UCITS and AIFs are directly impacted by this aspect of the directive, but other forms of collective management of assets (typically discretionary portfolio managers) should also consider if, and how, they might draft a similar voting policy.
The fourth and probably most complex challenge is related to the fact that, at any moment, issuers can ask to identify who their shareowners are. The underlying difficulty lies in the criteria proposed by the EU Directive: identification might be subject to an ownership threshold of 0.5 percent. Member States might chose to go below that minimum, down to ownership of one
share, with identification to be reported within 24 hours. In addition to the lack of harmonized definition of the notion of shareholder itself, the relevant percentage of detention to identify shareholders therefore varies from one Member State to the other.
Individually, the four previously-mentioned challenges would already weigh heavily on any organization, but in the case of shareholders’ rights regulation, these challenges are combined, with the additional twist that, at the present stage, not all useful templates are fully developed or available to the stakeholders, especially smaller ones.
26
Performance magazine issue 31
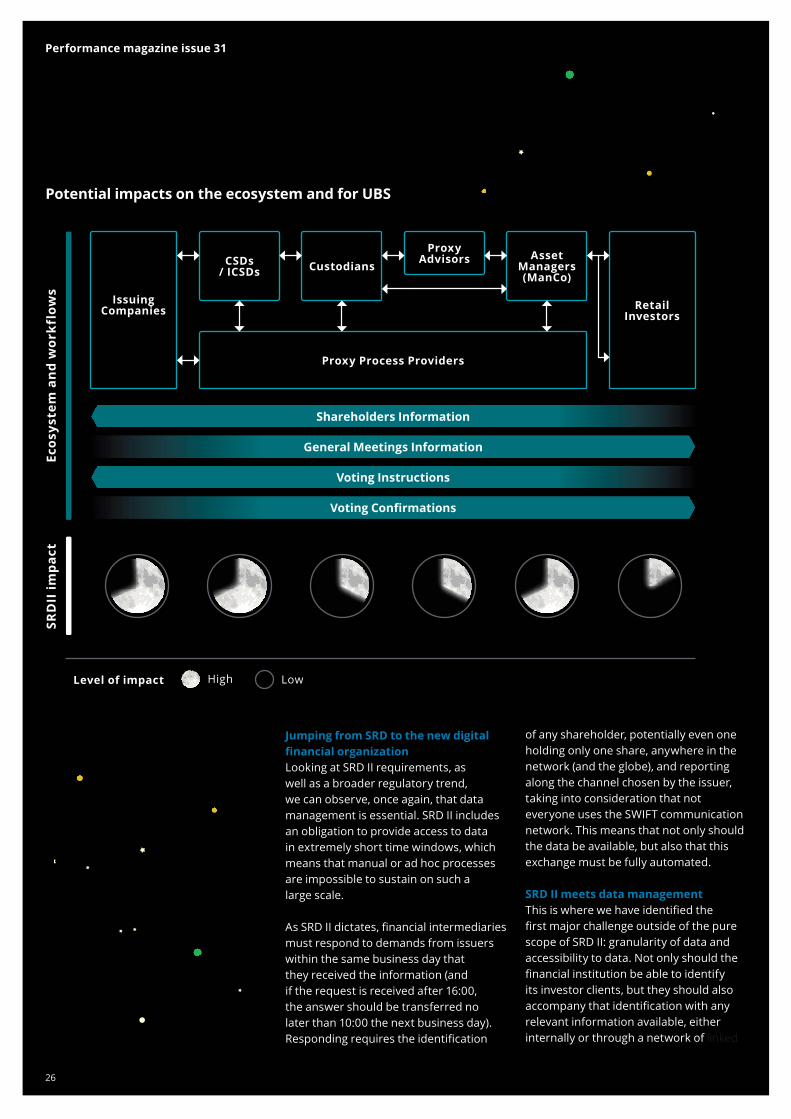
Potential impacts on the ecosystem and for UBS
SRD
II im
pact
Ecos
yste
m a
nd
wor
kflo
ws
Issuing Companies
CSDs / ICSDs
Proxy Process Providers
CustodiansProxy
Advisors Asset Managers(ManCo)
Retail Investors
Shareholders Information
General Meetings Information
Voting Instructions
Voting Confirmations
Level of impact High Low
of any shareholder, potentially even one holding only one share, anywhere in the network (and the globe), and reporting along the channel chosen by the issuer, taking into consideration that not everyone uses the SWIFT communication network. This means that not only should the data be available, but also that this exchange must be fully automated.
SRD II meets data managementThis is where we have identified the first major challenge outside of the pure scope of SRD II: granularity of data and accessibility to data. Not only should the financial institution be able to identify its investor clients, but they should also accompany that identification with any relevant information available, either internally or through a network of linked
Jumping from SRD to the new digital financial organizationLooking at SRD II requirements, as well as a broader regulatory trend, we can observe, once again, that data management is essential. SRD II includes an obligation to provide access to data in extremely short time windows, which means that manual or ad hoc processes are impossible to sustain on such a large scale.
As SRD II dictates, financial intermediaries must respond to demands from issuers within the same business day that they received the information (and if the request is received after 16:00, the answer should be transferred no later than 10:00 the next business day). Responding requires the identification

27
Performance magazine issue 31
entities (other banks or investment firms). This requires a robust data system, which may also be used as key strategic management tool. Indeed, the implementation of such a data system would allow financial institutions to exploit data, and combine it with artificial intelligence, robo-advising, and similar tools.
This represents a tremendous opportunity for financial institutions to deploy customized services, products, payment schemes, and any other type of tailored offer, provided that GDPR compliance is ensured.
Data granularity and its accessibility in a readily exploitable form will, therefore, become of utmost importance for SRD II, with a collateral potential for business development. Financial intermediaries must be able to locate any investors in any products instantaneously.
SRD II meets ESG requirementsA second, broader point of attention raised by SRD II concerns ESG (environmental, social and governance) policies. There is, indeed, an overlap of SRD and ESG regulatory demands. This will have an impact on the image of financial institutions: are they supporting ESG, and Paris Agreement goals? This will stem from the engagement policy that any representative of investors will have to communicate to the public. When creating a link with ESG regulatory requirements, how does the firm engage and use its voting rights for its investors? How does it communicate about this, and, above all, what happens in case of inconsistency between the ESG image that the financial institution wants to project, and the reality of how it can actually act (namely helping via votes in AGM) to force a move towards a more sustainable economy and world?
The SRD II requires financial intermediaries concerned by the directive to disclose on their website how they plan to vote in AGMs. ESG regulations, on the other hand, require firms to publicize and be transparent about their policies and
products. Hence a potential risk of lack of consistency, which would be easily spotted by an NGO, or anybody whatsoever. It is therefore highly advisable to ensure that the voting policies are well defined, followed, and communicated so as to be consistent with the ESG strategy.
Instantaneity and transparency, required everywhere, add to the complexity of the challenge. Not to mention other challenges linked to the storage (according to GDPR guidelines), and retrievability of information.
This will, as painful as it may be, force financial intermediaries to upscale their technologies. This forced change notwithstanding, this regulatory demand provides true strategic and business opportunities, compelling financial institutions to face their competition, who are no longer old-fashioned banks, but new digital-native companies, and financial firms that have developed state-of-the-art technologies, both agile and responsive.
ConclusionSRD II is about more than information, it focuses on a mixture of data management, digitalization, and a requirement for real-time data access, so it would not only help to meet a long-standing demand from supervisors and regulators, but would also help financial institutions be better prepared for a future of real-time transparency. Moreover, understanding the mutual dynamics of SRD II, ESG, and data may help better design for the long term, and mutually reinforce business strategies to better serve clients. SRD II is therefore a trigger for a review of data management systems.
It is highly advisable to ensure that the voting policies are well defined, followed, and communicated so as to be consistent with the ESG strategy.
To the point:
• Create engagement voting policies, align objectives on ESG factors
• Bring in operational changes for IT systems
• Real-time data management is essential to automate flow of information

28
Performance magazine issue 29

29
Andrew Carey PartnerReal EstateDeloitte
Benjamin Lam PartnerAssurance Deloitte
Arnaud Bon DirectorStrategy Regulatory & Corporate Finance Deloitte
Hendrik Aholt DirectorConsultingDeloitte
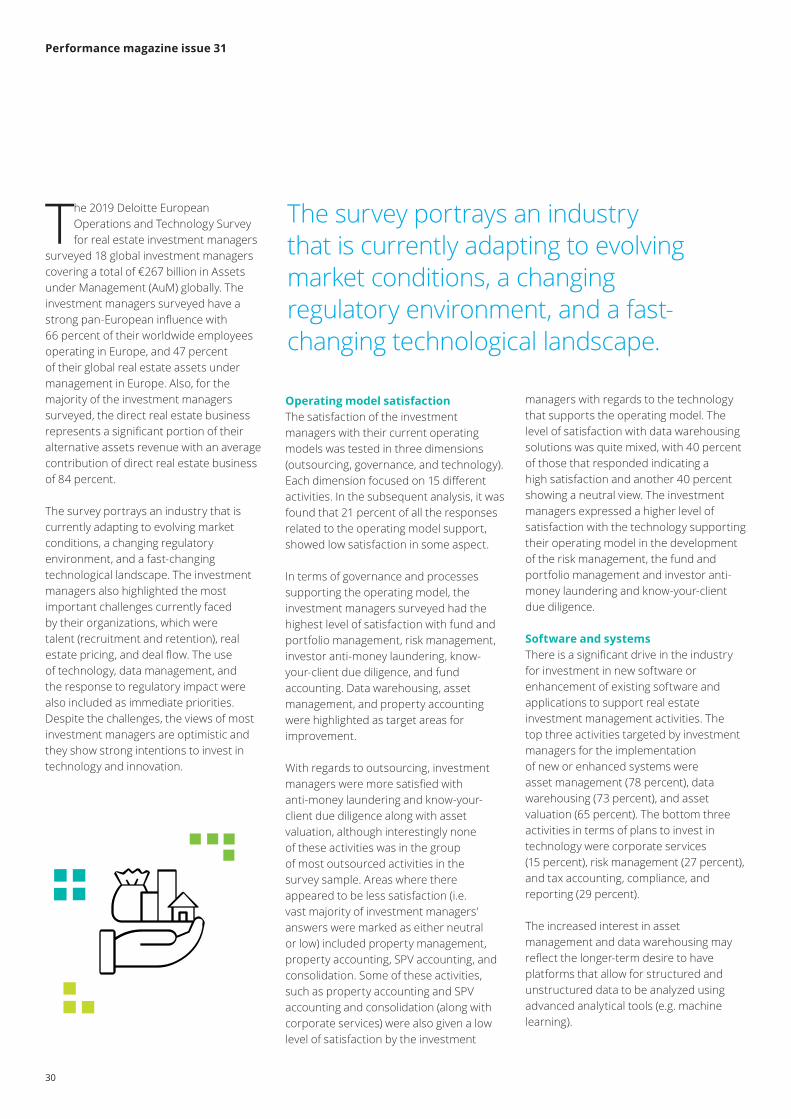
The 2019 Deloitte European Operations & Technology Survey for real estate investment managers indicates that major changes are ahead of the industry. Investment in technology is increasing and the utilization of data will become a cornerstone of the REIM-business of the future.
Industry interested in technological developmentDeloitte European Operations & Technology Survey
Performance magazine issue 31
30
Performance magazine issue 31
Operating model satisfactionThe satisfaction of the investment managers with their current operating models was tested in three dimensions (outsourcing, governance, and technology). Each dimension focused on 15 different activities. In the subsequent analysis, it was found that 21 percent of all the responses related to the operating model support, showed low satisfaction in some aspect.
In terms of governance and processes supporting the operating model, the investment managers surveyed had the highest level of satisfaction with fund and portfolio management, risk management, investor anti-money laundering, know-your-client due diligence, and fund accounting. Data warehousing, asset management, and property accounting were highlighted as target areas for improvement.
With regards to outsourcing, investment managers were more satisfied with anti-money laundering and know-your-client due diligence along with asset valuation, although interestingly none of these activities was in the group of most outsourced activities in the survey sample. Areas where there appeared to be less satisfaction (i.e. vast majority of investment managers’ answers were marked as either neutral or low) included property management, property accounting, SPV accounting, and consolidation. Some of these activities, such as property accounting and SPV accounting and consolidation (along with corporate services) were also given a low level of satisfaction by the investment
managers with regards to the technology that supports the operating model. The level of satisfaction with data warehousing solutions was quite mixed, with 40 percent of those that responded indicating a high satisfaction and another 40 percent showing a neutral view. The investment managers expressed a higher level of satisfaction with the technology supporting their operating model in the development of the risk management, the fund and portfolio management and investor anti-money laundering and know-your-client due diligence.
Software and systemsThere is a significant drive in the industry for investment in new software or enhancement of existing software and applications to support real estate investment management activities. The top three activities targeted by investment managers for the implementation of new or enhanced systems were asset management (78 percent), data warehousing (73 percent), and asset valuation (65 percent). The bottom three activities in terms of plans to invest in technology were corporate services (15 percent), risk management (27 percent), and tax accounting, compliance, and reporting (29 percent).
The increased interest in asset management and data warehousing may reflect the longer-term desire to have platforms that allow for structured and unstructured data to be analyzed using advanced analytical tools (e.g. machine learning).
The 2019 Deloitte European Operations and Technology Survey for real estate investment managers
surveyed 18 global investment managers covering a total of €267 billion in Assets under Management (AuM) globally. The investment managers surveyed have a strong pan-European influence with 66 percent of their worldwide employees operating in Europe, and 47 percent of their global real estate assets under management in Europe. Also, for the majority of the investment managers surveyed, the direct real estate business represents a significant portion of their alternative assets revenue with an average contribution of direct real estate business of 84 percent.
The survey portrays an industry that is currently adapting to evolving market conditions, a changing regulatory environment, and a fast-changing technological landscape. The investment managers also highlighted the most important challenges currently faced by their organizations, which were talent (recruitment and retention), real estate pricing, and deal flow. The use of technology, data management, and the response to regulatory impact were also included as immediate priorities. Despite the challenges, the views of most investment managers are optimistic and they show strong intentions to invest in technology and innovation.
The survey portrays an industry that is currently adapting to evolving market conditions, a changing regulatory environment, and a fast-changing technological landscape.
31
Performance magazine issue 31
The investment managers surveyed used a variety of software and applications for the different investment management activities. The solutions include well established external vendor software platforms, internally developed applications, and MS Office applications or equivalent. External vendor software is most used for fund and portfolio management, asset management, SPV accounting, fund accounting, property
78% 73% 65%
Asset management
Data warehousing
Asset valuation
The top three activities targeted by investment managers for the implementation of new or enhanced systems were...
accounting, investor reporting, asset valuation, and customer relationship management. The investment managers tend to use in-house solutions to support investment and transaction management, data warehousing, and fund and portfolio management. MS Office and equivalent solutions are mostly used for investor reporting, fund and portfolio management, and corporate services.
Technological innovationTechnological innovation has not been a key feature in the real estate investment management industry in the past. However, the opportunity to use innovation to streamline the transaction process and to perform more effective asset management and reporting through greater insight is clearly recognized by the investment managers. Process-driven activities seem to be perceived as offering less scope for radical change through innovation, but have significant potential for automation and, consequently, increased operational efficiency.
All the investment managers who participated in the survey considered that asset management, transaction management, and investor reporting could benefit in some way from technological innovation, with asset management being highlighted as having the potential to benefit the most (77 percent of the investment managers).

32
Performance magazine issue 31
Technological impact, investment, and future deploymentThe survey confirmed that investment managers are targeting a number of technological innovation initiatives, and these are currently being deployed globally. Some of these initiatives have the potential to significantly change or improve the performance of investment management activities.
Digitalization of contracts/documents
Most of the investment managers (88 percent) believe that digitalization of contracts and documents will have a strong or medium impact on them and their peers while 83 percent have already invested or are planning to invest over the next 18 months.
Big data and data analytics
The second most targeted technological innovation was big data and data analytics (81 percent of investment managers have invested or are planning to invest), as investment managers believe this area could have a high level of impact on their activities.
Robotics process automation comes in third on the list of targeted technological innovations by investment managers with 73 percent of them investing or planning to invest. This is also perceived to have a significant impact on the investment management activities.
Robotic process automation
In general, there is a greater drive to invest in technological innovations compared with the historical investment levels. This very strong interest perhaps reflects the level of opportunity seen in the sector in using technologies, disruptive or otherwise, to gain competitive
advantage. The investment focus areas are unsurprising and targeted at improving process efficiency or providing greater data insights. Some innovations may be too early in the cycle (e.g. artificial intelligence) or may be more effective at other parts of the real estate sector (e.g. 3D printing, augmented reality).
OutsourcingInvestment managers are known to work with multiple service providers in the running of their businesses, which tend to be locally-orientated, especially at property level. Therefore it is not surprising that the most outsourced activity (83 percent) is property management, including rental payments, maintaining the property, etc. Property accounting and SPV accounting and consolidation complete the top three of most commonly outsourced activities.
Risk management and investment reporting, being at the core of the investment management function, were almost never outsourced in our surveyed group. Similarly, within the survey group, none of the investment managers outsourced fund and portfolio management activities.
RegulationAfter a decade marked by a wave of regulations (such as AIFMD or FACTA) affecting the real estate funds and all alternative investment vehicles, the survey
confirmed that real estate investment managers’ believe that regulation continues to have a significant impact on their organizations. Within different aspects of the regulatory environment (such as increased compliance and structural costs, regulatory reporting or financial controls), the regulation impact was highlighted as a key challenge by 83 percent of the surveyed managers. The future will bring additional regulations and further impact on the industry, and investment managers are already preparing for changes in the tax environment as they recognize it as an important challenge for their organizations.
The survey results suggest that the industry is adapting to significant challenges (such as a changing regulatory environment and an ever-competitive talent landscape), questioning traditional aspects of the investment management operating model and steadily incorporating new software and systems to support a wide range of activities. Investment manager’s show strong intentions to invest more heavily in technology and innovative solutions over the next 18 months which might drive a dramatic shift in software use and investment manager satisfaction.
Investment manager’s show strong intentions to invest more heavily in technology and innovative solutions over the next 18 months which might drive a dramatic shift in software use and user satisfaction satisfaction.

33
Performance magazine issue 31
To the point:
• The 2019 Deloitte European Operations and Technology Survey for real estate investment managers surveyed 18 global investment managers covering a total of €267 billion in assets under management (AuM) globally.
• The survey focused on a number of key areas that were operating model satisfaction, technology (including current software and systems, technological innovation, and future deployment), outsourcing, and regulation.
• The survey portrays an industry that is currently adapting to evolving market conditions, a changing regulatory environment and a fast changing technological landscape.
• Despite the challenges, the views of most investment managers are optimistic and they show strong intentions to invest in technology and innovation.

Sylvain Crepin PartnerFinancial Industry Solutions Deloitte
Julien Baguet Senior Manager Financial Industry Solutions Deloitte
Guillaume Ledure Senior Manager Financial Industry Solutions Deloitte
Valnea Skansi Senior Consultant Financial Industry Solutions Deloitte
PRIIPs & MiFID 2 transaction costs for funds Behind the scene of the drama
Performance magazine issue 29
34
35
Performance magazine issue 31
Complete cost transparency (including implicit transaction costs) is required under PRIIPs and MiFID 2 legislations for financial instruments and services.
What are transaction costs?Compared to the simplified assumptions of a complete market with negligible transaction costs often used in economic modelling, in reality, there are costs intrinsically linked to the purchases and sales of financial instruments. We can divide these costs into:
• Fixed costs per transaction (explicit costs), such as brokerage fees or stamp duty
• Implicit costs, which represent the difference between the ask (resp. bid) price at which a market maker is willing to sell (resp. buy) a given financial
instrument, and the mid-price (the mid-price is the average between the ask and bid price), used as reference point for its valuation.
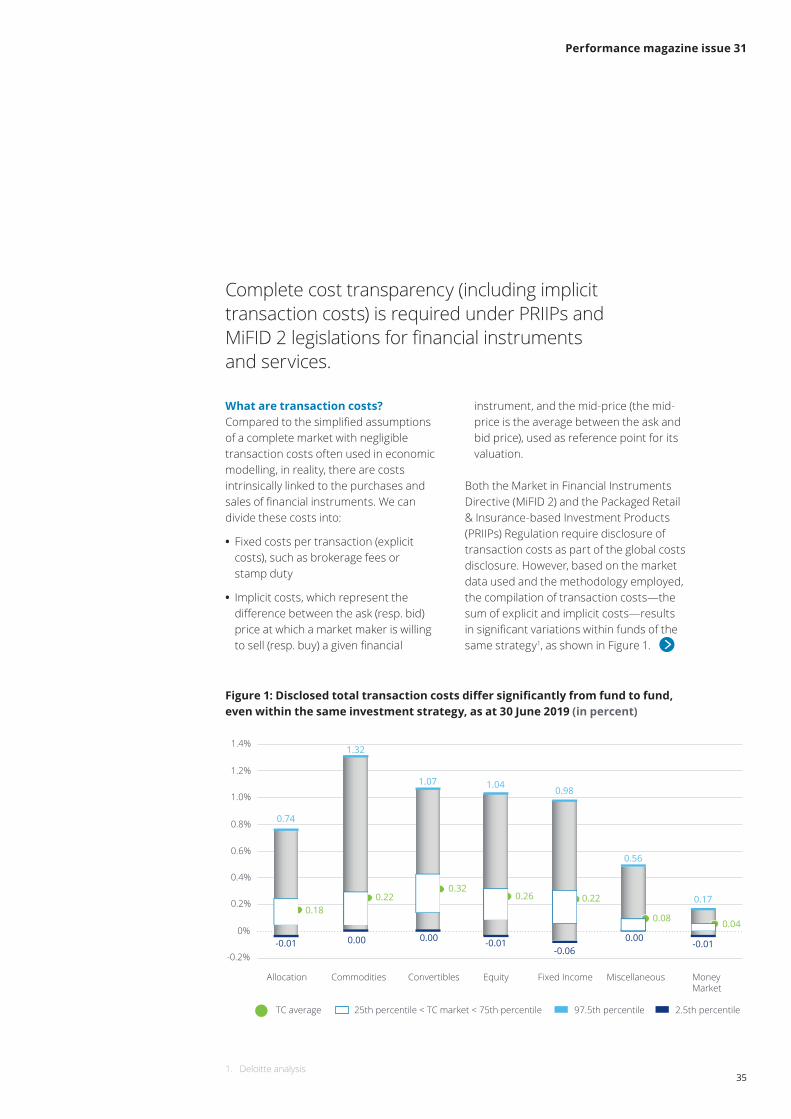
Both the Market in Financial Instruments Directive (MiFID 2) and the Packaged Retail & Insurance-based Investment Products (PRIIPs) Regulation require disclosure of transaction costs as part of the global costs disclosure. However, based on the market data used and the methodology employed, the compilation of transaction costs—the sum of explicit and implicit costs—results in significant variations within funds of the same strategy1, as shown in Figure 1.
Figure 1: Disclosed total transaction costs differ significantly from fund to fund, even within the same investment strategy, as at 30 June 2019 (in percent)
Allocation
25th percentile < TC market < 75th percentileTC average
Commodities
-0.2%
0%
0.2%
0.4%
0.6%
0.8%
1.0%
1.2%
1.4%
97.5th percentile 2.5th percentile
0.18
0.74
-0.01
Equity
1.04
-0.01
0.26
Fixed Income
0.98
-0.06
0.22
Miscellaneous
0.56
0.00
0.08
Money Market
0.17
-0.01
0.04
Convertibles
1.07
0.00
0.32
1.32
0.00
0.22
1. Deloitte analysis
36
Performance magazine issue 31
Implicit transaction costs compilation methodologiesPRIIPs Level 2 measures detail two methodologies for implicit transaction costs compilation:
• The “arrival price methodology” or “full PRIIPs methodology”, which applies to funds operating for more than three years
• The “turnover methodology” or “new PRIIPs methodology”, which applies to – PRIIPs operating for less than three years
– To UCITS or non-UCITS funds distributed as an underlying investment option of a PRIIP, where the PRIIP manufacturer only uses the key investor information document as a specific information document
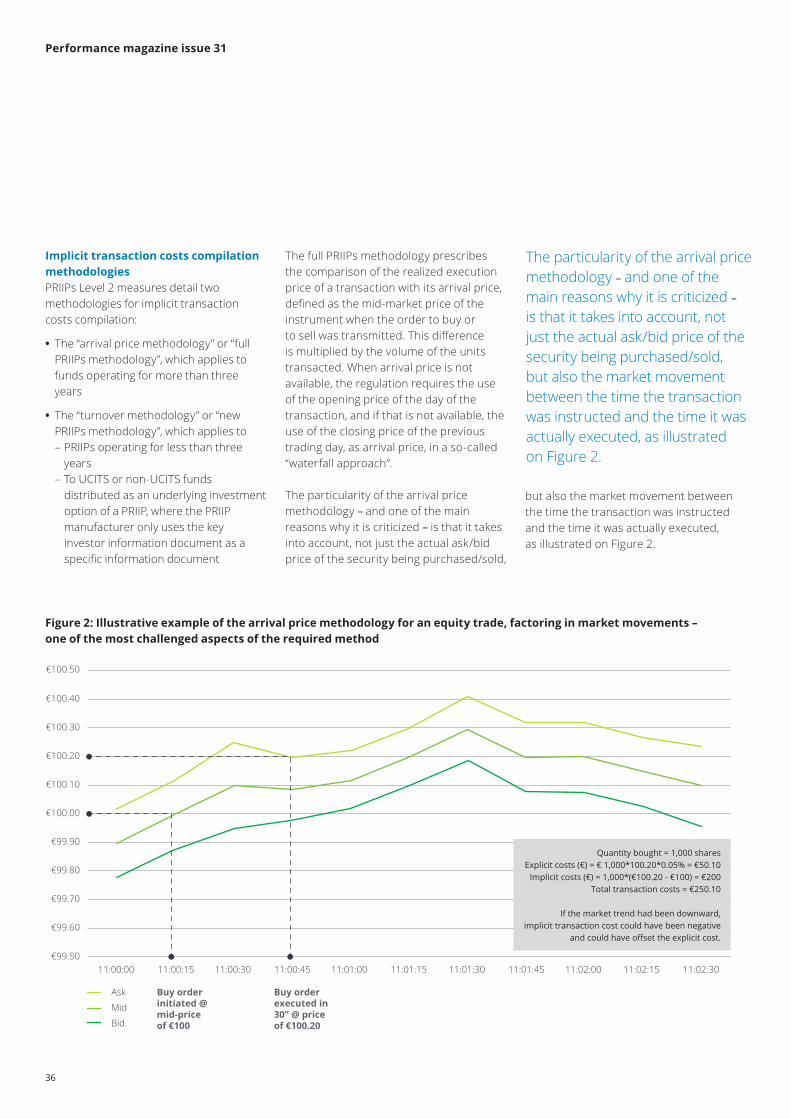
The full PRIIPs methodology prescribes the comparison of the realized execution price of a transaction with its arrival price, defined as the mid-market price of the instrument when the order to buy or to sell was transmitted. This difference is multiplied by the volume of the units transacted. When arrival price is not available, the regulation requires the use of the opening price of the day of the transaction, and if that is not available, the use of the closing price of the previous trading day, as arrival price, in a so-called “waterfall approach”.
The particularity of the arrival price methodology – and one of the main reasons why it is criticized – is that it takes into account, not just the actual ask/bid price of the security being purchased/sold,
Figure 2: Illustrative example of the arrival price methodology for an equity trade, factoring in market movements – one of the most challenged aspects of the required method
€100.50
€100.40
€100.30
€100.20
€100.10
€100.00
€99.90
€99.80
€99.70
€99.60
€99.5011:00:00 11:00:15 11:00:30 11:00:45 11:01:00
Buy order initiated @mid-price of €100
Buy order executed in 30” @ price of €100.20
11:01:15
Bid
11:01:30 11:01:45 11:02:00 11:02:15 11:02:30
Quantity bought = 1,000 sharesExplicit costs (€) = € 1,000*100.20*0.05% = €50.10
Implicit costs (€) = 1,000*(€100.20 - €100) = €200Total transaction costs = €250.10
If the market trend had been downward,implicit transaction cost could have been negative
and could have offset the explicit cost.
Mid
Ask
The particularity of the arrival price methodology – and one of the main reasons why it is criticized – is that it takes into account, not just the actual ask/bid price of the security being purchased/sold, but also the market movement between the time the transaction was instructed and the time it was actually executed, as illustrated on Figure 2.
but also the market movement between the time the transaction was instructed and the time it was actually executed, as illustrated on Figure 2.
37
Performance magazine issue 31
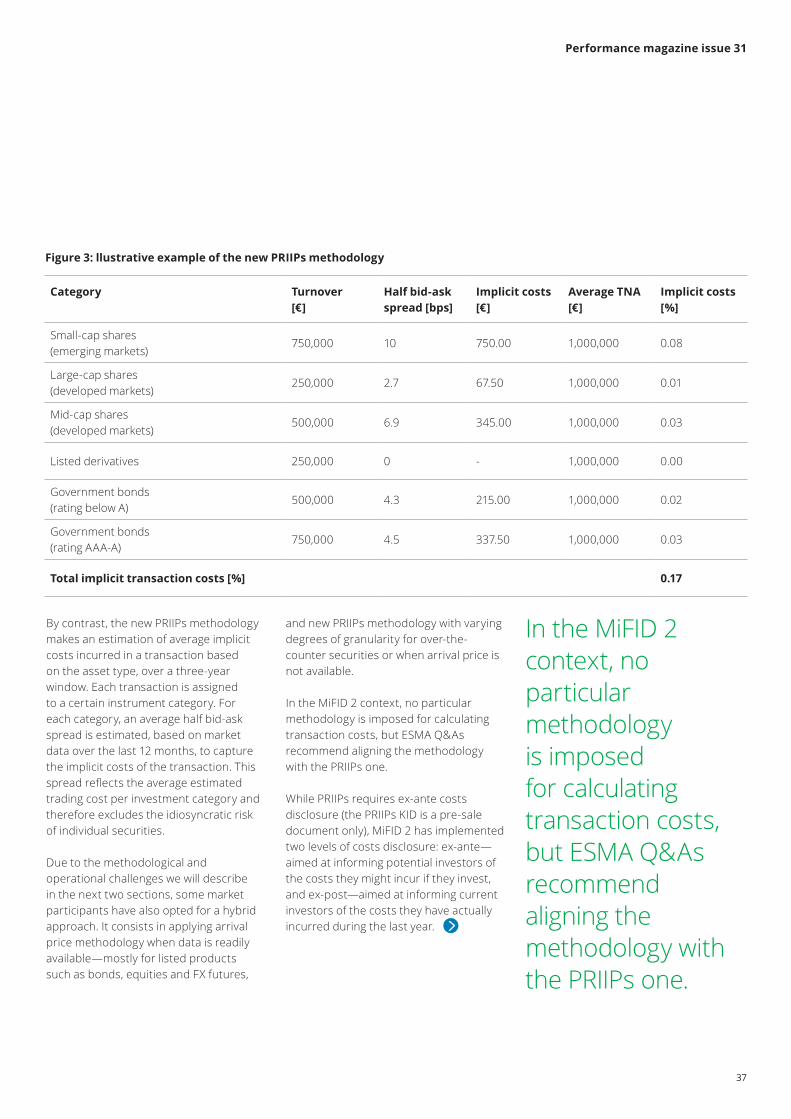
By contrast, the new PRIIPs methodology makes an estimation of average implicit costs incurred in a transaction based on the asset type, over a three-year window. Each transaction is assigned to a certain instrument category. For each category, an average half bid-ask spread is estimated, based on market data over the last 12 months, to capture the implicit costs of the transaction. This spread reflects the average estimated trading cost per investment category and therefore excludes the idiosyncratic risk of individual securities.
Due to the methodological and operational challenges we will describe in the next two sections, some market participants have also opted for a hybrid approach. It consists in applying arrival price methodology when data is readily available—mostly for listed products such as bonds, equities and FX futures,
and new PRIIPs methodology with varying degrees of granularity for over-the-counter securities or when arrival price is not available.
In the MiFID 2 context, no particular methodology is imposed for calculating transaction costs, but ESMA Q&As recommend aligning the methodology with the PRIIPs one.
While PRIIPs requires ex-ante costs disclosure (the PRIIPs KID is a pre-sale document only), MiFID 2 has implemented two levels of costs disclosure: ex-ante—aimed at informing potential investors of the costs they might incur if they invest, and ex-post—aimed at informing current investors of the costs they have actually incurred during the last year.
Figure 3: llustrative example of the new PRIIPs methodology
In the MiFID 2 context, no particular methodology is imposed for calculating transaction costs, but ESMA Q&As recommend aligning the methodology with the PRIIPs one.
Category Turnover [€]
Half bid-ask spread [bps]
Implicit costs [€]
Average TNA [€]
Implicit costs [%]
Small-cap shares (emerging markets)
750,000 10 750.00 1,000,000 0.08
Large-cap shares (developed markets)
250,000 2.7 67.50 1,000,000 0.01
Mid-cap shares (developed markets)
500,000 6.9 345.00 1,000,000 0.03
Listed derivatives 250,000 0 - 1,000,000 0.00
Government bonds (rating below A)
500,000 4.3 215.00 1,000,000 0.02
Government bonds (rating AAA-A)
750,000 4.5 337.50 1,000,000 0.03
Total implicit transaction costs [%] 0.17

38
Performance magazine issue 31
Methodological challengesFund industry representatives have raised strong concerns regarding the full PRIIPs methodology, related to the accuracy and meaningfulness of the results provided.
Firstly, negative or zero transaction costs are frequently highlighted as a severe shortfall of the arrival price method. This can occur due to market movement if the difference between the initiation price and the execution price is so favorable to the investor that it offsets other transaction costs. By contrast, market movements do not affect implicit costs obtained using the new PRIIPs methodology. More specifically, using arrival price transaction costs will always be negative for some types of transactions. Figure 4 illustrates
the example of a buy limit order which will always result, if executed, in a negative implicit transaction cost.
Second, the two different methodologies prescribed by the PRIIPs regulation may result in significantly different transaction costs within a same investment category, which reduces funds comparability. Some real-life examples show up to five-percentage point difference between transaction costs of the same fund estimated with the two methodologies2.
This comparability issue is also exacerbated by the present divergence of the regulatory frameworks. For instance, the UK regulator encourages the use of the arrival price methodology for all
costs disclosures efforts, including in the context of the UK Workplace Pension Policy Statement (e.g. DCPT), the Cost Transparency Initiative and MiFID 2. Should there be a revision of the PRIIPs transaction costs methodology, this may result in the same investment fund displaying different transaction costs across various regulatory contexts and disclosures.
Figure 4: Illustrative example resulting in negative implicit transaction costs for a buy limit order
€17.00
€16.50
€16.00
€15.50
€15.00
€14.50
€14.00
€13.50
€13.0009:30:00 10:00:00 10:30:00 11:00:00 11:30:00
Buy limit order initiated @mid-price of €15
Implicit Transaction Costs€14.50 – €15.00 = -€0.50
Buy limit order executed at €14.50
11:00:00
Bid
12:30:00 13:00:00 13:30:00 14:00:00 14:30:00
Mid
Ask
Limit order
Limit order
2. EFAMA’s evidence on the PRIIPs KID's shortcomings, 23 March 2018

39
Performance magazine issue 31
Operational challengesEnsuring data quality surely represents one of the most significant operational challenges. The number of transactions to process in a three-year observation window can largely exceed 10 million for large asset managers. The data quality may involve identification and removal of duplicate, cancelled or non-market transactions, identification and specific processing of trade at market auction close, trade at issuance, and derivative transactions, among other operational elements.
Many market players agree that market data availability presents a challenge for the relevance of the results of the full PRIIPs methodology. The PRIIPs RTS explicitly state that intra-day prices may be considered as unavailable for the period prior to the start of 2018. In cases where intra-day prices are unavailable, it is permissible to use the opening or closing prices, which may distort the figures disclosed by showing market movement—the difference between transaction price and the previous closing price, for instance, as transaction costs for the investors.
For the purpose of the new PRIIPs methodology, the Association Française
de la Gestion Financière (AFG) regularly publishes a half bid-ask spread matrix, estimated based on contributions from large French asset managers. While the use of this matrix ensures greater comparability of implicit transaction costs, it also represents a mapping problem in connection to reducing an investment universe on only seventeen categories. In response to this challenge, some market participants have added more granularity to this standard matrix, tailored to their investment strategy.
Similar to other types of regulatory reporting, two of the key challenges that remain are (i) ensuring governance around the computation and disclosure of transaction costs and (ii) consistency with other frameworks already in place. For instance, as disclosed transaction costs may be reduced by the amount of anti-dilution proceeds—such as proceeds from the application of swing pricing, asset managers should ensure the consistency and appropriateness of their swing pricing methodology with the transaction costs methodology. Furthermore, integration of anti-dilution proceeds may also result in negative transaction costs – which may not be the intended disclosure to investors.
To the point:
• Transaction costs represent costs inseparably linked to a purchase or a sale of an asset and should be disclosed under PRIIPs and MiFID 2 legislations, both ex-ante and ex-post
• Transaction costs can be split between explicit costs – reflecting brokerage fees, taxes, etc., and implicit costs – capturing the difference between bid and ask prices
• Main challenges around implicit transaction costs estimation are: 1) interpretation of negative (or zero) transaction costs 2) comparability across funds and over time, exacerbated by different methodologies used 3) data availability and data quality 4) governance and alignment with other regulatory frameworks
Conclusion and next stepsThe majority of market participants are challenging the prescribed transaction costs compilation methodology. The European Supervisory Authorities (ESAs) have carefully assessed the evidence regarding whether the transaction costs methodology is working as intended and have concluded that some amendments to the current rules are appropriate, as proposed in their Joint Consultation Paper of 16 October 2019. As a result, we may see amendments to the transaction costs computation and disclosure requirements in the near future. This may include a requirement to exclude implicit transaction costs when negative, to allow for an extended use of internal sources for arrival price and a simplified approach for over-the-counter securities and for PRIIPs with a low number of transactions. However, it is likely that arrival price will still be required for listed securities. Therefore, UCITS asset managers currently using only the new PRIIPs methodology will need to start to upgrade their operations to enable the arrival price data collection - or source it externally, in order to be ready by end of 2021, when the PRIIPs exemption for UCITS ends.

40
Performance magazine issue 31
Emmanuelle MiettePartnerAssurance Deloitte
Dario Zambotti DirectorAssurance Deloitte
The Italian asset management sector An attractive market

41
Performance magazine issue 31
The Italian asset management sector has experienced a long period of growth and is one of the largest and most dynamic markets in Europe. According to Assogestioni, the Italian asset management industry set a new record of €2.271 billion for Assets under Management (AuM) in the third quarter of 2019.
In recent years, funds and portfolio mandates have, with very few exceptions, posted positive monthly net inflows,
marking something of a boom for asset managers and distributors.
Low interest rates have for the first time forced Italian savers and institutions to look beyond the easy returns they previously obtained from government bonds, boosting the appeal of asset managers.
The aim of this article is to provide an overview of the Italian asset management market, highlighting recent sector trends, analysing the impact of these trends, and anticipating the influence they may have in the coming years.
To read the whitepaper1 published by Deloitte Luxembourg in collaboration with Deloitte Italy and JEME Bocconi Studenti, access our dedicated webpage.
Low interest rates have for the first time forced Italian savers and institutions to look beyond the easy returns they previously obtained from government bonds, boosting the appeal of asset managers.
1. Available at: www2.deloitte.com/lu/asset-management-italy

42
Performance magazine issue 31
Market overviewInvestment funds are becoming increasingly popular with investors thanks to the diversification that they provide and the professional competence of financial operators. Multi-asset products have overtaken traditional equity and bond funds, with the rise of balanced flexible funds and formula funds in recent years.Assets under management in Italy as at September 2019 were almost equally split between collective investment funds (49 percent) and discretionary mandates (51 percent). Within collective investment funds—the segment we focused on—the vast majority are open-ended funds with AuM of €1.036 billion at end-September (closed-ended funds accounted for AuM of €62 billion).
Investment funds are becoming increasingly popular with investors thanks to the diversification that they provide and the professional competence of financial operators.
A key factor in understanding the Italian market is the population’s propensity for saving: Italians have always been and still are great savers. Traditionally conservative in their financial habits, of late they have been forced to consider investments other than government bonds and deposits. Baby boomers, who own the largest share of Italy’s financial wealth, are the main target group for asset management firms. It is worth noting that one-third of Italians’ wealth is still parked in deposits and cash, representing huge potential for the industry. It will be vital for distributors to dig deep into their specific investment needs: low-risk seekers with little financial education will require assistance from a professional.
Figure 01: Average portfolio compositionin Percentages
0 20
2018
2012
2008
40 60 80 100
28,9 21,1 6 24,3 1,1 11 7,6
31,2 19,2 7,6 19,6 1,9 13,2 7,2
32 7 12 22,3 2,4 17,3 7
Deposits and cash
Pension funds
Shares and partecipating interestBonds
Insurance policies
Investment fund units
Other assets

43
Performance magazine issue 31
Another interesting factor is distribution in Italy, where there is a high concentration of market share among the top players. The market is currently dominated by banks, which are leaders in both fund and life insurance distribution. For more information on the distribution networks please see our previous report on the Italian market (www2.deloitte.com/lu/asset-management-italy). In terms of concentration, the ten biggest players accounted for 80 percent of the market at the beginning of 2018.
The relationship between the asset manager and the distributor is mainly
captive. This means that sector players are highly integrated, i.e. asset managers mainly enter into distribution agreements with a promoter that belongs to the same group. At the beginning of 2018, 73 percent of funds were distributed through an integrated model.
We can expect to see this distribution model evolve somewhat going forward in response to the MiFID regulation, tech innovations and the distribution opportunities offered to smaller players by Borsa d’Italia.
The market is currently dominated by banks, which are leaders in both fund and life insurance distribution.
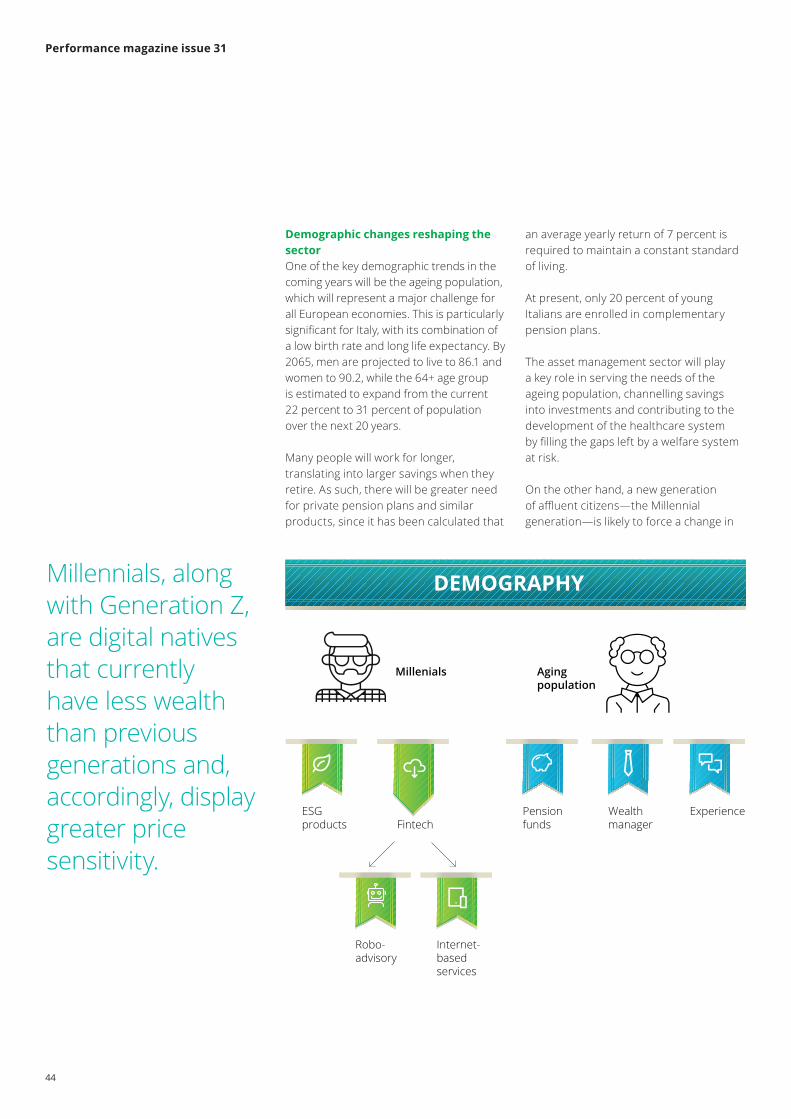
44
Performance magazine issue 31
Demographic changes reshaping the sector One of the key demographic trends in the coming years will be the ageing population, which will represent a major challenge for all European economies. This is particularly significant for Italy, with its combination of a low birth rate and long life expectancy. By 2065, men are projected to live to 86.1 and women to 90.2, while the 64+ age group is estimated to expand from the current 22 percent to 31 percent of population over the next 20 years.
Many people will work for longer, translating into larger savings when they retire. As such, there will be greater need for private pension plans and similar products, since it has been calculated that
an average yearly return of 7 percent is required to maintain a constant standard of living.
At present, only 20 percent of young Italians are enrolled in complementary pension plans.
The asset management sector will play a key role in serving the needs of the ageing population, channelling savings into investments and contributing to the development of the healthcare system by filling the gaps left by a welfare system at risk.
On the other hand, a new generation of affluent citizens—the Millennial generation—is likely to force a change in
DEMOGRAPHY
Millenials Aging population
Pension funds
ESGproducts Fintech
Wealth manager
Robo-advisory
Internet-basedservices
Experience
DEMOGRAPHY
Millenials Aging population
Pension funds
ESGproducts Fintech
Wealth manager
Robo-advisory
Internet-basedservices
Experience
Millennials, along with Generation Z, are digital natives that currently have less wealth than previous generations and, accordingly, display greater price sensitivity.

45
Performance magazine issue 31
No trade-off between ESG investing and returnsESG investing, which incorporates environmental, social and governance considerations in the investment approach, will soon no longer be considered simply as good practice and will become a new standard. Some studies have shown that ESG-compliant instruments are already delivering higher returns than non-ESG compliant products.
Developments in technology and transparency requirements will continue to be key themes in the global economy, making it easier for investors to be informed. This will impose a change of mindset on asset managers, who will have to adopt more robust screening procedures that will rule out players engaged in practices no longer considered sustainable. A strong ESG profile will therefore be a key signal to the market of better risk management and low systematic risk, which will result in lower tail risk, lower cost of capital and, consequently, higher valuations.
Shift towards a demand-driven asset management sector In light of the above considerations, the increasing importance of customer requirements will be at the heart of an asset management revolution. Demographic change will impact on investment habits and increase the need for new products and services, with on one hand, greater use of robo-advisory and innovative technological solutions and, on the other, the likely emergence of new personal and trusted advisors offering tailored investment strategies.
The trends reshaping the landscape of both the investor and the asset manager should lead to the roll-out of new products. For instance, major fund distributors will create more passive products, which are based on low fees and myriad diversification opportunities,
the strategy of the asset managers. In the next ten years, some 20 percent of Italy’s wealth will be inherited by around six million Italians, while Millennials will represent the majority in the workforce. Millennials, along with Generation Z, are digital natives that currently have less wealth than previous generations and, accordingly, display greater price sensitivity. Alongside investment potential, asset managers will also have to take account of their investment objectives. Moreover, younger investors are particularly concerned about sustainability and environmental issues, and this will drive a change in investment strategies and targets.
thereby offering customers investments with an attractive risk-reward profile.
Robo-advisory technology offers customers portfolio management and creation strategies based on index funds and ETFs, which mean lower fees and upfront capital requirements for investors. This market is showing bright prospects for global growth, with a target of 140 million users in 2024. The development of such services will enhance the already evident benefits of passive strategies.
The impact of demographic change on investor profiles, coupled with major technological advances and new financial products (e.g. incorporating ESG criteria), will put pressure on asset managers to re-think their role and modify their approach towards customers.

46
Performance magazine issue 31
Asset managers will have to become more like wealth managersThe aforementioned changes in the industry and the growing fragmentation of demand is likely to mean that the profile of an asset manager will evolve to more closely resemble a wealth manager.
Artificial intelligence is being used increasingly by traditional asset managers, potentially opening up space for new FinTech players to move into. Although the possible applications are almost limitless, artificial intelligence is unlikely to replace human emotional intelligence completely. This is why asset managers will have to modify their approach towards customers, moving from being asset allocators to becoming the trusted advisor of their clients.
To achieve that goal, a new marketing strategy will have to be implemented. Besides CRM and financial modelling software, social media is also having an increasing impact on asset management due to the fundamental role it plays in the modern investment community; a good example to consider might be the success of crowdfunding initiatives after viral communications and campaigns on social media.
Nonetheless, the new “wealth” managers will be in a better position to justify the fees for their products, explaining why investors should lean towards their products, which can be either for particular investment needs (such as ESG) or for extra returns when compared to the passive counterpart that replicates the benchmark. Active management has already moved towards more complex investment instruments and asset classes, such as private markets that allow further portfolio diversification and higher long-term potential returns: the “wealth” manager will enable the roll-out of these investment strategies alongside the development of investment instruments that could allow retail investors to enter this more alternative and risky segment.
In this context, it will be important to factor in the financial knowledge of Italian investors, which remains low according to a survey carried out in 2019 by Consob, the Italian securities market regulator. The proportion of correct answers to financial literacy questions ranged from 41 percent to 57 percent for basic concepts such as inflation, the risk-return trade-off and portfolio diversification—substantially in line with the evidence gathered in previous surveys—and falls to 20 percent or lower for more advanced concepts. In this respect, the “wealth” manager will be required to promote financial education programmes and to propose highly-tailored solutions, depending on the financial knowledge of the risk takers.
In view of these considerations, the asset manager of the future will probably allocate fewer assets and provide more solutions, thus providing a more meaningful experience.
The human traits of the future of asset management As mentioned in the above summary of our white paper “The Italian asset management sector and the trends impacting its future”, demographic transition and technological advances will primarily lead to a change in the general mindset.

47
Performance magazine issue 31
The investors of the future will expect their asset managers to provide a transparent tech-based service and include ESG features in the investment solutions proposed. Since the demand is expected to be highly fragmented, asset managers are likely to further develop passive investment strategies with significant investments in artificial intelligence and robo-advisors and to transform active asset managers into investment advisors whose value added will be to provide clients with an ‘investment experience’.
The Italian asset management market is evolving in accordance with new trends, presenting considerable opportunities to players who are able to understand and include them in strategic development plans. Investors have different needs, some of which are latent, and will place their trust only in asset managers that can offer them tailored and cost-effective financial solutions.
To the point:
• Italian investment management market has grown significantly in last decade and it still has high potential due to the level of savings still held on bank accounts.
• Demographic changes are reshaping the industry: investors base will change significantly in the next years and this will require new products and services.
• Customers’ needs will be at the heart of the asset management industry: on one hand there will be an increasing need for robo-advisory and innovative technological solutions and, on the other hand, new personal trusted advisors offering tailored investment strategies will emerge.
• Asset managers will have to modify their approach towards customers, moving from being an asset allocator to becoming the trusted advisor of their clients.
The Italian asset management market is evolving in accordance with new trends, presenting considerable opportunities to players who are able to understand and include them in strategic development plans.

48
Performance magazine issue 31
Frederic Bertholon-Lampiris PartnerFinancial Risk Deloitte
Nadege Grennepois PartnerRisk Advisory Deloitte
Building a robust model risk management framework in financial institutions
With increasing volumes of data, and the introduction of Artificial Intelligence (AI) and machine learning (ML) technologies, models are at the heart of every Financial Institution’s (FI) operations. However, as FIs increasingly rely on model outputs for decision-making, the focus on model risk—or risk of errors in the development, implementation, or use of models—has continued to gain momentum.

49
Performance magazine issue 31
There are several reasons for this. Firstly, the evolving technological capability of algorithms has resulted
in widespread democratization of model development, enabling users to deploy models without relying on internal IT or traditional model development functions. While this increases the speed of innovation, it also increases the risk for organizations, as these new models are not subjected to the same robust testing systems and governance structures as traditional ones.
Secondly, there has been increasing stakeholder expectations related to the documentation, accountability, controls, and risk management of such models. Regulators have been intensifying their scrutiny on model risks, focusing on models with elements of AI systems and ML algorithms.
In Singapore, the Monetary Authority of Singapore (MAS) released its set of principles to promote Fairness, Ethics, Accountability, and Transparency (FEAT) in the use of AI and data analytics (AIDA) in
Singapore’s financial sector. The aim is to guide FIs in their governance and mitigation of model/algorithmic risks. This direction has been reinforced by the Personal Data Protection Commission, which released a discussion paper on its Model AI Governance Framework articulating a common AI governance approach and a set of consistent principles on the responsible use of AI, to promote its adoption while ensuring that its risks are assessed, monitored, and mitigated.
What is model risk?Model risk is the potential loss that an FI may incur because of decisions that could be principally based on the output of models, due to errors in the development, implementation, or use of such models. Similarly, algorithmic risk may rise from the use of data analytics and cognitive technology-based software algorithms in automated and semi-automated decision-making environments.

50
Performance magazine issue 31
Risk factorsModel/algorithmic risks should be considered as a specific risk type to be managed in a similar way to other risks faced by FIs. This means that a robust framework should be put in place to identify, assess, mitigate, and monitor the evolution of model/algorithmic risks across the organisation.
Several underlying factors contribute to model risk:
The cognitive biases of model developers and users could skew outputs and yield unintended outcomes, especially when there is a lack of governance, or misalignment between the organisation’s values and behaviours of individual employees.
A lack of technical rigour during development, training, testing, or validation processes could result in models producing inaccurate outputs.
Even if the models produce accurate outputs, flaws in their implementation or integration with operations could result in inaccurate judgements.
Security breaches could enable internal or external actors to manipulate the outputs of a model to influence decision-making.
Model/algorithmic risks should be considered as a specific risk type to be managed in a similar way to other risks faced by FIs.
HUMAN BIASES
USAGE FLAWS
TECHNICAL FLAWS
SECURITY FLAWS
51
Five pillars of a model risk management frameworkRegardless of the organisation’s size and structure, its model risk management framework should consist of clearly defined roles and responsibilities across all stages of a model’s life cycle. In addition, a sound framework should define the level of control and ensure clear accountability for each model/algorithm within its scope, depending on the magnitude of its expected impact on business performance and organisational reputation.
Overall, a robust framework should include five pillars, to be adapted to the level of materiality and complexity of the scope:
01. Organisation and governance: Existence of a model risk management function, approved by the board and reporting to the Chief Risk Officer, which assesses and manages model/algorithmic risks
02. Model life cycle management: Continuous monitoring of all stages in a model’s life cycle, including development, documentation, classification, validation, and inventory maintenance
03. Model control framework: Initial validation before implementation, and continuous review of models and algorithms that have been assigned the highest level of risk
04. Model risk assessment and quantification: Assessment and quantification of model/algorithmic risks with the use of qualitative and quantitative techniques
05. Model risk management processes and technology: Implementation of appropriate processes and technology to support the management of traditional and AI-based models
Raising awareness on model/algorithmic risk managementIn order for FIs to assess and monitor their model risks, the appropriate metrics will need to be defined in alignment to their risk appetite and risk tolerance limits, and continuously monitored by the board and senior management.
The implementation of a central model inventory that encompasses all of an organisations’ models, tools, and calculators can enable stakeholders to assess the risk criticality levels for each model based on materiality and complexity, and focus testing and validation efforts on models deemed to be of higher risk. Such an inventory would enable risk mitigation actions to be documented, and enable organisations to identify models that are not fit for purpose, or which have been used for unintended purposes.
Ultimately, a model risk management framework should strive to embed a model governance culture within the organisation. Rather than focusing only on compliance, the framework should provide guidance, standardisation, and clear communication channels – features that could lead to long-term, improved efficiency in model development with enhanced governance. In this way, risk management can contribute to a better and sounder decision-making process, instead of being simply an oversight function.
• The evolving technological capabilities of algorithms have resulted in widespread democratization of model development. While this increases the speed of innovation, it also increases the risk for organizations, as these new models are not subjected to the same robust testing systems and governance structures as traditional ones.
• There has been increasing stakeholder expectations related to the documentation, accountability, controls, and risk management of models, and regulators are intensifying their scrutiny on model risks, focusing on models with elements of AI systems and ML algorithms.
• Model/algorithmic risks should be considered as a specific risk type to be managed in a similar way to other risks faced by FIs. This means that a robust framework should be put in place to identify, assess, mitigate, and monitor the evolution of model/algorithmic risks across the organization.
• A robust framework should include five pillars, to be adapted to the level of materiality and complexity of the scope: existence of a model risk management function; continuous monitoring of all stages in a model’s life cycle; initial validation before implementation, and continuous review of models and algorithms; assessment and quantification of model/algorithmic risks; and implementation of appropriate processes and technology.
• A model risk management framework should strive to embed a model governance culture within the organization. Rather than focusing only on compliance, the framework should provide guidance, standardization, and clear communication channels, thus contributing to a better and sounder decision-making process.
To the point:
Performance magazine issue 31
52
Performance magazine issue 31
Asset management disruptedUnlocking the potential of artificial intelligence in fixed income investingDorothea SchmidtPartnerInvestment Management OperationsDeloitte
Martin JustenSenior ManagerInvestment Management OperationsDeloitte
Andrew GoldsteinPartnerDigital VenturesDeloitte
Constantin KrauseSenior ConsultantInvestment Management OperationsDeloitte
Yan StegertConsultantInvestment Management OperationsDeloitte
Christian Thomas SchäferDirectorAnalytics InstituteDeloitte

53
Performance magazine issue 31

54
Performance magazine issue 31
Like few other technologies, artificial intelligence (AI) has the potential to fundamentally transform virtually any industry. However, the fixed income asset management sector has not yet fully embraced AI, and many sector players have failed to recognize the potential of intelligent solutions.
Three major challenges—low interest rates, exponential growth in data volumes, and increasing regulatory
requirements—are driving asset managers to develop new technology-based solutions inside and outside their core business. At the same time, technological advancements offer a unique opportunity to solve these challenges.
Given these underlying conditions, we have developed three use cases to serve as examples of how AI-enabled technology can solve the challenges of today. Firms may find it beneficial to market these use cases to third parties, rather than exclusively implementing them in-house, due to the nature of AI, the considerable upfront investment, and certain strategic considerations.
CHALLENGESIncreasing cost pressure and decreasing profit margins have forced asset managers to rethink their traditional approach to investment management. The findings of numerous interviews we conducted with executives of several large German asset management firms support our hypothesis that fixed income asset management is lagging behind. In particular, we identified three main challenges: the low interest rate environment, exponential growth in data, and increasing number of regulations.
In an effort to revive the economy after the financial crisis, central banks around the world gradually lowered interest rates until the euro zone reached a record low of zero percent in March 2016, with interest rates now even hitting negative territory.
This prolonged low interest rate environment, in conjunction with bond-purchasing programs as part of quantitative easing, have depressed yields for the fixed income portion of investment portfolios, and will make exploring alpha even tougher for active managers going forward. And yet, there are ways to counteract plummeting margins and rising cost pressure.
Exponential data growth is one of the main drivers of AI maturity. While there is no doubt that Big Data offers enormous potential in many use cases, dealing with the ever-growing masses of available data also presents a serious problem for most industries, including asset management.
90 percent of data worldwide was generated within the last two years alone1. Capturing these data flows and analyzing them to exploit their upside potential
The findings of numerous interviews we conducted with executives of several large German asset management firms support our hypothesis that fixed income asset management is lagging behind.
1. https://www.forbes.com/sites/bernardmarr/2018/05/21/how-much-data-do-we-create-every-day-the-mind-blowing-stats-everyone-should-read/#7344b05160ba
LOW-INTEREST RATE ENVIRONMENT
EXPONENTIAL DATA GROWTH

55
Performance magazine issue 31
requires capabilities that are simply not offered by status quo data management systems and analytical tools. Our interviewees confirmed that they would particularly benefit from access to data that is as up-to-date as possible.
While the volume, speed, and scope of data is increasing, the significance of data sources is also shifting. Asset managers have traditionally based their investment models on official sources with primarily quantitative information, such as corporate filings, however the growing volume of data from a variety of sources has given unconventional sources such as social media, blogs, press releases, and product reviews an increasingly important role.
By using AI to handle what seems like an explosion of data, asset managers can conduct deeper and richer analyses and gain a crucial competitive edge.
Ever since the 2008 financial crisis, regulators worldwide have implemented restrictive regulations and placed increasing scrutiny on the asset management industry, in an effort to promote financial market integrity and reduce risk for investors. The responses of the executives we surveyed suggest that the expanding regulatory framework is one of the bigger challenges facing the industry.
The CRA III Regulation in particular impacted fixed income operations of asset managers at the European level. After the major credit rating agencies were implicated in the financial meltdown and subsequent worldwide debt crisis, the EU passed the directive in an attempt to prevent over-reliance on external
ratings. It requires asset managers to assess in-house the credit risk of externally-rated assets using plausibility checks.
To comply with these regulatory requirements, firms are under pressure to hire additional credit analysts, inevitably resulting in higher overall expenses. In one of our deep dives into the following use cases, we’ll show how firms can leverage automation and AI to master these regulatory challenges.
INCREASING REGULATIONS

56
Performance magazine issue 31
TECHNOLOGY OVERVIEWAI is an area of computer science focused on the design of intelligent machines that perceive their environment and take autonomous decisions and actions to maximize the chance of reaching their goals. AI models are capable of interactions that traditionally required human intelligence, most significantly reasoning based on partial or uncertain information. AI is typically trained to serve a specific application, and therefore takes a variety of forms.
The framework used to train AI models and the key AI technology is Machine Learning (ML). ML refers to the ability of statistical models to develop capabilities and improve their performance on a given task over time—without the need to follow explicitly programmed instructions to do so. ML technologies are iterative in nature, i.e. they progressively improve their performance of a particular task through data analysis.
Thanks to four key technological trends in AI (see Figure 1 for an overview), industry players have the opportunity to reinvent their business and overcome existing challenges.
Natural Language Processing (NLP) is a special application of AI designed to analyze and understand natural language. NLP thus provides a basis for the capture, presentation, and reproduction of spoken and written language.
Language analysis requires a system to not only understand individual words and sentences, but also contexts and
meanings. The complexity and ambiguity of human language pose a particular challenge. In order to improve language comprehension, systems must first collect and categorize large amounts of data using ML and Big Data tools.
Advances in NLP allow asset managers to capture and process textual data sources with a new degree of automation, thereby leveraging information yet to become established. Text-based information obtained through NLP can also be used to improve ML algorithms in complex domains.
Text-based information obtained through NLP can also be used to improve ML algorithms in complex domains.
TECHNOLOGICAL TRENDS
ADVANCES IN NLP
Figure 1: Overview technology trends
Technological trends Description
NATURAL LANGUAGE PROCESSING (NLP)
NLP refers to the technology used to analyze and understand natural language. NLP thus provides a basis to capture, process, and structure textual data for application within ML models.
DOMAIN-ENRICHED MACHINE LEARNING
In highly complex domains such as financial markets, human domain knowledge or expert knowledge improves the learning process of ML technologies.
CONNECTION OF KNOWLEDGE
Knowledge graphs use data from different sources to create a network that comprises entities, their semantic types, properties, and the relationships between entities.
“WHITE-BOXING” MACHINE LEARNING MODELS
The transparency and interpretability of algorithms is key, mainly due to regulatory requirements and a desire to inspire trust in the ML models among human users. Recent research has identified methods designed to “white-box” complex ML models.

57
Performance magazine issue 31
ML technologies can rely on either automatic or interactive learning processes. While fully automated ML solutions achieve impressive results in many domains, it can be beneficial to draw on human expert knowledge in highly complex domains such as financial markets. Here, expert knowledge is typically the most relevant information for inductive learning performance.
Models can incorporate professional expertise specifically via domain knowledge on fixed income investments or on the data representation used. This enables domain-enriched ML algorithms to adapt to industry-specific needs and produce more accurate predictive analyses.
In particular, ML-based solutions reveal their inherent limitations when available data is too limited or too complex. Knowledge graphs, which use data from different sources and represent relationships between such data, are useful in these cases. These diagrams are essentially large networks that comprise entities, their semantic types, properties, and relationships between entities. As the availability of large-scale event data increases, novel insights with knowledge graphs that contain temporal, dynamically-evolving information can be generated.
By connecting data, knowledge graphs can mimic the human ability to understand meaning from context, and produce previously unthinkable results with AI solutions. This is a major support for human intelligence, and particularly for complex tasks in the investment industry.
Implementing ML algorithms in financial institutions is a staggering task. Due to regulatory demands and a drive to inspire public trust in ML models, the transparency and interpretability of algorithms is key. ML is typically described as a black-box approach, meaning it is difficult to track its processing and identify how particular features impact the model output.
Recent research has identified methods to open the black-box of ML algorithms, in order to increase acceptance among users of complex ML models and meet asset management regulator requirements. New “white-boxed” ML algorithms identify the shortcomings of existing approaches and improve forecasting, while also maintaining transparency in the calculation methods.
While fully automated ML solutions achieve impressive results in many domains, it can be beneficial to draw on human expert knowledge in highly complex domains such as financial markets.
DOMAIN-ENRICHED MACHINE LEARNING
CONNECTION OF KNOWLEDGE
“WHITE-BOXING” MACHINE LEARNING MODELS
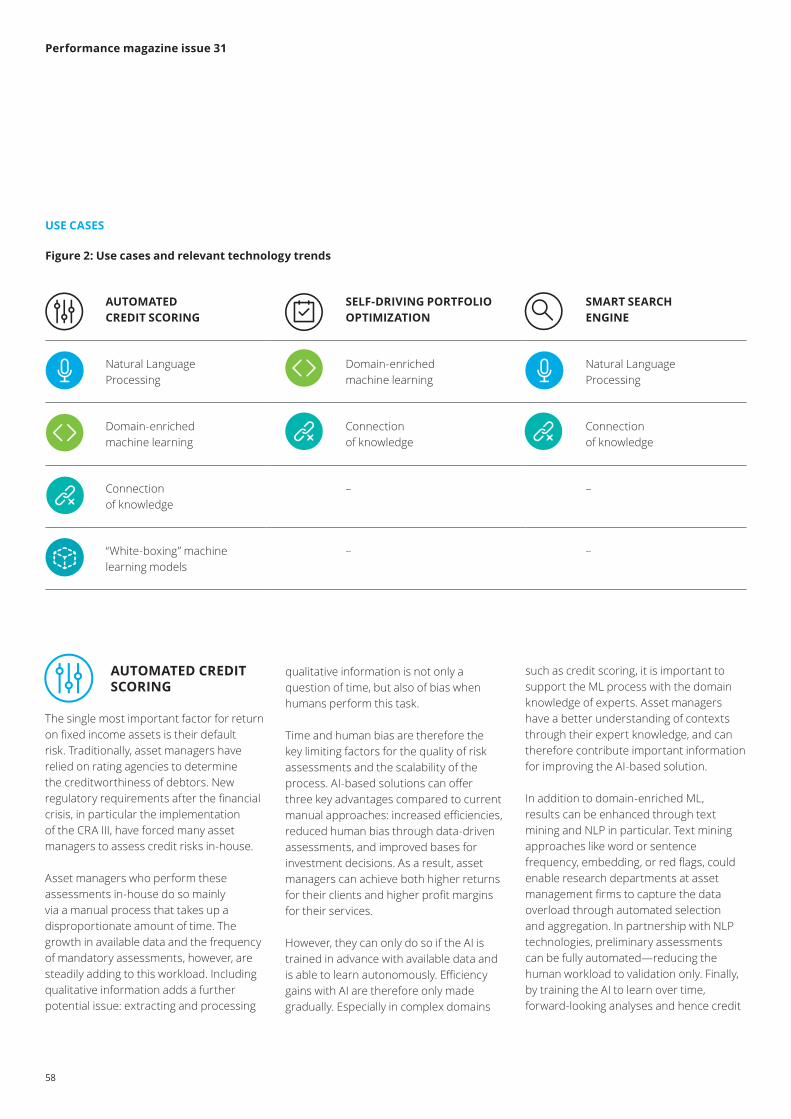
58
Performance magazine issue 31
USE CASES
Figure 2: Use cases and relevant technology trends
The single most important factor for return on fixed income assets is their default risk. Traditionally, asset managers have relied on rating agencies to determine the creditworthiness of debtors. New regulatory requirements after the financial crisis, in particular the implementation of the CRA III, have forced many asset managers to assess credit risks in-house.
Asset managers who perform these assessments in-house do so mainly via a manual process that takes up a disproportionate amount of time. The growth in available data and the frequency of mandatory assessments, however, are steadily adding to this workload. Including qualitative information adds a further potential issue: extracting and processing
qualitative information is not only a question of time, but also of bias when humans perform this task.
Time and human bias are therefore the key limiting factors for the quality of risk assessments and the scalability of the process. AI-based solutions can offer three key advantages compared to current manual approaches: increased efficiencies, reduced human bias through data-driven assessments, and improved bases for investment decisions. As a result, asset managers can achieve both higher returns for their clients and higher profit margins for their services.
However, they can only do so if the AI is trained in advance with available data and is able to learn autonomously. Efficiency gains with AI are therefore only made gradually. Especially in complex domains
such as credit scoring, it is important to support the ML process with the domain knowledge of experts. Asset managers have a better understanding of contexts through their expert knowledge, and can therefore contribute important information for improving the AI-based solution.
In addition to domain-enriched ML, results can be enhanced through text mining and NLP in particular. Text mining approaches like word or sentence frequency, embedding, or red flags, could enable research departments at asset management firms to capture the data overload through automated selection and aggregation. In partnership with NLP technologies, preliminary assessments can be fully automated—reducing the human workload to validation only. Finally, by training the AI to learn over time, forward-looking analyses and hence credit
AUTOMATED CREDIT SCORING
AUTOMATED CREDIT SCORING
SELF-DRIVING PORTFOLIO OPTIMIZATION
SMART SEARCH ENGINE
Natural Language Processing
Domain-enriched machine learning
Natural Language Processing
Domain-enriched machine learning
Connection of knowledge
Connection of knowledge
Connection of knowledge
– –
“White-boxing” machine learning models
– –

59
Performance magazine issue 31
ratings can be improved significantly. This results in a time-saving advantage and an opportunity to outperform the market.
Portfolio managers rely on exclusive research and information to create a competitive advantage and generate alpha for their clients. Many asset management companies therefore have to maintain very large research departments or procure costly external research.
As data volumes increase, asset managers will need more sophisticated tools to optimize their portfolios going forward. In order to generate higher yields, ML models can help portfolio managers predict price
movements and volatilities by detecting the right signals in Big Data streams.
This not only applies to quantitative data, but also to qualitative data and even audio files. Using text mining or NLP models, sentiment indicators can be derived from a variety of sources, such as social media, and give portfolio managers an indication of potential market developments. By connecting data through knowledge graphs in particular, AI solutions can analyze contexts.
Investment decisions will therefore be based on harmonized, quantifiable assessments, minimizing the uncertainty factor of human bias. This will fundamentally change research departments and portfolio management. The ability of intelligent algorithms to evaluate Big Data streams will support human analysts and not only handle a large
part of fundamental financial analysis, but also even provide investment recommendations.
Our interviews confirmed that the exponential growth in data has led to an increase in the time and resources required to structure, filter, and analyze data.
This problem is made worse by the fact that more and more regulatory requirements are forcing companies to obtain increasingly larger and more granular data in real time, for the purposes of reporting, risk management, and operational control. As a result, companies lack the capacity or time to conduct sufficient analysis of financial data.
AI-based solutions make it much easier to process large amounts of financial information, present it in a straightforward manner, and prioritize the information that asset managers need by creating a smart search engine. These search engines help companies to cut costs, while providing better information to managers through filter functionalities and improved data presentation, offering two main advantages: First, a smart search engine allows users to categorize data based on its level of quality, source, domain or an asset manager’s specific requirements. Advanced AI solutions can even detect domains and domain relationships between datasets. Second, an AI-based search engine has the advantage of allowing the system to merge large volumes of complex data into knowledge paths. This gives asset managers the ability to gain deep insights into data origination and impact analysis.
SELF-DRIVING PORTFOLIO OPTIMIZATION
SMART SEARCH ENGINES

60
Performance magazine issue 31
Back-office activities: Back-office activities:
FROM USE CASES TO BUSINESS BUILDING: Traditionally, technological back-office solutions are implemented to improve efficiency and create a competitive cost advantage. However, AI-enabled use cases have a huge potential to be marketed externally, rather than merely being used internally to cut costs. This “back-office as a service” model uses AI-enabled technologies to increase efficiencies in a firm’s own back-office, while also providing it to third-party customers or competitors, thereby creating a profit center that provides an additional revenue stream.
Figure 2: From cost center to profit center
AI-enabled use cases have a huge potential to be marketed externally, rather than merely being used internally to cut costs.
TRADITIONAL MODEL BACK-OFFICE AS A SERVICE
Continuous optimization of back-office activities
Create new revenue streams and improve back-office activities by offering activities as a service
Profit center
Cost center Cost/profit center3rd party customers
(e.g. competitors)
Cost center Cost center
Cost center Cost center
Profit center
Service provision
New revenue Streams and collective data usage

61
Performance magazine issue 31
CONCLUSION
• AI has had a lasting impact on the financial industry in recent years. While Fintech startups are joining the B2C market and initiating disruptive solutions, the B2B market, and in particular fixed income asset management, still relies on manual processes and traditional data processing.
• Low interest rates, increasing data volumes and strict regulations are forcing asset managers to reconsider their traditional business approach, and impressive technological advances in AI are paving the way. NLP, domain-enriched ML and connection of knowledge are particularly noteworthy here.
• To underscore the potential of AI, we have developed three use cases that show how AI-based software can be used: automated credit scoring, self-driving portfolio optimization, and smart search engines. These use cases show only a fraction of what is actually possible.
• What’s more, firms can sell their AI solutions on the broader market, which has the potential to create additional monetary, technical, and strategic advantages.
• Now is the time for asset managers to take advantage of new technological opportunities. By applying AI, incumbents can not only fend off new entrants and stand out from existing competitors, they can also build a winning strategy by creating new businesses, on a new playing field.
To the point:
• AI has had a lasting impact on the financial industry in recent years
• Fixed income asset management currently still relies on manual processes and traditional data processing
• Low interest rates, increasing data volumes, and strict regulations are forcing asset managers to reconsider their traditional business approach
• We’ve developed three example use cases to show how AI can be used: automated credit scoring, self-driving portfolio optimization, and smart search engines
• Now is the time for asset managers to take advantage of new technological opportunities

62
The only way is upDigital-fueled investment management services
© 2020 Deloitte Tax & Consulting.
In the ever-changing global markets, investment managers are facing a new level of complexity in their business. At Deloitte, we combine our strong expertise and significant industry experience with the digital tools and skills you need to take your fund strategy to the next level.
www.deloitte.com/lu

Performance magazine issue 31
63
WebinarsProgramme 2020Since 2009, Deloitte has decided to open its knowledge resources to the professionals of the Financial Services Industries community. We are happy to present to you the calendar of our new Link’n Learn season which, as in previous years, will be moderated by our leading industry experts. These sessions are specifically designed to provide you with valuable insight on today’s critical trends and the latest regulations impacting your business. An hour of your time is all you need to log on and tune into each informative webinar.
• Investment Management Tax / Tax Outlook 2020 13 February
• Challenges and opportunities of Sustainable Finance 19 March
• Fund distribution management 02 April
• Alternative funds 14 May
• AML/KYC 28 May
• Derivative Financial Instruments 18 June
• Introduction to Money Market Fund Regulation 10 September
• Carried interest: What to look out for when analysing the waterfall 24 September
• From outsourcing to smartsourcing, a key step to create value in the IM industry 01 October
• Data is king 15 October
• Valuation of illiquid assets 26 November
• Delegation, Oversight & Due diligence 03 December
Investment Funds
• Technology and innovation in Investment Management 25 June
Innovation & Technology
• Introduction to Risk Management 09 April
Risk & Asset Management
For access to the sessions do not hesitate to contact [email protected] and detailed agendas available here: www.deloitte.com/lu/link-n-learn
• Embracing complexity: the Asset Management Regulatory Landscape for 2020 06 February
• Culture and Corporate Governance 05 March
• How is Brexit affecting the asset management industry? 30 April
• PRiiPs and KID 11 June
• Trends on NAV errors and compliance breaches 12 November
Regulatory

64
Performance magazine issue 31
ContactsAfrica - East, West, Central and South
Dinesh Munu Partner - Audit +27 011 806 5767 [email protected]
David Nchimbi Partner - Audit+255 222 169 000 [email protected]
Joshua Ojo Partner - Audit +234 190 421 30 [email protected]
Australia
Neil BrownPartner - Assurance & Advisory Wealth Management +61 3 967 171 54 [email protected]
Siew-Kee Chen Partner - Tax+61 2 9322 3823 [email protected]
Philip HopePartner - Assurance & Advisory+61 2 8260 [email protected]
Declan O'CallaghanPartner - Assurance & Advisory+61 2 932 273 [email protected]
James OliverPartner - Assurance & Advisory +61 3 9671 7969 [email protected]
Austria
Dominik DammPartner - Advisory+431 537 005 [email protected]
Nora Engel-KazemiPartner – [email protected]
Robert PejhovskyPartner - Tax & Audit+431 537 004 [email protected]
Bahamas
Lawrence LewisPartner - ERS+1 242 302 4898 [email protected]
Belgium
Maurice VrolixPartner - Audit+32 2 800 [email protected]
Bermuda
Mark BaumgartnerPartner - Audit+1 441 299 [email protected]
James DockerayPartner - Tax+1 441 299 1399 [email protected]
Muhammad KhanPartner - Audit+1 441 299 [email protected]
Brazil
Cristina Yong Hae Soh Partner - Consulting +55 11 5186 1305 [email protected]
British Virgin Islands
Carlene A. RomneyPartner - Audit+1 284 494 [email protected]
Central Europe
Grzegorz CimochowskiPartner - Consulting+48 22 511 [email protected]
Chile
Ricardo BriggsPartner - Consulting+56 2 2729 [email protected]
Pablo HerreraPartner - Financial Advisory Services+56 2 2729 [email protected]
Alberto KulenkampffPartner - Audit+ 56 22729 7368 [email protected]
China (Southern)
Sharon LamPartner - International Tax Services +852 28 52 65 36 [email protected]
Anthony LauPartner - International Tax Services+852 2852 [email protected]
China (Easter and Northern)
Natalie Na YuPartner - Tax Services +86 10 [email protected]
Lily Fang WangPartner - Audit+86 [email protected]
Colombia
Ricardo RubioPartner - Financial Advisory Services+57 1 546 [email protected]
Cyprus
Panikos TeklosDirector - Consulting+ 357 994 917 [email protected]
Denmark
John LadekarlPartner - Audit+45 36 10 20 [email protected]
Anders Oldau GjelstrupPartner - Audit+45 20 41 68 02 [email protected]
Finland
Ilkka HuikkoPartner - Consulting +358 40 740 [email protected]
Sami Toivoniemi Director - Regulatory Risk+358 207 555 [email protected]
Juha HyttinenSenior Manager - Strategy and Operations+358 207 555 [email protected]

65
Performance magazine issue 31
France
Hélène AlstonPartner - Tax +33 1 55 61 60 32 [email protected]
Yoan ChazalPartner - Risk Advisory+33 1 40 88 72 [email protected]
Stéphane CollasPartner - Audit+33 1 55 61 61 [email protected]
Jean-Marc LecatPartner - Audit+33 1 55 61 66 [email protected]
Germany
Andreas KochPartner - Audit+49 892 903 687 [email protected]
Marcus RothPartner - Tax+49 892 903 682 [email protected]
Dorothea Schmidt Partner - Consulting+49 699 713 734 [email protected]
Nina SchraderDirector - Consulting+49 173 258 5554 [email protected]
Christof Stadter Partner - Audit+49 89 29036 [email protected]
Alexander WenzelPartner - Tax & Legal+49 69 75695 6111 [email protected]
Gibraltar
Joseph CaruanaPartner - Audit+350 200 112 [email protected]
Greece
Alexandra KostaraPartner - Audit +30 210 67 81 152 [email protected]
Despina XenakiPartner - Audit +30 210 67 81 [email protected]
Hong Kong
Anthony Ming YoungPartner - International Tax Services+852 285 210 [email protected]
Guernsey
John ClacyPartner - Audit+44 1 481 703 [email protected]
Iceland
Gunnar ThorvardarsonPartner - Audit +354 580 3031 [email protected]
India
Rajesh GandhiPartner - Tax Leader+91 22 6185 [email protected]
Bimal ModiPartner - IM Leader+91 22 6185 [email protected]
Indonesia
Rosita SinagaPartner - Audit+62 21 2992 [email protected]
Ireland
David Dalton Partner - Consulting+353 140 748 [email protected]
Brian ForresterPartner - Audit+353 141 726 14 [email protected]
Mike HartwellPartner - Audit+353 141 723 [email protected]
Brian Jackson Partner - Audit+ 353 141 729 [email protected]
Christian MacManus Partner - Audit+353 141 785 [email protected]
Deirdre PowerPartner - Tax+353 141 724 [email protected]
Israel
Ran Feldboy Partner - Audit +972 3 6085478 [email protected]
Italy
Marco De PontiPartner - Audit+390 283 322 [email protected]
Maurizio FerreroPartner - Audit +390 283 322 [email protected]
Paolo Gibello-RibattoPartner - Audit+390 283 322 [email protected]
Marco MiccoliPartner - Audit +390 283 322 308 [email protected]
Riccardo MottaPartner - Audit+390 283 322 [email protected]

66
Performance magazine issue 31
Malta
Michael BianchiPartner - Audit+356 2343 [email protected]
Mexico
Ernesto PinedaPartner - Financial Services+52 55 5080 [email protected]
Netherlands
Bas Castelijn Partner - Tax+38 288 [email protected]
Martin EleveldPartner - Enterprise Risk Services+31 62 324 5159 [email protected]
Remy Maarschalk Partner - Audit+31 88 288 [email protected]
Evert van der SteenPartner - Enterprise Risk Services +31 62 078 [email protected]
Jan-Wouter Bloos Partner - Consulting +31 88 288 [email protected]
Jubin Majlessi Partner - Consulting+31 63 882 [email protected]
Norway
Sverre DanielsenPartner - Enterprise Risk Services+47 99 517 [email protected]
Henrik WoxholtPartner - Audit & Advisory+47 23 27 90 00 [email protected]
Philippines
Bonifacio LumacangPartner - Audit+63 2 581 [email protected]
Portugal
Maria Augusta FranciscoPartner - Audit+351 21 042 [email protected]
Singapore
Ei Leen GiamPartner - Global Financial Services Industry+ 65 62 163 [email protected]
Ho Kok YongPartner - Global Financial Services Industry+65 621 632 [email protected]
Michael Velten Partner – Tax +65 6531 5039 [email protected]
Slovakia
Peter LongauerPartner - Audit+421 2 582 49 [email protected]
Spain
Rodrigo Diaz Partner - Audit +349 144 320 21 [email protected]
Francisco Rámirez Arbues Partner - Regulatory +34 606289571 [email protected]
Antonio Rios CidPartner - Audit +349 915 141 492 [email protected]
Alberto Torija Partner - Audit +349 143 814 91 [email protected]
José María Grande EsturoPartner - M&A Consulting+34 944 447 [email protected]
Ignacio García AlonsoPartner - Tax +34 67 952 [email protected]
Sweden
Steven Payne Partner - Consulting+46 75 246 33 [email protected]
Kazakhstan
Roman SattarovDirector - Audit+7 7272 [email protected]
Korea
Kyoung Il YoonPartner - Audit +82 2 6676 1149 [email protected]
Luxembourg
Eric CentiPartner - Cross-Border Tax+352 451 452 [email protected]
Benjamin CollettePartner - Advisory & Consulting+352 451 452 [email protected]
Laurent Fedrigo Partner - Audit +352 451 452 [email protected]
Nicolas Hennebert Partner - Audit +352 451 454 [email protected]
Lou KieschPartner - Regulatory Consulting +352 451 452 [email protected]
Benjamin Lam Partner - Audit+352 451 452 [email protected]
Malaysia
Anthony TaiExecutive Director - Enterprise Risk Services+60 3 7610 [email protected]
Japan
Yang Ho KimPartner - Tax+81 3 621 338 [email protected]
Nobuyuki YamadaPartner - Audit+81 90 650 345 [email protected]

67
Performance magazine issue 31
Switzerland
Marcel Meyer Partner - Audit+41 58 279 [email protected]
Simona Terranova Partner - Audit +41 58 279 8454 [email protected]
Andreas Timpert Partner - Consulting +41 58 279 6858 [email protected]
André KuhnDirector - Tax+41 58 279 [email protected]
Markus Weber Partner - Tax +41 58 279 7527 [email protected]
Taiwan
Vincent Hsu Partner - Audit +886 2 545 9988 1436 [email protected]
Olivia KuoPartner - Audit +886 2 [email protected]
Jimmy S. WuPartner - Audit+886 2 2545 9988 [email protected]
Thailand
Somkrit KrishnamraPartner - Risk Advisory+66 2 676 [email protected]
Turkey
Hasan KiliçPartner - Audit+90 212 366 60 [email protected]
United Kingdom
Allee BonnardPartner - Audit+44 20 7303 [email protected]
Gavin J BullockPartner - Tax+44 20 7007 [email protected]
Andrew McNeillPartner - Consulting+44 20 7007 6151 [email protected]
Jamie PartridgePartner - Audit+44 14 1314 5956 [email protected]
Mark WardPartner - Risk Advisory+44 20 7007 [email protected]
United States
Patrick Henry Partner - Vice Chairman +1 212 436 [email protected]
Kristina DavisPartner - Advisory +1 617 437 2648 [email protected]
Ted Dougherty Partner - Tax+1 212 436 [email protected]
Paul KraftPartner - Audit+1 617 437 [email protected]
Liliana RobuPartner - Consulting+1 646 673 [email protected]
Venezuela
Fatima De AndradePartner - Audit+58 212 206 8548 [email protected]
Vietnam
Thinh PhamManaging Partner+84 [email protected]

Please do not hesitate to contact your relevant country experts listed in the magazine.
Contacts
Cary Stier Partner - Global Investment Management Leader +1 212 436 7371 [email protected]
Vincent Gouverneur Partner - EMEA Investment Management Co-Leader +352 451 452 451 [email protected]
Tony GaughanPartner - EMEA Investment Management Co-Leader+44 20 7303 [email protected]
Jennifer Qin Partner - Asia Pacific Investment Management Leader +86 21 61 411 998 [email protected]
Deloitte refers to one or more of Deloitte Touche Tohmatsu Limited (“DTTL”), its global network of member firms, and their related entities. DTTL (also referred to as “Deloitte Global”) and each of its member firms are legally separate and independent entities. DTTL does not provide services to clients. Please see www.deloitte.com/about to learn more.
Deloitte is a leading global provider of audit and assurance, consulting, financial advisory, risk advisory, tax and related services. Our network of member firms in more than 150 countries and territories serves four out of five Fortune Global 500® companies. Learn how Deloitte’s approximately 286,000 people make an impact that matters at www.deloitte.com.
This communication contains general information only, and none of Deloitte Touche Tohmatsu Limited, its member firms or their related entities (collectively, the “Deloitte network”) is, by means of this communication, rendering professional advice or services. Before making any decision or taking any action that may affect your finances or your business, you should consult a qualified professional adviser. No entity in the Deloitte network shall be responsible for any loss whatsoever sustained by any person who relies on this communication.
© 2020. Deloitte Tax & Consulting. Designed and produced by MarCom at Deloitte Luxembourg.