deloitte media consumer survey 2014 - australian media and digital preferences - 3rd edition
DESCRIPTION
This third edition of Deloitte’s Media Consumer Survey, previously known as the State of the Media Democracy report, is a snapshot of how Australians are consuming different media and entertainment. In it we consider: * How we like to be entertained * Our preferred technologies and devices * How we use social networks and their influence * What and who we respond to * Where advertising fits. For more information visit: http://www.deloitte.com/au/mediaconsumerTRANSCRIPT
Australian media and digital preferences – 3rd edition
Media Consumer Survey 2014

Contents
1 Foreword
2 About this survey3 Entertainment
Digital tipping pointsMore, but on my termsAll about conveniencePaying for morePremium choices not infinite choices
4 Devices
Dosing up on tabletsWe’re still watching the box...and at the same time, we’re...Get(ting) smart(er)App-solute market growth for games
5 Internet, social media and advertisingTelling it like it isInternet speedstersExpress yourselfNo deck chair shuffle for advertising
6 e-books, magazines and news
Stocking up our e-bookshelvesMagazine readers still prefer print… but for how much longer?Old news – the digital age is here
7 References8 Contacts
3 Foreword About this survey Entertainment Internet, social media and advertising e-books, magazines and news References ContactsDevices
This third edition of Deloitte’s Media Consumer Survey is a snapshot of how Australians are consuming different media and entertainment.
In it we consider: • How we like to be entertained• Our preferred technologies and devices • How we use social networks and their influence• What and who we respond to • Where advertising fits.
Our overarching finding is that a number of the much anticipated digital tipping points have arrived.
EntertainmentThe Internet – using the Internet is likely to eclipse watching TV as the preferred source of entertainment in the coming year.
While TV is still number one, with 64% of survey respondents ranking it in their top three entertainment preferences, using the Internet for social or personal reasons is a close second to TV (63%), and has climbed the ranks for the past three years (10% year on year growth). If this rate of growth is maintained, the Internet will overtake TV as the preferred source of entertainment this year.
When we lock on a hit TV show, we binge – some 72% of survey participants watch back-to-back episodes (three or more) in one sitting – and more than a quarter of us (26%) are doing this once a week.
We’re engaged and invested in these shows, but want to watch them on our terms. These shows don’t need to be on the TV for us to binge and non-broadcasters are just as likely to be developing binge-worthy content.
Preferences for movie and TV show rental are increasingly digital – 24% of respondents will stream the content and 21% will make a digital rental, compared with 25% who will rent the physical product.
When it comes to TV, we want choice – but it’s premium choice, not infinite choice we want. For example, consumers are regularly watching an average of only nine pay TV channels. Of those respondents that have pay TV, 39% subscribe to a premium package on top of the basic package to access the content they really want.
DevicesWe have gone tablet mad, across all age groups – more than half (53%) of Australian survey respondents are now ‘digital omnivores’ – owners of a tablet, laptop and smartphone. This has increased significantly from 28% last year, largely driven by increased tablet ownership which now stands at 63% amongst survey respondents, with the most marked growth coming from older age groups – the Boomers and Matures. This could be due to changes in the tablet market – price points are varied and affordable, and multiple formats are now available.
TV connectivity – more Australians connect their TV sets to the Internet to receive media and content such as webpages, streamed movies or music, accounting for 42% of all survey participants, up from 37% last year. Conversely, some 47% of those who don’t presently connect their TVs to the Internet are not interested in doing so in the next year, with 40% only somewhat interested. But we think this is likely to change as the content offers continue to improve.
We multi-task like it’s going out of fashion – a significant 79% of survey respondents multi-task while watching TV – and not much of it is related to the program. Only 21% of multi-tasking activities directly relate to the program being watched. In terms of our device preferences, we most commonly use smartphones to multi-task while watching TV (49%).
Smartphone ownership is at 81% – smartphone ownership among survey participants has increased by 21% over the last three years. 57% of those who own a smartphone consider it their go-to device.
Foreword
Deloitte’s survey reveals attitudes and behaviours, reporting on how they have changed over the past three years and considers the future.
4 Foreword About this survey Entertainment Internet, social media and advertising e-books, magazines and news References ContactsDevices
Apps are key to utility and perceived value – among survey participants who use apps, social networking apps are the most frequently used (55%), with weather apps in second place (46%), followed closely by games, banking, navigation and browsers.
Internet, social media and advertisingWe want faster Internet and are willing to pay for it – only 29% of Australian survey respondents are satisfied with their Internet speed – the rest want faster Internet connections. And a few of us would pay a lot more – 9% of those surveyed would be willing to pay $20+ more a month.
Australians express themselves on social media daily – more than half of those surveyed (54%) update or check social media daily (checking anywhere from one to 20+ times a day) – up 170% since last year, when 20% of survey participants updated social media daily or almost daily.
Who influences whom? Online reviews or recommendations from someone within your social media circle are as influential on buying decisions as television advertising. An online review from a stranger or mentioning a product in a television show, are just as influential as newspaper and magazine advertising.
e-books, newspapers and magazinese-books are on the rise – almost a third of survey respondents (32%) purchase e-books and 66% of survey respondents who purchase e-books are reading more digital books than printed books. And we are buying more digital books than we can read! (51% of survey respondents who buy e-books are doing so).
News is online and we won’t pay for it – when asked about their willingness to pay, 92% of Australian survey respondents would not pay for news online, as they believe there is enough information available for free. Traditional news formats continue to decline with 32% of Australian survey respondents now indicating that keeping
up to date with breaking news was one of their top three reasons for using social media.
But we love our printed mags – the printed magazine is still holding its own and remains the preferred way to read magazine content (49% of all survey respondents). Nearly half (49%) of magazine subscribers indicated that if the price of their favourite magazine was the same for various options of physical or digital copies, they would prefer to receive the physical copy only, rather than both.
The information and insights in this report are important for telecommunications, media and technology businesses – but not exclusively so. The challenges of anticipating and responding to digital consumers’ changing behaviours to connect with customers across platforms and devices are common across many industries.
We hope you find this report interesting and useful as you determine your responses to these changes.
Until next year...
Niki AlcornPartner – Consulting
Clare HardingPartner – Consulting
Stuart JohnstonPartner – TMT Leader

5 Foreword About this survey Entertainment Internet, social media and advertising e-books, magazines and news References ContactsDevices
About Deloitte Touche Tohmatsu Limited’s Australian media usage and preferences surveyFocusing on four generations and five distinct age groups, the survey provides a snapshot of how consumers are interacting with media, entertainment and technologies and considers their preferences in the future.
The report uses self-reported survey data and was undertaken by an independent research organisation between March and April 2014. The online survey was delivered in eight countries, with more than 2300 consumers surveyed in Australia. The other participating international markets were the US, China, Germany, Italy, Japan, Norway and Spain.
Identical questions were asked across all geographies and age groups (Figure 1), with some regionalisation to ensure local relevance. All data is weighted back to the most recent census data in each country.
Where provided, growth rates reflect compound annual growth rates (CAGRs) over the three years since the first Australian survey was reported in 2012, then called the ‘State of the Media Democracy Survey’.
Deloitte’s Telecommunications, Media and Technology experts who work with leading Australian companies daily, added their insights and analysis to the report.
Figure 1. Survey participant age groups
Trailing MillenialsAge: 14–24
Lending MillenialsAge: 25–30
XersAge: 31–47
BoomersAge: 48–66
MaturesAge: 67+
About this survey
This is the third consecutive year of undertaking this research in Australia, and where possible, comparisons have been included to show how things have shif ted over time.

6 Foreword About this survey Entertainment Internet, social media and advertising e-books, magazines and news References ContactsDevices
72% of survey participants binge on back-to-back episodes (more than three)
of a TV series
72%
3+
7 Foreword About this survey Entertainment Internet, social media and advertising e-books, magazines and news References ContactsDevices
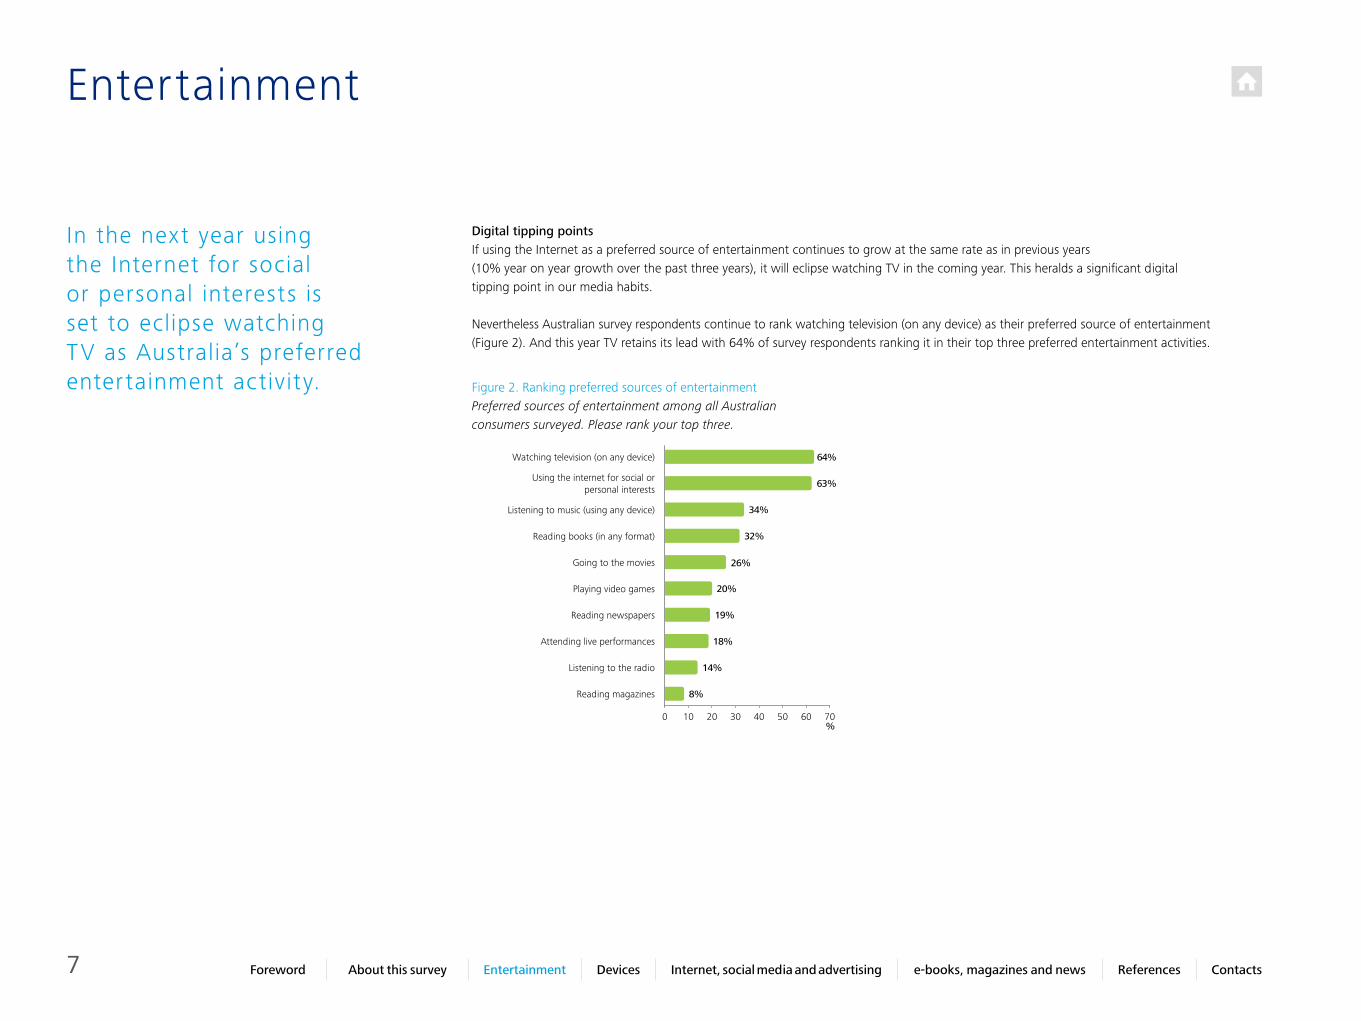
Digital tipping points If using the Internet as a preferred source of entertainment continues to grow at the same rate as in previous years (10% year on year growth over the past three years), it will eclipse watching TV in the coming year. This heralds a significant digital tipping point in our media habits.
Nevertheless Australian survey respondents continue to rank watching television (on any device) as their preferred source of entertainment (Figure 2). And this year TV retains its lead with 64% of survey respondents ranking it in their top three preferred entertainment activities.
Entertainment
In the next year using the Internet for social or personal interests is set to eclipse watching TV as Australia’s preferred entertainment activity. Figure 2. Ranking preferred sources of entertainment
Preferred sources of entertainment among all Australian consumers surveyed. Please rank your top three.
Watching television (on any device)
Reading magazines
Listening to music (using any device)
Attending live performances
Using the internet for social or personal interests
Reading newspapers
Playing video games
Listening to the radio
Going to the movies
Reading books (in any format)
64%
8%
34%
18%
63%
19%
20%
14%
26%
32%
60402010 30 50 700%
8 Foreword About this survey Entertainment Internet, social media and advertising e-books, magazines and news References ContactsDevices
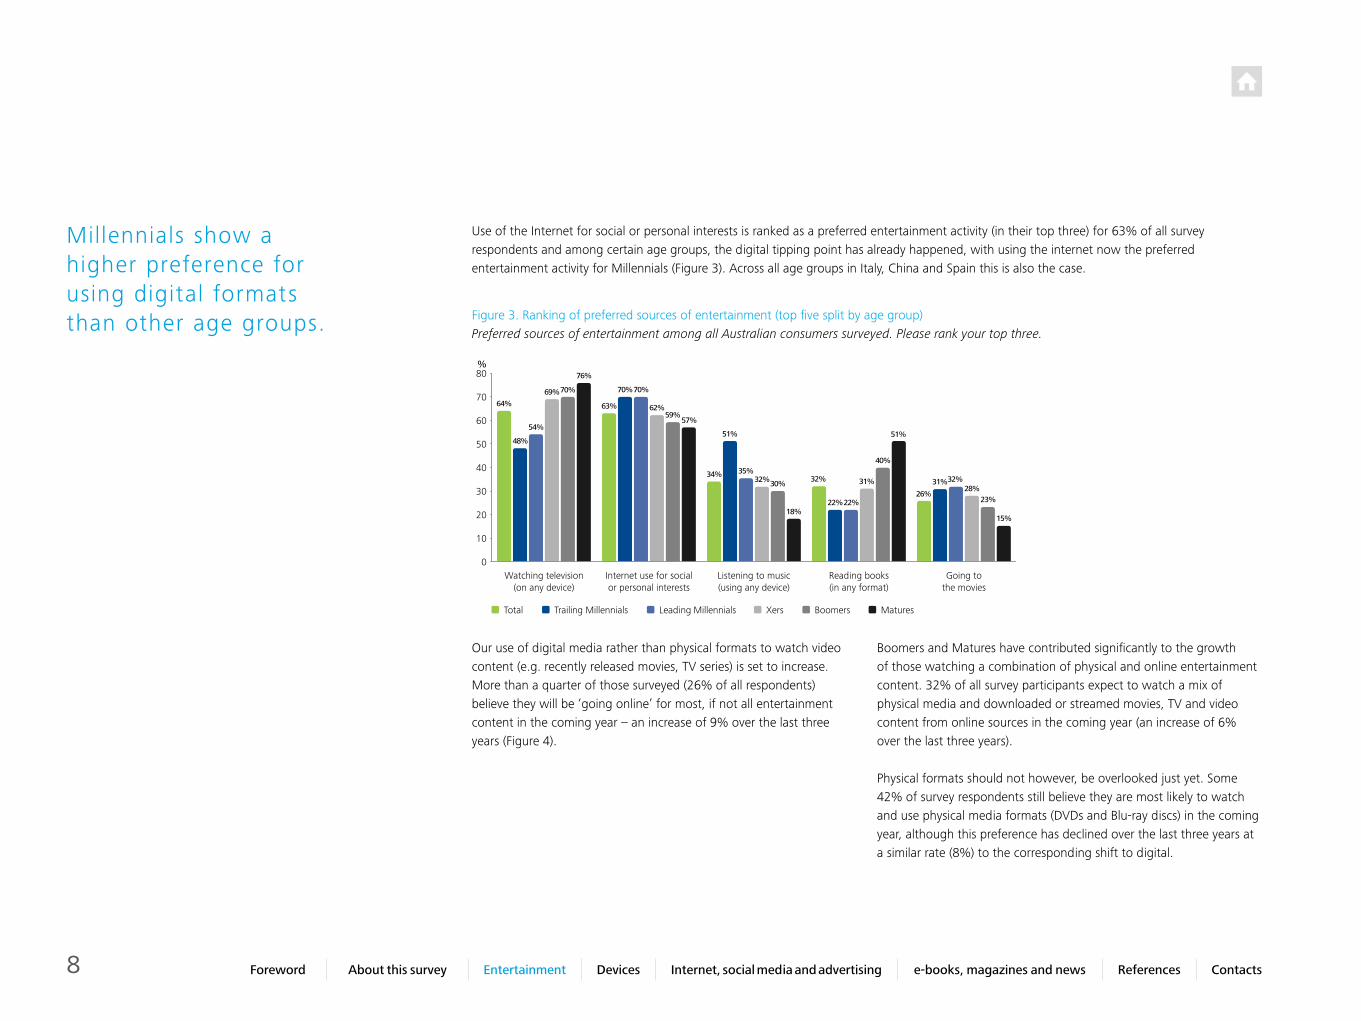
Use of the Internet for social or personal interests is ranked as a preferred entertainment activity (in their top three) for 63% of all survey respondents and among certain age groups, the digital tipping point has already happened, with using the internet now the preferred entertainment activity for Millennials (Figure 3). Across all age groups in Italy, China and Spain this is also the case.
Our use of digital media rather than physical formats to watch video content (e.g. recently released movies, TV series) is set to increase. More than a quarter of those surveyed (26% of all respondents) believe they will be ‘going online’ for most, if not all entertainment content in the coming year – an increase of 9% over the last three years (Figure 4).
Boomers and Matures have contributed significantly to the growth of those watching a combination of physical and online entertainment content. 32% of all survey participants expect to watch a mix of physical media and downloaded or streamed movies, TV and video content from online sources in the coming year (an increase of 6% over the last three years).
Physical formats should not however, be overlooked just yet. Some 42% of survey respondents still believe they are most likely to watch and use physical media formats (DVDs and Blu-ray discs) in the coming year, although this preference has declined over the last three years at a similar rate (8%) to the corresponding shift to digital.
Millennials show a higher preference for using digital formats than other age groups. Figure 3. Ranking of preferred sources of entertainment (top five split by age group)
Preferred sources of entertainment among all Australian consumers surveyed. Please rank your top three.
Internet use for social or personal interests
Watching television (on any device)
Listening to music (using any device)
Reading books (in any format)
Going to the movies
80
60
40
20
10
30
50
70
0
%
Total Trailing Millennials Leading Millennials Xers Boomers Matures
64%
48%
54%
69%70%
76%
70%70%
62%59%
57%
51%
35%32%30%
18%22%22%
31%
40%
51%
31%32%28%
23%
15%
63%
34%32%
26%

9 Foreword About this survey Entertainment Internet, social media and advertising e-books, magazines and news References ContactsDevices
Figure 4. Physical vs. digital media consumption by age group (recently released and rental movies, packaged seasons of television series and other such video)Thinking about how you will watch entertainment content in the next 12 months, which of the following best describes what you will most likely do?
80
40
20
60
0
%
33% 31%32%30%31% 31%25%
11%
27%33%
21%23%
35%32%39%
80
40
20
60
0
%
41%47%47%
43%34%
54%
27%
73%65%
59%67%64%
35%41%
26%
Trailing Millennials
XersLeading Millennials
Boomers Matures
40
20
60
0
%
27% 26%22%
12%20%
14%8%
17%8%
27%
15%
30%35%36%
47%
80
26%
32%
42%
I will most likely watch most if not all of this content from online digital
sources (via download or streamed over
the Internet.
I will watch a mix of both physical media and downloaded or streamed movies,
television, and video content from online
digital sources.
I will most likely watch and use physical media (e.g. DVDs and Blu-ray discs) nearly all or all
of the time.
In 2014...
2012 2013 2014
10 Foreword About this survey Entertainment Internet, social media and advertising e-books, magazines and news References ContactsDevices
More, but on my termsAustralians are spending more than a day a week watching TV and video content. On average, all survey participants spend almost four hours a day (3.8 hours) watching all types of video content, on all devices – equivalent to more than 26 hours a week. Millennials spend the most time watching video content, clocking up an average of 4.1 hours a day for Trailing Millennials (more than 28 hours a week) and 4.7 hours a day for Leading Millennials (almost 33 hours a week).
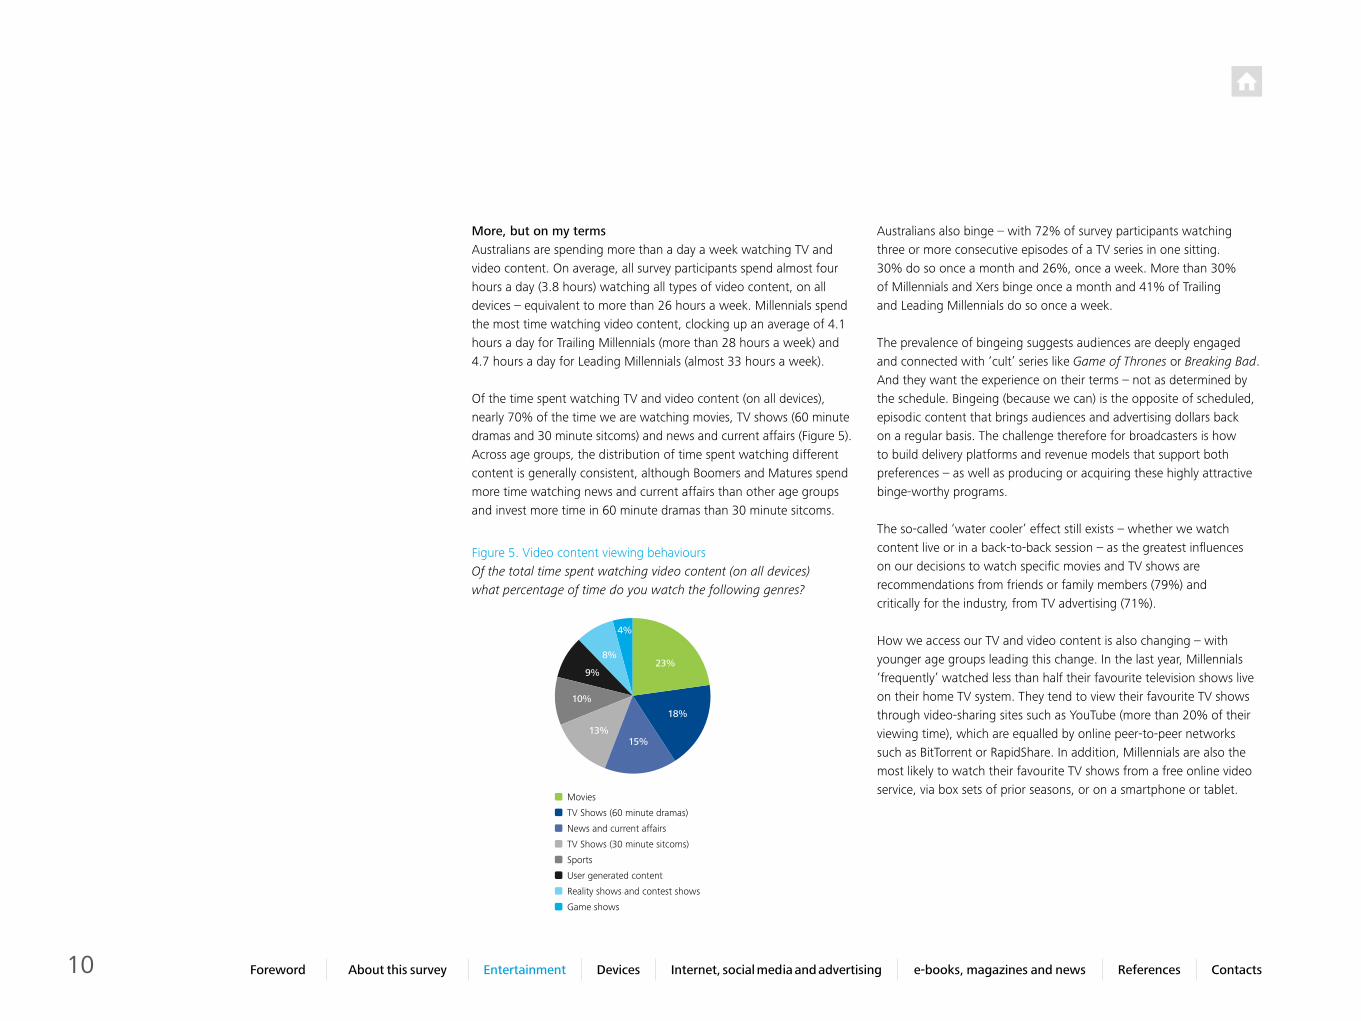
Of the time spent watching TV and video content (on all devices), nearly 70% of the time we are watching movies, TV shows (60 minute dramas and 30 minute sitcoms) and news and current affairs (Figure 5). Across age groups, the distribution of time spent watching different content is generally consistent, although Boomers and Matures spend more time watching news and current affairs than other age groups and invest more time in 60 minute dramas than 30 minute sitcoms.
Australians also binge – with 72% of survey participants watching three or more consecutive episodes of a TV series in one sitting. 30% do so once a month and 26%, once a week. More than 30% of Millennials and Xers binge once a month and 41% of Trailing and Leading Millennials do so once a week.
The prevalence of bingeing suggests audiences are deeply engaged and connected with ‘cult’ series like Game of Thrones or Breaking Bad. And they want the experience on their terms – not as determined by the schedule. Bingeing (because we can) is the opposite of scheduled, episodic content that brings audiences and advertising dollars back on a regular basis. The challenge therefore for broadcasters is how to build delivery platforms and revenue models that support both preferences – as well as producing or acquiring these highly attractive binge-worthy programs.
The so-called ‘water cooler’ effect still exists – whether we watch content live or in a back-to-back session – as the greatest influences on our decisions to watch specific movies and TV shows are recommendations from friends or family members (79%) and critically for the industry, from TV advertising (71%).
How we access our TV and video content is also changing – with younger age groups leading this change. In the last year, Millennials ‘frequently’ watched less than half their favourite television shows live on their home TV system. They tend to view their favourite TV shows through video-sharing sites such as YouTube (more than 20% of their viewing time), which are equalled by online peer-to-peer networks such as BitTorrent or RapidShare. In addition, Millennials are also the most likely to watch their favourite TV shows from a free online video service, via box sets of prior seasons, or on a smartphone or tablet.
Figure 5. Video content viewing behavioursOf the total time spent watching video content (on all devices) what percentage of time do you watch the following genres?
Movies
TV Shows (60 minute dramas)
News and current affairs
TV Shows (30 minute sitcoms)
Sports
Reality shows and contest shows
User generated content
Game shows
23%
18%
15%13%
10%
9%
8%
4%
11 Foreword About this survey Entertainment Internet, social media and advertising e-books, magazines and news References ContactsDevices
In the coming year Australians expect to purchase digital video entertainment online almost as frequently as they purchase DVD/Blu-ray discs at a physical retail store. The choice will be driven by whichever is the most convenient at the time.
All about convenience Australian survey respondents rent movie and TV shows using whichever method is most convenient. There is an emerging preference for digital formats – over the next 12 months, 24% of all survey respondents intend to subscribe to an online streaming service and 21% intend to rent a digital copy, compared with 25% who intend to rent physical copies in-store.
Personal ownership of physical or digital video content is seen as most convenient for repeat viewing. All age groups indicate they buy a physical or digital copy to view content at their leisure (41%), to maintain a personal library (34%), or to give as a gift (32%).
Convenience is also important when it comes to watching our favourite television shows. Live shows on a home television system (65%) are the most common way we view, but are followed by delayed watching through DVRs on home television systems (21%) and catch-up services including free online video services and a show’s Internet site (18%).
12 Foreword About this survey Entertainment Internet, social media and advertising e-books, magazines and news References ContactsDevices
Paying for more Some 38% of survey participants have pay TV subscriptions (traditional cable TV and other paid TV services), up from 34% last year. Of these, the majority have no plans to cancel or change their service within the next 12 months (28% up from 27% last year). There is an increase in those with pay TV looking to change provider, rather than cancel their subscription (6% up from 3% last year).
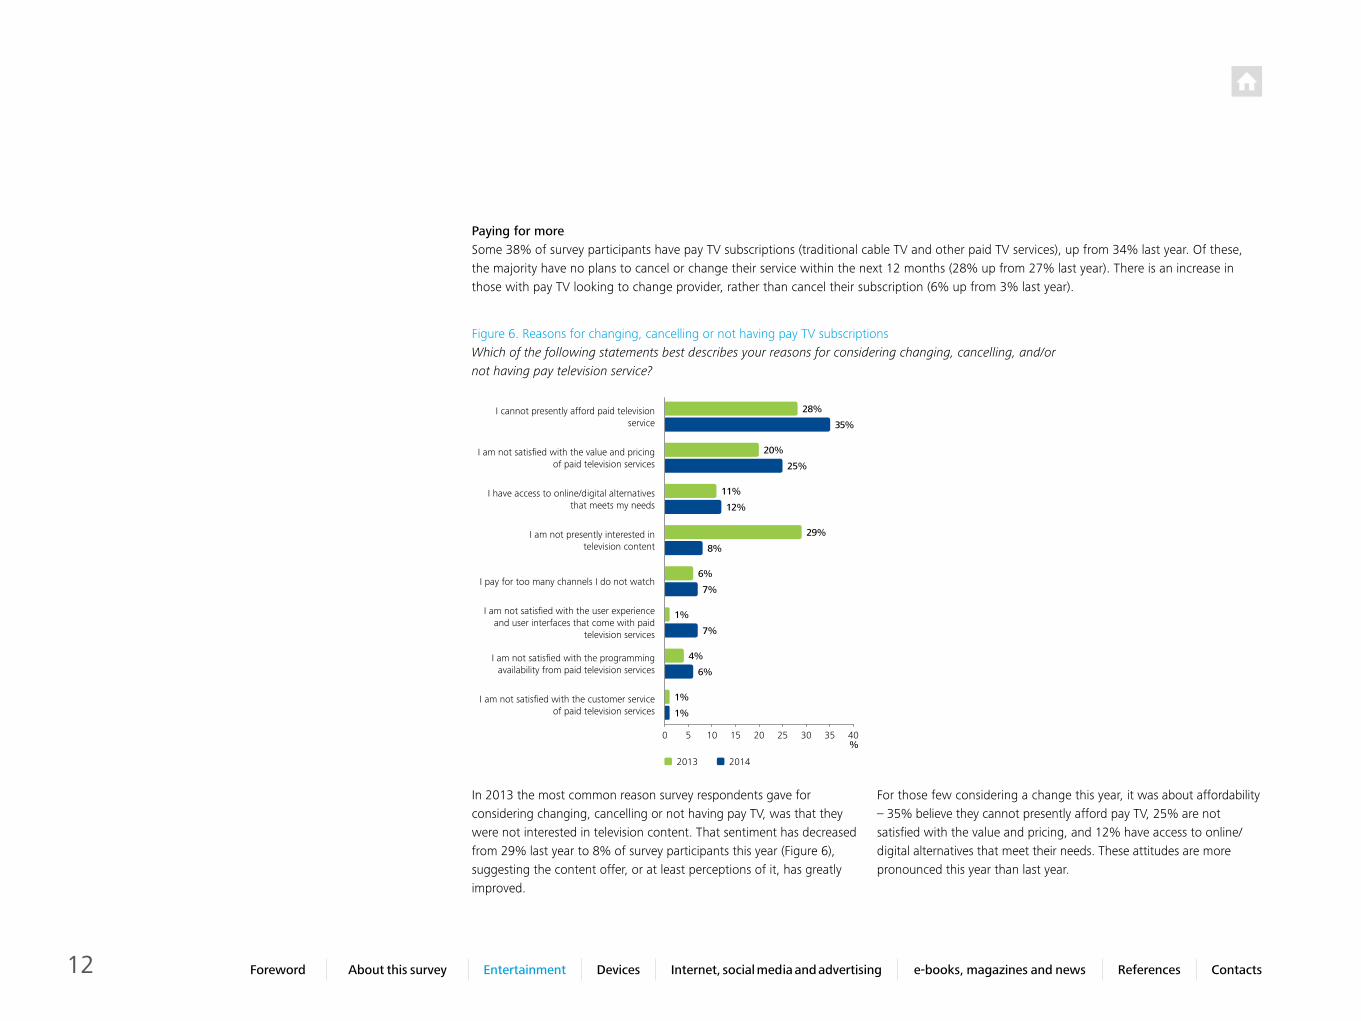
Figure 6. Reasons for changing, cancelling or not having pay TV subscriptionsWhich of the following statements best describes your reasons for considering changing, cancelling, and/or not having pay television service?
28%
20%
11%
12%
8%
6%
6%
7%
1%
1%
1%
7%
4%
29%
35%
25%
I cannot presently afford paid television service
I am not satisfied with the value and pricing of paid television services
I have access to online/digital alternatives that meets my needs
I pay for too many channels I do not watch
I am not satisfied with the user experience and user interfaces that come with paid
television services
I am not satisfied with the programming availability from paid television services
I am not satisfied with the customer service of paid television services
I am not presently interested in television content
2013 2014
403020105 15 25 350%
In 2013 the most common reason survey respondents gave for considering changing, cancelling or not having pay TV, was that they were not interested in television content. That sentiment has decreased from 29% last year to 8% of survey participants this year (Figure 6), suggesting the content offer, or at least perceptions of it, has greatly improved.
For those few considering a change this year, it was about affordability – 35% believe they cannot presently afford pay TV, 25% are not satisfied with the value and pricing, and 12% have access to online/digital alternatives that meet their needs. These attitudes are more pronounced this year than last year.
13 Foreword About this survey Entertainment Internet, social media and advertising e-books, magazines and news References ContactsDevices
To date however, there is no evidence of an increase in ‘cord cutting’. Cancellations of paid services remain at just 4% over the last two years. In fact, rather than reducing our pay TV subscriptions, our evidence suggests we are doubling up on them. Of the 9% of survey participants who subscribe to a streaming video service, 82% did so because the audio/visual quality of their content was on par with that of their pay TV service.
Over the coming years, the number of households with multiple subscriptions should continue to rise, as more content owners and aggregators, including platform owners such as cable and satellite providers, make their content portfolios available via subscription video-on-demand delivered ‘over-the-top’ using broadband connections1.
Premium choices not infinite choices Consumers are regularly watching nine pay TV channels on average. Of those respondents that have pay TV, 39% subscribe to a premium package on top of their basic package, to get the content they really want. Additionally, nearly half (49%) of survey respondents who have pay TV would prefer to subscribe only to channels they watch regularly – a ‘my favourites’ subscription. This trend is higher among Trailing Millennials, Matures and Boomers. Our survey data suggests Leading Millennials and Xers would prefer an ‘all you can eat’ package of channels even if they don’t regularly watch them all.
Pay TV providers appear to be pursuing a dual strategy in response to emerging consumer preferences. On the one hand, there has been greater choice and innovation in offerings, with more channels, smaller pay as you go and á la carte options, and companion device or second screen experiences.
On the other hand, there have been intense rights negotiations to control the distribution of premium content on paid channels before making it available for online rental – and so provide premium options to subscribers.
By the end of 2014 up to 50 million homes globally will have two or more separate pay TV subscriptions. Most of these 50 million households will have just two pay TV providers, typically one platform-based (satellite, cable or IPTV) service, and a Streamed Video On Demand (SVOD) service. In addition about five million homes may have three or more providers1.
There are further opportunities for pay TV providers through consumers’ use of multiple sources of paid content.

14 Foreword About this survey Entertainment Internet, social media and advertising e-books, magazines and news References ContactsDevices
We most commonly use smartphones to multi-task while watching TV
49%

1515 Foreword About this survey Entertainment Internet, social media and advertising e-books, magazines and news References ContactsDevices
Dosing up on tablets More than half (53%) of Australian survey respondents over the age of 14 are ‘digital omnivores’, that is they own a tablet, laptop and a smartphone. This ‘dosing up on devices’ has almost doubled since last year – up significantly from 28% – largely driven by increased tablet ownership. 63% of survey respondents now own a tablet. Although tablet ownership has grown across all age groups over the past three years, 67 year olds and over (the Matures) have shown the greatest increase in appetite for tablets (Figure 7). In fact Matures are the only age group to have higher ownership of tablets than smartphones.
In Australia there is a higher proportion of ‘digital omnivores’ than in the US (37%) and Japan (17%), though we lag China (63%) and are just behind Norway (57%).
Devices
Figure 7. Tablet ownership by age groupWhich of the following media or home entertainment equipment does your household own – tablets?
Total
Trailing Millennials
Boomers
Leading Millennials
Matures
Xers
63%
68%
70%
54%
69%
49%
75% CAGR
70% CAGR
62% CAGR
75% CAGR
91% CAGR
69% CAGR
30 60 7020 5010 405 3515 4525 55 650%
Compared with other surveyed countries, Australia at 63% has some of the highest tablet ownership rates, again just behind China’s 68%, and equal to Norway (63%).
But we still want more. Some 16% of survey respondents who do not currently own a tablet are interested in purchasing one in the near future. And over a third (36%) of those who already own a tablet intend to spend more time using their device during the year.
In Australia, and in other surveyed markets, we primarily use our tablets to browse the Internet (57%), followed by social networking (29%) and watching TV shows (24%). China is the exception, where tablets are primarily used to watch movies and TV shows.

1616 Foreword About this survey Entertainment Internet, social media and advertising e-books, magazines and news References ContactsDevices
Figure 8. Movie watching behaviours of tablet vs. non-tablet ownersWhat methods have you used to view a movie, available for purchase or rental, in the past 12 months?
65%
40%
28%
17%
26%
19%
62%
25%
Home television system
Streamed or downloaded
Home computer
I have not viewed a movie, available for purchase or rental, in the past 12 months
Tablet owners Non-tablet owners
60402010 30 50 700%
In Australia we use tablets differently across age groups. Boomers and Matures tend to use their tablets for communications, reading the news and e-books, as well as for online banking and taking photos. Conversely Millennials and Xers are more likely to use their tablets to watch TV shows and listen to music.
Tablets continue to be used primarily for content consumption rather than content production or creation. Tablet owners in Australia are almost twice as likely as non-tablet owners to stream movies, and are more likely to have watched a movie in the past 12 months than non-tablet owners (Figure 8). Content ‘creation’ activities on a tablet – such as taking photos, viewing or editing documents and making videos – are only ranked in the top three uses by 8% of respondents or less.
In the coming year the tablet market is likely to comprise an increasingly diverse range of devices in terms of size, weight, processor speed, memory capacity and price. Size matters in Australia, with twice as many Australians owning 9+ inch models than the more recently introduced 7–9 inch models.
The increasing array of tablet features and price points may also encourage Australians to own more than one tablet. Currently the average Australian household owns 1.62 tablets. In developed markets, an average 20% of consumers own both a large and a compact tablet1. In some cases, they use one device for work and the other for personal use. In other cases, one device is shared in the family and the other is for individual use.
We’re still watching the boxTelevision sets still feature heavily in Australian living rooms. The average Australian household owns 2.3 TVs’ with flat panel TVs owned by 85% of those surveyed. When it comes to consumer preferences, the TV set is one of the top three most valued devices for more than half the survey participants who own one (52%).
It also remains the preferred device for watching movies, sports and TV shows across all age groups. However, when it comes to watching user generated content, the TV set loses out to laptops and desktops.
5% more Australians this year than last are connecting their TV sets to the Internet in order to receive media and content, such as webpages, streamed movies or streamed music. Some 42% of all survey participants, primarily Millennials and Xers, are connecting their sets, with 41% preferring a direct connection to the Internet, either wirelessly or through a wired connection (up from 34% in 2013).
1717 Foreword About this survey Entertainment Internet, social media and advertising e-books, magazines and news References ContactsDevices
We believe that immediate further growth in connected TVs is unlikely given 47% of those not presently connecting their TV are not interested in connecting next year and 40% are only somewhat interested. Compared to other markets, Australia’s active use of connected TVs lags behind China (83% of those surveyed), the US (58%) and Italy (51%), perhaps due to the limited content offered locally. However, this is likely to change in the Australian market in coming years as streaming services become more readily available.
...and at the same time we’re...Although we spend a lot of time watching TV, multi-tasking is becoming more habitual with 79% of survey respondents multi-tasking. On average, multi-taskers are engaged in three additional activities while watching TV, in line with consumers in the US, China and Italy.
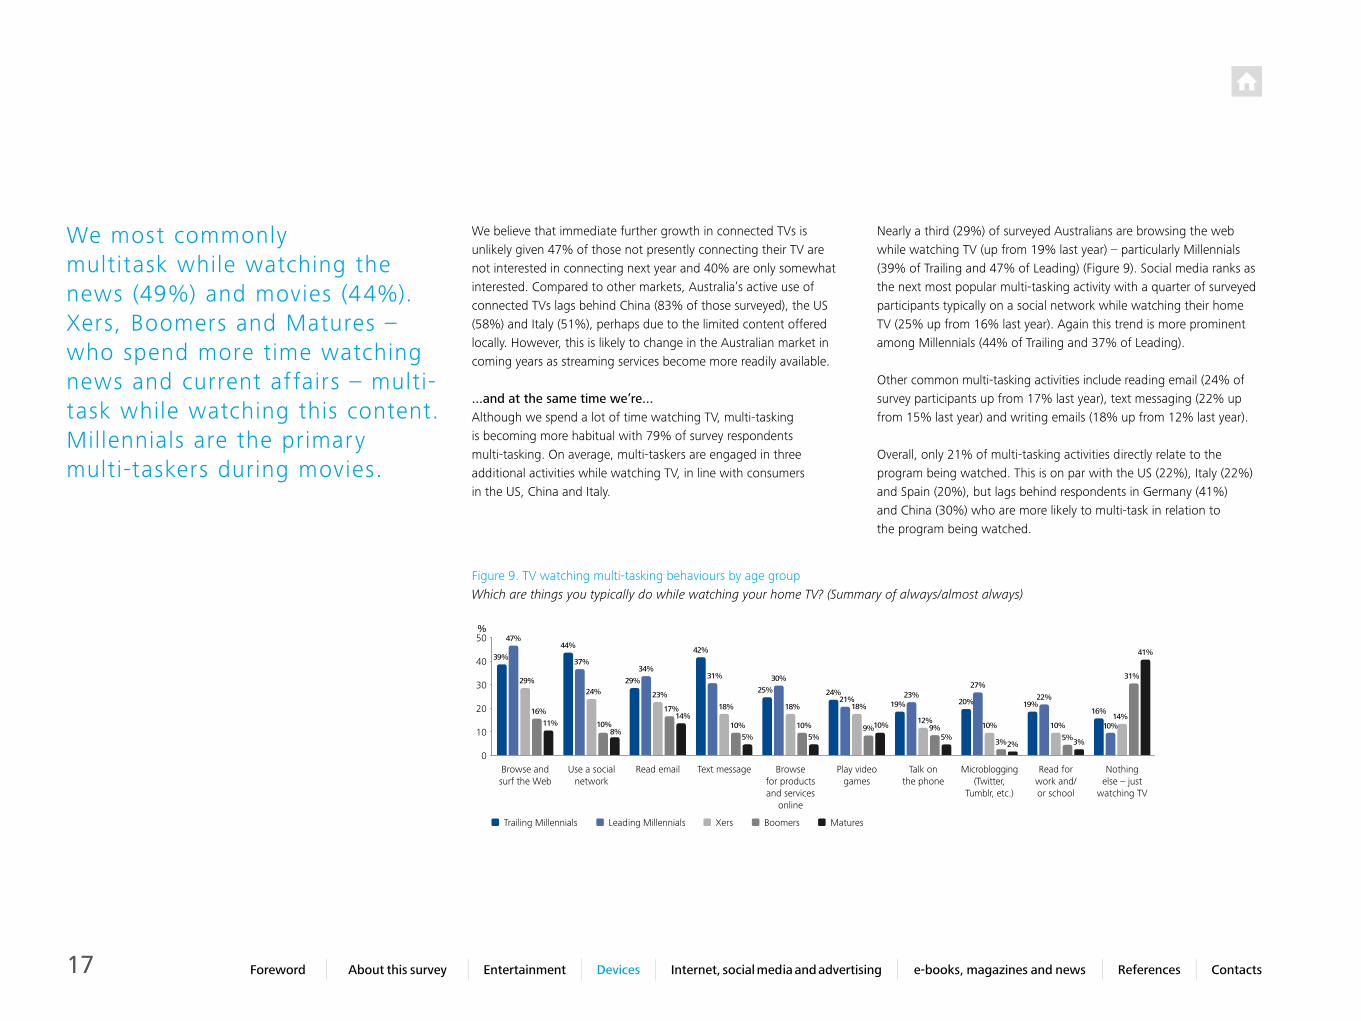
Nearly a third (29%) of surveyed Australians are browsing the web while watching TV (up from 19% last year) – particularly Millennials (39% of Trailing and 47% of Leading) (Figure 9). Social media ranks as the next most popular multi-tasking activity with a quarter of surveyed participants typically on a social network while watching their home TV (25% up from 16% last year). Again this trend is more prominent among Millennials (44% of Trailing and 37% of Leading).
Other common multi-tasking activities include reading email (24% of survey participants up from 17% last year), text messaging (22% up from 15% last year) and writing emails (18% up from 12% last year).
Overall, only 21% of multi-tasking activities directly relate to the program being watched. This is on par with the US (22%), Italy (22%) and Spain (20%), but lags behind respondents in Germany (41%) and China (30%) who are more likely to multi-task in relation to the program being watched.
We most commonly multitask while watching the news (49%) and movies (44%). Xers, Boomers and Matures – who spend more time watching news and current affairs – multi-task while watching this content. Millennials are the primary multi-taskers during movies.
Figure 9. TV watching multi-tasking behaviours by age groupWhich are things you typically do while watching your home TV? (Summary of always/almost always)
Browse and surf the Web
Use a social network
Read email Text message Microblogging (Twitter,
Tumblr, etc.)
Browse for products and services
online
Read for work and/or school
Play video games
Nothing else – just
watching TV
Talk on the phone
40
20
10
30
50
0
%
Trailing Millennials Leading Millennials Xers Boomers Matures
47%44%
37%
24%
10%8%
29%
23%
17%
42%
31% 30%
25%
18%
10%10%
5%5%
24%21%
18%
9%10%
19%23%
12%9%
5%
20%
27%
10%
19%22%
10%
16%
10%14%
31%
41%
5%3%3%2%
18%14%
34%
39%
29%
16%
11%

1818 Foreword About this survey Entertainment Internet, social media and advertising e-books, magazines and news References ContactsDevices
Overall we tend to use smartphones (49%) closely followed by laptops (48%) and tablets (34%) when we multi-task (Figure 10).
Matures prefer to multi-task on a tablet (30% of the time), Boomers prefer laptops (41%) and Millennials and Xers tend to use their smartphones (64%, 63% and 52%).
Get(ting) smart(er)Smartphone ownership has increased among Australian survey respondents by 21% over the past three years to 81%, ahead of Japan, the US and Germany but lagging the other four countries surveyed (Figure 11). The highest growth over the past three years in Australia occurred among Matures (38% increase) and Boomers (27% increase) – age groups which previously had the lowest smartphone penetration.
Figure 11. Smartphone ownership in surveyed countriesWhich of the following media or home entertainment equipment does your household own – smartphones?
Italy
85
Spain
87
US
65
Japan
56
Norway
86
China
96
Australia
81
Germany
73
Figure 10. Most used devices for multi-tasking while watching TV by age groupYou indicated that you multi-task when watching content on your main screen. What devices do you predominately use to multi-task?
Trailing Millennials 64% 52% 33% 16% 0% 3% 4%
Leading Millennials 63% 60% 36% 18% 3% 3% 2%
Xers 52% 49% 36% 17% 2% 4% 6%
Boomers 31% 41% 32% 17% 4% 1% 13%
Matures 18% 27% 30% 21% 4% 1% 24%
Smartphone Laptop Tablet Desktop e-Reader Hand-held gaming device
Other
40
20
10
30
50
0
%49% 48%
34%
17%
3% 3%8%
1919 Foreword About this survey Entertainment Internet, social media and advertising e-books, magazines and news References ContactsDevices
Some 40% of all survey respondents still own a basic mobile phone device (i.e. without smart features). This is higher among Matures (64%) who are expected to continue to experience the fastest year-on-year growth in smartphone ownership across developed markets. Consequently, the smartphone ownership age gap is expected to narrow and become negligible by 20201.
While smartphones will soon be ubiquitous, there is likely to be substantial variation in how different age groups use them. Although over-55s are buying smartphones, getting them to fully exploit the data functions is a key opportunity for network operators1.
Smartphones are considered the ‘go-to’ device by 57% of consumers who own one, despite more respondents owning laptops (87% of all respondents). The preference for smartphones is up almost 10% (from 48% last year) and has increased over the last three years as the utility of the smartphone has increased – with functions ranging from GPS navigation, to Internet radio, and HD video cameras.
More than a third of survey respondents (35%) intend to spend more time using their device over the next year which is good news for app developers, network and data providers, and potentially for advertisers on mobile platforms.
App-solute market growth for gamesSmartphone and tablet use has grown the market for apps. However not all apps are created equal. App-using survey participants use social networking apps the most (55%), followed by weather apps (46%), with games, banking, navigation and browser apps close behind.
Many apps have a social aspect or have been gamified in some way with leader boards, in-app games or competitive games (e.g. Words with Friends or QuizUp).
Preferred categories of apps differ according to consumer age and gender. Social media, games, photo/video and music streaming apps have higher appeal for Millennials and Xers. Women prefer review/guide apps and business apps, while men prefer apps for the weather, food/drink, streaming video, VOIP as well as news aggregators.
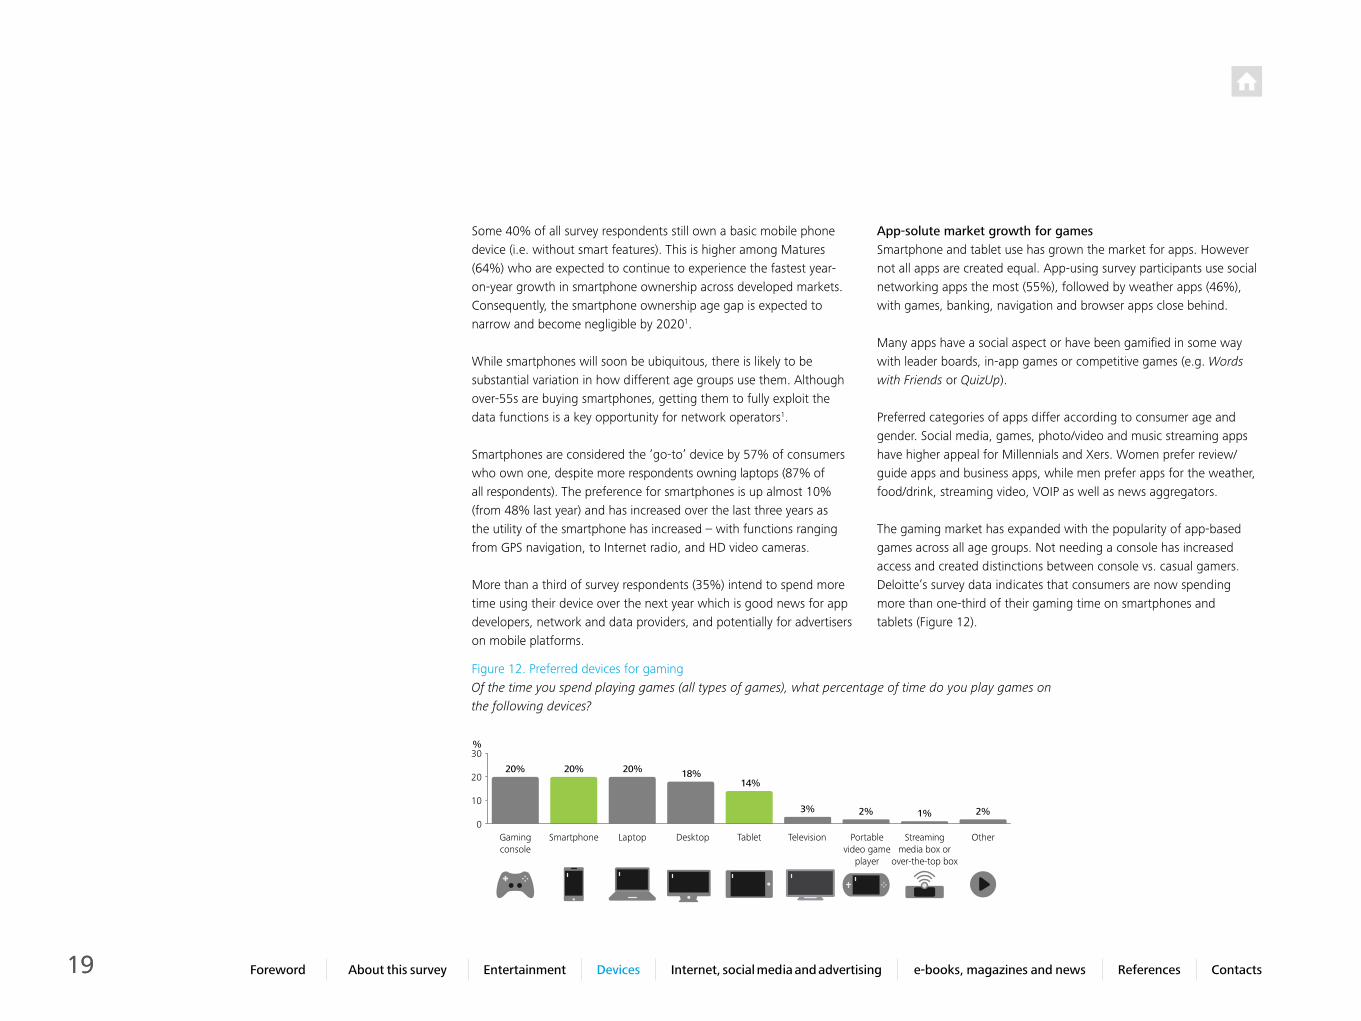
The gaming market has expanded with the popularity of app-based games across all age groups. Not needing a console has increased access and created distinctions between console vs. casual gamers. Deloitte’s survey data indicates that consumers are now spending more than one-third of their gaming time on smartphones and tablets (Figure 12).
Figure 12. Preferred devices for gamingOf the time you spend playing games (all types of games), what percentage of time do you play games on the following devices?
2%1%3% 2%
20
30
10
0
%
Laptop TabletSmartphone OtherDesktop Portable video game
player
TelevisionGaming console
Streaming media box or
over-the-top box
20% 20% 20% 18%14%
20 Foreword About this survey Entertainment Internet, social media and advertising e-books, magazines and news References ContactsDevices
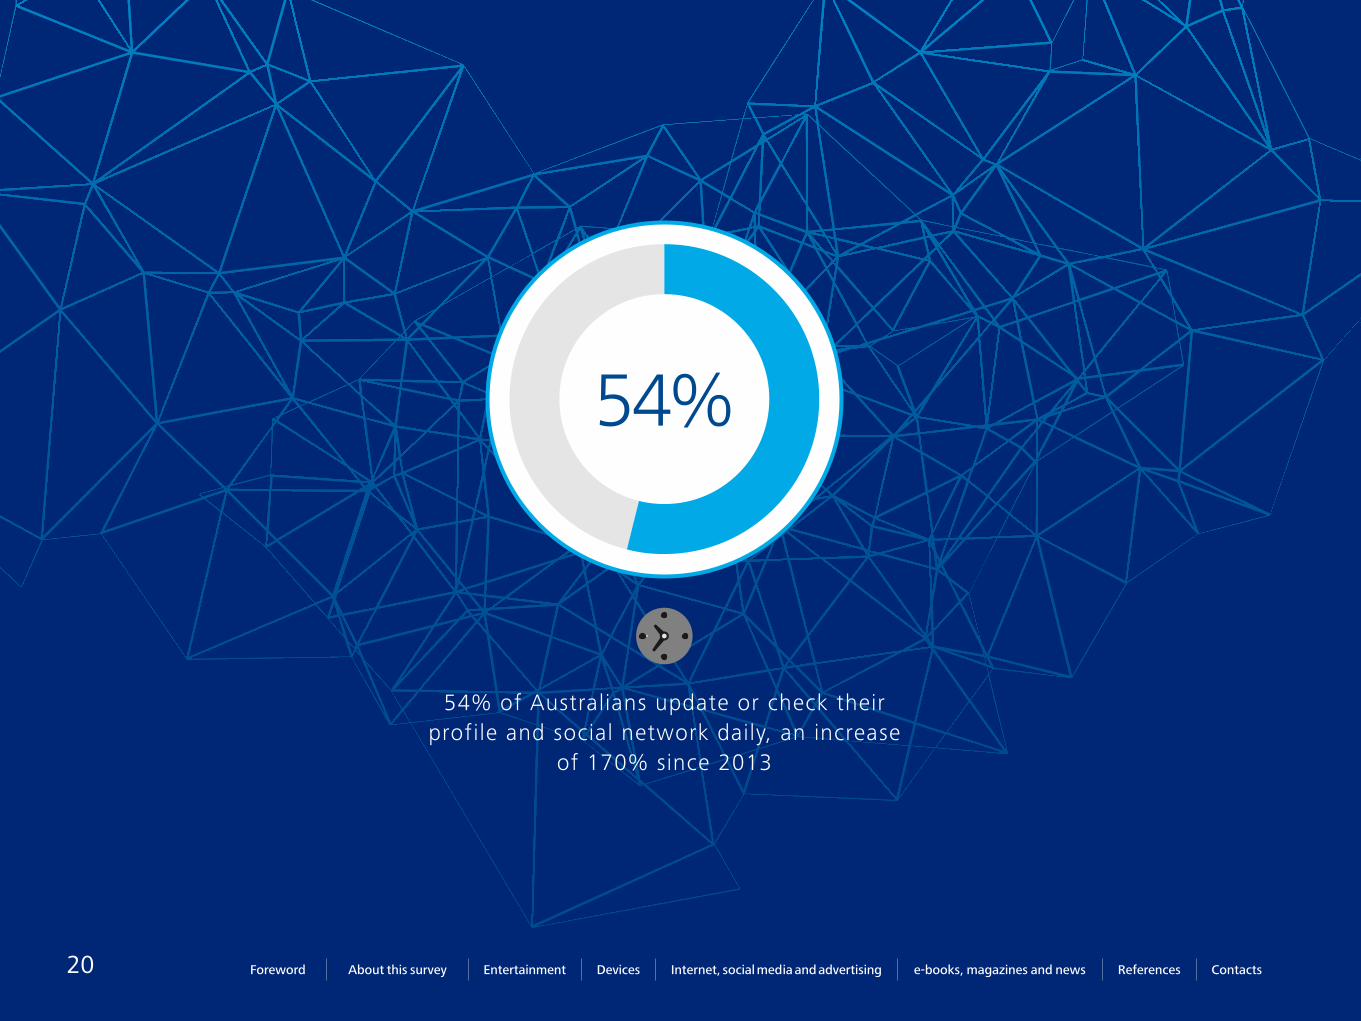
54% of Australians update or check their profile and social network daily, an increase
of 170% since 2013
54%
21 Foreword About this survey Entertainment Internet, social media and advertising e-books, magazines and news References ContactsDevices
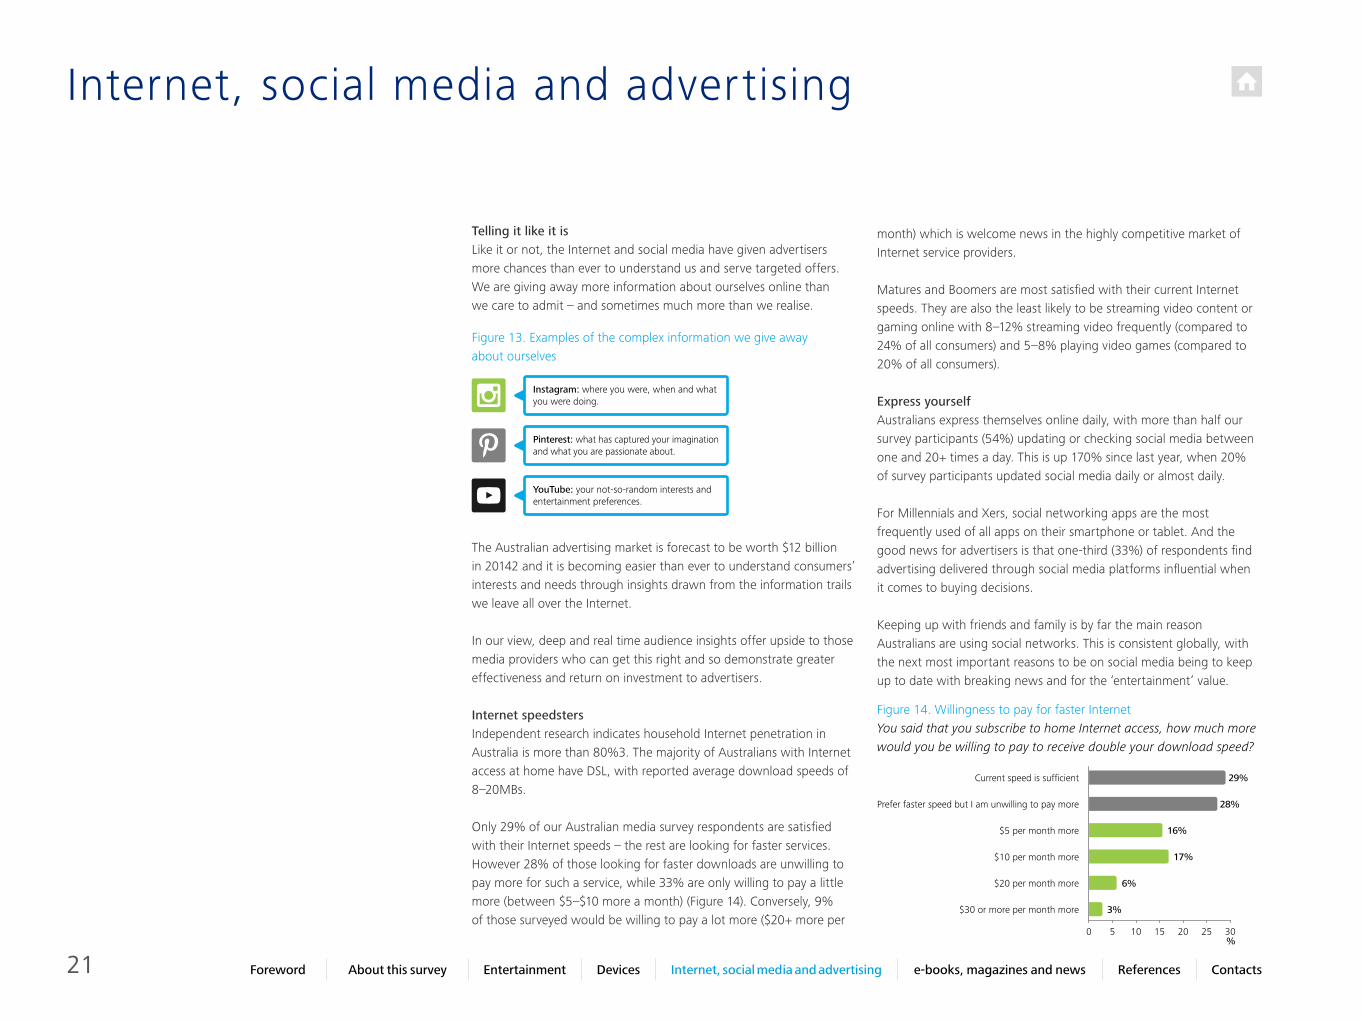
Telling it like it isLike it or not, the Internet and social media have given advertisers more chances than ever to understand us and serve targeted offers. We are giving away more information about ourselves online than we care to admit – and sometimes much more than we realise.
The Australian advertising market is forecast to be worth $12 billion in 20142 and it is becoming easier than ever to understand consumers’ interests and needs through insights drawn from the information trails we leave all over the Internet.
In our view, deep and real time audience insights offer upside to those media providers who can get this right and so demonstrate greater effectiveness and return on investment to advertisers.
Internet speedstersIndependent research indicates household Internet penetration in Australia is more than 80%3. The majority of Australians with Internet access at home have DSL, with reported average download speeds of 8–20MBs.
Only 29% of our Australian media survey respondents are satisfied with their Internet speeds – the rest are looking for faster services. However 28% of those looking for faster downloads are unwilling to pay more for such a service, while 33% are only willing to pay a little more (between $5–$10 more a month) (Figure 14). Conversely, 9% of those surveyed would be willing to pay a lot more ($20+ more per
month) which is welcome news in the highly competitive market of Internet service providers.
Matures and Boomers are most satisfied with their current Internet speeds. They are also the least likely to be streaming video content or gaming online with 8–12% streaming video frequently (compared to 24% of all consumers) and 5–8% playing video games (compared to 20% of all consumers).
Express yourself Australians express themselves online daily, with more than half our survey participants (54%) updating or checking social media between one and 20+ times a day. This is up 170% since last year, when 20% of survey participants updated social media daily or almost daily.
For Millennials and Xers, social networking apps are the most frequently used of all apps on their smartphone or tablet. And the good news for advertisers is that one-third (33%) of respondents find advertising delivered through social media platforms influential when it comes to buying decisions.
Keeping up with friends and family is by far the main reason Australians are using social networks. This is consistent globally, with the next most important reasons to be on social media being to keep up to date with breaking news and for the ‘entertainment’ value.
Internet, social media and advertising
Figure 13. Examples of the complex information we give away about ourselves
Instagram: where you were, when and what you were doing.
Pinterest: what has captured your imagination and what you are passionate about.
YouTube: your not-so-random interests and entertainment preferences.
Figure 14. Willingness to pay for faster InternetYou said that you subscribe to home Internet access, how much more would you be willing to pay to receive double your download speed?
Current speed is sufficient
$5 per month more
Prefer faster speed but I am unwilling to pay more
$30 or more per month more
$20 per month more
$10 per month more
29%
28%
16%
17%
6%
3%
3020105 15 250%

22 Foreword About this survey Entertainment Internet, social media and advertising e-books, magazines and news References ContactsDevices
30 60 7020 5010 405 3515 4525 55 650%
I often share links to different things I find online with friends and/or family
I contribute to a blog (not my own) by adding comments or postings
I upload my own videos to a video-sharing site (YouTube, Veoh, etc.)
I write product reviews on review sites, e-commerce sites, blogs, etc.
I use social networking sites for dating purposes
I comment or post to news articles or special interest stories I read on the Internet
I maintain my own blog for others to read about me and my opinions
I upload my own photos to a photo-sharing site (Flickr, Photobucket, etc.)
I upload my own game content (e.g. levels, music, other) to a console or
a PC games environment
Figure 15. Social media behaviours by age groupHow much do you agree or disagree with each of the following? (Summary of agree strongly/agree somewhat).
Total Trailing Millennials Leading Millennials Xers Boomers Matures
56%66%66%
51%52%
47%
41%42%
54%43%
33%31%
34%40%
46%32%
28%22%
33%43%
52%33%
20%19%
32%35%
48%33%
23%20%
27%38%
47%27%
12%11%
25%34%
41%25%
12%6%
23%32%
39%24%
9%7%
22%29%
41%23%
7%6%
23 Foreword About this survey Entertainment Internet, social media and advertising e-books, magazines and news References ContactsDevices
Australian Xers and older age groups tend to use social networks to share links or stories of interest with their network. In particular, Millennials use social media to express themselves – contributing their own generated content, like photos and product reviews, or adding their opinions to others’ articles or blogs (Figure 15).
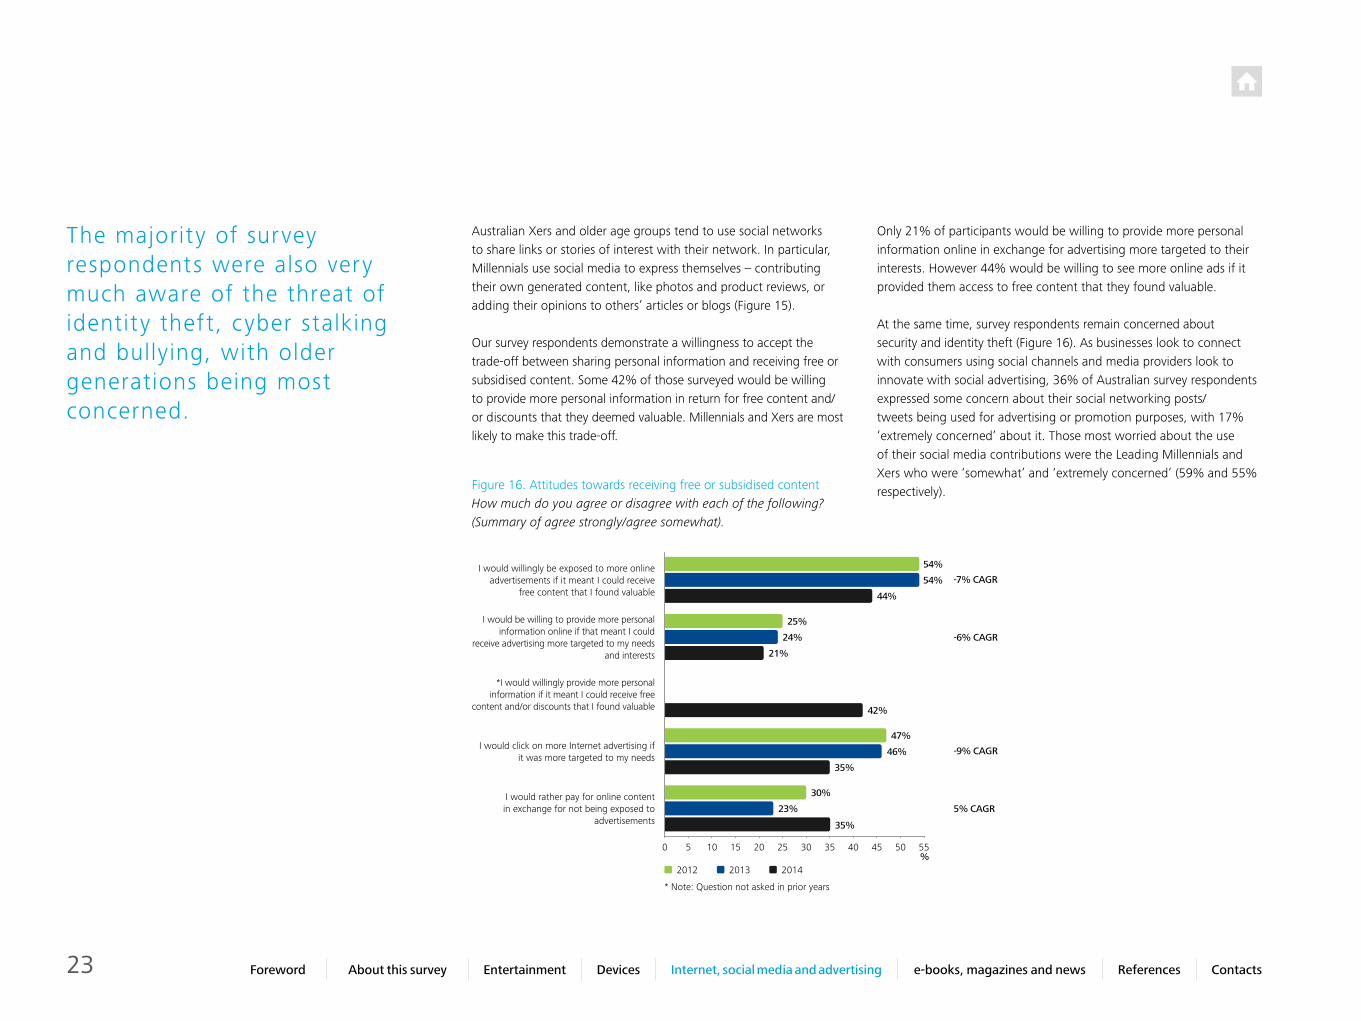
Our survey respondents demonstrate a willingness to accept the trade-off between sharing personal information and receiving free or subsidised content. Some 42% of those surveyed would be willing to provide more personal information in return for free content and/or discounts that they deemed valuable. Millennials and Xers are most likely to make this trade-off.
Only 21% of participants would be willing to provide more personal information online in exchange for advertising more targeted to their interests. However 44% would be willing to see more online ads if it provided them access to free content that they found valuable.
At the same time, survey respondents remain concerned about security and identity theft (Figure 16). As businesses look to connect with consumers using social channels and media providers look to innovate with social advertising, 36% of Australian survey respondents expressed some concern about their social networking posts/tweets being used for advertising or promotion purposes, with 17% ‘extremely concerned’ about it. Those most worried about the use of their social media contributions were the Leading Millennials and Xers who were ‘somewhat’ and ‘extremely concerned’ (59% and 55% respectively).
The majority of survey respondents were also very much aware of the threat of identity theft, cyber stalking and bullying, with older generations being most concerned.
Figure 16. Attitudes towards receiving free or subsidised contentHow much do you agree or disagree with each of the following? (Summary of agree strongly/agree somewhat).
I would willingly be exposed to more online advertisements if it meant I could receive
free content that I found valuable
I would be willing to provide more personal information online if that meant I could
receive advertising more targeted to my needs and interests
*I would willingly provide more personal information if it meant I could receive free
content and/or discounts that I found valuable
I would click on more Internet advertising if it was more targeted to my needs
I would rather pay for online content in exchange for not being exposed to
advertisements
* Note: Question not asked in prior years
40 5530 4520105 15 25 35 500%
2012 2013 2014
54%
54% -7% CAGR
-6% CAGR
-9% CAGR
5% CAGR
44%
25%
24%
21%
42%
47%
46%
35%
30%
35%
23%
24 Foreword About this survey Entertainment Internet, social media and advertising e-books, magazines and news References ContactsDevices
Recommendations from a friend/family/known acquaintance (someone you know in real life)
*Online review or recommendation from someone within your social media circle
(could be a friend of a friend)
Television ads
*Manufacturer or vendor website (e.g. SonyStyle.com, Nestle.com)
*Online review by someone you do not know in real life
*Products or services mentioned/featured in a TV show or movie
Newspaper ads
Magazine ads
*An email from a company/brand (e.g. an email campaign)
*A reseller or channel partner website (e.g. Amazon.com, iTunes.com®)
In-theater advertising
Radio ads
Billboards and posters
*A tweet/post by company/brand you do not follow
Ads delivered on mobile apps, including location-based ad
*A tweet/post by someone you do not already follow (not an ad)
SMS/Text Message ad
*Video game advertising (all forms of games)
Ads delivered through social media platforms such as Instagram, Facebook, and Google+
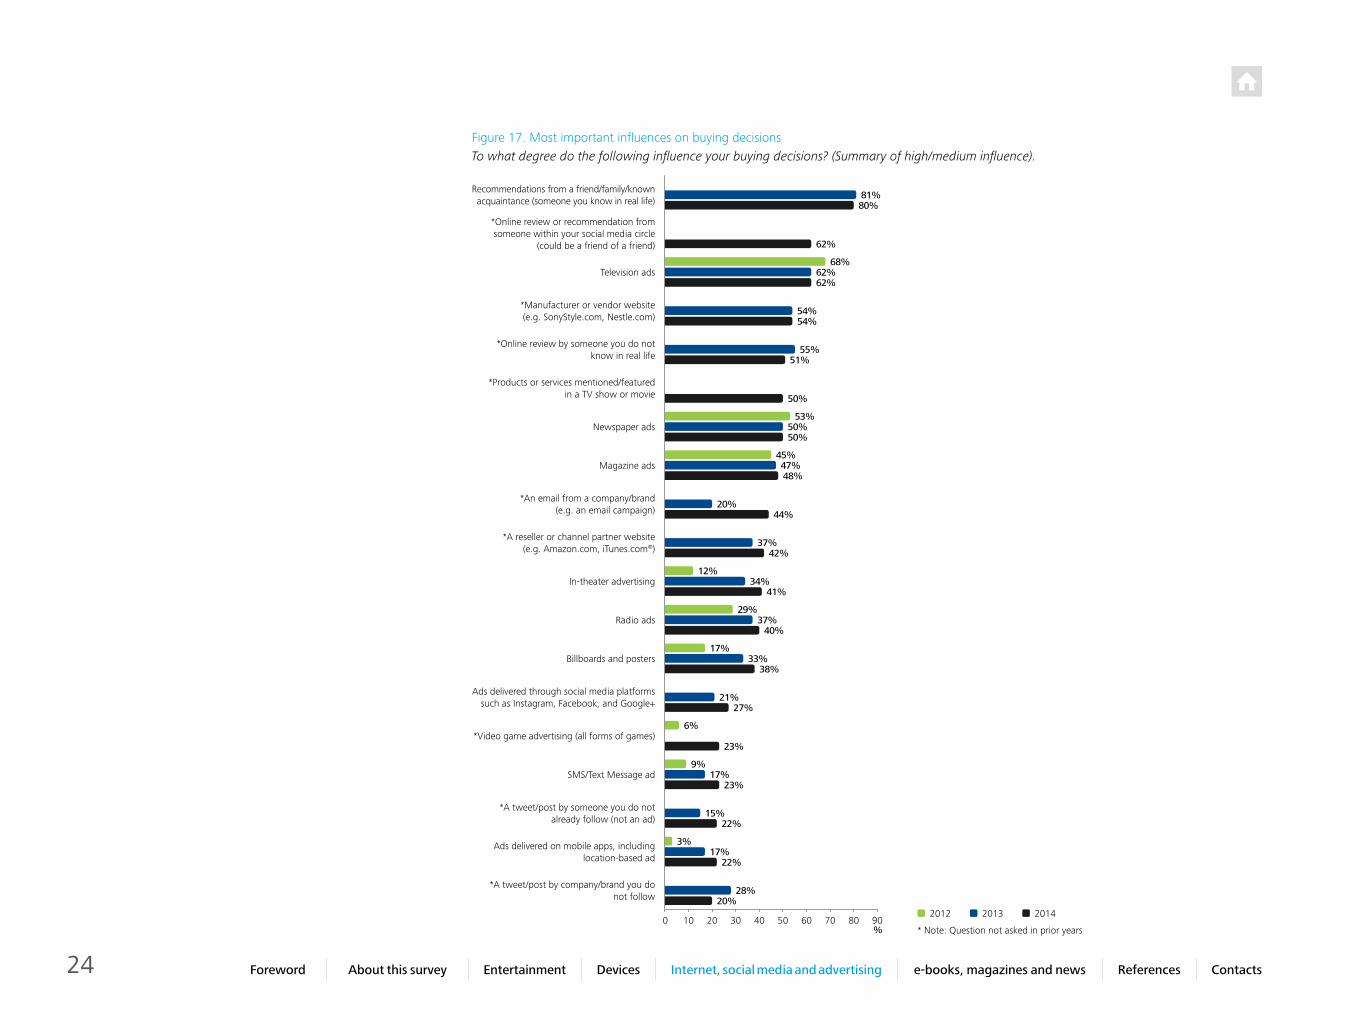
Figure 17. Most important influences on buying decisions To what degree do the following influence your buying decisions? (Summary of high/medium influence).
80%
62%
68%62%62%
54%54%
55%51%
50%
50%50%
45%47%48%
44%
42%
41%
40%
29%
17%
38%
27%
23%
23%
22%
22%
20%
6%
9%
3%
12%
37%
20%
34%
37%
33%
21%
17%
15%
17%
28%
53%
81%
604020 8010 7030 90500%
2012 2013 2014
* Note: Question not asked in prior years
25 Foreword About this survey Entertainment Internet, social media and advertising e-books, magazines and news References ContactsDevices
No deck chair shuffle for advertising Personal recommendations, including those from social media circles, are the most important influencers when it comes to buying decisions (Figure 17). Even online reviews by people that the survey respondents don’t know were rated more influential on buying decisions than product placements, newspaper and magazine advertising.
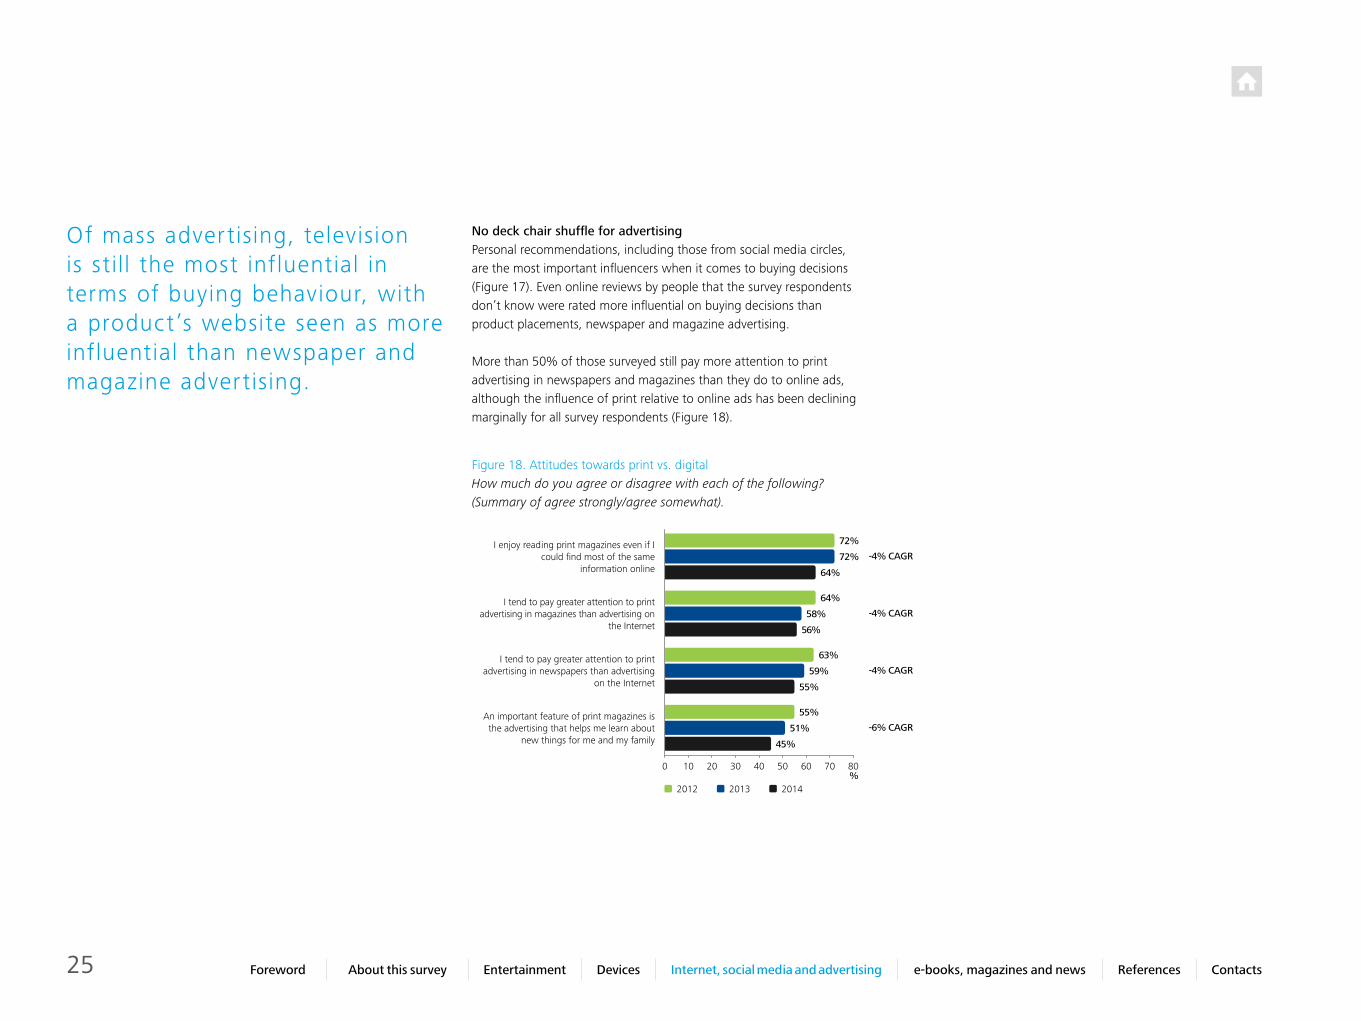
More than 50% of those surveyed still pay more attention to print advertising in newspapers and magazines than they do to online ads, although the influence of print relative to online ads has been declining marginally for all survey respondents (Figure 18).
Of mass advertising, television is still the most influential in terms of buying behaviour, with a product’s website seen as more influential than newspaper and magazine advertising.
Figure 18. Attitudes towards print vs. digital How much do you agree or disagree with each of the following? (Summary of agree strongly/agree somewhat).
I enjoy reading print magazines even if I could find most of the same
information online
I tend to pay greater attention to print advertising in magazines than advertising on
the Internet
I tend to pay greater attention to print advertising in newspapers than advertising
on the Internet
An important feature of print magazines is the advertising that helps me learn about
new things for me and my family
8060402010 30 50 700%
2012 2013 2014
72%
72% -4% CAGR
-4% CAGR
-6% CAGR
-4% CAGR
64%
64%
63%
58%
59%
56%
55%
55%
51%
45%
26 Foreword About this survey Entertainment Internet, social media and advertising e-books, magazines and news References ContactsDevices
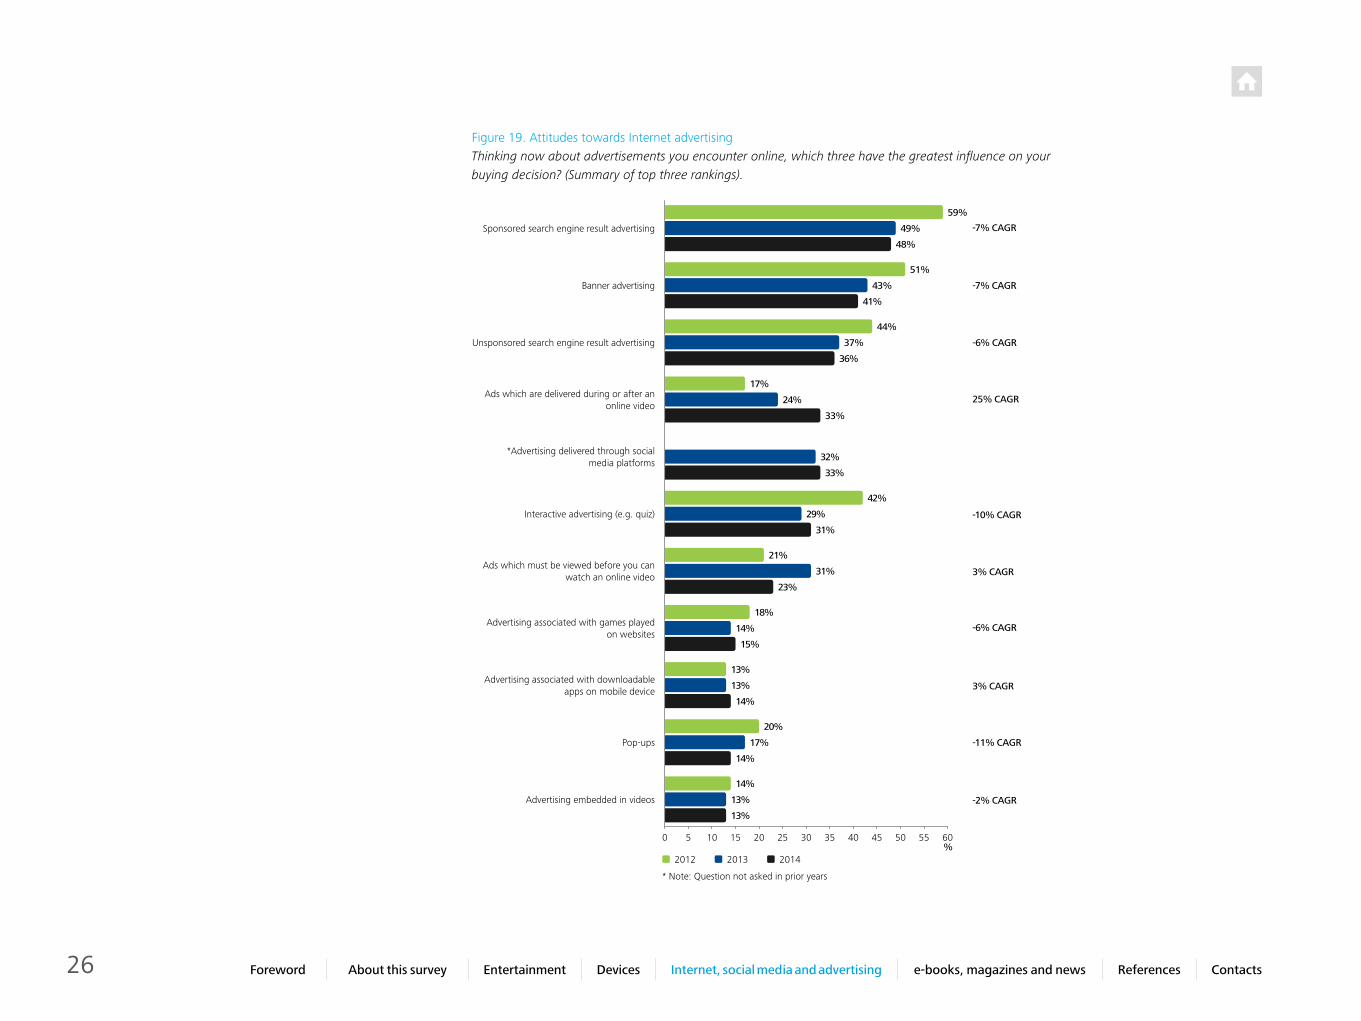
Figure 19. Attitudes towards Internet advertisingThinking now about advertisements you encounter online, which three have the greatest influence on your buying decision? (Summary of top three rankings).
Sponsored search engine result advertising
Banner advertising
Unsponsored search engine result advertising
Ads which are delivered during or after an online video
*Advertising delivered through social media platforms
Advertising embedded in videos
Pop-ups
Advertising associated with downloadable apps on mobile device
Advertising associated with games played on websites
Ads which must be viewed before you can watch an online video
Interactive advertising (e.g. quiz)
40 55 6030 4520105 15 25 35 500%
2012 2013 2014
59%
49% -7% CAGR
-7% CAGR
-6% CAGR
25% CAGR
-10% CAGR
3% CAGR
-6% CAGR
3% CAGR
-11% CAGR
-2% CAGR
48%
51%
44%
43%
37%
41%
36%
17%
24%
33%
42%
21%
18%
13%
20%
14%
33%
31%
23%
15%
14%
14%
13%
32%
29%
31%
14%
13%
17%
13%
* Note: Question not asked in prior years
27 Foreword About this survey Entertainment Internet, social media and advertising e-books, magazines and news References ContactsDevices
Internet advertising in Australia is forecast to reach $4.5 billion in 2014 and forecast to grow by 17% in the next two years2. While sponsored search engine advertising is still the most influential for almost half of all Australians surveyed, it is experiencing a decline in terms of its influence, along with banner ads and unsponsored search engine results (Figure 19).
Ads delivered during or af ter an online video appear to be becoming more influential, with 33% of surveyed respondents ranking them in the top three greatest influencers on their buying decisions.

28 Foreword About this survey Entertainment Internet, social media and advertising e-books, magazines and news References ContactsDevices
49% of Australians prefer printed magazines
49%
29 Foreword About this survey Entertainment Internet, social media and advertising e-books, magazines and news References ContactsDevices
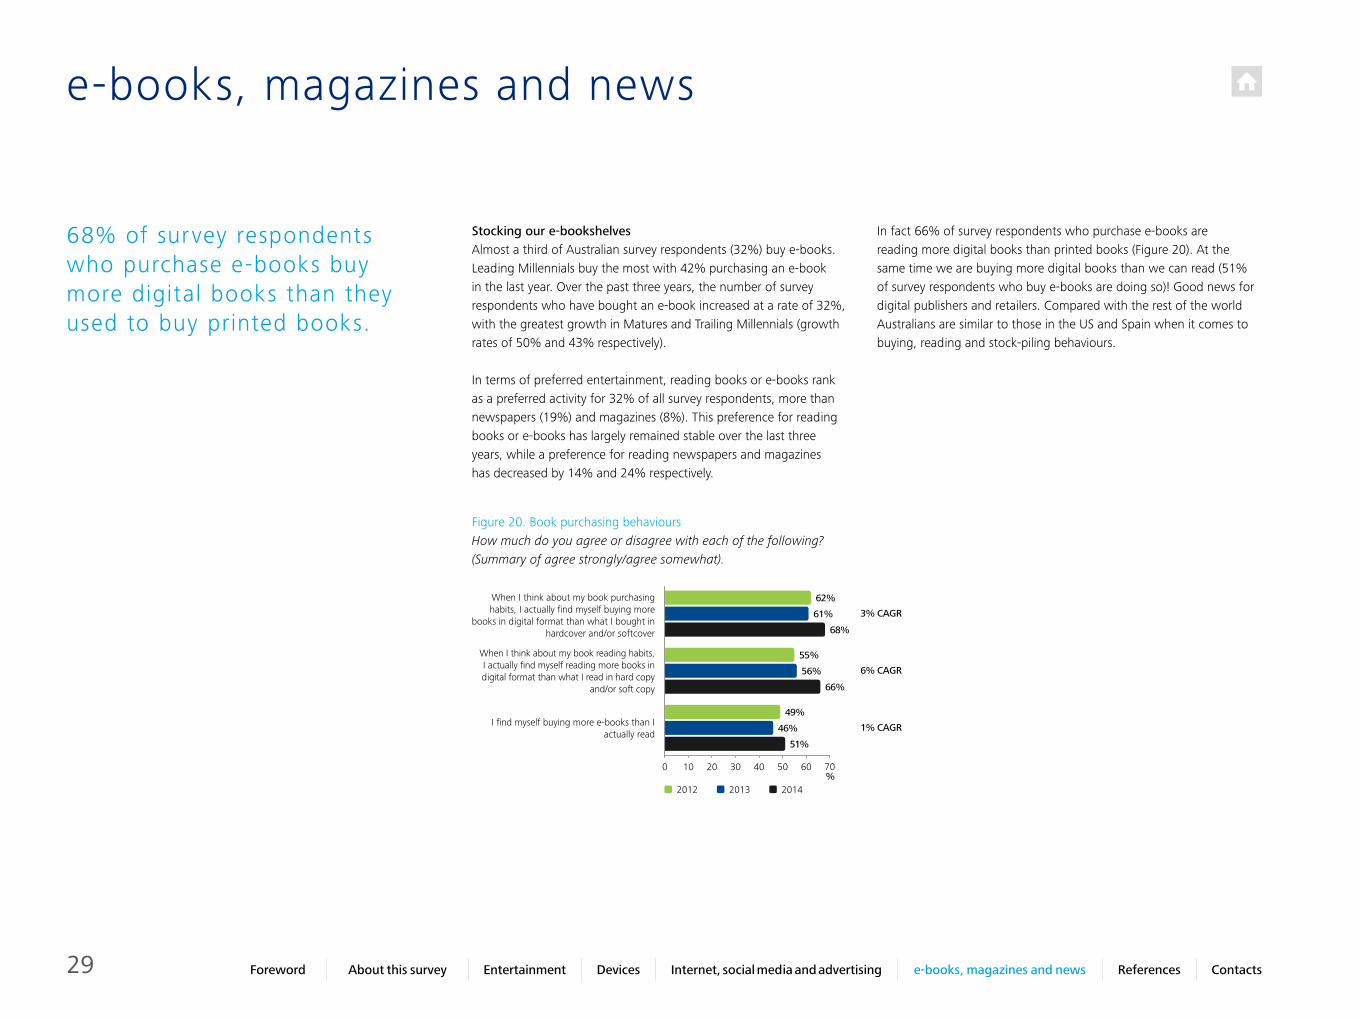
Stocking our e-bookshelvesAlmost a third of Australian survey respondents (32%) buy e-books. Leading Millennials buy the most with 42% purchasing an e-book in the last year. Over the past three years, the number of survey respondents who have bought an e-book increased at a rate of 32%, with the greatest growth in Matures and Trailing Millennials (growth rates of 50% and 43% respectively).
In terms of preferred entertainment, reading books or e-books rank as a preferred activity for 32% of all survey respondents, more than newspapers (19%) and magazines (8%). This preference for reading books or e-books has largely remained stable over the last three years, while a preference for reading newspapers and magazines has decreased by 14% and 24% respectively.
In fact 66% of survey respondents who purchase e-books are reading more digital books than printed books (Figure 20). At the same time we are buying more digital books than we can read (51% of survey respondents who buy e-books are doing so)! Good news for digital publishers and retailers. Compared with the rest of the world Australians are similar to those in the US and Spain when it comes to buying, reading and stock-piling behaviours.
68% of survey respondents who purchase e-books buy more digital books than they used to buy printed books.
e-books, magazines and news
Figure 20. Book purchasing behaviours How much do you agree or disagree with each of the following? (Summary of agree strongly/agree somewhat).
When I think about my book purchasing habits, I actually find myself buying more
books in digital format than what I bought in hardcover and/or softcover
When I think about my book reading habits, I actually find myself reading more books in digital format than what I read in hard copy
and/or soft copy
I find myself buying more e-books than I actually read
60402010 30 50 700%
2012 2013 2014
62%
61% 3% CAGR
6% CAGR
1% CAGR
68%
55%
49%
56%
46%
66%
51%
30 Foreword About this survey Entertainment Internet, social media and advertising e-books, magazines and news References ContactsDevices
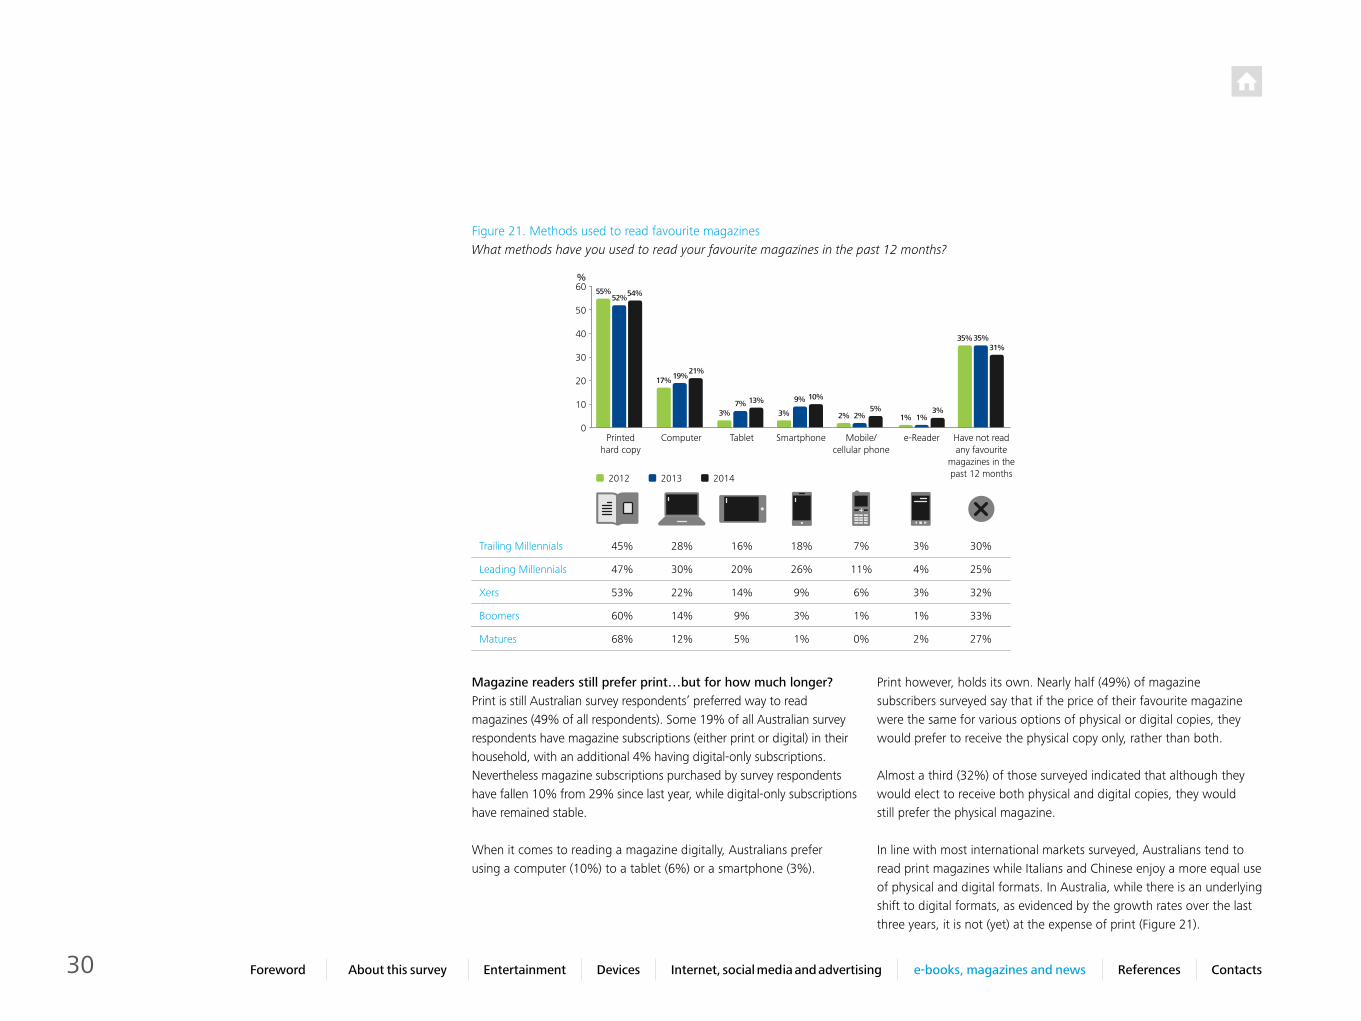
Magazine readers still prefer print…but for how much longer?Print is still Australian survey respondents’ preferred way to read magazines (49% of all respondents). Some 19% of all Australian survey respondents have magazine subscriptions (either print or digital) in their household, with an additional 4% having digital-only subscriptions. Nevertheless magazine subscriptions purchased by survey respondents have fallen 10% from 29% since last year, while digital-only subscriptions have remained stable.
When it comes to reading a magazine digitally, Australians prefer using a computer (10%) to a tablet (6%) or a smartphone (3%).
Figure 21. Methods used to read favourite magazinesWhat methods have you used to read your favourite magazines in the past 12 months?
Printed hard copy
Computer Tablet Smartphone Mobile/cellular phone
e-Reader
40
50
20
10
30
60
0
%55%
17%
3% 3% 2% 1% 1%2%5% 3%
19%
7% 9% 10%
21%
13%
52%
35%35%31%
54%
Have not read any favourite
magazines in the past 12 months
Trailing Millennials 45% 28% 16% 18% 7% 3% 30%
Leading Millennials 47% 30% 20% 26% 11% 4% 25%
Xers 53% 22% 14% 9% 6% 3% 32%
Boomers 60% 14% 9% 3% 1% 1% 33%
Matures 68% 12% 5% 1% 0% 2% 27%
2012 2013 2014
Print however, holds its own. Nearly half (49%) of magazine subscribers surveyed say that if the price of their favourite magazine were the same for various options of physical or digital copies, they would prefer to receive the physical copy only, rather than both.
Almost a third (32%) of those surveyed indicated that although they would elect to receive both physical and digital copies, they would still prefer the physical magazine.
In line with most international markets surveyed, Australians tend to read print magazines while Italians and Chinese enjoy a more equal use of physical and digital formats. In Australia, while there is an underlying shift to digital formats, as evidenced by the growth rates over the last three years, it is not (yet) at the expense of print (Figure 21).
31 Foreword About this survey Entertainment Internet, social media and advertising e-books, magazines and news References ContactsDevices
Old news – the digital age is here In our view, the relentless digitisation of news will continue, with higher volumes of daily news content produced digitally, greater consumer expectations about the immediacy of breaking news, and a move to accessing news outside of traditional news outlets.
As a consequence, traditional news formats continue to decline, with 32% of Australian survey respondents now indicating that keeping up to date with breaking news is one of their top three reasons for using social media.
Compared with other surveyed countries, Australia has the lowest newspaper subscription rates per household, whether print or digital (22%), compared with the top ranking Japan (53%), the UK (51%)4 and China (44%). An additional 8% have digital-only subscriptions. Within the surveyed population, newspaper subscriptions have declined by 5% over the past three years while digital-only subscriptions have grown by 26%, albeit from a very low base.
Both major newspaper organisations in Australia now have pay-walls in place. When asked about their willingness to pay for news online, 92% of Australians surveyed said that they would not pay, as they believe there is enough information available for free. This is consistent across all age groups, although Leading Millennials appear to be the most willing to pay (16%).
Among those who are willing to pay for online news content, the reasons include:• Trust in the brand (64% of those respondents willing to pay) • Access to unique content not available from free news sources
(48%, most important for Xers and Boomers) • In-depth news analysis (34%, most important for Boomers
and Matures) (Figure 22).
The digital tipping point has occurred for news – 35% of survey respondents always prefer to read their newspaper content in a digital format with a further 35% restricting their print newspaper reading to the weekend.
When reading news articles on a tablet, e-reader, and/or a smartphone, the most common ways of reading were through: • Online versions of national newspapers (48%) (through a mobile web
browser such as Safari or Chrome) • News article consolidators’ websites such as Yahoo News, Google
News (47%)• Online versions of a local city newspaper (44%) (through a web
browser)• The app version of a national newspaper (30%).
Some international publishers have stopped supporting the app version of their papers due to the closing gap between the experience that can be delivered via HTML5-compatible mobile browsers and that of apps. Another factor in this decision is the revenue-sharing model of apps, where a cut of the app subscription goes to the app store (e.g. iTunes). Publishers that can provide ‘responsive’ web-versions of their content no longer need to share their revenue with the distribution platform provider.

32 Foreword About this survey Entertainment Internet, social media and advertising e-books, magazines and news References ContactsDevices
Figure 22. Willingness to pay for news by age groupIn cases where you are willing to pay for online news content, what are the specific reasons?
The content is unique and I can’t find it from
free news sources
I trust and associate with the brand
I am looking for in depth news analysis
The point of view of the news source aligns closely with my values
The format/platform is unique (e.g. only print product that
delivers to my home)
Other reason
80
60
40
20
10
30
50
70
0
%
Total Trailing Millennials Leading Millennials Xers Boomers Matures
64%
75%
60%
13%
48%
39%
47%
52%54%
17%
34%31%
36%
24%
35% 34%
13%
22%
32%
23%23%
17%
4%8%
5%3%
31%
0%0%
29%
55%
65%
27%23%
72%
62%
33 Foreword About this survey Entertainment Internet, social media and advertising e-books, magazines and news References ContactsDevices
References
1. Deloitte Technology, Media & Telecommunications Predictions 2014.
2. Australian Advertising Market Forecast Annual Update – 2013, Venture Consulting, September 2013.
3. IBISWorld Industry Report J5911 Internet Service Providers in Australia, March 2014.
4. Deloitte UK Media Consumer Survey Report, The Digital Divide, 2014
34 Foreword About this survey Entertainment Internet, social media and advertising e-books, magazines and news References ContactsDevices
Contacts
Niki AlcornPartner – Consulting Tel: +61 2 9322 [email protected]
Authors
Lucy BuchananManager – ConsultingTel: +61 2 9322 [email protected]
Gerry VoonManager – ConsultingTel: +61 2 9322 [email protected]
Stuart JohnstonPartner – TMT LeaderTel: +61 3 9671 [email protected]
Frank FarrallPartner – Deloitte Digital Leader Tel: +61 3 9671 [email protected]
Additional Deloitte contacts
Clare HardingPartner – ConsultingTel: +61 2 9322 [email protected]
Mason DaviesPartner – Deloitte DigitalTel: +61 2 9322 [email protected]
Kate HugginsPartner – ConsultingTel: +61 2 9322 [email protected]
Damien TamplingPartner – Financial Advisory ServicesTel: +61 2 9322 [email protected]
Dennis MothPartner – Risk Services Tel: +61 2 9255 [email protected]
Roan FryerPartner – TaxTel: +61 2 9840 [email protected]
Sandeep ChadhaPartner – A&ATel: +61 2 9322 [email protected]
Ric SimesPartner – Deloitte Access EconomicsTel: +61 2 9322 [email protected]
Joshua TanchelPartner – Deloitte PrivateTel: +61 2 9322 7258 [email protected]

35 Foreword About this survey Entertainment Internet, social media and advertising e-books, magazines and news References ContactsDevices
The challenges of anticipating and responding to digital consumers changing behaviours to connect with customers across platforms and devices are common across many industries.
36 Foreword About this survey Entertainment Internet, social media and advertising e-books, magazines and news References ContactsDevices
Contact usDeloitte225 George StreetSydney, New South Wales Australia
Tel: +61 2 9322 7000www.deloitte.com.au
This publication contains general information only, and none of Deloitte Touche Tohmatsu Limited, its member firms, or their related entities (collectively the “Deloitte Network”) is, by means of this publication, rendering professional advice or services.
Before making any decision or taking any action that may affect your finances or your business, you should consult a qualified professional adviser. No entity in the Deloitte Network shall be responsible for any loss whatsoever sustained by any person who relies on this publication.
About Deloitte
Deloitte refers to one or more of Deloitte Touche Tohmatsu Limited, a UK private company limited by guarantee, and its network of member firms, each of which is a legally separate and independent entity. Please see www.deloitte.com/au/about for a detailed description of the legal structure of Deloitte Touche Tohmatsu Limited and its member firms.
Deloitte provides audit, tax, consulting, and financial advisory services to public and private clients spanning multiple industries. With a globally connected network of member firms in more than 150 countries, Deloitte brings world-class capabilities and high-quality service to clients, delivering the insights they need to address their most complex business challenges. Deloitte has in the region of 200,000 professionals, all committed to becoming the standard of excellence.
About Deloitte Australia
In Australia, the member firm is the Australian partnership of Deloitte Touche Tohmatsu. As one of Australia’s leading professional services firms, Deloitte Touche Tohmatsu and its affiliates provide audit, tax, consulting, and financial advisory services through approximately 6,000 people across the country. Focused on the creation of value and growth, and known as an employer of choice for innovative human resources programs, we are dedicated to helping our clients and our people excel. For more information, please visit Deloitte’s web site at www.deloitte.com.au.
Liability limited by a scheme approved under Professional Standards Legislation.
Member of Deloitte Touche Tohmatsu Limited
© 2014 Deloitte Touche Tohmatsu.
MCBD_HYD_07/14_02061