deloitte access economics · acknowledgement supported by deloitte access economics acknowledges...
TRANSCRIPT
At what price?The economic, social and icon value of the Great Barrier Reef

Acknowledgement
Supported by
Deloitte Access Economics acknowledges and thanks the Great Barrier Reef Foundation for commissioning the report with support from the National Australia Bank and the Great Barrier Reef Marine Park Authority. In particular, we would like to thank the report’s Steering Committee for their guidance:
Andrew Fyffe Finance Officer Great Barrier Reef Foundation
Anna Marsden Managing Director Great Barrier Reef Foundation
James Bentley Manager Natural Value, Corporate Responsibility National Australia Bank Limited
Keith Tuffley Director Great Barrier Reef Foundation
Dr Margaret Gooch Manager, Social and Economic Sciences Great Barrier Reef Marine Park Authority
Prof. Ove Hoegh-Guldberg Director of the Global Change Institute and Professor of Marine Science The University of Queensland
Prof. Robert Costanza Professor and Chair in Public Policy Australian National University
Dr Russell Reichelt Chairman and Chief Executive Great Barrier Reef Marine Park Authority
Stephen Fitzgerald Director Great Barrier Reef Foundation
Stephen Roberts Director Great Barrier Reef Foundation
Thank you to Associate Professor Henrietta Marrie from the Office of Indigenous Engagement at CQUniversity Cairns for her significant contribution and assistance in articulating the Aboriginal and Torres Strait Islander value of the Great Barrier Reef.
Thank you to Ipsos Public Affairs Australia for their assistance in conducting the primary research for this study.
We would also like to thank Nicholas Gruen, CEO Lateral Economics and Lord O’Neill of Gatley for suggestions.

Foreword 03Executive summary 05
1 Introduction 091.1 Overview 091.2 Why value the Great Barrier Reef? 111.3 Report structure 13
2 Economic contribution 152.1 Measuring the economic contribution 152.2 Tourism 172.3 Commercialfishingandaquaculture 202.4 Recreational activities 222.5 Scientificresearchand
reef management 242.6 Economic contribution 26
3 Economic, social and icon value 293.1 Valuation approach 303.2 Non-use value 343.3 Direct use value 393.4 Indirect use value 403.5 Economic, social and icon value 44
4 Traditional Owner value 454.1 Cultural ecosystem services 454.2 Traditional Owner economic value 464.3 Economic valuation 47
5 Brand value 505.1 Australia’s Brand Trinity 525.2 Valuing the Brand 535.3 Brand Australia 56
6 Too big to fail 58
Acronyms 61Glossary 62References 63
Contents
Appendix A: Economic contribution studies 65A.1 Value added 65A.2 Measuring the economic contribution 65A.3 Direct and indirect contributions 66A.4 Limitations of economic
contribution studies 66A.5 Input-output analysis 67
Appendix B: Economic contribution 68B.1 Data source 68B.2 Economic contribution of
tourism activities 69B.3 Economic contribution of
commercialfishingandaquaculture 70B.4 Economiccontributionofscientific
research and reef management 71B.5 Summary of employment contribution
to Queensland 72B.6 Summary of employment contribution
to Australia 72
Appendix C: Literature review 73C.1 Literature review framework 73C.2 International studies 73C.3 Australian studies 73C.4 Reviewfindings 75
Appendix D: Primary research and results 76D.1 General 76D.2 Tourist Respondents 78D.3 Non-Users 79
Appendix E: Economic, social and icon value 83E.1 Non-use value 83E.2 Indirect use value 84E.3 Direct use value 84
Appendix F: Valuing the future and the discount rate 87F.1 Valuing the future and the discount rate 87
Authors 89
Limitation of our work 89General use restriction 89

ChartsChart 2.1 Visitor nights in the GBR region, 2015–16 17Chart 2.2 Regional composition of total visitor days (nights) in the GBRMP region, 2015–16 18Chart 2.3 Total visitor days and visitor nights by purpose of trips, 2015–16 (million) 19Chart2.4 Regionalcontributiontothevalueofcommercialfishingandaquaculture
production in the GBR region, 2015–16 20Chart 2.5 Recreation expenditure by industries, 2015–16 ($m) 23Chart 3.1 Why are Australians willing to pay to protect the GBR? 31Chart 3.2 Why is the international community willing to pay for the GBR’s future health? 32Chart 3.3 Australian’s views' on the biggest threats to the GBR 32Chart 3.4 International residents views' on the biggest threats to the GBR 33Chart 3.5 Weekly willingness to pay by state and territory 35Chart 3.6 Natural capital and human capital interactions 44Chart 5.1 Why the GBR is the most iconic to Australians and international respondents 51Chart 5.2 What Australians and the international community thinks about the GBR 51Chart 5.3 Why are people willing to pay to for the GBR's future health? 54
Tables Table 2.1 Types of employment contributions 16Table 2.2 Average expenditure per visitor day (or visitor night), 2015–16 ($A) 19Table 2.3 Tourism valued added to the economy 20Table2.4 ThevalueofcommercialfishingandaquacultureproductionbyNRMregions,2015–16 21Table2.5 Commercialfishingandaquaculturevaluedaddedtotheeconomy 21Table 2.6 Recreational expenditure on the GBR region by types of expenditure, 2015–16 22Table 2.7 Recreational activity valued added to the economy 23Table2.8 Scientificresearchandreefmanagementactivityvaluedaddedtotheeconomy 24Table 2.9 Economic contribution of the GBR 2015–16 26Table B.1 Sources of data to measure the economic contribution 68Table B.2 Economic contribution of tourism in the GBRMP region by NRM region and
types of visitor, 2015–16 69TableB.3 CommercialfishingandaquaculturecontributiontotheAustralianeconomy
by NRM regions, 2015–16 70Table B.4 Recreation contribution to the Australian economy in terms of value added, 2015–16 71TableB.5 EconomiccontributionoftheGBRtoscientificresearchandreefmanagement,2015–16 71Table B.6 Summary of the economic contribution to Queensland 72Table B.7 Summary of the economic contribution to Australia 72Table F.1 Key social discount rates considered 88Table F.2 Sensitivity analysis 88
FiguresFigure 1.1 Scope of the report 11Figure 2.1 Economic activity accounting framework 16Figure 3.1 Total economic and social value measurement framework 30Figure 3.2 Natural capital and human capital interactions 41Figure 3.3 Ecosystem services 42Figure A.1 Economic activity accounting framework 66
At what price? The economic, social and icon value of the Great Barrier Reef
02
At what price? | Foreword
Foreword
There is no doubt that the Great Barrier Reef holdssignificantvalueforAustralia,Australiansand the global community.
Sir David Attenborough has declared our Great Barrier Reef to be “one of the greatest and most splendid natural treasures that the world possesses”. Beyond its unparalleled beauty and richness of biodiversity, the Reef delivers real economic value to the Australian economy.
Today, our Reef is under threat like never before. Two consecutive years of global coral bleaching are unprecedented,whileincreasinglyfrequentextremeweathereventsandwaterqualityissuescontinuetoaffectReefhealth.SotherehasneverbeenamorecriticaltimetounderstandpreciselywhattheReef contributes and, therefore, what we stand to lose without it.
The contents of this report should inform future policy settings and assist industry, government, the science community and the wider public to fully understand the contribution of the Great Barrier Reef to the economy and society, both in Australia and around the world.
Thereport’sfindingsemphasisetheeconomicaspectofwhytheFoundation’sworkoverthecomingdecade is so important. We all must do more – much more – to protect the Reef. The Foundation is committed to enabling large-scale, ambitious projects that go to the heart of building the Reef’s resilience. We believe that mitigation and adaptation in the face of a changing climate are key. Fundamentally,ourworkisaboutfindingwaystoeasetheenvironmentalburdenontheReef–effectivelybuyingtheReeftime–astheworldworkstomeetthetermsoftheParisAgreement.
I would like to acknowledge and thank National Australia Bank and the Great Barrier Reef Marine Park Authority who have supported the Foundation to commission this report.
This report makes it clear that the Great Barrier Reef is a treasure that is too big to fail. It is a call to actionforusall–individuals,businesses,foundationsandgovernments–torespondinequal measure to ensure that we don’t fail our natural wonder.
Undoubtedly there is a role for everyone to do more to protect the Great Barrier Reef. Please join us onthequesttoensurethereisaGreat Barrier Reef for future generations.
Dr John Schubert AOChair, Great Barrier Reef Foundation
03
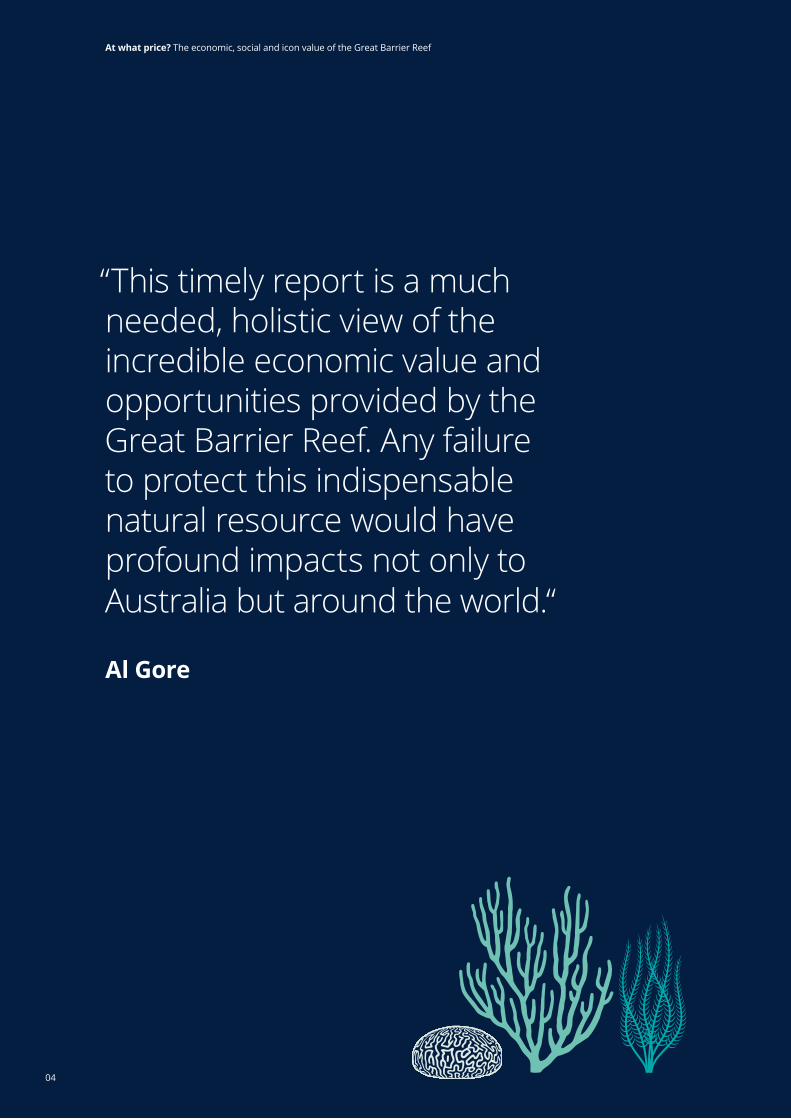
“This timely report is a much needed, holistic view of the incredible economic value and opportunities provided by the Great Barrier Reef. Any failure to protect this indispensable natural resource would have profound impacts not only to Australia but around the world.“
Al Gore
04
At what price? The economic, social and icon value of the Great Barrier Reef
At what price? | Executive summary
The Great Barrier Reef has a economic, social and icon asset value of $56 billion. It supports 64,000 jobs and contributes $6.4 billion to the Australian economy.
The Great Barrier Reef is the largest living structure on Earth. It is as big in size as Japan, and bigger than the United Kingdom, Switzerland and the Netherlands put together. Spanning 2,300 kilometres, the Great Barrier Reef can even be seen from space. The hundreds of thousands of marine and coral species that make up its rich tapestry of biodiversity make it one of the mostuniqueandcomplexecosystemsintheworld.
But it is more than a coral reef.
The Great Barrier Reef is in Australia’s cultural DNA. It is integral to the identity of Australia’s Traditional Owners. What’s more, its status as one the seven natural wonders of the world makes it an international asset. In many ways, it hardly seems necessary to quantifyitsvalue.ThevalueoftheGreatBarrierReef is priceless and we know that there is no replacement.
However, identifying, measuring and reporting on the economic and social value of the environment elevatesitssignificanceindecisionmaking.Valuingnatureinmonetarytermscaneffectivelyinformpolicysettingsandhelpindustry,government,thescientificcommunity and the wider public understand the contribution of the environment, or in this case the Great Barrier Reef, to the economy and society.
At a time when the global natural environment is under threat from the pressures of humankind, particularly climate change, it has never been more important to understand the economic and social value of the natural environment.
The Great Barrier Reef is incredibly rich, diverse – and under threat. The tight and unforgiving deadline the Great Barrier Reef is up against necessitates an understanding of its true value to know what kind of policyactionisrequiredinresponse.
This report assesses the economic, social, icon and brand value of the Great Barrier Reef. Its purpose is to gauge the Great Barrier Reef’s value to Australians and understand how the international community values it. This research synthesises the results from a range of publicly available data sources, a new survey of over 1,500 Australians and residents from 10 countries world-wide, fresh insights from stakeholderconsultationsandtheeffortsofpreviousresearch. The sample was representative and the sizestatisticallysignificant.
The report estimates the Great Barrier Reef’s: • Contribution to the Australian economy in 2015–16 through industry value added and employment,
• Economic, social and icon value, • SignificancetoAboriginalandTorresStraitIslanderTraditional Owners, and brand value to Australia andtheinternational community.
Executive summary
05
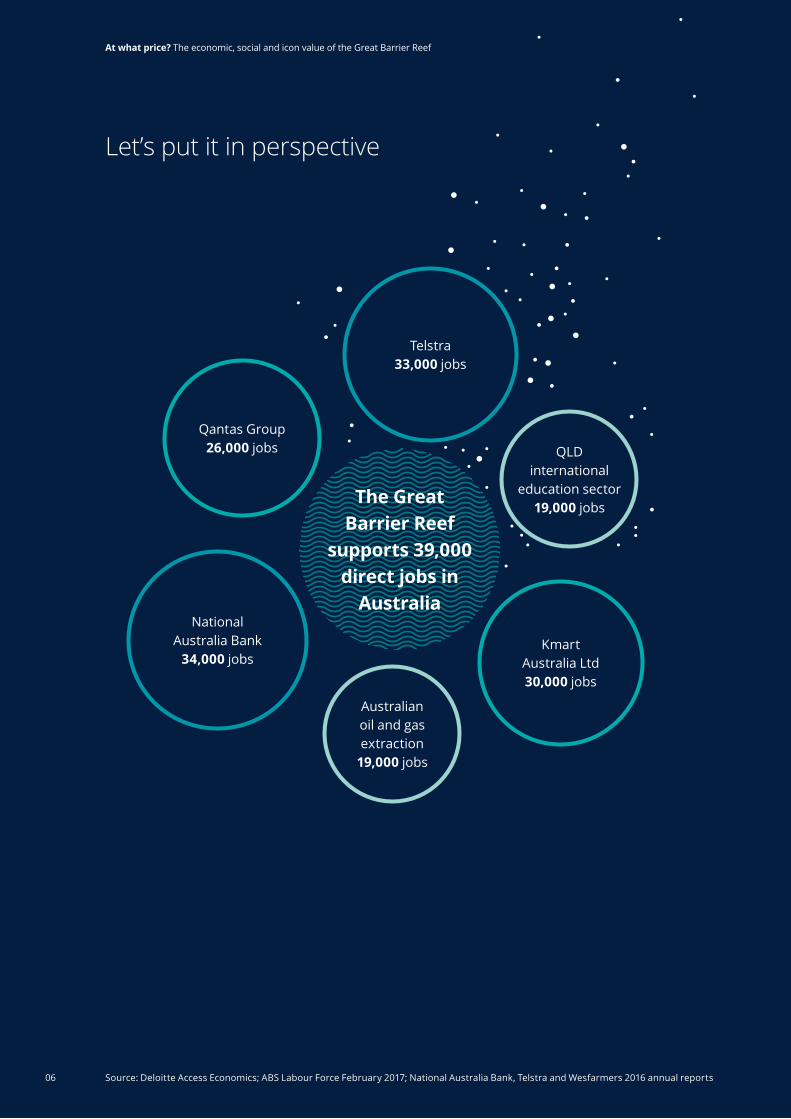
Let’s put it in perspective
Source: Deloitte Access Economics; ABS Labour Force February 2017; National Australia Bank, Telstra and Wesfarmers 2016 annual reports
The Great Barrier Reef
supports 39,000 direct jobs in
Australia
Qantas Group 26,000 jobs
Telstra 33,000 jobs
QLD international
education sector 19,000 jobs
National Australia Bank
34,000 jobs
Australian oil and gas extraction
19,000 jobs
Kmart Australia Ltd 30,000 jobs
06
At what price? The economic, social and icon value of the Great Barrier Reef
ThefirstwayofvaluingtheReefisthroughits annual contribution to the Australian economy in terms of value added (Gross Domestic Product) and employment.
Our research has shown the Great Barrier Reef contributed $6.4 billion in value added and over 64,000 jobs to the Australian economy in 2015–16 (direct and indirect). Most of these jobs came from tourism activities generated by the Great Barrier Reef, but there were also important economic contributions fromfishing,recreationalandscientificactivities.
The annual employment supported by the Great Barrier Reef is more than most of Australia’s major banks, and many corporates including the likes of Qantas and Deloitte Australia.
Considering this, the Reef is critical to supporting economic activity and jobs in Australia. The livelihoods and businesses it supports across Australia far exceeds the numbers supported by many industries we would consider too big to fail.
Another way of valuing the Reef is its economic, social andiconassetvalue.Thisfigurecapturesthebroaderaspects of why we value the Reef, and cannot be added totheannualeconomiccontributionfigure.
More than the jobs it supports and the value it adds to the economy each year, the Great Barrier Reef is valued at $56 billion as an Australian economic, social and iconic asset.
That's more than 12 Sydney Opera Houses, or the cost of building Australia's new submarines. It’s even more than 4 times the length of the Great Wall of China in $100 notes.
This is Australia’s Reef. This is our natural asset. If we split the $56 billion asset value down into its parts: • Australians who have visited the Reef as tourists – on their honeymoon, on a family holiday, on a bucket-listtrip–derive$29 billioninvalue
• Australians that have not yet visited the Reef – butvalueknowingthatitexists–derive$24 billion in value
• And the lucky Australians that are recreational users of the Reef – going to the beach, taking the boat out, diving on the weekends – derive $3 billion in value.
Theabovefiguresareestimatesbasedonreasonableassumptions about the length of analysis and the ‘discount rate’ – how much we value the Reef in the future. Varying these produces a range of $37 billion to$77billion.Theestimatesdonotincludequantifiedestimates of the value Traditional Owners place on the Reef. Another approach that analyses how the Reef is natural capital that provides ecosystem services is also exploredqualitativelyinthisreport.
So why do people value the Great Barrier Reef? What makes it worth $56 billion? Australians and the international community value the Great Barrier Reef for a range of reasons. Some reasons are more concrete such as their belief in its importance for tourism, while some are more abstract such as their belief that Australia would just not be ‘the same’ without it.
Australians want their children and future generations to be able to visit the Great Barrier Reef and enjoy it. From a global perspective, the Great Barrier Reef’s importance to the planet and to biodiversity is paramount. By every measure, the Great Barrier Reef is seen as the natural asset contributing most powerfully to Australia’s global brand. In our research, the Great Barrier Reef left other Australian land-based natural assets far behind in terms of visitor preference, reputationand experience.
07
At what price? | Executive summary

Why is this? Of the almost 1,000 respondents who named the Great Barrier Reef as Australia’s most iconic natural asset, their justificationincludes:theyconsider it to be one of the most beautiful places in Australia; it’s the most famous UNESCO natural site in Australia, and it is one of the seven natural wonders of the world.
Two-thirds of Australian and international respondents were prepared to pay to protect the Great Barrier Reef. Of these respondents:
• 61% alluded to its importance to the planet • 59% felt future generations should be able to visit it
• 59% cited its importance to biodiversity • 52% felt it was morally and ethically right to pay for its protection.
Ononelevel,allofthesefiguresseemenormous, butwhenyoureflectonit,it’salsoclearhowinadequatefinancialmeasuresareforsomethingasimportant to the planet as the Great Barrier Reef.
TheGreatBarrierReefisanimmenseanduniqueecosystemthatholdsasignificantvaluetohumansand other interlinked systems. In this sense, the Reef performs important environmental and ecological functions.Thesefunctions,ifquantified,wouldshowthat the Great Barrier Reef is worth much more than the 64,000 jobs annually and $56 billion asset value reported here.
Thisisn’tthefirstreporttoconsidertheimportanceoftheGreatBarrierReef–someofthesignificantexamples include Costanza et al. (2014) analysis of Reefs globally, Windle and Rolfe’s (2005a) application of choice modelling, Oxford Economics (2009), Stoeckl et al (2011) comprehensive account of literature and Deloitte Access Economics’ various contribution analyses.
Therehavealsobeendecadesofefforttoprotectthe Reef. The Commonwealth and Queensland Governments have implemented various policies to mitigate the impacts of local threats and build resilience against other pressures. The Great Barrier Reef 2050 Long-term Sustainability Plan was established in 2015 for greater coordination between stakeholders to protect the future health of the Reef. Inaddition,significantgovernmentfundingiscommittedeachyeartotheresearcheffortofunderstanding– and protecting – the complex nature of the Reef.
Whileeffortstodatehavebeensubstantial,thesignificanceoftheGreatBarrierReef’scontributionto the Australian economy, to Australian jobs and its remarkable asset value strongly indicates the Reef should be given even greater priority by all citizens, businesses and levels of government.
There is an opportunity – and a need – now more than ever for action on a universal level.
But more than just getting the policy settings right and investing wisely, understanding the true value of the Great Barrier Reef shows us what is at stake. And when called on, it is this knowledge that allows us to make it clear that the Great Barrier Reef’s protection is not only an Australian priority, or an international one – it is a human one.
At what price? The economic, social and icon value of the Great Barrier Reef
08

At what price? | Introduction
1.1 OverviewThe Great Barrier Reef (GBR) is the largest living structure and continuous coral reef system on Earth. It is as large as Japan and bigger than the United Kingdom, Switzerland and the Netherlands put together. Spanning 2,300 kilometres, it can even be seen from space. The hundreds of thousands of marine and coral species that make up its rich tapestry of biodiversity makes it one of the most distinctive and complex ecosystems in the world.
But, it is more than a coral reef.
As the largest living structure on the planet, the GBR is incredibly rich, diverse – and under threat. The GBR is up against a tight and unforgiving deadline. Tounderstandwhatkindofpolicyactionisrequired inresponse,thevalueoftheGBRmustfirst be understood.
This report examines the economic complexities of the GBR and studies its value to the Australian economy and society. It expands on the 2013 report by Deloitte AccessEconomicsthatestimatedthespecificeconomiccontribution of the Great Barrier Reef Marine Park area (GBRMP) in terms of its value added to the economy and contribution to employment across key sectors.
In addition to providing an updated economic contribution analysis, there are three other elements to this study.
ThefirstisananalysisoftheGBR’seconomicandsocialvalue as an Australian icon and natural wonder of the world, beyond what is captured by economic statistics.
TheGBRprovidesadditionalbenefit,orasurplus,tothose who visit it through its natural beauty, biodiversity andtherecreationalexperienceitoffers.Forthosewho haven’t had the pleasure of visiting, there is also a much broader social, cultural, heritage and iconic value attached to the GBR.
To capture these values, Deloitte Access Economics andIpsosPublicAffairsAustraliaconductedaresearchsurvey of over 1,500 Australian and international residents. This research across a statistically significantrangeofpeoplecoveredsimpletopicslikeunderstanding the details of people’s travel to the GBR, all the way to conceptually understanding how people think and feel about the GBR. It is important to note that this analysis is completed independent of the economic contribution analysis to avoid an overlap of the respective concepts.
Second, the significance of the GBR from the perspective of Aboriginal and Torres Strait Islander Traditional Owners is considered. The connection of Traditional Owners to the GBR spans over 60,000 years and its natural features of are deeply embedded in Indigenous culture, spirituality andwisdom.Whilethisvalueisnotquantified,itssignificanceandqualitativevalueisdemonstrated.
Third, the value of the GBR’s brand to Australia and the international community is evaluated. Again, while not monetised, the power of the GBR and its significancetoBrandAustraliaisassessedagainst fourpillars–Differentiation,Relevance,Esteem and Knowledge.
Introduction1
09
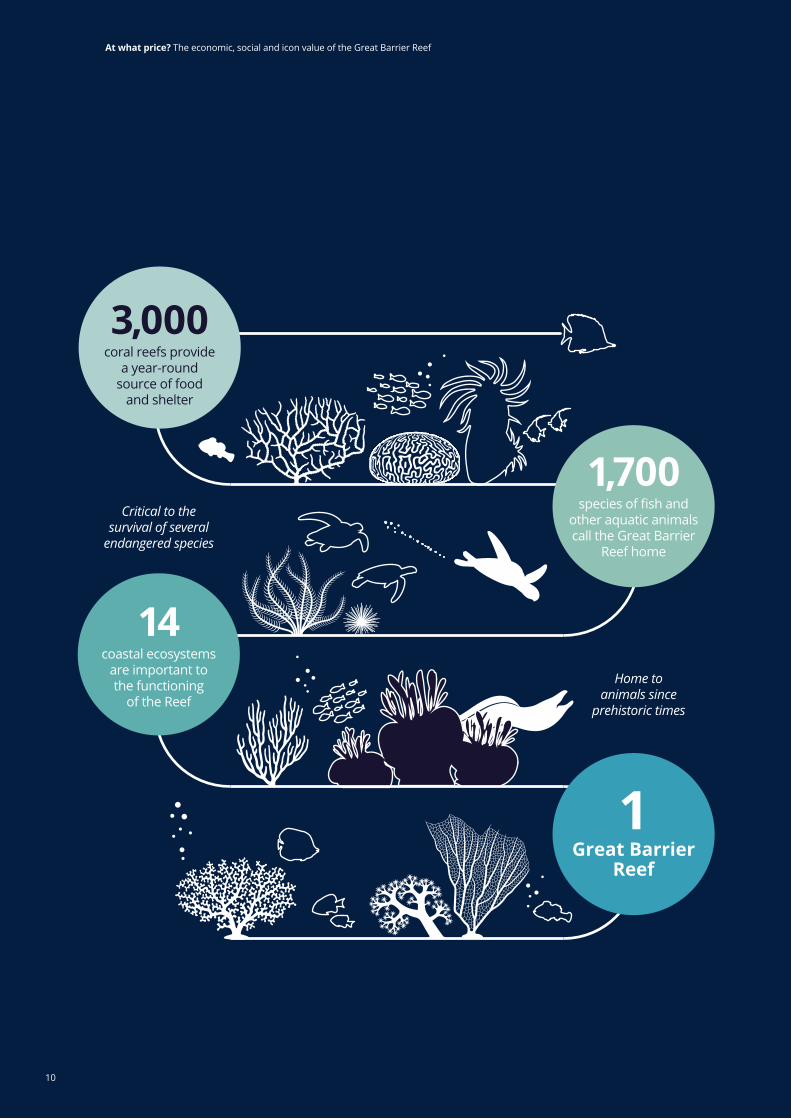
1,700species of fish and
other aquatic animals call the Great Barrier
Reef home
Home to animals since
prehistoric times
Critical to the survival of several
endangered species
3,000coral reefs provide
a year-round source of food
and shelter
1Great Barrier
Reef
14coastal ecosystems
are important to the functioning
of the Reef
10
At what price? The economic, social and icon value of the Great Barrier Reef
At what price? | Introduction
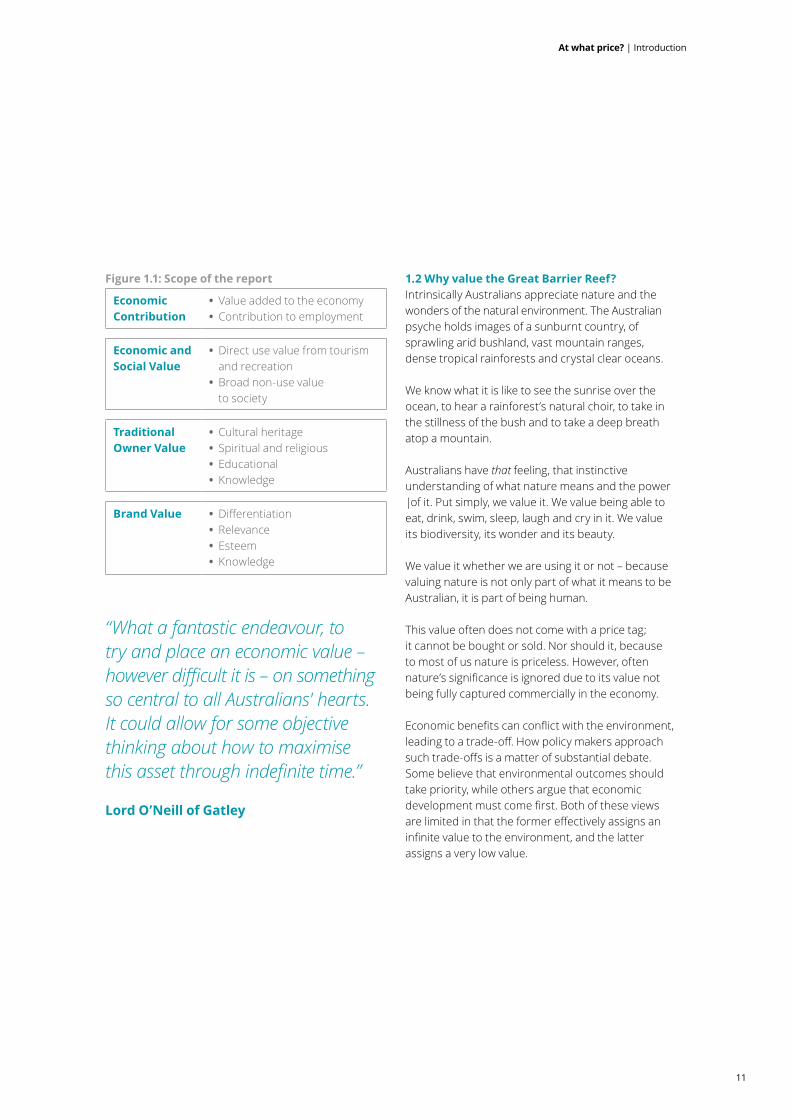
Figure 1.1: Scope of the report
Economic Contribution
• Value added to the economy • Contribution to employment
Economic and Social Value
• Direct use value from tourism and recreation
• Broad non-use value to society
Traditional Owner Value
• Cultural heritage • Spiritual and religious • Educational • Knowledge
Brand Value • Differentiation • Relevance • Esteem • Knowledge
1.2 Why value the Great Barrier Reef?Intrinsically Australians appreciate nature and the wonders of the natural environment. The Australian psyche holds images of a sunburnt country, of sprawling arid bushland, vast mountain ranges, dense tropical rainforests and crystal clear oceans.
We know what it is like to see the sunrise over the ocean, to hear a rainforest’s natural choir, to take in the stillness of the bush and to take a deep breath atop a mountain.
Australians have that feeling, that instinctive understanding of what nature means and the power |of it. Put simply, we value it. We value being able to eat, drink, swim, sleep, laugh and cry in it. We value its biodiversity, its wonder and its beauty.
Wevalueitwhetherweareusingitornot –becausevaluing nature is not only part of what it means to be Australian,itispartofbeing human.
This value often does not come with a price tag; it cannot be bought or sold. Nor should it, because to most of us nature is priceless. However, often nature’ssignificanceisignoredduetoitsvaluenotbeing fully captured commercially in the economy.
Economicbenefitscanconflictwiththeenvironment,leadingtoatrade-off.Howpolicymakersapproachsuchtrade-offsisamatterofsubstantialdebate.Some believe that environmental outcomes should take priority, while others argue that economic developmentmustcomefirst.Bothoftheseviews arelimitedinthattheformereffectivelyassignsaninfinitevaluetotheenvironment,andthelatter assigns a very low value.
“What a fantastic endeavour, to try and place an economic value – however difficult it is – on something so central to all Australians' hearts. It could allow for some objective thinking about how to maximise this asset through indefinite time.”
Lord O’Neill of Gatley
11

Public policy and the Great Barrier Reef
The GBR is a complex natural structure that supports a number of interlinked ecosystems. Currently, the health and functionality of these ecosystems are under severe pressure from threats such as climate change, land-based run-off, coastal development and Illegal fishing.
The Commonwealth and Queensland governments have implemented various policies to mitigate the impacts of local threats and build resilience against pressures.
In 1975, the Commonwealth government enacted the Great Barrier Reef Marine Park Act 1975, the primary act used to create an exclusive protection zone and marine authority to prevent damaging activities. Currently, this legislation works in
conjunction with Queensland’s Marine Parks Act 2004 and Coastal Protection and Management Act 1995 to enforce Commonwealth zoning and monitoring efforts.
Since 2009, the GBRMPA release an Outlook Report every five years to assesses the effectiveness of their ongoing commitment to build GBR resilience through localised threat mitigation.
In 2015, the Commonwealth and Queensland government developed the Reef 2050 Long-term Sustainability Plan to establish greater coordination between stakeholders to ensure the long-term sustainability of the GBR.
Identifying, measuring and reporting on the total valueofnaturetoaneconomygivesitasignificance in decision making and provides a middle ground. Valuingnatureinmonetarytermscaneffectivelyinformpolicy settings and help industry, government, the scientificcommunityandthewiderpublicunderstandthe contribution of the environment to the economy and society.
At a time when the global natural environment is under threat from the pressures of humankind, particularly climate change, it has never been more important to understand the value of nature.
When looking to our own Australian backyard, the case for putting an economic value on nature has never been stronger, especially when considering the GBR.
CapturingandquantifyingtheroletheGBRplayseconomically, socially and culturally, is to capture and quantifythevalueofanAustralianiconandoneoftheseven natural wonders of the world.
We know this value to be priceless and we know that there is only one GBR. But we also know the threats to the GBR demand that the total value Australians and the international community place on it be understood in the most appropriate way possible.
That is why Deloitte Access Economics, commissioned by the Great Barrier Reef Foundation, with the support of the National Australia Bank, Great Barrier Reef Marine Park Authority, and the community of people and organisations that work on and for the GBR, has estimated the total economic and social value ofthe GBR.
At what price? The economic, social and icon value of the Great Barrier Reef
12
Not for sale
Valuing the GBR is useful for raising public awareness of its importance to our economy, society and environment. It can also assist in policy and planning discussions. In fact, we implicitly value the Reef and other environmental assets as we make a range of economic, business and policy decisions.
ValuingtheGBR’sbenefitstosocietyisnotto implyitiscommodifiedorshouldbeprivatised.Because it is a public good, it would not be better protected in a private market environment. Valuation is about the GBR’s relative contribution to our wellbeing; like air or food, it is something uponwhichlife depends.
The economic and social value at the heart of thisreportissimilarinobjective,butdifferentinmethodology,totheemergingscientificdisciplineof ecosystem services. Where ecosystem services try to objectively measure coral reef services people may not even be aware of, such as storm protection, this report is based on direct uses of the GBR (such as recreation and tourism) and the non-use value, which is driven by a willingness to pay approach.
It’s about perceptions of value and is bounded by income. Another important feature of our approach is that it is Australian, not global. It is a highly relevant estimate of how we, as Australians, value the GBR and, in a policy context, what we are willing to do about it.
Source: Deloitte Access Economics; Costanza et al (2014).
1.3 Report structureThe report is structured as follows: • Chapter 2 presents the annual direct and indirect economic contribution of the GBR
• Chapter 3 capturesandquantifiesthebroadeconomic, social and icon value of the GBR to society
• Chapter 4considersthesignificantvalueofthe GBR to Traditional Aboriginal and Torres Strait Islander Owners
• Chapter 5 evaluates the brand value of the GBR to Australia
• Chapter 6 brings it all together, highlighting the criticalimportanceoftheGBRto Australia.
In determining the total economic and social value of the Great Barrier Reef, the report is not an evaluation of any particular policy setting, a funding needs assessment, and it is not the basis of any project business case.
13
At what price? | Introduction
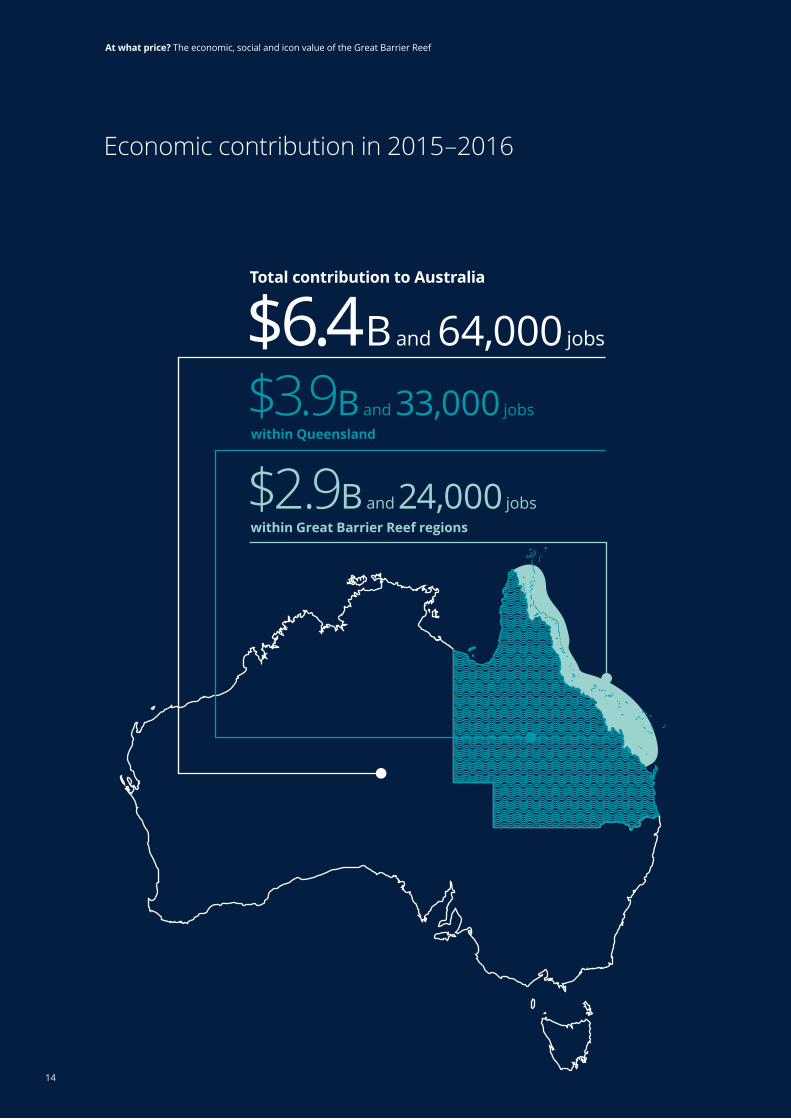
Economic contribution in 2015–2016
Total contribution to Australia
$6.4B and 64,000 jobs
$2.9B and 24,000 jobs within Great Barrier Reef regions
$3.9B and 33,000 jobs within Queensland
14
At what price? The economic, social and icon value of the Great Barrier Reef
Economic contribution 2
The Great Barrier Reef contributed $6.4 billion in value added and over 64,000 jobs to the Australian economy in 2015–16.
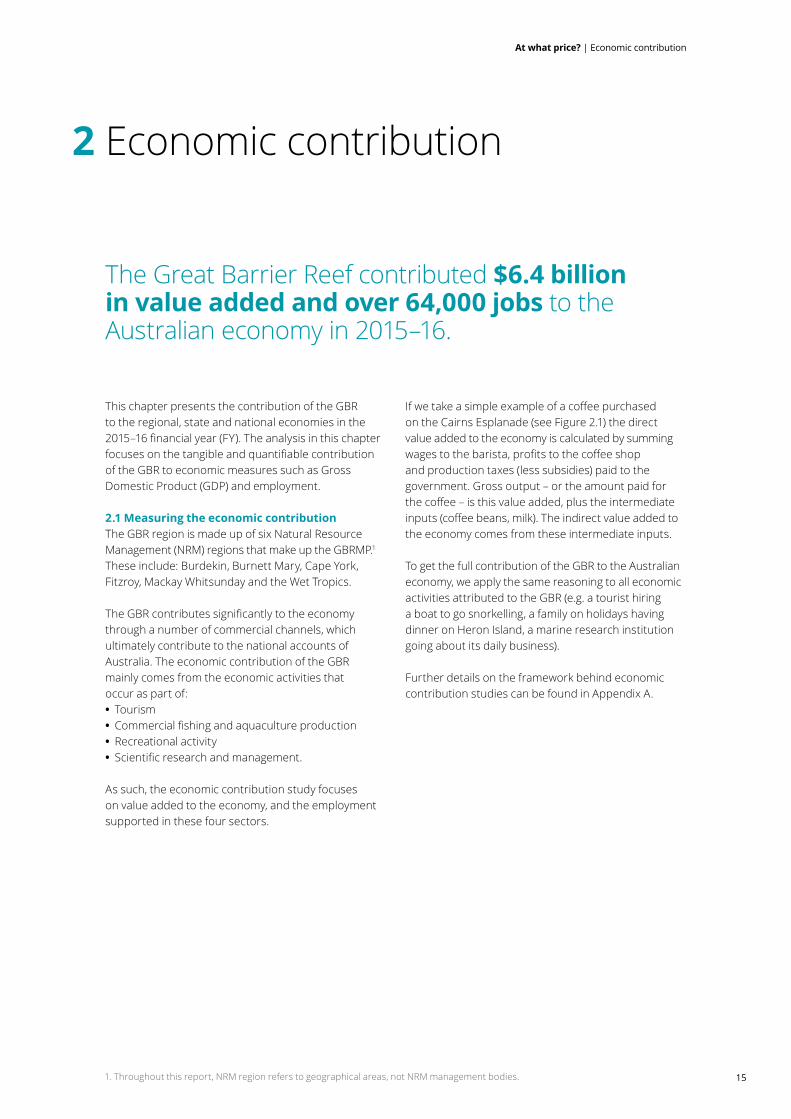
This chapter presents the contribution of the GBR to the regional, state and national economies in the 2015–16financialyear(FY).Theanalysisinthischapterfocusesonthetangibleandquantifiablecontributionof the GBR to economic measures such as Gross Domestic Product (GDP) and employment.
2.1 Measuring the economic contributionThe GBR region is made up of six Natural Resource Management (NRM) regions that make up the GBRMP.1 Theseinclude:Burdekin,BurnettMary,CapeYork,Fitzroy, Mackay Whitsunday and the Wet Tropics.
TheGBRcontributessignificantlytotheeconomythrough a number of commercial channels, which ultimately contribute to the national accounts of Australia. The economic contribution of the GBR mainly comes from the economic activities that occuraspart of: • Tourism • Commercialfishingandaquacultureproduction • Recreational activity • Scientificresearchandmanagement.
As such, the economic contribution study focuses on value added to the economy, and the employment supported in these four sectors.
IfwetakeasimpleexampleofacoffeepurchasedontheCairnsEsplanade(seeFigure 2.1)thedirectvalue added to the economy is calculated by summing wagestothebarista,profitstothecoffeeshopand production taxes (less subsidies) paid to the government. Gross output – or the amount paid for thecoffee–isthisvalueadded,plustheintermediateinputs(coffeebeans,milk).Theindirectvalueaddedtotheeconomycomesfromtheseintermediate inputs.
To get the full contribution of the GBR to the Australian economy, we apply the same reasoning to all economic activities attributed to the GBR (e.g. a tourist hiring a boat to go snorkelling, a family on holidays having dinner on Heron Island, a marine research institution going about its daily business).
Further details on the framework behind economic contribution studies can be found in Appendix A.
1. Throughout this report, NRM region refers to geographical areas, not NRM management bodies. 15
At what price? | Economic contribution

Muchliketheexampleabove,theGBRcontributestofulltimeequivalent(FTE)employmentdirectlyandindirectly.Direct employment through activities such as tourism, which also contributes indirect employment to cafés throughtheincreaseindemandthattourismgenerates.Thedefinitionsusedtodescribethedifferentcontributionthe GBR has to employment are detailed in Table 2.1.
Table 2.1: Types of employment contributions
Job type Definition
Full time equivalent (FTE) Employment of approximately 40 hours per week
Direct FTE Direct industry related FTEs
Indirect FTE Flow on FTEs from direct FTEs
Total FTE Direct and indirect
Figure 2.1: Economic activity accounting framework – making a cup of coffee
Value added
Intermediate inputsThe coffee beans
WagesTo the Barista
ProfitsFor the café
Production taxes (less subsidies)
To the government
Gross output – Value of a coffee
At what price? The economic, social and icon value of the Great Barrier Reef
16
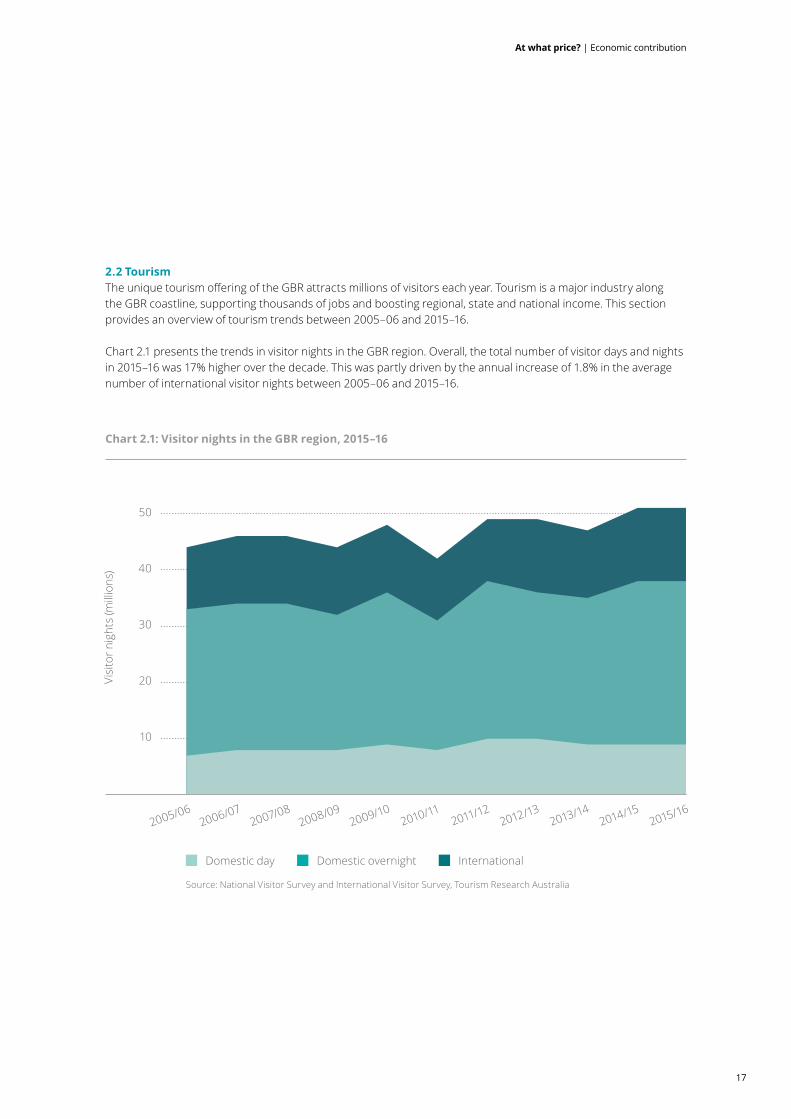
Chart 2.1: Visitor nights in the GBR region, 2015–16
Source: National Visitor Survey and lnternational Visitor Survey, Tourism Research Australia
0
10
20
30
40
50
60
Domestic day Domestic overnight International
50
40
30
20
10
2005/062006/07
2007/082008/09
2009/102010/11
2011/122012/13
2013/142014/15
2015/16
Visi
tor n
ight
s (m
illio
ns)
2.2 TourismTheuniquetourismofferingoftheGBRattractsmillionsofvisitorseachyear.Tourismisamajorindustryalongthe GBR coastline, supporting thousands of jobs and boosting regional, state and national income. This section provides an overview of tourism trends between 2005–06 and 2015–16.
Chart 2.1 presents the trends in visitor nights in the GBR region. Overall, the total number of visitor days and nights in 2015–16 was 17% higher over the decade. This was partly driven by the annual increase of 1.8% in the average number of international visitor nights between 2005–06 and 2015–16.
17
At what price? | Economic contribution
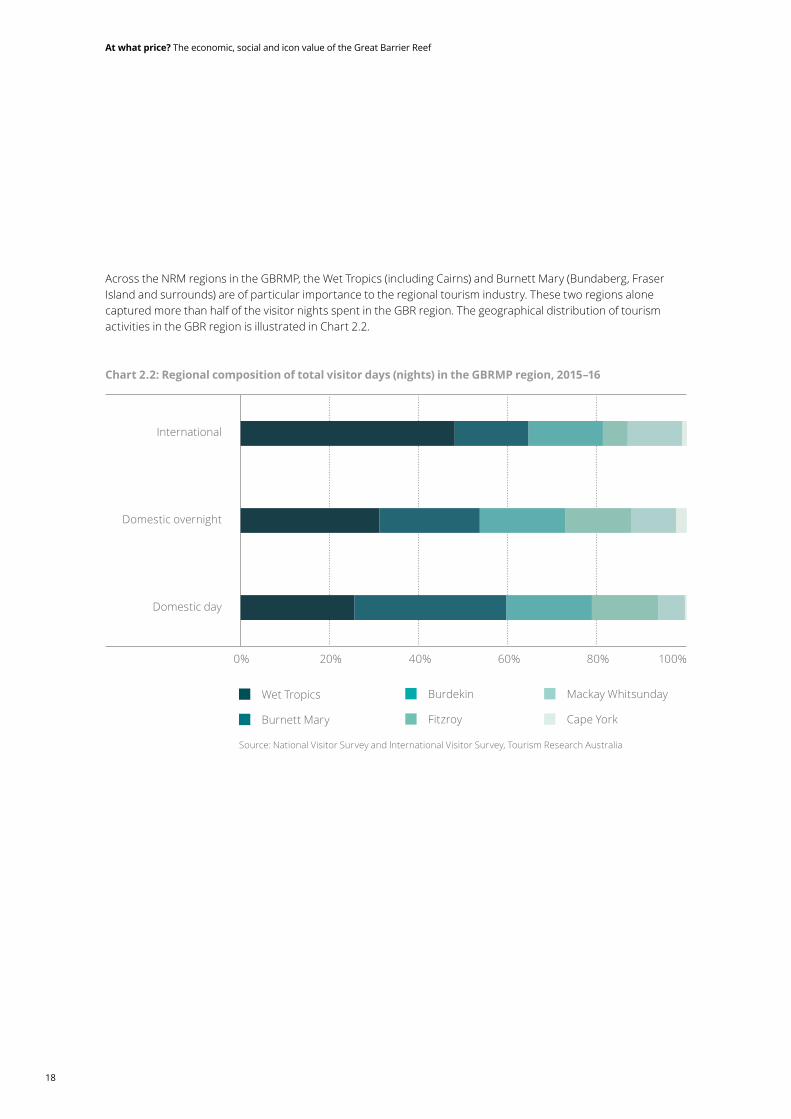
Across the NRM regions in the GBRMP, the Wet Tropics (including Cairns) and Burnett Mary (Bundaberg, Fraser Island and surrounds) are of particular importance to the regional tourism industry. These two regions alone captured more than half of the visitor nights spent in the GBR region. The geographical distribution of tourism activitiesintheGBRregionisillustratedinChart 2.2.
Chart 2.2: Regional composition of total visitor days (nights) in the GBRMP region, 2015–16
Source: National Visitor Survey and lnternational Visitor Survey, Tourism Research Australia
International
Domestic overnight
Domestic day
Wet Tropics
Burnett Mary
0% 20% 40% 60% 80% 100%
Burdekin
Fitzroy
Mackay Whitsunday
CapeYork
At what price? The economic, social and icon value of the Great Barrier Reef
18
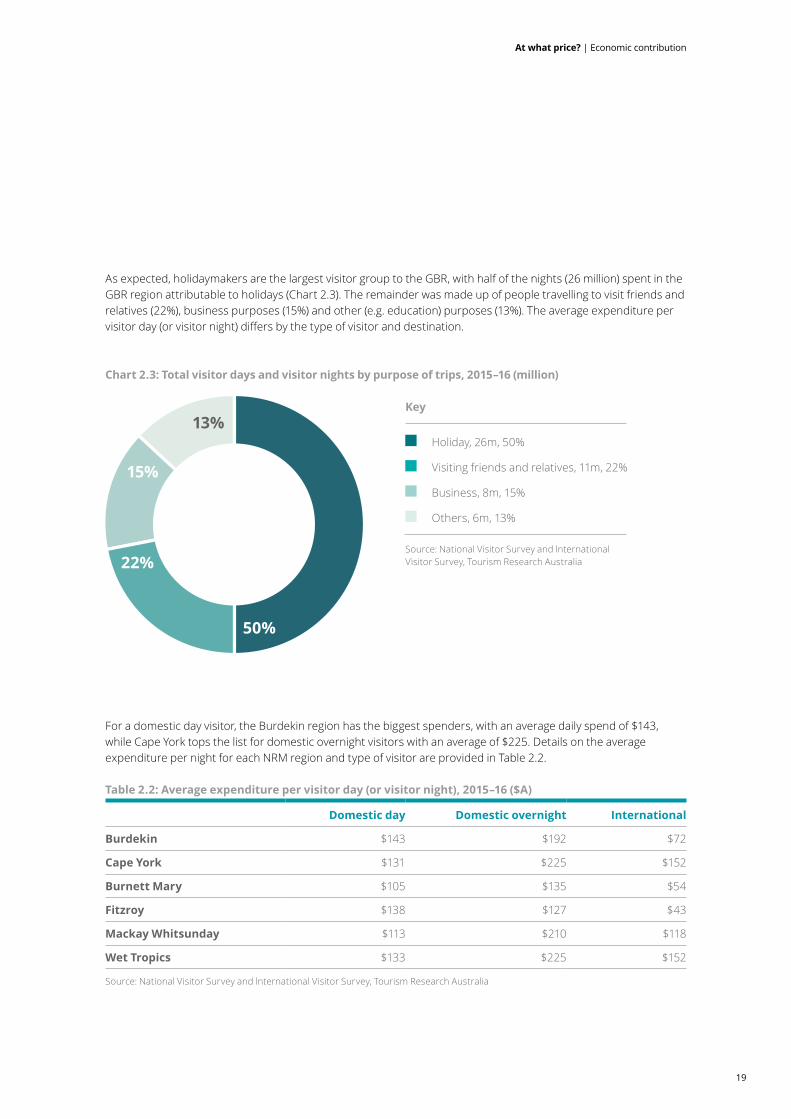
As expected, holidaymakers are the largest visitor group to the GBR, with half of the nights (26 million) spent in the GBR region attributable to holidays (Chart 2.3). The remainder was made up of people travelling to visit friends and relatives (22%), business purposes (15%) and other (e.g. education) purposes (13%). The average expenditure per visitorday(orvisitornight)differsbythetypeofvisitoranddestination.
Chart 2.3: Total visitor days and visitor nights by purpose of trips, 2015–16 (million)
Source: National Visitor Survey and lnternational Visitor Survey, Tourism Research Australia
Key
Holiday, 26m, 50%
Visiting friends and relatives, 11m, 22%
Business, 8m, 15%
Others, 6m, 13%
50%
22%
15%
13%
For a domestic day visitor, the Burdekin region has the biggest spenders, with an average daily spend of $143, whileCapeYorktopsthelistfordomesticovernightvisitorswithanaverageof$225.Detailsontheaverageexpenditure per night for each NRM region and type of visitor are provided in Table 2.2.
Table 2.2: Average expenditure per visitor day (or visitor night), 2015–16 ($A)
Domestic day Domestic overnight International
Burdekin $143 $192 $72
Cape York $131 $225 $152
Burnett Mary $105 $135 $54
Fitzroy $138 $127 $43
Mackay Whitsunday $113 $210 $118
Wet Tropics $133 $225 $152
Source: National Visitor Survey and lnternational Visitor Survey, Tourism Research Australia
19
At what price? | Economic contribution
Source: Department of Agriculture and Fisheries. Note:ContributionofCapeYork,Fitzroy,andMackayWhitsunday are under-represented due to the unavailability of data.
Key
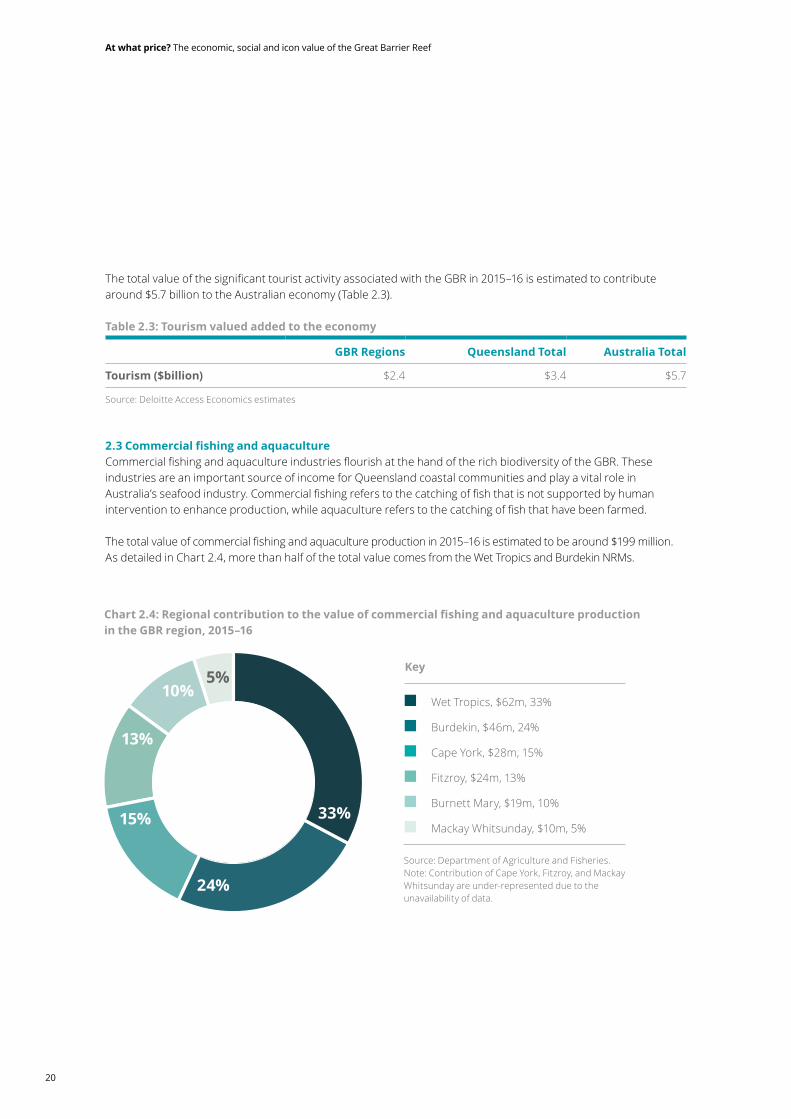
Chart 2.4: Regional contribution to the value of commercial fishing and aquaculture production in the GBR region, 2015–16
Wet Tropics, $62m, 33%
Burdekin, $46m, 24%
CapeYork,$28m,15%
Fitzroy, $24m, 13%
Burnett Mary, $19m, 10%
Mackay Whitsunday, $10m, 5%33%
24%
15%
13%
10%5%
ThetotalvalueofthesignificanttouristactivityassociatedwiththeGBRin2015–16isestimatedtocontributearound $5.7 billion to the Australian economy (Table 2.3).
Table 2.3: Tourism valued added to the economy
GBR Regions Queensland Total Australia Total
Tourism ($billion) $2.4 $3.4 $5.7
Source: Deloitte Access Economics estimates
2.3 Commercial fishing and aquacultureCommercialfishingandaquacultureindustriesflourishatthehandoftherichbiodiversityoftheGBR.Theseindustries are an important source of income for Queensland coastal communities and play a vital role in Australia’sseafoodindustry.Commercialfishingreferstothecatchingoffishthatisnotsupportedbyhumaninterventiontoenhanceproduction,whileaquaculturereferstothecatchingoffishthathavebeenfarmed.
Thetotalvalueofcommercialfishingandaquacultureproductionin2015–16isestimatedtobearound$199million.AsdetailedinChart 2.4,morethanhalfofthetotalvaluecomesfromtheWetTropicsandBurdekinNRMs.
At what price? The economic, social and icon value of the Great Barrier Reef
20

Table2.4demonstratesthatline,net,pot,andtrawlismostpopularcommercialfishingmethodintheGBRregion.Thesefisheries,togetherwithaquaculture,accountfor95%ofthetotalvalueofcommercialfishingandaquacultureproductionintheGBRregion.
Table 2.4: The value of commercial fishing and aquaculture production by NRM regions, 2015–16
($million) BurdekinBurnett
MaryCape York Fitzroy
Mackay Whitsunday
Wet Tropics Total
Line, net, pot, and trawl
$16 $12 $23 $22 $10 $13 $95
Harvest $0 $0 $5 $2 $0 $0 $9
Aquaculture $30 $6 ND ND ND $49 $95
Total $46 $19 $28 $24 $10 $62 $199
Source: Department of Agriculture and Fisheries Note:ThevalueofaquacultureproductioninCapeYork,Fitzroy,andMackayWhitsundayisnotprovidedduetoconfidentialityreasons.Numbers may not add up due to rounding error.
ThetotalvalueofcommercialfishingandaquacultureassociatedwiththeGBRin2015–16isestimatedtocontributearound $162 million to the Australian economy (Table 2.5).
Table 2.5: Commercial fishing and aquaculture valued added to the economy
GBR Regions Queensland Total Australia Total
Fishing ($million) $139 $140 $162
Source: Deloitte Access Economics estimates
21
At what price? | Economic contribution

2.4 Recreational activitiesMany of the residents that live in the GBR region use the GBR for recreational activities such as visiting an island, snorkelling,diving,sailing,boatingandfishing.TheeconomiccontributionoftheGBRtorecreationiscapturedbythe expenditure on these types of recreational activities in the GBR region.
For each type of recreational activity, total expenditure is broken down into expenditure on recreational equipmentandotherpersonalexpenses.Recreationalequipmentexpenditureincludesthepurchase,registration,insurance,hireandrepairofboats,fishingequipment,andwatersportsequipment.Recreationalequipmentamounts to over half of the total amount of recreation expenditure.
A detailed breakdown of the total recreational expenditure by NRM regions and types of expenditure is provided inTable2.6.Ofthefourrecreationalactivities,recreationalfishingisthemostpopularwithanestimated3.8millionfishingtripstakingplacein2015–16,theexpendituregeneratedfromrecreationalfishingactivitiesamountsto$70 million.
Table 2.6: Recreational expenditure on the GBR region by types of expenditure, 2015–16
By NRM ($million) Equipment
Other personal expenses
TotalFishing Boating SailingVisiting
an island
Burdekin $57 $17 $6 $4 $22 $106
Burnett Mary $65 $19 $7 $4 $11 $107
Cape York $2 $1 $0 $0 $1 $4
Fitzroy $38 $11 $4 $2 $7 $63
Mackay Whitsunday $26 $7 $3 $2 $5 $42
Wet Tropics $53 $15 $6 $3 $17 $94
Total $241 $70 $26 $15 $62 $415
Source: Deloitte Access Economics estimates
At what price? The economic, social and icon value of the Great Barrier Reef
22

Source: Deloitte Access Economics estimates
Key
Chart 2.5: Recreation expenditure by industries, 2015–16 ($m)
Retail Trade, $241m, 58%
Ships and Boat Manufacturing, $114m, 28%
Road Transport, $35m, 8%
Insurance and Superannuation Funds, $13m, 3%
Rental and Hiring Services (except Real Estate), $11m, 3%
58%
28%
8%
3%3%
Expenditureonrecreationalactivitiescanbebrokendownintofiveindustries.AsshowninChart2.5, the majority of recreational expenditure is attributable to retail trade.
The total value of this recreational activity associated with the GBR in 2015–16 is estimated to contribute around $346 million to the Australian economy (Table 2.7).
Table 2.7: Recreational activity valued added to the economy
GBR Regions Queensland Total Australia Total
Recreation ($million) $284 $296 $346
Source: Deloitte Access Economics estimates
23
At what price? | Economic contribution

2.5 Scientific research and reef managementAs the largest living structure on the planet with one of the greatest diversity of species and habitats, the GBR has attracted a large number of researchers who work out of six research stations along the length of the Great Barrier Reef. In the eyes of many, it is the best-studied tropical marine ecosystem in the world.DespitetheimportanceoftheGBRtoscientificresearch, information on the research conducted in the GBR region is often not available.
Giventhelimiteddata,fiveresearchandreef-relatedorganisations that have carried out extensive research on the GBR have been selected, including: • Great Barrier Reef Foundation • Australian Institute of Marine Science (AIMS) • Great Barrier Reef Marine Park Authority • JCU ARC Centre of Excellence • Lizard Island Reef Research Foundation.
These research institutions focus on the GBR’s complex ecosystem. A network of six island research stations at Lizard Island, Low Isles, Green Island, Orpheus Island, HeronIslandandOneTreeIslandworkwiththesefiveresearch organisations to understand the mysteries of the Reef and work to reduce the pressures that threaten it. This research is not only valuable to science, but to the economy.
In 2015–16, $130 million of revenue was generated by theseorganisationsthroughtheconductofscientificresearch, reef management, and related activities. They spent $57 million and $65 million on employment and intermediate inputs respectively.
Thetotalvalueofthescientificresearchandreefmanagement associated with the GBR in 2015–16 is estimatedtocontributearound$182 milliontotheAustralian economy (Table 2.8).
Table 2.8: Scientific research and reef management activity valued added to the economy
GBR Regions Queensland Total Australia Total
Scientific research ($million) $155 $161 $182
Source: Deloitte Access Economics estimates
At what price? The economic, social and icon value of the Great Barrier Reef
24

Heron Island Research Station
Associate Professor Sophie Dove and Professor Ove Hoegh-Guldberg have led teams of researchers at Heron Island Research station (HIRS) on the southern Great Barrier Reef who have explored the question of how reefs are likely to change if we do or do not respond to climate change. To do this, they have devised a series of experimental facilities that expose coral communities to future ocean temperatures and carbon dioxide levels over long periods. These studies have been instrumental in understanding how the ecosystem services provided by coral reefs are likely to change under future ocean warming and acidification.
Most importantly, these experiments show taking action on climate change reduces the loss of coral reefs and has many benefits for the GBR and its dependent people and industries. These types of scientific experiment, in combination with field studies, have built a strong case for action on climate change.
Source: Dove et al., 2013; Attenborough’s Reef 2015
Current state
Change nothing scenario
Take action scenario
25
At what price? | Economic contribution
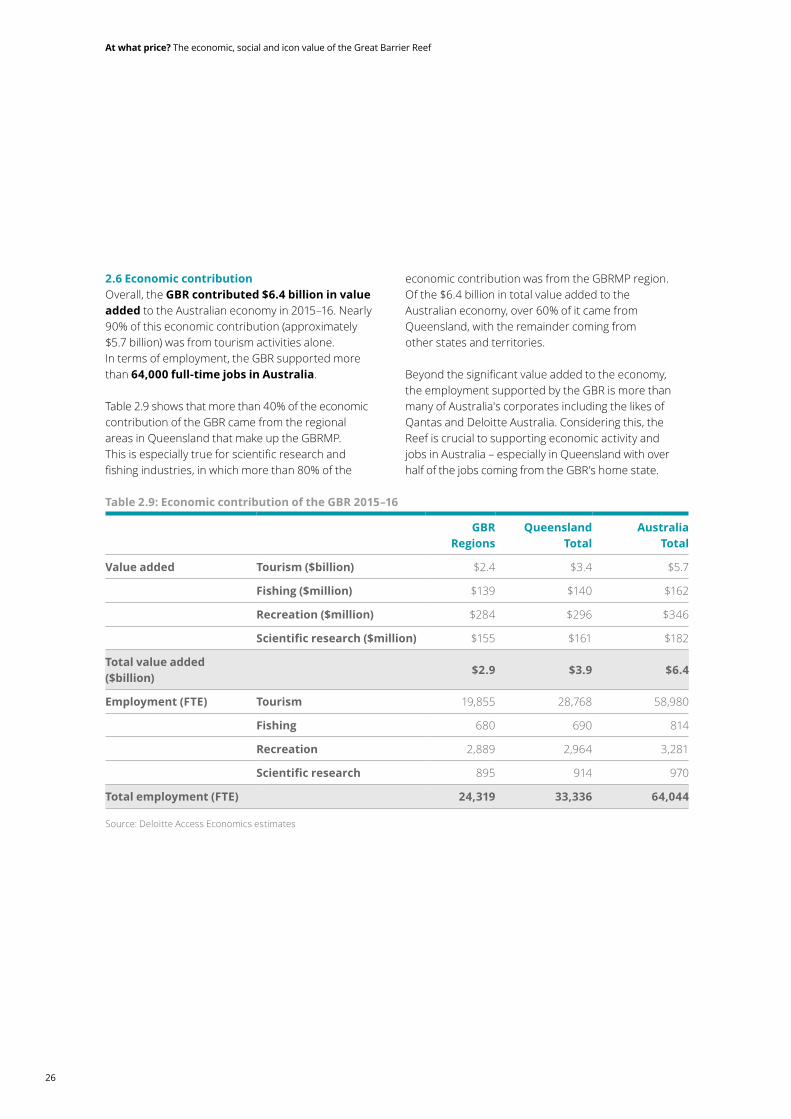
2.6 Economic contributionOverall, the GBR contributed $6.4 billion in value added to the Australian economy in 2015–16. Nearly 90% of this economic contribution (approximately $5.7 billion)wasfromtourismactivitiesalone. In terms of employment, the GBR supported more than 64,000 full-time jobs in Australia.
Table 2.9 shows that more than 40% of the economic contribution of the GBR came from the regional areas in Queensland that make up the GBRMP. Thisisespeciallytrueforscientificresearchand fishingindustries,inwhichmorethan80%ofthe
economic contribution was from the GBRMP region. Ofthe$6.4 billionintotalvalueaddedtothe Australian economy, over 60% of it came from Queensland, with the remainder coming from otherstatesand territories.
Beyondthesignificantvalueaddedtotheeconomy, the employment supported by the GBR is more than many of Australia's corporates including the likes of Qantas and Deloitte Australia. Considering this, the Reef is crucial to supporting economic activity and jobs in Australia – especially in Queensland with over half of the jobs coming from the GBR’s home state.
Table 2.9: Economic contribution of the GBR 2015–16
GBR Regions
Queensland Total
Australia Total
Value added Tourism ($billion) $2.4 $3.4 $5.7
Fishing ($million) $139 $140 $162
Recreation ($million) $284 $296 $346
Scientific research ($million) $155 $161 $182
Total value added ($billion)
$2.9 $3.9 $6.4
Employment (FTE) Tourism 19,855 28,768 58,980
Fishing 680 690 814
Recreation 2,889 2,964 3,281
Scientific research 895 914 970
Total employment (FTE) 24,319 33,336 64,044
Source: Deloitte Access Economics estimates
At what price? The economic, social and icon value of the Great Barrier Reef
26
While the estimated value added is higher than the 2013 study, ($5.7 billion for 2012), the number of jobs supported by the GBR has fallen from 69,000 FTE in 2012 to 64,000 FTE in 2016. This slightly reduced jobsfigureisaresultofupdatedAustralianBureauofStatistics (ABS) Input-Output tables in 2013–14 that are used to model the economic contribution of the GBR. The 2013–14 tables indicate a lower average industry estimate of employment per million dollars. As such, for every million dollar of value added in the economy, there are less jobs. As a result, estimates of the total employment supported by the GBR have fallen relative to the 2013 report. It is important to notethatthischangeisnotareflectionofsignificantjoblosses,ratheritreflectsatechnicaladjustmentand underlying shifts in the overall structure of the Australian economy.
Further details regarding the economic contribution can be found in Appendix B.
27
At what price? | Economic contribution

$56B
0 20 40 60 80 100
Total economic, social and icon value to Australia
Total non-use value to Australians is
$24B
Total direct use benefit to domestic tourists is
$29B
Total direct use benefit to
recreational visitors is
$3B
28
At what price? The economic, social and icon value of the Great Barrier Reef

Economic, social and icon value 3
The Great Barrier Reef’s economic, social and icon value to Australia is $56 billion.
Thischaptercapturesandquantifiesthesocialandeconomic value of the GBR to Australians. For a range of reasons, the annual GDP contribution of the GBR presented in the previous chapter does not entirely reflecttheGBR’stotalcontributiontothewelfare of society.
Consider the price paid for a holiday to the GBR. Avisitormayhavepaid$1,000toflytoHamiltonIsland, to relax on the beach and to go scuba diving. If the value and prices were higher, say $1,500, they might still be willing to pay more to make sure they canenjoyHamiltonIsland.That$500pricedifferencetheholidaymakeriswillingtopayisabenefittothembecause while they only paid $1,000, it was really worth $1,500.
When consumers’ value is above the market price, an economic contribution study will underestimate the value because it is never paid. Or in this case, when the price of a holiday to the GBR is less than what a tourist mightbewillingtopay,thevalueoftheGBR’sofferingis undervalued. This underestimated value is referred to as consumer surplus and comes from the GBR’s direct use through tourism and recreation.
The GBR also provides value to those who have not, or may not ever visit it and directly use it. This non-use value can be described as social, cultural or even iconic. This value represents the place of the GBR in Australian and international culture in a way that no existingmarketpricereflects.LeavingtheGBRforfuturegenerations to enjoy is an example of a ‘non-use’ that has value to people. The price of accommodation in the Whitsundaysisnotgoingtoreflectthiskindofvalue,and nor should it.
To capture sentiment such as this, we estimate the non-use value of the GBR using contingent valuation. Contingent valuation is a way to place a value on something that does not have a market price. The relevant literature on how best to determine the non-use value of a natural asset like the GBR is summarised in Appendix C.
Asdirectandnon-usevaluesclearlydiffertotheeconomiccontributionstudyinChapter 2,theresultsin these two chapters cannot be added together. Furthermore, the total economic, social and icon value of the GBR is presented as an asset or stock value. Assuch,itisnotanannualmeasurementthatflowsand changes, such as GDP or government budgets.
Importantly, the estimates in this chapter do not net out any costs to visitors, governments, industry, the environment or any other form of opportunity cost that may relate to the GBR. In this regard, the total economic, social and icon asset value is a gross benefitmeasure.Whilethevaluesinthischapterarenot calculated using market prices, and are therefore more abstract compared to the economic contribution results, they are no more or less real. However, like withalleconomictheory,thetruepoweroffigures is in their context.
$56B
0 20 40 60 80 100
29
At what price? | Economic, social and icon value
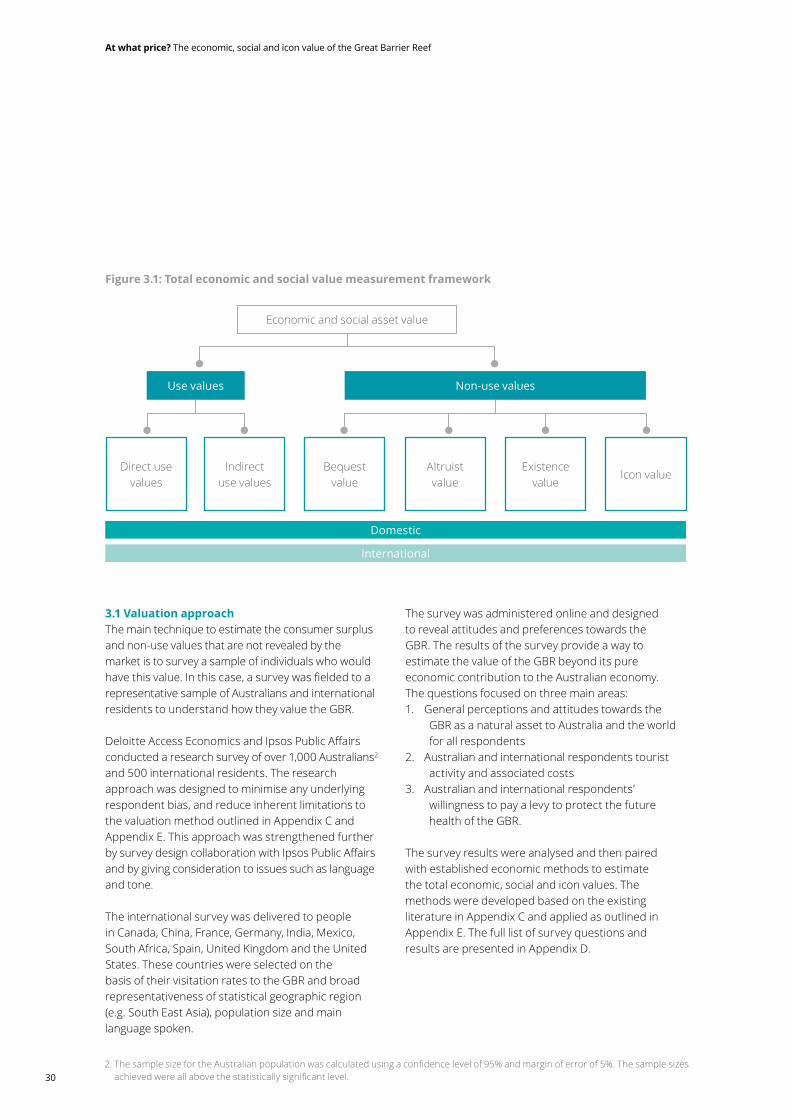
3.1 Valuation approach Themaintechniquetoestimatetheconsumersurplusand non-use values that are not revealed by the market is to survey a sample of individuals who would havethisvalue.Inthiscase,asurveywasfieldedtoarepresentative sample of Australians and international residents to understand how they value the GBR.
DeloitteAccessEconomicsandIpsosPublicAffairsconducted a research survey of over 1,000 Australians2 and 500 international residents. The research approach was designed to minimise any underlying respondent bias, and reduce inherent limitations to the valuation method outlined in Appendix C and Appendix E. This approach was strengthened further bysurveydesigncollaborationwithIpsosPublicAffairsand by giving consideration to issues such as language and tone.
The international survey was delivered to people in Canada, China, France, Germany, India, Mexico, South Africa, Spain, United Kingdom and the United States. These countries were selected on the basis of their visitation rates to the GBR and broad representativeness of statistical geographic region (e.g. South East Asia), population size and main language spoken.
The survey was administered online and designed to reveal attitudes and preferences towards the GBR. The results of the survey provide a way to estimate the value of the GBR beyond its pure economic contribution to the Australian economy. Thequestionsfocusedonthreemainareas:1. General perceptions and attitudes towards the
GBR as a natural asset to Australia and the world for all respondents
2. Australian and international respondents tourist activity and associated costs
3. Australian and international respondents’ willingness to pay a levy to protect the future health of the GBR.
The survey results were analysed and then paired with established economic methods to estimate the total economic, social and icon values. The methods were developed based on the existing literature in Appendix C and applied as outlined in AppendixE.Thefulllistofsurveyquestionsand results are presented in Appendix D.
2.ThesamplesizefortheAustralianpopulationwascalculatedusingaconfidencelevelof95%andmarginoferrorof5%.Thesamplesizesachievedwereallabovethestatisticallysignificantlevel.
Figure 3.1: Total economic and social value measurement framework
Economic and social asset value
Domestic
International
Use values
Direct use values
Bequestvalue
Existence value
Indirect use values
Altruist value
Icon value
Non-use values
At what price? The economic, social and icon value of the Great Barrier Reef
30
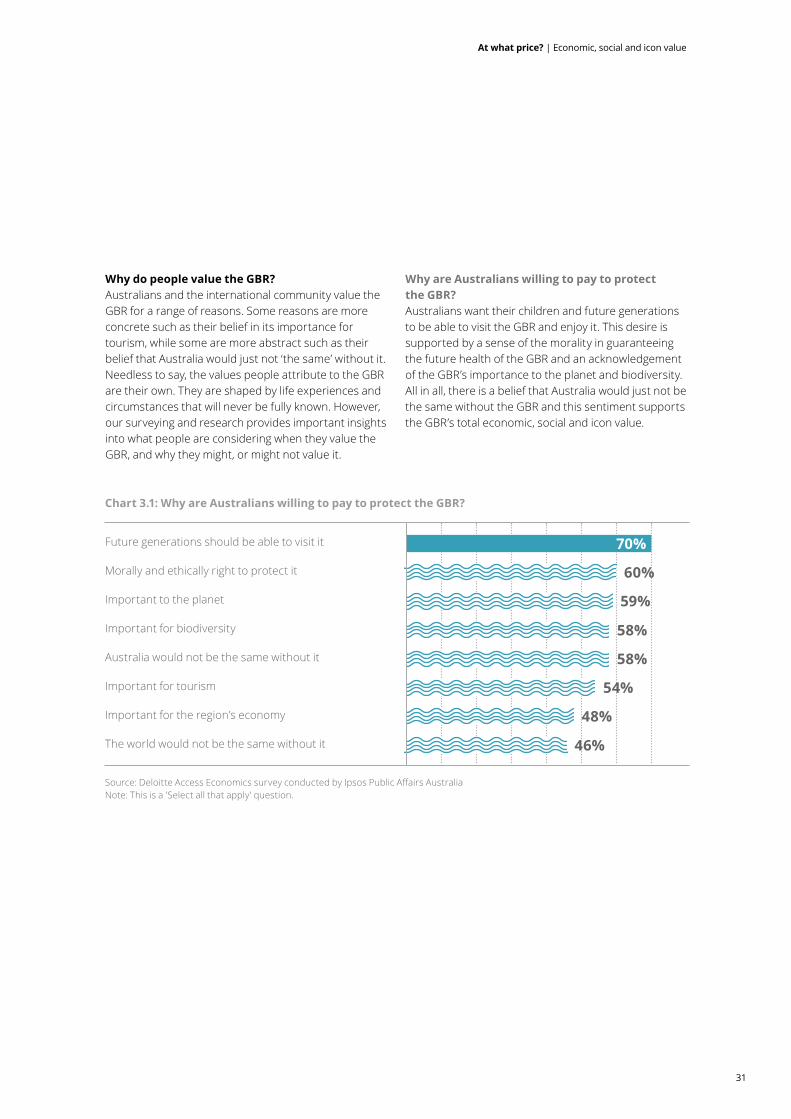
Why do people value the GBR? Australians and the international community value the GBR for a range of reasons. Some reasons are more concrete such as their belief in its importance for tourism, while some are more abstract such as their belief that Australia would just not ‘the same’ without it. Needless to say, the values people attribute to the GBR are their own. They are shaped by life experiences and circumstances that will never be fully known. However, our surveying and research provides important insights into what people are considering when they value the GBR, and why they might, or might not value it.
Why are Australians willing to pay to protect the GBR?Australians want their children and future generations to be able to visit the GBR and enjoy it. This desire is supported by a sense of the morality in guaranteeing the future health of the GBR and an acknowledgement of the GBR’s importance to the planet and biodiversity. All in all, there is a belief that Australia would just not be the same without the GBR and this sentiment supports the GBR’s total economic, social and icon value.
Chart 3.1: Why are Australians willing to pay to protect the GBR?
Source:DeloitteAccessEconomicssurveyconductedbyIpsosPublicAffairsAustralia Note:Thisisa'Selectallthatapply'question.
Future generations should be able to visit it
Morally and ethically right to protect it
Important to the planet
Important for biodiversity
Australia would not be the same without it
Important for tourism
Important for the region’s economy
The world would not be the same without it
70%
60%
59%
58%
58%
54%
48%
46%
31
At what price? | Economic, social and icon value
Source: Deloitte Access Economics survey conducted by Ipsos PublicAffairsAustralia
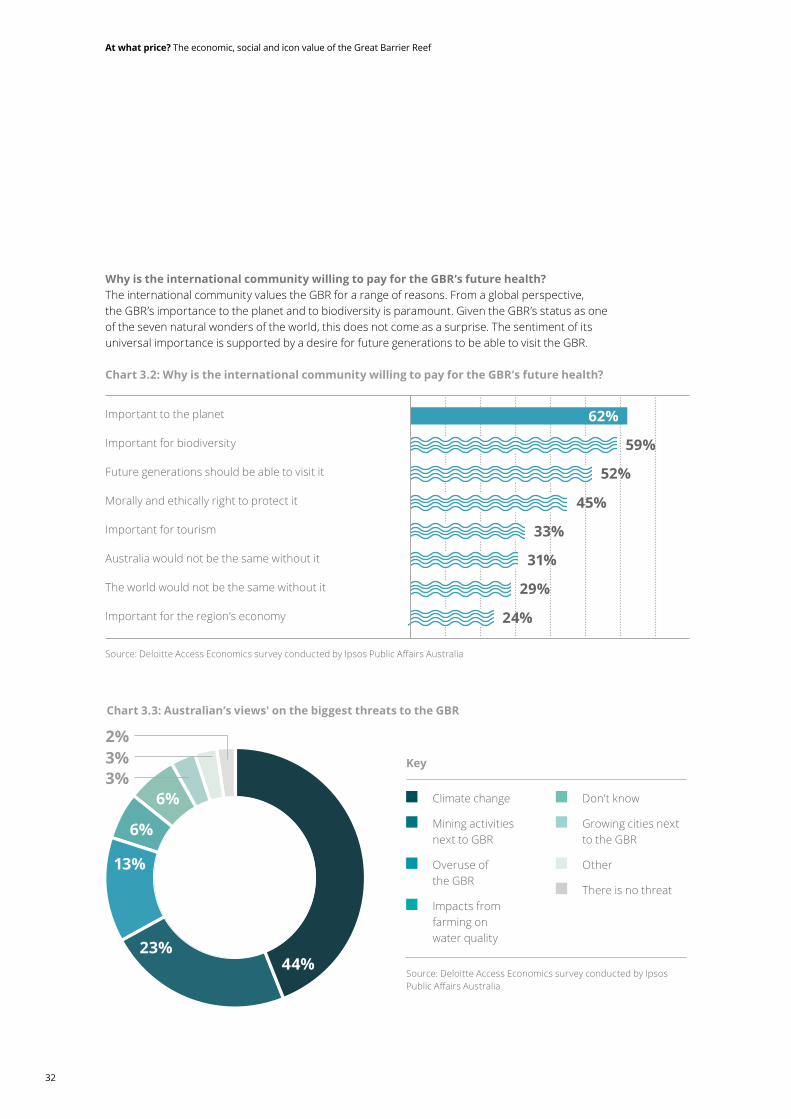
Chart 3.3: Australian’s views' on the biggest threats to the GBR
Key
Climate change
Mining activities next to GBR
Overuse of the GBR
Impacts from farming on waterquality
Don’t know
Growing cities next to the GBR
Other
There is no threat
44%23%
13%
6%
6%
3%2%
3%
Why is the international community willing to pay for the GBR’s future health?The international community values the GBR for a range of reasons. From a global perspective, the GBR’s importance to the planet and to biodiversity is paramount. Given the GBR’s status as one of the seven natural wonders of the world, this does not come as a surprise. The sentiment of its universal importance is supported by a desire for future generations to be able to visit the GBR.
Source:DeloitteAccessEconomicssurveyconductedbyIpsosPublicAffairsAustralia
Chart 3.2: Why is the international community willing to pay for the GBR’s future health?
Important to the planet
Important for biodiversity
Future generations should be able to visit it
Morally and ethically right to protect it
Important for tourism
Australia would not be the same without it
The world would not be the same without it
Important for the region’s economy
62%
59%
52%
45%
33%
31%
29%
24%
At what price? The economic, social and icon value of the Great Barrier Reef
32

Chart 3.4: International residents views' on the biggest threats to the GBR
Source: Deloitte Access Economics survey conducted by Ipsos PublicAffairsAustralia
Key
Climate change
Mining activities next to GBR
Overuse of the GBR
Impacts from farming on waterquality
Don’t know
Growing cities next to the GBR
Other
There is no threat
46%14%
13%
11%
10%
1%1%
4%
Why are people not willing to pay?
The 46% of Australians, and 37% of international respondents, who were not willing pay to protect theGBRindicatedtheysimplycouldnotaffordit.This reason was often accompanied by commentary around a desire to be able to pay for the GBR’s protection, but practical budgetary constraints or otherfinancialprioritiespreventedthem.Otherreasons, ranging between 10–25% of respondents, offeredforwhy they were not willing to pay included: • Belief that funding should come from another source
• Not enough information in their mind to decide on whether or not to pay
• Being prepared to pay for the GBR’s protection, but not in the form of a levy or charge
• International respondents indicated they felt only Australians should only pay.
A very small proportion of respondents, ranging between 2–3%, indicated that: • TheGBRwasnotpersonallyimportantto them • The GBR was not under threat in their mind • The GBR could not be protected regardless of any contribution.
Source: Deloitte Access Economics
33
At what price? | Economic, social and icon value
3.2 Non-use value
Our research shows that Australians and the internationalcommunityholdtheGBRinhigh esteem.
• 73% of Australians surveyed, and 56% of international respondents, said the GBR is the most iconic UNESCO World Heritage natural site.
• 93% of Australians, and 83% of international respondents, either strongly agree or agree that the GBR is an iconic Australian landmark that contributes to Australia’s national identity and international standing.
The way people value and perceive the GBR extends beyond consideration of its natural ecosystem. This value does not have a market price and understandably varies according to an individual’s circumstances and experiences. The non-use value of the GBR to an individual has been measured using a contingent valuation survey that elicits the willingness of individuals to pay for the GBR’s protection.
To ensure respondents had a realistic constraint in mind, the survey elicited what they would be willing to pay in a weekly ‘Great Barrier Reef Future Health Charge’ that all Australians would pay over the next 10 years. All respondents were made aware of what happens to the GBR if society ‘changes nothing’ from how it works today, or ‘takes action’ to limit the impacts of environmental pressures and threats to the GBR.
The ‘change nothing’ scenario stated the GBR is not protected and does not exist for future generations. The ‘take action’ scenario ensured protection and future existence. In each scenario the environmental pressuresandthreatswereunspecifiedtopreventovercomplication. In this sense, a respondent’s willingness to pay is contingent on a scenario and making a clear trade-off.AppendixEdetailsthemethodappliedtocalculatetheaveragewillingnesstopayfigurefor both Australian and international respondents from thistrade-off.
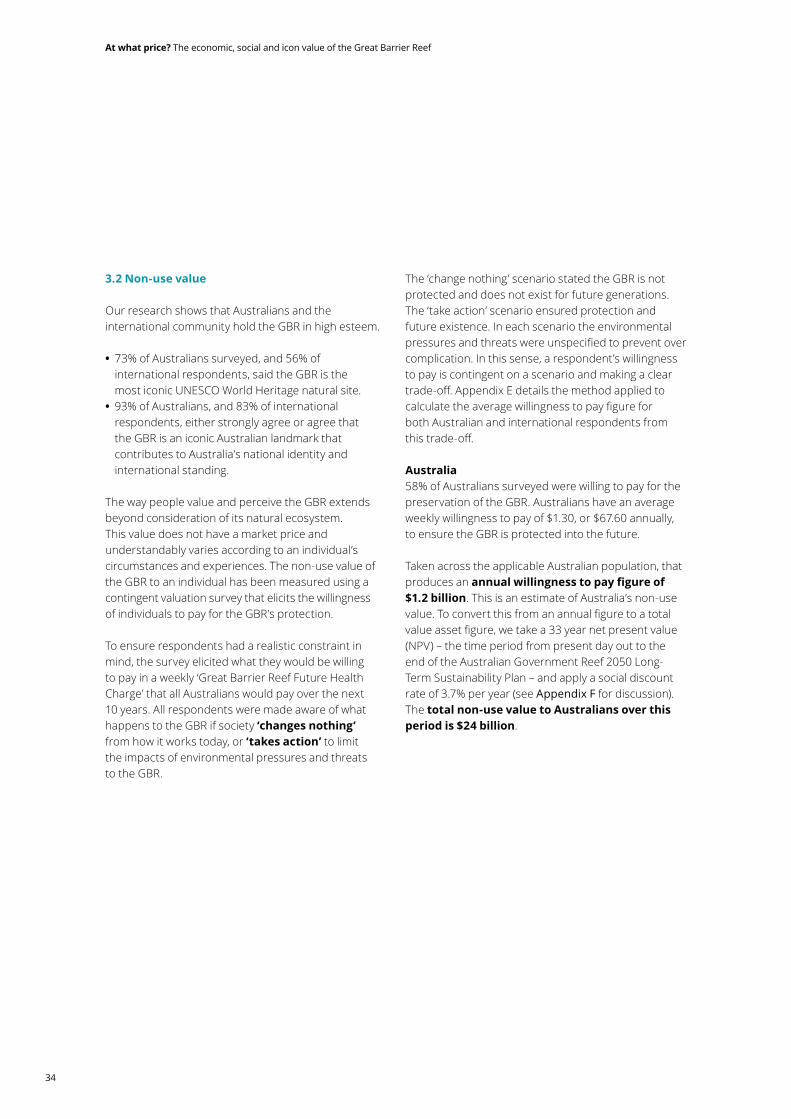
Australia58% of Australians surveyed were willing to pay for the preservation of the GBR. Australians have an average weekly willingness to pay of $1.30, or $67.60 annually, to ensure the GBR is protected into the future.
Taken across the applicable Australian population, that produces an annual willingness to pay figure of $1.2 billion. This is an estimate of Australia’s non-use value.Toconvertthisfromanannualfiguretoatotalvalueassetfigure,wetakea33yearnetpresentvalue(NPV) – the time period from present day out to the end of the Australian Government Reef 2050 Long-Term Sustainability Plan – and apply a social discount rate of 3.7% per year (see Appendix F for discussion). The total non-use value to Australians over this period is $24 billion.
At what price? The economic, social and icon value of the Great Barrier Reef
34
International Of the 10 countries surveyed, all valued the GBR and 73% were willing to pay to for its preservation. The researchshowthatmanydifferentcountriesvaluetheGBR. From Australia’s regional neighbour in China, to across the world in Europe, and down in South Africa, developed or developing – all were willing to contribute to the GBR’s protection.
Theinternationalwillingnesstopayfiguresarenotreported or calculated as an economic, social and icon asset value for a range of reasons. To extrapolate the values, apply assumptions and present an ‘international’ or world non-use value would be unreliable. Underlying biases in the data, contextual cultural factors, language barriers and purchasing powerdifferencesallprovidechallengestomodelling.
However, if we were model the annual willingness to payfigurefortheUnitedStates,theUnitedKingdom,France, Germany and Canada, it would be USD$5 billion in 2016 purchasing power parities (PPP). This annual willingnesstopayfigureisderivedfromtheproportionof each country’s employed population over the age of 15 years in the middle income percentile, or 20%3. This is larger than the annual willingness to pay of Australians.
Ultimately though, the survey respondents while broadly representative, cannot speak for the world when considering the non-use value of one of its seven natural wonders. Despite the non-use asset value not beingreportedinequivalenttermstotheAustraliannon-use value, the insights from the research are no less valuable and clearly show, as an international asset, the GBR would be worth several times the Australian value.
3. As per the United Nations World Population Prospect: The 2015 Revision.
Chart 3.5: Weekly willingness to pay by state and territory
Australia ACT NSW NT QLD SA TAS VIC WA
$1.30 $1.00$0.80
$1.30 $1.30
$1.70$1.40 $1.40
$1.90
Source:DeloitteAccessEconomicssurveyconductedbyIpsosPublicAffairsAustralia
35
At what price? | Economic, social and icon value

Reason for willingness to pay Top 3 countries
Important to the planet Spain, UK, USA
Morally and ethically right to protect it France, Spain UK
Australia would not be the same without it USA, India, China
The world would not be the same without it Spain, USA, Canada
Future generations should be able to visit it South Africa, UK, India
Important for tourism India, China, Mexico
Important for the region’s economy UK, India, Canada
Important for biodiversity Spain, Mexico, Germany
Canada
USA "I agree that the reef must be protected – however, that being said, that is the express job of the Australian government.""World treasure. Save it."
Mexico "It is necessary to preserve our planet""It is important to conserve corals as it is a very important national treasure for the ecological balance of the marine world."
South Africa "The amount I specify is not how much I would like to pay, but the amount I am able to pay (on a pension)… It would be tragic to watch the GBR die."
Average weekly willingness to pay:
$1.98
Source: Deloitte Access Economics36
At what price? The economic, social and icon value of the Great Barrier Reef

China "Human kind should start protecting the environment without any delay. Everybody should raise awareness and work towards a common goal."
France "It would be nice for the world (the richest countries) to pay this tax."
UK "It made me feel guilty about the amount I said I would pay to protect the GBR, but being disabled and not working makes it very difficult to afford more, which I would definitely do if I was able to.""The governments around the world need to do more."
Spain
Germany "I find it frightening that this reef is just so destroyed."
India "I am overwhelmed by the loss to the reef.""It is necessary that rich people not only contribute more for the protection of the reef, but take strong action to prevent its misuse. I wish I could pay more.""The GBR is a fabulous asset to our earth.""People all over the world should help to protect it.""The GBR is one of nature’s best gifts, should be protected at all cost."
37
At what price? | Economic, social and icon value
Youcan’tvaluewhatyoudon’tknowJust 0.01% of the world’s population has dived on a coral reef. If the majority of people don’t feel connected to the GBR’s natural wonder, how can they be motivated to protect it?
Considering this, domestic and international respondents were asked for their willingness to pay to protect the GBR under the survey scenarios. While we had their attention, we wanted to test what the impact of more information on the threats the GBR is facing on their willingness to pay to protect it.
Respondents were asked to watch a short YouTube video titled The Great Barrier Reef is in Danger from David Attenborough’s the Great Barrier Reef © Atlantic Productions 2015. Following this clip, their previous willingness to pay was restated and they were asked, after watching the video, if they were willing to pay more.
When given more information on the threats the GBR is facing, 35% of Australians and 51% of international respondents were willing to pay more. An increased level of understanding, and the sentiment respondents felt when confronted with the potential loss of the natural wonder, increased the value they felt for it.
Source: Deloitte Access Economics; Attenborough’s Reef 2015
What did respondents have to say?
I hope we can save our
beautiful Barrier Reef for future generations.
The last video has kindled my interest to visit the historical site
sooner rather than later before the beauty
gets eroded.
It was a bit of an eye opener, as I had no idea
50% of it [had been] destroyed since the 80s.
That's a significant number.
It has been an awesome eye opener
as to what is really transpiring in the real world and makes us
aware of the dangers out there…
Australia
South AfricaIndia
USA
38
At what price? The economic, social and icon value of the Great Barrier Reef

3.3 Direct use value
Tourism From the economic contribution we know that tourism in the GBR contributes $5.7 billion to the Australian economy per year. This contribution relies on market transactions taking place. To understand the full benefitvisitorstotheGBRreceive,anestimateoftheconsumersurplusisrequired.
Since there is no ‘price’ for the GBR, information from the GBR tourism industry can be used to reveal the valueofthesebenefitstovisitors.Thetravelcostmethod is what is routinely used to value consumer surplus by observing individuals’ travel patterns and behaviour. In this way, the consumer surplus from tourists in the GBR comes from observing the amount visitors are willing to pay to get there and how often they are doing it.
Travelcosts,includingflights,accommodation,meals,equipmenthireandorganisedtouringwereusedasaproxy for the price of visiting the GBR. People who live a long distance from the GBR naturally pay more for theirtripthanthosethatliveclosebyandconsequentlymake less trips. As a result, the demand for trips is reliant on the costs to get there.
Research was conducted on tourists to the GBR to help understand their travel costs and number of trips taken. The survey returned 268 domestic responses that were representatively spread across states and territories, see survey in Appendix D. As travelling to the GBR is expensive and can be a ‘once in a lifetime trip’ for domestic tourists, especially interstate visitors, tripfrequencytotheGBRwasaskedoverthepastfive years.
Through econometric modelling, detailed in Appendix E, the average consumer surplus per person, per trip is estimatedat$662.Tofindthetotalconsumersurplus,theannualfigurewasextrapolatedacrosstheannualnumber of domestic visitors to the GBR. The number of annual domestic overnight visitors was sourced from TRA data (at the NRM level) and a total of 2.3 million overnight trips were made to the GBR in 2016 (see Appendix E for further discussion around visitor number assumptions). This amounts to $1.5 billion in annual direct benefits to domestic tourists from the GBR.
Toconvertthisfromanannualfiguretoanassetfigure,we used the social discount rate of 3.7% to derive the NPV over 33 years. This makes the total direct use benefit to domestic tourists $29 billion.
39
At what price? | Economic, social and icon value

RecreationThere are a number of studies that have undertaken the challenging task of valuing access to a recreational site such as the GBR4.Duetothequalityofthe benefitestimatesderivedinthesestudies,atransfer ofthebenefitsestimatedtothecontextofthisstudy is appropriate.
Abenefittransferisonlyasgoodastheresearchonwhich it is based, therefore numerous studies were evaluated using the criteria detailed in Appendix E. The most notable and relevant to our study is the work undertaken by Rolfe and Gregg (2012), who estimated recreation values in Bundaberg, Gladstone, Capricorn Coast (Rockhampton), Mackay, Townsville and Cairns.
The consumer surplus estimates for Rolfe & Gregg (2012) were adjusted using the March 2017 ABS Consumer Price Index (CPI), and ranged from $26 per person per trip in Cairns to $63 per person per trip on the Capricorn Coast. Across all the GBR sites, the consumer surplus was estimated at $43.
TRA data on intrastate day trips for the NRM regions thatfallwithintherecreationboundary,specifiedin Chapter 2, were used to calculate the annual recreational visits to the GBR. 3.9 million trips were made by recreational visitors to the GBR in 2016 (seeAppendix Cforfurtherdiscussionaround visitornumber assumptions).
Takingtheconsumersurplusfigureacrosstheannualrecreational trips gives $170 million in annual direct benefits to recreational visitors to the GBR. Using the same social discount rate of 3.7% to estimate the NPV asset value over 33 years, the total direct use benefit to recreational visitors is $3.2 billion.
3.4 Indirect use value
Ecosystem services TheGBRisanimmenseanduniqueecosystemthatholdsasignificantvaluetohumansandotherinterlinked systems. In this sense, the GBR performs an important environmental and ecological function. These functions are known as ecosystem services and are important to societal wellbeing and are valuable inputs for production.
Figure 3.2 shows the interaction between the types of capital in an economy and human wellbeing used in ecosystem services analysis. Costanza et al. (2014) found that even with falling coral reef area, rising values (reaching US$352,249/ha/year) meant that the world’s coral reefs were worth trillions of dollars to human wellbeing. Ecosystem services are not bound by willingness to pay or GDP and can produce estimatessignificantlyhigher,becausetheintent is to capture the contribution to human wellbeing.
The ecosystem services of the GBR, for example, producefood,maintainwaterquality,andprovidefisherieshabitat.TheGBRasapartofnaturealso provide important storm protection for the Queensland coast. These kinds of ecosystem services can be grouped as; cultural, provisioning, regulating, and supporting services (Figure 3.3).
4. GBRMPA charges $6.50 per person an Environmental Management Charge that applies to all persons over the age of four years of age toentertheGBR.However,thischargeisincludedinthecostoftouristactivitiessuchasequipmenthire,boatexcursionsandorganisedtouring and not charged to users of the Reef that aren’t involved in such activities.
At what price? The economic, social and icon value of the Great Barrier Reef
40
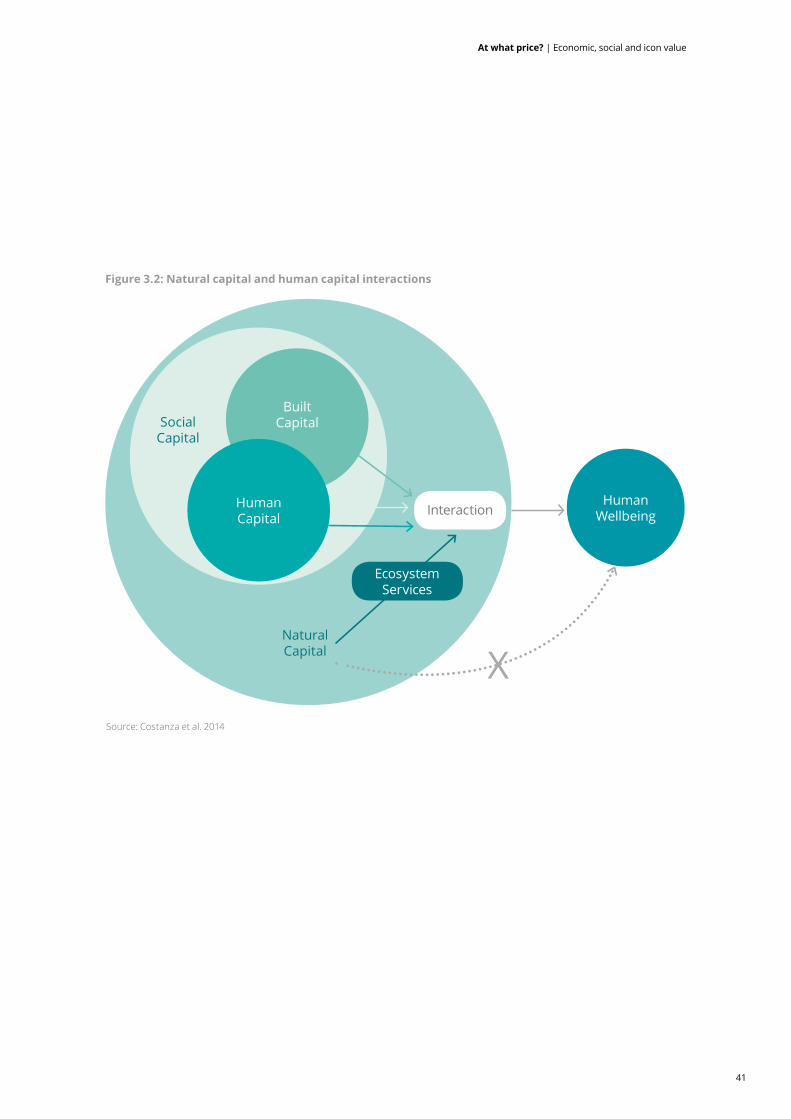
Figure 3.2: Natural capital and human capital interactions
Source: Costanza et al. 2014
Human Capital
Built CapitalSocial
Capital
Natural Capital X
Human WellbeingInteraction
Ecosystem Services
41
At what price? | Economic, social and icon value

While this study covers aspects of cultural and provisioning services such as icon value, recreation andfishing,itdoesn’tcoveralloftheGBR’secosystemservices.Specifically,regulatingandsupportingservices are not included in this study.
The ABS, however, has developed an Experimental Ecosystem Account for the Great Barrier Reef Region (2015), which measures various elements of these ecosystem services in the GBR catchment. The ecosystem accounting approach provides a quantitativeassessmentbydirectlylinkingtheGBR'secosystems to economic and other human activity.
These links are both the services provided by the GBR ecosystem, and also the impacts that economic and human activity can have on the GBR ecosystem. The output is reported as a net measure of these impacts on the GBR’s natural capital. For example, the ABS estimates the ecosystem service value of nutrition and materials (biomass) in the GBRMP from agricultural industryproductiontobe$1.4 billion(FY2012–13).
This ecosystem account of the GBR highlights the important relationship of environmental condition to economicandothersocialbenefitsthatareprovided in the GBRMP.
Where some of the ecosystem service values are captured discreetly in the GBR economic contribution, to include them in this study would be to double count. More detail are described in Appendix E.
However, while ecosystem service values are not explicitlyquantifiedinthisreport,theirimportance to the value of the GBR must still be considered.
ThesignificanceoftheGreatBarrier Reef as a natural capital asset, and the need for the protection of its ecosystem serviceofferings,arefundamentalelements of its true value.
Figure 3.3: Ecosystem services
Source: Adapted from Stoeckl et al.,2011.
Ecosystem Services
Cultural Services
Provisioning Services
Regulating Services
Supporting Services
• Cultural heritage • Cognitive/scientificresearch
• Australian icon • Recreation
• Ports and shipping • Aquariumtrade • Fishing • Oil reserves and medical products
• Storm protection • Waterpurification • Climate regulation/carbon sequestration
• Nutrient cycling/food webs
• Habitat provisions • Coastal protection • Ecosystem resilience
At what price? The economic, social and icon value of the Great Barrier Reef
42
Great Barrier Reef’s natural beauty
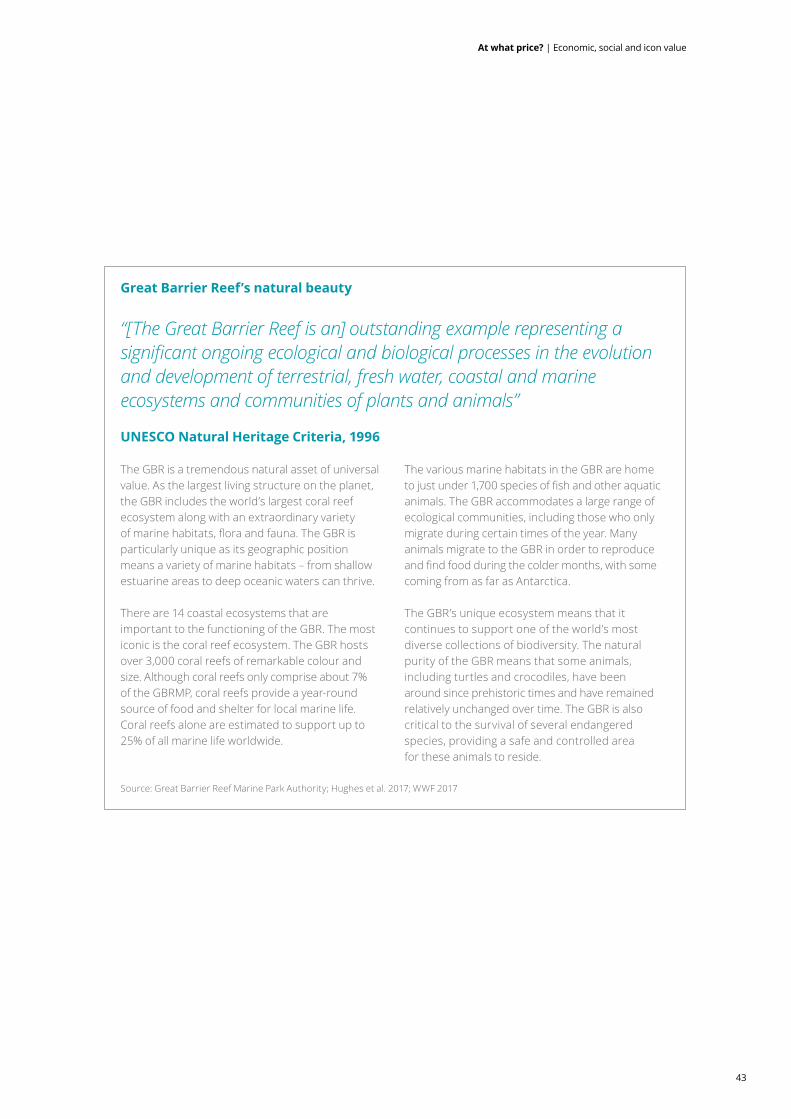
“[The Great Barrier Reef is an] outstanding example representing a significant ongoing ecological and biological processes in the evolution and development of terrestrial, fresh water, coastal and marine ecosystems and communities of plants and animals”
UNESCO Natural Heritage Criteria, 1996
The GBR is a tremendous natural asset of universal value. As the largest living structure on the planet, the GBR includes the world’s largest coral reef ecosystem along with an extraordinary variety ofmarinehabitats,floraandfauna.TheGBRisparticularlyuniqueasitsgeographicpositionmeans a variety of marine habitats – from shallow estuarine areas to deep oceanic waters can thrive.
There are 14 coastal ecosystems that are important to the functioning of the GBR. The most iconic is the coral reef ecosystem. The GBR hosts over 3,000 coral reefs of remarkable colour and size. Although coral reefs only comprise about 7% of the GBRMP, coral reefs provide a year-round source of food and shelter for local marine life. Coral reefs alone are estimated to support up to 25% of all marine life worldwide.
The various marine habitats in the GBR are home tojustunder1,700speciesoffishandotheraquaticanimals. The GBR accommodates a large range of ecological communities, including those who only migrate during certain times of the year. Many animals migrate to the GBR in order to reproduce andfindfoodduringthecoldermonths,withsomecoming from as far as Antarctica.
TheGBR’suniqueecosystemmeansthatitcontinues to support one of the world’s most diverse collections of biodiversity. The natural purity of the GBR means that some animals, including turtles and crocodiles, have been around since prehistoric times and have remained relatively unchanged over time. The GBR is also critical to the survival of several endangered species, providing a safe and controlled area for these animals to reside.
Source: Great Barrier Reef Marine Park Authority; Hughes et al. 2017; WWF 2017
43
At what price? | Economic, social and icon value

3.5 Economic, social and icon value Overall, the GBR has an estimated total economic, social and icon value to Australia of $56 billion, representinga33 yearpresentvaluerangeofbenefitsout to the end of the Australian Government Reef 2050 Long-Term Sustainability Plan.
Over half of this value is attributed to those Australians who have visited the GBR and experienced its wonder. The connection these people feel to the GBR, and thebenefitabovewhattheyactuallypaytovisit,isanimportant part of its total value.
Beyondthisbenefit,asignificantproportionoftheGBR’s total value arises from those who have never evenvisitedit.ThisreflectsthevalueAustralianshavein being able to leave the GBR to future generations, to know others enjoy its natural beauty and its importance as an Australian icon and natural wonder of the world. The total value also includes the additional value that recreational users of the GBR receive that they don’t necessarily pay for.
If we split the $56 billion asset value down into its parts: • Australians who have visited the Reef as tourists – on their honeymoon, on a family holiday, on a bucket-list trip – derive $29 billion in value
• Australians who have not yet visited the Reef – but value knowing that it exists – derive $24 billion in value
• And the lucky Australians who are recreational users of the Reef – going to the beach, taking the boat out, diving on the weekends – derive $3 billion in value.
By all measures this value is conservative and only represents an Australian perspective. Were it to consider the international community’s value it is clear it would be much higher, if not priceless. Indeed, the conservative nature of this total value calculation does not include many elements that are considered priceless, such as Traditional Owner and brand value. Chapters 4 and 5 explore these core elements to the GBR’s value, ones which do not have a dollar value, but are no less important to Australians and the internationalcommunity alike.
Chart 3.6: Natural capital and human capital interactions
Source: Deloitte Access Economics
Key
Tourism value, 52%
Recreational value, 6%
Non-use value, 42%
52%6%
42%
Source:DeloitteAccessEconomicssurveyconductedbyIpsosPublicAffairsAustralia
At what price? The economic, social and icon value of the Great Barrier Reef
44
5. Australian Government, Australian Indigenous cultural heritage, http://www.australia.gov.au/about-australia/australian-story/austn-indigenous-cultural-heritage
Traditional Owner value 4
The value of the Great Barrier Reef extends far beyond what can be measured.
Aboriginal and Torres Strait Islander peoples have a strong connection to the GBR as Traditional Owners of the GBR Region, with evidence of their connections to country dating back over 60,000 years.
The natural features of the Reef are embedded in Indigenous culture, spirituality and wisdom. There are more than 70 Aboriginal and Torres Strait Islander Traditional Owner clan groups in the GBR Region, with eachgroupassociatingsignificantvaluetotheReefand its ecosystems. We respectfully acknowledge the Traditional Owners of the Great Barrier Reef, and pay respect to the First Nations Peoples and their elders, past, present and future.
4.1 Cultural ecosystem services MillenniumEcosystemAssessmentdefinesculturalecosystem services as:
“The non-material benefits people obtain from ecosystems through spiritual enrichment, cognitive development, reflection, recreation and aesthetic experience, including knowledge systems, social relations and aesthetic values.”
The ABS Experimental Ecosystem Account for the Great Barrier Reef Region 2015 categorises the cultural ecosystem service values that Traditional Owners obtain from the GBR under four groupings: cultural heritage, spiritual and religious, educational, and knowledge services.
Cultural heritage servicesCulturalheritageservicesreflectthecustodialresponsibilities of Aboriginal people and Torres Strait Islanders to other generations of their societies. In the total economic valuation framework, these values reflectaestheticandbequestvalues.Aestheticvaluesarenotonlyconsequentialbutalsoincludedutiessuchas‘educational’and‘symbolic’services.Bequestvaluesreflecttheculturalservicescustodianspassonto younger generations through knowledge and skills in areasthatreflecttheirculturalidentitysuchasculturalpractices, totems, observances, customs and lore.
Spiritual and religious services Spiritualandreligiousservicesreflectthesacredconnection between people and earth. This is particularly true for sacred sites, sites of particular significance,andplacesimportantforculturaltradition.5 The strong connection to country is core to spirituality and this relationship, the spirit of country, is of central importance to Indigenous people today.
“We cultivated our land, but in a way different from the white man. We endeavoured to live with the land; they seemed to live off it. I was taught to preserve, never to destroy.”
Tom Dystra Aboriginal Elder
45
At what price? | Traditional Owner value
Educational servicesThe educational cultural services include educational, entertainment and aesthetic values, which are expressedthroughstories,songlines,outfits,dances,arts and languages that connect them to a place and/or time. Australia’s Traditional Owners have been educating generations on the history of the Reef long before the rest of the world knew it existed. In particular, Australian Aboriginal stories have been determined to represent genuine and distinctive observations of increases in sea level after the ice age 10,000 years ago and of the origins of the GBR itself.6 The case has been made that Indigenous stories are sources for accurate knowledge across time and are far more valuable than ever previously imagined.
Knowledge services Knowledge services refer to the archaeology of the GBRthatreflectsthehistoryofhumanexistenceover thousands of years. These include Indigenous structures, technology, tools and archaeological sites. The ABS has categorised these archaeological sites as: • Occupation sites – stone tools, food remains, ochre, charcoal, cooking stones, shells
• Middens – deposits of food refuse • Grinding grooves – evidence of tool making or food processing
• Rock art – Dreamtime stories, pictorial evidence of past rituals central to lives of Indigenous people
• Scar trees – result of bark being removed for food or to make canoes, water containers, shields, huts.
The value of these knowledge services is not only significanttoarchaeology,buttoourTraditional Owner heritage and history.
4.2 Traditional Owner economic value Associate Professor, Henrietta Marrie, CQUniversity
Despite Aboriginal, Torres Strait Islander and Traditional Owner representation within the committee structures responsible for managing the policy environment surrounding the GBR, including the Tourism Reef Advisory Committee, Aboriginal participation in the local GBR tourism industry is almost non-existent – despite abundant opportunities to do so. This is in distinct contrast to, for example, Aboriginal involvement in tourism in the adjacent Wet Tropics World Heritage Area.7 Further, there appears to be little or no Aboriginal interest in the industry itself other than to ensure that protocols regarding cultural heritagesites,andhuntingandfishingrightsandpractices are respected and regulated.
Lacking the necessary reef transport infrastructure and equipmenttoconduct,forexample,fishinganddivingtours of local reefs, Aboriginal participation in coral reef tourism is very low, as measured, for example, by advertisements in local tourism trade literature. Major reef tourism operators rarely include representatives of local Traditional Owners as guides and cultural interpreters. Aboriginal participation in the industry is largely restricted to on-shore cultural activities (for example, cultural performances that celebrate stories of important reef-associated species, such as turtle, dugong, sharks, and crocodiles as part of welcome to country ceremonies for conference participants, visiting dignitaries and overseas tourists), sale of Indigenous reef-related art works and other merchandise, and participation in local festivals, such as the annual Gimuy Fish Festival in Cairns and the Cairns Indigenous Art Fair.EmploymentforlocalAboriginalpeopleinthetourismindustryisthereforelargelyconfinedtothehospitality sector.
6. Reid, Nunn and Sharpe (2014)7. See, for example, Marrie HL and Marrie APH, 2014. Rainforest Aboriginal Peoples and the Wet Tropics of Queensland World Heritage Area:TheRoleofIndigenousActivisminAchievingEffectiveInvolvementinManagementandRecognitionofCulturalValues.InDiskoSand Tugenhadt H (eds) (2014). World Heritage Sites and Indigenous Peoples’ Rights. IWGIA, Copenhagen, 340–375.
At what price? The economic, social and icon value of the Great Barrier Reef
46
However, the whole area of Indigenous coral reef tourism remains largely un-researched and CQUniversity’s Centre for Tourism and Research OpportunitiesandOfficeofIndigenousEngagementareintheprocessofaddressingthisresearchdeficitfrom both local and global perspectives.
While the direct economic contribution of Traditional Owners is undervalued, the GBR, nevertheless, remains economically important to its traditional inhabitantswhoregularlycarryonfishing,hunting and gathering practices for domestic consumption andartefactproduction.Gatheringincludesshell-fish,crabs and seabird eggs. Many of these traditional activities are regulated under Traditional Use of Marine Resources Agreements (TUMRAs) and native title Indigenous Land Use Agreement (ILUAs). While it remains a controversial issue, turtle and dugong are hunted under a permit system, although such hunting is usually associated with catching animals for important family and ceremonial occasions.
The economic value of this Traditional Owner marine resource subsistence economy also appears to be un-researched. However, it is likely to be high. Based on the commercial per kilogram value of such iconic speciesasmud-crabs,crayfish,barramundiandcoraltrout, the annual economic value of this Traditional Owner subsistence economy across the length of theGBRcouldrunwouldhaveasignificantmonetaryvalue. Thefindingscouldsurprise,forexample,areport authored by Professor John Cordell in 1995 fortheCapeYorkPeninsulaLandUseStrategyfoundthat the value of the Indigenous subsistence economy exceeded that of the cattle industry at the time.
4.3 Economic valuationTo our knowledge, no current studies present an economic valuation of the GBR as an Indigenous cultural asset. But there are several studies that have aimed to value Australian cultural heritage through commercialbenefits( Janke,1998;Zeppel,2001)and through the replacement value of subsistence production (Altman, 1987; Asafu-Adjaye, 1996).
These studies all focus on use values, with Rolfe and Windle(2003)beingthefirstpublishedstudytoestimate the non-use values of Australian Indigenous culture.Morerecently,Zander&Stranton(2010)estimated the value Indigenous Australians put on river ecosystem services and Gillespie & Bennet (2012) valued the impact of open-cut mining on highly significantAboriginalsitesintheHunterValley.Allof the non-use valuation studies used choice experiments to arrive at their values.
In valuing the GBR, sacred values are particularly sensitive and therefore resistant to price-based trade-offsduetoalackasubstitutability.TraditionalOwnersoften have a deep connection with natural resources thatplayauniqueroleinshapingtheirculturalidentity,through traditions, stories, and ceremonies making them sacrosanct and irreplaceable (Venn & Quiggin 2007).
As non-market valuation is reliant on substitutability to obtain a value, this makes monetising access to cultural goods and services unsuitable. Fundamentally, in the contextofourstudyTraditionalOwnersdonotrequireaquantifiedvalueinordertounderstandsignificanceoftheReef.However,asanareaofresearchitrequiresfurther attention and investment.
47
At what price? | Traditional Owner value
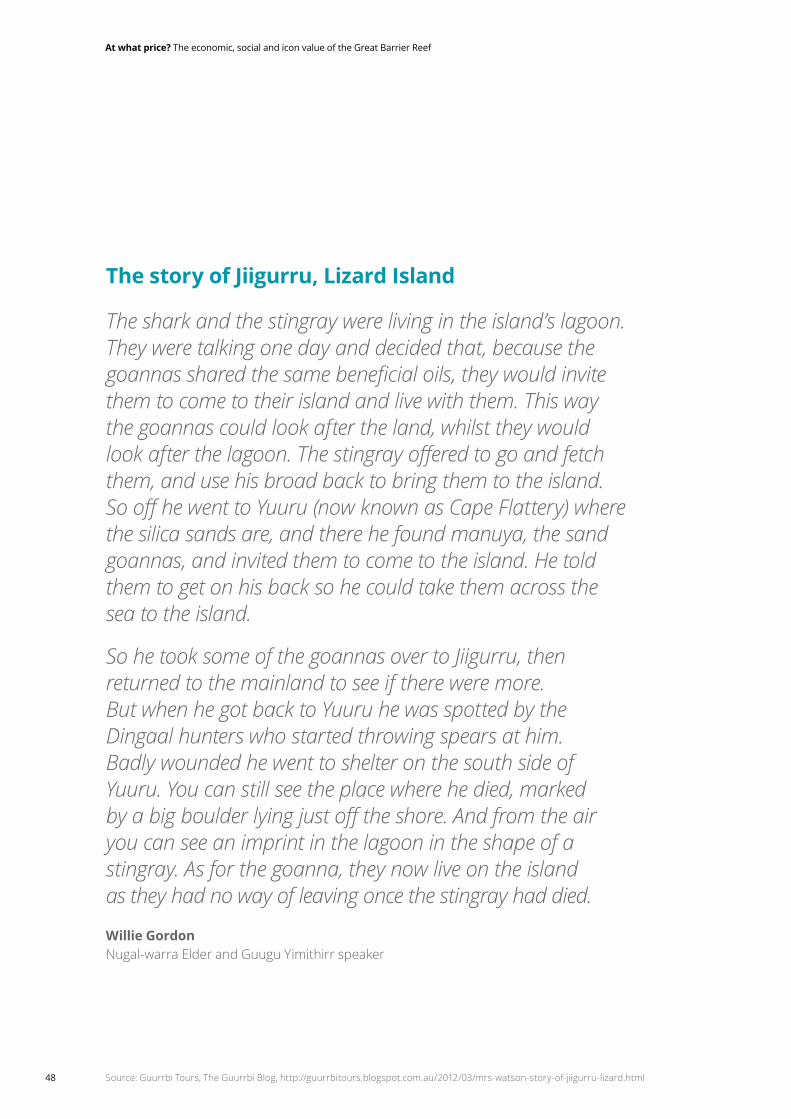
The story of Jiigurru, Lizard Island
The shark and the stingray were living in the island’s lagoon. They were talking one day and decided that, because the goannas shared the same beneficial oils, they would invite them to come to their island and live with them. This way the goannas could look after the land, whilst they would look after the lagoon. The stingray offered to go and fetch them, and use his broad back to bring them to the island. So off he went to Yuuru (now known as Cape Flattery) where the silica sands are, and there he found manuya, the sand goannas, and invited them to come to the island. He told them to get on his back so he could take them across the sea to the island.
So he took some of the goannas over to Jiigurru, then returned to the mainland to see if there were more. But when he got back to Yuuru he was spotted by the Dingaal hunters who started throwing spears at him. Badly wounded he went to shelter on the south side of Yuuru. You can still see the place where he died, marked by a big boulder lying just off the shore. And from the air you can see an imprint in the lagoon in the shape of a stingray. As for the goanna, they now live on the island as they had no way of leaving once the stingray had died.
Willie Gordon Nugal-warraElderandGuuguYimithirrspeaker
Source: Guurrbi Tours, The Guurrbi Blog, http://guurrbitours.blogspot.com.au/2012/03/mrs-watson-story-of-jiigurru-lizard.html
At what price? The economic, social and icon value of the Great Barrier Reef
48
49
At what price? | Traditional Owner value

Brand value5
No single Australian natural asset contributes as much in terms of brand and icon value to international perceptions of Brand Australia as the Great Barrier Reef. In our research, the Great Barrier Reef left other Australian land-based natural assets far behind in terms of visitor preference, reputation and experience. Of the more than 1,500 people Deloitte Access Economics surveyed domestically and internationally, 65% felt the GBR is Australia’s most iconic natural World Heritage site. Of these, Australians selected the GBR more than international respondents: 73% of Australians rated it as Australia’s most iconic natural site, and 56% of international respondents. The second was Uluru, also rated an iconic natural asset by both international and domestic visitors. Other important natural assets include the Kakadu National Park, Australian Fossil Mammal Sites, the Tasmanian Wilderness and the Blue Mountains.
By every measure, the Great Barrier Reef is seen as the natural asset contributing most powerfully to Australia’s global brand.
Why is this? Of the almost 1,000 respondents who named the GBR as Australia’s most iconic natural asset, they consider: • The GBR to be one of the most beautiful places in Australia
• Most people know what the GBR is • The GBR is the most famous UNESCO World Heritage site
• It is the most famous on the list • Oneofthesevennaturalwondersofthe world.
Furthermore, a large majority of all those surveyedagreedorstronglyagreedthatthe GBR: • Contributes to Australia’s global brand • Offersauniqueexperiencethatisnot offeredanywhereelseintheworld
• Contributes to Australia’s cultural identity • Is an iconic Australian landmark that contributes to Australia’s national identity andinternational standing.
At what price? The economic, social and icon value of the Great Barrier Reef
50
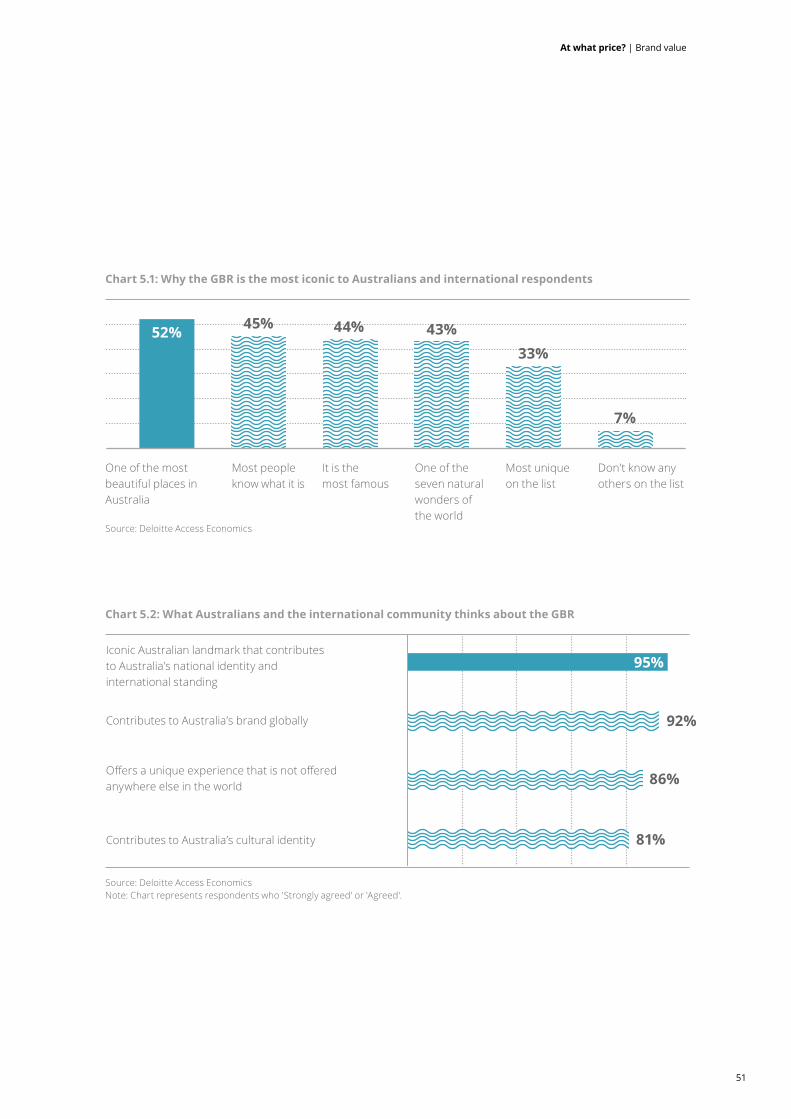
Chart 5.1: Why the GBR is the most iconic to Australians and international respondents
Chart 5.2: What Australians and the international community thinks about the GBR
Source: Deloitte Access Economics
One of the most beautiful places in Australia
Most people know what it is
It is the most famous
One of the seven natural wonders of the world
Mostunique on the list
Don’t know any others on the list
52% 45% 44% 43%33%
7%
Source: Deloitte Access Economics Note: Chart represents respondents who 'Strongly agreed' or 'Agreed'.
Iconic Australian landmark that contributes to Australia’s national identity and international standing
Contributes to Australia’s brand globally
Offersauniqueexperiencethatisnotofferedanywhere else in the world
Contributes to Australia’s cultural identity
95%
92%
86%
81%
51
At what price? | Brand value
5.1 Australia’s Brand TrinityWhile the GBR is globally famous as the ‘world’s largest living organism’ and a huge drawcard for tourists in its own right, it is not purely a standalone brand. It combines with other elements of Australia’s reputation internationally – enhanced by the ambassadorial role Australians play when living and travelling abroad – to shape international perceptions of Brand Australia.
Australia’sartists,film-makers,musiciansandentertainers also play an important role. In 2016, Deloitte Access Economics published a report commissioned by Screen Australia that found thatAustralianfilmandtelevisioncontributedtointernational tourism worth $725 million to our economy in 2014–15. Australia’s cuisine, sports culture, food and wine have also added texture to perceptions of Brand Australia. The Sydney Fish Markets, for example, welcomes 3 million tourists a year. A variety of Australian business activities combine to shape perceptions of Brand Australia for potential visitors.
However, when potential international visitors are asked why they might want to travel to Australia, three attractions form a powerful trilogy in Australia’s brand narrative: ‘the Rock, the Reef, and the House’. These uniqueiconsofAustralia–Uluru,theGBR,andtheSydney Opera House – are interchangeable when used as shorthand visual symbols for the country.
The Sydney Opera House, as Deloitte Access Economicsshowedinapreviousreport(HowDoYouValue an Icon? October 2013), represents an iconic and brand value to Australians and international visitors far inexcessofitsnarrowfinancialcontributionthroughticket sales. The Opera House’s cultural and iconic value to Australia is estimated at $4.6 billion.
In the same way, the brand value of the GBR to Australia far exceeds the revenue it generates for the national and Queensland economy. While the GBR’s economic contribution totals $6.4 billion, the GBR’s total value to Australia when one considers the consumer surplus, cultural value and enhancement it provides to the bigger brand of Australia as a destination, is $56 billion.
With great brand value comes great responsibility. Whether the GBR is regarded as the property of its Traditional Owners, of humankind as a whole, or whether it is considered beyond ‘ownership’, Australia as a nation is legally considered its owner, and morally, its custodian. Accordingly, the way in which Australia responds to threats to the health of the GBRwillinfluenceAustralia’sbrand.JustasAustralia’sreputation can be enhanced by its character on the battlefieldinGallipoliordiminishedbyrefugeepoliciesperceived as mean-spirited, so too will its stance on environmental management and the actions it takes to safeguard global assets of which it is seen as guardian, continue to shape Australia’s international brand. If the brand of the GBR is damaged or destroyed, so too will Australia’sbrandreputationsufferasavibrant,healthyand invigorating destination, famed for its outdoor lifestyle and natural assets.
The power of this interrelationship cannot be overestimated. In our research, commentary by respondents ranged from the GBR’s description as “the most beautiful and wondrous place on Earth” to its capacity to “draw people from around the world, across continents, just so they can experience it; it is loved by millions and known by billions”.
At what price? The economic, social and icon value of the Great Barrier Reef
52
5.2 Valuing the BrandAll methodologies in use for measuring brand value are subject to debate and scrutiny. Because of the verynatureofmeasuringbrands–notoriouslydifficultgiven they are rationally constructed but emotionally measured assets – there will never be a truly watertight method for ascribing a dollar value to a brand. For the entity of the GBR, opinions of its brand value vary widely due to the societal, political, industrial, or environmental lens through which it is viewed.
Nonetheless,applyingdifferentbrandmeasurementframeworks can be instructive and revealing. Perhaps the world’s oldest and best known brand valuation methodology is the Brand Asset Valuator (BAV) which measures the strength of thousands of brands in more than 50 countries by surveying tens of thousands of consumers. Developed originally in the 1970s by designconsultancyLandorAssociatesinSan Franciscoas ImagePower and then relaunched in 1992 as BAV followingLandor’sacquisitionbyadagencyYoung&Rubicam Associates, this pioneering survey measures a brand’s momentum, future potential and resonance byassessingitsDifferentiation,Relevance,EsteemandKnowledge in the minds of its audiences.
While BAV has not traditionally been applied to natural assets like the GBR, this ‘four pillars’ approach can be used to generate a hypothetical assessment of the brand’scurrentandfuturestatus.Thefirsttwopillars,DifferentiationandRelevance,combinetorepresentBrand Vitality – a brand’s future growth potential. IntermsofDifferentiation,theGBRexistswithinacrowded global category of coral reefs found across the world, and also competes alongside other globally renownedAustraliannaturalassets.YettheGBR’sdistinction as the world’s largest living organism; its uniquequalitiesoflength,scaleandbiodiversity;theculturalandhistoricalsignificancegivenitbyAustralia’sAboriginal and Torres Strait Islander peoples; and its powerfully visual associations with the image of contemporary Australia; these factors collectively put theGBRinauniquecategoryandworktostrengthentheDifferentiationoftheGBR’sbrand,akeydriverofits future value and sustainability.
The GBR’s Relevance pillar, meanwhile, is another key indicator of its brand value. While the GBR’s relevance might be seen as strongest to those who have experienceditthemselves,abroadersignificancecanbe extrapolated from what the GBR brand stands for in relation to Australia’s national identity, its importance to the collective psyche, and the role it plays in generating positive feelings amongst the country’s citizens, as well as international audiences.
A multi-country study published in March 2017 by the BBC Worldwide Global Insight Team and the University of Berkeley, California (Exploring the Emotional Stateof‘RealHappiness’:AStudyintotheEffectsofWatching Natural History Television Content) indicated that people are happier after they watch nature documentaries. Watching the BBC’s Planet Earth series, forexample,inspiredsignificantincreasesinfeelingsofawe, contentedness, joy, amusement and curiosity, as well as reducing feelings of tiredness, anger and stress.
In this context, whether by televisual or direct experience,itissuggestedthatexposuretoauniquenatural phenomenon like the GBR has a positive impact on people’s sense of wellbeing and personal motivation. While economists make obvious links betweentheGBRandthejobsandlivelihoodsaffectedby it, ascribing a value to the positive bond between AustraliansandtheGBR,whiledifficult,ispossiblegiven the well documented connections between collective morale and national productivity.
53
At what price? | Brand value
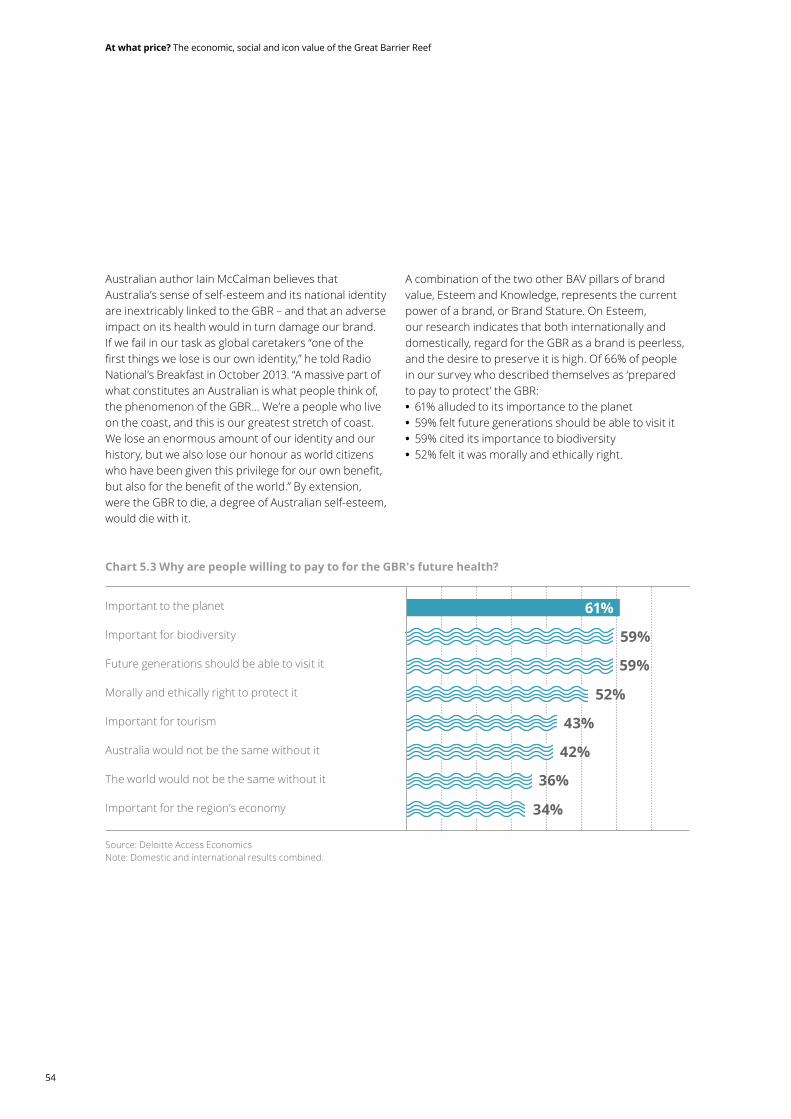
Australian author Iain McCalman believes that Australia’s sense of self-esteem and its national identity are inextricably linked to the GBR – and that an adverse impact on its health would in turn damage our brand. If we fail in our task as global caretakers “one of the firstthingsweloseisourownidentity,”hetoldRadioNational’s Breakfast in October 2013. “A massive part of what constitutes an Australian is what people think of, the phenomenon of the GBR… We’re a people who live on the coast, and this is our greatest stretch of coast. We lose an enormous amount of our identity and our history, but we also lose our honour as world citizens whohavebeengiventhisprivilegeforourownbenefit,butalsoforthebenefitoftheworld.”Byextension,were the GBR to die, a degree of Australian self-esteem, would die with it.
A combination of the two other BAV pillars of brand value, Esteem and Knowledge, represents the current power of a brand, or Brand Stature. On Esteem, our research indicates that both internationally and domestically, regard for the GBR as a brand is peerless, and the desire to preserve it is high. Of 66% of people in our survey who described themselves as ‘prepared topaytoprotect’the GBR: • 61% alluded to its importance to the planet • 59% felt future generations should be able to visit it • 59% cited its importance to biodiversity • 52% felt it was morally and ethically right.
Source: Deloitte Access Economics Note: Domestic and international results combined.
Chart 5.3 Why are people willing to pay to for the GBR's future health?
Important to the planet
Important for biodiversity
Future generations should be able to visit it
Morally and ethically right to protect it
Important for tourism
Australia would not be the same without it
The world would not be the same without it
Important for the region’s economy
61%
59%
59%
52%
43%
42%
36%
34%
At what price? The economic, social and icon value of the Great Barrier Reef
54
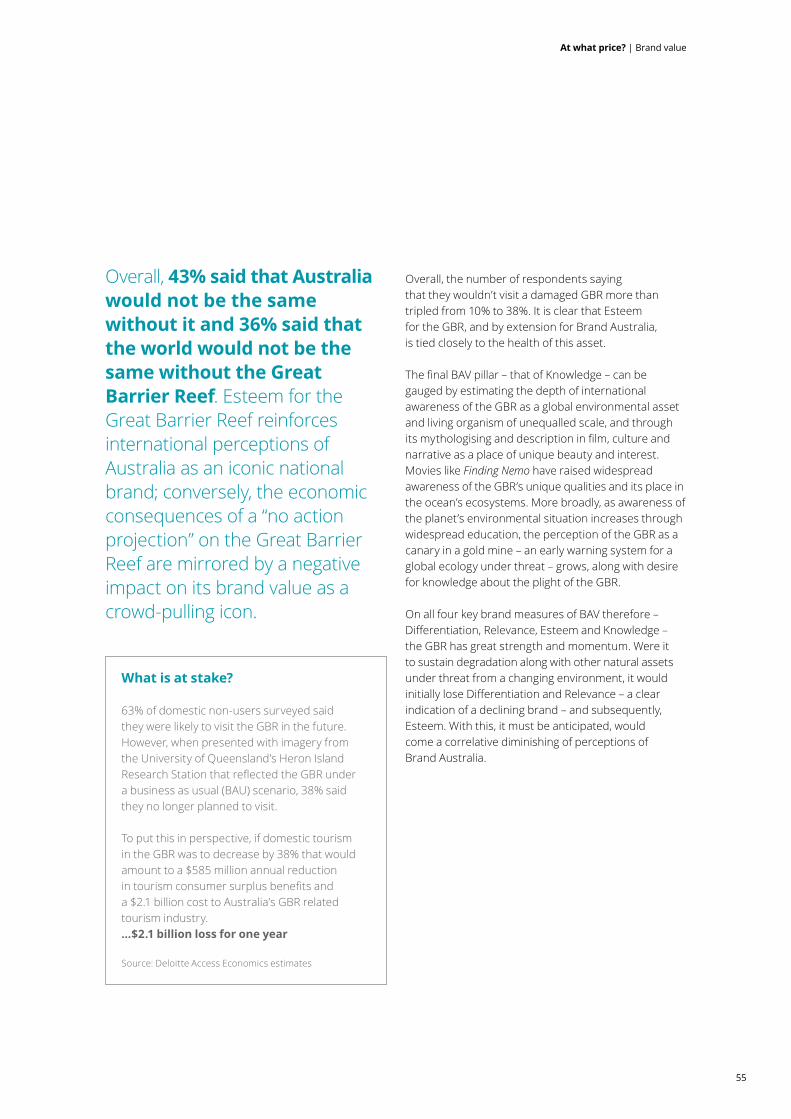
Overall, 43% said that Australia would not be the same without it and 36% said that the world would not be the same without the Great Barrier Reef. Esteem for the Great Barrier Reef reinforces international perceptions of Australia as an iconic national brand; conversely, the economic consequencesofa“noactionprojection” on the Great Barrier Reef are mirrored by a negative impact on its brand value as a crowd-pulling icon.
Overall, the number of respondents saying that they wouldn’t visit a damaged GBR more than tripled from 10% to 38%. It is clear that Esteem for the GBR, and by extension for Brand Australia, is tied closely to the health of this asset.
ThefinalBAVpillar–thatofKnowledge–canbegauged by estimating the depth of international awareness of the GBR as a global environmental asset andlivingorganismofunequalledscale,andthroughitsmythologisinganddescriptioninfilm,cultureandnarrativeasaplaceofuniquebeautyandinterest.Movies like Finding Nemo have raised widespread awarenessoftheGBR’suniquequalitiesanditsplaceinthe ocean’s ecosystems. More broadly, as awareness of the planet’s environmental situation increases through widespread education, the perception of the GBR as a canary in a gold mine – an early warning system for a global ecology under threat – grows, along with desire for knowledge about the plight of the GBR.
On all four key brand measures of BAV therefore – Differentiation,Relevance,EsteemandKnowledge –the GBR has great strength and momentum. Were it to sustain degradation along with other natural assets under threat from a changing environment, it would initiallyloseDifferentiationandRelevance–aclearindicationofadecliningbrand–andsubsequently,Esteem. With this, it must be anticipated, would come a correlative diminishing of perceptions of Brand Australia.
What is at stake?
63% of domestic non-users surveyed said they were likely to visit the GBR in the future. However, when presented with imagery from the University of Queensland’s Heron Island ResearchStationthatreflectedtheGBRunder a business as usual (BAU) scenario, 38% said they no longer planned to visit.
To put this in perspective, if domestic tourism in the GBR was to decrease by 38% that would amount to a $585 million annual reduction intourismconsumersurplusbenefitsanda$2.1 billioncosttoAustralia’sGBRrelatedtourism industry. …$2.1 billion loss for one year
Source: Deloitte Access Economics estimates
55
At what price? | Brand value
5.3 Brand AustraliaThe importance of a strong national brand in generating economic value cannot be underestimated. In a 2013 report Progressing Australia, with a survey sampledrawnfromover30countries,Young&Rubicam used BAV to frame its assessment of the influenceofAustralia’sbranduponinboundforeigninvestment and exports, on the power of ‘Made in Australia’ endorsements, and on international tourism. The research was the most comprehensive ever of perceptions of Brand Australia by Australians and international audiences.
Unsurprisingly, Australians placed Australia at the apex of the BAV ‘Power Grid’; they rated Australia as high in both Brand Vitality and Brand Stature, and as being ahead of nearest competitors the USA, UK, Japan,Germany,NZ,Canada,FranceandSingapore. Yetwhenaudiencesofothercountrieswereinterviewed about their perceptions of Australia, the shoewasfrequentlyontheotherfoot.France,Hollandand Japan placed Australia as high in Vitality but low in Stature; conversely India and China rated Australia’s brand as strong in Stature, but rated its Vitality as low and losing momentum. While Germany scored Australia high in all categories, other countries like MexicorateditaslowinbothVitalityand Stature.
The strategic task facing Australia, according to the study’s conclusions, is to enhance the national brand’svitalitythroughincreasedDifferentiationandRelevance. Revealingly, many visitors to Australia – indeed, many of whom had visited the GBR – returned to their own countries with a higher opinion of Australia asabrand.YetbrandperceptionslingerofAustraliaasacountrythatis‘Nicelydifferentiated–butwithoutmuch to admire’, according to the BAV study. The main challenge facing Australia in reshaping external brand perceptions, therefore, is that the country needs things ofdifferenceandrelevancethatotherswilladmire.
In the case of the GBR, this is less about Australia’s ‘ownership’ of the GBR and the GBR’s mere existence and location as part of the Australian continent, and more about Australia’s relationship with the GBR, and guardianship of its future. Our care for and nurturing of a healthy Reef under challenging circumstances could build admiration and esteem for Australia’s brand. Were the GBR brand to be adversely impacted through a combination of global and localised environmental factors with Australia a complicit bystander, Australia’s credentialsasaresponsibleglobalcitizenwouldsuffer.
Two other international country brand studies appear to support these perspectives. The Country Brand Index 2014/15 by FutureBrand, another global brand consultancy, and the annual Best Countries Ranking created by US News, each draw clear associations between a country’s sense of environmental and social citizenship and its global brand strength.
In the FutureBrand study, Australia ranked a strong 8th,influencedbysuchelementsasitsvaluesystem(including environmental standards) and experience (tourism, heritage and culture including natural beauty). In the US News Best Countries ranking, meanwhile, Australia also ranked number 8, just ahead of France and behind the United States with brand perceptions ofAustraliascoringespeciallyhighinqualityoflife and citizenship.
Within the US News study’s Citizenship attribute, Australia ranked 8.5/10 in a measure of ‘cares about the environment’ and 8.1/10 for being a ‘progressive country’. In the same study, Australia ranked 10th on the list of ‘Best countries for Green Living’, 11th on that of ‘Forward-looking countries’ and 10th in terms of ‘Transparency’. It is evident that all these measures wouldbeadverselyaffectedbyaseriousdeclinein the health of the GBR.
At what price? The economic, social and icon value of the Great Barrier Reef
56

The science of branding is traditionally one of competitive comparison; consumer brands, corporate brands, and country brands are ranked according to their relative strength in the minds of consumers, citizens, and global audiences. Considering a living organism like the GBR as a brand is therefore economically problematic. If price is largely driven byrelativity–supply,demand,andquality–thenbydefinition,theveryuniquenessoftheGBRrendersit price-less. While the Sydney Opera House could conceivably be rebuilt should it be damaged or worse, a vibrant the GBR, having naturally developed over millennia,wouldbefarmoredifficulttoreplace, evenwithscientificdevelopmentstoaccelerate reef regeneration.
Using this logic, the GBR’s value is beyond measure. Nonetheless, insurance specialists are occasionally faced with a related problem of valuation. To compensate the loss of a limb resulting from an industrial accident or medical negligence, for example, the use of that limb must be ascribed a cost. A dollar equationiscalculatedforeacharmorleg:itemsthatare beyond value and intrinsic to the psyche, daily abilities, sense of self-identity and, inevitably, the earning power of an individual. While someone can never be fully compensated for the loss of a limb, they can and will accept a calculated compensation and will thereafter get on with their lives as best they can.
Johan Rockström, director of the Stockholm Resilience Centre and a professor of environmental science at Stockholm University, has spoken widely of the economic impact of environmental upheaval: ‘Nature is beginning to send us her invoices,’ he says of the growing cost of climate change-induced damage to infrastructures, supply chains, food chains and other dimensions of the modern connected economy. Rockström urges businesses to recognize the true cash value of natural systems, to manage risks beyond their own value chains, and to think transnationally while embracing the circular economy of recycling and reusing. Critically, he recommends that businesses factor in environmental costs when measuring their performance – doing so, he says, can strengthen business decisions by giving visibility on long term risks and opportunities.
If brand is accepted as one of the critical assets on a business balance sheet – then Brand Australia’s value willincreasinglybeaffectedbyenvironmentalfactors,bothwithinandbeyonditscontrolorinfluence,andtheir impact upon the country’s natural assets like the GBR.
The crucial implication for the Great Barrier Reef, is that if it is seen to be ‘going backwards’, its value will inevitably decline. Ontheotherhand,ifscientificinitiatives are embraced and work successfully helps regeneration, itshouldinducefutureconfidence,and indeed the Great Barrier Reef's value should rise.
57
At what price? | Brand value
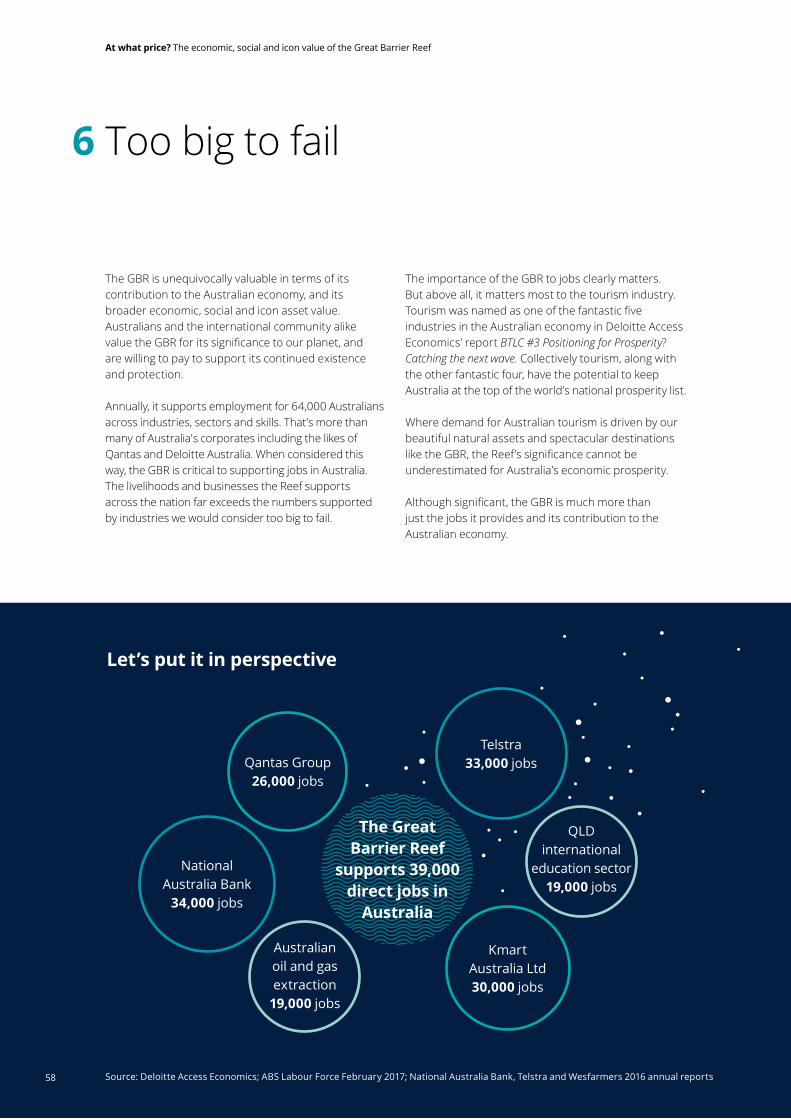
Too big to fail6
TheGBRisunequivocallyvaluableintermsofitscontribution to the Australian economy, and its broader economic, social and icon asset value. Australians and the international community alike valuetheGBRforitssignificancetoourplanet,and are willing to pay to support its continued existence and protection.
Annually, it supports employment for 64,000 Australians across industries, sectors and skills. That’s more than many of Australia's corporates including the likes of Qantas and Deloitte Australia. When considered this way, the GBR is critical to supporting jobs in Australia. The livelihoods and businesses the Reef supports across the nation far exceeds the numbers supported by industries we would consider too big to fail.
The importance of the GBR to jobs clearly matters. But above all, it matters most to the tourism industry. Tourismwasnamedasoneofthefantasticfiveindustries in the Australian economy in Deloitte Access Economics’ report BTLC #3 Positioning for Prosperity? Catching the next wave. Collectively tourism, along with the other fantastic four, have the potential to keep Australia at the top of the world’s national prosperity list.
Where demand for Australian tourism is driven by our beautiful natural assets and spectacular destinations liketheGBR,theReef’ssignificancecannotbeunderestimated for Australia’s economic prosperity.
Althoughsignificant,theGBRismuchmorethanjust the jobs it provides and its contribution to the Australian economy.
Let’s put it in perspective
Source: Deloitte Access Economics; ABS Labour Force February 2017; National Australia Bank, Telstra and Wesfarmers 2016 annual reports
The Great Barrier Reef
supports 39,000 direct jobs in
Australia
Qantas Group 26,000 jobs
Telstra 33,000 jobs
QLD international
education sector 19,000 jobs
National Australia Bank
34,000 jobs
Australian oil and gas extraction
19,000 jobs
Kmart Australia Ltd 30,000 jobs
At what price? The economic, social and icon value of the Great Barrier Reef
58

The economic, social and icon value of the Reef is $56 billion. That's more than 12 Sydney Opera Houses, or the cost of building Australia's new submarines. It’s even more than 4 times the length of the Great Wall of China in $100 notes.
Ononelevel,allofthesefiguresseemenormous,butwhenyoureflectonit,it’salsoclearhowinadequatefinancialmeasuresareforsomethingasimportanttothe planet as the GBR. The tremendous biodiversity and natural wonder value on a global scale is also not capturedinthisfigure.Ifquantified,theywouldshow it is worth much more than what is reported here.
The GBR is in Australians’ cultural DNA and Traditional Owner identity. And its status as one of the seven natural wonders of the world makes it an international asset. Considering this, what matters most is not quantifyingitsvalueasanexercisetosimplyputit on an economic leader board. Fundamentally, we know that the value of the GBR is priceless and we know that there is no replacement.
But we also know all of the jobs, all of its economic, social and icon value is under threat. Climate change, poorwaterqualityfromrun-off,impactsfromcoastaldevelopmentandillegalfishingarewelldocumentedthreats to the GBR. Of these, climate change remains the most serious and our research has shown Australiansandtheinternationalcommunity agree.
We have already lost around 50% of the corals on the GBR in the last 30 years. Severe changes in the ocean will see a continued decline ahead of us. Further, we nowknowthatresearchershavefoundeffortstoimprovewaterqualitydoessimplynotreducetheseverity of coral bleaching events on the GBR.
With the recognised threats to the GBR, and an understanding of the economic, social and icon value, comes the opportunity for us all to know what we do about it.
“Brisbane Airport is a Queensland company and our growth is heavily influenced by increased visitation to Queensland for tourism, study and investment. A damaged reef will affect visitation and the Queensland tourism brand.”
Julieanne Alroe CEO and Managing Director, Brisbane Airport Corporation Pty Ltd
“We do not inherit the Great Barrier Reef from our ancestors, we borrow it from our children.”
Dr Roger Beeden Director Reef 2050 Integrated Monitoring, Modelling and Reporting Program, Great Barrier Reef Marine Park Authority
59
At what price? | Too big to fail
Certainly, the GBR has been an environmental and publicpolicypriorityfordecades.Butthesignificanceof its contribution to the Australian economy, to jobs and its remarkable value to Australians and the world suggests the Reef should be given even greater priority by all citizens, businesses and levels of government.
There is opportunity now more than ever for action on a universal level. Local communities can do their bit – whether it is participating in citizen science initiatives at a grassroots level or simply playing a role to reduce their environmental footprint in the region.
Business and industry have a chance to invest in the ideas, technologies and outcomes that will drive the change needed to protect the GBR and its asset value.
Governments of all levels – local, state, national and international – can establish the policy settings and make the right investments that will ensure the GBR’s value is there for future generations.
But more than just getting the policies right and investing wisely, understanding the total value of the Reef shows us what is at stake. And when called on, it is this knowledge that allows us to make it clear that the Great Barrier Reef’s protection is not only an Australian priority, or an international one – it is a human one.
At what price? The economic, social and icon value of the Great Barrier Reef
60
Acronyms
Acronym Full name
ABS Australian Bureau of Statistics
BAV Brand asset valuator
DAE-RIO-M Deloitte Access Economics’ Regional Input-Output Model
GBRMP Great Barrier Reef Marine Park
GDP Gross domestic product
GOS Gross operating surplus
GVA Gross value added
GSP Gross state product
LGA Local government area
NRM Natural Resource Management area
NPV Net present value
WTP Willingness to pay
61
At what price? | Acronyms
Glossary
Term Definition
Consumer SurplusAdditionalbenefitaconsumerreceiveswhenthepricetheyactuallypay(market price) is lower than the price they are willing-to-pay
Direct use value Value individuals attribute to the actual use of the Great Barrier Reef
Indirect use valueValueattributedtoindirectusebenefitsoftheGreatBarrierReef’s ecosystem services
Market benefits Measurable commercial and economic contribution of the Great Barrier Reef
Non-market benefits Measurablesocial,culturalandeconomicbenefitsoftheGreatBarrierReefthat do not have an existing commercial market
Non-use valueValue that people assign the Great Barrier Reef even if they never have and possibly never will use and/or visit it
Recreational userA local resident of the Great Barrier Reef Region where it takes them less than 1.5 hours to drive to the coastline
Total economic value Combined value of direct, indirect and non-use values
TouristA visitor to the region, who stays overnight and lives more than 1.5 hour drive from the coastline
At what price? The economic, social and icon value of the Great Barrier Reef
62
At what price? | References
Access Economics Pty Ltd. (2005). Measuring the economic andfinancialvalueoftheGreatBarrierReefMarinePark. The Great Barrier Reef Marine Park Authority.
Access Economics Pty Ltd. (2007). Measuring the economic andfinancialvalueoftheGreatBarrierReefMarinePark. The Great Barrier Reef Marine Park Authority.
Access Economics Pty Ltd. (2008). Measuring the economic andfinancialvalueoftheGreatBarrierReefMarinePark. The Great Barrier Reef Marine Park Authority.
Adger, W. N., Brown, K., Cervigni, R., & Moran, D. (1995). Total economic value of forests in Mexico. Ambio, 286-296.
Altman, J. C. (1987). Hunter-gatherers today: an Aboriginal economy in north Australia. Australian Institute of Aboriginal and Torres Strait Island.
Asafu-Adjaye, J. (1996). Traditional production activities and resource sustainability: the case of Indigenous societies in CapeYorkPeninsula,Australia.International Journal of Social Economics, 23(4/5/6), 125-135.
Asafu-Adjaye, J., Brown, R., & Straton, A. (2005). On measuring wealth: a case study on the state of Queensland. Journal of Environmental Management, 75(2), 145-155.
Australian Research Council (2017). Grant Database http://www.arc.gov.au/grants-dataset
Badola, R., & Hussain, S. A. (2005). Valuing ecosystem functions: an empirical study on the storm protection function of Bhitarkanika mangrove ecosystem, India. Environmental Conservation, 32(01), 85-92.
Baker, R., & Ruting, B. (2014). Environmental policy analysis: a guide to non-market valuation. Productivity Commission Canberra.
Barnes-Mauthe,M.,Oleson,K.L.,&Zafindrasilivonona,B.(2013).Thetotaleconomicvalueofsmall-scalefisherieswitha characterization of post-landing trends: An application in Madagascar with global relevance. Fisheries Research, 147, 175-185.
Beal, D. J. (1995). A travel cost analysis of the value of Carnarvon Gorge National Park for recreational use. Review of Marketing and Agricultural Economics, 63(2), 292-303.
Carr, L., & Mendelsohn, R. (2003). Valuing coral reefs: a travel cost analysis of the GBR. AMBIO: A Journal of the Human Environment, 32(5), 353-357.
Carson, R. T., Wright, J., Carson, N., Alberini, A., & Flores, N. (1994). A Bibliography of Contingent Valuation Studies and Papers. California: Natural Resource Damage Assessment, Inc.
Cordell, J. (1995). Indigenous Management of Land and Sea andTraditionalActivitiesinCapeYorkPeninsula.CapeYorkPeninsulaLandUseStrategy(CYPLUS)andUniversityofQueensland.
Deloitte Access Economics. (2013). Economic contribution of the Great Barrier Reef.
Deloitte Access Economics. (2013). How do you value an icon? The Sydney Opera House: economic, cultural and digital value.
Deloitte Access Economics. (2016). Economic and social valueofimprovedwaterqualityatSydney’scoastalbeaches.
Department of Agriculture and Fisheries (2016). Ross LobegeigerReporttoFarmersAquacultureproductionsummary for Queensland 2014-15
Department of Agriculture and Fisheries (2017). QFish Database.http://qfish.fisheries.qld.gov.au/
Dove, S. G., Kline, D. I., Pantos, O., Angly, F. E., Tyson, G. W., &Hoegh-Guldberg,O.(2013).Futurereefdecalcificationunder a business-as-usual CO2 emission scenario. Proceedings of the National Academy of Sciences, 110(38), 15342-15347.
Driml, S. M. (1999). Dollar values and trends of major direct uses of the GBR Marine Park. The Great Barrier Reef Marine Park Authority.
Farr, M., Stoeckl, N., & Beg, R. A. (2014). The non-consumptive (tourism) ‘value’ of marine species in the Northern section of the GBR. Marine Policy, 43, 89-103.
Gillespie, R., & Bennett, J. (2012). Valuing the environmental, cultural and social impacts of open-cut coal mining in the Hunter Valley of New South Wales, Australia. Journal of Environmental Economics and Policy, 1(3), 276-288.
Hammack, J., & Brown Jr, G. M. (2016). Waterfowl and wetlands: Toward bioeconomic analysis. Routledge.
Hodgson, G. & Dixon, J. (1988). Logging Versus Fisheries and Tourism in Palawan. Occasional Papers of the East-West Environment and Policy Institute. Paper No. 7. East- West Centre, Hawaii, USA.
Hughes, T. P., Kerry, J. T., Álvarez-Noriega, M., Álvarez-Romero, J. G., Anderson, K. D., Baird, A. H., & Bridge, T. C. (2017). Global warming and recurrent mass bleaching of corals. Nature, 543(7645), 373-377.
Hundloe, T. J. A., Vanclay, F., & Carter, M. (1987). Economic andsocio-economicimpactsofthecrownofthornsstarfishontheGBR.Publishernotidentified.
References
63

Jacobs. (2016). Investing in the Great Barrier Reef as economicinfrastructure.http://www.qff.org.au/wp-content/uploads/2016/12/Jacobs-report-15-12-16.pdf
Janke, T. (1998). Our culture our future: a report on Australian Indigenous cultural and intellectual property rights. Australian Institute of Aboriginal and Torres Strait Islander Studies and Aboriginal and Torres Strait Islander Commission, Canberra.
KPMG(2000).EconomicandfinancialvaluesoftheGBRMarine Park. GBRMPA, Townsville, Australia.
Kragt,M.E.,Roebeling,P.C.,&Ruijs,A.(2009).Effectsofthe GBR degradation on recreational reef-trip demand: a contingent behaviour approach. Australian Journal of Agricultural and Resource Economics, 53(2), 213-229.
Moncur, J.E. (1973). The value of recreation areas on Oahu.
Parsons, G. R. (2003). The travel cost model. In P. Champ, K. Boyle & T. Brown (Eds.), A Primer on Non-Market Valuation (pp. 269-329). Berlin, Germany: Springer.
Pascoe, S., Doshi, A., Dell, Q., Tonks, M., & Kenyon, R. (2014). EconomicvalueofrecreationalfishinginMoretonBayandthe potential impact of the marine park rezoning. Tourism Management, 41(1), 53-63.
PDP Australia (2003). An economic and social evaluation of implementing the representative areas program by rezoning the GBR Marine Park. Report for the GBR Marine Park Authority, Brisbane.
Prayaga, P., Rolfe, J., & Stoeckl, N. (2010). The value of recreationalfishingintheGBR,Australia:apooledrevealedpreference and contingent behaviour model. Marine Policy, 34(2), 244-251.
Reid N, Nunn P & Sharpe M. (2014) Indigenous Australian Stories and Sea-Level Change. Indigenous Languages: Their Value to the Community. Proceedings of the 18th FEL Conference, 82-87.
Rolfe, J., & Dyack, B. (2011). Valuing Recreation in the Coorong, Australia, with Travel Cost and Contingent Behaviour Models. Economic Record, 87(277), 282-293.
Rolfe, J., & Gregg, D. (2012). Valuing beach recreation across a regional area: The GBR in Australia. Ocean & Coastal Management, 69, 282-290.
Rolfe, J., & Prayaga, P. (2007). Estimating values for recreationalfishingatfreshwaterdamsinQueensland. The Australian Journal of Agricultural and Resource Economics, 51(2), 157-174.
Rolfe, J., & Windle, J. (2010). Assessing national values to protect the health of the GBR. Res. Rep, 72.
Rolfe,J.,&Windle,J.(2012a).Testingbenefittransferofreefprotection values between local case studies: The GBR in Australia. Ecological Economics, 81, 60-69.
OxfordEconomics.(2009).ValuingtheeffectsoftheGBRbleaching. The Great Barrier Reef Foundation, Brisbane.
Turpie, J. K., Heydenrych, B. J., & Lamberth, S. J. (2003). Economic value of terrestrial and marine biodiversity in theCapeFloristicRegion:implicationsfordefiningeffectiveand socially optimal conservation strategies. Biological conservation, 112(1), 233-251.
Spurgeon, J. P. (1992). The economic valuation of coral reefs. Marine Pollution Bulletin, 24(11), 529-536.
Stoeckl, N., Hicks, C. C., Mills, M., Fabricius, K., Esparon, M., Kroon, F., & Costanza, R. (2011). The economic value of ecosystem services in the GBR: our state of knowledge. Annals of the New York Academy of Sciences, 1219(1), 113-133.
Stoeckl, N., Farr, M., Jarvis, D., Larson, S., Esparon, M., Sakata, H., & Mustika, P. (2014). The Great Barrier Reef World Heritage Area: its ‘value’to residents and tourists Project 10–2 Socioeconomic systems and reef resilience. Final Report to the National Environmental Research Program. Reef and Rainforest Research Centre Limited.
Venn, T. J., & Quiggin, J. (2007). Accommodating indigenous culturalheritagevaluesinresourceassessment:CapeYorkPeninsula and the Murray-Darling Basin, Australia. Ecological Economics, 61 2-3: 334-344.
Ward, F. A., & Loomis, J. B. (1986). The travel cost demand model as an environmental policy assessment tool: A review of literature. Western Journal of Agricultural Economics, 164-178.
Wattage, P., & Mardle, S. (2008). Total economic value of wetland conservation in Sri Lanka identifying use and non-use values. Wetlands ecology and management, 16(5), 359-369.
Windle, J., & Rolfe, J. (2005a). Assessing non-use values for environmental protection of an estuary in the Great Barrier Reef catchment. Australasian Journal of Environmental Management, 12(3), 147-155.
Windle,J.,&Rolfe,J.(2005b).Diversificationchoicesinagriculture: a Choice Modelling case study of sugarcane growers. Australian Journal of Agricultural and Resource Economics, 49(1), 63-74.
Zander,K.K.,&Straton,A.(2010).Aneconomic assessment of the value of tropical river ecosystem services: Heterogeneous preferences among Aboriginal and non-Aboriginal Australians. Ecological Economics, 69(12), 2417-2426.
Zeppel,H.(2000).Indigenousheritagetourismanditseconomic value in Australia. Heritage Economics—Challenges for Heritage Conservation and Sustainable Development in the 21st Century. In Proceedings of Australian Heritage Commission Conference, 4th July. Australian Heritage Commission, Canberra.
At what price? The economic, social and icon value of the Great Barrier Reef
64

Appendix A: Economic contribution studies
Economiccontributionstudiesareintendedtoquantifymeasures such as value added, exports, imports and employmentassociatedwithagivenindustryorfirm,inan historical reference year. The economic contribution isameasureofthevalueofproductionbyafirmor industry.
A.1 Value added Value added is the most appropriate measure of an industry’s/company’s economic contribution to gross domestic product (GDP) at the national level, or gross state product (GSP) at the state level.
The value added of each industry in the value chain can be added without the risk of double counting across industries caused by including the value added by other industries earlier in the production chain.
Other measures, such as total revenue or total exports, may be easier to estimate than value added but they ‘double count’. That is, they overstate the contribution of a company to economic activity because they include, for example, the value added byexternalfirmssupplyinginputsorthevalueaddedbyother industries.
A.2 Measuring the economic contribution There are several commonly used measures of economicactivity,eachofwhichdescribesadifferentaspectofanindustry’seconomic contribution: • Value added measures the value of output (i.e. goods and services) generated by the entity’s factors of production (i.e. labour and capital) as measured in the income to those factors of production. The sum of value added across all entities in the economyequalsgrossdomesticproduct.Giventherelationship to GDP, the value added measure can be thought of as the increased contribution to welfare.
Value added is the sum of: • Gross operating surplus (GOS) – GOS represents the value of income generated by the entity’s direct capital inputs, generally measured as the earnings before interest, tax, depreciation and amortisation (EBITDA)
• Tax on production less subsidy provided for production – This generally includes company taxes and taxes on employment. Note: Given the returns to capital before tax (EBITDA) are calculated, company tax is not included or this would double count that tax
• Labour income is a subcomponent of value added. It represents the value of output generated by the entity’s direct labour inputs, as measured by the income to labour
• Gross output measures the total value of the goods and services supplied by the entity. This is a broader measure than value added because it is an addition to the value added generated by the entity. It also includes the value of intermediate inputs used by the entity that flowfromvalueaddedgeneratedbyotherentities
• Employmentisafundamentallydifferentmeasureofactivity from those above. It measures the number of workers employed by the entity, rather than the value of the workers’ output.
65
At what price? | Appendix A: Economic contribution studies
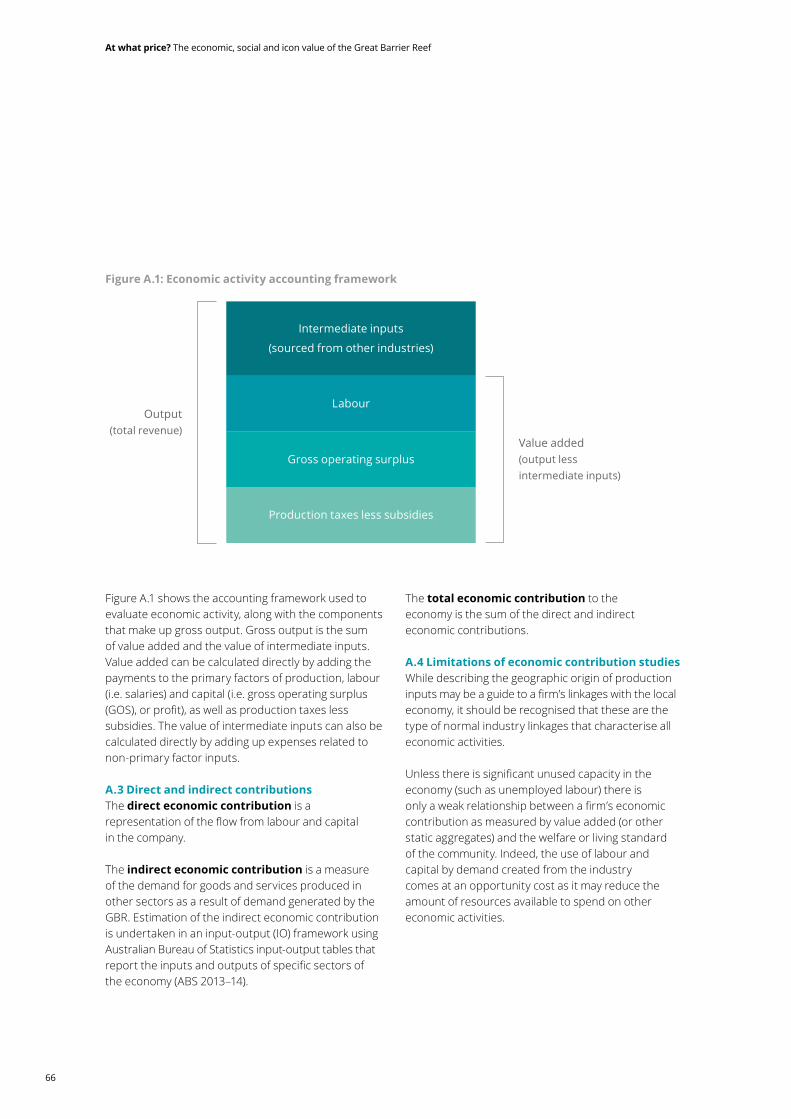
Figure A.1 shows the accounting framework used to evaluate economic activity, along with the components that make up gross output. Gross output is the sum of value added and the value of intermediate inputs. Value added can be calculated directly by adding the payments to the primary factors of production, labour (i.e. salaries) and capital (i.e. gross operating surplus (GOS),orprofit),aswellasproductiontaxeslesssubsidies. The value of intermediate inputs can also be calculated directly by adding up expenses related to non-primary factor inputs.
A.3 Direct and indirect contributions The direct economic contribution is a representationoftheflowfromlabourandcapital in the company.
The indirect economic contribution is a measure of the demand for goods and services produced in other sectors as a result of demand generated by the GBR. Estimation of the indirect economic contribution is undertaken in an input-output (IO) framework using Australian Bureau of Statistics input-output tables that reporttheinputsandoutputsofspecificsectorsof the economy (ABS 2013–14).
The total economic contribution to the economy is the sum of the direct and indirect economic contributions.
A.4 Limitations of economic contribution studies While describing the geographic origin of production inputsmaybeaguidetoafirm’slinkageswiththelocaleconomy, it should be recognised that these are the type of normal industry linkages that characterise all economic activities.
Unlessthereissignificantunusedcapacityintheeconomy (such as unemployed labour) there is onlyaweakrelationshipbetweenafirm’seconomiccontribution as measured by value added (or other static aggregates) and the welfare or living standard of the community. Indeed, the use of labour and capital by demand created from the industry comes at an opportunity cost as it may reduce the amount of resources available to spend on other economic activities.
Figure A.1: Economic activity accounting framework
Intermediate inputs
(sourced from other industries)
LabourOutput
(total revenue)Value added (output less intermediate inputs)
Gross operating surplus
Production taxes less subsidies
At what price? The economic, social and icon value of the Great Barrier Reef
66
This is not to say that the economic contribution, including employment, is not important. As stated by the Productivity Commission in the context of Australia’s gambling industries8:
Value added, trade and job creation arguments need to be considered in the context of the economy as a whole… income from trade uses real resources, which could have been employed to generate benefits elsewhere. These arguments do not mean that jobs, trade and activity are unimportant in an economy. To the contrary they are critical to people’s wellbeing. However, any particular industry’s contribution to these benefits is much smaller than might at first be thought, because substitute industries could produce similar, though not equal gains.
In a fundamental sense, economic contribution studies are simply historical accounting exercises. No ‘what-if’, or counterfactual inferences – such as ‘what would happentolivingstandardsifthefirmdisappeared?’–should be drawn from them.
Theanalysis–asdiscussedinthereport –reliesonanational IO table modelling framework and there are some limitations in this modelling framework. The analysis assumes that goods and services provided to the sector are produced by factors of production that arelocatedcompletelywithinthestateorregiondefinedandthatincomeflowsdonotleaktoother states.
The IO framework and the derivation of the multipliers also assume that the relevant economic activity takes place within an unconstrained environment. That is, an increase in economic activity in one area of the economydoesnotincreasepricesandsubsequentlycrowd out economic activity in another area of the economy. As a result, the modelled total and indirect contribution can be regarded as an upper-bound estimate of the contribution made by the supply of intermediate inputs.
Similarly, the IO framework does not account for furtherflow-onbenefitsascapturedinamore dynamic modelling environment like the CGE model.
A.5 Input-output analysis IOtablesarerequiredtoaccountfortheintermediateflowsbetweensectors.Thesetablesmeasurethedirect economic activity of every sector in the economy at the national level. Importantly, these tables allow intermediate inputs to be further broken down by source.Thesedetailedintermediateflowscanbeused to derive the total change in economic activity associated with a given direct change in activity for a given sector.
A widely used measure of the spill-over of activity from one sector to another is captured by the ratio of the total to direct change in economic activity. The resulting estimate is typically referred to as ‘the multiplier’. A multiplier greater than one implies some indirect activity, with higher multipliers indicating relatively largerindirectandtotalactivityflowingfromagivenlevelofdirect activity.
The IO matrix used for Australia is derived from the ABSIOTables.Theindustryclassificationusedforinput-outputtablesisbasedonANZSIC,with111sectorsinthemodelling framework.
8. Productivity Commission (1999), Australia’s Gambling Industries, Report No. 10, AusInfo, Canberra (page 4.19). 67
At what price? | Appendix A: Economic contribution studies

Appendix B: Economic contribution
B.1 Data sourceTable B.1 provides a summary data used to assess the economic contribution of the GBR.
Table B.1: Sources of data to measure the economic contribution
Economic activity Data type Data source
Tourism Visitor nights and average expenditure per visitor night
National Visitors Survey (NVS) and the InternationalVisitorsSurvey (IVS)
Commercial fishing and aquaculture
Gross value production Queensland Department of Agriculture and Fisheries
Recreation Expenditure on recreational equipment
Australian Bureau of Statistics Household Expenditure Survey 2009–10 (ABS cat. no. 6530.0)
Recreational activities undertaken in the GBR
Valuing local recreation in the Great Barrier Reef, Australia, a survey conducted by John Rolfe et al. (2012)
Scientific research and Reef management
Australian Research Council (ARC)fundandthefinancialstatements of selected research organisation, including:
• Great Barrier Reef Foundation • Australian Institute of Marine Science • Great Barrier Reef Marine Park Authority
• JCU ARC Centre of Excellence • Lizard Island Reef Research Foundation
Website of the ARC and research organisations
Source: Deloitte Access Economics
At what price? The economic, social and icon value of the Great Barrier Reef
68
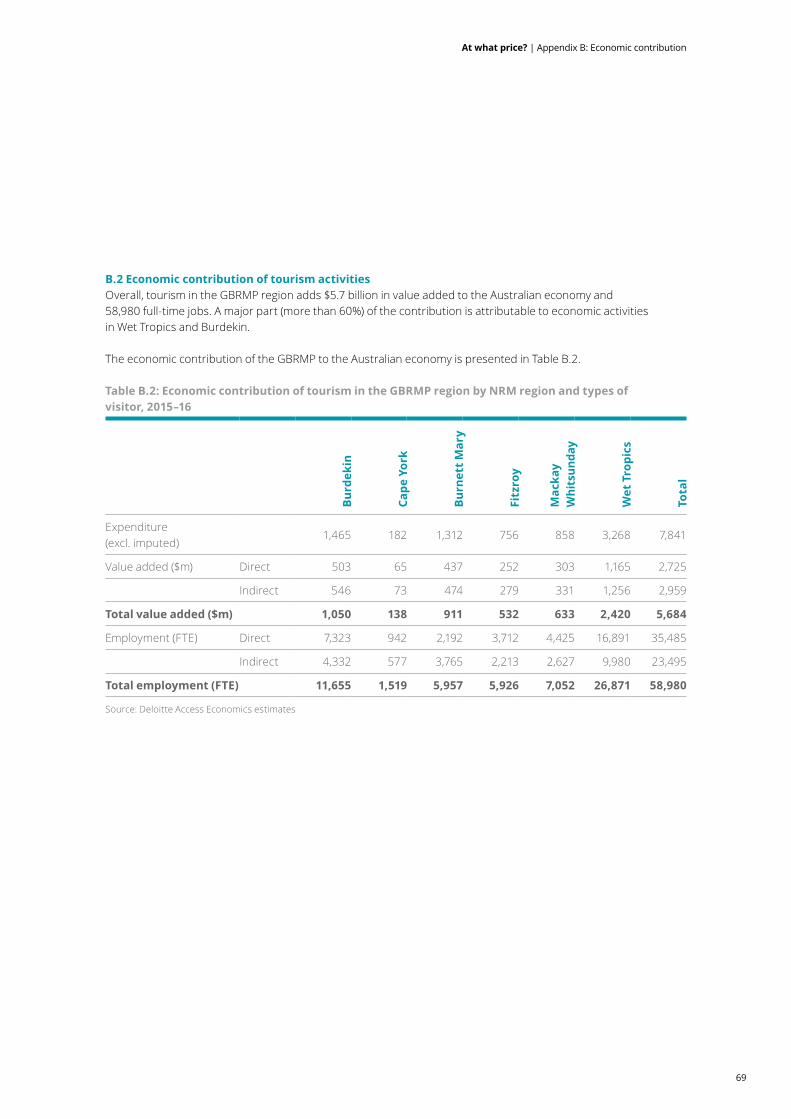
B.2 Economic contribution of tourism activitiesOverall, tourism in the GBRMP region adds $5.7 billion in value added to the Australian economy and 58,980 full-time jobs. A major part (more than 60%) of the contribution is attributable to economic activities in Wet Tropics and Burdekin.
The economic contribution of the GBRMP to the Australian economy is presented in Table B.2.
Table B.2: Economic contribution of tourism in the GBRMP region by NRM region and types of visitor, 2015–16
Burd
ekin
Cape
Yor
k
Burn
ett M
ary
Fitz
roy
Mac
kay
Whi
tsun
day
Wet
Tro
pics
Tota
l
Expenditure (excl. imputed)
1,465 182 1,312 756 858 3,268 7,841
Value added ($m) Direct 503 65 437 252 303 1,165 2,725
Indirect 546 73 474 279 331 1,256 2,959
Total value added ($m) 1,050 138 911 532 633 2,420 5,684
Employment (FTE) Direct 7,323 942 2,192 3,712 4,425 16,891 35,485
Indirect 4,332 577 3,765 2,213 2,627 9,980 23,495
Total employment (FTE) 11,655 1,519 5,957 5,926 7,052 26,871 58,980
Source: Deloitte Access Economics estimates
69
At what price? | Appendix B: Economic contribution
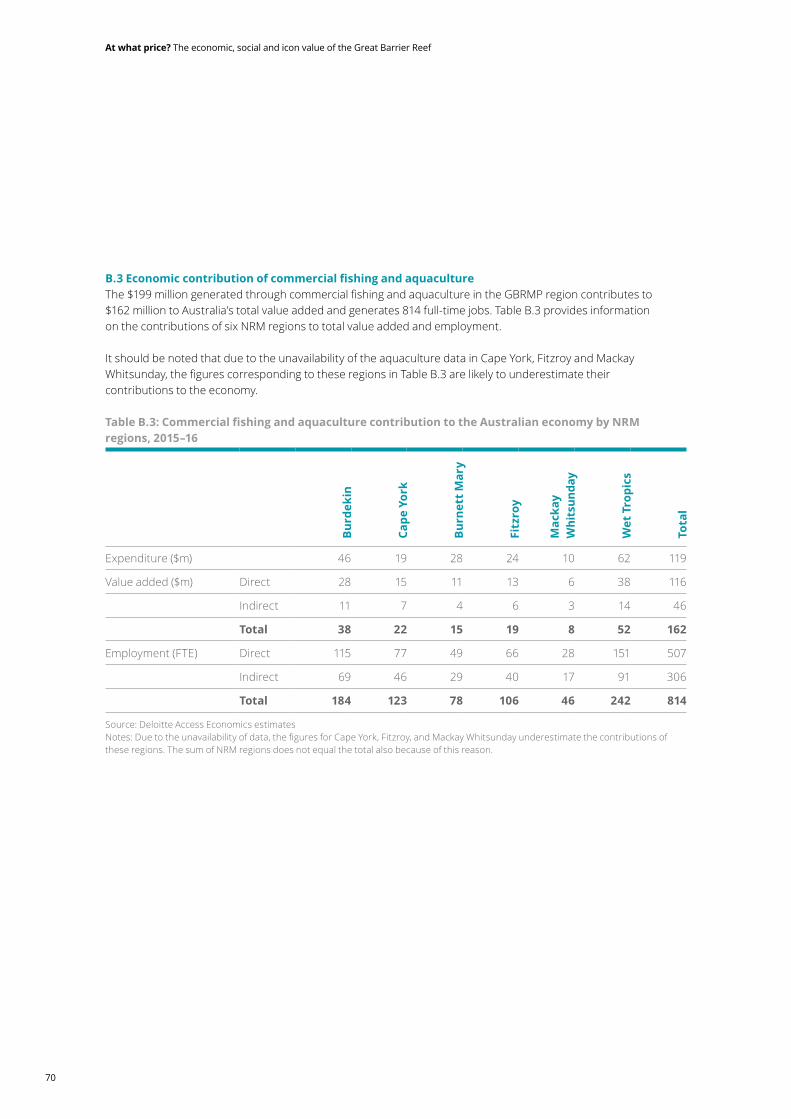
B.3 Economic contribution of commercial fishing and aquacultureThe$199milliongeneratedthroughcommercialfishingandaquacultureintheGBRMPregioncontributesto$162 milliontoAustralia’stotalvalueaddedandgenerates814full-timejobs.TableB.3providesinformation on the contributions of six NRM regions to total value added and employment.
ItshouldbenotedthatduetotheunavailabilityoftheaquaculturedatainCapeYork,FitzroyandMackayWhitsunday,thefigurescorrespondingtotheseregionsinTableB.3arelikelytounderestimatetheir contributions to the economy.
Table B.3: Commercial fishing and aquaculture contribution to the Australian economy by NRM regions, 2015–16
Burd
ekin
Cape
Yor
k
Burn
ett M
ary
Fitz
roy
Mac
kay
Whi
tsun
day
Wet
Tro
pics
Tota
l
Expenditure ($m) 46 19 28 24 10 62 119
Value added ($m) Direct 28 15 11 13 6 38 116
Indirect 11 7 4 6 3 14 46
Total 38 22 15 19 8 52 162
Employment (FTE) Direct 115 77 49 66 28 151 507
Indirect 69 46 29 40 17 91 306
Total 184 123 78 106 46 242 814
Source: Deloitte Access Economics estimates Notes:Duetotheunavailabilityofdata,thefiguresforCapeYork,Fitzroy,andMackayWhitsundayunderestimatethecontributionsoftheseregions.ThesumofNRMregionsdoesnotequalthetotalalsobecauseofthisreason.
At what price? The economic, social and icon value of the Great Barrier Reef
70

B.3.1 Economic contribution of recreational activitiesThe economic contribution of the GBR to recreation is presented in Table B.4. The total recreational contribution totheAustralianeconomyis$346millioninvalueadded,whichisequivalentto3,281full-timejobs.Burdekin,Burnett Mary, and Wet Tropics are the regions with the highest contributions to the Australian economy.
Table B.4: Recreation contribution to the Australian economy in terms of value added, 2015–16Bu
rdek
in
Burn
ett M
ary
Cape
Yor
k
Fitz
roy
Mac
kay
Whi
tsun
day
Wet
tro
pics
Tota
l
Value added ($m) Direct 53 53 2 31 21 47 206
Indirect 36 36 1 21 14 32 141
Total 89 89 3 52 35 78 346
Employment (FTE) Direct 605 601 22 354 236 534 2,352
Indirect 237 238 9 140 94 210 929
Total 843 839 30 494 330 745 3,281
Source: Deloitte Access Economics estimates
B.4 Economic contribution of scientific research and reef managementOverall,scientificresearchontheGBRandreefmanagementactivitiescontribute$182milliontotheAustralianeconomy.Thisisequivalentto970full-timejobs.DetailsoneconomiccontributionofscientificresearchandreefmanagementactivitiesontheAustralianeconomyarepresentedon TableB.5.
Table B.5: Economic contribution of the GBR to scientific research and reef management, 2015–16
Value added ($m) Employment (FTE)
Direct 62 514
Indirect GBR 93 381
QLD 98 400
Australia 120 456
Total contribution to Australia 182 970
Source: Deloitte Access Economics estimates
71
At what price? | Appendix B: Economic contribution
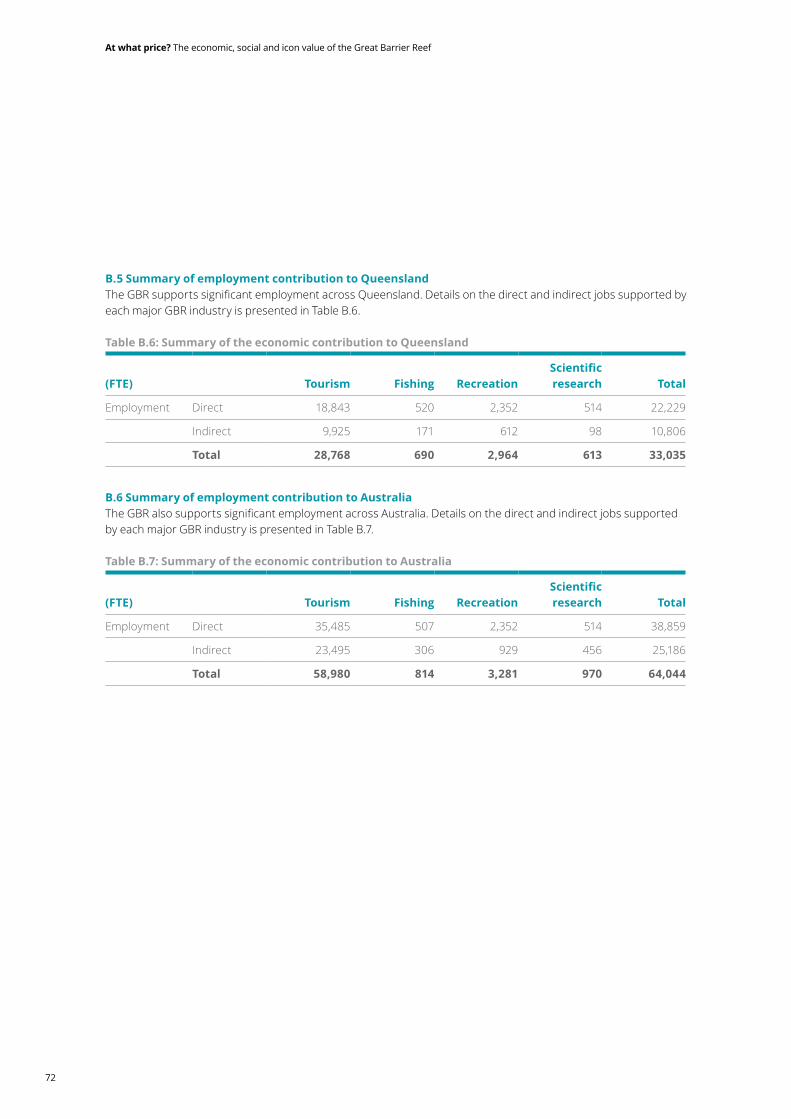
B.5 Summary of employment contribution to Queensland TheGBRsupportssignificantemploymentacrossQueensland.Detailsonthedirectandindirectjobssupportedbyeach major GBR industry is presented in Table B.6.
Table B.6: Summary of the economic contribution to Queensland
(FTE) Tourism Fishing RecreationScientific research Total
Employment Direct 18,843 520 2,352 514 22,229
Indirect 9,925 171 612 98 10,806
Total 28,768 690 2,964 613 33,035
B.6 Summary of employment contribution to Australia TheGBRalsosupportssignificantemploymentacrossAustralia.Detailsonthedirectandindirectjobssupportedby each major GBR industry is presented in Table B.7.
Table B.7: Summary of the economic contribution to Australia
(FTE) Tourism Fishing RecreationScientific research Total
Employment Direct 35,485 507 2,352 514 38,859
Indirect 23,495 306 929 456 25,186
Total 58,980 814 3,281 970 64,044
At what price? The economic, social and icon value of the Great Barrier Reef
72

Appendix C: Literature review
C.1 Literature review framework The literature framework was structured to build an understanding of the literature, theories and concepts that underpin the valuation of environmental assets, the total economic framework and non-market valuationtechniques.
The literature review framework was limited to the specificscopeofthisstudy,whichisthevaluationofthe GBR within a total economic valuation framework. Stoeckl et al. (2011) provided a detailed review of the numerous valuation studies focused on the GBR, which provided a broad direction for the literature review.
The literature search returned a substantial amount of domestic and international studies that assisted in the framing of the methodology for measuring the total economic value of the GBR. The following section provides a condensed overview of the key literature as it related to the GBR and outlines the relevance to conducting a total economic valuation of the GBR.
C.2 International studiesThere have been various credible studies that have used the total economic value framework to value large environmental assets such as, forests in Mexico (Adger et al., 1995), wetlands in Sri Lanka (Wattage &Mardle,2008),small-scalefisheriesinMadagascar(Barnes-Mauthe,Oleson,&Zafindrasilivonona,2013),mangroves in India (Badola & Hussain, 2005) and terrestrial and marine biodiversity (Turpie, Heydenrych & Lamberth, 2003).
The early literature surrounding the valuation of coral reefs only valued the cost of reef degradation, rather thanthebenefitsthatmadeupthetotaleconomicvalue.Moncur(1973)wasthefirstwithaHundloeetal.(1987), Hodgson and Dixon (1988) and McAllister (1988) soon to follow. From then, large number of valuation studies of coral reef were released in the 90’s, see Spurgeon, 1992, for a full account.
C.3 Australian studies Stoeckl et al. (2011) released a comprehensive account of the literature surrounding the economic and social valuation of the GBR. Their account highlights numerous gaps in the literature, particularly in the valuation of regulating and support ecosystem services. This report attempts to build on existing literature by addressing a number of gaps highlighted in Stoeckl et al. (2011).
Hundloeetal.(1987)wasthefirststudytovaluethe use and non-use values of the GBR and set the standard for other practitioners to follow. From then on, a number of studies have aimed to value the financialbenefitstheGBRcontributestothe Australian economy.
Driml(1999)wasthefirstofthesestudies,reportingestimates of major direct uses of the GBR, such as tourism, through productivity change, a method mirrored by KPMG (2000) and Asafu-Adjaye et al. (2005). PDP Australia (2003) then followed, but used tourism expenditure to estimate the GBR’s contribution to the Australian economy.
From then, Access Economics (2005, 2007 & 2008) valued the economic contribution of the GBR using a value-add approach with input-output tables. This methodhascontinuallybeenupdated,andrefined.Deloitte Access Economics (2013) is the most recent report assessing the economic contribution of the GBR, using the value-add approach. The majority of thesestudiesvaluedtheGBR’seconomic/financialcontributiontoindustry(profitability)butfailedtoaccountforconsumerbenefits.
Following Hundloe et al. (1987), there has been a number of studies that have applied non-market valuationtechniquestovaluearangeofconsumerbenefitsontheGBR.Themostcommonlyappliedrevealedpreference,non-marketvaluationtechniqueis the travel cost method9 that has been used to value such activities as beach recreation (Rolfe et al., 2011), recreationalfishing(Prayagaetal.,2010)andgeneralrecreation (Rolfe & Gregg, 2012).
73
At what price? | Appendix C: Literature review
Very few studies have aimed to estimate tourism, beyond a local, recreational scope, due to complexities indefiningtravelcosts,multiplepurposetripsandfunctional forms. Carr and Mendelsohn (2003) is the only study to our knowledge that has attempted to aggregatedomesticandinternationaltourismbenefitsof the GBR using the travel cost method.
Despite being the most commonly used stated preferencetechniqueinternationally(Carsonetal.,1994), Contingent valuation isn’t as commonly applied in Australia. Farr et al. (2014) built upon the Hundloe et al. (1987) application of the contingent valuation method using the GBR as a case study. Farr et al. (2014) measured domestic and international tourist’s WTP for marine animal sightings. More recently, Stoeckl et al., (2014) used a combination of various economic valuationtechniquesincluding,contingentbehaviourand contingent valuation. They estimated the collective value of services on the GBR such as, tourism and other non-use values to be between $15and$20 billion.
The literature search returned a number of choice modelling articles, with Windle & Rolfe (2005a) being thefirsttoapplychoicemodellingtotheGBRcontext,and the second study to value the non-use values of the GBR (after Hundle et al., 1987). Since then the pair used choice modelling on the GBR to answer a number ofotherresearchquestions(Windle&Rolfe,2005b;Rolfe & Windle, 2010; Windle & Rolfe, 2011; Rolfe & Windle, 2012).
Kragtetal.(2009)wasthefirststudytoourknowledgetoapplythecontingentbehaviourtechniquetoaGBRcasestudy.ThestudyaimedtomonetisetheeffectsofGBR degradation on diver and snorkeler’s demand for reef-trips.
To our knowledge Oxford Economics (2009) is the only study that has attempted to estimate the total economic value of the GBR. The aim of the Oxford Economics study was to value the consumer and producerbenefitslostunderaseverecoral bleaching scenario, rather than valuing it as an iconic asset. It is worth noting that the majority of their social and economic values were realised through abenefittransferfromthepreviouslymentionedacademic sources.
Jacobs (2016) recently estimated the value of the GBR as a piece of economic infrastructure as part of their business case for investment in the GBR. TourismexpenditureandthefindingsfoundinStoeckl(2014) were used to arrive at the conservative asset valueof$21billion.Thesefindingsuggestedthatan appropriate level of annual funding (including operations, maintenance and depreciation) for the GBR would be $830 million.
9. To our knowledge there is no published hedonic pricing literature that used the GBR as a case study.
At what price? The economic, social and icon value of the Great Barrier Reef
74
C.4 Review findingsThe literature review provided direction to the development of the technical methodology for the social and economic values of the GBR, particularly fornon-marketvaluationtechniques.
Domestic and international literature helped conclude that the travel cost method is the most appropriate method to be used for valuing domestic tourism benefitstotheGBR,withCarrandMendelsohn(2003), Prayaga et al. (2010), Rolfe & Gregg (2012), Pascoe, et al, (2014), collectively providing valuable insight into suitable survey design, assumptions and econometric modelling.
Contingent valuation was chosen as the most robust method to value the domestic non-use values of the GBR. This was due to the large international presence in literature (Carson et al. 1994) and the “best practice” structure of its application through the National Oceanic and Atmospheric Administration (NOAA) guidelines. The NOAA guidelines (Arrow et al., 1993), Kotchen,Boyle&Leiserowitz,(2012)andthefindingsfrom Carson et al’s (1994) literature review were used theframingofthecontingentvaluationquestionandthe assumptions used (see Appendix D and E).
75
At what price? | Appendix C: Literature review
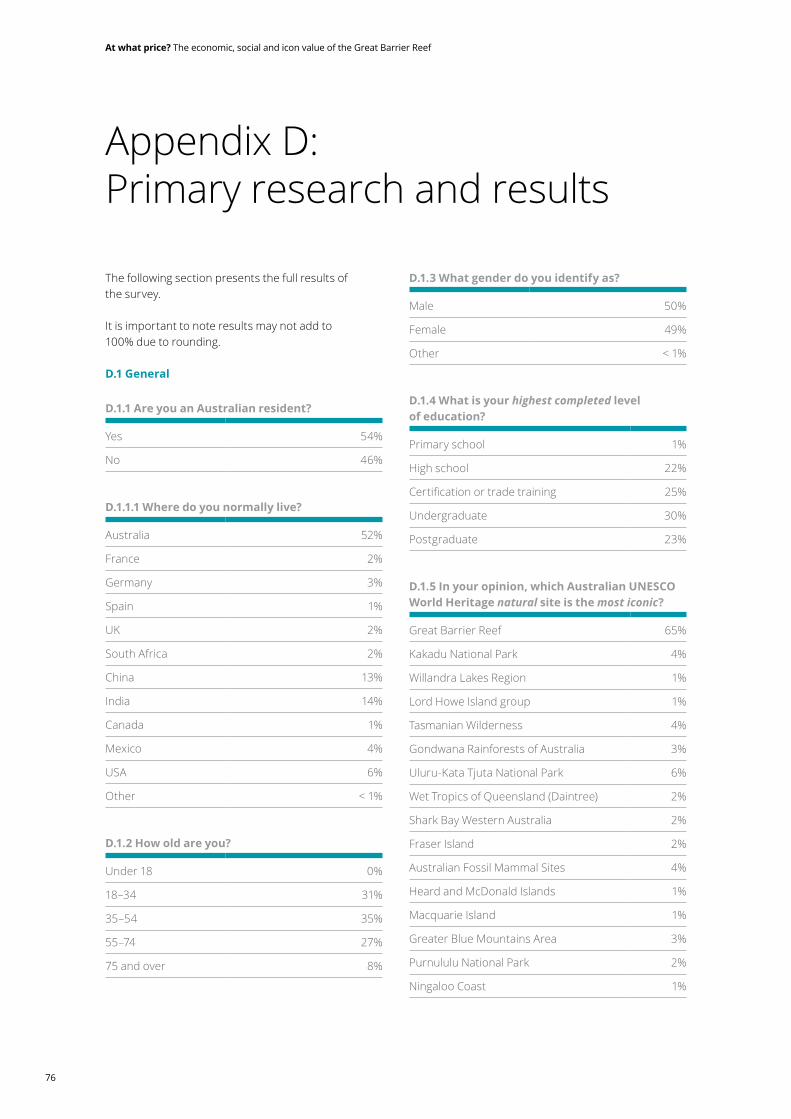
Appendix D: Primary research and results
The following section presents the full results of the survey.
It is important to note results may not add to 100% due to rounding.
D.1 General
D.1.1 Are you an Australian resident?
Yes 54%
No 46%
D.1.1.1 Where do you normally live?
Australia 52%
France 2%
Germany 3%
Spain 1%
UK 2%
South Africa 2%
China 13%
India 14%
Canada 1%
Mexico 4%
USA 6%
Other < 1%
D.1.2 How old are you?
Under 18 0%
18–34 31%
35–54 35%
55–74 27%
75 and over 8%
D.1.3 What gender do you identify as?
Male 50%
Female 49%
Other < 1%
D.1.4 What is your highest completed level of education?
Primary school 1%
High school 22%
Certificationortradetraining 25%
Undergraduate 30%
Postgraduate 23%
D.1.5 In your opinion, which Australian UNESCO World Heritage natural site is the most iconic?
Great Barrier Reef 65%
Kakadu National Park 4%
Willandra Lakes Region 1%
Lord Howe Island group 1%
Tasmanian Wilderness 4%
Gondwana Rainforests of Australia 3%
Uluru-Kata Tjuta National Park 6%
Wet Tropics of Queensland (Daintree) 2%
Shark Bay Western Australia 2%
Fraser Island 2%
Australian Fossil Mammal Sites 4%
Heard and McDonald Islands 1%
MacquarieIsland 1%
Greater Blue Mountains Area 3%
Purnululu National Park 2%
Ningaloo Coast 1%
At what price? The economic, social and icon value of the Great Barrier Reef
76

D.1.5.1 Why did you pick the Great Barrier Reef? (Select all that apply)
Itisthemostuniqueonthelist 33%
It is one of the seven natural wonders of the world
43%
It is one of the most beautiful places in Australia
52%
Most people know what it is 45%
I don’t know any others on the list 7%
It is the most famous on the list 44%
Other 3%
D.1.6 Do you agree/disagree with the following statements?
Stro
ngly
A
gree
Agr
ee
Neu
tral
Dis
agre
e
Stro
ngly
D
isag
ree
The Great Barrier Reef is an iconic Australian landmark that contributes to Australia’s national identity and international standing
63% 32% 4% 1% < 1%
The Great Barrier Reef contributes to Australia’s cultural identity
42% 39% 17% 2% < 1%
TheGreatBarrierReefoffersauniqueexperience thatisnotofferedanywhereelseintheworld
48% 38% 12% 2% 1%
The Great Barrier Reef contributes to Australia’s brand globally
57% 35% 7% 1% < 1%
D.1.7 Have you ever visited the Great Barrier Reef?
Yes 43%
No 57%
D.1.8 Have you visited the Great Barrier Reef in the past five years?
Yes 30%
No 70%
77
At what price? | Appendix D: Primary research and results

D.1.8.1 What was the main reason for your visit?
Dom
esti
c
Inte
r-na
tion
alBusiness (you travelled for work)
< 1% 2%
Holiday (you went as a tourist) 27% 16%
Visiting family and friends 7% 3%
Recreational use (you live close by and a regular visitor to the Reef)
2% < 1%
Did not visit 63% 79%
D.2 Tourist Respondents
D.2.1 In the past five years, how many times have you visited the Great Barrier Reef? This includes visiting the beaches, swimming, snorkelling and sightseeing around the Reef.
Dom
esti
c
Inte
r-na
tion
al
1 40% 59%
2 21% 27%
3 12% 8%
4 4% 2%
5 8% 4%
More than 5 15% 0%
D.2.2 How many persons (excluding yourself) were you financially responsible for on this trip?
Dom
esti
c
Inte
r-na
tion
al
I did not pay for this trip 7% 5%
I only paid for myself on this trip 28% 28%
1 other person 32% 26%
2 other people 12% 17%
3 other people 14% 16%
4 other people 5% 4%
5 other people 1% 2%
More than 5 others 1% 1%
At what price? The economic, social and icon value of the Great Barrier Reef
78

D.2.3 How many nights were you away from home in total? Include any other travel not related to the Great Barrier Reef.268 domestic and 128 international respondents
D.2.4 How many nights did you stay at the Great Barrier Reef specifically? This includes, for example, accommodation in Cairns or Townsville. 268 domestic and 128 international respondents
D.2.5 Please estimate the total cost of your trip for all persons.
Travel costs (e.g.flights,vehiclecosts,cruise/ferry/bus tickets)
268 domestic and 128 international respondents
Accommodation (e.g. hotel, unit, Airbnb, campsite, caravan)
268 domestic and 128 international respondents
Meals and incidentals (e.g. lunch cost)
268 domestic and 128 international respondents
Organised touring (e.g. scuba diving, site seeing, boating)
268 domestic and 128 international respondents
Individualequipmenthire(e.g. personal scuba diving gear,paddleboards,fishingequipment)
268 domestic and 128 international respondents
Other costs 268 domestic and 128 international respondents
D.2.6 What was the main reason you chose to visit Australia?
International
Visiting the Great Barrier Reef 52%
Visiting other attractions in Australia
12%
Experiencing Australian culture 32%
Other 4%
D.3 Non-Users
D.3.1 What do you think is the biggest threat to the health of the Great Barrier Reef?
Dom
esti
c
Inte
r-na
tion
al
Climate change 44% 46%
Impacts from farming on waterquality
6% 4%
Growing cities next to the Reef 3% 13%
Overuse of the Reef 13% 14%
Mining activities next to the Reef
23% 11%
There is no threat to the Great Barrier Reef
2% 1%
Other… Specify 3% 1%
Don’t know 6% 10%
79
At what price? | Appendix D: Primary research and results

D.3.2 Do you think climate change is caused by human activity?
Dom
esti
c
Inte
r-na
tion
al
Yes 69% 87%
No 15% 8%
Don’t Know 16% 6%
D.3.3 Will you likely visit the Great Barrier Reef in the future?
Dom
esti
c
Inte
r-na
tion
al
Yes 63% 60%
No 9% 11%
Don’t know 28% 29%
D.3.4 How much are you willing to pay weekly to guarantee that the Great Barrier Reef is protected?10
Dom
esti
c
Inte
r-na
tion
al
$0 42% 27%
$0.44 per week 21% 25%
$1.15 per week 19% 19%
$2.33 per week 6% 8%
$3.58 per week 3% 6%
$4.75 per week 5% 4%
$7.19 per week 1% 3%
$8.40 per week < 1% 1%
$9.62 per week < 1% 1%
$10 per week 2% 2%
$15 per week 1% 3%
More than $15 per week < 1% 1%
10.Thisquestionwasaskedafterframingthecontingentvaluationscenario.ThescenarioincludedaGreatBarrierReefFutureHealthCharge that all Australians had to pay. The respondent was told that their payment would guarantee that the GBR was protected andwouldreflectthatofthe“takeaction”scenario,ratherthanthe“changenothing”scenariopresentedinChapter2(HeronIslandResearch Station).
At what price? The economic, social and icon value of the Great Barrier Reef
80
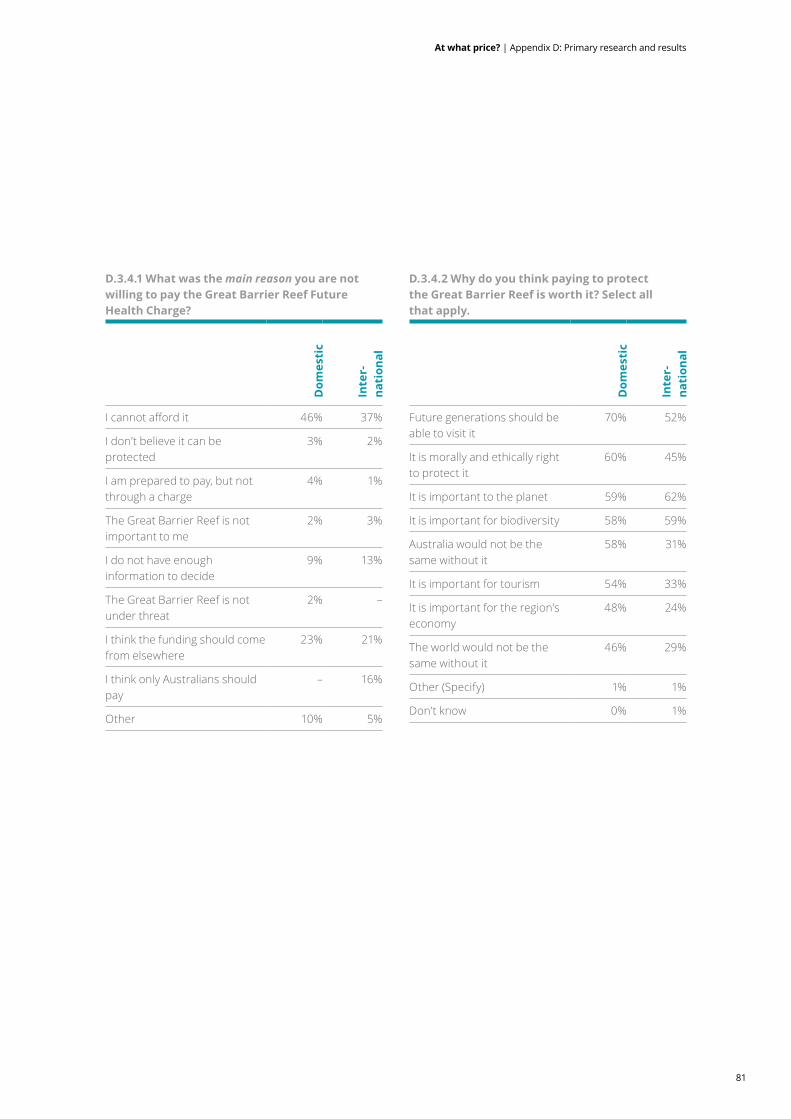
D.3.4.1 What was the main reason you are not willing to pay the Great Barrier Reef Future Health Charge?
Dom
esti
c
Inte
r-na
tion
al
Icannotaffordit 46% 37%
I don’t believe it can be protected
3% 2%
I am prepared to pay, but not through a charge
4% 1%
The Great Barrier Reef is not important to me
2% 3%
I do not have enough information to decide
9% 13%
The Great Barrier Reef is not under threat
2% –
I think the funding should come from elsewhere
23% 21%
I think only Australians should pay
– 16%
Other 10% 5%
D.3.4.2 Why do you think paying to protect the Great Barrier Reef is worth it? Select all that apply.
Dom
esti
c
Inte
r-na
tion
al
Future generations should be able to visit it
70% 52%
It is morally and ethically right to protect it
60% 45%
It is important to the planet 59% 62%
It is important for biodiversity 58% 59%
Australia would not be the same without it
58% 31%
It is important for tourism 54% 33%
It is important for the region’s economy
48% 24%
The world would not be the same without it
46% 29%
Other (Specify) 1% 1%
Don’t know 0% 1%
81
At what price? | Appendix D: Primary research and results
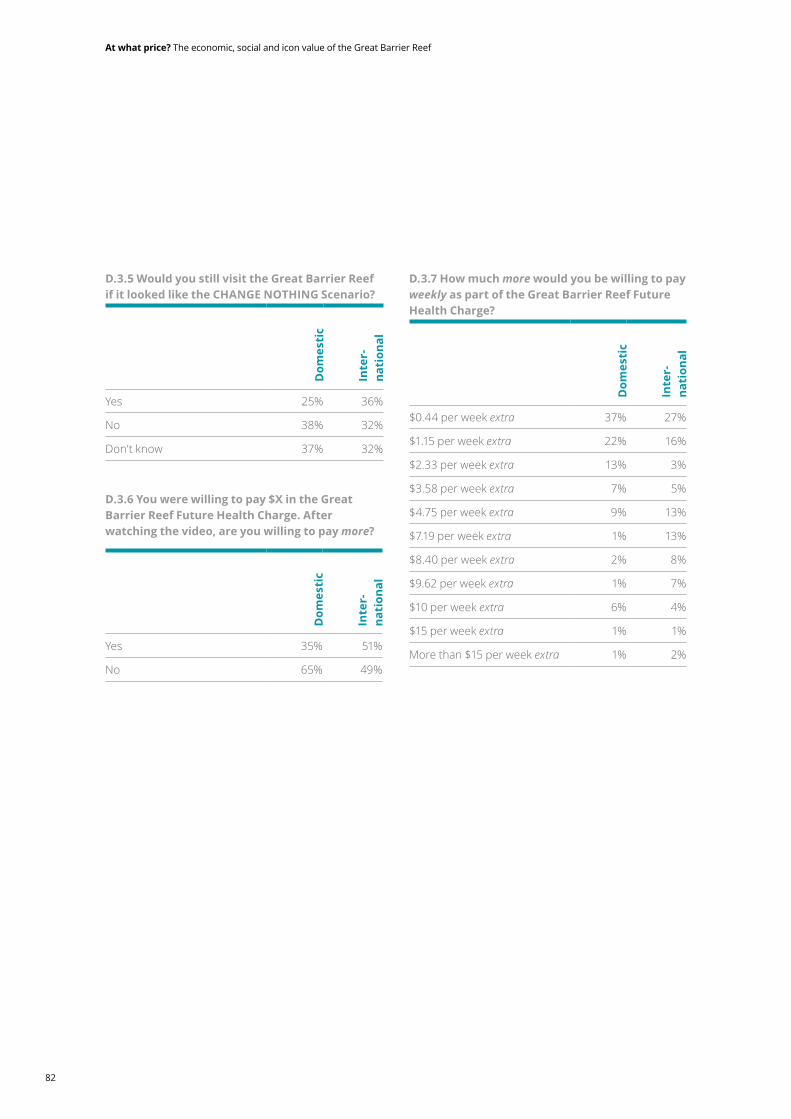
D.3.5 Would you still visit the Great Barrier Reef if it looked like the CHANGE NOTHING Scenario?
Dom
esti
c
Inte
r-na
tion
al
Yes 25% 36%
No 38% 32%
Don’t know 37% 32%
D.3.6 You were willing to pay $X in the Great Barrier Reef Future Health Charge. After watching the video, are you willing to pay more?
Dom
esti
c
Inte
r-na
tion
al
Yes 35% 51%
No 65% 49%
D.3.7 How much more would you be willing to pay weekly as part of the Great Barrier Reef Future Health Charge?
Dom
esti
c
Inte
r-na
tion
al
$0.44 per week extra 37% 27%
$1.15 per week extra 22% 16%
$2.33 per week extra 13% 3%
$3.58 per week extra 7% 5%
$4.75 per week extra 9% 13%
$7.19 per week extra 1% 13%
$8.40 per week extra 2% 8%
$9.62 per week extra 1% 7%
$10 per week extra 6% 4%
$15 per week extra 1% 1%
More than $15 per week extra 1% 2%
At what price? The economic, social and icon value of the Great Barrier Reef
82

Appendix E: Economic, social and icon value
E.1 Non-use valueE.1.1 Assumptions As continent valuation is hypothetical in nature, it is subject to a range of biases. The magnitude of these biases can be reduced with careful survey design and testing a pilot survey.
E.1.1.1 Willingness to pay vs willingness to acceptOne of the key assumptions that can lead to large differencesinestimateishowthepricetrade-offiscommunicated in the survey. The contingent valuation questionisusuallyframedinsuchawaythatitdirectlyasks a respondent how much they are WTP to prevent adecreaseinreefqualityorWTAascompensationifsuch a decrease was to occur.
In most cases WTA produces a higher estimate than WTP,withHammackandBrown(2016)findingthatWTA reported estimates four times larger than WTP. In order to remain conservative with our estimates, the contingentvaluationquestionwasframedtoelicitanindividual’s WTP.
E.1.1.2 Pricing techniquesWTPcanbeelicitedfromthreecommontechniques:payment card, dichotomous choice and open-ended questioning.Bothdichotomouschoiceandpaymentcardmethodsaresuperiortoopen-endedquestionsin that they account for uncertainty in respondents’ preferencesthroughallowingthemtotrade-offbetweenWTPoptions.Thepaymentcardtechniquehas the relative advantages over dichotomous choice ofbeingeffectiveforonlinesurveys,moreinformative,and avoiding anchoring and ‘yeah saying’ (giving positive but possibly false responses) when a sole bid is presented.
Thepaymentcardtechniqueisalsosubject to bias resulting from survey design of interval size and range of monetary options. To alleviate a lot of this bias we followed the payment options in Kotchen, Boyle & Leiserowitz, (2012).
A maximum amount of $15+ and a no payment option of $0 were established, then a middle amount of $7.19wassetandsubsequentmiddleamountssetabove ($8.40, $9.62, 10 and 15) and below ($4.75, $3.58, $2.33, $1.15). Figures such as $2.50 and $4 are avoided as people are more likely to answer ‘yes’ to lower even amounts than odd numbers that are veryclose.Finallyalowerfigureof$0.44wasaddedas most people are usually willing to pay a modest amount. This approach yields conservative results and is in line with NOAA Blue Ribbon Panel’s guidelines for Contingent Valuation.
E.1.2 Average WTP TheaverageWTPfigurewerecalculatedperstateand per country for domestic and international non-users using the survey data. The average WTP figuresencapsulaterespondentsthatwereWTPzerosothattheestimateswereanhonestreflectionofthe domestic and international non-user’s WTP. This techniquereflectsthemethodologyusedinDAE’s2013 Sydney Opera House: economic, cultural and digital value study and their 2016 study of the Economic and social value of improved water quality at Sydney’s coastal beaches.
E.1.2.1 Domestic valueTheaverageWTPfigurefortheAustralianpopulationwas $1.30 per week. All respondents that selected that they would be WTP more than $15 per week (n=4), stated that they would be WTP $20 per week in theopenresponse.TheaverageWTPfigurewasthenextrapolated against the entire Australian population over the age of 18, 18,715,742 people.11
11. As at June 2016 ABS 3101.0 – Australian Demographic Statistics, Sep 2016 83
At what price? | Appendix E: Economic, social and icon value
E.1.2.2 International value The major issue with extrapolating international WTPestimatesisthatitisdifficulttoaccurately discern an applicable population for modelling from research results.
The results showed that respondents from developing countries were relatively wealthier than the average, and respondents from developed countries were relatively poorer than the average. This was likely due to wide discrepancy between emerging and developed countries in regards to access to the internet, and therefore presence in the online survey.
Theextrapolationofthesefigureswasthereforeavoided due to a relatively small sample size representing the WTP of the international population. However,aweeklyWTPfigurecanbeproducedfromthesurvey sample.
The respondents that selected that they were WTP over $15 per year was assumed to be WTP $20, asthiswasthefigurereportedbythedomesticresponses. This was assumed to remain conservativeandtoensuredataisnot skewed.
The weekly WTP was then averaged across the 555 international respondent sample size.
E.2 Indirect use valueE.2.1 Ecosystem servicesTheGBR’secosystemservicesprovidessignificanteconomic and social value, which needed to be considered as part of this valuation. The ABS released an Experimental Ecosystem Account for the Great Barrier Reef Region in 2015 that accounts for the stock of ecosystem services and condition in both monetary and physical terms.
To use the monetary terms from the ABS Ecosystem Accountwewouldneedtoconvertthestockfigure(actual)toflowfigures(marginal)andseparatetheecosystem services provided by the terrestrial and river ecosystems from the marine ecosystem. An example of this is for the agriculture industry, where the ecosystem service value is made up of the services provided by multiple ecosystems (primarily terrestrial). As the proportion that is attributable to the GBR’s marine ecosystem cannot be separated from other ecosystems, it would be inappropriate to include it in analysis.
TheecosystemservicetheGBRprovidestothefishingand tourism industry can largely be attributable to the GBR’s marine ecosystem. However, including this in the analysis could result in a double count, as it the economic contribution would have discreetly captured a proportion of this value.
An alternative to using the ABS Ecosystem accounts, is to evaluate an individual’s willingness to pay (WTP) toconserveaspecificecosystemflow.Thiswouldhave also resulted in a double count as a proportion of this value would likely be encapsulated in the non-use value.
E.3 Direct use value E.3.1 TourismThe zonal travel cost model is often used to estimate the direct use values of tourism sites visited infrequentlybytravellersfromafar.Thisisduetoindividuals who have to travel a long distance to access thesiteinquestionhavingalowtripfrequency.Whenthereisalotofindividualswithalowtripfrequency (e.g.1tripayear)inthesample,itisdifficult to derive a relationship between travel cost and demand for visitation.
Thequestionnaireaskedforthenumberoftripsrespondentsmakeeveryfiveyears,ratherthanannually. This provided us with more variation in the dependentvariable(tripfrequency).Thisallowedustoderive a demand curve using the individual travel cost model, which has more explanatory power than the zonal travel cost method.
At what price? The economic, social and icon value of the Great Barrier Reef
84

The travel cost method involves making a number of assumptions appropriate to the site under investigation. Three key assumptions that often lead todifferencesinestimatesarethetreatmentoftime,multipurpose trips and international visitors.
E.3.1.1 Travel timeThe value of time is based on the notion of opportunity cost.Thisisdefinedasthebenefitthatapersonwouldhave experienced by undertaking the next best activity with the time spent travelling to the recreation site (Parsons, 2003).
There is no commonly agreed upon method to measure this opportunity cost. However, it is often assumed to be a proportion of income. Beal (1995) contested the inclusion of travel time in travel cost modelsduetofull-timeworkershavingfixedworkinghours and paid leave for leisure. He also reasoned that opportunity cost isn’t only related to income foregone, but also to other leisure activities, meaning that the value of time is variable between an individual’s preferences.
A number of articles (Pascoe et al., 2014; Rolfe & Dyack, 2011 and Rolfe & Prayaga, 2007) applied a zero costfiguretotraveltime,whichhasbeenassumedinthis report in order to align with the literature and to remain conservative in our estimates.
E.3.1.2 Multiple-site visitsAnother major assumption of the travel cost method is that all of the accrued travel costs are incurred exclusively to access one site. Due to the high costs oftravellingtoalocationthatrequiredflightsandaccommodation, such as the GBR, visitors often engage in other activities at the site or visit other sites during their trip. Failure to distinguish between multiple purpose visitors than those that solely visited the GBR, would result in bias (Parsons, 2003).
Despite multi-purpose trips receiving consideration in literature, there has been no single theoretical approach that has been agreed upon to address this issue (Ward & Loomis, 1986). Common approaches are, to either assume all trips are single purpose, adjust multiple purpose visitors travel costs to a portion of total cost or to drop all multi-purpose visitors from analysis altogether (Pascoe et al., 2014).
The most appropriate approach for this report was to ask respondents how many days in total they spent away from home and how many days were spent at the GBR, as detailed in Appendix D. The total travel cost of the trip was then allocated proportionately to the GBR.
E.3.1.3 Treatment of international visitors The treatment of international visitors varies in GBR literature, see for example, Carr & Mendelsohn (2003)andPrayagaetal.(2006).Tourismbenefitstointernational visitors are of interest to this report, however, it attract enough respondents to have a reliable sample proved challenging. IPSOS attracted 130 respondents. The individual and zonal travel cost methodwasattemptedbutduetoaninsufficientvariation the dependent variable (number of trips between individuals/zones), a demand curve could not be derived. Therefore, international tourism was not included in the analysis.
E.3.1.4 Model specification An individual’s demand to visit the GBR is determined bytheirtripfrequency,whichthetravelcostmethodassumes to be a function of their travel costs and socio-economic characteristics. The standard demand curve for an individual i can be written as:
�i = �(�i ) + �
Where �i is the number of trips to the GBR, and �i is a vectoroffactorsinfluencingdemandwhicharetravelcost, income, gender, age and education, and � is a random error term.
Ordinaryleastsquaresregressionmethodsare not commonly used to model to travel cost data due to the non-negative nature of the dependent variable (number of trips) in tourism data. Therefore, a count model was chosen over standard regression techniquesastheyestimatetheprobabilityof an individual choosing to visit the GBR. A Poisson regression is a popular count model to use, however, it assumes that the mean and variance of the data areequalandwillreturnbiasedresultsifusedon data that has overdispersion.
85
At what price? | Appendix E: Economic, social and icon value

A likelihood ratio test performed on the Poisson regressionconfirmedthatourdatawascharacterisedwith overdispersion, therefore, a negative binomial regression was employed as it corrects for bias by adding in an additional parameter � into the probability function. The probability function of a negative binomial model is given by:
Where Γ(•) is the gamma probability density function evaluated at (•), and � > 0 is an independently and identically distributed random variable with density �(�|�)(Martínez-Espiñeira&Amoako-Tuffour,2008).This collapses to Poisson distribution when the overdispersion parameter, �isequaltozero (Pascoe et al., 2014).
Several functional forms were tested and the double log functionalformwasdeterminedasbestfit,incomparisonto the linear and log-liner forms. Due to this functional form the consumer surplus had to be measured at multiple points. The model found that visitors place a highvalueontheirfirsttriptotheGBR,withthisvaluedepreciating as more trips are taken. $662 is the weighted average that takes this variation into account and visitors thattakemultipletripsoverfiveyears.
E.3.1.5 Visitor numbers TRA data on intrastate and interstate overnight trips withintheGBRNRMregions,specifiedinChapter2,were used to calculate the annual visitor numbers to the GBR. As it is unlikely that 100% of “holiday” visitors to the NRM regions visited the GBR, visitor numbers were adjusted by applying a set of assumptions.
We conservatively assumed that only 50% of the visitorstoBurdekin,CapeYork,BurnettMaryandFitzroy visited the GBR, with popular entry points to the GBR such as, Mackey Whitsunday and Wet tropics, getting a larger weighting of 90%. This adjustment resulted in the total number of domestic overnight visitors to the GBR being 2.3 million for 2016.12
E.3.2 Recreation Benefitstransferscanresultinbiasedestimates if the transfer site and study site are immensely different.Fortunately,therearenumerousrecreationvaluation studies that use the GBR as a case study. The appropriateness of the GBR studies were judged on the following criteria: • Robustness of estimates • Appropriateness of non-market valuation techniqueandapplication
• Abilitytofitgeographicscope
If the case studies failed on any of the above criteria, they would be deemed inappropriate and primary research would have been undertaken. This was unnecessary as the estimates in Rolfe & Gregg (2012) were robust and covered the full GBR scope covered in this report.13
E.3.2.1 Visitor numbersTRA data on intrastate day trips within the GBR NRM regions,specifiedinChapter2,wereusedtocalculatethe annual recreation visitor numbers to the GBR. As it is unlikely that 100% of visitors to the region visited the GBR, therefore, we adjusted the TRA data in line with the domestic overnight visitor numbers, detailed in C.3.1.5. This adjustment resulted in the total intrastate day trips to the GBR becoming 3,989,898.
12.TRAcategorisesallvisitorsaseither,“holiday”,“visitingfriendsandrelatives”,“business”or“other”whichreflectsthevisitor’smainpurposeoftrip.13. All of the regions in the Rolfe & Gregg (2012) study were included in the analysis, except for Bundaberg. It was determined that general recreational
activities undertaken as a "day trip" in Bundaberg would not be attributable to the GBR. The Bundaberg estimate was therefore not included in order to remain conservative.
At what price? The economic, social and icon value of the Great Barrier Reef
86
Appendix F: Valuing the future and the discount rate
F.1 Valuing the future and the discount rate Itisverydifficultto‘discount’thefutureoftheGBR.Somepeoplefinditimpossibleorsimplywrongto‘discount’ the future of something as important as the GBR. But it is important to recognise intergenerational benefitsandwelfareindeterminingthetotalsocialandeconomicassetvalue.Thisraisesthequestionofhowfuture generations are valued relative to the present when it comes to the GBR. How much value is attributed to those who are not even born yet? In comparing welfare,utilityandbenefitsacrossgenerations,thediscount rate needs to be determined.
F.1.1 Discount rateTheRamseyequationisusedtocalculatethediscountrate applied to determine the NPV social and economic assetvalueoftheGBR.TheRamseyequationisbrokendown into two main components:
r = δ+ ηg
Thefirstistherateoftimepreference(δ), or, the rate that utility is discounted for future generations. If the numberispositive,presentbenefitrealisationisgivenahigherutilityweightingthanbenefitsrealisedbyfuturegenerations. If the time preference is zero, or close to zero, there is no discount placed on future generations andintergenerationalutilityisequallyweighted.Inthecontext of assessing the social and economic value of the GBR, it is ethically appropriate to distribute welfare equallyacrossgenerations.Assuch,anear-zeropurerate of time preference is appropriate and we have adopted rate 0.05 per cent. This is the same rate as the Garnaut Climate Change Review 2008 and similar to the Stern Review 2007 (Table F.1).
The second component includes the elasticity of the marginal utility of consumption (η) and the growth rate of the economy (g). The marginal elasticity of utility of consumption measures society’s concern for equityinincomedistribution.Again,turningtotheGarnaut Climate Change Review 2008, an elasticity of 1 is a common choice in literature and while there are differingviews,wehaveadoptedanelasticityof1.Thegrowth rate of the economy is assumed as the average annual GDP chain volume measures percentage change from 1987 to 2017, 5204.0 Australian System of National Accounts. It is important to note that when considering the environment, and potential depletions of natural capital from development, that GDP growth it not necessarily a good measure of this or of wellbeing. However, in the absence of an Australian net national welfare measure, a long-term economic growth rate is appropriate.
UsingtheRamseyequationandtheassumedparameters, a social discount rate of 3.7% is produced. This discount rate applies to the total social and economic asset calculations over the selected time period.
F.1.2 Time periodThe time period over which to model the asset value of the GBR takes into account several considerations. Fundamentally, the discounted present value of benefitsshouldataminimumbeconsideredoverthelifespanofthepresentgeneration.Thisrequiresthetime period to usually exceed two decades, particularly when considering the value of environmental assets that typically take a long time to change. However, in the context of this study, the GBR is currently facing severe threats to its future health. Therefore, to model thebenefitsoveraperiodoftimeaslongas50years,for example, would not consider potential damage to the GBR, changes in people’s values and the ultimate benefittheyreceivefromit.
87
At what price? | Appendix F: Valuing the future and the discount rate

We consider the time period of 33 years to be suitablefortheassetvaluecalculation.33 yearsisthe time period from present day out to the end of the Australian Government Reef 2050 Long-Term Sustainability Plan. The Reef 2050 Plan is Australia’s response to the World Heritage Committee’s recommendation that a long-term plan for sustainable development to protect the Outstanding Universal Value of the Reef be developed. The Plan considers ecosystem health, biodiversity, heritage, water quality,communitybenefits,economicbenefitsandgovernance as priorities for action14. To measure the GBR’s value beyond the timeline of the long term sustainability plan would produce a degree of uncertainty in the results.
F.1.3 Sensitivity The asset value of the GBR is sensitive to the discount rate and time period applied to its modelling.
Table F.2 presents a sensitivity analysis from applying differentdiscountratesandtimeperiods.
Table F.2: Sensitivity analysis
Discount rate
Time period
Total economic, social and icon value
1.5% 33 years $77 billion
7% 33 years $37 billion
3.7% 50 years $67 billion
1.5% 50 years $104 billion
7% 50 years $41 billion
14. Australian Government and Queensland Government, 2015
Table F.1: Key social discount rates considered
Study ValuationActivity/asset measured
Discount Rate Logic
Costanza et al. (2008)
Non-useEcosystem service – Hurricane protection
3%No explicit reasoning, standard social rate.
United states environmental protection agency
Environmental costs andbenefits
General environment 2–3%General guidance for natural capital future costsandbenefits
Stern review (2007)
Climate change review
Climate change damages 1.4%Based on the Ramseyequation
Garnaut Review (2008)
Climate change review
Climate change damages 1.35–2.65%Based on literature and Stern Review parameters
At what price? The economic, social and icon value of the Great Barrier Reef
88

Authors
Limitation of our workGeneral use restrictionThis report is prepared for the use of The Great Barrier Reef Foundation. This report is not intended to and should not be used or relied upon by anyone else and we accept no duty of care to any other person or entity. The report has been prepared for the purpose of calculating the economic, social and icon value of the Great Barrier Reef. Youshouldnotrefertooruseournameortheadviceforanyotherpurpose.
John O’MahonyPartnerE: [email protected]: +61 2 9322 7877
David RedhillPartner & CMOGlobal Consulting
Claire AtkinsonSenior Economist
Dr. Ric SimesPartnerE: [email protected]: +61 2 9322 7772
Kelly HeatonAssociate Director
Emily HaywardEconomist
Mai NguyenEconomist
At what price? | Authors
Contact us
Deloitte Access EconomicsACN: 149 633 116Riverside Centre 123 Eagle St Brisbane QLD 4000 Australia
Tel: +61 7 3308 7000
Deloitte Access Economics is Australia’s pre-eminent economics advisory practice and a member of Deloitte’s global economics group. For more information, please visit our website.
Deloitte refers to one or more of Deloitte Touche Tohmatsu Limited, a UK private company limited by guarantee, and its network of member firms, each of which is a legally separate and independent entity. Please see www.deloitte.com/au/about for a detailed description of the legal structure of Deloitte Touche Tohmatsu Limited and its member firms.
The entity named herein is a legally separate and independent entity. In providing this document, the author only acts in the named capacity and does not act in any other capacity. Nothing in this document, nor any related attachments or communications or services, have any capacity to bind any other entity under the ‘Deloitte’ network of member firms (including those operating in Australia).
About DeloitteDeloitte provides audit, tax, consulting, and financial advisory services to public and private clients spanning multiple industries. With a globally connected network of member firms in more than 150 countries, Deloitte brings world-class capabilities and high-quality service to clients, delivering the insights they need to address their most complex business challenges. Deloitte’s approximately 200,000 professionals are committed to becoming the standard of excellence.
About Deloitte AustraliaIn Australia, the member firm is the Australian partnership of Deloitte Touche Tohmatsu. As one of Australia’s leading professional services firms. Deloitte Touche Tohmatsu and its affiliates provide audit, tax, consulting, and financial advisory services through approximately 6000 people across the country. Focused on the creation of value and growth, and known as an employer of choice for innovative human resources programs, we are dedicated to helping our clients and our people excel. For more information, please visit our web site at www.deloitte.com.au.
Liability limited by a scheme approved under Professional Standards Legislation.
Member of Deloitte Touche Tohmatsu Limited.
© 2017 Deloitte Touche Tohmatsu.
MCBD_Syd_06/17_054482