delivers best first quarter financial results in company’s ... · delivers best first quarter...
TRANSCRIPT

Immediate Release: April 22, 2014
Canadian Pacific reports Q1-2014 net income of C$254M or C$1.44 per diluted share
Delivers best first quarter financial results in company’s history Calgary, AB - Canadian Pacific Railway Limited (TSX: CP) (NYSE: CP) today announced record Q1 2014 financial results. Reported net income in the first quarter was $254 million, or $1.44 per diluted share, versus $217 million, or $1.24 per share, in the first quarter of 2013. This represents a 16 per cent year-over year improvement in earnings per share. FIRST-QUARTER 2014 RESULTS COMPARED WITH FIRST-QUARTER 2013: • Total revenues were $1,509 million, an increase of 1 per cent • Operating expenses were $1,086 million, a decrease of 4 per cent • Operating income was $423 million, an increase of 17 per cent • Operating ratio was 72.0 per cent, a 380 basis point improvement "CP delivered solid results in a period that was severely impacted by extraordinary cold and severe winter weather conditions,” said E. Hunter Harrison, Chief Executive Officer. “In the face of such difficult operating conditions, I am particularly proud of the women and men of CP who remained on the job 24/7, to keep the railway operating.” “Despite a slow start to the year and the reduced capacity which limited our ability to meet strong customer demand, we still have the utmost confidence in our ability to achieve our financial targets for 2014.”
-30- Note on forward-looking information This news release contains certain forward-looking information within the meaning of applicable securities laws relating, but not limited, to our operations, priorities and plans, anticipated financial performance, purchases of common shares for cancellation under CP's share repurchase program, future sources of capital, business prospects, planned capital expenditures, programs and strategies. This forward-looking information also includes, but is not limited to, statements concerning expectations, beliefs, plans, goals, objectives, assumptions and statements about possible future events, conditions, and results of operations or performance. Forward-looking information may contain statements with words or headings such as “financial expectations”, “key assumptions”, “anticipate”, “believe”, “expect”, “plan”, “will”, “outlook”, “should” or similar words suggesting future outcomes. Undue reliance should not be placed on forward-looking information as actual results may differ materially from the forward-looking information. Forward-looking information is not a guarantee of future performance. By its nature, CP’s forward-looking information involves numerous assumptions, inherent risks and uncertainties that could cause actual results to differ materially from the forward-looking information, including but not limited to the following factors: changes in business strategies; general North American and global economic, credit and business conditions; risks in agricultural production such as weather conditions and insect populations; the availability and price of energy commodities; the effects of competition and
1

pricing pressures; industry capacity; shifts in market demand; changes in commodity prices; uncertainty surrounding timing and volumes of commodities being shipped via CP; inflation; changes in laws and regulations, including regulation of rates; changes in taxes and tax rates; potential increases in maintenance and operating costs; uncertainties of investigations, proceedings or other types of claims and litigation; labour disputes; risks and liabilities arising from derailments; transportation of dangerous goods; timing of completion of capital and maintenance projects; currency and interest rate fluctuations; effects of changes in market conditions and discount rates on the financial position of pension plans and investments; and various events that could disrupt operations, including severe weather, droughts, floods, avalanches and earthquakes as well as security threats and governmental response to them, and technological changes. The foregoing list of factors is not exhaustive. These and other factors are detailed from time to time in reports filed by CP with securities regulators in Canada and the United States. Reference should be made to “Management’s Discussion and Analysis” in CP’s annual and interim reports, Annual Information Form and Form 40-F. Readers are cautioned not to place undue reliance on forward-looking information. Forward-looking information is based on current expectations, estimates and projections and it is possible that predictions, forecasts, projections, and other forms of forward-looking information will not be achieved by CP. Except as required by law, CP undertakes no obligation to update publicly or otherwise revise any forward-looking information, whether as a result of new information, future events or otherwise. About Canadian Pacific Canadian Pacific (TSX:CP)(NYSE:CP) is a transcontinental railway in Canada and the United States with direct links to eight major ports, including Vancouver and Montreal, providing North American customers a competitive rail service with access to key markets in every corner of the globe. CP is a low-cost provider that is growing with its customers, offering a suite of freight transportation services, logistics solutions and supply chain expertise. Visit www.cpr.ca to see the rail advantages of Canadian Pacific. Contacts Media Ed Greenberg Tel.: 612-849-4717 24/7 Media Pager: 855-242-3674 email: [email protected] Investment Community Nadeem Velani Tel.: 403-319-3591 email: [email protected]
2

CANADIAN PACIFIC RAILWAY LIMITED
INTERIM CONSOLIDATED STATEMENTS OF INCOME (in millions of Canadian dollars, except per share data) (unaudited) For the three months ended March 31 2014 2013 Revenues Freight $ 1,474 $ 1,459 Other 35 36 Total revenues 1,509 1,495 Operating expenses Compensation and benefits (Note 2) 355 402 Fuel 271 270 Materials 89 72 Equipment rents 41 46 Depreciation and amortization 141 141 Purchased services and other 189 202 Total operating expenses 1,086 1,133 Operating income 423 362 Less: Other income and charges - 3 Net interest expense 70 70 Income before income tax expense 353 289 Income tax expense (Note 3) 99 72 Net income $ 254 $ 217 Earnings per share (Note 4) Basic earnings per share $ 1.45 $ 1.25 Diluted earnings per share $ 1.44 $ 1.24 Weighted-average number of shares (millions) (Note 4) Basic 175.5 174.3 Diluted 177.0 175.8 Dividends declared per share $ 0.3500 $ 0.3500 See Notes to Interim Consolidated Financial Statements.
3

CANADIAN PACIFIC RAILWAY LIMITED
INTERIM CONSOLIDATED STATEMENTS OF COMPREHENSIVE INCOME (in millions of Canadian dollars) (unaudited) For the three months ended March 31 2014 2013 Net income $ 254 $ 217 Net loss on foreign currency translation adjustments, net of hedging activities - (2) Change in derivatives designated as cash flow hedges (1) 1 Change in pension and post-retirement defined benefit plans 31 188 Other comprehensive income before income tax expense 30 187 Income tax recovery (expense) 8 (40) Other comprehensive income (Note 2) 38 147 Comprehensive income $ 292 $ 364 See Notes to Interim Consolidated Financial Statements.
4

CANADIAN PACIFIC RAILWAY LIMITED
INTERIM CONSOLIDATED BALANCE SHEETS AS AT MARCH 31, 2014 (in millions of Canadian dollars) (unaudited) March 31 December 31 2014 2013 Assets Current assets Cash and cash equivalents $ 279 $ 476 Restricted cash and cash equivalents 409 411 Accounts receivable, net 723 580 Materials and supplies 190 165 Deferred income taxes (Note 3) 345 344 Other current assets 64 53 2,010 2,029 Investments 98 92 Properties 13,518 13,327 Assets held for sale 230 222 Goodwill and intangible assets 168 162 Pension asset (Note 8) 1,092 1,028 Other assets 199 200 Total assets $ 17,315 $ 17,060 Liabilities and shareholders’ equity Current liabilities Accounts payable and accrued liabilities $ 1,144 $ 1,189 Long-term debt maturing within one year (Note 6) 95 189 1,239 1,378 Pension and other benefit liabilities (Note 8) 663 657 Other long-term liabilities 348 338 Long-term debt (Note 6) 4,774 4,687 Deferred income taxes 3,028 2,903 Total liabilities 10,052 9,963 Shareholders’ equity Share capital (Note 5) 2,253 2,240 Additional paid-in capital 36 34 Accumulated other comprehensive loss (Note 2) (1,465) (1,503) Retained earnings 6,439 6,326 7,263 7,097 Total liabilities and shareholders’ equity $ 17,315 $ 17,060 Contingencies (Note 9) See Notes to Interim Consolidated Financial Statements.
5
CANADIAN PACIFIC RAILWAY LIMITED
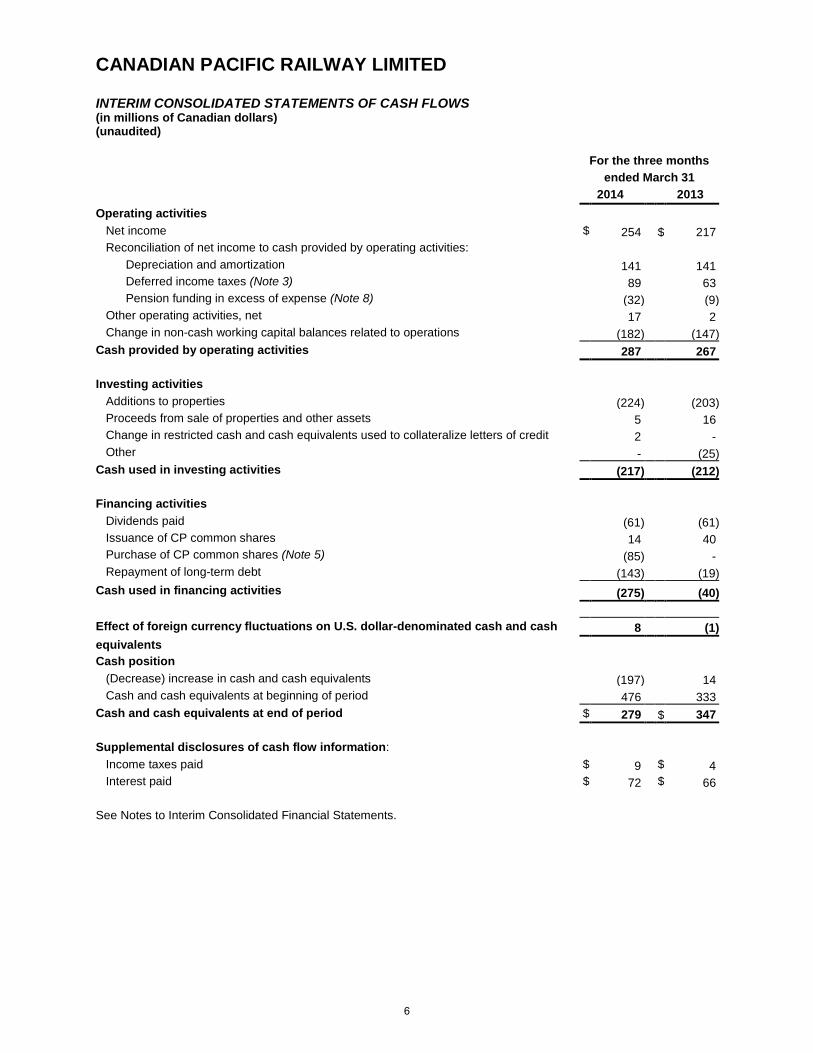
INTERIM CONSOLIDATED STATEMENTS OF CASH FLOWS (in millions of Canadian dollars) (unaudited) For the three months ended March 31 2014 2013 Operating activities Net income $ 254 $ 217 Reconciliation of net income to cash provided by operating activities: Depreciation and amortization 141 141 Deferred income taxes (Note 3) 89 63 Pension funding in excess of expense (Note 8) (32) (9) Other operating activities, net 17 2 Change in non-cash working capital balances related to operations (182) (147) Cash provided by operating activities 287 267 Investing activities Additions to properties (224) (203) Proceeds from sale of properties and other assets 5 16 Change in restricted cash and cash equivalents used to collateralize letters of credit 2 - Other - (25) Cash used in investing activities (217) (212) Financing activities Dividends paid (61) (61) Issuance of CP common shares 14 40 Purchase of CP common shares (Note 5) (85) - Repayment of long-term debt (143) (19) Cash used in financing activities (275) (40) Effect of foreign currency fluctuations on U.S. dollar-denominated cash and cash 8 (1) equivalents Cash position (Decrease) increase in cash and cash equivalents (197) 14 Cash and cash equivalents at beginning of period 476 333 Cash and cash equivalents at end of period $ 279 $ 347 Supplemental disclosures of cash flow information: Income taxes paid $ 9 $ 4 Interest paid $ 72 $ 66 See Notes to Interim Consolidated Financial Statements.
6

CANADIAN PACIFIC RAILWAY LIMITED
INTERIM CONSOLIDATED STATEMENTS OF CHANGES IN SHAREHOLDERS’ EQUITY (in millions of Canadian dollars, except common share amounts) (unaudited) Common Accumulated shares Additional other Total (in Share paid-in comprehensive Retained shareholders’ millions) capital capital loss earnings equity
Balance at January 1, 2014 175.4 $ 2,240 $ 34 $ (1,503) $ 6,326 $ 7,097 Net income - - - - 254 254 Other comprehensive income (Note 2) - - - 38 - 38 Dividends declared - - - - (61) (61) Effect of stock-based compensation expense - - 6 - - 6 CP common shares repurchased (Note 5) (0.6)
(7)
-
-
(80)
(87) Shares issued under stock option plans 0.3 20 (4) - - 16 Balance at March 31, 2014 175.1 $ 2,253 $ 36 $ (1,465) $ 6,439 $ 7,263 Common Accumulated shares Additional other Total (in Share paid-in comprehensive Retained shareholders’ millions) capital capital loss earnings equity Balance at January 1, 2013 173.9 $ 2,127 $ 41 $ (2,768) $ 5,697 $ 5,097 Net income - - - - 217 217 Other comprehensive income (Note 2) - - - 147 - 147 Dividends declared - - - - (62) (62) Effect of stock-based compensation expense - - 6 - - 6 Shares issued under stock option plans 0.8 56 (12) - - 44 Balance at March 31, 2013 174.7 $ 2,183 $ 35 $ (2,621) $ 5,852 $ 5,449 See Notes to Interim Consolidated Financial Statements.
7

CANADIAN PACIFIC RAILWAY LIMITED NOTES TO INTERIM CONSOLIDATED FINANCIAL STATEMENTS March 31, 2014 (unaudited)
1 Basis of presentation
These unaudited interim consolidated financial statements of Canadian Pacific Railway Limited (“CP”, or “the Company”), expressed in Canadian dollars, reflect management’s estimates and assumptions that are necessary for their fair presentation in conformity with generally accepted accounting principles in the United States of America (“GAAP”). They do not include all disclosures required under GAAP for annual financial statements and should be read in conjunction with the 2013 annual consolidated financial statements. The accounting policies used are consistent with the accounting policies used in preparing the 2013 annual consolidated financial statements. CP’s operations can be affected by seasonal fluctuations such as changes in customer demand and weather-related issues. This seasonality could impact quarter-over-quarter comparisons. In management’s opinion, the unaudited interim consolidated financial statements include all adjustments (consisting of normal and recurring adjustments) necessary to present fairly such information. Interim results are not necessarily indicative of the results expected for the fiscal year.
2 Changes in accumulated other comprehensive loss (“AOCL”) by component For the three months ended March 31
(in millions of Canadian dollars)
Foreign currency net of
hedging activities(1)
Derivatives and other(1)
Pension and post-
retirement defined benefit
plans(1)(2) Total(1)
January 1, 2014 $ 105 $ (15) $ (1,593) $ (1,503)
Other comprehensive income
before reclassifications 17 10 - 27 Amounts reclassified from accumulated other comprehensive loss - (11) 22 11
Net current-period other comprehensive income (loss) 17 (1) 22 38
March 31, 2014 $ 122 (16) (1,571) (1,465)
January 1, 2013 $ 74 $ (14) $ (2,828) $ (2,768) Other comprehensive income (loss) before reclassifications 8 (7) 94 95 Amounts reclassified from accumulated other comprehensive loss - 6 46 52
Net current-period other comprehensive income (loss) 8 (1) 140 147
March 31, 2013 $ 82 $ (15) $ (2,688) $ (2,621)
(1)Amounts are presented net of tax.
(2) Amounts reclassified from accumulated other comprehensive loss.
8

CANADIAN PACIFIC RAILWAY LIMITED NOTES TO INTERIM CONSOLIDATED FINANCIAL STATEMENTS March 31, 2014 (unaudited)
2 Changes in accumulated other comprehensive loss (“AOCL”) by component (continued)
For the three months ended
March 31
2014 2013
Amortization of prior service costs(a) $ (17) $ (6)
Recognition of net actuarial loss(a) 48 67
Total before income tax 31 61
Income tax recovery (9) (15)
Net of income tax $ 22 $ 46
(a)Impacts Compensation and benefits on the Interim Consolidated Statements of Income.
3 Income taxes For the three months ended March 31 2014 2013 (in millions of Canadian dollars) Current income tax expense $ 10 $ 9 Deferred income tax expense 89 63 Income tax expense $ 99 $ 72
The effective income tax rate for the three months ended March 31, 2014 was 28.0% (three months ended March 31, 2013 - 24.8%). The lower rate in 2013 was the result of a benefit recognized for a U.S. federal track maintenance credit of $6 million for 2012 enacted and reported in the first quarter of 2013.
4 Earnings per share
At March 31, 2014, the number of shares outstanding was 175.1 million (March 31, 2013 – 174.7 million).
Basic earnings per share have been calculated using net income for the period divided by the weighted-average number of shares outstanding during the period. The number of shares used in earnings per share calculations is reconciled as follows:
For the three months ended March 31 (in millions) 2014 2013 Weighted-average basic shares outstanding 175.5 174.3 Dilutive effect of stock options 1.5 1.5 Weighted-average diluted 177.0 175.8 shares outstanding
For the three months ended March 31, 2014,122,017 options were excluded from the computation of diluted earnings per share because their effects were not dilutive (three months ended March 31, 2013 – no options).
9

CANADIAN PACIFIC RAILWAY LIMITED NOTES TO INTERIM CONSOLIDATED FINANCIAL STATEMENTS March 31, 2014 (unaudited)
5 Shareholders’ Equity
On February 20, 2014, the Board of Directors of the Company approved a share repurchase program, and in March 2014, the Company filed a new normal course issuer bid to purchase, for cancellation, up to 5.3 million of its outstanding common shares. Under the filing, share purchases may be made during the 12-month period that began March 17, 2014, and ends March 16, 2015. The purchases are made at the market price on the day of purchase, with consideration allocated to share capital up to the average carrying amount of the shares, and any excess allocated to retained earnings. The following table provides the activity under the share repurchase program:
For the three months
ended March 31
2014
Number of common shares repurchased 567,750
Weighted-average price per share(1) $ 154.07
Amount of repurchase (in millions)(1) $ 87
(1) Includes brokerage fees.
6 Financial instruments
A. Fair values of financial instruments The Company categorizes its financial assets and liabilities measured at fair value in line with the fair value hierarchy established by GAAP that prioritizes, with respect to reliability, the inputs to valuation techniques used to measure fair value. This hierarchy consists of three broad levels. Level 1 inputs consist of quoted prices (unadjusted) in active markets for identical assets and liabilities and give the highest priority to these inputs. Level 2 and 3 inputs are based on significant other observable inputs and significant unobservable inputs, respectively, and give lower priority to these inputs. When possible, the estimated fair value is based on quoted market prices and, if not available, estimates from third party brokers. For non-exchange traded derivatives classified in Level 2, the Company uses standard valuation techniques to calculate fair value. Primary inputs to these techniques include observable market prices (interest, foreign exchange and commodity) and volatility, depending on the type of derivative and nature of the underlying risk. The Company uses inputs and data used by willing market participants when valuing derivatives and considers its own credit default swap spread as well as those of its counterparties in its determination of fair value. The carrying values of financial instruments equal or approximate their fair values with the exception of long-term debt which has a fair value of approximately $5,715 million at March 31, 2014 (December 31, 2013 – $5,572 million) and a carrying value of $4,869 million at March 31, 2014 (December 31, 2013 – $4,876 million). The estimated fair value of current and long-term borrowings has been determined based on market information where available, or by discounting future payments of interest and principal at estimated interest rates expected to be available to the Company at period end. All derivatives and long-term debt are classified as Level 2.
10

CANADIAN PACIFIC RAILWAY LIMITED NOTES TO INTERIM CONSOLIDATED FINANCIAL STATEMENTS March 31, 2014 (unaudited) 6 Financial instruments (continued)
B. Financial risk management
Derivative financial instruments Derivative financial instruments may be used to selectively reduce volatility associated with fluctuations in interest rates, foreign exchange (“FX”) rates, the price of fuel and stock-based compensation expense. Where derivatives are designated as hedging instruments, the relationship between the hedging instruments and their associated hedged items is documented, as well as the risk management objective and strategy for the use of the hedging instruments. This documentation includes linking the derivatives that are designated as fair value or cash flow hedges to specific assets or liabilities on the Interim Consolidated Balance Sheets, commitments or forecasted transactions. At the time a derivative contract is entered into, and at least quarterly thereafter, an assessment is made whether the derivative item is effective in offsetting the changes in fair value or cash flows of the hedged items. The derivative qualifies for hedge accounting treatment if it is effective in substantially mitigating the risk it was designed to address. It is not the Company’s intent to use financial derivatives or commodity instruments for trading or speculative purposes.
Foreign exchange management The Company conducts business transactions and owns assets in both Canada and the United States. As a result, the Company is exposed to fluctuations in value of financial commitments, assets, liabilities, income or cash flows due to changes in FX rates. The Company may enter into foreign exchange risk management transactions primarily to manage fluctuations in the exchange rate between Canadian and U.S. currencies. FX exposure is primarily mitigated through natural offsets created by revenues, expenditures and balance sheet positions incurred in the same currency. Where appropriate, the Company may negotiate with customers and suppliers to reduce the net exposure.
Occasionally the Company may enter into short-term FX forward contracts as part of its cash management strategy. Net investment hedge The FX gains and losses on long-term debt are mainly unrealized and can only be realized when U.S. dollar denominated long-term debt matures or is settled. The Company also has long-term FX exposure on its investment in U.S. affiliates. The majority of the Company’s U.S. dollar denominated long-term debt has been designated as a hedge of the net investment in foreign subsidiaries. This designation has the effect of mitigating volatility on net income by offsetting long-term FX gains and losses on U.S. dollar denominated long-term debt and gains and losses on its net investment. The effective portion recognized in “Other comprehensive income” for the three months ended March 31, 2014 was an unrealized foreign exchange loss of $131 million (three months ended March 31, 2013 – $67 million). There was no ineffectiveness during the three months ended March 31, 2014 and March 31, 2013.
Foreign exchange forward contracts The Company may enter into FX forward contracts to lock-in the amount of Canadian dollars it has to pay on its U.S. denominated debt maturities. At March 31, 2014, the Company had FX forward contracts to fix the exchange rate on US$175 million of its 6.50% Notes due in May 2018, and US$100 million of its 7.25% Notes due in May 2019. At December 31, 2013, the Company had FX forward contracts to fix the exchange rate on US$100 million of principal outstanding on a capital lease due in January 2014, US$175 million of its 6.50% Notes due in May 2018, and US$100 million of its 7.25% Notes due in May 2019. These derivatives, which are accounted for as cash flow hedges, guarantee the amount of Canadian dollars that the Company will repay when these obligations mature.
During the three months ended March 31, 2014, the Company settled the FX forward contract related to the repayment of a capital lease due in January 2014 for proceeds of $8 million. During the three months ended March 31, 2014, the combined realized and unrealized foreign exchange gain of $11 million (three months ended March 31, 2013 – unrealized gain of $5 million) was recorded in “Other income and charges” in relation to these derivatives. These gains recorded in “Other income and charges”
11

CANADIAN PACIFIC RAILWAY LIMITED NOTES TO INTERIM CONSOLIDATED FINANCIAL STATEMENTS March 31, 2014 (unaudited) 6 Financial instruments (continued)
were largely offset by the realized and unrealized losses on the underlying debt which the derivatives were designated to hedge. At March 31, 2014, the unrealized gain derived from these FX forwards was $27 million which was recorded in “Other assets” with the offset reflected as an unrealized gain of $4 million in “Accumulated other comprehensive loss” and as an unrealized gain of $23 million in “Retained earnings”. At December 31, 2013, the unrealized gain derived from these FX forwards was $25 million of which $6 million was included in “Other current assets” and $19 million in “Other assets” with the offset reflected as an unrealized gain of $5 million in “Accumulated other comprehensive loss” and as an unrealized gain of $20 million in “Retained earnings”. At March 31, 2014, the Company expected that, during the next twelve months, unrealized pre-tax losses of $1 million would be reclassified to “Other income and charges”.
7 Stock-based compensation
At March 31, 2014, the Company had several stock-based compensation plans, including stock option plans, various cash settled liability plans and an employee stock savings plan. These plans resulted in an expense for the three months ended March 31, 2014 of $22 million (three months ended March 31, 2013 – $33 million). Regular options In the first three months of 2014, under CP’s stock option plans, the Company issued 366,050 regular options at the weighted average price of $168.88 per share, based on the closing price on the grant date. Pursuant to the employee plan, these regular options may be exercised upon vesting, which is between 12 months and 48 months after the grant date, and will expire after 10 years. Under the fair value method, the fair value of the regular options at the grant date was approximately $17 million. The weighted average fair value assumptions were approximately:
For the three months ended March, 31 2014 Grant price $ 168.88 Expected option life (years)(1) 5.82 Risk-free interest rate(2) 1.64 % Expected stock price volatility(3) 28.63 % Expected annual dividends per share(4) $ 1.40 Expected forfeiture rate(5) 1.4 %
(1) Represents the period of time that awards are expected to be outstanding. Historical data on exercise behaviour, or when available, specific expectations regarding future exercise behaviour, were used to estimate the expected life of the option. (2) Based on the implied yield available on zero-coupon government issues with an equivalent remaining term at the time of the grant. (3) Based on the historical stock price volatility of the Company’s stock over a period commensurate with the expected term of the option. (4) Determined by the current annual dividend at the time of grant. The Company does not employ different dividend yields throughout the contractual term of the option. (5) The Company estimated forfeitures based on past experience. This rate is monitored on a periodic basis.
Performance share unit (“PSU”) plan In the three months ended March 31, 2014, the Company issued 163,760 PSUs with a grant date fair value of approximately $25 million. These units attract dividend equivalents in the form of additional units based on the dividends paid on the Company’s Common Shares. PSUs vest and are settled in cash, or in CP
12

CANADIAN PACIFIC RAILWAY LIMITED NOTES TO CONSOLIDATED FINANCIAL STATEMENTS March 31, 2014 (unaudited) 7 Stock-based compensation (continued)
common shares approximately three years after the grant date, contingent upon CP’s performance (performance factor). The fair value of PSUs is measured, both on the grant date and each subsequent quarter until settlement, using a Monte Carlo simulation model. The model utilizes multiple input variables that determine the probability of satisfying the performance and market conditions stipulated in the grant. Deferred share unit (“DSU”) plan In the three months ended March 31, 2014, the Company granted 46,034 DSUs with a grant date fair value of approximately $7.5 million. DSUs vest over various periods of up to 48 months and are only redeemable for a specified period after employment is terminated. An expense to income for DSUs is recognized over the vesting period for both the initial subscription price and the change in value between reporting periods.
8 Pensions and other benefits
In the three months ended March 31, 2014, the Company made contributions of $19 million (in the three months ended March 31, 2013 - $30 million) to its defined benefit pension plans. The elements of net periodic benefit cost for defined benefit pension plans and other benefits recognized in the quarter included the following components:
For the three months ended March 31 Pensions Other benefits (in millions of Canadian dollars) 2014 2013 2014 2013 Current service cost (benefits earned by employees in the period) $ 27 $ 35 $ 3 $ 4 Interest cost on benefit obligation 119 112 6 5 Expected return on fund assets (189) (186) - - Recognized net actuarial loss 47 66 1 1 Amortization of prior service costs (17) (6) - - Net periodic benefit cost (recovery) $ (13) $ 21 $ 10 $ 10 9 Contingencies
In the normal course of its operations, the Company becomes involved in various legal actions, including claims relating to injuries and damage to property. The Company maintains provisions it considers to be adequate for such actions. While the final outcome with respect to actions outstanding or pending at March 31, 2014 cannot be predicted with certainty, it is the opinion of management that their resolution will not have a material adverse effect on the Company’s financial position or results of operations individually and in aggregate.
On July 6, 2013, a train carrying crude oil operated by Montreal Maine and Atlantic Railway (“MM&A”) derailed and exploded in Lac-Megantic, Quebec on a section of railway line owned by MM&A. The day before CP had interchanged the train to MM&A, but after the interchange MM&A exercised exclusive control over the train. Following this incident, the Minister of Sustainable Development, Environment, Wildlife and Parks of Quebec issued an order directing named parties to recover the contaminants and to clean up and decontaminate the derailment site. CP was later added as a named party in the administrative action on August 14, 2013. A class action lawsuit has also been filed in the Superior Court of Quebec on behalf of a class of persons and entities residing in, owning or leasing property in, operating a business in or physically present in Lac-Megantic. The lawsuit seeks damages caused by the derailment including for wrongful deaths, personal injuries, and property damages. CP was added as a defendant on August 16, 2013. In the wake of the derailment and ensuing litigation, MM&A filed for bankruptcy in Canada and the United States.
13

CANADIAN PACIFIC RAILWAY LIMITED NOTES TO CONSOLIDATED FINANCIAL STATEMENTS March 31, 2014 (unaudited) 9 Contingencies (continued)
At this early stage in the legal proceedings, any potential liability and the quantum of potential loss cannot be determined. Nevertheless, CP denies liability for MM&A's derailment and will vigorously defend itself in both proceedings or any proceeding that may be commenced in the future.
Environmental remediation accruals cover site-specific remediation programs. Environmental remediation accruals are measured on an undiscounted basis and are recorded when the costs to remediate are probable and reasonably estimable. The accruals for environmental remediation represent CP’s best estimate of its probable future obligation and include both asserted and unasserted claims, without reduction for anticipated recoveries from third parties. Although the recorded accruals include CP’s best estimate of all probable costs, CP’s total environmental remediation costs cannot be predicted with certainty. Accruals for environmental remediation may change from time to time as new information about previously untested sites becomes known, environmental laws and regulations evolve and advances are made in environmental remediation technology. The accruals may also vary as the courts decide legal proceedings against outside parties responsible for contamination. These potential charges, which cannot be quantified at this time, are not expected to be material to CP’s financial position, but may materially affect income in the particular period in which a charge is recognized. Costs related to existing, but as yet unknown, or future contamination will be accrued in the period in which they become probable and reasonably estimable. The expense included in “Purchased services and other” for the three months ended March 31, 2014 was $1 million (three months ended March 31, 2013 – $1 million). Provisions for environmental remediation costs are recorded in “Other long-term liabilities”, except for the current portion which is recorded in “Accounts payable and accrued liabilities”. The total amount provided at March 31, 2014 was $93 million (December 31, 2013 – $ 90 million). Payments are expected to be made over 10 years to 2024.
14

Summary of Rail Data First Quarter Financial (millions, except per share data) 2014 2013 Fav/(Unfav) % Revenues
Freight revenue $ 1,474 $ 1,459 $ 15 1 Other revenue 35 36 (1) (3)Total revenues 1,509 1,495 14 1 Operating expenses
Compensation and benefits 355 402 47 12 Fuel 271 270 (1) - Materials 89 72 (17) (24) Equipment rents 41 46 5 11 Depreciation and amortization 141 141 - - Purchased services and other 189 202 13 6 Total operating expenses 1,086 1,133 47 4 Operating income 423 362 61 17 Less:
Other income and charges - 3 3 100 Net interest expense 70 70 - - Income before income tax expense 353 289 64 22 Income tax expense 99 72 (27) (38) Net income $ 254 $ 217 $ 37 17 Operating ratio (%) 72.0 75.8 3.8 380 bps Basic earnings per share $ 1.45 $ 1.25 $ 0.20 16 Diluted earnings per share $ 1.44 $ 1.24 $ 0.20 16 Shares Outstanding Weighted average number of shares outstanding (millions) 175.5 174.3 1.2 1
Weighted average number of diluted shares outstanding (millions) 177.0 175.8 1.2 1 Foreign Exchange Average foreign exchange rate (US$/Canadian$) 0.92 0.99 0.07 7
Average foreign exchange rate (Canadian$/US$) 1.09 1.01 0.08 8
15
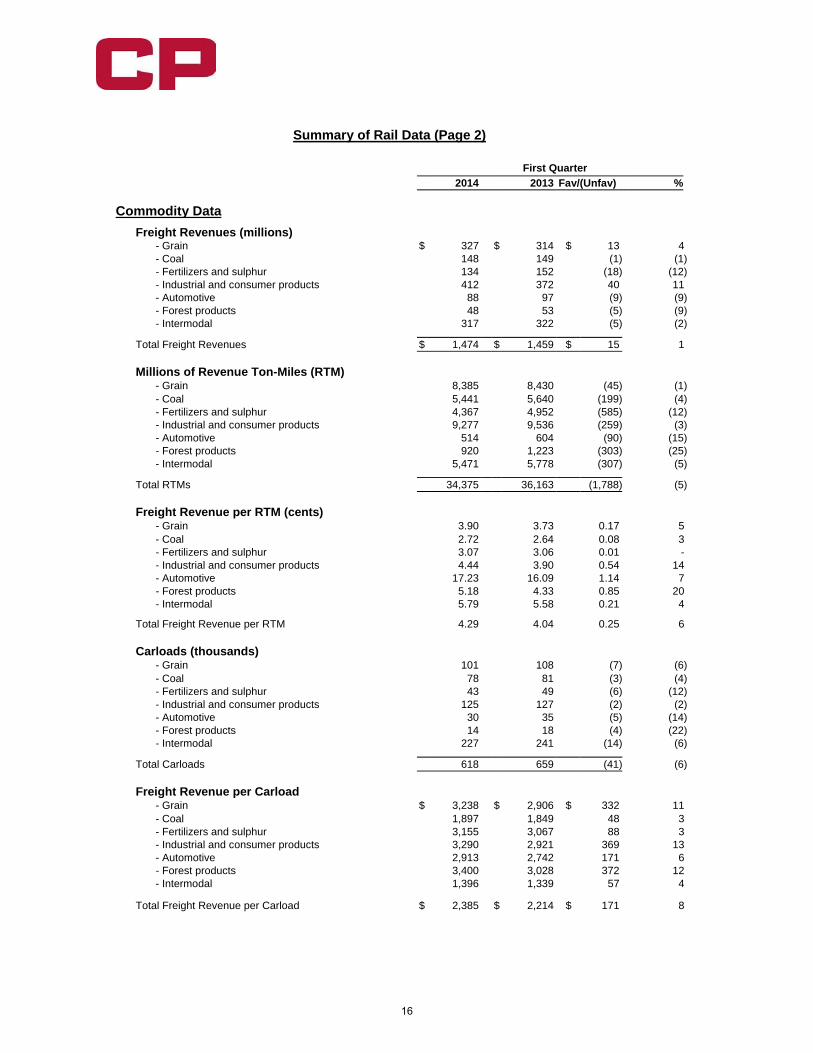
Summary of Rail Data (Page 2) First Quarter 2014 2013 Fav/(Unfav) % Commodity Data
Freight Revenues (millions) - Grain $ 327 $ 314 $ 13 4 - Coal 148 149 (1) (1) - Fertilizers and sulphur 134 152 (18) (12) - Industrial and consumer products 412 372 40 11 - Automotive 88 97 (9) (9) - Forest products 48 53 (5) (9) - Intermodal 317 322 (5) (2)
Total Freight Revenues $ 1,474 $ 1,459 $ 15 1
Millions of Revenue Ton-Miles (RTM) - Grain 8,385 8,430 (45) (1) - Coal 5,441 5,640 (199) (4) - Fertilizers and sulphur 4,367 4,952 (585) (12) - Industrial and consumer products 9,277 9,536 (259) (3) - Automotive 514 604 (90) (15) - Forest products 920 1,223 (303) (25) - Intermodal 5,471 5,778 (307) (5)
Total RTMs 34,375 36,163 (1,788) (5)
Freight Revenue per RTM (cents) - Grain 3.90 3.73 0.17 5 - Coal 2.72 2.64 0.08 3 - Fertilizers and sulphur 3.07 3.06 0.01 - - Industrial and consumer products 4.44 3.90 0.54 14 - Automotive 17.23 16.09 1.14 7 - Forest products 5.18 4.33 0.85 20 - Intermodal 5.79 5.58 0.21 4
Total Freight Revenue per RTM 4.29 4.04 0.25 6
Carloads (thousands) - Grain 101 108 (7) (6) - Coal 78 81 (3) (4) - Fertilizers and sulphur 43 49 (6) (12) - Industrial and consumer products 125 127 (2) (2) - Automotive 30 35 (5) (14) - Forest products 14 18 (4) (22) - Intermodal 227 241 (14) (6)
Total Carloads 618 659 (41) (6)
Freight Revenue per Carload - Grain $ 3,238 $ 2,906 $ 332 11 - Coal 1,897 1,849 48 3 - Fertilizers and sulphur 3,155 3,067 88 3 - Industrial and consumer products 3,290 2,921 369 13 - Automotive 2,913 2,742 171 6 - Forest products 3,400 3,028 372 12 - Intermodal 1,396 1,339 57 4
Total Freight Revenue per Carload $ 2,385 $ 2,214 $ 171 8
16

Summary of Rail Data (Page 3)
First Quarter 2014 2013 (1) Fav/(Unfav) % Operations Performance Freight gross ton-miles (millions) 62,349 67,679 (5,330) (8) Revenue ton-miles (millions) 34,375 36,163 (1,788) (5) Train miles (thousands) 8,727 9,993 (1,266) (13) Average train weight - excluding local traffic (tons) 7,653 7,209 444 6 Average train length - excluding local traffic (feet) 6,371 6,298 73 1 Average terminal dwell (hours)(2) 10.3 6.6 (3.7) (56) Average train speed (mph)(3) 15.9 18.0 (2.1) (12) Locomotive productivity (daily average GTMs/active HP) 204.3 205.5 (1.2) (1) Fuel efficiency(4) 1.11 1.13 0.02 2 U.S. gallons of locomotive fuel consumed (millions)(5) 68.3 75.7 7.4 10 Average fuel price (U.S. dollars per U.S. gallon) 3.63 3.55 (0.08) (2) Total employees (average)(6) 14,246 14,920 674 5 Total employees (end of period)(6) 14,446 15,112 666 4 Workforce (end of period)(7) 14,774 16,108 1,334 8 Safety FRA personal injuries per 200,000 employee-hours 1.50 1.74 0.24 14 FRA train accidents per million train-miles 0.92 1.96 1.04 53
(1) Certain prior period figures have been revised to conform with current presentation or have been updated to reflect new
information. (2) Incorporates a new reporting definition where average terminal dwell measures the average time a freight car resides
within terminal boundaries. (3) Incorporates a new reporting definition where average train speed measures the line-haul movement from origin to
destination including terminal dwell hours. (4) Fuel efficiency is defined as U.S. gallons of locomotive fuel consumed per 1,000 GTMs – freight and yard. (5) Includes gallons of fuel consumed from freight, yard and commuter service but excludes fuel used in capital projects and
other non-freight activities. (6) An employee is defined as an individual, including trainees, who has worked more than 40 hours in a standard biweekly
pay period. This excludes part time employees, contractors, and consultants. (7) Workforce is defined as total employees plus part time employees, contractors, and consultants.
17