delivering the dividend of workplace cultural diversity evidence-based measurement and monitoring...
TRANSCRIPT
Delivering the Dividend of Workplace Cultural Diversity
Evidence-based Measurement and Monitoring
Michael DoveDirector, OriginsInfo
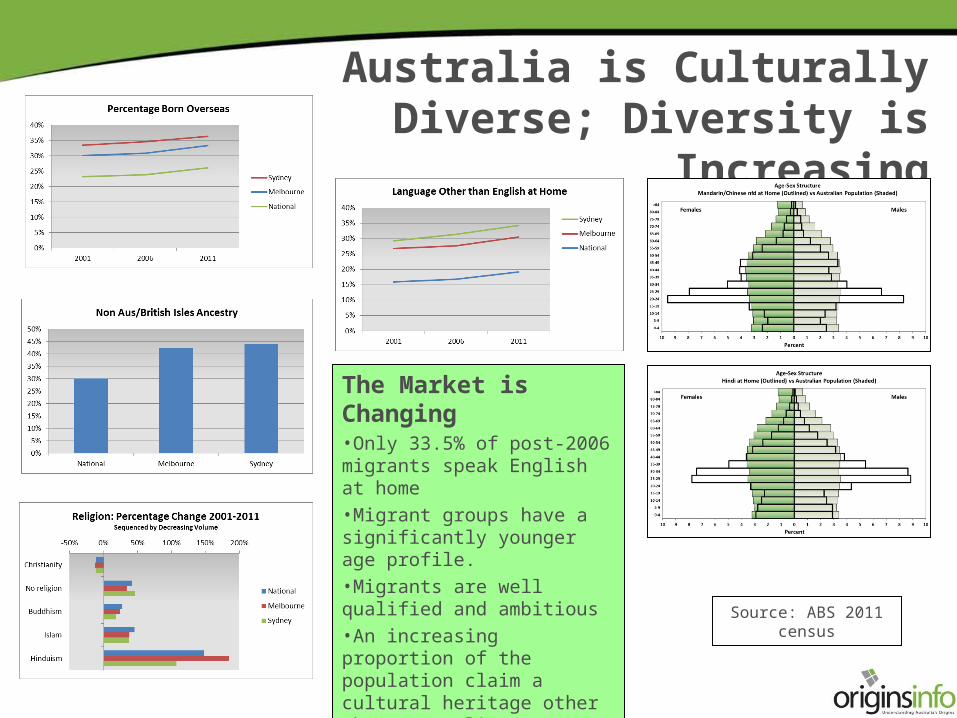
Australia is Culturally Diverse; Diversity is Increasing
Source: ABS 2011 census
The Market is Changing•Only 33.5% of post-2006 migrants speak English at home•Migrant groups have a significantly younger age profile. •Migrants are well qualified and ambitious•An increasing proportion of the population claim a cultural heritage other than Australian / British Isles

• Which cultural groups are over and under represented compared with the labour market?
• How do these patterns vary by functional area or service line?
• Is gender a dimension of cultural diversity?
• Does diversity vary by role or seniority?
• What is the relationship between diversity and tenure?
Cultural Diversity Insights in the WorkplacePowered by Origins Analysis
• Are there critical drop-off points for culturally diverse talent? • Are there geographical variations to the patterns? • Does employee satisfaction vary by cultural group? • Does workplace diversity reflect customer diversity?
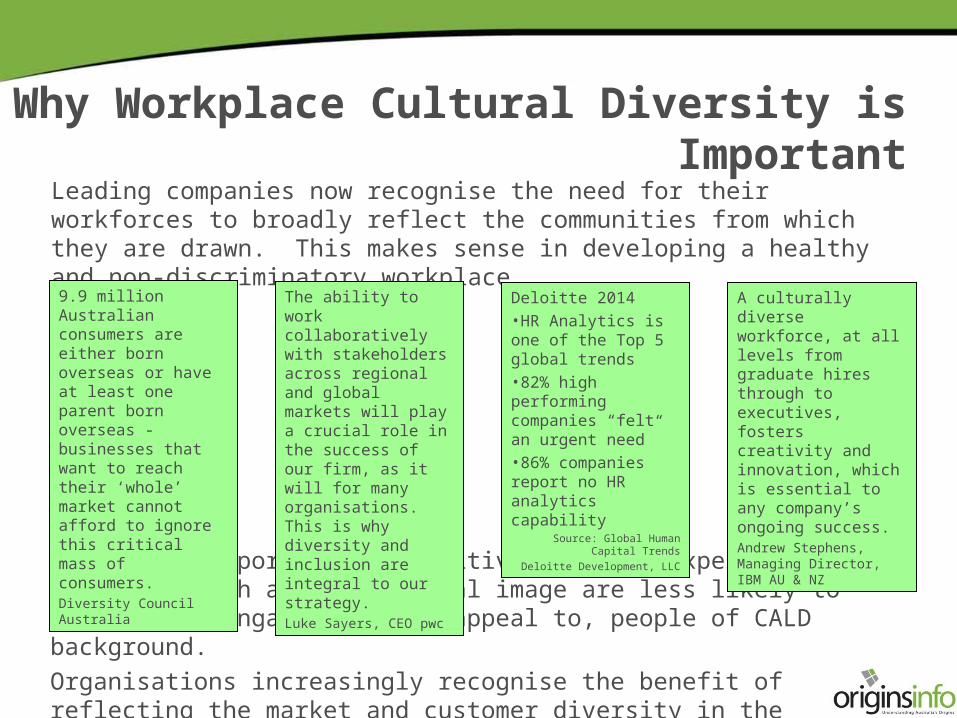
Leading companies now recognise the need for their workforces to broadly reflect the communities from which they are drawn. This makes sense in developing a healthy and non-discriminatory workplace.
Why Workplace Cultural Diversity is Important
It is also important for positive customer experience. Companies with a mono-cultural image are less likely to effectively engage with, or appeal to, people of CALD background.Organisations increasingly recognise the benefit of reflecting the market and customer diversity in the diversity of their employees.
The ability to work collaboratively with stakeholders across regional and global markets will play a crucial role in the success of our firm, as it will for many organisations. This is why diversity and inclusion are integral to our strategy.Luke Sayers, CEO pwc
A culturally diverse workforce, at all levels from graduate hires through to executives, fosters creativity and innovation, which is essential to any company’s ongoing success.Andrew Stephens, Managing Director, IBM AU & NZ
Deloitte 2014•HR Analytics is one of the Top 5 global trends•82% high performing companies “felt an urgent need”•86% companies report no HR analytics capability
Source: Global Human Capital TrendsDeloitte Development, LLC
9.9 million Australian consumers are either born overseas or have at least one parent born overseas - businesses that want to reach their ‘whole’ market cannot afford to ignore this critical mass of consumers.Diversity Council Australia
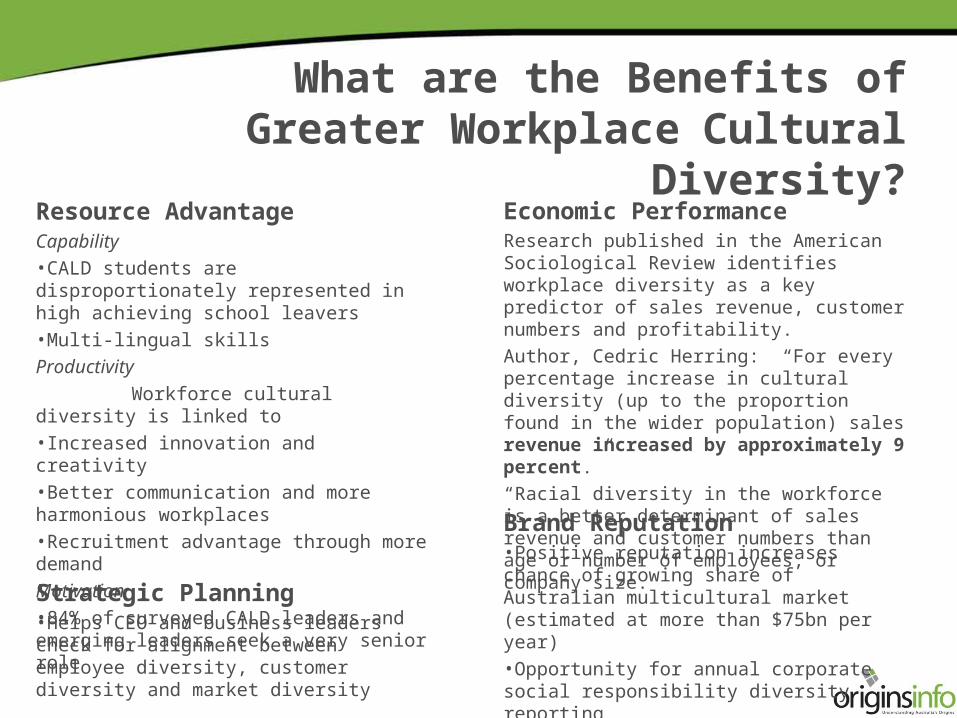
Economic PerformanceResearch published in the American Sociological Review identifies workplace diversity as a key predictor of sales revenue, customer numbers and profitability. Author, Cedric Herring: “For every percentage increase in cultural diversity (up to the proportion found in the wider population) sales revenue increased by approximately 9 percent.” “Racial diversity in the workforce is a better determinant of sales revenue and customer numbers than age or number of employees, or company size.”
What are the Benefits of Greater Workplace Cultural Diversity?
Brand Reputation•Positive reputation increases chance of growing share of Australian multicultural market (estimated at more than $75bn per year)•Opportunity for annual corporate social responsibility diversity reporting
Resource AdvantageCapability •CALD students are disproportionately represented in high achieving school leavers •Multi-lingual skillsProductivity
Workforce cultural diversity is linked to•Increased innovation and creativity•Better communication and more harmonious workplaces•Recruitment advantage through more demandMotivation•84% of surveyed CALD leaders and emerging leaders seek a very senior role
Strategic Planning•Helps CEO and business leaders check for alignment between employee diversity, customer diversity and market diversity

Why use Origins?• Quick, cost-effective and accurate
measurement of cultural diversity in the workplace
• Avoids expensive and intrusive employee surveys that – Rarely achieve adequate response rates -
overall, and particularly from CALD groups– Rely on narrow definitions of ‘culture’ –
eg country of birth; language spoken at home; or self-identified ancestry that tends to over-state ‘Australian’
• Benchmarks against local labour market counts created with the same name recognition tool = valid like-for-like comparisons
• Defines a reference point for monitoring and trend analysis
Origins is a market leading cultural diversity measurement tool developed in the UK and adapted
for use in Australia, Canada and South Africa

How Does Origins Work?• The underlying databases are derived from 1.2bn
global individuals• Family and personal name databases of 2.5m and
900k have been created• The outcome is a truly global solution achieving
>99.5% coding rates with around 85% accuracy at individual level – even allowing for name changes due to marriage and other reasons
• A multi-dimensional classification enables reporting and appropriate action
– 257 detailed CEL codes reflecting countries, cultures/ethnicities, regions, languages and religions
– Customisable aggregation from CEL level to suit business context and statistical reliability
• Origins separately evaluates each personal and family name and assigns a CEL code to each. A ‘confidence score’, along with rules applicable to the Australian market are used to assign the overall name combination to a single code
• Reports are then produced at an appropriate level of aggregation
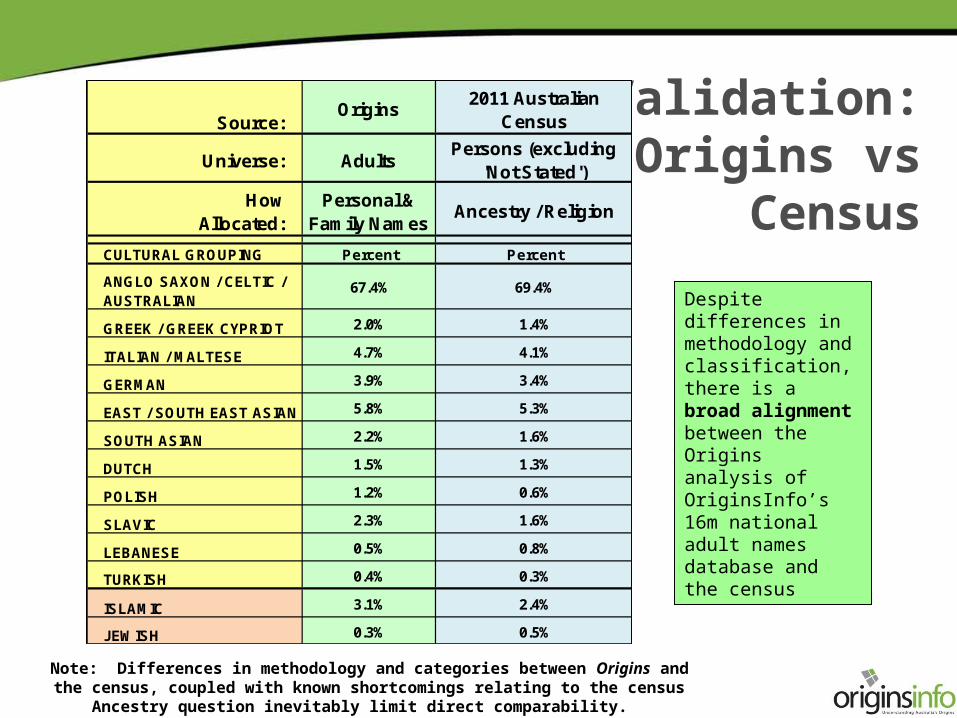
Validation: Origins vs
Census
Note: Differences in methodology and categories between Origins and the census, coupled with known shortcomings relating to the census Ancestry question inevitably limit direct
comparability.
Despite differences in methodology and classification, there is a broad alignment between the Origins analysis of OriginsInfo’s 16m national adult names database and the census
Source:Origins
2011 Australian Census
Universe: AdultsPersons (excluding
'Not Stated')
HowAllocated:
Personal & Family Names
Ancestry / Religion
CULTURAL GROUPING Percent Percent
ANGLO SAXON / CELTIC / AUSTRALIAN
67.4% 69.4%
GREEK / GREEK CYPRIOT 2.0% 1.4%
ITALIAN / MALTESE 4.7% 4.1%
GERMAN 3.9% 3.4%
EAST / SOUTH EAST ASIAN 5.8% 5.3%
SOUTH ASIAN 2.2% 1.6%
DUTCH 1.5% 1.3%
POLISH 1.2% 0.6%
SLAVIC 2.3% 1.6%
LEBANESE 0.5% 0.8%
TURKISH 0.4% 0.3%
ISLAMIC 3.1% 2.4%
JEWISH 0.3% 0.5%
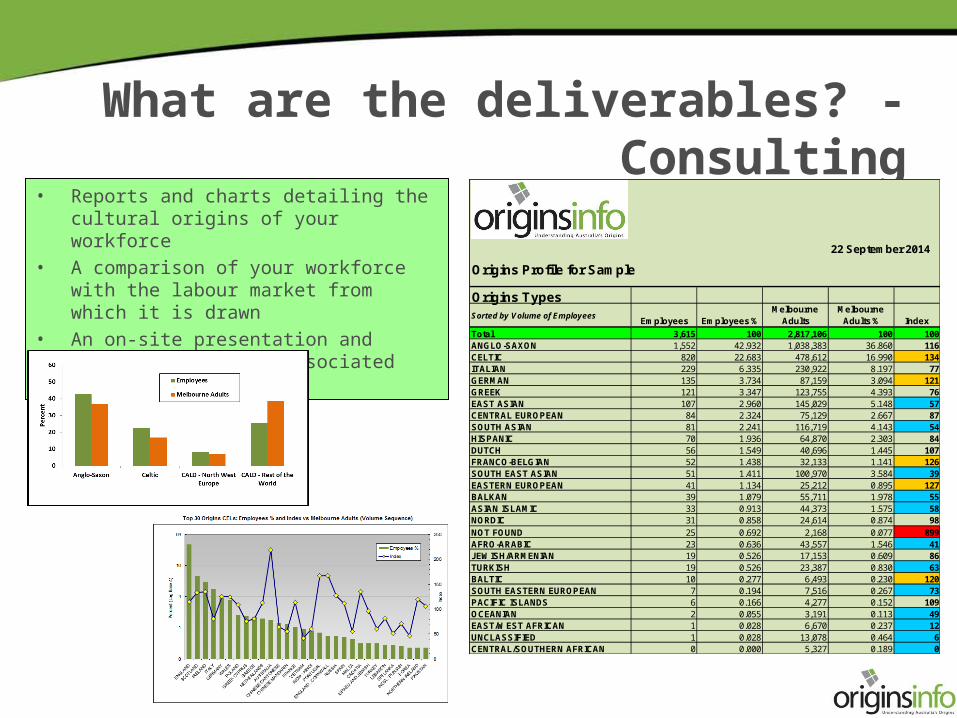
What are the deliverables? - Consulting• Reports and charts detailing the cultural origins
of your workforce • A comparison of your workforce with the labour
market from which it is drawn• An on-site presentation and review of results;
associated discussion
Origins Profile for Sample
Origins TypesSorted by Volume of Employees
Employees Employees %Melbourne
AdultsMelbourne
Adults % Index
Total 3,615 100 2,817,106 100 100ANGLO-SAXON 1,552 42.932 1,038,383 36.860 116CELTIC 820 22.683 478,612 16.990 134ITALIAN 229 6.335 230,922 8.197 77GERMAN 135 3.734 87,159 3.094 121GREEK 121 3.347 123,755 4.393 76EAST ASIAN 107 2.960 145,029 5.148 57CENTRAL EUROPEAN 84 2.324 75,129 2.667 87SOUTH ASIAN 81 2.241 116,719 4.143 54HISPANIC 70 1.936 64,870 2.303 84DUTCH 56 1.549 40,696 1.445 107FRANCO-BELGIAN 52 1.438 32,133 1.141 126SOUTH EAST ASIAN 51 1.411 100,970 3.584 39EASTERN EUROPEAN 41 1.134 25,212 0.895 127BALKAN 39 1.079 55,711 1.978 55ASIAN ISLAMIC 33 0.913 44,373 1.575 58NORDIC 31 0.858 24,614 0.874 98NOT FOUND 25 0.692 2,168 0.077 899AFRO-ARABIC 23 0.636 43,557 1.546 41JEWISH/ARMENIAN 19 0.526 17,153 0.609 86TURKISH 19 0.526 23,387 0.830 63BALTIC 10 0.277 6,493 0.230 120SOUTH EASTERN EUROPEAN 7 0.194 7,516 0.267 73PACIFIC ISLANDS 6 0.166 4,277 0.152 109OCEANIAN 2 0.055 3,191 0.113 49EAST/WEST AFRICAN 1 0.028 6,670 0.237 12UNCLASSIFIED 1 0.028 13,078 0.464 6CENTRAL/SOUTHERN AFRICAN 0 0.000 5,327 0.189 0
22 September 2014

For further information and an obligation-free quotation, contactMichael Dove
www.originsinfo.com.au +61 418 359 711
Delivering the Dividend of Workplace Cultural Diversity
Evidence-based Measurement and Monitoring