delivering roi, internationally ian manning head of client services – international...
TRANSCRIPT
Delivering ROI,Internationally
Ian ManningHead of Client Services – InternationalZenithOptimedia International09 October 2009

“marketing departments have
an inadequate understanding of financial controls”
Source: Advertising Age, July 2008

Profitable Growth

“Companies showing a commitment to
measuring marketing tend to be better at
delivering profitable growth”

Brand Power
PricingDistribution
Brand Power Media Investment
Drivers of Profitable Growth

• Based on detailed P&L inputs and marketing channel response functions at the market, portfolio, brand and sku level
Econometrics attempts to isolate drivers by ‘unbaking the cake’

“Every brand in every country that has done marketing mix modelling or marketing ROI (econometric analysis) has improved the productivity of its marketing spending without exception”AJ Laffey
Chairman, P&G
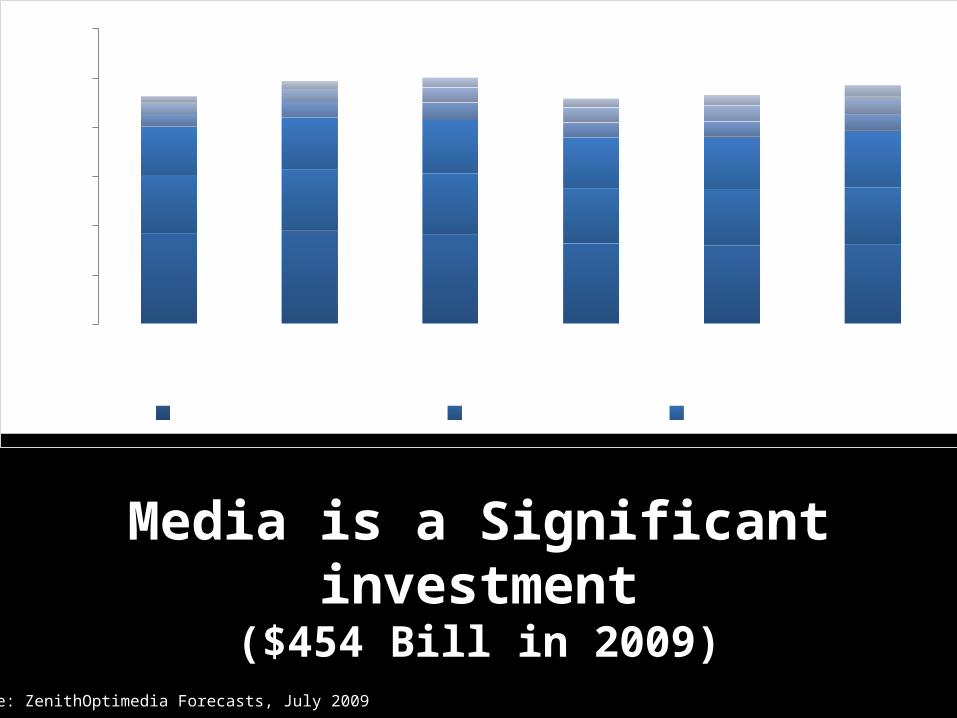
Media is a Significant investment($454 Bill in 2009)
0
100000
200000
300000
400000
500000
600000
Mill US$ North America Western Europe Asia/PacificC & E Europe Latin America Africa/M. East/ROW
Mill
ions
US$
2006 20112007 2008 2009 2010
Source: ZenithOptimedia Forecasts, July 2009

The Challenge for us is to understand the relationship between Media Investment
and Profitable Growth
Profitable GrowthMedia Investment

Many Metrics are Available to bridge the gap
Search Metrics
Web/banner Metrics
Website Metrics
In-Store Metrics
Media Metrics
Brand Metrics
Profitable GrowthMedia Investment
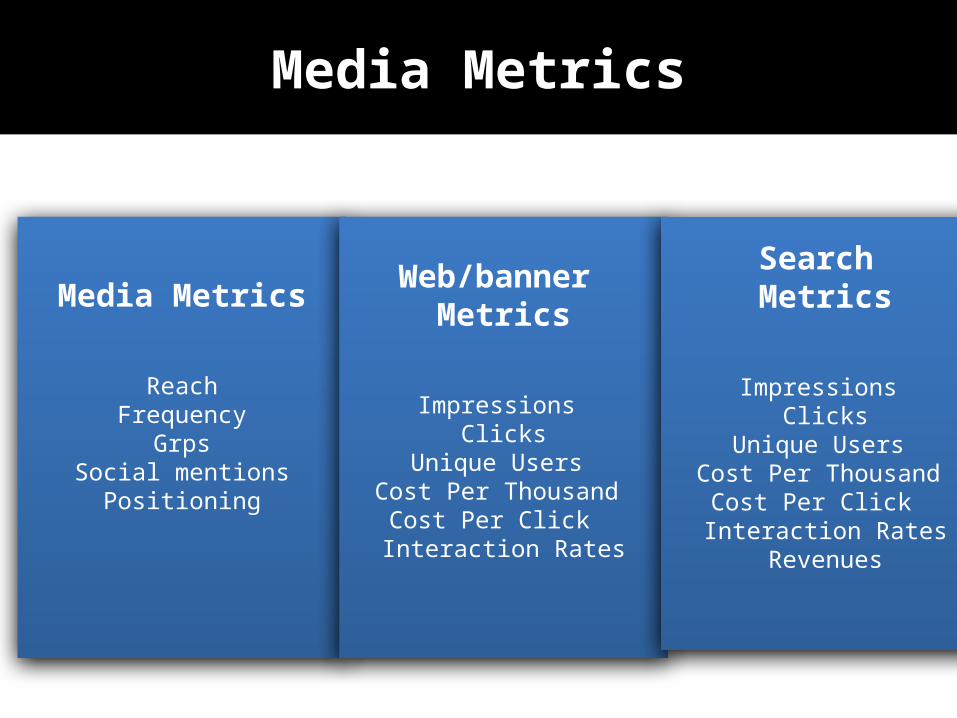
Media Metrics
Media Metrics
ReachFrequency
GrpsSocial mentions
Positioning
Web/banner Metrics
Impressions Clicks
Unique Users
Cost Per Thousand
Cost Per Click Interaction Rates
Search Metrics
Impressions Clicks
Unique Users
Cost Per Thousand
Cost Per Click Interaction Rates
Revenues
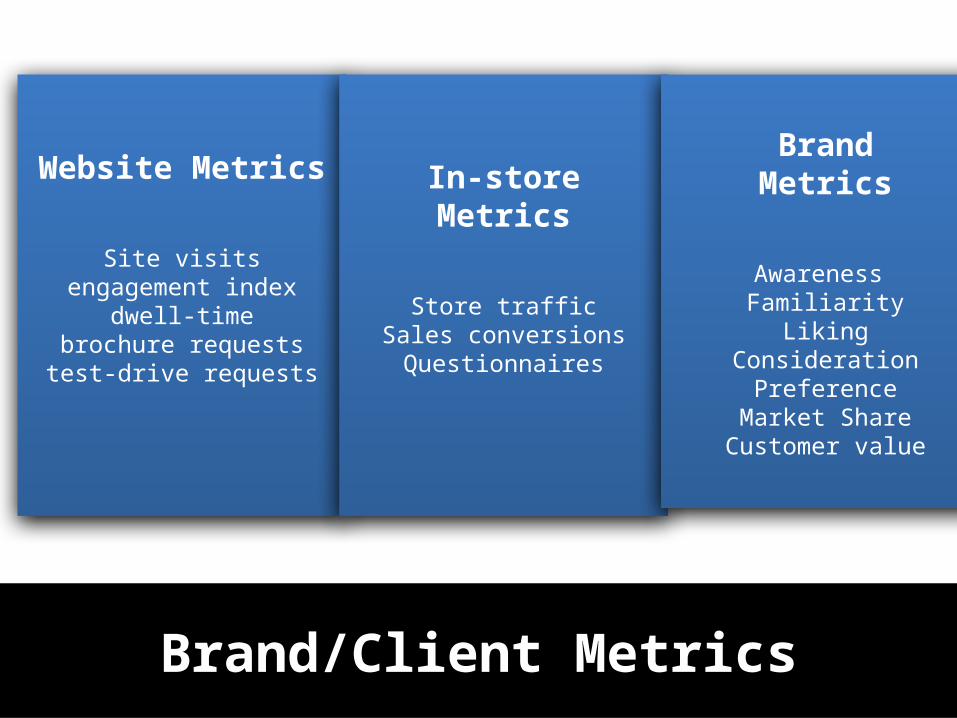
Brand/Client Metrics
Website Metrics
Site visits engagement index
dwell-time
brochure requests test-drive
requests
In-storeMetrics
Store trafficSales conversions
Questionnaires
BrandMetrics
Awareness Familiarity
LikingConsideration Preference
Market ShareCustomer value
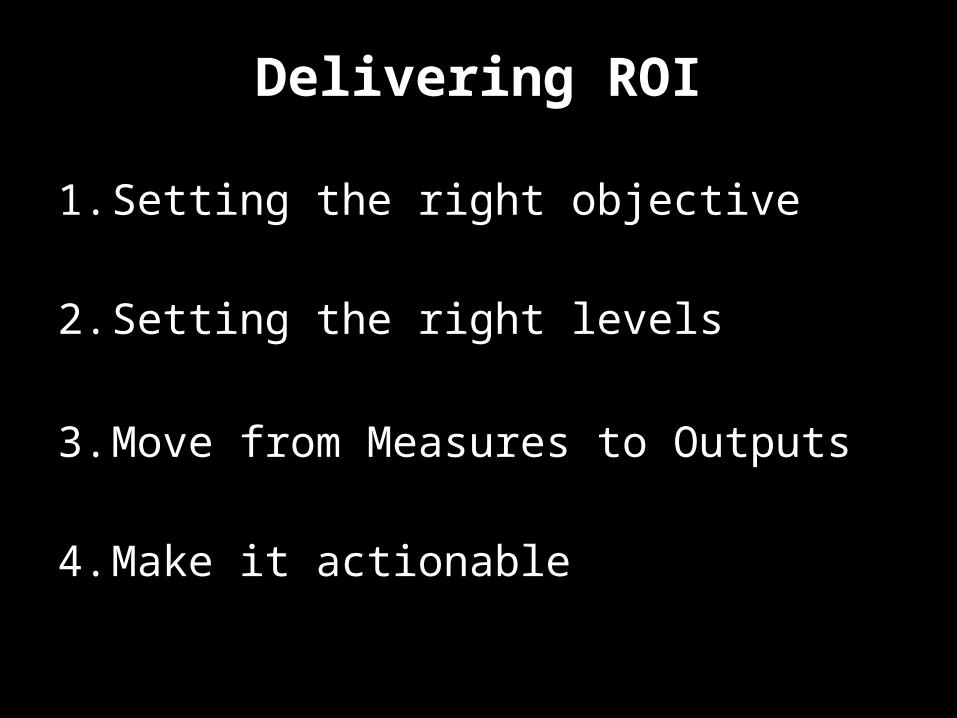
Delivering ROI
1. Setting the right objective
2. Setting the right levels
3. Move from Measures to Outputs
4. Make it actionable

90% of campaigns with
ROI goals deliver
satisfactory results
Source: Moore and Allsop, 2004
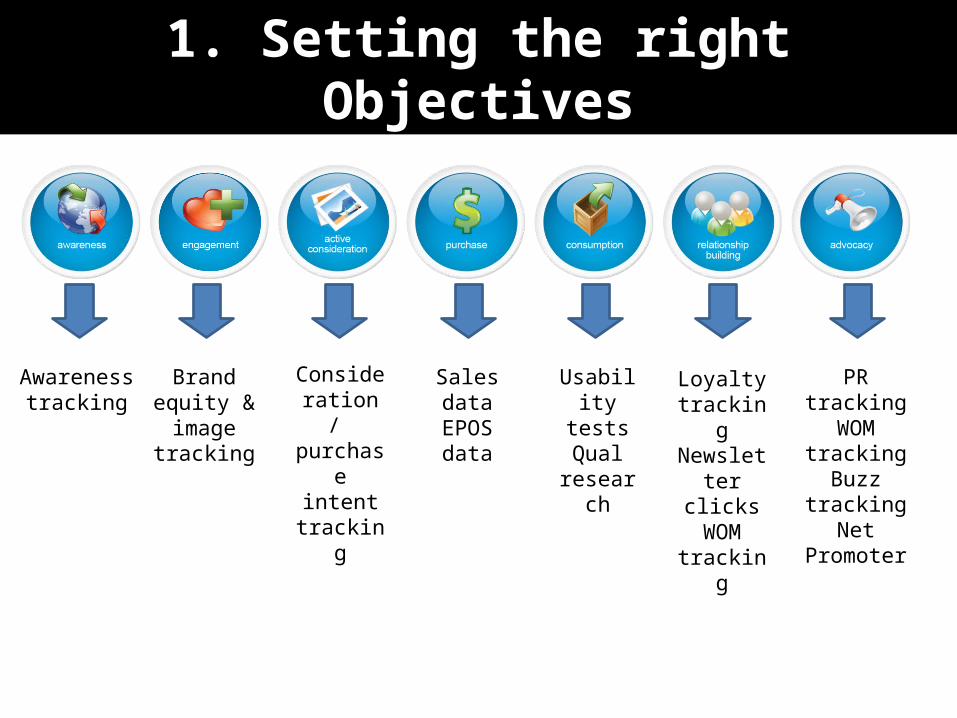
PR trackingWOM trackingBuzz trackingNet Promoter
Awareness tracking
Brand equity &image
tracking
Consideration /
purchase intent
tracking
Sales dataEPOS data
Usability testsQual
research
Loyalty tracking
Newsletter clicksWOM
tracking
1. Setting the right Objectives
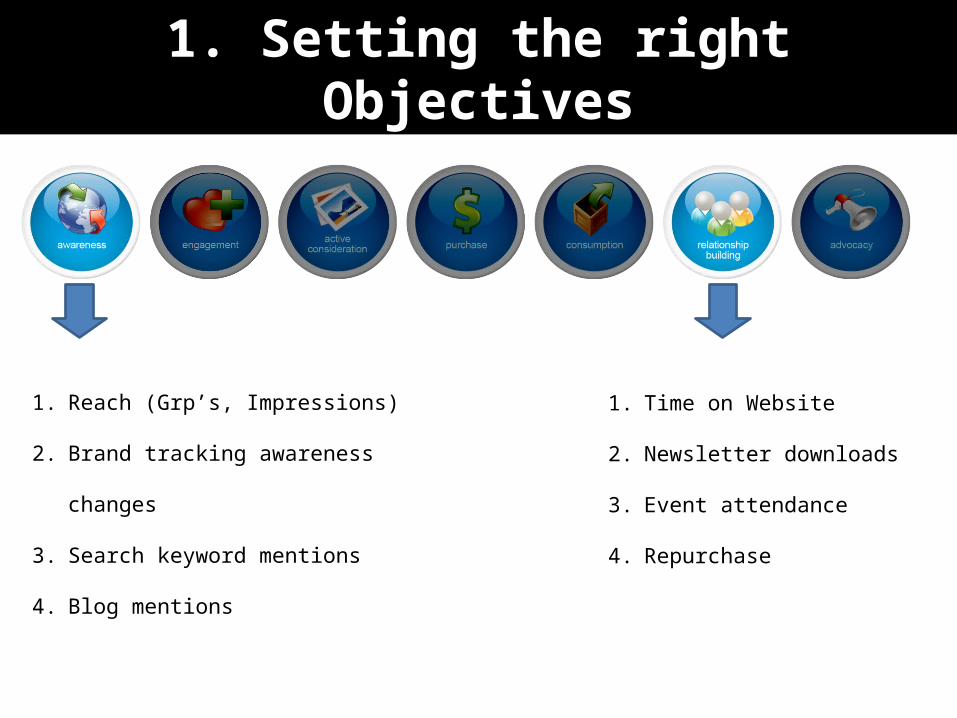
1. Setting the right Objectives
1. Reach (Grp’s, Impressions)
2. Brand tracking awareness changes
3. Search keyword mentions
4. Blog mentions
1. Time on Website
2. Newsletter downloads
3. Event attendance
4. Repurchase
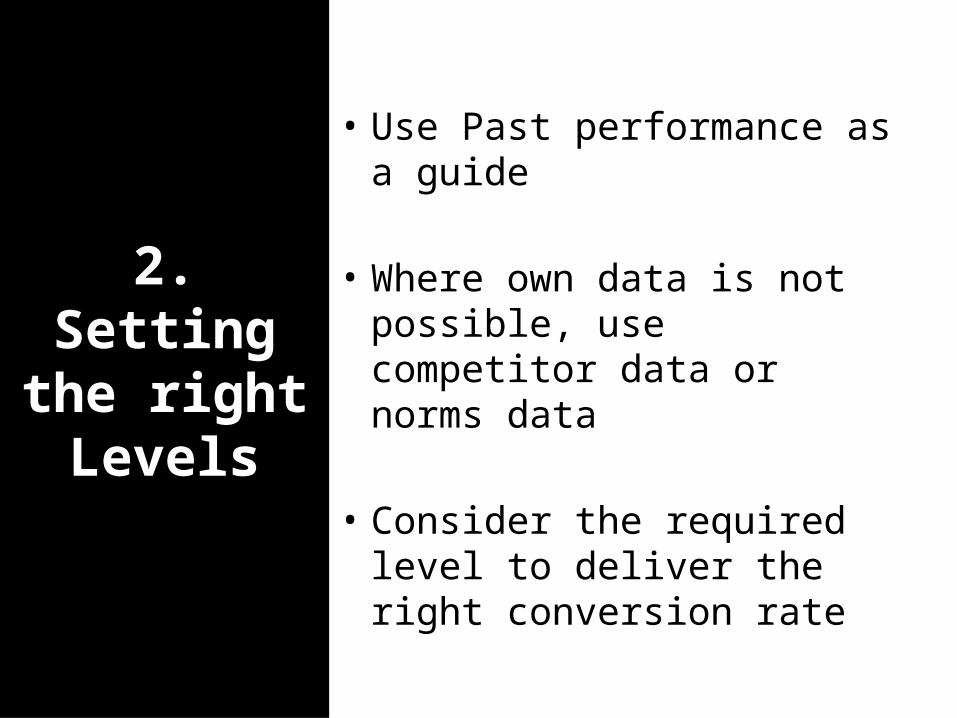
• Use Past performance as a guide
• Where own data is not possible, use competitor data or norms data
• Consider the required level to deliver the right conversion rate
2. Setting the right Levels
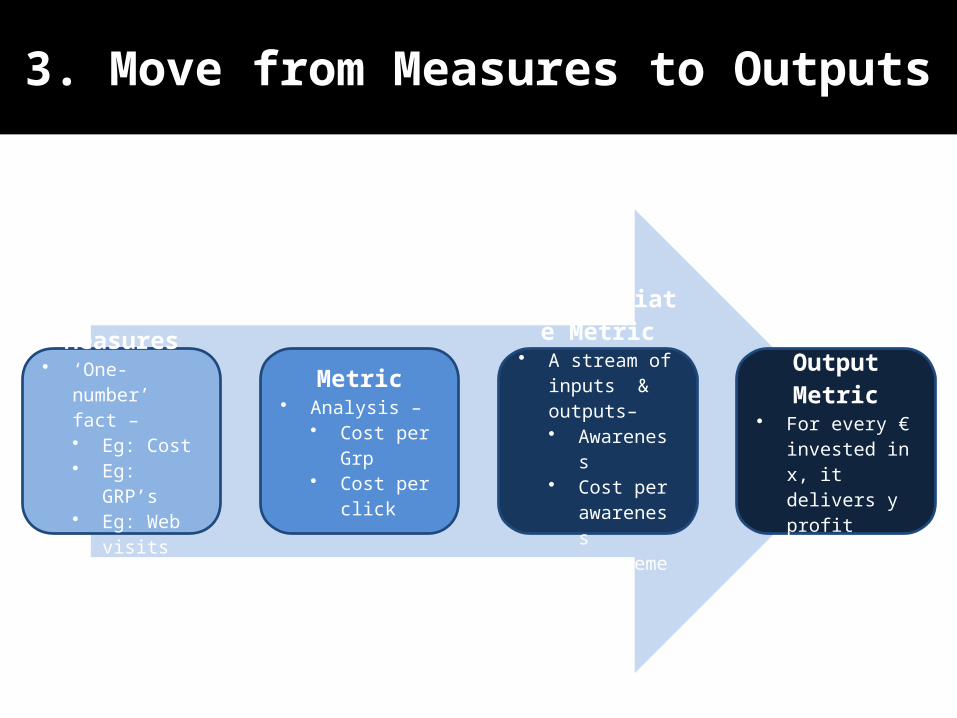
Measures• ‘One-number’
fact –• Eg: Cost• Eg: GRP’s• Eg: Web
visits
Metric• Analysis –
• Cost per Grp• Cost per
click
Intermediate Metric
• A stream of inputs & outputs– • Awareness• Cost per
awareness• engagement
Output Metric• For every €
invested in x, it delivers y profit
3. Move from Measures to Outputs
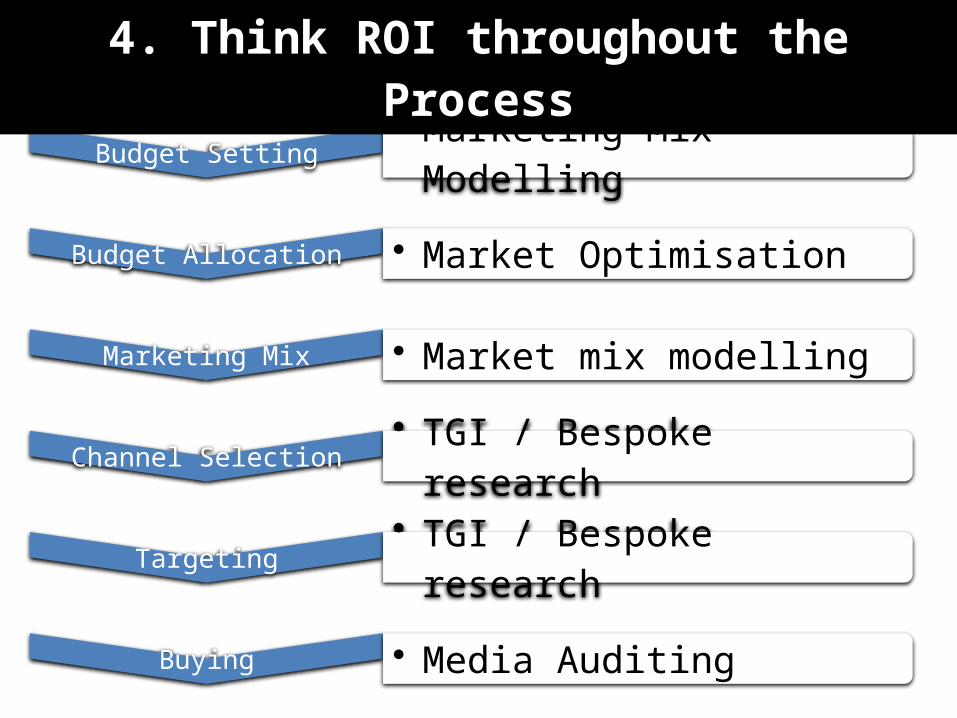
Budget Setting • Marketing Mix Modelling
Budget Allocation • Market Optimisation
Marketing Mix • Market mix modelling
Channel Selection • TGI / Bespoke research
Targeting • TGI / Bespoke research
Buying • Media Auditing
4. Think ROI throughout the Process
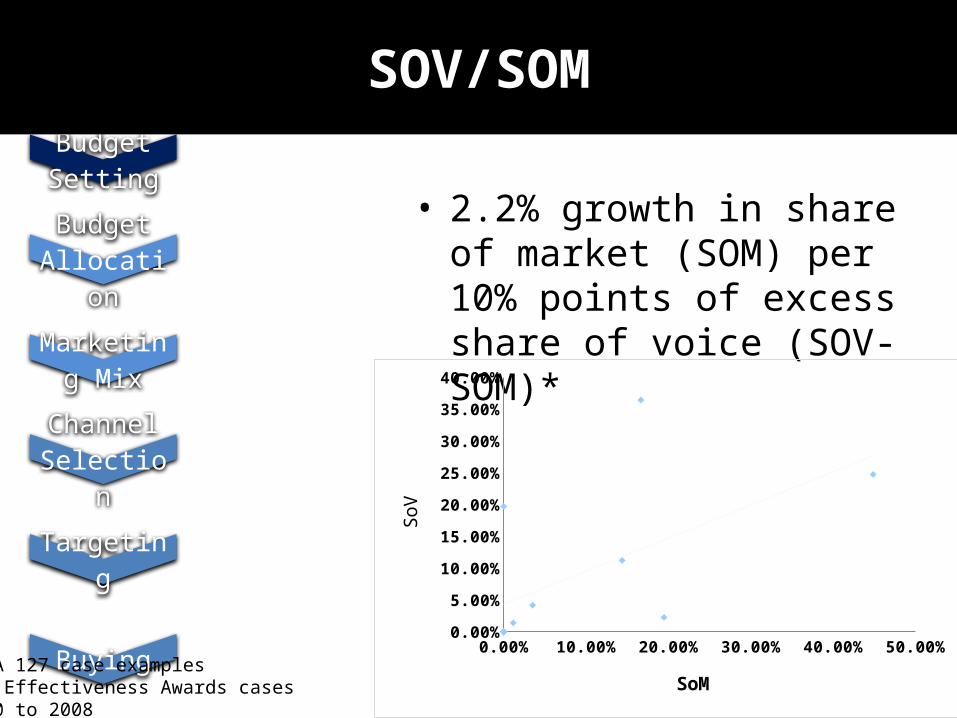
• 2.2% growth in share of market (SOM) per 10% points of excess share of voice (SOV-SOM)*
Budget Setting
Budget Allocation
Marketing Mix
Channel Selection
Targeting
Buying 0.00% 10.00% 20.00% 30.00% 40.00% 50.00%0.00%
5.00%
10.00%
15.00%
20.00%
25.00%
30.00%
35.00%
40.00%
SoM
SoV
SOV/SOM
*IPA 127 case examplesIPA Effectiveness Awards cases 1980 to 2008
Budget Setting
Budget Allocation
Marketing Mix
Channel Selection
Targeting
Buying
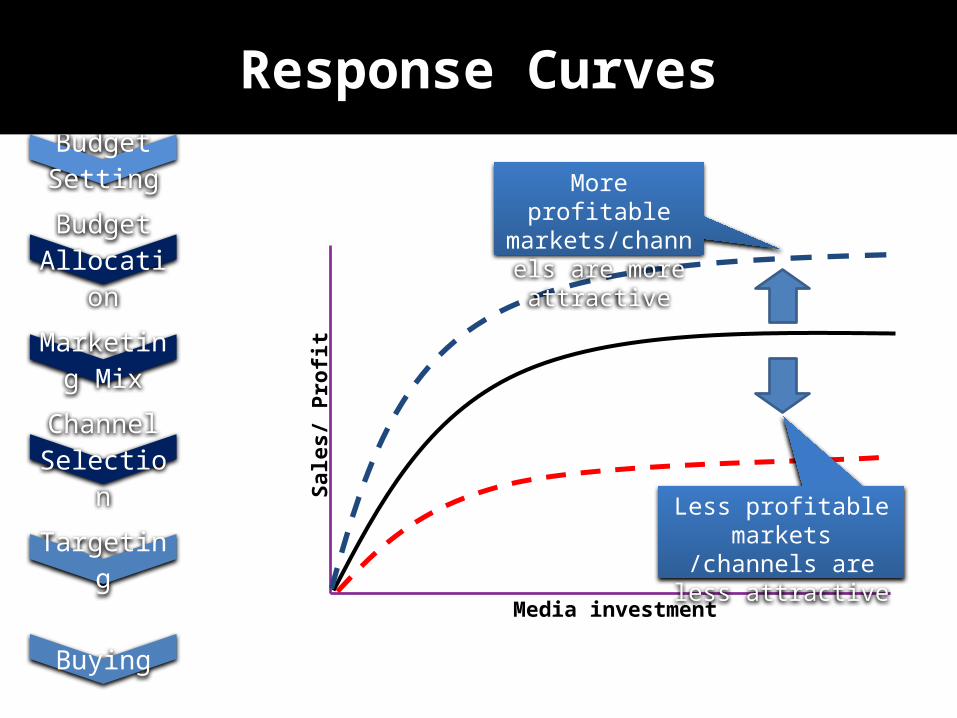
Media investment
Sale
s/ P
rofit
More profitable markets/channels
are more attractive
Less profitable markets /channels are less
attractive
Response Curves
Budget Setting
Budget Allocation
Marketing Mix
Channel Selection
Targeting
Buying
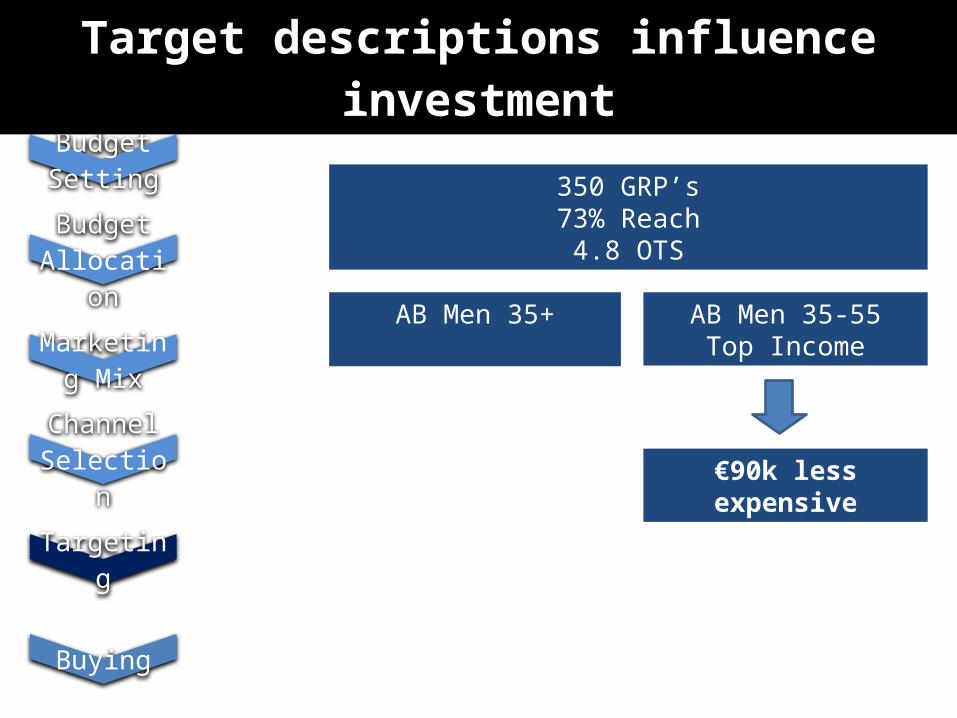
Target descriptions influence investment
350 GRP’s73% Reach
4.8 OTS
AB Men 35+ AB Men 35-55Top Income
€90k less expensive
Budget Setting
Budget Allocation
Marketing Mix
Channel Selection
Targeting
Buying
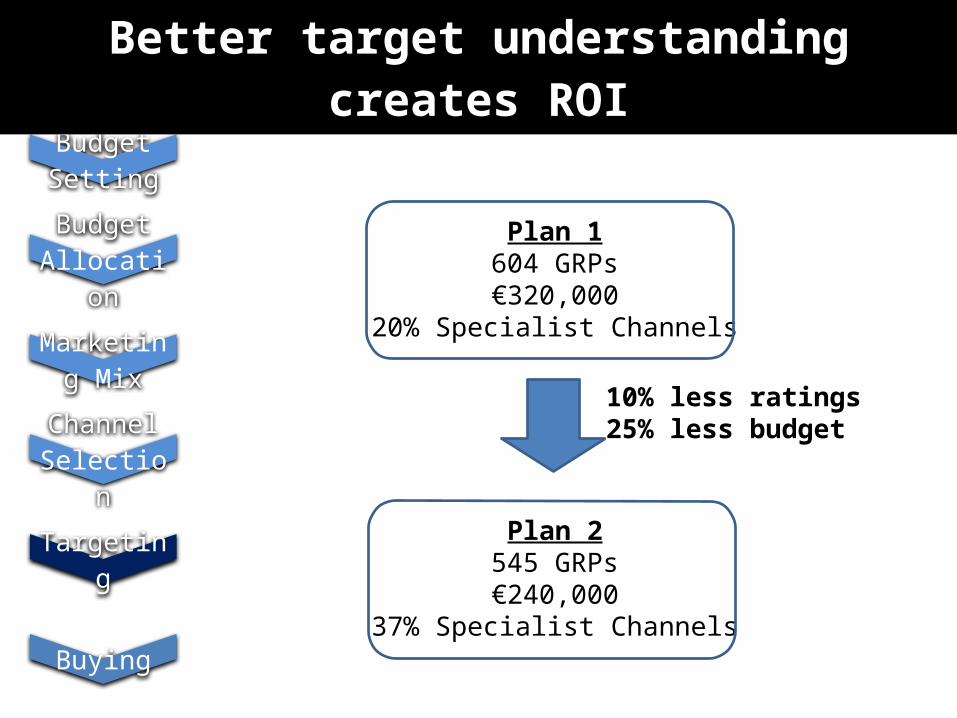
Better target understanding creates ROI
Plan 1604 GRPs€320,000
20% Specialist Channels
Plan 2545 GRPs€240,000
37% Specialist Channels
10% less ratings25% less budget
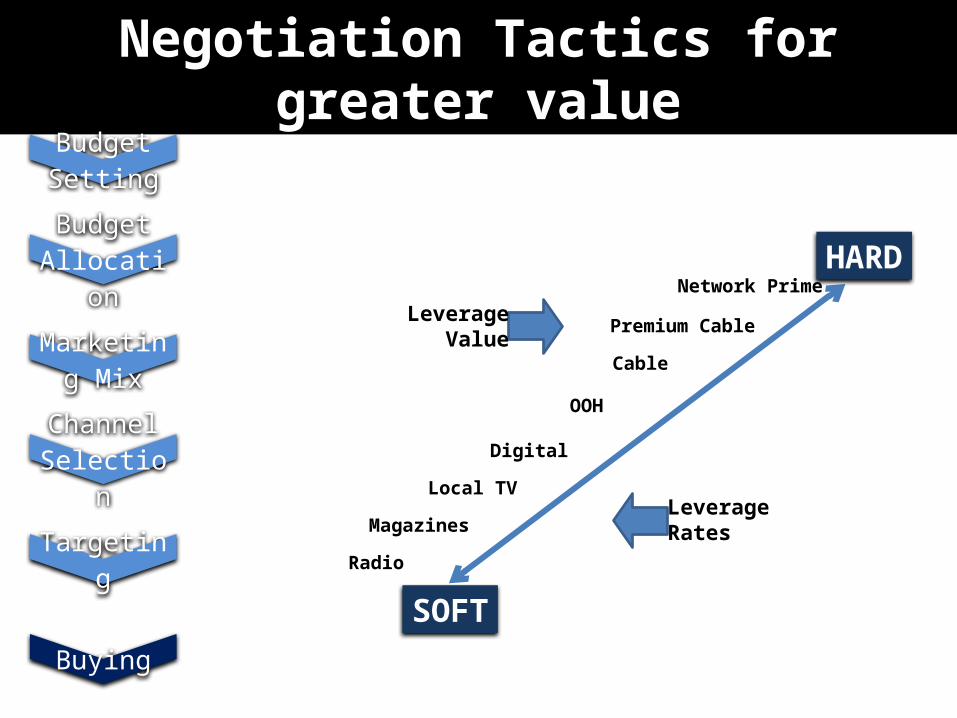
Negotiation Tactics for greater valueBudget Setting
Budget Allocation
Marketing Mix
Channel Selection
Targeting
Buying
Leverage Rates
LeverageValue
Network Prime
OOH
Digital
Magazines
Radio
Premium Cable
Cable
Local TV
HARD
SOFT
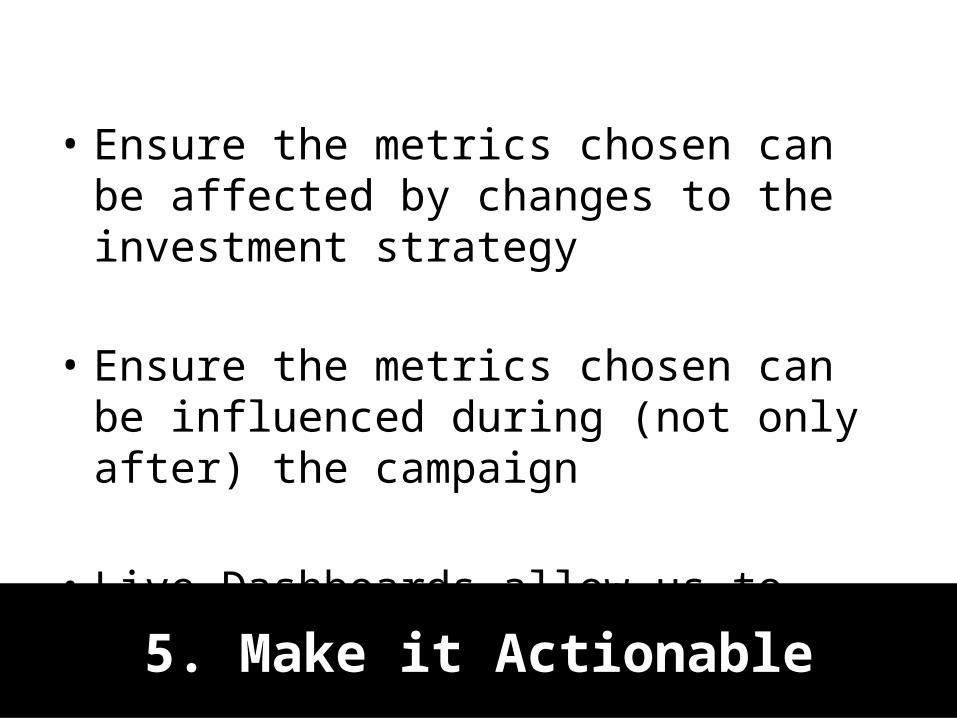
• Ensure the metrics chosen can be affected by changes to the investment strategy
• Ensure the metrics chosen can be influenced during (not only after) the campaign
• Live Dashboards allow us to evaluate multiple metrics during campaigns
5. Make it Actionable
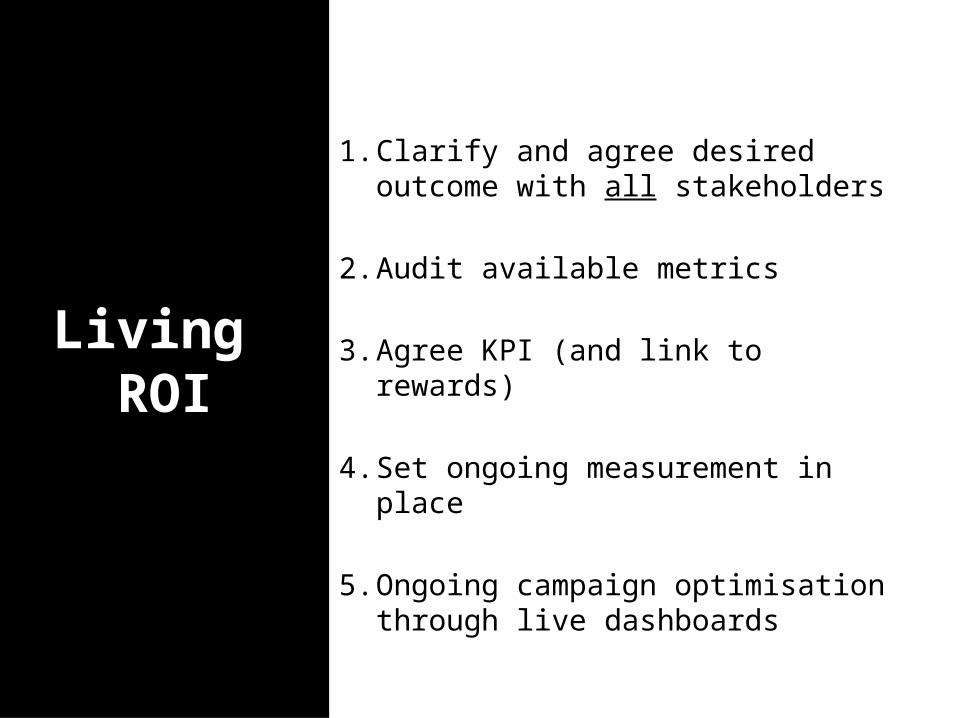
1. Clarify and agree desired outcome with all stakeholders
2. Audit available metrics
3. Agree KPI (and link to rewards)
4. Set ongoing measurement in place
5. Ongoing campaign optimisation through live dashboards
Living ROI

The ROI Agency