delivering more - jubilant · pdf filedomino’s pizza to achieve folklore status in the...
TRANSCRIPT

Annual Report 2011-12
Deliveringmore
What’s inside
Operating ReviewOverview Financial Statements
Corporate Information 01
Delivering More 02
Milestones 04
Foundation of Strengths 06
Marketing & Brand Excellence 10
Corporate Social Responsibility 12
Awards & Recognitions 13
Financial Highlights 14
Chairmen’s Letter 16
Board of Directors 20
Management Discussion & Analysis 22
Directors’ Report 31
Corporate Governance Report 36
Standalone Financial StatementsAuditors’ Report 45
Balance Sheet 48
Statement of Profit & Loss 49
Cash Flow Statement 50
Significant Accounting Policies & Notes on Financial Statements 52
Consolidated Financial StatementsAuditor’s Report 71
Balance Sheet 72
Statement of Profit & Loss 73
Cash Flow Statement 74
Significant Accounting Policies & Notes on Financial Statements 76

ANNUAL REPORT 2011-12 01
CorporateInformation
Board of DirectorsChairman & Non-Executive DirectorMr. Shyam S. Bhartia
Co-Chairman & Non-Executive DirectorMr. Hari S. Bhartia
CEO cum Whole Time Director Mr. Ajay Kaul
Independent DirectorsMr. Arun SethMr. Vishal MarwahaMs. Ramni NirulaMr. Phiroz Vandrevala
Company Secretary & Compliance OfficerMs. Mona Aggarwal
Statutory AuditorsS. R. Batliboi & Co.Chartered AccountantsGolf View Corporate Tower BNear DLF Golf CourseSector 52, Gurgaon 122002
Registrar & Transfer AgentsLink Intime India Private LimitedA-40, Second FloorNaraina Industrial Area, Phase IINew Delhi – 110028
Website www.jubilantfoodworks.com

JUBILANT FOODWORKS LIMITED02
Delivering more

Going deeper, it is the core of our operational strategy and the nucleus of our business philosophy. It is that distinctive edge that makes us grow bigger and better every year.
The philosophy of Delivering More is what pushes us to give our consumers more satisfaction and more happiness every time they connect with us. It is that overriding ethos which encourages us to give more taste, more products, more stores, more accessibility and more convenience through a seamless delivery system.
It is the mantra which enables us to deliver more value for our consumers and better return on investment for every stakeholder. More is the cornerstone of our methodology which flawlessly facilitates our relationships with our business partners, leading to more growth for each of them.
It is the spirit which inspires us to constantly strengthen the cultural eco-system of our organisation, to provide more opportunities and more empowerment for our people to develop and grow.
It is the thought which motivates us to continuously work towards giving back to the community a part of what we have earned from it.
MORE, for us, is the DNA of our fabric, the driving force that is continually propelling us to greater heights of success.
ANNUAL REPORT 2011-12 03
At JFL, delivering more exemplifies our credo of delivering that little more of everything which makes every consumer experience with us an occasion to remember, reminisce and celebrate.
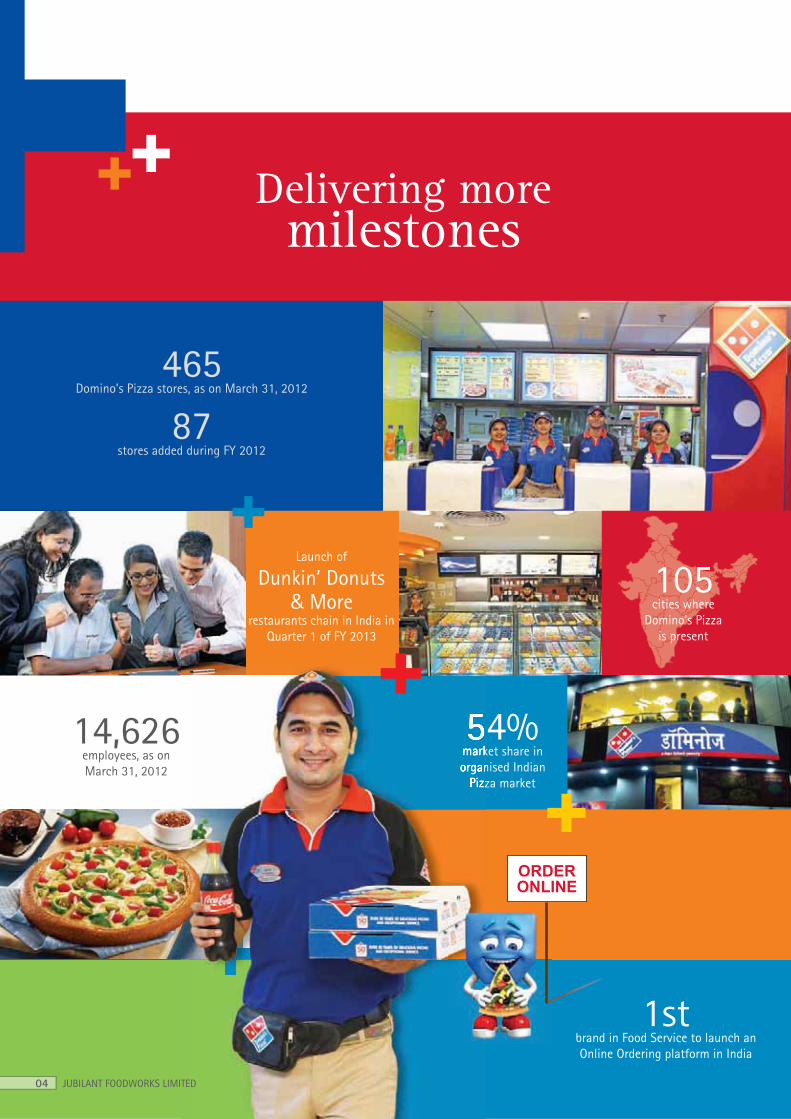
Delivering moremilestones
14,626 employees, as on March 31, 2012
54%market share in organised Indian
Pizza market
1stbrand in Food Service to launch an Online Ordering platform in India
Launch of
Dunkin’ Donuts
& More restaurants chain in India in
Quarter 1 of FY 2013
465 Domino’s Pizza stores, as on March 31, 2012
87 stores added during FY 2012
JUBILANT FOODWORKS LIMITED04
ORDERONLINE
105cities where
Domino’s Pizza is present

70%market share in
Pizza Home Delivery segment
Average 1.39 Lakh pizzas per Domino’s Pizza
store in FY 2012
1of the most engaging Facebook fan pages
with more than 1 million fans
Jubilant FoodWorks’ amongst
top 5 in Domino’s Pizza global
network outside US in terms of absolute number of stores
Entered Sri Lanka with launch of
2 Domino’s Pizza stores in Colombo in FY 2012
Continued
product innovation
to add new products & side dishes
4 out of the 5 busiest stores in Domino’s
Pizza world are from India in terms of number of pizzas sold
ANNUAL REPORT 2011-12 05
India is Domino’s Pizza’s fastest-growing market globally in terms
of new stores opened; Largest market for Domino’s Pizza globally in terms of weekly orders per store

JUBILANT FOODWORKS LIMITED06
Delivering more on afoundation of strengths
In a constantly growing and extremely competitive market, we have leveraged our strong fundamentals and deep understanding of the Indian consumer & industry dynamics to carve a leadership position. This has enabled Domino’s Pizza to achieve folklore status in the Indian food industry and helped us emerge as the partner of choice for international brands.
Our quest for operational excellence is an integral component of our business canvas.
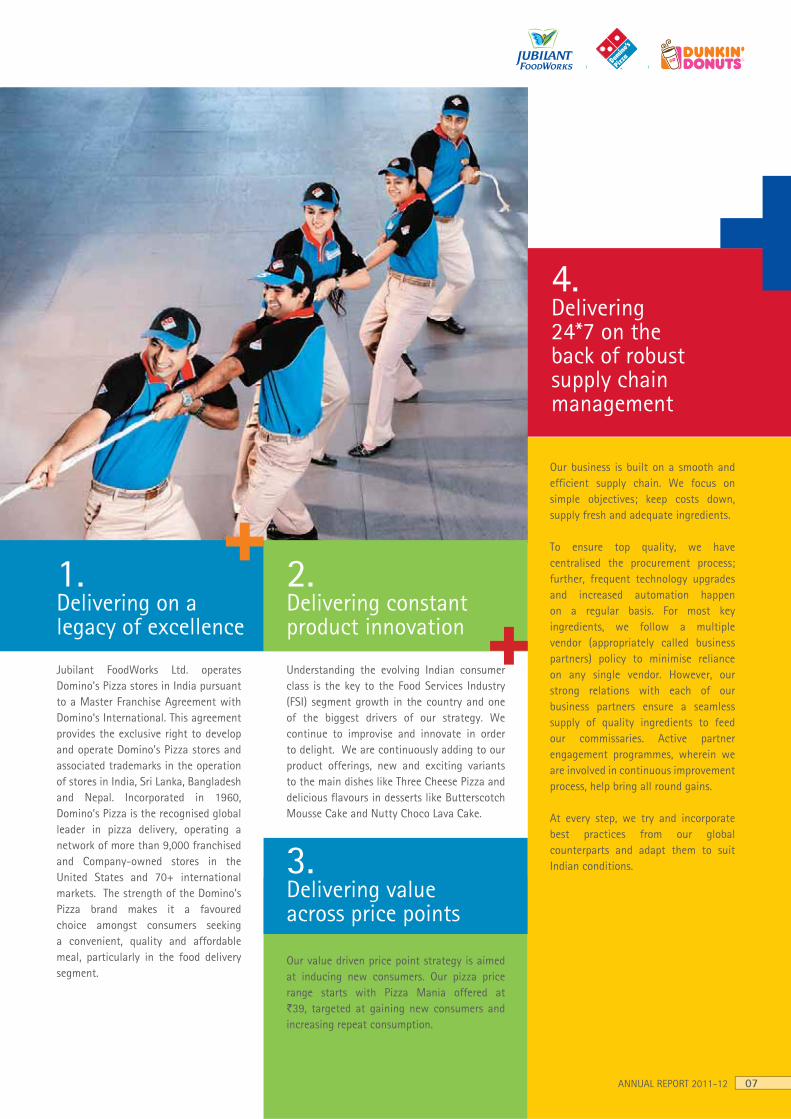
Our value driven price point strategy is aimed at inducing new consumers. Our pizza price range starts with Pizza Mania offered at `39, targeted at gaining new consumers and increasing repeat consumption.
3. Delivering value across price points
Our business is built on a smooth and efficient supply chain. We focus on simple objectives; keep costs down, supply fresh and adequate ingredients.
To ensure top quality, we have centralised the procurement process; further, frequent technology upgrades and increased automation happen on a regular basis. For most key ingredients, we follow a multiple vendor (appropriately called business partners) policy to minimise reliance on any single vendor. However, our strong relations with each of our business partners ensure a seamless supply of quality ingredients to feed our commissaries. Active partner engagement programmes, wherein we are involved in continuous improvement process, help bring all round gains.
At every step, we try and incorporate best practices from our global counterparts and adapt them to suit Indian conditions.
4. Delivering 24*7 on the back of robust supply chain management
ANNUAL REPORT 2011-12 07
2. Delivering constant product innovation
1. Delivering on a legacy of excellence
Understanding the evolving Indian consumer class is the key to the Food Services Industry (FSI) segment growth in the country and one of the biggest drivers of our strategy. We continue to improvise and innovate in order to delight. We are continuously adding to our product offerings, new and exciting variants to the main dishes like Three Cheese Pizza and delicious flavours in desserts like Butterscotch Mousse Cake and Nutty Choco Lava Cake.
Jubilant FoodWorks Ltd. operates Domino’s Pizza stores in India pursuant to a Master Franchise Agreement with Domino‘s International. This agreement provides the exclusive right to develop and operate Domino’s Pizza stores and associated trademarks in the operation of stores in India, Sri Lanka, Bangladesh and Nepal. Incorporated in 1960, Domino’s Pizza is the recognised global leader in pizza delivery, operating a network of more than 9,000 franchised and Company-owned stores in the United States and 70+ international markets. The strength of the Domino’s Pizza brand makes it a favoured choice amongst consumers seeking a convenient, quality and affordable meal, particularly in the food delivery segment.

JUBILANT FOODWORKS LIMITED08
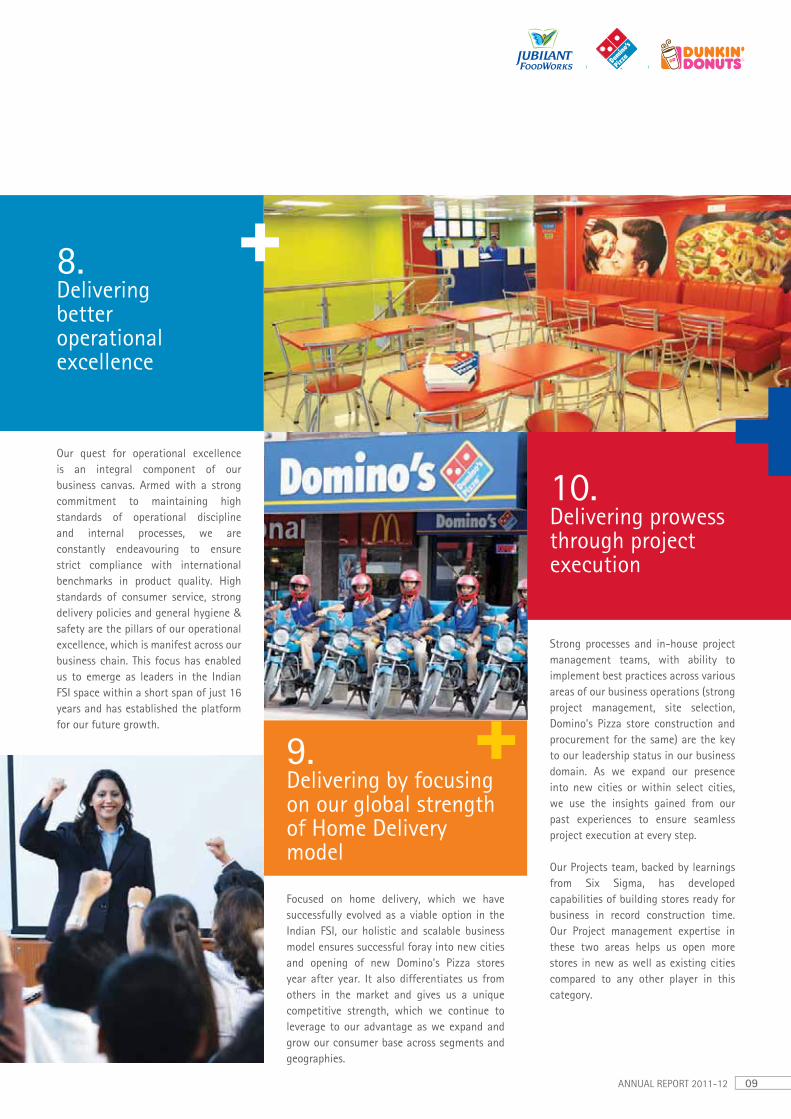
6. Delivering growth to our employees
We deeply value the contribution of our employees to our successful growth in the Indian FSI space. Our strong HR foundation involves continuous investment in our people and a training infrastructure regarded as one of the best models in the whole of Domino’s Pizza world. We have in place a robust behavioural training programme with a high execution rate. A dedicated Training Ace for each Domino’s Pizza store, with regional trainers and a dedicated training facility in each major city in which we operate, ensures a robust training system that plays a pivotal role in our growth strategy. During the year, we launched several new programmes to improve the skill-set of our human resource.
Employee empowerment at the Domino’s Pizza store level is critical to our HR philosophy and we give our store managers the liberty to take various store and consumer related decisions, such as total satisfaction guarantee. This policy also helps in encouraging individual growth. Our empowerment focus extends from the Domino’s Pizza store managers to the entry level members (team members). Committed to growth across the HR chain, we have empowered even our delivery people to give away free pizzas to consumers (in case of delayed delivery) without any hesitation and penalisation.
To curb the high attrition rate, we have also put in place several internal rewards and recognition programmes to keep employee motivation high.
Cost efficiencies without compromise on quality are a strong determinant of our growth strategy and a key factor that distinguishes us from our competitors. A lean structure with a culture of responsibility exists in each of our Domino’s Pizza stores. Reduction of waste, constant improvement in processes and reduction in costs are the key parameters enabling cost efficiencies. Our policy of centralised sourcing from an optimal number of business partners further facilitates cost efficiencies, enabling us to leverage economies of scale. The ROI analysis we undertake prior to opening every Domino’s Pizza store to determine the payback period is a strong contributory factor in the year-on-year improvement in our EBIDTA.
7. Delivering efficiencies through prudent cost management
5. Delivering a promise through brand power
Delivering more on afoundation of strengths
With a positioning that resonates with consumer emotions, our national marketing campaigns revolve around launching new winning products. Our Local Store Marketing (LSM) is aimed at devising tailor-made programmes for individual Domino’s Pizza stores depending on the catchment area requirement. Our Customer Relations Model (CRM) is scientifically designed (based on analytical modeling) to develop customised, engaging communication and offerings for consumers to suit their individual preferences. Both these models complement the national marketing programmes to drive sales growth.
From traditional media (print and TV campaigns), we have now expanded our media strategy to encompass online and digital marketing, thereby setting the stage for adding Internet and mobile platforms for reaching consumers and as a channel for receiving orders.
Complementing our marketing efforts further are our regular comprehensive programmes aimed at gauging the evolving industry trends and discerning consumer preferences, which in turn provide direction and relevance to our consumer-centric marketing strategies. The success of our incisive endeavours can be gauged by the growth of our business and Domino’s Pizza stores in recent past; increase of market share in the Indian pizza delivery business; establishment of strong consumer connect for the brand; and the opportune leverage of fast growing opportunities in the food services sector in India through the development of our new brand Dunkin’ Donuts.
ANNUAL REPORT 2011-12 09
Strong processes and in-house project management teams, with ability to implement best practices across various areas of our business operations (strong project management, site selection, Domino’s Pizza store construction and procurement for the same) are the key to our leadership status in our business domain. As we expand our presence into new cities or within select cities, we use the insights gained from our past experiences to ensure seamless project execution at every step.
Our Projects team, backed by learnings from Six Sigma, has developed capabilities of building stores ready for business in record construction time. Our Project management expertise in these two areas helps us open more stores in new as well as existing cities compared to any other player in this category.
10. Delivering prowess through project execution
Our quest for operational excellence is an integral component of our business canvas. Armed with a strong commitment to maintaining high standards of operational discipline and internal processes, we are constantly endeavouring to ensure strict compliance with international benchmarks in product quality. High standards of consumer service, strong delivery policies and general hygiene & safety are the pillars of our operational excellence, which is manifest across our business chain. This focus has enabled us to emerge as leaders in the Indian FSI space within a short span of just 16 years and has established the platform for our future growth.
8. Delivering better operational excellence
9. Delivering by focusing on our global strength of Home Delivery model
Focused on home delivery, which we have successfully evolved as a viable option in the Indian FSI, our holistic and scalable business model ensures successful foray into new cities and opening of new Domino’s Pizza stores year after year. It also differentiates us from others in the market and gives us a unique competitive strength, which we continue to leverage to our advantage as we expand and grow our consumer base across segments and geographies.

JUBILANT FOODWORKS LIMITED10
Delivering moreat every step
...of our journey of marketing and brand excellence
The beginning - Domino’s Pizza arrivesIn 1996, we opened the first Domino’s Pizza store in New Delhi. Our thrust, then, was on simply promoting and popularising “pizza” as an interesting meal replacement option, which had been restricted to a few local and homemade varieties of pizzas. We catered to the Indian palette, a wholesome base built around wheat & cheese, tomatoes for sauce, assortment of vegetables & meat and lots of other well accepted local ingredients, all enveloped on the platform “Hungry Kya?”, “if you are hungry, try Domino’s Pizza”. Now 16 years and 465 stores later, Domino’s Pizza is on the menu in 105 cities.
Establishing the Home Delivery edge - Domino’s Pizza at homeThe next phase was to arm ourselves with a distinctive competitive edge by bringing in our global strength of home delivery expertise to give our consumers more convenience and a better experience. Almost ignored till then, the concept of home delivery took off in India through Domino’s Pizza. Today, Domino’s Pizza dominates the pizza home delivery market.
Staying a step ahead - Domino’s Pizza on timeAs other players in the industry followed suit, we decided to stretch the boundaries. To inculcate the delivery trials and build the delivery inclination in the country, a bold advertising campaign ‘30 minutes or free’, promising consumers a free pizza if we failed to deliver in 30 minutes, was rolled out. This re-enforced the confidence and belief that Domino’s Pizza will always arrive on time. Today, the 30-minute delivery time is the benchmark for operational success in the home delivery space.
Constantly innovating - Domino’s Pizza excitesExtending our operational success further, we went on to innovate new products to add to the taste quotient of the consumers. We continued to add more varieties, toppings and crusts to pizzas, expanded our offerings to include pastas, cakes and several side dishes to attract more consumers to our Domino’s Pizza stores.
Reaching out - Domino’s Pizza for everyoneThe challenge was to reach out to the large middle class to give us a pan india presence. What followed were the affordable ‘Fun Meal’ and the ‘Pizza Mania’ range. With an entry price of `39, Domino’s Pizza broke into the sub `50 category. Domino’s Pizza could now be enjoyed by a completely new genre of consumers.
Creating the emotional connect - Domino’s Pizza brings happinessWith strong innovative product offerings backed by phenomenal delivery mechanism, Domino’s Pizza stepped up a gear. We moved from ruling the consumer’s mind to residing in his heart – through the ‘Khushiyon ki Home Delivery’ campaign.
Understanding the consumer, the myriad tastes across India, the role of food and specifically pizzas on occasions when families bond, as well as the changing preferences have allowed us to deliver happiness and excitement. The journey of our brand is now a benchmark in the Indian food industry.

Extending happiness beyond pizzas - Beyond Domino’s PizzaIn line with our diversification strategy, we entered into an alliance with Dunkin’ Donuts in February 2011, bringing the world’s leading & most loved baked goods and coffee chain into India. The Dunkin’ Donuts chain, established in 1950, still uses the proprietary coffee blend recipe established by its founder more than 60 years ago and offers a wide range of food products, such as donuts, bagels, muffins, breakfast sandwiches, flat bread sandwiches, hash brown, and more. It has more than 10,000 restaurants globally in 32 countries. It went in for rapid expansion in 2010, opening 574 net new global locations, making it the fastest growing QSR in the world that year.
We have spent time building the foundation for the launch of Dunkin’ Donuts in India as a sustainable brand in the All Day Part Food & Beverages Segment, as part of our strategic vision to leverage the growing preference among a younger and more affluent class to enjoy great beverages & snacks at prices meant to delight.
With a dedicated team leading various stages of development, we focused our efforts on setting high quality standards and creating a menu designed for Indian consumers. All areas of the business - from restaurant design to supply chain - were created to build a chain that is swiftly scalable. Branded as ’Dunkin’ Donuts & More’, the launch of two new restaurants in New Delhi, in Quarter 1 of FY 2013, shall be followed by a rollout of 80-100 restaurants over a span of 5 years, with initial focus on metro cities.
All our Dunkin’ Donuts restaurants shall be backed by “Central Kitchen” for continuous and uninterrupted supplies. While serving the “core” Dunkin’ Donuts menu, the restaurants will also serve products that appeal to the distinctive Indian palate. A year-long collaboration between our teams and chefs from the Dunkin’ Donuts based in the US has resulted in a menu that combines the most popular of international best sellers and Indian taste.
Dunkin’ Donuts shall help us further strengthen our position in the Indian FSI space.
ANNUAL REPORT 2011-12
Moving on...The journey continues with our core proposition of shared joy and positioning of Happiness home delivered…
11

Delivering morehappiness to the community
Corporate Social Responsibility
Sustainable development goes beyond business and this culture is etched in the professional psyche of every member of the Jubilant FoodWorks family. Delivering happiness is our motto not just to our consumers but extends to communities in which we operate. We have undertaken many initiatives to achieve this as part of our CSR campaign.
During FY 2012, we undertook various activities, some of which we are proud to enumerate below:
Distribution of food, books and stationery, etc. in slums across regions.
Environment conservation by undertaking plantation activities in some cities.
Cycle rally against pollution in Chandigarh.
Road safety campaigns in Delhi.
Blood donation camps in Delhi and Agra.
Cleanliness programmes in temples and parks in various areas.
Our team members spent time at Old Age Homes, Home for Mentally Retarded and Home for Physically Challenged in an effort to bring cheer to the lives of the inmates.
Education campaigns focusing on the underprivileged.
Other CSR highlights included malaria awareness programme, slum children education society, global hand-washing day, festival celebrations, Children’s Day celebrations, `say no to crackers’ campaign, ̀ save fuel’ campaign, ̀ protection against fog’, etc.
We remain committed to our social responsibility and the cause of environment. Social and community causes and reaching out to the underprivileged remain close to our hearts.
JUBILANT FOODWORKS LIMITED12

Delivering moreto garner more
Our success story is endorsed by the various awards, honours and recognitions that we earned during the year.
“Best Managed Company in India – Small Cap”
for the year 2010 by ASIAMONEY
Most Admired Food Service Retailer of the Year: QSR Foreign Origin
by Coca Cola Golden Spoon Awards 2012
Won 2 out of the 4 Awards given by Domino’s International in the Asia Pacific region
– Manager of the Year: International
– Rookie Manager: Asia Pacific region
Recognised with “Strong Commitment to HR Excellence” by CII in its HR Excellence
Survey 2011-12
First runners-up trophy for excellence in IT by CSI (Computer
Society of India)
Recognition as the ‘Star Small and Medium Enterprise’ at Business Standard
awards for Corporate excellence
Won 215 Rolex in 2011
Gold Award
in the “Reader’s Digest Trusted Brand 2011 Survey” in the category “Family
Restaurant”
Ranked amongst the top 25 best employers in India in Hewitt’s Best
Employers Survey 2011; amongst the 6 companies who retained their top 25 status
over the past 3 Hewitt’s surveys
Gold Award by Exchange4media for the best e-commerce product design in “Indian
Digital Media Awards”
2 awards in India e.Retail Awards 2012
– Quick Service Food Delivery e.Retailer of the year
– Best Customer Experience across e.Retail in India
Gold Franny Award by Domino’s Pizza International as the Fastest Growing
Franchisee in the World 6th time in a row
Mr. Ravi S. Gupta - JFL’s President and CFO recognised and awarded as the Best CFO
in the category “Sustained Wealth Creation (Mid-Sized Companies)” by Business Today
in association with Yes Bank
“Most Admired Retailer of the Year: Foodservice”
in Images Retail Awards 2011 by Indian Retail Forum
Ranked amongst the top 50 employers in India by the Great Places to Work Institute 2011
Gold Medal in the India Digital Awards for the ‘Best Search Marketing Campaign’ for our
Online Ordering; presented by IAMAI (Internet and Mobile Association of India), which is the
leading body for internet and mobile commerce/marketing/ activations/ promotions in India
Ranked amongst top 100 in TOP 100 CISO Awards 2011 – an award established to recognise the best and the brightest IT
security leaders of today
Won Fastest Pizza Making Competition at the Asia Pacific region
ANNUAL REPORT 2011-12 13

JUBILANT FOODWORKS LIMITED14
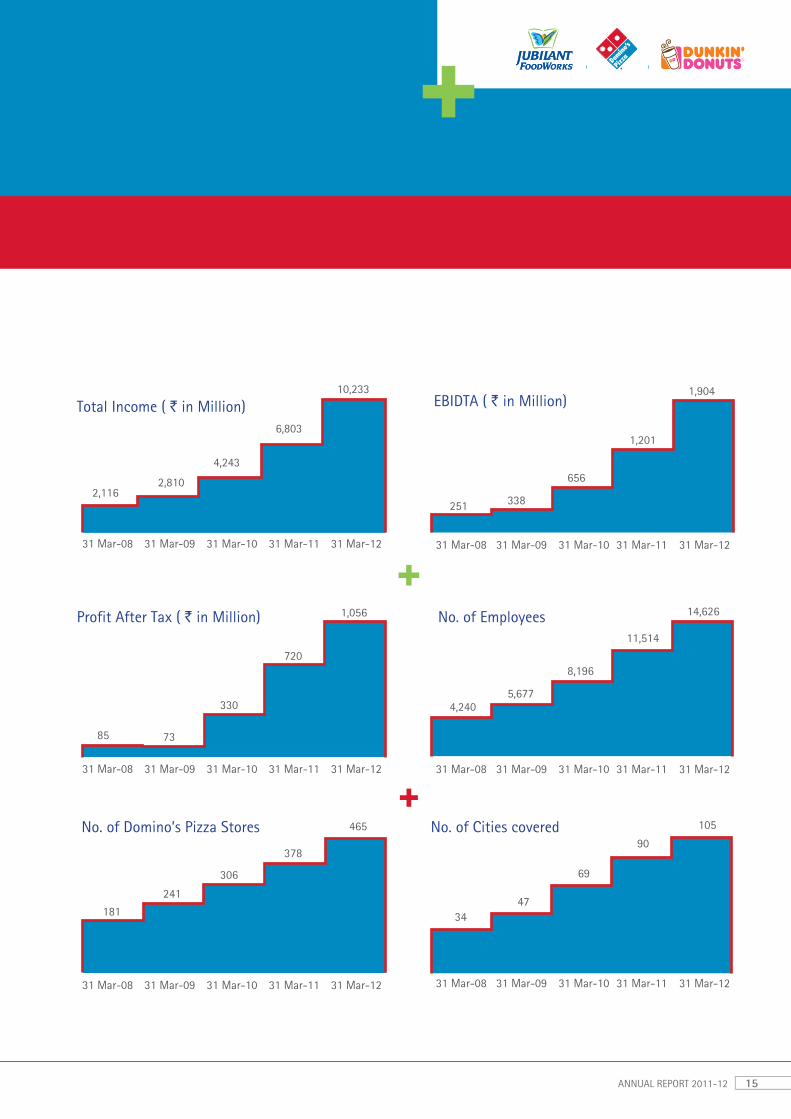
Financial Highlights
Particulars March 31, 2012
March 31, 2011
March 31, 2010
March 31, 2009
March 31, 2008
Total Income 10,233 6,803 4,243 2,810 2,116
Profit before Interest, Depreciation & Tax (EBIDTA)
1,904 1,201 656 338 251
Add: Other Income 59 19 1 1 3
Less: Interest - 3 83 89 48
Less: Depreciation 376 293 243 169 119
Less: Exceptional Items 41 - - - (5)
Profit Before Tax 1,546 924 331 81 92
Provision for Taxation/FBT 490 204 1 8 7
Profit After Tax 1,056 720 330 73 85
Earning per Share (EPS) (`) 16.3 11.2 5.5 1.3 1.5
No. of Employees 14,626 11,514 8,196 5,677 4,240
No. of Domino’s Pizza Stores
465 378 306 241 181
No. of Cities covered 105 90 69 47 34
System Sales Growth (%) 50 60 51 33 52
Same Store Sales Growth (%)
30 37 22 6 20
(` in Million, expect otherwise stated)
Delivering morethrough numbers
ANNUAL REPORT 2011-12 15
2,116
85
181 34
251
4,240
31 Mar-08
31 Mar-08
31 Mar-08
31 Mar-08
31 Mar-08
31 Mar-08
31 Mar-09
31 Mar-09
31 Mar-09
31 Mar-09
31 Mar-09
31 Mar-09
31 Mar-10
31 Mar-10
31 Mar-10
31 Mar-10
31 Mar-10
31 Mar-10
31 Mar-11
31 Mar-11
31 Mar-11
31 Mar-11
31 Mar-11
31 Mar-11
31 Mar-12
31 Mar-12
31 Mar-12
31 Mar-12
31 Mar-12
31 Mar-12
2,810
73
24147
338
5,677
4,243
330
306 69
656
8,196
6,803
720
37890
1,201
11,514
10,233
1,056
465 105
1,904
14,626
Total Income ( ` in Million)
Profit After Tax ( ` in Million)
No. of Domino’s Pizza Stores No. of Cities covered
No. of Employees
EBIDTA ( ` in Million)
Chairmen’s Letter
JUBILANT FOODWORKS LIMITED16
ANNUAL REPORT 2011-12 17
“”
Dear Shareholders,Our journey of progress continues. We started the year on a high, and have closed it on an even higher note. More excitement, more happiness and more new offerings was the mantra for us through the year, and after clocking exceptional numbers in the previous year, we continued to surge forward, notching many more milestones and recognitions in FY 2011-12.
It was a remarkable year for us, as we maintained a healthy level of growth, largely unhampered by the dampening economic scenario, to deliver more to our consumers and stakeholders. Strategic goals were achieved and continuous improvements were made on the operational front. Consumer connect has been a focus area and we continue to strengthen our presence in the consumer’s mind.
Our growth strategy was built on the two planks of driving Domino’s Pizza’s same store sales growth and expanding Domino’s Pizza’s store footprint. We performed well on both counts. Additionally, we improved operating efficiencies and kept costs in control.
While Domino’s Pizza continues to scale new heights, Dunkin’ Donuts will allow us to script a different trajectory. We feel that this segment is poised to grow and the combination of our understanding and execution skills backed by the presence of an iconic brand bodes well for the Company. With our expertise and deep domain knowledge remaining unmatched, coupled with our acknowledged position as a
leading player in the Food Services Industry, we are both excited and confident of harnessing the burgeoning potential in this sector.
Delivering strategicallyOur focus on value enhancement for our consumers remained unwavering during the year and we leveraged our aggressive marketing strategy to give the right push to our expansion thrust, even as we concertedly worked on increasing the affordability quotient for our valued consumers. The distinct competitive advantages we have over other players in the industry are backed by our track record of execution, established leadership position, high levels of operational performance and cost efficiencies. These, along with a powerful brand image and presence, shall continue to place your Company on the path to sustainable profitable growth over the long run.
Delivering more in performance Our aggressive growth and expansion thrust enabled us to keep our business well on track and to deliver expected business results during the year. We are pleased to inform you that we clocked a system level growth of 50%, with Same Store sales growth at an equally impressive 29.6%, on account of an expanded store network of Domino’s Pizza on a pan India basis, coupled with increase in number of orders received. Our EBIDTA levels also improved to 18.7%, in a year when inflationary pressures negatively impacted the industry.
The various awards and endorsements that we won during the year amply demonstrate the success of our growth strategy, which is focused on delivering more across every aspect of our business function.

Chairmen’s Letter
FSI in the country remains under penetrated, even in urban areas, offering huge opportunity for growth. The shift from unorganised to organised is very apparent across India, fuelled by growing disposable incomes, aspirations, shifting demographic pattern, awareness of hygiene, quality & taste and convenience. All these factors work in our favour and propel our growth ambitions.
We, at Jubilant FoodWorks, believe that competition for us extends beyond our immediate peers, into the overall food industry – a factor that encouraged us to move into non-Pizza segments, as evidenced in our collaboration with Dunkin’ Donuts. This is a well-thought of and planned move which stems out of our understanding of the segment and the consumer needs and which, we are confident, shall add significant value to our business proposition.
Our key performance indicatorsFor the year under review, our net sales stood at `10,173 million, as against `6,783 million in FY 2011. We opened 87 Domino’s Pizza stores during the year, taking the total number to 465, as of March 31, 2012.
We posted net profit of `1,056 million in FY 2012 – an increase of `336 million over the previous fiscal.
These results clearly demonstrate our commitment to grow our network, attract new consumers and leverage the Domino’s brand to deliver superior value to all our stakeholders.
On the product front, we added some exciting new offerings and flavours to our menu to remain ahead on the taste quotient:
Relaunch of the fast selling Pizza Mania and Pasta Italiano ranges, and introduction of a richer and more scrumptious experience with 3 cheese pizza also added more zest to our menu.
Qualitatively too, the year gone by was one of continuous improvements. The various awards and endorsements that we won during the year amply demonstrate the success of our growth strategy, which is focused on delivering more across every aspect of our business function. These recognitions and awards are a vindication of the robustness of our business model and our well-oiled machinery that is consistently delivering positive results.
Excellent drivers geared to deliver moreWe feel that, with our strong core of strengths and our experience in the industry, we have successfully evolved the right recipe for long-term and sustainable growth. Our focus on further augmenting our strengths continued during the year across our business value chain – from product innovation to Domino’s Pizza store expansion.
Geographically, we remained on track to expand our footprint to more cities across India, working on a two-pronged strategy comprising further penetration in the existing cities of our presence while concurrently expanding our presence into new cities. Our expansion thrust in Tier II and III cities continued as we forayed into Visakhapatnam, Thrissur, Gajraula, Moradabad, Rudrapur and Sambalpur. We also have a strong presence in other Tier II and III cities, including Calicut, Madurai, Gangtok, Raipur, among others – an indication of our growing pan India presence.
Cognizant of the need for regular and continuous technological upgradation to remain ahead in the business, we took several steps during the year to further integrate, improve and centralise our IT systems. This shall continue to be a major focus area as we move forward on our growth path.
Delivering more beyond bordersGoing beyond borders, we opened our maiden Domino’s Pizza store in Sri Lanka under our subsidiary, Jubilant FoodWorks Lanka Pvt. Ltd., and expanded our presence in the neighboring island nation to two stores by the end of the fiscal. There is no doubt that Sri Lanka is now clearly looking northward in terms of its consumer sentiment, optimism and overall economic vibrancy.
Food Services Industry in IndiaOur multiple and focused growth drivers inspire us to move forward with confidence to make the most of the growth potential in the Food Services Industry in India. Organised
JUBILANT FOODWORKS LIMITED18

We remain committed to optimising our cost containment practices across each area and level of business to drive continuous positive growth. Given these parameters, we are confident that our acknowledged position as a leading player in the Indian FSI space shall enable us to continue to effectively capitalise on the immense unlocked potential the sector presents.
Further strengthening of our business partner relations and launch of more tech-savvy platforms to better the consumer experience are some of the initiatives that we feel shall help us enhance our opportunity matrix to address the huge potential in the industry.
Moving forward, we are optimistic about our plans for Dunkin’ Donuts and the growth potential for Domino’s Pizza. We shall strive to further harness our strengths and we are confident that your Company shall continue to build a better growth momentum in the coming years, propelled by the hard work and commitment of a highly trained and motivated workforce.
On a concluding noteBefore we conclude, we would like to take this opportunity to thank all our stakeholders and consumers for the trust they have reposed in us and the support they have continuously extended to us at all times. We are also grateful to our Board members for their invaluable support and guidance always. With your belief in us, we are confident of maintaining an excellent performance index as we take our journey of growth to the next level. To Deliver More and More.
Best wishes & regards
Shyam S. Bhartia Hari S. BhartiaChairman & Director Co-Chairman & Director
New initiatives aimed at better consumer experience and satisfaction continued to remain high on our growth agenda. The year saw us launch our Online Ordering platform nationally with a new Digital Marketing campaign – the first in Indian FSI – to a very positive response.
Further, in an effort to boost our presence and reach in these markets, we added more Regional language channels to the media mix (Marathi, Telugu, Bengali, Punjabi and Gujarati).
Our focused endeavour to ensure an effective supply at all times has yielded strong growth parameters by ensuring that our Domino’s Pizza stores are never out of stock. Our well-oiled supply chain is the result of the Company’s accurate planning and an indication of our ability to respond to unusual situations.
Even as these initiatives gave a fillip to our home delivery segment, the dine-in segment of the Company also witnessed steady growth during the year, especially in smaller cities, to make significant contribution to our progress chart. To add to the momentum of growth in this segment, we are relocating as well as re-imaging our Domino’s Pizza stores in some of the existing cities of our presence to make them more strategically situated and get refreshed with a new look.
Our growth strategyAs we enter FY 2013, we do so with a stronger vision for success. Going ahead, we shall continue to invest, innovate and remain focused on providing the best possible experience to our consumers while delivering the maximum returns to our shareholders. Our thrust on Domino’s Pizza store expansion and further strengthening of our systems and processes shall also continue to drive our operational performance.
ANNUAL REPORT 2011-12 19

JUBILANT FOODWORKS LIMITED20
Board of Directors
Mr. Shyam S. Bhartia,aged 59, is Chairman and founder Director of the Company. He is also a fellow member of the ICWAI. Mr. Shyam S. Bhartia has experience in the pharmaceuticals and specialty chemicals, food, oil and gas, aerospace and IT sectors. He also serves on the Board of several companies such as Chambal Fertilizers and Chemicals Limited, Vam Holdings Limited and Zuari Industries Limited. Mr. Shyam S. Bhartia had served on the Board of Air India Limited in the past. He has also been a member on the Board of Governors of the Indian Institute of Technology, Mumbai and the Indian Institute of Management, Ahmedabad. He holds a Bachelor’s degree in Commerce from St. Xaviers College, Calcutta University and joined the Board of the Company in 1995.
Mr. Hari S. Bhartia,aged 55, is Co-Chairman and founder Director of the Company. He has interests in the Pharma, Life Sciences & Healthcare, Oil & Gas (Exploration & Production), Agri & Performance Polymers, Food & Retail and Consulting Services in Aerospace and Oilfield Services. Mr. Hari S. Bhartia has been involved in institutional work in various capacities with Indian Institute of Technology (IIT), Delhi and IIT Kanpur as Chairman of the Board of Governors. He is Past President of Confederation of Indian Industry (CII) & is Chairman of Indian Institute of Management (Raipur). He has also been a member in several educational and science & technology programmes of Government of India. He holds a Bachelor’s degree in Chemical Engineering from the Indian Institute of Technology, Delhi and joined the Board of the Company in 1995.
Mr. Ajay Kaul,aged 48, is the Chief Executive Officer cum Whole Time Director of the Company. Mr. Kaul has experience in industries such as financial services, airlines, express distribution and logistics and food retail. Prior to joining the Company, he worked in Indonesia as the Country Head of TNT Express Division. He has also worked with TNT India, Modiluft and American Express TRS. He holds a Bachelor’s degree in Technology from Indian Institute of Technology, Delhi and a Masters’ degree in Business Administration from XLRI, Jamshedpur. He took over as the Chief Executive Officer and joined the Board of the Company in 2005.
Mr. Vishal Marwaha,aged 48, is an Independent Director of the Company. Since 2001, Mr. Marwaha has been working with Henderson Equity Partners as a senior partner, where he is principally responsible for investments in India. He also jointly oversees Henderson Equity Partners Asian operations. He has expertise in private equity and investment banking, having previously led Hong Kong and Shanghai Banking Corporation’s South Asia private equity operations. He has also worked with ANZ Bank and Donaldson, Lufkin and Jenrette (DLJ). He holds a Bachelor’s degree in Commerce from the University of Delhi and is a qualified Chartered Accountant. He joined the Board of the Company in 2009.

ANNUAL REPORT 2011-12 21
Ms. Ramni Nirula,aged 60, is an Independent Director of the Company. Ms. Nirula has expertise in the banking and finance industry. Having joined ICICI Bank in 1976 in the project appraisal division, she has held various leadership positions in areas of Project Financing, Strategy, Planning & Resources and Corporate Banking. She is currently associated with ICICI Foundation as an advisor and key management team member. Ms. Nirula has been a member of the Board of many ICICI group and associate companies like ICICI Securities Limited, ICICI Direct and 3i Infotech. Additionally, she has been a member of Board of leading companies in India, including Ballarpur Industries Limited, Crompton Greaves Limited, Jindal Steel and Power Limited, Haldia Petrochemicals Limited and Eicher Limited. She holds a Bachelor’s degree in Economics and a Masters’ degree in Business Administration from University of Delhi and joined the Board of the Company in 2009.
Mr. Arun Seth,aged 60, is an Independent Director of the Company. He has commercial and technical expertise in the IT and telecommunications industry in India. Mr. Seth is the Non-Executive Chairman of Alcatel-Lucent India since 2011. Prior to this, he was Managing Director of British Telecom in India since 1995 and retired as the Non-Executive Chairman in 2012. Mr. Seth is also a member of the executive committee of NASSCOM, India’s leading industry association for IT and BPO. Mr. Seth also serves on the Board of various companies, including Balmer Lawrie & Co. Limited, Centum Learning Limited, and Cadista Holdings Inc. He is on the Board of various NGOs like Helpage India, Katha and TERI. He holds a Bachelor’s degree in Engineering from Indian Institute of Technology, Kanpur, as well as a MBA from Indian Institute of Management, Calcutta. He joined the Board of the Company in 2009.
Mr. Phiroz Vandrevala,aged 58, is an Independent Director of the Company. He has been part of numerous expert committees constituted by the Reserve Bank of India to guide the Central Bank in its policy-making efforts, as well as IT advisory bodies in India and on the Board of several prominent educational institutions. He is currently Vice Chairman and Managing Director of Diligenta, a subsidiary of Tata Consultancy Services (TCS), and serves on the Board of Tata Consultancy Services Ltd. and Punj Lloyd Ltd. He was the Co-Chair of the Indo-British Partnership (IBP) for over 5 years and is a Board member of Indo British Partnership Network. A graduate from Kolkata and a qualified Chartered Accountant, he joined the Board of the Company in 2010.
22 JUBILANT FOODWORKS LIMITED
ECONOMIC OVERVIEW
As in 2008, economic woes in the major developed economies weakened growth prospects around the world and the ongoing sovereign debt crises in the euro zone were a source of continuous turmoil in various global financial markets during the year. The switch from fiscal stimulus to austerity measures in many of the developed countries further weakened the global aggregate demand, already affected by persistent high unemployment.
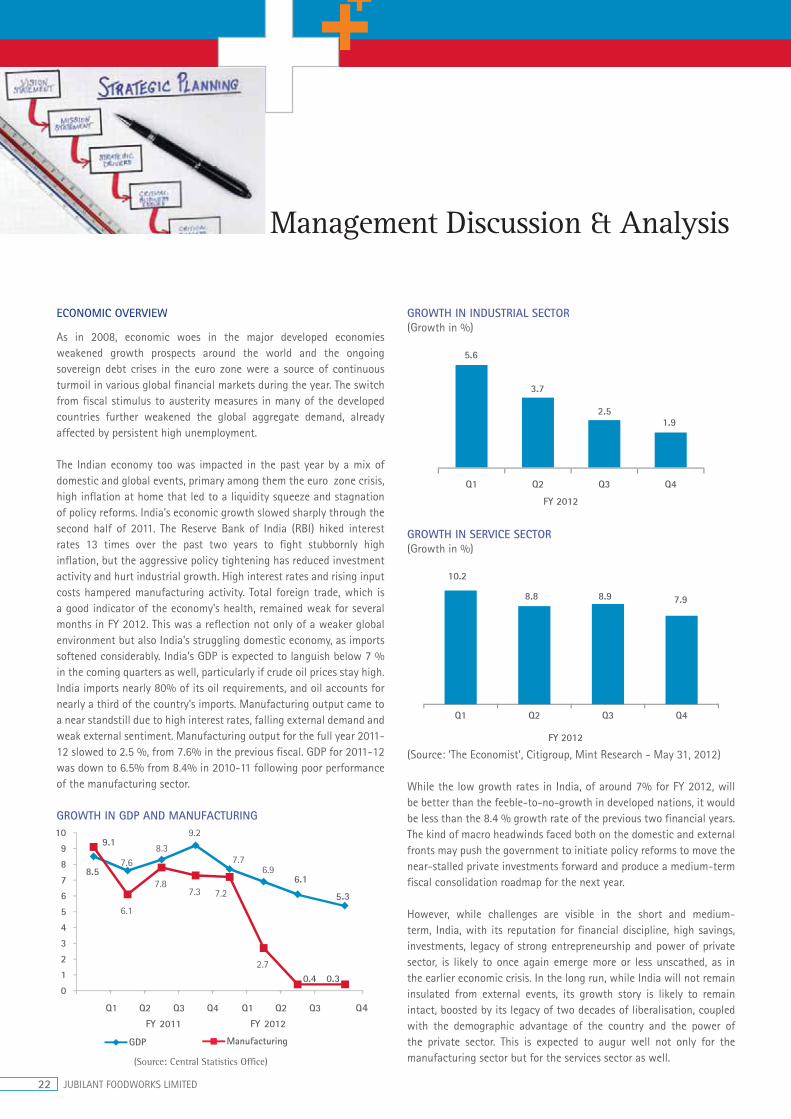
The Indian economy too was impacted in the past year by a mix of domestic and global events, primary among them the euro zone crisis, high inflation at home that led to a liquidity squeeze and stagnation of policy reforms. India’s economic growth slowed sharply through the second half of 2011. The Reserve Bank of India (RBI) hiked interest rates 13 times over the past two years to fight stubbornly high inflation, but the aggressive policy tightening has reduced investment activity and hurt industrial growth. High interest rates and rising input costs hampered manufacturing activity. Total foreign trade, which is a good indicator of the economy’s health, remained weak for several months in FY 2012. This was a reflection not only of a weaker global environment but also India’s struggling domestic economy, as imports softened considerably. India’s GDP is expected to languish below 7 % in the coming quarters as well, particularly if crude oil prices stay high. India imports nearly 80% of its oil requirements, and oil accounts for nearly a third of the country’s imports. Manufacturing output came to a near standstill due to high interest rates, falling external demand and weak external sentiment. Manufacturing output for the full year 2011-12 slowed to 2.5 %, from 7.6% in the previous fiscal. GDP for 2011-12 was down to 6.5% from 8.4% in 2010-11 following poor performance of the manufacturing sector.
GROWTH IN GDP AND MANUFACTURING
(Source: Central Statistics Office)
GROWTH IN INDUSTRIAL SECTOR(Growth in %)
5.6
3.7
2.51.9
Q1 Q2 Q3 Q4
FY 2012
GROWTH IN SERVICE SECTOR(Growth in %)
10.2
8.8 8.9 7.9
Q1 Q2
FY 2012
Q3 Q4
(Source: ‘The Economist’, Citigroup, Mint Research - May 31, 2012)
While the low growth rates in India, of around 7% for FY 2012, will be better than the feeble-to-no-growth in developed nations, it would be less than the 8.4 % growth rate of the previous two financial years. The kind of macro headwinds faced both on the domestic and external fronts may push the government to initiate policy reforms to move the near-stalled private investments forward and produce a medium-term fiscal consolidation roadmap for the next year.
However, while challenges are visible in the short and medium-term, India, with its reputation for financial discipline, high savings, investments, legacy of strong entrepreneurship and power of private sector, is likely to once again emerge more or less unscathed, as in the earlier economic crisis. In the long run, while India will not remain insulated from external events, its growth story is likely to remain intact, boosted by its legacy of two decades of liberalisation, coupled with the demographic advantage of the country and the power of the private sector. This is expected to augur well not only for the manufacturing sector but for the services sector as well.
Management Discussion & Analysis
ANNUAL REPORT 2011-12 23
INDUSTRY OVERVIEW
India’s huge population and its increasing purchasing power, growing consumer aspirations, increasing urbanisation and lifestyle changes have led to a slow but steady transformation of the Indian cities, specifically in the retail food sector. Not only the metros, but even Tier II and III cities are being increasingly dotted with a variety of fast food chains, take-aways, quality fine dining restaurants, speciality Quick Service Restaurants (QSR) and more contemporary eating options.
For the Indian Food Services Industry, the impact of the global slowdown during the year has been fairly muted but visible. Inflation, along with increasing overheads such as rent and wages, as well as higher interest outflow, posed challenges to the food services sector. This trend was particularly noticeable in the fragmented and traditional eateries, smaller standalone restaurants and hotels which cater to the discerning middle class. The promise of better quality and newer varieties tend to attract numbers to the more contemporary and organised food chains as their presence expands across the country. Economies of scale, strong supply chain network, growing consumer preference, coupled with entry of private equity in the food services sectors, has enabled many fast growing chains of the organised sector to manoeuvre around the constraints of inflation.
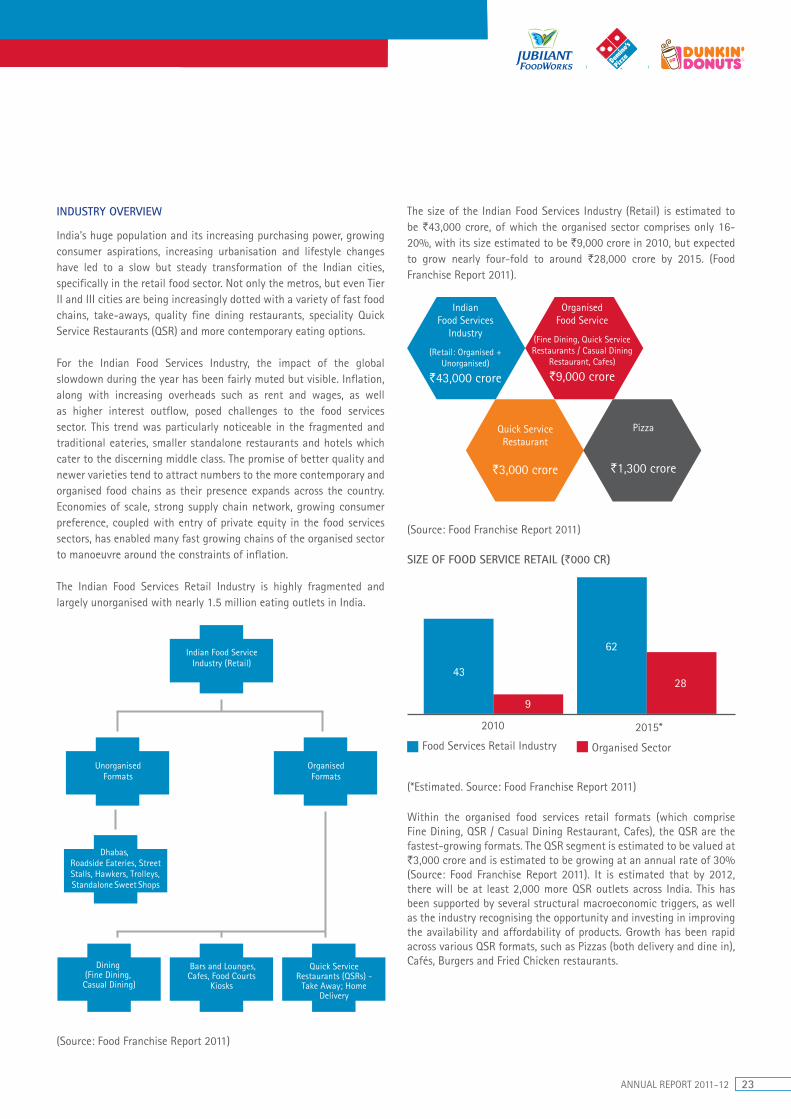
The Indian Food Services Retail Industry is highly fragmented and largely unorganised with nearly 1.5 million eating outlets in India.
(Source: Food Franchise Report 2011)
The size of the Indian Food Services Industry (Retail) is estimated to be `43,000 crore, of which the organised sector comprises only 16-20%, with its size estimated to be `9,000 crore in 2010, but expected to grow nearly four-fold to around `28,000 crore by 2015. (Food Franchise Report 2011).
Indian Food Services
Industry
(Retail: Organised + Unorganised)
`43,000 crore
Organised Food Service
(Fine Dining, Quick Service Restaurants / Casual Dining
Restaurant, Cafes)
`9,000 crore
Quick Service Restaurant
`3,000 crore
Pizza
`1,300 crore
(Source: Food Franchise Report 2011)
SIZE OF FOOD SERVICE RETAIL (`000 CR)
2010
Food Services Retail Industry Organised Sector
2015*
43
9
62
28
(*Estimated. Source: Food Franchise Report 2011)
Within the organised food services retail formats (which comprise Fine Dining, QSR / Casual Dining Restaurant, Cafes), the QSR are the fastest-growing formats. The QSR segment is estimated to be valued at `3,000 crore and is estimated to be growing at an annual rate of 30% (Source: Food Franchise Report 2011). It is estimated that by 2012, there will be at least 2,000 more QSR outlets across India. This has been supported by several structural macroeconomic triggers, as well as the industry recognising the opportunity and investing in improving the availability and affordability of products. Growth has been rapid across various QSR formats, such as Pizzas (both delivery and dine in), Cafés, Burgers and Fried Chicken restaurants.
24 JUBILANT FOODWORKS LIMITED
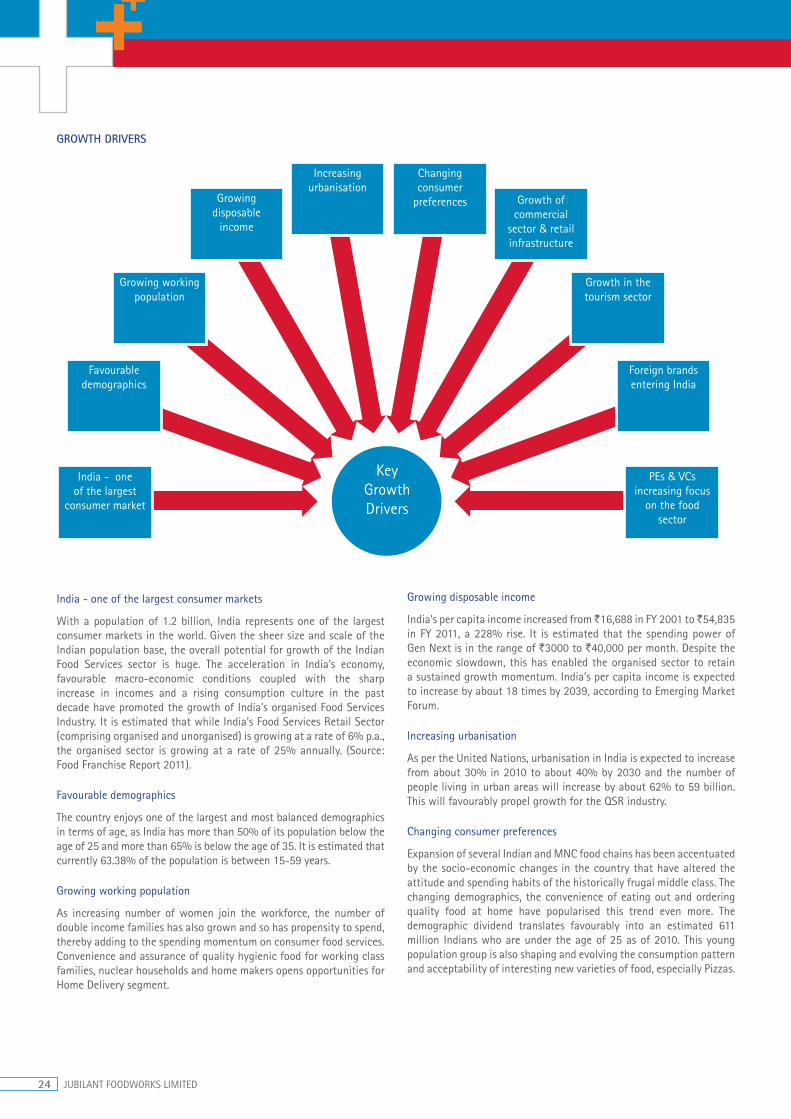
GROWTH DRIVERS
Changing consumer
preferences Growth of commercial
sector & retail infrastructure
Growth in the tourism sector
Foreign brands entering India
PEs & VCs increasing focus
on the food sector
Increasing urbanisation
Growing disposable
income
Growing working population
Favourable demographics
India - one of the largest
consumer market
KeyGrowthDrivers
India - one of the largest consumer markets
With a population of 1.2 billion, India represents one of the largest consumer markets in the world. Given the sheer size and scale of the Indian population base, the overall potential for growth of the Indian Food Services sector is huge. The acceleration in India’s economy, favourable macro-economic conditions coupled with the sharp increase in incomes and a rising consumption culture in the past decade have promoted the growth of India’s organised Food Services Industry. It is estimated that while India’s Food Services Retail Sector (comprising organised and unorganised) is growing at a rate of 6% p.a., the organised sector is growing at a rate of 25% annually. (Source: Food Franchise Report 2011).
Favourable demographics
The country enjoys one of the largest and most balanced demographics in terms of age, as India has more than 50% of its population below the age of 25 and more than 65% is below the age of 35. It is estimated that currently 63.38% of the population is between 15-59 years.
Growing working population
As increasing number of women join the workforce, the number of double income families has also grown and so has propensity to spend, thereby adding to the spending momentum on consumer food services. Convenience and assurance of quality hygienic food for working class families, nuclear households and home makers opens opportunities for Home Delivery segment.
Growing disposable income
India’s per capita income increased from ̀ 16,688 in FY 2001 to ̀ 54,835 in FY 2011, a 228% rise. It is estimated that the spending power of Gen Next is in the range of `3000 to `40,000 per month. Despite the economic slowdown, this has enabled the organised sector to retain a sustained growth momentum. India’s per capita income is expected to increase by about 18 times by 2039, according to Emerging Market Forum.
Increasing urbanisation
As per the United Nations, urbanisation in India is expected to increase from about 30% in 2010 to about 40% by 2030 and the number of people living in urban areas will increase by about 62% to 59 billion. This will favourably propel growth for the QSR industry.
Changing consumer preferences
Expansion of several Indian and MNC food chains has been accentuated by the socio-economic changes in the country that have altered the attitude and spending habits of the historically frugal middle class. The changing demographics, the convenience of eating out and ordering quality food at home have popularised this trend even more. The demographic dividend translates favourably into an estimated 611 million Indians who are under the age of 25 as of 2010. This young population group is also shaping and evolving the consumption pattern and acceptability of interesting new varieties of food, especially Pizzas.
ANNUAL REPORT 2011-12 25
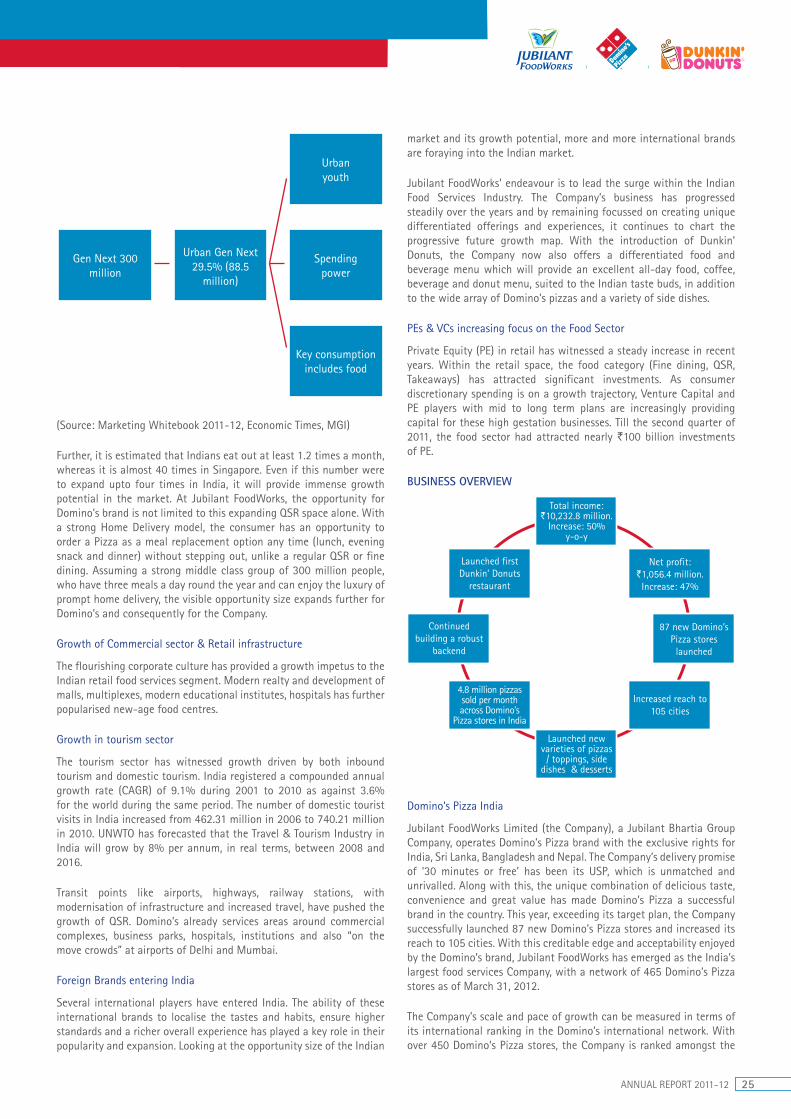
Gen Next 300 million
Urban Gen Next 29.5% (88.5
million)
Spending power
Key consumption includes food
Urban youth
(Source: Marketing Whitebook 2011-12, Economic Times, MGI)
Further, it is estimated that Indians eat out at least 1.2 times a month, whereas it is almost 40 times in Singapore. Even if this number were to expand upto four times in India, it will provide immense growth potential in the market. At Jubilant FoodWorks, the opportunity for Domino’s brand is not limited to this expanding QSR space alone. With a strong Home Delivery model, the consumer has an opportunity to order a Pizza as a meal replacement option any time (lunch, evening snack and dinner) without stepping out, unlike a regular QSR or fine dining. Assuming a strong middle class group of 300 million people, who have three meals a day round the year and can enjoy the luxury of prompt home delivery, the visible opportunity size expands further for Domino’s and consequently for the Company.
Growth of Commercial sector & Retail infrastructure
The flourishing corporate culture has provided a growth impetus to the Indian retail food services segment. Modern realty and development of malls, multiplexes, modern educational institutes, hospitals has further popularised new-age food centres.
Growth in tourism sector
The tourism sector has witnessed growth driven by both inbound tourism and domestic tourism. India registered a compounded annual growth rate (CAGR) of 9.1% during 2001 to 2010 as against 3.6% for the world during the same period. The number of domestic tourist visits in India increased from 462.31 million in 2006 to 740.21 million in 2010. UNWTO has forecasted that the Travel & Tourism Industry in India will grow by 8% per annum, in real terms, between 2008 and 2016.
Transit points like airports, highways, railway stations, with modernisation of infrastructure and increased travel, have pushed the growth of QSR. Domino’s already services areas around commercial complexes, business parks, hospitals, institutions and also “on the move crowds” at airports of Delhi and Mumbai.
Foreign Brands entering India
Several international players have entered India. The ability of these international brands to localise the tastes and habits, ensure higher standards and a richer overall experience has played a key role in their popularity and expansion. Looking at the opportunity size of the Indian
market and its growth potential, more and more international brands are foraying into the Indian market.
Jubilant FoodWorks’ endeavour is to lead the surge within the Indian Food Services Industry. The Company’s business has progressed steadily over the years and by remaining focussed on creating unique differentiated offerings and experiences, it continues to chart the progressive future growth map. With the introduction of Dunkin’ Donuts, the Company now also offers a differentiated food and beverage menu which will provide an excellent all-day food, coffee, beverage and donut menu, suited to the Indian taste buds, in addition to the wide array of Domino’s pizzas and a variety of side dishes.
PEs & VCs increasing focus on the Food Sector
Private Equity (PE) in retail has witnessed a steady increase in recent years. Within the retail space, the food category (Fine dining, QSR, Takeaways) has attracted significant investments. As consumer discretionary spending is on a growth trajectory, Venture Capital and PE players with mid to long term plans are increasingly providing capital for these high gestation businesses. Till the second quarter of 2011, the food sector had attracted nearly `100 billion investments of PE.
BUSINESS OVERVIEW
Total income: `10,232.8 million.
Increase: 50% y-o-y
Launched new varieties of pizzas
/ toppings, side dishes & desserts
Launched first Dunkin’ Donuts
restaurant
4.8 million pizzas sold per month across Domino’s
Pizza stores in India
Net profit: `1,056.4 million. Increase: 47%
Increased reach to 105 cities
87 new Domino’s Pizza stores launched
Continued building a robust
backend
Domino’s Pizza India
Jubilant FoodWorks Limited (the Company), a Jubilant Bhartia Group Company, operates Domino’s Pizza brand with the exclusive rights for India, Sri Lanka, Bangladesh and Nepal. The Company’s delivery promise of ‘30 minutes or free’ has been its USP, which is unmatched and unrivalled. Along with this, the unique combination of delicious taste, convenience and great value has made Domino’s Pizza a successful brand in the country. This year, exceeding its target plan, the Company successfully launched 87 new Domino’s Pizza stores and increased its reach to 105 cities. With this creditable edge and acceptability enjoyed by the Domino’s brand, Jubilant FoodWorks has emerged as the India’s largest food services Company, with a network of 465 Domino’s Pizza stores as of March 31, 2012.
The Company’s scale and pace of growth can be measured in terms of its international ranking in the Domino’s international network. With over 450 Domino’s Pizza stores, the Company is ranked amongst the

26 JUBILANT FOODWORKS LIMITED
top 5 in the Domino’s network globally in terms of absolute number of stores. Further, the Company has clocked highest number of store openings across all countries where Domino’s is present (outside the US) for last 4 years.
The Company also has the unique distinction of being the fastest growing franchisee of Domino’s Pizza chain globally. Other records that validate Domino’s consistent growth in India include the fact that four out of five busiest Domino’s Pizza Stores in Domino’s world were from India in calendar year 2011. Further, five new stores entered the “million dollar club” of Domino’s in 2011 i.e. they clocked a sale of more than one million USD in 2011 and the Indian operations have recorded the highest same-store-growth globally in the Domino’s network for last two years.
In the past one year, the Company has not only aggressively expanded its footprints but has also been focused on winning more consumer hearts across India through its tasty variety of Pizza offerings, unmatched delivery promise and warm customer service approach.
In line with its focussed approach, the Company has placed immense importance on consistently evolving its product portfolio while building a robust backend. These strong pillars of success have enabled the Company to emerge as the market leader in the organised pizza market, with a 54% market share (Euromonitor Report 2010) and 70% share in the pizza home delivery segment in India.
The Company’s results for FY 2012 demonstrate the success of a focussed approach to successfully achieve growth which is sustained and consistent with its expectations. For FY 2012, the Company’s total income for the year increased by 50% to `10,232.8 million. Net profit for FY 2012 was at `1,056.4 million, registering an increase of 47% as compared to last year.
The Company’s Same Store Sales (SSS) growth in FY 2012 was at 29.6% as against 37.2% for the same period in FY 2011.
The Company continued to benefit from the strong brand identity it has created for Domino’s Pizza, in combination with an outstanding product quality and an expansive network which has enabled it to grow the business thus far. The Company believes it shall be able to successfully leverage the opportunities in the QSR segment and its proven track record further encourages it to achieve greater heights. The Company’s focus of expanding Domino’s Pizza stores continued during the year as it launched 87 new stores in FY 2012 and cast its footprints in several new cities including Dhanbad, Asansol, Ajmer, Shillong etc. As a result, the Company is now present in 105 cities with a well-entrenched network of 465 Domino’s Pizza stores.
The consumers’ interest remains the top priority for the Company. An important element in the Company’s success is consumer acceptance and feedback, which it values and utilises to create new offerings. During the year, the Company launched new indulgent treats for its consumers like the unique ‘3 Cheese Pizza’, which promised a richer and more scrumptious pizza experience - a combination of Cheddar, Gouda in addition to the existing Mozzarella Cheese, to coincide with the winter season. The innovation continued with the launch of a new range of 5 Peppers Veg, Zesty Chicken and Chicken Fiesta which received strong consumer response. The Company also launched refreshing new varieties and topping options for Pizza Mania - Golden Corn, Chunky Chicken and Zesty Chicken Sausage. It also re-launched Pasta Italiano & Pizza Mania and introduced new Pizza Dips. The Company also concentrated on strengthening the side dishes and desserts and launched the Nutty Choco Lava Cake and Chicken Kickers.
With every addition to its menu, the Company is hopeful of taking the tasting experience to a new level with a pocket friendly price. While the Company creates a wider option base for its consumers, the success of new product launches continues to drive an increase in overall sales. The other new launches during the year such as Butterscotch Mousse Cake also continued to be well accepted.
On an average, 4.8 million pizzas were sold each month throughout the Domino’s Pizza stores in India in FY 2012.
The Company not only continues to align itself with its consumers but also focusses on building a robust backend as it continues to expand its business base. Supply chain management has been its focus since inception and serves as a backbone for its operations. The Company is in the process of relocating its West and East commissaries and also opening a new one around Chandigarh. Work at these commissaries is progressing well and the Company expects them to be ready for operations in first half of FY 2013.
On a competitive basis, the Company believes that with its talented and creative workforce and the culture of innovation along with the robust support system, it has a strong business foundation.
Domino’s Pizza Sri Lanka
The launch of Domino’s Pizza stores in Sri Lanka by Company’s wholly owned subsidiary has received tremendous response and operations continue to witness healthy growth. As at March 31, 2012, there were two stores in operation in the capital of Sri Lanka. With ability to have a deep understanding of consumer, solid operational expertise and best-in-class marketing, the Company seeks to deliver excellent products at the doorsteps of every household in Sri Lanka over a period of time.
Dunkin’ Donuts
Dunkin’ Donuts is the world’s leading baked goods and coffee chain with total global franchisee-reported sales of US $6.4 billion for the year 2011. Dunkin’ Donuts has more than 10,000 restaurants globally in 32 countries. Dunkin’ Donuts was the fastest growing QSR in the world last year and has rapidly expanded in 2010, opening 574 net new global locations. The original Dunkin’ Donuts experience started in 1950 with cup of coffee and a donut. Today, Dunkin’ Donuts offers a wide range of high-quality foods and beverages, including a wide variety of coffee, coffee-related beverages, tea, flavoured beverages, baked goods and an expanding all-day snacking menu. Dunkin’ Donuts still use the original proprietary coffee blend recipe established by its founder more than 60 years ago. Besides coffee, Dunkin’ Donuts has a wide range of food products such as donuts, bagels, muffins, breakfast sandwiches, flatbread sandwiches, hash browns and more.
The Company had strengthened its portfolio by entering into an alliance with Dunkin’ Donuts Franchising LLC, for developing the Dunkin’ Donuts restaurants in India. Dunkin’ Donuts would be catering to the all day part food segment and its menu includes a wide variety of coffee, coffee-related beverages, baked goods and an expanding all-day snacking menu which represents an attractive opportunity and has tremendous potential to grow.
A systematic approach is one of the key thoughts for any of the Company’s business initiatives, and thus, during the year, the Company was focussed on creating the foundation for a sustainable brand launch. Decisions & strategic choices continued to be guided by the principle of systematic expansion backed by strong infrastructure. This included creating synergies for existing facilities, setting up of
ANNUAL REPORT 2011-12 27
manufacturing facilities, supply chain competencies and processes and local vendor development. A year-long collaboration between the Company’s team and chefs from Dunkin’ Donuts resulted in a menu that combined the best of what the brand has to offer internationally, while keeping in mind the taste of Indian consumers. This delicious and well-thought through menu includes:
espresso based beverages, a range of cold coffees, fruit milk shakes and smoothies and tea
sandwiches, baked goods and other snacks, along with products specially tailored for the Indian market
better suit India tastes and preferences, including lunch and dinner sandwiches served on bread such as focaccia, croissants, rustic Mediterranean ciabatta and bagels
Dunkin’ Donuts menu is suited to the Indian taste buds and by offering certain elements of both Cafés and QSR restaurants, Dunkin’ Donuts expects to occupy the sweet spot between them.
The Dunkin’ Donuts restaurants, branded as “Dunkin’ Donuts & More” launched in New Delhi, are being catered to by the Company’s new central kitchen located at Noida.
All the growth drivers of the economy, which augur well for Domino’s, would also help in establishment and growth of Dunkin’ Donuts in India.
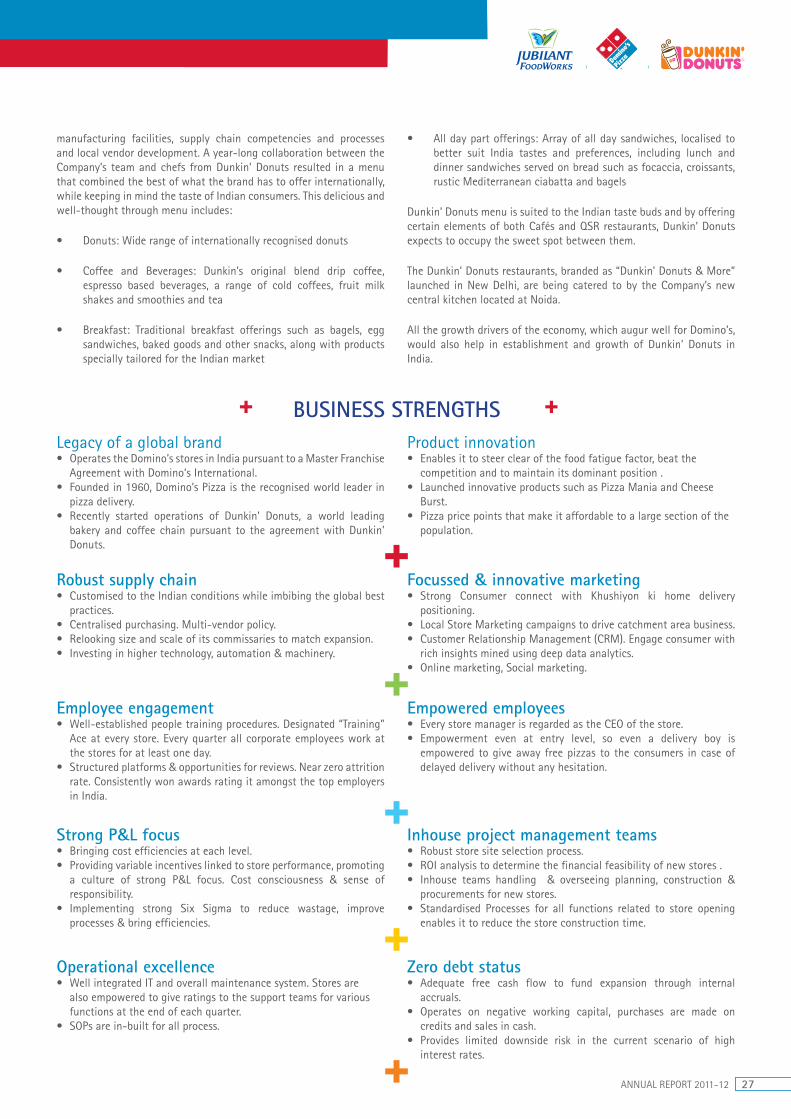
Legacy of a global brandOperates the Domino’s stores in India pursuant to a Master Franchise Agreement with Domino‘s International.Founded in 1960, Domino’s Pizza is the recognised world leader in pizza delivery.Recently started operations of Dunkin’ Donuts, a world leading bakery and coffee chain pursuant to the agreement with Dunkin’ Donuts.
Robust supply chainCustomised to the Indian conditions while imbibing the global best practices. Centralised purchasing. Multi-vendor policy. Relooking size and scale of its commissaries to match expansion.Investing in higher technology, automation & machinery.
Employee engagementWell-established people training procedures. Designated “Training” Ace at every store. Every quarter all corporate employees work at the stores for at least one day.Structured platforms & opportunities for reviews. Near zero attrition rate. Consistently won awards rating it amongst the top employers in India.
Strong P&L focusBringing cost efficiencies at each level.Providing variable incentives linked to store performance, promoting a culture of strong P&L focus. Cost consciousness & sense of responsibility.Implementing strong Six Sigma to reduce wastage, improve processes & bring efficiencies.
Operational excellence Well integrated IT and overall maintenance system. Stores are also empowered to give ratings to the support teams for various functions at the end of each quarter.SOPs are in-built for all process.
Product innovationEnables it to steer clear of the food fatigue factor, beat the competition and to maintain its dominant position .Launched innovative products such as Pizza Mania and Cheese Burst.Pizza price points that make it affordable to a large section of the population.
Focussed & innovative marketingStrong Consumer connect with Khushiyon ki home delivery positioning. Local Store Marketing campaigns to drive catchment area business.Customer Relationship Management (CRM). Engage consumer with rich insights mined using deep data analytics.Online marketing, Social marketing.
Empowered employees Every store manager is regarded as the CEO of the store.Empowerment even at entry level, so even a delivery boy is empowered to give away free pizzas to the consumers in case of delayed delivery without any hesitation.
Inhouse project management teamsRobust store site selection process.ROI analysis to determine the financial feasibility of new stores . Inhouse teams handling & overseeing planning, construction & procurements for new stores. Standardised Processes for all functions related to store opening enables it to reduce the store construction time.
Zero debt statusAdequate free cash flow to fund expansion through internal accruals. Operates on negative working capital, purchases are made on credits and sales in cash. Provides limited downside risk in the current scenario of high interest rates.
BUSINESS STRENGTHS
28 JUBILANT FOODWORKS LIMITED
The Company’s strengths are reflected in the continued acceptance of its products and its popularity is also reflected in the year-on-year awards and recognitions in every gamut.
FINANCIAL REVIEW – Standalone Financials
Total Income
The Company’s total income was at `10,232.8 million for FY 2012, an increase of 50% over `6,802.71 million in FY 2011. The Company’s Same Store Sales growth for the same period is 29.6%. The results reflect the Company’s concerted efforts to grow the Domino’s Pizza network coupled with continued new launches throughout the year. The Company’s consumers’ interests are its top priority. New products enhance the Domino’s experience and create a wider option base for consumers and the success of the new product launches continues to drive an increase in overall sales.
Total Expenditure
The Company’s total expenditure comprises primarily of cost of raw materials consumed, staff costs, manufacturing and other expenses. For FY 2012, the Company’s total expenses stood at `8,269.9 million as compared to `5,581.6 million in the previous financial year, representing an increase of 48.2%.
Raw Material & Provisions consumed for FY 2012 were at `2,611.2 million as compared to `1,705.8 million in the FY 2011. This cost includes costs related to basic ingredients such as cheese, chicken, other raw materials consumed for preparing food products and cost of traded goods. The increase in the raw material cost is directly related to the increase in number of stores operating and overall sales. In view of the impact of inflation on raw material costs, apart from leveraging volumes and the scale that is built in the business, the Company also passed residual inflation impact to the consumers in a steady way.
Personnel Expenses includes the salaries, allowances and bonus payments to all employees, contribution towards superannuation fund, provident fund and employee state insurance and other funds, gratuity and staff welfare. For FY 2012, this cost component for the Company stood at `1,962.2 million as compared to `1,355.3 million in FY 2011.
The Company’s Manufacturing and other expenses for FY 2012 were `3,696.5 million as against `2,520.5 million in FY 2011. These expenses, amongst other items, include expenses towards rent, cost of power and fuel consumed, cost of packaging materials, franchisee fees, advertisement, publicity expenses and general administration expenses.
The Company is probably the only fast food services company which engages Six Sigma in an aggressive way to look at efficiencies across the business. The marketing efforts have gone into all the tools and vehicles that were available to the Company, apart from advertising which is more conventional. The Company has also put in more money into below the line activities at the local store level and, most importantly, on the launch of the online ordering system.
EBIDTA
EBIDTA for FY 2012 was `1,905.5 million compared with `1,201.7 million in the corresponding period last year. EBIDTA margin stood at
18.7% compared to 17.7% in FY 2011. The Company’s cost containment practices and higher operating leverage on account of its business scale has enabled the Company deliver enhanced operating margins.
Profitability
Profit Before Tax (PBT) for FY 2012 was recorded at `1,546.6 million, witnessing a growth of 67.3% when compared to PBT of ̀ 924.3 million in FY 2011.
Profit After Tax (PAT) for FY 2012 was `1,056.4 million, posting a growth of 46.7% when compared to PAT of `720.0 million in FY 2011 for the same period. The Company’s top-line growth and the combined effect of the cost reductions and improved operating efficiency together had a positive impact on the profitability.
Efforts have been focussed on ensuring that the Company drives its sales with high levels of quality and service and that the cost structure is an optimal one, in order to drive profitability which is sustainable for the long term.
The PAT considers `40.5 million for FY 2012 as exceptional item as expenses for operationalising of Dunkin’ Donuts.
The Company continued to remain debt free during the year. At the end of the fiscal, the Company registered surplus cash in books of ~`900 million which currently is invested in liquid mutual funds, thus providing the Company with the requisite financial flexibility to expand its operations.
RISK REVIEW
The Company’s vision on Risk Management is to establish and maintain enterprise wide risk management capabilities for active monitoring & mitigation of organisational risks on a continuous and sustainable basis.
The Company has a holistic risk management framework to identify, assess, prioritise, manage, monitor and communicate risks across the organisation to ensure that risks are taken with due diligence and care.
The Company’s three-tier risk management framework involves a Risk Management Strategy, Risk Management Structure and Risk Identification & Monitoring.
Risk Management Strategy
Risk Management Structure
Risk Identification & Monitoring
The Company’s strong risk management framework enables it to actively monitor the business activities for identification, assessment and mitigation of potential internal or external risks. The overall tone and risk culture of the organisation through defined and communicated corporate values is set by the Company’s Senior Management. Risk responsibilities are clearly assigned and authority appropriately delegated. A set of processes, procedures and guidelines are laid down to assess the risk assessment and eliminate or minimise its impact.

ANNUAL REPORT 2011-12 29
Board of Directors and Audit Committee
Risk Management Committee (RMC) comprising CEO, CFO, Head of Functions and Head of Management Assurance Function (Chief Risk
Officer).
Responsible for the identification & monitoring of risks and implementation & review of the Risk Management initiative.
The Risk Management Committee (RMC), along with the Board, attempts to identify risks at an early stage and take appropriate steps to pre-empt or mitigate them. The risk assessments performed under the ERM exercise are a key input for the annual internal audit programme, which covers the Company’s various businesses and functions. This approach provides adequate assurance to the management that the right areas are covered under the audit plan.
The Audit Committee reviews adequacy of internal controls, along with the Head of Management Assurance, acts as a governing body to monitor the effectiveness of the ERM framework on a regular basis. Further, the Audit Committee, on a quarterly basis, reviews the adequacy and effectiveness of the internal controls being exercised by various functions and recommends to the Board on matters of core concern for redressal.
Management’s Assessment of Risk
The Company continuously works towards de-risking its business with a slew of strategic initiatives. However, there are risks within the socio-economic environment which are generic to the entire Food Services Industry (FSI) including Jubilant FoodWorks. The Company consistently monitors the risk factors and endeavours to mitigate them from time to time. The details of key risks as perceived by the management of the Company have been enumerated below:
Economic slowdown: An economic slowdown or slower growth in disposable income would limit discretionary spending and could negatively impact sales. With the economic scenario having a dampening effect on the Indian Food Services Industry, the Company’s new consumer acquisition could materialise at a slower pace as compared to the past. During the year, the Company foresaw this challenge arising due to sovereign debt crisis in the euro zone, high inflation, etc. and adopted a completely aggressive marketing policy, the results of which were clearly visible. The Company’s revenues increased by 50%, thereby crossing the `10 billion mark. The Company does not foresee any significant slide or steep downturn and remains optimistic on the country’s economic growth potential.
Dependence on Master Franchise Agreement: The Company at present relies to a large extent on its agreement with Domino’s International with respect to its business operations. The term of the Master Franchise Agreement continues until December 31, 2024 and is further extendable for a period of 10 years, subject to the fulfilment of certain conditions. Thus the right to termination is held by Domino’s International, and if exercised, the Company will have to terminate its business activity. Domino’s International so far has not had reason to ever exercise such an option in its history. Also, considering that the Indian market has been ranked among the top in terms of operational
excellence and is the fastest growing franchisee within the Domino’s global chain, the risk is more on theoretical grounds. However, the Company will use its expertise and slowly and steadily consider nurturing more brands and chains of which Dunkin’s Donuts is the first step. The operations of Dunkin’ Donuts have commenced recently.
Right Employee Mix: As the number of stores expands, the right employee mix can be a challenge. The Company is expanding its employee base and simultaneously increasing its training at each level. In each city that the Company enters, while it creates job opportunities for nearly 30-40 new employees in the store, the challenge is to ensure that it provides adequate training at each such location to both existing and new employees. The Company has developed a holistic module to keep pace with its expansion plan. The training infrastructure that is created by the Company is regarded as one of the best models in Domino’s worldwide and is robust enough to train employees for the store expansion on the anvil. The Company, year after year, has been rated as one of the best employers in India; in fact, the Hewitt Best Employer Survey rated Jubilant FoodWorks among the top 25 best employers in India third time in a row. A similar rating was also received from Great Place to Work Institute. The Company invests in its people; it invests in bench strength and in constantly training people. Following its corporate philosophy, the Company also encourages growth of its existing people and, within a short time, the Company’s strategy has enabled it to create more store managers plus regional heads while factoring in attrition. The Company continues to identify and train for nurturing the next level of professional leaders, keeping in mind its future expansion plans.
Inflation: Food inflation remains a part and parcel of the Food Services Industry. However, the Company has been able to drive continued positive financial results by leveraging volumes and the scale that is built in the business, in combination with other measures of cost containment. The Company works in close collaboration with all its business partners to create a scenario which is mutually beneficial. This has not only enabled it to leverage its scale and create efficiencies but also helped it to create a distinctive business model. The Company also enhanced its ability to monitor and thereby proactively manage its operating margins. Residual inflation impact after taking the above measures is passed on to the consumer in a steady way.
Supply chain: As the Company’s footprints rapidly scale pan India, supply chain expansion without dilution of quality and efficiency is a pre-requisite to its success. The Company has in place well integrated supply chain management systems, vendor management policies and regular vendor performance and quality audits as well as interactions to ensure the smooth supply chain management policy. The Company follows “hub and spoke model” where all ingredients are processed centrally by the Commissaries and then dispatched through dedicated channels to stores. The Quality Control for ingredients is ensured at multiple levels starting from vendor, commissaries and going upto stores.
Competition: As the QSR segment expands, competition is expected to intensify significantly in the organised food services market as well as the pizza delivery segment. Rising investments from private equity investors in the food services businesses suggest a more competitive market. One of the key determinants for success of QSR and takeaways (including Home delivery) is offering value to the consumers. Backed by good demand, the Company can offer great value to consumer along with consistency in quality due to economies of scale, strong supply chain network, aggressive advertising with increasing spending
30 JUBILANT FOODWORKS LIMITED
and consumer interest in quality food. The Company’s stores in India are located in neighbourhood areas / markets of prime areas which enables it to compete effectively with other international and domestic pizza chains operating in India, as well as local restaurants in the home delivery and QSR segment. It is able to provide both delivery or takeaways and dine-in options to its consumers while enjoying an operating cost edge.
The Company is able to offer Domino’s Pizza products at affordable price points such as Pizza Mania at `39, and further at various price points upto ̀ 500. This will help it further edge out traditional organised food options and, over the long run, this advantage is likely to expand with the expanding geographic reach. The incumbent advantage and years of experience and consumer insights will continue to provide the Company an edge over peers and new entrants.
Possible failure in new markets or new tie-ups: The Company has been doing very well in India. However, this may not be the case with other territories like Sri Lanka, Nepal and Bangladesh. The launch of Dunkin’ Donuts may not be as successful as Domino’s Pizza. This may impact the long-term performance of the Company. However, so far, the response to the store opening in Sri Lanka has been very encouraging. The Company is using its past expertise, understanding of the Indian consumers tastes and preferences to mitigate this risk.
HUMAN RESOURCES
One of the key factors aiding the growth of the Company has been the employees’ commitment to its vision. The Company has consistently been ranked amongst the top 25 best employers in India in Hewitt’s Best Employers survey in the past 3 surveys. The Company is amongst the 6 companies who have retained their top 25 status over the past 3 surveys. The Company has also consistently been ranked amongst the top 50 employers in India by the Great Places to Work Institute in last two surveys. Moving forward to match the pace of growth and sustain it in the future also, the Company continues to invest in the training and empowerment of its employees to act as partners in business.
The Company also provides its middle management the option to undertake executive training programmes. As it expands into new towns and cities, the ability to successfully train existing and new employees will play a crucial role. The Company has an integrated software system to assist with the recruitment, training, appraisal and performance management of employees and continues to develop new technology-based training mechanisms and also devise innovating employee engagement programmes.
INTERNAL CONTROL SYSTEMS AND THEIR ADEQUACY
The Company strongly believes in the critical role that internal control systems play in an organisation. The requirement of a well integrated internal control system is further underpinned by the nature of the fast evolving service oriented industry. Scale, increasing pan India footprints and simultaneously expanding the backend and front end operations also usher operational complexity which in turn requires even better integrated internal control systems. As the dynamics of the business in a competitive environment grows, the Company on an ongoing basis revisits any opportunity to further tighten its internal control systems. The Company has well defined and documented Standard Operating Processes and while imbibing global best practices it has also introduced several automatic checks using well defined working procedures and by investing in IT systems. Further, the Company’s comprehensive risk management and internal control management system enables it to identify, gauge and thereby manage risks in an efficient manner and also implement adequate checks and balances.
The Company’s internal controls are well aligned with the nature of business and economic environment in order to safeguard and mitigate risks on a proactive basis.
The Company undertakes periodic reviews to further sharpen the internal control framework at the organisation. This, in effect, helps in driving continued competitive sustainability of the Company and enables alignment of its operations and activities with its vision and values.
OUTLOOK
The Company has in place all the requisites that go into building a robust business, with streamlined processes and inbuilt operational excellence systems, strong supply chain management, robust cost management systems, people strength and the smallest aspect minutely looked into.
Looking forward, the Company’s vision, strategic thought process and core underlying strengths will lead to an even stronger future. The Company will continue its dedicated efforts to further drive its competitive edge through the scale advantage, constant innovation and financial discipline, while always looking for opportunities to further strengthen the revenue levers and improve the operating execution.
The Company remains committed to growing the Domino’s Pizza network in terms of stores in existing cities and outreach in new cities too and plans to launch 90 new Domino’s Pizza stores in FY 2013. The Company is also optimistic about its future progress in Sri Lanka as the market presents great opportunities to expand. The Company wishes to extend its experience in India while delivering growth at a healthy momentum and expects to launch 25-30 stores over the next 5 years in Sri Lanka.
With the introduction of the iconic Dunkin’ Donuts brand in India and the launch of its flagship restaurant in Delhi, the Company will now address the largely untapped ‘all-day part food’ segment. The Company has leveraged its own knowledge and ability to gauge the Indian consumer’s preferences and also utilised the flexibility provided by Dunkin’ Donuts to suitably localise the menu to delivery unique food service experience to the Indian consumers. The Company believes that the Dunkin’ Donuts brand is extremely relevant for India not only due to its strength in donuts and coffee, but also due to a differentiated food and beverage menu. The Company’s efforts have been directed at combining Dunkin’ Donuts global quality standards with its own knowledge and ability to create a synergistic operating environment. The Company plans to expand in a phased manner with a plan of launching around 10 restaurants in FY 2013 and a target of 80-100 restaurants over a span of 5 years.
The Company believes it is at an exciting phase in its life cycle and remains optimistic about its future growth with regards to Domino’s Pizza and with the launch of Dunkin’ Donuts stores. With this, the Company is now well poised to address two distinct non-competing segments of the Food Services Industry in India, namely the home delivery of Pizza’s market and the all day part dine-in restaurant, food and beverage market.
The Company intends to leverage its market position and experience in the Food Services Industry to launch new international food services brands in India in the future. Given the disciplined business approach and capabilities of the Company, it is confident that the forthcoming quarters and the future will be exciting, with healthy traction in its business.
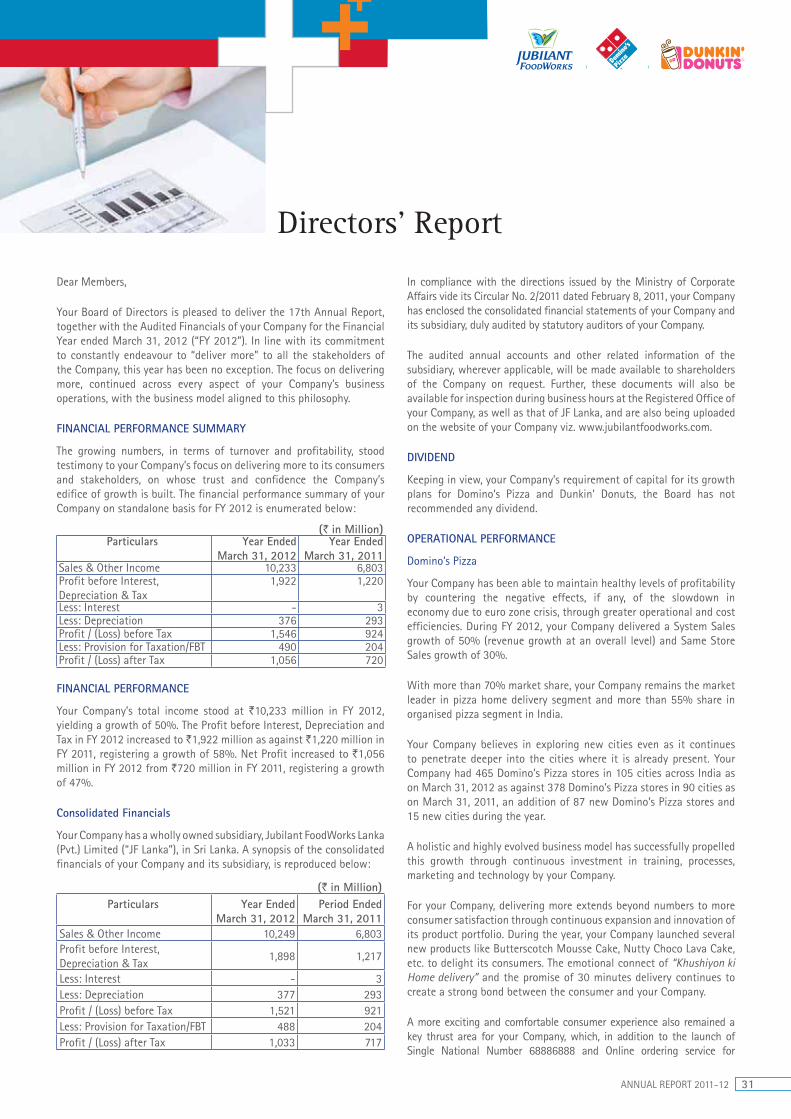
ANNUAL REPORT 2011-12 31
Dear Members,
Your Board of Directors is pleased to deliver the 17th Annual Report, together with the Audited Financials of your Company for the Financial Year ended March 31, 2012 (“FY 2012”). In line with its commitment to constantly endeavour to “deliver more” to all the stakeholders of the Company, this year has been no exception. The focus on delivering more, continued across every aspect of your Company’s business operations, with the business model aligned to this philosophy.
FINANCIAL PERFORMANCE SUMMARY
The growing numbers, in terms of turnover and profitability, stood testimony to your Company’s focus on delivering more to its consumers and stakeholders, on whose trust and confidence the Company’s edifice of growth is built. The financial performance summary of your Company on standalone basis for FY 2012 is enumerated below:
(` in Million)Particulars Year Ended
March 31, 2012Year Ended
March 31, 2011Sales & Other Income 10,233 6,803Profit before Interest, Depreciation & Tax
1,922 1,220
Less: Interest - 3Less: Depreciation 376 293Profit / (Loss) before Tax 1,546 924Less: Provision for Taxation/FBT 490 204Profit / (Loss) after Tax 1,056 720
FINANCIAL PERFORMANCE
Your Company’s total income stood at `10,233 million in FY 2012, yielding a growth of 50%. The Profit before Interest, Depreciation and Tax in FY 2012 increased to `1,922 million as against `1,220 million in FY 2011, registering a growth of 58%. Net Profit increased to `1,056 million in FY 2012 from `720 million in FY 2011, registering a growth of 47%.
Consolidated Financials
Your Company has a wholly owned subsidiary, Jubilant FoodWorks Lanka (Pvt.) Limited (“JF Lanka”), in Sri Lanka. A synopsis of the consolidated financials of your Company and its subsidiary, is reproduced below:
(` in Million)Particulars Year Ended
March 31, 2012Period Ended
March 31, 2011Sales & Other Income 10,249 6,803Profit before Interest, Depreciation & Tax
1,898 1,217
Less: Interest - 3Less: Depreciation 377 293Profit / (Loss) before Tax 1,521 921Less: Provision for Taxation/FBT 488 204Profit / (Loss) after Tax 1,033 717
In compliance with the directions issued by the Ministry of Corporate Affairs vide its Circular No. 2/2011 dated February 8, 2011, your Company has enclosed the consolidated financial statements of your Company and its subsidiary, duly audited by statutory auditors of your Company.
The audited annual accounts and other related information of the subsidiary, wherever applicable, will be made available to shareholders of the Company on request. Further, these documents will also be available for inspection during business hours at the Registered Office of your Company, as well as that of JF Lanka, and are also being uploaded on the website of your Company viz. www.jubilantfoodworks.com.
DIVIDEND
Keeping in view, your Company’s requirement of capital for its growth plans for Domino’s Pizza and Dunkin’ Donuts, the Board has not recommended any dividend.
OPERATIONAL PERFORMANCE
Domino’s Pizza
Your Company has been able to maintain healthy levels of profitability by countering the negative effects, if any, of the slowdown in economy due to euro zone crisis, through greater operational and cost efficiencies. During FY 2012, your Company delivered a System Sales growth of 50% (revenue growth at an overall level) and Same Store Sales growth of 30%.
With more than 70% market share, your Company remains the market leader in pizza home delivery segment and more than 55% share in organised pizza segment in India.
Your Company believes in exploring new cities even as it continues to penetrate deeper into the cities where it is already present. Your Company had 465 Domino’s Pizza stores in 105 cities across India as on March 31, 2012 as against 378 Domino’s Pizza stores in 90 cities as on March 31, 2011, an addition of 87 new Domino’s Pizza stores and 15 new cities during the year.
A holistic and highly evolved business model has successfully propelled this growth through continuous investment in training, processes, marketing and technology by your Company.
For your Company, delivering more extends beyond numbers to more consumer satisfaction through continuous expansion and innovation of its product portfolio. During the year, your Company launched several new products like Butterscotch Mousse Cake, Nutty Choco Lava Cake, etc. to delight its consumers. The emotional connect of “Khushiyon ki Home delivery” and the promise of 30 minutes delivery continues to create a strong bond between the consumer and your Company.
A more exciting and comfortable consumer experience also remained a key thrust area for your Company, which, in addition to the launch of Single National Number 68886888 and Online ordering service for
Directors’ Report
32 JUBILANT FOODWORKS LIMITED
Domino’s Pizza, also entered into the field of digital marketing, thereby creating more and more ways to reach its consumers. The popularity of your Company in the society is well depicted by a fan base of over 1 million people on Domino’s Pizza Fan Page on Facebook as on March 31, 2012.
During the year, your Company also opened its first two Domino’s Pizza stores in Sri Lanka through its subsidiary. Since the launch, the consumer response has been overwhelming, indicating the brand’s wholehearted acceptance in Sri Lanka.
Dunkin’ Donuts
Your Company announced launch of Dunkin’ Donuts by opening two restaurants in New Delhi in May 2012, thereby adding more flavour to its palate. With the launch of Dunkin’ Donuts, your Company marks the beginning of another exciting journey and hopes to exceed consumer expectations.
INCORPORATION OF SUBSIDIARY
Your Company incorporated a wholly owned subsidiary in Mauritius, viz. JFW Holdings Mauritius Private Limited in March 2012.
RISK MANAGEMENT
Your Company has a strong risk monitoring system at various levels for timely identification and mitigation of the risks faced by your Company. With an effective risk management framework in place, your Company looks at these risks as challenges and opportunities to create more value for its stakeholders.
A detailed note on Risk Management is given as part of “Management Discussion & Analysis”.
SHARE CAPITAL
During the year, your Company issued 545,720 Equity Shares on the exercise of stock options under Employees Stock Option Plan, 2007. As a result, the issued, subscribed and paid-up equity share capital increased from 64,532,220 Equity Shares as at March 31, 2011 to 65,077,940 Equity Shares as at March 31, 2012.
HUMAN RESOURCE DEVELOPMENT
Your Company considers its employees resources as the engine which drives the Company’s growth and helps it rise to greater levels of success. Your Company believes in the philosophy of continuous investment in its people by undertaking several employee development initiatives and best-in-class employee friendly policies. During the year, various programmes were conducted across teams for the overall skill enhancement of the employees. Further, varied employee engagement programmes were initiated to sustain the energised and cohesive team culture in the organisation. Your Company successfully implemented a Succession Planning initiative for the key leadership roles and created customised development programmes for the incumbents.
As a testimony to this, your Company continues to enjoy a strong reputation as an employer of choice. Your Company has been ranked amongst the top 25 employers in India in Hewitt’s Best Employers Survey in the past 3 years. Your Company is amongst 6 companies who have retained their status over the past 3 surveys. Your Company has also consistently been ranked amongst the top 50 employers in India by the Great Place to Work Institute in the last 3 surveys. Your Company was also recognised with “Strong Commitment to HR Excellence” by CII in its HR Excellence Survey 2011-12.
“Happy faces delivering boxes of joy, confidence in their strides, pride in their voice and a feeling of comradeship with their fellow colleagues – all this makes your Company a great place to work.”
Your Company also implemented JFL Employees Stock Option Scheme, 2011 during the year to reward its employees. In addition, the Employees Stock Option Plan, 2007 is still in force. The Compensation Committee of your Company administers and monitors both ESOP Schemes. During the year, the employees were allotted equity shares upon exercise of stock options under the Employees Stock Option Plan, 2007. The applicable disclosures under the Securities and Exchange Board of India (Employee Stock Option Scheme and Employee Stock Purchase Scheme) Guidelines, 1999, as at March 31, 2012 are given in Annexure A.
Certificate from M/s. S. R. Batliboi & Co., Chartered Accountants, Statutory Auditors, with respect to the implementation of the JFL Employees Stock Option Scheme, 2011 and Employees Stock Option Plan, 2007 would be placed before the shareholders at the ensuing Annual General Meeting and a copy of the same shall be available for inspection at the Registered Office of your Company.
CORPORATE SOCIAL RESPONSIBILITY (CSR) - CARING FOR THE COMMUNITY
Your Company is committed to contribute as much more to the society as to its employees, consumers and stakeholders in its pursuit of growth. It is a privilege for your Company to extend a supporting hand to those in need. Road safety, health awareness, green plant and civic and social awareness are some of the key areas your Company actively pursued as part of its CSR thrust. This focus is evident from the fact that 481 CSR activities were undertaken in FY 2012 as against 366 in FY 2011.
CORPORATE GOVERNANCE REPORT
Your Company consistently endeavours to focus on good corporate governance practices to match global standards. These practices have resulted in securing the trust of the stakeholders and society at large in your Company and its management.
The Corporate Governance Report pursuant to Clause 49 of the Listing Agreement with the Stock Exchanges forms part of the Annual Report. A certificate from M/s. Chandrasekaran Associates, Company Secretaries confirming compliance with the conditions of Corporate Governance as stipulated under Clause 49 is attached to this Report.
MANAGEMENT DISCUSSION AND ANALYSIS REPORT
Pursuant to Clause 49 of the Listing Agreement with the Stock Exchanges, the Management Discussion & Analysis Report is presented in a separate section forming part of the Annual Report.
DEPOSITS
Your Company has not accepted any public deposits and, as such, no amount on account of principal or interest was outstanding as at March 31, 2012.
DIRECTORS
In accordance with the Articles of Association of your Company, Mr. Vishal Marwaha and Mr. Arun Seth are liable to retire by rotation in the forthcoming Annual General Meeting and being eligible, offer themselves for re-appointment.
ANNUAL REPORT 2011-12 33
A brief resume containing nature of expertise, details of directorships held in other public limited companies and other information of the Directors proposing re-appointment pursuant to Clause 49 of the Listing Agreement with the Stock Exchanges is appended as an annexure to the Notice of ensuing Annual General Meeting.
Your Directors recommend their re-appointment at the ensuing Annual General Meeting.
AUDITORS AND THEIR REPORT
S. R. Batliboi & Co., Chartered Accountants, Statutory Auditors of your Company, retire at the conclusion of the ensuing Annual General Meeting of your Company and being eligible, have offered themselves for re-appointment as Statutory Auditors for a further period of one year. Your Directors recommend their re-appointment.
Members’ attention is drawn towards the observation made by the Auditors in Clause (ix)(a) of the Auditor’s Report and the Directors of your Company wish to clarify that your Company is committed for timely deposit of all statutory dues and steps have been taken to eliminate the slight delays due to spread of your Company’s operations pan India.
PARTICULARS OF EMPLOYEES
In terms of the provisions of Section 217 (2A) of the Companies Act, 1956, read with the Companies (Particulars of Employees) Rules, 1975, as amended, the names and other particulars of the employees are set out in the Annexure ‘B’ forming part of the Directors’ Report.
ENERGY CONSERVATION, TECHNOLOGY ABSORPTION AND FOREIGN EXCHANGE EARNINGS AND OUTGO UNDER SECTION 217(1)(e) OF THE COMPANIES ACT, 1956 READ WITH THE COMPANIES (DISCLOSURE OF PARTICULARS IN THE REPORT OF BOARD OF DIRECTORS) RULES, 1988
Energy conservation demands a strong thrust on conserving energy to the maximum extent possible. Energy Audits are carried out for Domino’s Pizza stores and commissaries of your Company to identify the areas of energy efficiency. These are implemented after due observations, thus ensuring more environment friendly and energy-efficient systems and processes.
In view of the nature of business of your Company, the information as prescribed in the prescribed form for Technology Absorption is considered to be not applicable to your Company.
Information pertaining to Foreign Exchange Earnings and Outgo is given in the Note No. 33 of the Notes forming part of the standalone financial statements.
DIRECTORS’ RESPONSIBILITY STATEMENT
Pursuant to the requirement under Section 217 (2AA) of the Companies Act, 1956, with respect to Directors’ Responsibility Statement, it is
hereby confirmed that in the preparation of Statement of Profit and Loss for the year ended March 31, 2012 and the Balance Sheet as at that date, your Directors have:
departures have been made from the same;
and made judgments and estimates that are reasonable and prudent so as to give a true and fair view of the state of affairs of your Company at the end of the financial year and of the profit of your Company for that year;
adequate accounting records in accordance with the provisions of the Companies Act, 1956 for safeguarding the assets of your Company and for preventing and detecting fraud and other irregularities; and
ACKNOWLEDGEMENT
Your Directors wish to convey their sincere appreciation to all the employees for their enormous dedication as well as contribution to the Company’s performance. The progress which the Company has made would never have been possible without the tremendous support of the Management and the dedicated commitment of the workforce of the Company. Your Directors are also thankful to the investors of the Company for their continued trust and support in the Company. Your Directors also gratefully acknowledge the continued support from the business associates, various government agencies, financial institutions, bankers, media and academic institutions received throughout the year and look forward to nurture this relationship further in the future. Your Directors also appreciate the confidence and loyalty displayed by the consumers, whom your Company will always strive to serve better by delivering more happiness.
Your Directors would need this continued support to achieve the goals they have set for Jubilant FoodWorks in the years ahead.
For and on behalf of the Board of Directors
sd/-Shyam S. BhartiaChairmanDate : May 10, 2012
Figures have been rounded off for purpose of reporting in Directors’ Report.
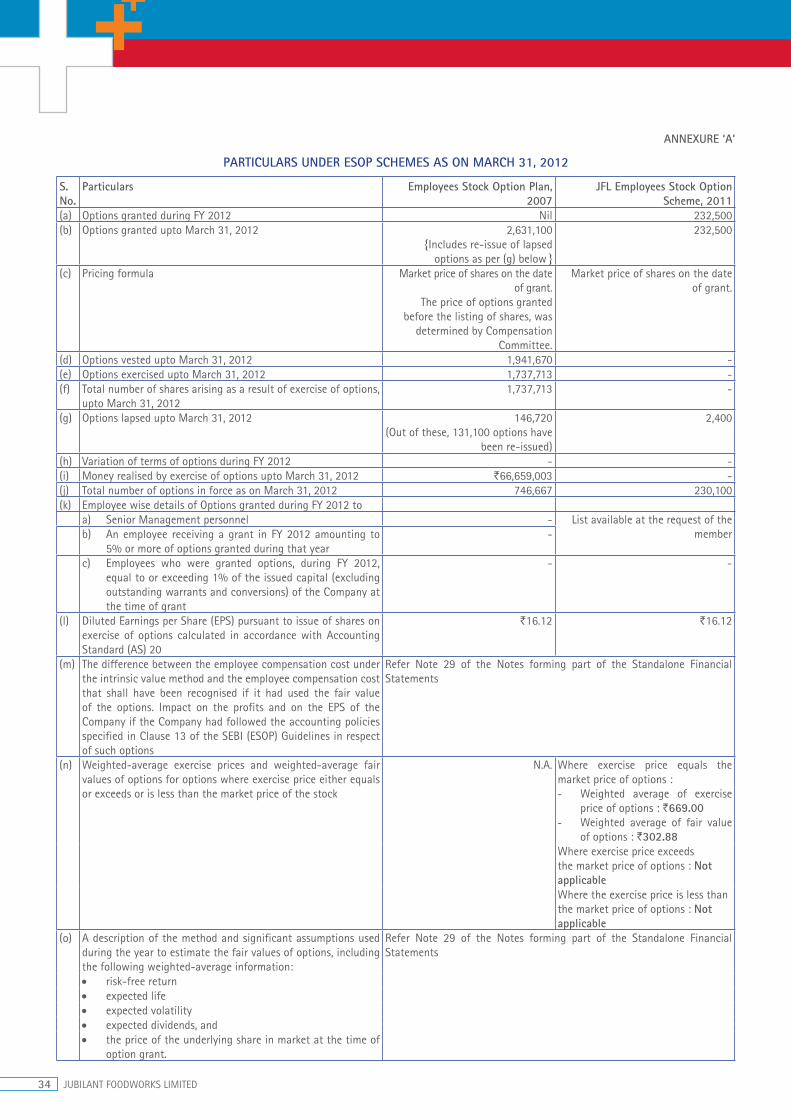
34 JUBILANT FOODWORKS LIMITED
ANNEXURE ‘A’
PARTICULARS UNDER ESOP SCHEMES AS ON MARCH 31, 2012
S. No.
Particulars Employees Stock Option Plan, 2007
JFL Employees Stock Option Scheme, 2011
(a) Options granted during FY 2012 Nil 232,500(b) Options granted upto March 31, 2012 2,631,100
{Includes re-issue of lapsed options as per (g) below}
232,500
(c) Pricing formula Market price of shares on the date of grant.
The price of options granted before the listing of shares, was
determined by Compensation Committee.
Market price of shares on the date of grant.
(d) Options vested upto March 31, 2012 1,941,670 -(e) Options exercised upto March 31, 2012 1,737,713 -(f) Total number of shares arising as a result of exercise of options,
upto March 31, 20121,737,713 -
(g) Options lapsed upto March 31, 2012 146,720(Out of these, 131,100 options have
been re-issued)
2,400
(h) Variation of terms of options during FY 2012 - -(i) Money realised by exercise of options upto March 31, 2012 `66,659,003 -(j) Total number of options in force as on March 31, 2012 746,667 230,100(k) Employee wise details of Options granted during FY 2012 to
a) Senior Management personnel - List available at the request of the memberb) An employee receiving a grant in FY 2012 amounting to
5% or more of options granted during that year -
c) Employees who were granted options, during FY 2012, equal to or exceeding 1% of the issued capital (excluding outstanding warrants and conversions) of the Company at the time of grant
- -
(l) Diluted Earnings per Share (EPS) pursuant to issue of shares on exercise of options calculated in accordance with Accounting Standard (AS) 20
`16.12 `16.12
(m) The difference between the employee compensation cost under the intrinsic value method and the employee compensation cost that shall have been recognised if it had used the fair value of the options. Impact on the profits and on the EPS of the Company if the Company had followed the accounting policies specified in Clause 13 of the SEBI (ESOP) Guidelines in respect of such options
Refer Note 29 of the Notes forming part of the Standalone Financial Statements
(n) Weighted-average exercise prices and weighted-average fair values of options for options where exercise price either equals or exceeds or is less than the market price of the stock
N.A. Where exercise price equals the market price of options :- Weighted average of exercise
price of options : `669.00- Weighted average of fair value
of options : `302.88Where exercise price exceeds the market price of options : Not applicableWhere the exercise price is less than the market price of options : Not applicable
(o) A description of the method and significant assumptions used during the year to estimate the fair values of options, including the following weighted-average information:
Refer Note 29 of the Notes forming part of the Standalone Financial Statements
risk-free returnexpected lifeexpected volatilityexpected dividends, andthe price of the underlying share in market at the time of option grant.
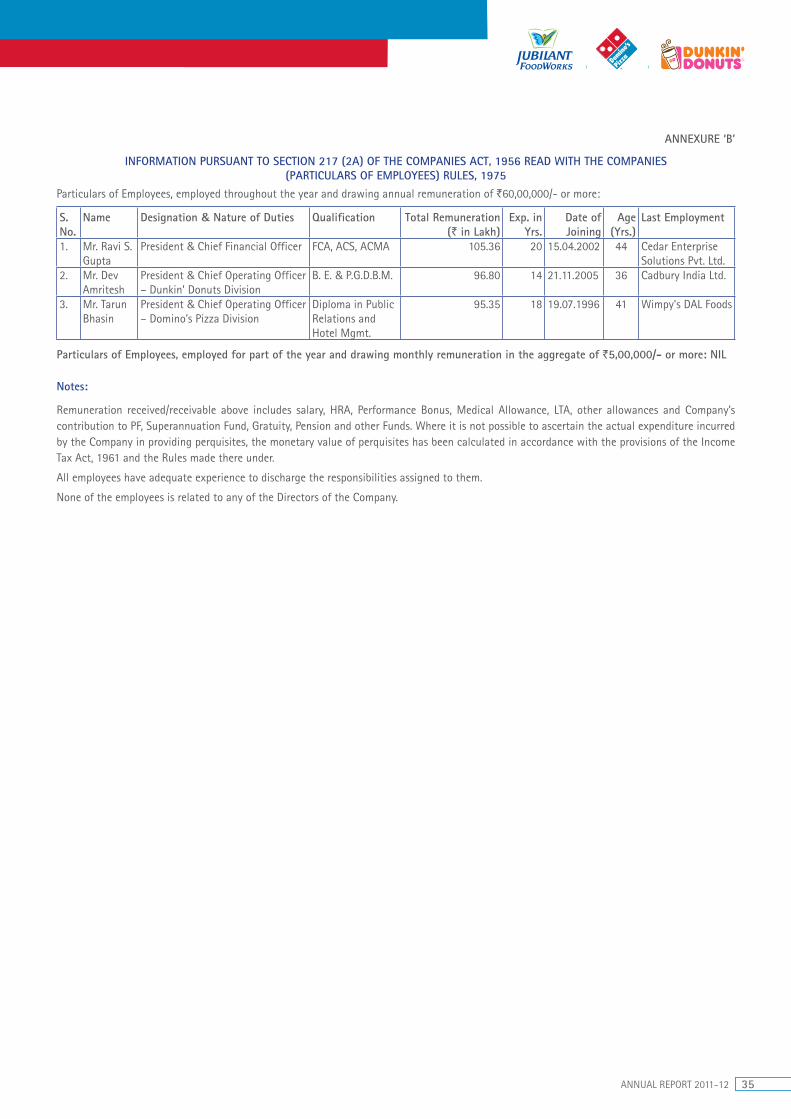
ANNUAL REPORT 2011-12 35
ANNEXURE ‘B’
INFORMATION PURSUANT TO SECTION 217 (2A) OF THE COMPANIES ACT, 1956 READ WITH THE COMPANIES (PARTICULARS OF EMPLOYEES) RULES, 1975
Particulars of Employees, employed throughout the year and drawing annual remuneration of `60,00,000/- or more:
S. No.
Name Designation & Nature of Duties Qualification Total Remuneration(` in Lakh)
Exp. in Yrs.
Date of Joining
Age (Yrs.)
Last Employment
1. Mr. Ravi S. Gupta
President & Chief Financial Officer FCA, ACS, ACMA 105.36 20 15.04.2002 44 Cedar Enterprise Solutions Pvt. Ltd.
2. Mr. Dev Amritesh
President & Chief Operating Officer – Dunkin’ Donuts Division
B. E. & P.G.D.B.M. 96.80 14 21.11.2005 36 Cadbury India Ltd.
3. Mr. Tarun Bhasin
President & Chief Operating Officer – Domino’s Pizza Division
Diploma in Public Relations and Hotel Mgmt.
95.35 18 19.07.1996 41 Wimpy's DAL Foods
Particulars of Employees, employed for part of the year and drawing monthly remuneration in the aggregate of `5,00,000/- or more: NIL
Notes:
Remuneration received/receivable above includes salary, HRA, Performance Bonus, Medical Allowance, LTA, other allowances and Company’s contribution to PF, Superannuation Fund, Gratuity, Pension and other Funds. Where it is not possible to ascertain the actual expenditure incurred by the Company in providing perquisites, the monetary value of perquisites has been calculated in accordance with the provisions of the Income Tax Act, 1961 and the Rules made there under.
All employees have adequate experience to discharge the responsibilities assigned to them.
None of the employees is related to any of the Directors of the Company.
36 JUBILANT FOODWORKS LIMITED
Corporate Governance Report
I. COMPANY’S PHILOSOPHY ON CORPORATE GOVERNANCE
The corporate governance philosophy of the Company is driven by the interest of stakeholders and business needs of the organisation. Aligning itself to this philosophy and in order to sustain the shareholders’ trust, the Company has placed corporate governance on a high priority. This ethos also underlines the Company’s commitment to fulfilment of its social responsibilities.
The highlights of the Company’s Corporate Governance regime are:
practice is Board of Directors, which oversees how the management serves and protects the long-term interests of all the stakeholders. The Company believes that an active, well-informed and independent Board is necessary to ensure high standards of corporate governance. To ensure the independency of the Board, the majority of the Board members, four out of seven, are independent Directors.
Committee, Remuneration Committee, Compensation Committee, Investors Grievance Committee, etc. for more focussed attention, enables the Company to ensure continuous monitoring and implementation of its Corporate Governance policies.
Management, along with the Code for Prevention of Insider Trading as per the SEBI Guidelines, constitute strong parameters of its Corporate Governance philosophy.
has an established Whistle Blower Policy in terms of the Listing Agreement. This policy enables employees of the organisation to bring to the notice of the Management any concerns regarding serious irregularities within the Company, while providing necessary safeguards to the
employees from unlawful victimisation.
and nurturing best talent and on promoting a culture of excellence across the organisation. Exhaustive HRD Policies cover succession planning, training and development, employee grievance handling.
e-mailing of quarterly results after release to Stock Exchanges and e-mailing of Annual Reports to shareholders, ensures a high degree of transparency in functioning.
II. BOARD OF DIRECTORS
The Board of Directors, alongwith the Committees, provides leadership and guidance to the Company’s Management and directs, supervises and controls the performance of the Company.
The Company has a Non-Executive Chairman who is also a Promoter Director. The total Board strength is seven, of which four are independent Directors and one is Whole-Time Director. As required under Clause 49 of the Listing Agreement, Independent Directors constitute the majority of the Board strength.
Composition, Meetings and Attendance
During the Financial Year ended March 31, 2012 (“FY 2012”), four Board meetings were held on May 12, 2011, August 11, 2011, November 03, 2011 and February 08, 2012. Further, circular resolutions were also passed on July 12, 2011 and January 17, 2012.
The composition of the Board and category of Directors alongwith number of directorships / membership of Committees in other companies and also the attendance of each Director at the Board Meetings held during FY 2012 and the last Annual General Meeting is as under:
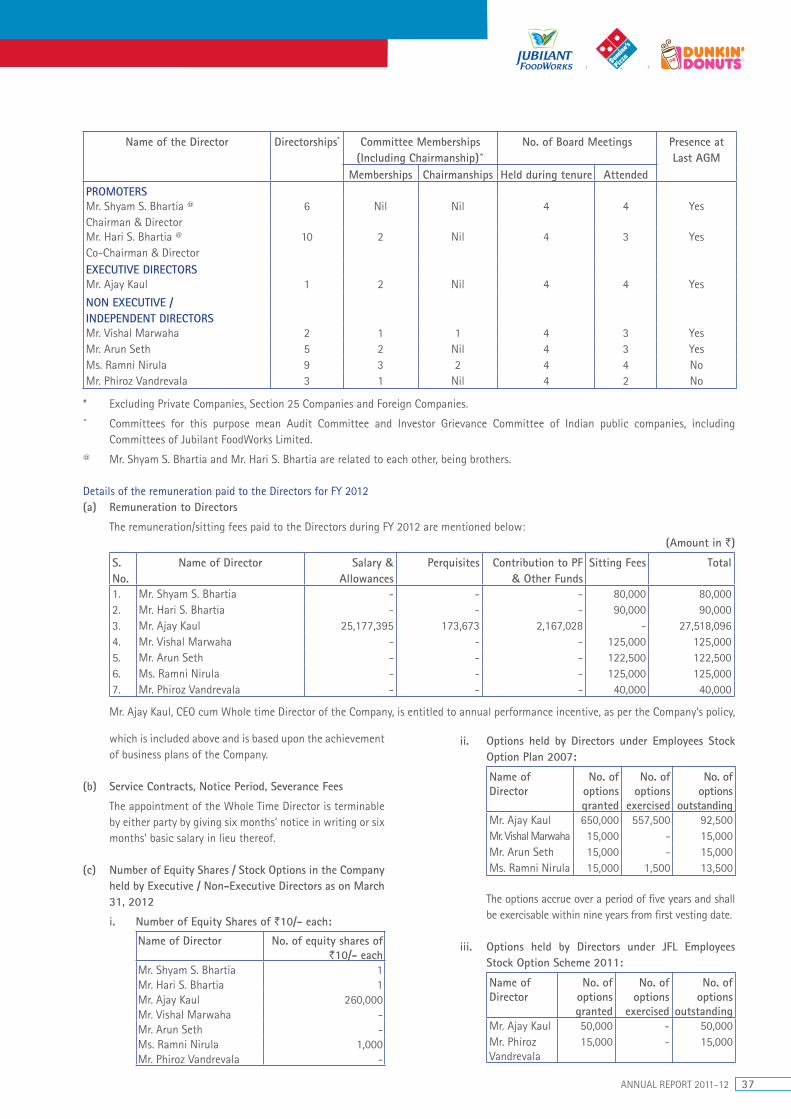
ANNUAL REPORT 2011-12 37
Name of the Director Directorships* Committee Memberships (Including Chairmanship)^
No. of Board Meetings Presence at Last AGM
Memberships Chairmanships Held during tenure AttendedPROMOTERSMr. Shyam S. Bhartia @
Chairman & Director6 Nil Nil 4 4 Yes
Mr. Hari S. Bhartia @
Co-Chairman & Director10 2 Nil 4 3 Yes
EXECUTIVE DIRECTORSMr. Ajay Kaul 1 2 Nil 4 4 Yes
NON EXECUTIVE / INDEPENDENT DIRECTORSMr. Vishal Marwaha 2 1 1 4 3 YesMr. Arun Seth 5 2 Nil 4 3 YesMs. Ramni Nirula 9 3 2 4 4 NoMr. Phiroz Vandrevala 3 1 Nil 4 2 No
* Excluding Private Companies, Section 25 Companies and Foreign Companies.
^ Committees for this purpose mean Audit Committee and Investor Grievance Committee of Indian public companies, including Committees of Jubilant FoodWorks Limited.
@ Mr. Shyam S. Bhartia and Mr. Hari S. Bhartia are related to each other, being brothers.
Details of the remuneration paid to the Directors for FY 2012(a) Remuneration to Directors
The remuneration/sitting fees paid to the Directors during FY 2012 are mentioned below:(Amount in `)
S. No.
Name of Director Salary & Allowances
Perquisites Contribution to PF & Other Funds
Sitting Fees Total
1. Mr. Shyam S. Bhartia - - - 80,000 80,0002. Mr. Hari S. Bhartia - - - 90,000 90,0003. Mr. Ajay Kaul 25,177,395 173,673 2,167,028 - 27,518,0964. Mr. Vishal Marwaha - - - 125,000 125,0005. Mr. Arun Seth - - - 122,500 122,5006. Ms. Ramni Nirula - - - 125,000 125,0007. Mr. Phiroz Vandrevala - - - 40,000 40,000
Mr. Ajay Kaul, CEO cum Whole time Director of the Company, is entitled to annual performance incentive, as per the Company’s policy,
which is included above and is based upon the achievement of business plans of the Company.
(b) Service Contracts, Notice Period, Severance Fees
The appointment of the Whole Time Director is terminable by either party by giving six months’ notice in writing or six months’ basic salary in lieu thereof.
(c) Number of Equity Shares / Stock Options in the Company held by Executive / Non-Executive Directors as on March 31, 2012
i. Number of Equity Shares of `10/- each:
Name of Director No. of equity shares of `10/- each
Mr. Shyam S. Bhartia 1Mr. Hari S. Bhartia 1Mr. Ajay Kaul 260,000Mr. Vishal Marwaha -Mr. Arun Seth -Ms. Ramni Nirula 1,000Mr. Phiroz Vandrevala -
ii. Options held by Directors under Employees Stock Option Plan 2007:
Name of Director
No. of options granted
No. of options
exercised
No. of options
outstandingMr. Ajay Kaul 650,000 557,500 92,500Mr. Vishal Marwaha 15,000 - 15,000Mr. Arun Seth 15,000 - 15,000Ms. Ramni Nirula 15,000 1,500 13,500
The options accrue over a period of five years and shall be exercisable within nine years from first vesting date.
iii. Options held by Directors under JFL Employees Stock Option Scheme 2011:
Name of Director
No. of options granted
No. of options
exercised
No. of options
outstandingMr. Ajay Kaul 50,000 - 50,000Mr. Phiroz Vandrevala
15,000 - 15,000

38 JUBILANT FOODWORKS LIMITED
The options accrue over a period of three years and shall be exercisable within seven years from first vesting date.
(d) Criteria of making payments to Non-Executive Directors
The Company considers the time and efforts put in by the Non-Executive Directors in deliberations at Board/Committee meetings. They are compensated through sitting fees, as per table below, for attending the meetings and are not entitled to any other payments.
S. No.
Nature of Meeting Sitting fees per meeting (`)
1. Board 20,0002. Audit Committee 10,0003. Remuneration Committee 5,0004. Compensation Committee 5,0005. Share Transfer & Investor
Grievance Committee 2,500
III. COMMITTEES OF THE BOARD
The Board of Directors has constituted Committees of Directors, with adequate delegation of powers. Each Committee has its own charter which sets forth the purposes, goals and responsibilities of the Committees. Further, the Company Secretary of the Company acts as the Secretary to the meetings of the Committees.
The various Committees are:a. Corporate Governance Committees
- Audit Committee - Share Transfer and Investors’ Grievance Committee - Remuneration Committee
b. Other Committees - Compensation Committee - Regulatory & Finance Committee
Information pertaining to the Corporate Governance Committees is as under:
(i) Audit Committee
All members of the Committee have good financial and accounting knowledge. The Chairman of the Committee has accounting and financial management expertise. The Statutory Auditors and Internal Auditors are invitees to the meetings.
The Committee oversees the audit functions, review of Company’s financial performance, review of critical findings of Internal Audit, compliance with the Accounting Standards & all other matters specified under Clause 49 of the Listing Agreement of the Stock Exchange and in Section 292A of the Companies Act, 1956.
During FY 2012, five meetings were held on May 11, 2011; August 11, 2011; November 03, 2011; February 02, 2012 and February 08, 2012. The composition of Committee as on March 31, 2012 and attendance of members during FY 2012 is as below:
Name & Designation of the Member No. of Meetings Attended
Mr. Vishal MarwahaChairman, Independent, Non – Executive
5
Mr. Ajay KaulExecutive Member
5
Mr. Arun SethIndependent, Non–Executive Member
4
Ms. Ramni NirulaIndependent, Non–Executive Member
2*
*Ms. Ramni Nirula was appointed as member of the Committee on January 17, 2012 by the Board of Directors through resolution passed by circulation.
The Chairman of the Committee was present in the last Annual General Meeting to respond to shareholders’ queries.
(ii) Remuneration Committee
The Committee determines the remuneration of the Executive Directors of the Company.
During FY 2012, three meetings were held on May 12, 2011; February 02, 2012 and March 16, 2012. The composition of Committee as on March 31, 2012 and attendance of members during FY 2012 is as below:
Name & Designation of the Member No. of Meetings Attended
Mr. Arun SethChairman, Independent, Non–Executive
3
Mr. Vishal MarwahaIndependent, Non–Executive Member
2
Mr. Hari S. BhartiaNon–Executive Member
3
Remuneration Policy of the Company
The Company’s Remuneration Policy is aimed at encouraging and rewarding good performance/contribution to the Company’s objectives and to retain the best talent in the organisation.
(iii) Share Transfer & Investors’ Grievance Committee
The Committee supervises the process of redressal of Investor Grievances and ensures cordial investor relations.
The Company Secretary cum Compliance Officer of the Company has been delegated the power to approve transfer and transmission of physical shares and other matters like consolidation/sub-division of share certificates, issue of duplicate share certificates, dematerialisation / rematerialisation of shares, handling of investor grievances in stipulated period of time.
During FY 2012, four meetings were held on May 12, 2011; August 11, 2011; November 03, 2011 and February 08, 2012. The composition of the Committee as on March 31, 2012 and
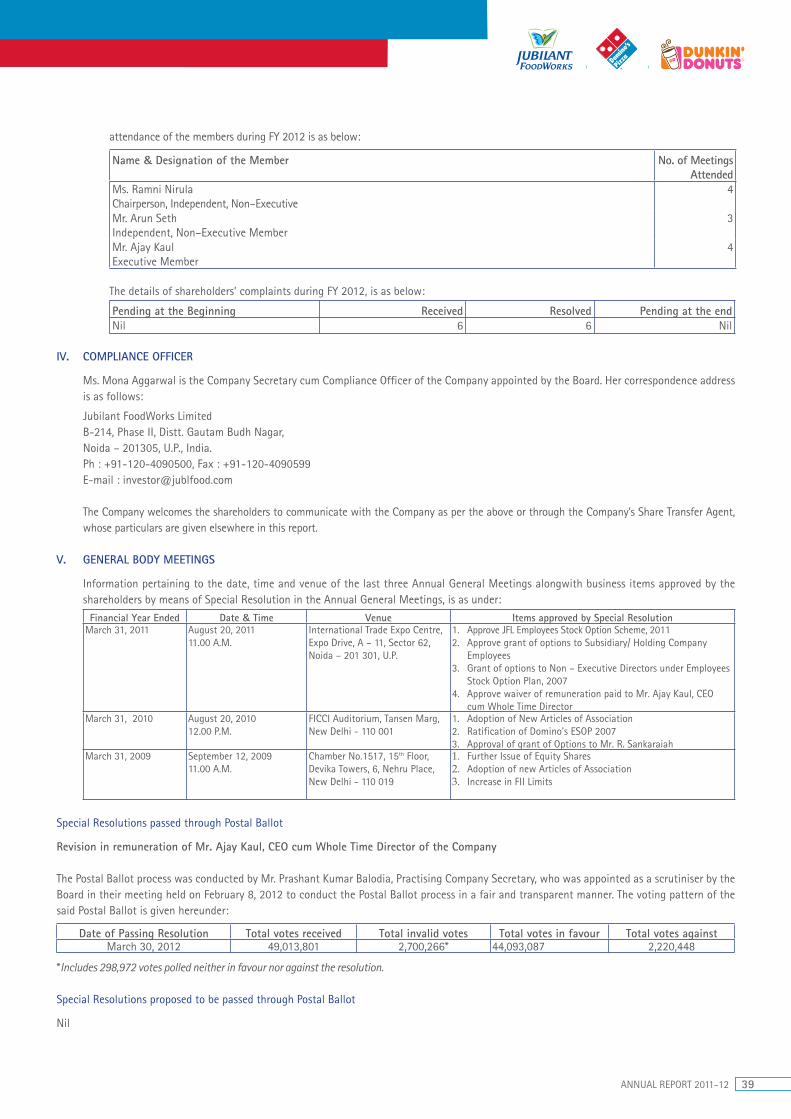
ANNUAL REPORT 2011-12 39
attendance of the members during FY 2012 is as below:
Name & Designation of the Member No. of Meetings Attended
Ms. Ramni NirulaChairperson, Independent, Non–Executive
4
Mr. Arun SethIndependent, Non–Executive Member
3
Mr. Ajay KaulExecutive Member
4
The details of shareholders’ complaints during FY 2012, is as below:
Pending at the Beginning Received Resolved Pending at the endNil 6 6 Nil
IV. COMPLIANCE OFFICER
Ms. Mona Aggarwal is the Company Secretary cum Compliance Officer of the Company appointed by the Board. Her correspondence address is as follows:
Jubilant FoodWorks LimitedB-214, Phase II, Distt. Gautam Budh Nagar,Noida – 201305, U.P., India.Ph : +91-120-4090500, Fax : +91-120-4090599E-mail : [email protected]
The Company welcomes the shareholders to communicate with the Company as per the above or through the Company’s Share Transfer Agent, whose particulars are given elsewhere in this report.
V. GENERAL BODY MEETINGS
Information pertaining to the date, time and venue of the last three Annual General Meetings alongwith business items approved by the shareholders by means of Special Resolution in the Annual General Meetings, is as under:
Financial Year Ended Date & Time Venue Items approved by Special Resolution March 31, 2011 August 20, 2011
11.00 A.M.International Trade Expo Centre, Expo Drive, A – 11, Sector 62, Noida – 201 301, U.P.
1. Approve JFL Employees Stock Option Scheme, 20112. Approve grant of options to Subsidiary/ Holding Company
Employees3. Grant of options to Non – Executive Directors under Employees
Stock Option Plan, 20074. Approve waiver of remuneration paid to Mr. Ajay Kaul, CEO
cum Whole Time DirectorMarch 31, 2010 August 20, 2010
12.00 P.M.FICCI Auditorium, Tansen Marg, New Delhi - 110 001
1. Adoption of New Articles of Association2. Ratification of Domino’s ESOP 20073. Approval of grant of Options to Mr. R. Sankaraiah
March 31, 2009 September 12, 200911.00 A.M.
Chamber No.1517, 15th Floor, Devika Towers, 6, Nehru Place, New Delhi - 110 019
1. Further Issue of Equity Shares2. Adoption of new Articles of Association3. Increase in FII Limits
Special Resolutions passed through Postal Ballot
Revision in remuneration of Mr. Ajay Kaul, CEO cum Whole Time Director of the Company
The Postal Ballot process was conducted by Mr. Prashant Kumar Balodia, Practising Company Secretary, who was appointed as a scrutiniser by the Board in their meeting held on February 8, 2012 to conduct the Postal Ballot process in a fair and transparent manner. The voting pattern of the said Postal Ballot is given hereunder:
Date of Passing Resolution Total votes received Total invalid votes Total votes in favour Total votes againstMarch 30, 2012 49,013,801 2,700,266* 44,093,087 2,220,448
*Includes 298,972 votes polled neither in favour nor against the resolution.
Special Resolutions proposed to be passed through Postal Ballot
Nil
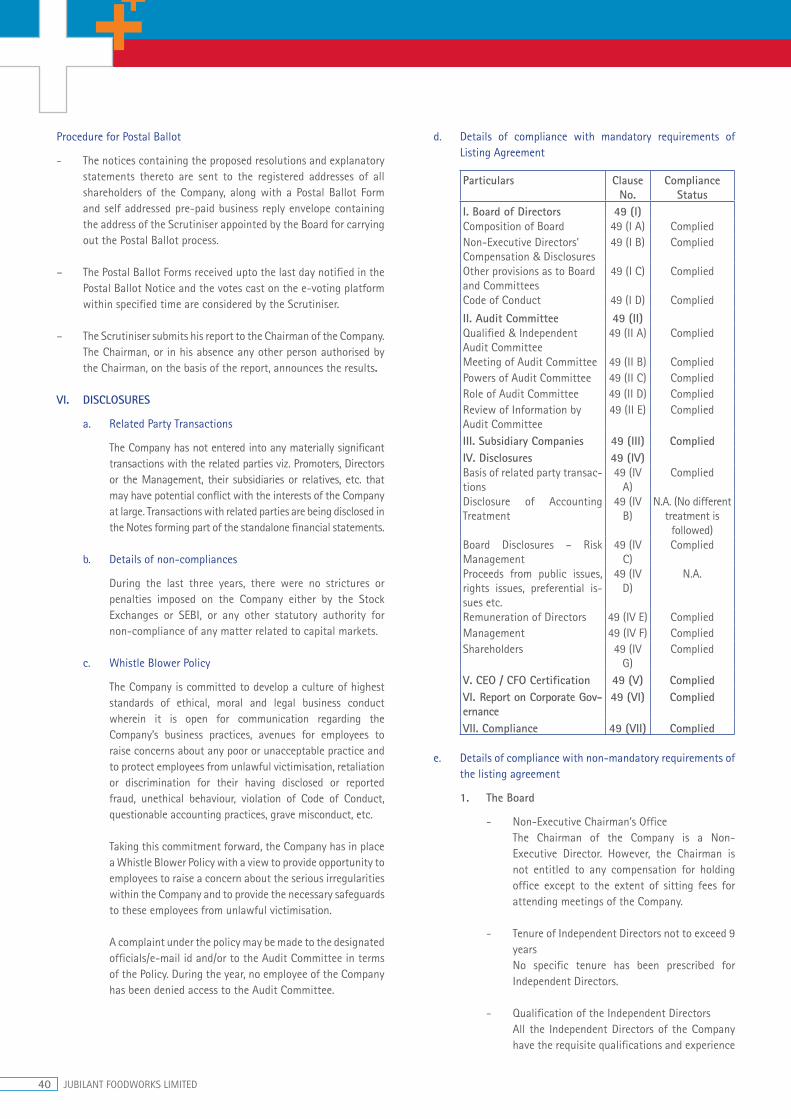
40 JUBILANT FOODWORKS LIMITED
Procedure for Postal Ballot
- The notices containing the proposed resolutions and explanatory statements thereto are sent to the registered addresses of all shareholders of the Company, along with a Postal Ballot Form and self addressed pre-paid business reply envelope containing the address of the Scrutiniser appointed by the Board for carrying out the Postal Ballot process.
– The Postal Ballot Forms received upto the last day notified in the Postal Ballot Notice and the votes cast on the e-voting platform within specified time are considered by the Scrutiniser.
– The Scrutiniser submits his report to the Chairman of the Company. The Chairman, or in his absence any other person authorised by the Chairman, on the basis of the report, announces the results.
VI. DISCLOSURES
a. Related Party Transactions
The Company has not entered into any materially significant transactions with the related parties viz. Promoters, Directors or the Management, their subsidiaries or relatives, etc. that may have potential conflict with the interests of the Company at large. Transactions with related parties are being disclosed in the Notes forming part of the standalone financial statements.
b. Details of non-compliances
During the last three years, there were no strictures or penalties imposed on the Company either by the Stock Exchanges or SEBI, or any other statutory authority for non-compliance of any matter related to capital markets.
c. Whistle Blower Policy
The Company is committed to develop a culture of highest standards of ethical, moral and legal business conduct wherein it is open for communication regarding the Company’s business practices, avenues for employees to raise concerns about any poor or unacceptable practice and to protect employees from unlawful victimisation, retaliation or discrimination for their having disclosed or reported fraud, unethical behaviour, violation of Code of Conduct, questionable accounting practices, grave misconduct, etc.
Taking this commitment forward, the Company has in place a Whistle Blower Policy with a view to provide opportunity to employees to raise a concern about the serious irregularities within the Company and to provide the necessary safeguards to these employees from unlawful victimisation.
A complaint under the policy may be made to the designated officials/e-mail id and/or to the Audit Committee in terms of the Policy. During the year, no employee of the Company has been denied access to the Audit Committee.
d. Details of compliance with mandatory requirements of Listing Agreement
Particulars Clause No.
Compliance Status
I. Board of Directors 49 (I)Composition of Board 49 (I A) CompliedNon-Executive Directors’ Compensation & Disclosures
49 (I B) Complied
Other provisions as to Board and Committees
49 (I C) Complied
Code of Conduct 49 (I D) Complied
II. Audit Committee 49 (II)Qualified & Independent Audit Committee
49 (II A) Complied
Meeting of Audit Committee 49 (II B) CompliedPowers of Audit Committee 49 (II C) CompliedRole of Audit Committee 49 (II D) CompliedReview of Information by Audit Committee
49 (II E) Complied
III. Subsidiary Companies 49 (III) Complied IV. Disclosures 49 (IV)Basis of related party transac-tions
49 (IV A)
Complied
Disclosure of Accounting Treatment
49 (IV B)
N.A. (No different treatment is
followed)Board Disclosures – Risk Management
49 (IV C)
Complied
Proceeds from public issues, rights issues, preferential is-sues etc.
49 (IV D)
N.A.
Remuneration of Directors 49 (IV E) CompliedManagement 49 (IV F) CompliedShareholders 49 (IV
G)Complied
V. CEO / CFO Certification 49 (V) CompliedVI. Report on Corporate Gov-ernance
49 (VI) Complied
VII. Compliance 49 (VII) Complied
e. Details of compliance with non-mandatory requirements of the listing agreement
1. The Board
- Non-Executive Chairman’s Office The Chairman of the Company is a Non-
Executive Director. However, the Chairman is not entitled to any compensation for holding office except to the extent of sitting fees for attending meetings of the Company.
- Tenure of Independent Directors not to exceed 9 years
No specific tenure has been prescribed for Independent Directors.
- Qualification of the Independent Directors All the Independent Directors of the Company
have the requisite qualifications and experience
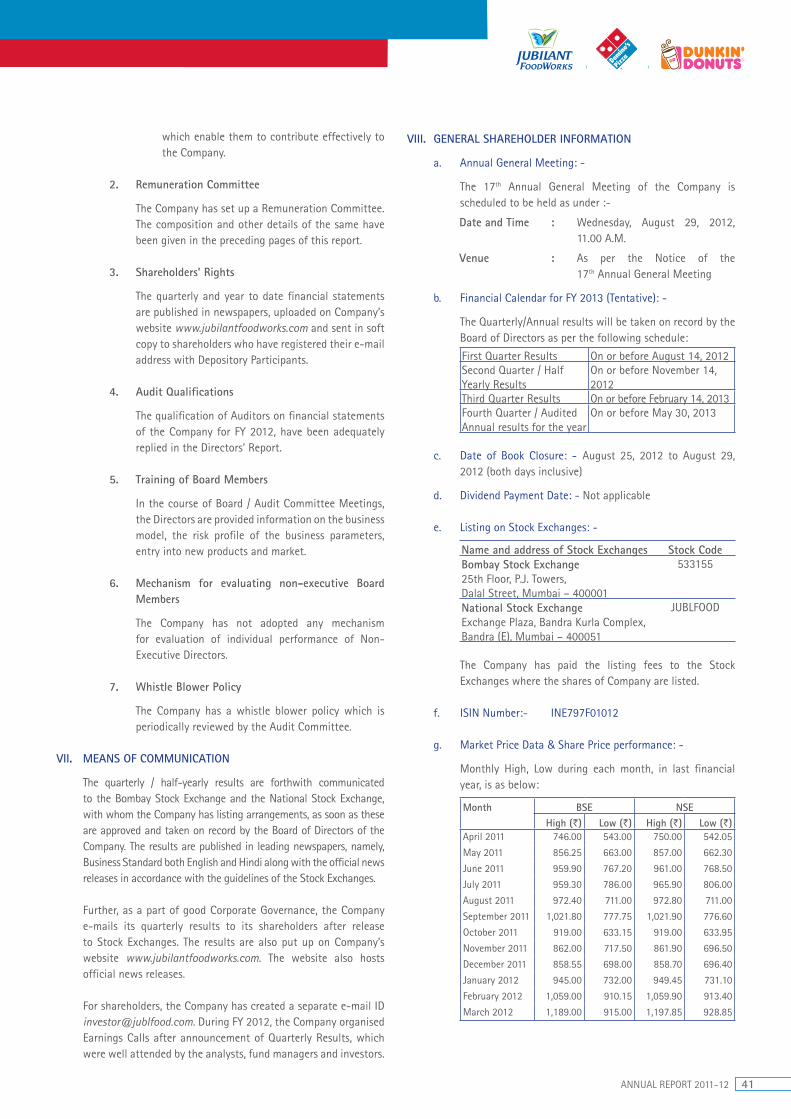
ANNUAL REPORT 2011-12 41
which enable them to contribute effectively to the Company.
2. Remuneration Committee
The Company has set up a Remuneration Committee. The composition and other details of the same have been given in the preceding pages of this report.
3. Shareholders’ Rights
The quarterly and year to date financial statements are published in newspapers, uploaded on Company’s website www.jubilantfoodworks.com and sent in soft copy to shareholders who have registered their e-mail address with Depository Participants.
4. Audit Qualifications
The qualification of Auditors on financial statements of the Company for FY 2012, have been adequately replied in the Directors’ Report.
5. Training of Board Members
In the course of Board / Audit Committee Meetings, the Directors are provided information on the business model, the risk profile of the business parameters, entry into new products and market.
6. Mechanism for evaluating non-executive Board Members
The Company has not adopted any mechanism for evaluation of individual performance of Non-Executive Directors.
7. Whistle Blower Policy
The Company has a whistle blower policy which is periodically reviewed by the Audit Committee.
VII. MEANS OF COMMUNICATION
The quarterly / half-yearly results are forthwith communicated to the Bombay Stock Exchange and the National Stock Exchange, with whom the Company has listing arrangements, as soon as these are approved and taken on record by the Board of Directors of the Company. The results are published in leading newspapers, namely, Business Standard both English and Hindi along with the official news releases in accordance with the guidelines of the Stock Exchanges.
Further, as a part of good Corporate Governance, the Company e-mails its quarterly results to its shareholders after release to Stock Exchanges. The results are also put up on Company’s website www.jubilantfoodworks.com. The website also hosts official news releases.
For shareholders, the Company has created a separate e-mail ID [email protected]. During FY 2012, the Company organised Earnings Calls after announcement of Quarterly Results, which were well attended by the analysts, fund managers and investors.
VIII. GENERAL SHAREHOLDER INFORMATION
a. Annual General Meeting: -
The 17th Annual General Meeting of the Company is scheduled to be held as under :-
Date and Time : Wednesday, August 29, 2012, 11.00 A.M.
Venue : As per the Notice of the 17th Annual General Meeting
b. Financial Calendar for FY 2013 (Tentative): -
The Quarterly/Annual results will be taken on record by the Board of Directors as per the following schedule:
First Quarter Results On or before August 14, 2012Second Quarter / Half Yearly Results
On or before November 14, 2012
Third Quarter Results On or before February 14, 2013Fourth Quarter / Audited Annual results for the year
On or before May 30, 2013
c. Date of Book Closure: - August 25, 2012 to August 29, 2012 (both days inclusive)
d. Dividend Payment Date: - Not applicable
e. Listing on Stock Exchanges: -
Name and address of Stock Exchanges Stock CodeBombay Stock Exchange25th Floor, P.J. Towers,Dalal Street, Mumbai – 400001
533155
National Stock ExchangeExchange Plaza, Bandra Kurla Complex,Bandra (E), Mumbai – 400051
JUBLFOOD
The Company has paid the listing fees to the Stock Exchanges where the shares of Company are listed.
f. ISIN Number:- INE797F01012
g. Market Price Data & Share Price performance: -
Monthly High, Low during each month, in last financial year, is as below:
Month BSE NSEHigh (`) Low (`) High (`) Low (`)
April 2011 746.00 543.00 750.00 542.05
May 2011 856.25 663.00 857.00 662.30
June 2011 959.90 767.20 961.00 768.50
July 2011 959.30 786.00 965.90 806.00
August 2011 972.40 711.00 972.80 711.00
September 2011 1,021.80 777.75 1,021.90 776.60
October 2011 919.00 633.15 919.00 633.95
November 2011 862.00 717.50 861.90 696.50
December 2011 858.55 698.00 858.70 696.40
January 2012 945.00 732.00 949.45 731.10
February 2012 1,059.00 910.15 1,059.90 913.40
March 2012 1,189.00 915.00 1,197.85 928.85
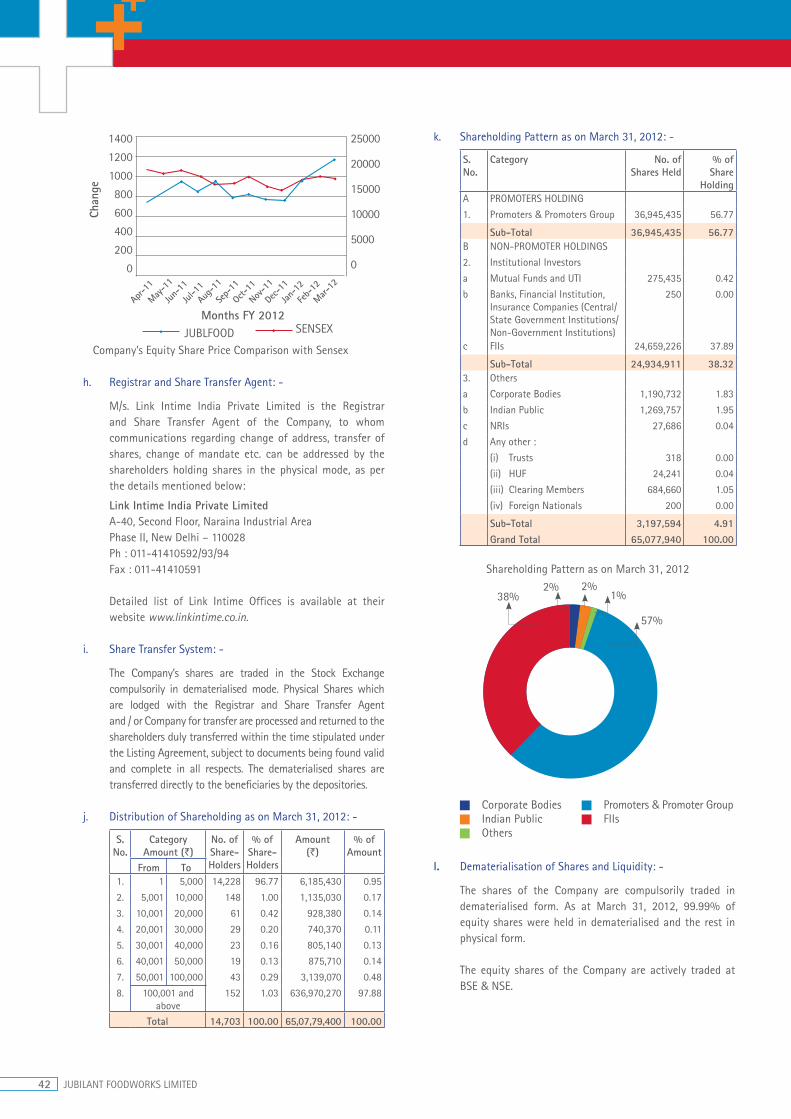
42 JUBILANT FOODWORKS LIMITED
Chan
ge
Months FY 2012Ap
r-11
May-1
1
Jun-
11
Jul-1
1Au
g-11
Sep-
11
Oct-11
Nov-1
1
Dec-
11
Jan-1
2
Feb-
12
Mar-12
1400
1200
1000
800
600
400
200
0
25000
20000
15000
10000
5000
0
JUBLFOOD SENSEX
Company’s Equity Share Price Comparison with Sensex
h. Registrar and Share Transfer Agent: -
M/s. Link Intime India Private Limited is the Registrar and Share Transfer Agent of the Company, to whom communications regarding change of address, transfer of shares, change of mandate etc. can be addressed by the shareholders holding shares in the physical mode, as per the details mentioned below:
Link Intime India Private LimitedA-40, Second Floor, Naraina Industrial AreaPhase II, New Delhi – 110028Ph : 011-41410592/93/94Fax : 011-41410591
Detailed list of Link Intime Offices is available at their website www.linkintime.co.in.
i. Share Transfer System: -
The Company’s shares are traded in the Stock Exchange compulsorily in dematerialised mode. Physical Shares which are lodged with the Registrar and Share Transfer Agent and / or Company for transfer are processed and returned to the shareholders duly transferred within the time stipulated under the Listing Agreement, subject to documents being found valid and complete in all respects. The dematerialised shares are transferred directly to the beneficiaries by the depositories.
j. Distribution of Shareholding as on March 31, 2012: -
S. No.
CategoryAmount (`)
No. of Share-Holders
% ofShare-Holders
Amount(`)
% of Amount
From To1. 1 5,000 14,228 96.77 6,185,430 0.95
2. 5,001 10,000 148 1.00 1,135,030 0.17
3. 10,001 20,000 61 0.42 928,380 0.14
4. 20,001 30,000 29 0.20 740,370 0.11
5. 30,001 40,000 23 0.16 805,140 0.13
6. 40,001 50,000 19 0.13 875,710 0.14
7. 50,001 100,000 43 0.29 3,139,070 0.48
8. 100,001 and above
152 1.03 636,970,270 97.88
Total 14,703 100.00 65,07,79,400 100.00
k. Shareholding Pattern as on March 31, 2012: -
S. No.
Category No. of Shares Held
% of Share
HoldingA PROMOTERS HOLDING
1. Promoters & Promoters Group 36,945,435 56.77
Sub-Total 36,945,435 56.77B NON-PROMOTER HOLDINGS
2. Institutional Investors
a Mutual Funds and UTI 275,435 0.42
b Banks, Financial Institution, Insurance Companies (Central/ State Government Institutions/ Non-Government Institutions)
250 0.00
c FIIs 24,659,226 37.89
Sub-Total 24,934,911 38.323. Others
a Corporate Bodies 1,190,732 1.83
b Indian Public 1,269,757 1.95
c NRIs 27,686 0.04
d Any other :
(i) Trusts 318 0.00
(ii) HUF 24,241 0.04
(iii) Clearing Members 684,660 1.05
(iv) Foreign Nationals 200 0.00
Sub-Total 3,197,594 4.91Grand Total 65,077,940 100.00
Shareholding Pattern as on March 31, 2012
38%2% 2%
1%
57%
Corporate Bodies Promoters & Promoter GroupIndian Public FIIsOthers
l. Dematerialisation of Shares and Liquidity: -
The shares of the Company are compulsorily traded in dematerialised form. As at March 31, 2012, 99.99% of equity shares were held in dematerialised and the rest in physical form.
The equity shares of the Company are actively traded at BSE & NSE.

ANNUAL REPORT 2011-12 43
m. Outstanding GDRs/ ADRs/ Warrants or any Convertible instruments, conversion date and likely impact on equity:-
As on March 31, 2012, a total of 7,46,667 options were outstanding under the Employees Stock Option Plan 2007 and 2,30,100 options under JFL Employees Stock Option Scheme 2011. Each option is convertible into one equity share of `10/- each. The Company had not issued any GDRs/ADRs/Warrants etc.
n. Plant Locations: -
The Company has 465 Domino’s Pizza stores as on March 31, 2012 pan India, 4 Domino’s Pizza Commissaries, one each located in North, West, South and East regions of India.
Further, the Company has one Central Kitchen, Dunkin’ Donuts in North region of India and two Dunkin’ Donuts Restaurants as on May 10, 2012.
IX. CODE OF CONDUCT
The Board of Directors has laid down a Code of Conduct, which is applicable to all Board Members and Senior Management Personnel of the Company. The Code has also been posted on the website of the Company.
All Board Members and Senior Management Personnel have affirmed compliance with the Code of Conduct.
The declaration signed by the CEO affirming compliance to the Code by the Board members and the Senior Management Personnel has been placed as Annexure – I at the end of Report.
X. CEO/CFO CERTIFICATION
In compliance with Clause 49(V) of the Listing Agreement, a declaration by CEO and CFO was placed before the Board, certifying the accuracy of Financial Statements and the adequacy of internal controls pertaining to Financial Reporting.

44 JUBILANT FOODWORKS LIMITED
ANNEXURE I
DECLARATION ON CODE OF CONDUCT
It is hereby declared that all the Board members and the Senior Management Personnel of the Company have affirmed compliance with the Code of Conduct for the year ended March 31, 2012.
sd/-(Ajay Kaul)CEO cum Whole Time Director
Date: May 10, 2012Place: Noida
COMPLIANCE CERTIFICATE ON CONDITIONS OF CORPORATE GOVERNANCE
Jubilant FoodWorks LimitedB-214, Phase II, Dist. Gautam Budh NagarNoida – 201 305, (Uttar Pradesh)
We have examined all relevant records of Jubilant FoodWorks Limited (the Company) for the purpose of certifying of the conditions of the Corporate Governance under Clause 49 of the Listing Agreement with Stock Exchanges for the financial year ended 31st March, 2012. We have obtained all the information and explanations which to the best of our knowledge and belief were necessary for the purposes of certification.
The compliance of the conditions of Corporate Governance is the responsibility of the management. Our examination was limited to the procedures and implementation thereof. This certificate is neither an assurance as to the future viability of the Company nor of the efficacy or effectiveness with which the management has conducted the affairs of the Company.
On the basis of our examination of the records produced, explanations and information furnished, we certify that the Company has complied with the conditions of Clause 49 of the Listing Agreement.
For Chandrasekaran Associates
Company Secretaries
sd/-Dr. S. ChandrasekaranSenior Partner(Membership No. FCS 1644, CP 715)
Place: DelhiDate: May 10, 2012

ANNUAL REPORT 2011-12 45
To The Members of Jubilant FoodWorks Limited
1. We have audited the attached Balance Sheet of Jubilant FoodWorks Limited (‘the Company’) as at March 31, 2012 and also the Statement of Profit and Loss and the Cash Flow Statement for the year ended on that date annexed thereto. These financial statements are the responsibility of the Company’s management. Our responsibility is to express an opinion on these financial statements based on our audit.
2. We conducted our audit in accordance with auditing standards generally accepted in India. Those Standards require that we plan and perform the audit to obtain reasonable assurance about whether the financial statements are free of material misstatement. An audit includes examining, on a test basis, evidence supporting the amounts and disclosures in the financial statements. An audit also includes assessing the accounting principles used and significant estimates made by management, as well as evaluating the overall financial statement presentation. We believe that our audit provides a reasonable basis for our opinion.
3. As required by the Companies (Auditor’s Report) Order, 2003 (as amended) issued by the Central Government of India in terms of sub-section (4A) of Section 227 of the Companies Act, 1956, we enclose in the Annexure a statement on the matters specified in paragraphs 4 and 5 of the said Order.
4. Further to our comments in the Annexure referred to above, we report that:
i. We have obtained all the information and explanations, which to the best of our knowledge and belief were necessary for the purposes of our audit;
ii. In our opinion, proper books of account as required by law have been kept, by the Company so far as appears from our examination of those books;
iii. The balance sheet, statement of profit and loss and cash flow statement dealt with by this report are in agreement with the books of account;
iv. In our opinion, the balance sheet, statement of profit and loss and cash flow statement dealt with by this report comply with the accounting standards referred to in sub-section (3C) of Section 211 of the Companies Act, 1956;
v. On the basis of the written representations received from the directors, as on March 31, 2012, and taken on record by the Board of Directors, we report that none of the directors is disqualified as on March 31, 2012 from being appointed as a director in terms of clause (g) of sub-section (1) of Section 274 of the Companies Act, 1956;
vi. In our opinion and to the best of our information and according to the explanations given to us, the said accounts give the information required by the Companies Act, 1956, in the manner so required and give a true and fair view in conformity with the accounting principles generally accepted in India;
a) in the case of the balance sheet, of the state of affairs of the Company as at March 31, 2012;
b) in the case of the statement of profit and loss, of the profit for the year ended on that date; and
c) in the case of cash flow statement, of the cash flows for the year ended on that date.
For S. R. Batliboi & Co.Firm registration number: 301003EChartered Accountants
sd/-per Rajiv GoyalPartnerMembership No.: 94549
Place : GurgaonDate : May 10, 2012
ANNEXURE REFERRED TO IN PARAGRAPH 3 OF OUR REPORT OF EVEN DATERe: Jubilant FoodWorks Limited
i. a) The Company has maintained proper records showing full particulars, including quantitative details and situation of fixed assets.
b) Fixed assets have been physically verified by the management during the year and no material discrepancies were identified on such verification.
c) There was no substantial disposal of fixed assets during the year.
Auditors’ Report
Standalone Financial Statements
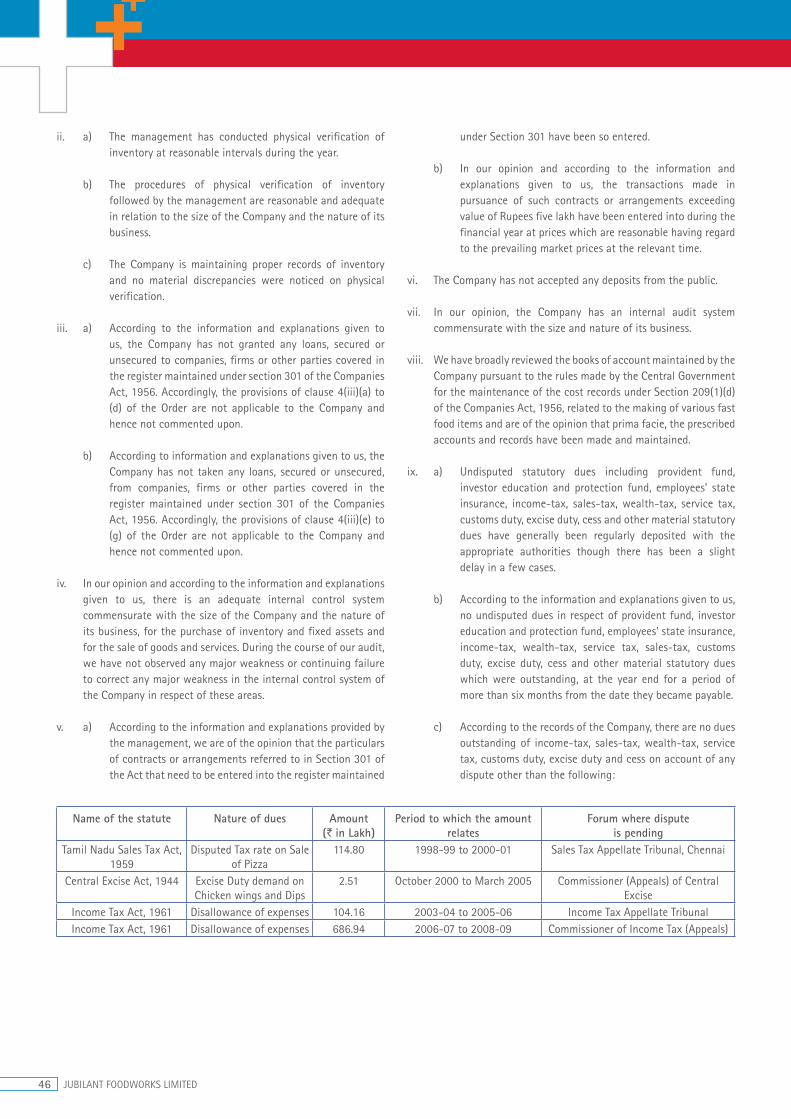
46 JUBILANT FOODWORKS LIMITED
ii. a) The management has conducted physical verification of inventory at reasonable intervals during the year.
b) The procedures of physical verification of inventory followed by the management are reasonable and adequate in relation to the size of the Company and the nature of its business.
c) The Company is maintaining proper records of inventory and no material discrepancies were noticed on physical verification.
iii. a) According to the information and explanations given to us, the Company has not granted any loans, secured or unsecured to companies, firms or other parties covered in the register maintained under section 301 of the Companies Act, 1956. Accordingly, the provisions of clause 4(iii)(a) to (d) of the Order are not applicable to the Company and hence not commented upon.
b) According to information and explanations given to us, the Company has not taken any loans, secured or unsecured, from companies, firms or other parties covered in the register maintained under section 301 of the Companies Act, 1956. Accordingly, the provisions of clause 4(iii)(e) to (g) of the Order are not applicable to the Company and hence not commented upon.
iv. In our opinion and according to the information and explanations given to us, there is an adequate internal control system commensurate with the size of the Company and the nature of its business, for the purchase of inventory and fixed assets and for the sale of goods and services. During the course of our audit, we have not observed any major weakness or continuing failure to correct any major weakness in the internal control system of the Company in respect of these areas.
v. a) According to the information and explanations provided by the management, we are of the opinion that the particulars of contracts or arrangements referred to in Section 301 of the Act that need to be entered into the register maintained
under Section 301 have been so entered.
b) In our opinion and according to the information and explanations given to us, the transactions made in pursuance of such contracts or arrangements exceeding value of Rupees five lakh have been entered into during the financial year at prices which are reasonable having regard to the prevailing market prices at the relevant time.
vi. The Company has not accepted any deposits from the public.
vii. In our opinion, the Company has an internal audit system commensurate with the size and nature of its business.
viii. We have broadly reviewed the books of account maintained by the Company pursuant to the rules made by the Central Government for the maintenance of the cost records under Section 209(1)(d) of the Companies Act, 1956, related to the making of various fast food items and are of the opinion that prima facie, the prescribed accounts and records have been made and maintained.
ix. a) Undisputed statutory dues including provident fund, investor education and protection fund, employees’ state insurance, income-tax, sales-tax, wealth-tax, service tax, customs duty, excise duty, cess and other material statutory dues have generally been regularly deposited with the appropriate authorities though there has been a slight delay in a few cases.
b) According to the information and explanations given to us, no undisputed dues in respect of provident fund, investor education and protection fund, employees’ state insurance, income-tax, wealth-tax, service tax, sales-tax, customs duty, excise duty, cess and other material statutory dues which were outstanding, at the year end for a period of more than six months from the date they became payable.
c) According to the records of the Company, there are no dues outstanding of income-tax, sales-tax, wealth-tax, service tax, customs duty, excise duty and cess on account of any dispute other than the following:
Name of the statute Nature of dues Amount (` in Lakh)
Period to which the amount relates
Forum where dispute is pending
Tamil Nadu Sales Tax Act, 1959
Disputed Tax rate on Sale of Pizza
114.80 1998-99 to 2000-01 Sales Tax Appellate Tribunal, Chennai
Central Excise Act, 1944 Excise Duty demand on Chicken wings and Dips
2.51 October 2000 to March 2005 Commissioner (Appeals) of Central Excise
Income Tax Act, 1961 Disallowance of expenses 104.16 2003-04 to 2005-06 Income Tax Appellate TribunalIncome Tax Act, 1961 Disallowance of expenses 686.94 2006-07 to 2008-09 Commissioner of Income Tax (Appeals)

ANNUAL REPORT 2011-12 47
x. The Company has no accumulated losses at the end of the financial year and it has not incurred cash losses in the current and immediately preceding financial year.
xi. Based on our audit procedures and as per the information and explanations given by the management, we are of the opinion that the Company has not defaulted in repayment of dues to a financial institution, bank or debenture holders.
xii. According to the information and explanations given to us and based on the documents and records produced to us, the Company has not granted loans and advances on the basis of security by way of pledge of shares, debentures and other securities.
xiii. In our opinion, the Company is not a chit fund or a nidhi / mutual benefit fund / society. Therefore, the provisions of clause 4(xiii) of the Companies (Auditor’s Report) Order, 2003 (as amended) are not applicable to the Company.
xiv. In our opinion, the Company is not dealing in or trading in shares, securities, debentures and other investments. Accordingly, the provisions of clause 4(xiv) of the Companies (Auditor’s Report) Order, 2003 (as amended) are not applicable to the Company.
xv. According to the information and explanations given to us, the Company has not given any guarantee for loans taken by others from bank or financial institutions.
xvi. The Company did not have any term loans outstanding during the year.
xvii. According to the information and explanations given to us and on an overall examination of the balance sheet of the Company, we report that no funds raised on short-term basis have been used for long-term investment.
xviii. The Company has not made any preferential allotment of shares to parties or companies covered in the register maintained under Section 301 of the Companies Act, 1956.
xix. The Company did not have any outstanding debentures during the year.
xx. The Company has not raised any money by way of public issue during the year.
xxi. Based upon the audit procedures performed for the purpose of reporting the true and fair view of the financial statements and as per the information and explanations given by the management, we report that no fraud on or by the Company has been noticed or reported during the year.
For S. R. Batliboi & Co.Firm registration number: 301003EChartered Accountants
sd/-per Rajiv GoyalPartnerMembership No.: 94549
Place : GurgaonDate : May 10, 2012
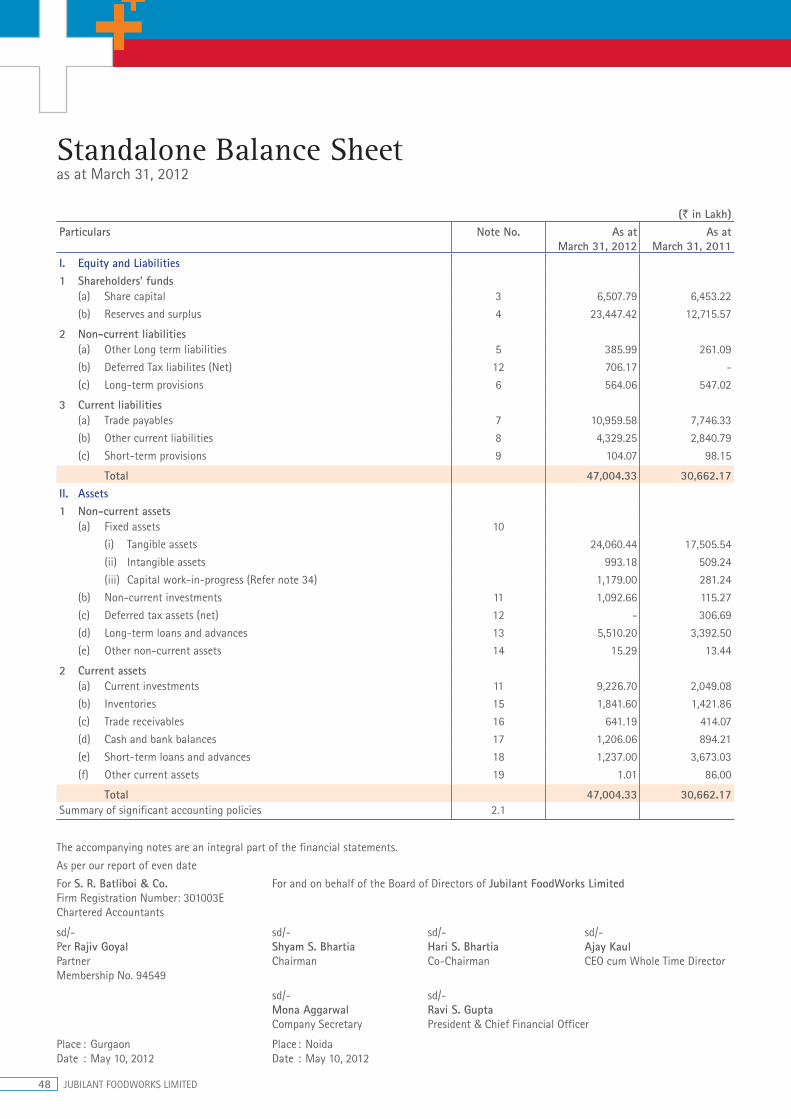
48 JUBILANT FOODWORKS LIMITED
Standalone Balance Sheet as at March 31, 2012
The accompanying notes are an integral part of the financial statements.
As per our report of even date
For S. R. Batliboi & Co. For and on behalf of the Board of Directors of Jubilant FoodWorks LimitedFirm Registration Number: 301003EChartered Accountants
sd/- sd/- sd/- sd/-Per Rajiv Goyal Shyam S. Bhartia Hari S. Bhartia Ajay KaulPartner Chairman Co-Chairman CEO cum Whole Time DirectorMembership No. 94549
sd/- sd/- Mona Aggarwal Ravi S. Gupta Company Secretary President & Chief Financial Officer
Place : Gurgaon Place : NoidaDate : May 10, 2012 Date : May 10, 2012
(` in Lakh)Particulars Note No. As at
March 31, 2012As at
March 31, 2011I. Equity and Liabilities1 Shareholders’ funds (a) Share capital 3 6,507.79 6,453.22
(b) Reserves and surplus 4 23,447.42 12,715.57
2 Non-current liabilities (a) Other Long term liabilities 5 385.99 261.09
(b) Deferred Tax liabilites (Net) 12 706.17 -
(c) Long-term provisions 6 564.06 547.02
3 Current liabilities (a) Trade payables 7 10,959.58 7,746.33
(b) Other current liabilities 8 4,329.25 2,840.79
(c) Short-term provisions 9 104.07 98.15
Total 47,004.33 30,662.17II. Assets1 Non-current assets (a) Fixed assets 10
(i) Tangible assets 24,060.44 17,505.54
(ii) Intangible assets 993.18 509.24
(iii) Capital work-in-progress (Refer note 34) 1,179.00 281.24
(b) Non-current investments 11 1,092.66 115.27
(c) Deferred tax assets (net) 12 - 306.69
(d) Long-term loans and advances 13 5,510.20 3,392.50
(e) Other non-current assets 14 15.29 13.44
2 Current assets (a) Current investments 11 9,226.70 2,049.08
(b) Inventories 15 1,841.60 1,421.86
(c) Trade receivables 16 641.19 414.07
(d) Cash and bank balances 17 1,206.06 894.21
(e) Short-term loans and advances 18 1,237.00 3,673.03
(f) Other current assets 19 1.01 86.00
Total 47,004.33 30,662.17Summary of significant accounting policies 2.1

ANNUAL REPORT 2011-12 49
The accompanying notes are an integral part of the financial statements.
As per our report of even date
For S. R. Batliboi & Co. For and on behalf of the Board of Directors of Jubilant FoodWorks LimitedFirm Registration Number: 301003EChartered Accountants
sd/- sd/- sd/- sd/-Per Rajiv Goyal Shyam S. Bhartia Hari S. Bhartia Ajay KaulPartner Chairman Co-Chairman CEO cum Whole Time DirectorMembership No. 94549
sd/- sd/- Mona Aggarwal Ravi S. Gupta Company Secretary President & Chief Financial Officer
Place : Gurgaon Place : NoidaDate : May 10, 2012 Date : May 10, 2012
Standalone Statement of Profit & Loss for the year ended March 31, 2012
(` in Lakh)Particulars Note No. Year Ended
March 31, 2012Year Ended
March 31, 2011I Income Revenue from operations (Net) 20 101,735.55 67,827.73
II Other Income 21 592.06 199.34
Total Revenue 102,327.61 68,027.07III Expenses Cost of materials consumed 22 21,505.57 14,453.17
Purchase of traded goods 23 4,784.57 2,630.03
(Increase)/Decrease in inventories of
work-in-progress and traded goods 23 (178.32) (25.26)
Employee benefit expenses 24 19,622.09 13,553.40
Depreciation and amortisation expense (Refer note 38) 10 3,757.24 2,933.88
Finance costs 26 - 34.21
Other expenses 25 36,965.14 25,204.77
Total Expenses 86,456.29 58,784.20IV Profit before exceptional items and Tax 15,871.32 9,242.87V Exceptional Items (Refer note 38) 405.26 -VI Profit before tax 15,466.06 9,242.87VII Tax expense Current tax 3,965.70 2,349.49
Income Tax for earlier years (76.82) -
Deferred tax charge / (credit) 1,012.87 (306.69)
Total Tax Expense 4,901.75 2,042.80VIII Profit for the year 10,564.31 7,200.07IX Earnings per share (in `) 27
Basic 16.31 11.20
Diluted 16.12 11.01
Nominal Value per share 10.00 10.00
Summary of significant accounting policies 2.1
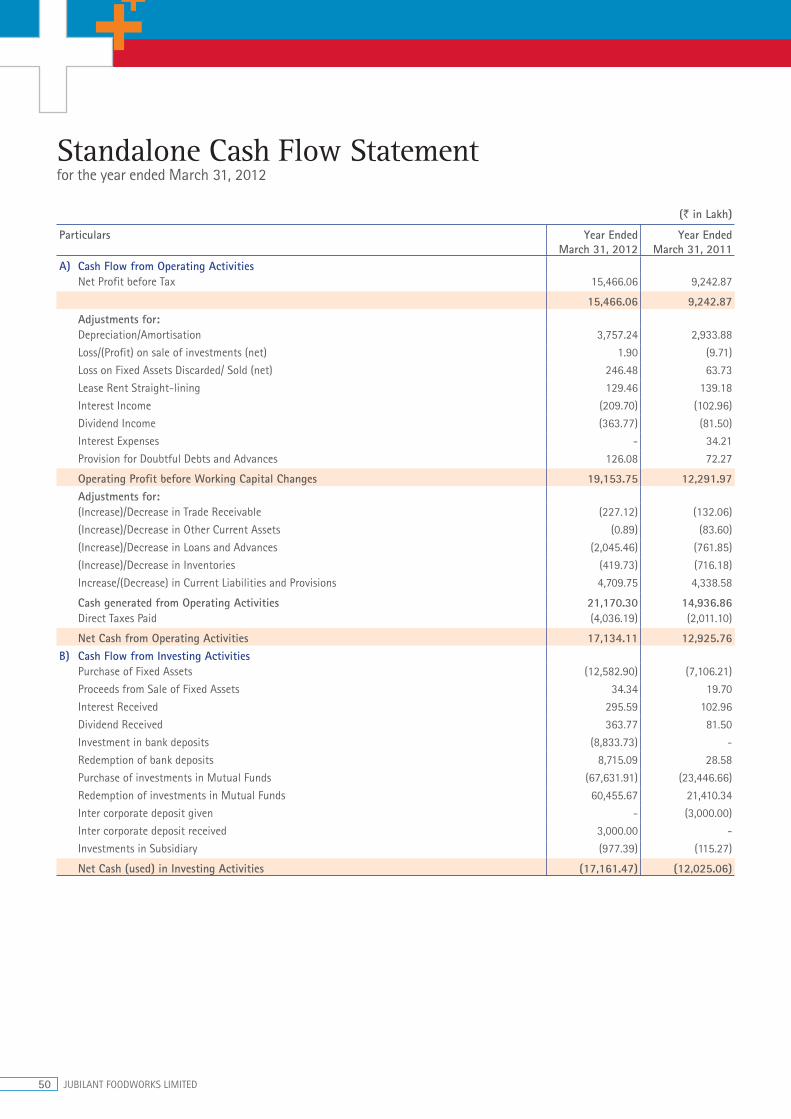
50 JUBILANT FOODWORKS LIMITED
Standalone Cash Flow Statementfor the year ended March 31, 2012
(` in Lakh)
Particulars Year EndedMarch 31, 2012
Year EndedMarch 31, 2011
A) Cash Flow from Operating ActivitiesNet Profit before Tax 15,466.06 9,242.87
15,466.06 9,242.87Adjustments for:Depreciation/Amortisation 3,757.24 2,933.88
Loss/(Profit) on sale of investments (net) 1.90 (9.71)
Loss on Fixed Assets Discarded/ Sold (net) 246.48 63.73
Lease Rent Straight-lining 129.46 139.18
Interest Income (209.70) (102.96)
Dividend Income (363.77) (81.50)
Interest Expenses - 34.21
Provision for Doubtful Debts and Advances 126.08 72.27
Operating Profit before Working Capital Changes 19,153.75 12,291.97Adjustments for:(Increase)/Decrease in Trade Receivable (227.12) (132.06)
(Increase)/Decrease in Other Current Assets (0.89) (83.60)
(Increase)/Decrease in Loans and Advances (2,045.46) (761.85)
(Increase)/Decrease in Inventories (419.73) (716.18)
Increase/(Decrease) in Current Liabilities and Provisions 4,709.75 4,338.58
Cash generated from Operating Activities 21,170.30 14,936.86Direct Taxes Paid (4,036.19) (2,011.10)
Net Cash from Operating Activities 17,134.11 12,925.76B) Cash Flow from Investing Activities
Purchase of Fixed Assets (12,582.90) (7,106.21)
Proceeds from Sale of Fixed Assets 34.34 19.70
Interest Received 295.59 102.96
Dividend Received 363.77 81.50
Investment in bank deposits (8,833.73) -
Redemption of bank deposits 8,715.09 28.58
Purchase of investments in Mutual Funds (67,631.91) (23,446.66)
Redemption of investments in Mutual Funds 60,455.67 21,410.34
Inter corporate deposit given - (3,000.00)
Inter corporate deposit received 3,000.00 -
Investments in Subsidiary (977.39) (115.27)
Net Cash (used) in Investing Activities (17,161.47) (12,025.06)

ANNUAL REPORT 2011-12 51
Standalone Cash Flow Statement for the year ended March 31, 2012 (Contd.)
(` in Lakh)
Particulars Year EndedMarch 31, 2012
Year EndedMarch 31, 2011
C) Cash Flow from Financing ActivitiesProceeds from Issue of Share Capital (including Share Premium) 222.13 224.85
Repayment of Long Term Borrowings - (859.05)
Interest Paid - (34.21)
Net Cash from/(used in) Financing Activities 222.13 (668.41)Net Increase/(Decrease) in Cash and Cash Equivalents (A+B+C) 194.77 232.29Cash and Cash Equivalents as at beginning of the Year 883.34 651.05Cash and Cash Equivalents as at end of the Year 1,078.11 883.34Components of Cash and Cash Equivalents:Cash in Hand 594.82 502.93
Cheques in Hand 32.44 27.67
Balances with Scheduled Banks in
- Current Accounts* 450.85 352.74
- Fixed Deposit Accounts 15.29 24.31
Less - Fixed deposits not considered as cash equivalents (15.29) (24.31)
Cash & Cash Equivalents in Cash Flow Statement 1,078.11 883.34
* Includes `0.29 lakh (Previous year `0.29 lakh) for IPO Refund Account and is restrictive in nature.
Notes :1. Previous year/Period figures have been regrouped, where necessary to conform to current year’s classification.2. The above Cash Flow has been prepared under the ‘Indirect Method’ as set out in the Accounting Standard-3 on Cash Flow Statements,
issued by the Institute of Chartered Accountants of India.
As per our report of even date
For S. R. Batliboi & Co. For and on behalf of the Board of Directors of Jubilant FoodWorks LimitedFirm Registration Number: 301003EChartered Accountants
sd/- sd/- sd/- sd/-Per Rajiv Goyal Shyam S. Bhartia Hari S. Bhartia Ajay KaulPartner Chairman Co-Chairman CEO cum Whole Time DirectorMembership No. 94549
sd/- sd/- Mona Aggarwal Ravi S. Gupta Company Secretary President & Chief Financial Officer
Place : Gurgaon Place : NoidaDate : May 10, 2012 Date : May 10, 2012
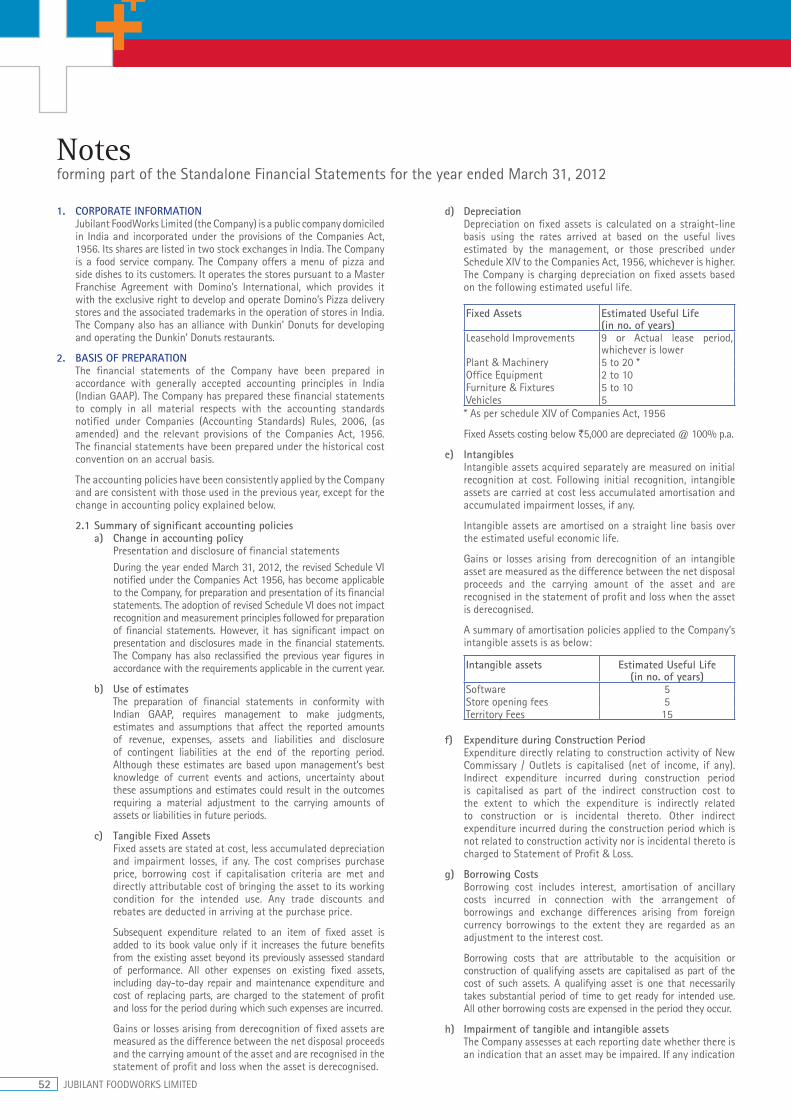
52 JUBILANT FOODWORKS LIMITED
1. CORPORATE INFORMATIONJubilant FoodWorks Limited (the Company) is a public company domiciled in India and incorporated under the provisions of the Companies Act, 1956. Its shares are listed in two stock exchanges in India. The Company is a food service company. The Company offers a menu of pizza and side dishes to its customers. It operates the stores pursuant to a Master Franchise Agreement with Domino’s International, which provides it with the exclusive right to develop and operate Domino’s Pizza delivery stores and the associated trademarks in the operation of stores in India. The Company also has an alliance with Dunkin’ Donuts for developing and operating the Dunkin’ Donuts restaurants.
2. BASIS OF PREPARATIONThe financial statements of the Company have been prepared in accordance with generally accepted accounting principles in India (Indian GAAP). The Company has prepared these financial statements to comply in all material respects with the accounting standards notified under Companies (Accounting Standards) Rules, 2006, (as amended) and the relevant provisions of the Companies Act, 1956. The financial statements have been prepared under the historical cost convention on an accrual basis.
The accounting policies have been consistently applied by the Company and are consistent with those used in the previous year, except for the change in accounting policy explained below.
2.1 Summary of significant accounting policiesa) Change in accounting policy
Presentation and disclosure of financial statementsDuring the year ended March 31, 2012, the revised Schedule VI notified under the Companies Act 1956, has become applicable to the Company, for preparation and presentation of its financial statements. The adoption of revised Schedule VI does not impact recognition and measurement principles followed for preparation of financial statements. However, it has significant impact on presentation and disclosures made in the financial statements. The Company has also reclassified the previous year figures in accordance with the requirements applicable in the current year.
b) Use of estimatesThe preparation of financial statements in conformity with Indian GAAP, requires management to make judgments, estimates and assumptions that affect the reported amounts of revenue, expenses, assets and liabilities and disclosure of contingent liabilities at the end of the reporting period. Although these estimates are based upon management’s best knowledge of current events and actions, uncertainty about these assumptions and estimates could result in the outcomes requiring a material adjustment to the carrying amounts of assets or liabilities in future periods.
c) Tangible Fixed AssetsFixed assets are stated at cost, less accumulated depreciation and impairment losses, if any. The cost comprises purchase price, borrowing cost if capitalisation criteria are met and directly attributable cost of bringing the asset to its working condition for the intended use. Any trade discounts and rebates are deducted in arriving at the purchase price.
Subsequent expenditure related to an item of fixed asset is added to its book value only if it increases the future benefits from the existing asset beyond its previously assessed standard of performance. All other expenses on existing fixed assets, including day-to-day repair and maintenance expenditure and cost of replacing parts, are charged to the statement of profit and loss for the period during which such expenses are incurred.
Gains or losses arising from derecognition of fixed assets are measured as the difference between the net disposal proceeds and the carrying amount of the asset and are recognised in the statement of profit and loss when the asset is derecognised.
d) DepreciationDepreciation on fixed assets is calculated on a straight-line basis using the rates arrived at based on the useful lives estimated by the management, or those prescribed under Schedule XIV to the Companies Act, 1956, whichever is higher. The Company is charging depreciation on fixed assets based on the following estimated useful life.
Fixed Assets Estimated Useful Life (in no. of years)
Leasehold Improvements 9 or Actual lease period, whichever is lower
Plant & Machinery 5 to 20 *Office Equipment 2 to 10Furniture & Fixtures 5 to 10Vehicles 5* As per schedule XIV of Companies Act, 1956
Fixed Assets costing below `5,000 are depreciated @ 100% p.a.
e) IntangiblesIntangible assets acquired separately are measured on initial recognition at cost. Following initial recognition, intangible assets are carried at cost less accumulated amortisation and accumulated impairment losses, if any.
Intangible assets are amortised on a straight line basis over the estimated useful economic life.
Gains or losses arising from derecognition of an intangible asset are measured as the difference between the net disposal proceeds and the carrying amount of the asset and are recognised in the statement of profit and loss when the asset is derecognised.
A summary of amortisation policies applied to the Company’s intangible assets is as below:
Intangible assets Estimated Useful Life (in no. of years)
Software 5Store opening fees 5Territory Fees 15
f) Expenditure during Construction PeriodExpenditure directly relating to construction activity of New Commissary / Outlets is capitalised (net of income, if any). Indirect expenditure incurred during construction period is capitalised as part of the indirect construction cost to the extent to which the expenditure is indirectly related to construction or is incidental thereto. Other indirect expenditure incurred during the construction period which is not related to construction activity nor is incidental thereto is charged to Statement of Profit & Loss.
g) Borrowing CostsBorrowing cost includes interest, amortisation of ancillary costs incurred in connection with the arrangement of borrowings and exchange differences arising from foreign currency borrowings to the extent they are regarded as an adjustment to the interest cost.
Borrowing costs that are attributable to the acquisition or construction of qualifying assets are capitalised as part of the cost of such assets. A qualifying asset is one that necessarily takes substantial period of time to get ready for intended use. All other borrowing costs are expensed in the period they occur.
h) Impairment of tangible and intangible assetsThe Company assesses at each reporting date whether there is an indication that an asset may be impaired. If any indication
Notes forming part of the Standalone Financial Statements for the year ended March 31, 2012
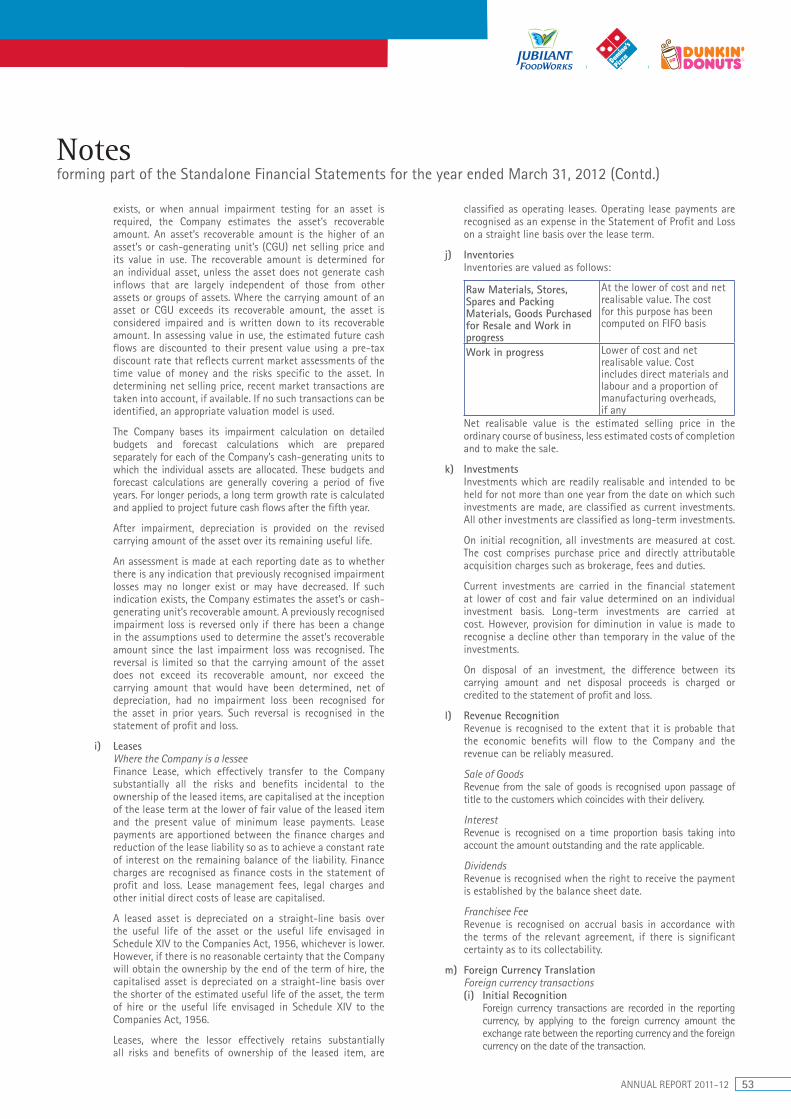
ANNUAL REPORT 2011-12 53
exists, or when annual impairment testing for an asset is required, the Company estimates the asset’s recoverable amount. An asset’s recoverable amount is the higher of an asset’s or cash-generating unit’s (CGU) net selling price and its value in use. The recoverable amount is determined for an individual asset, unless the asset does not generate cash inflows that are largely independent of those from other assets or groups of assets. Where the carrying amount of an asset or CGU exceeds its recoverable amount, the asset is considered impaired and is written down to its recoverable amount. In assessing value in use, the estimated future cash flows are discounted to their present value using a pre-tax discount rate that reflects current market assessments of the time value of money and the risks specific to the asset. In determining net selling price, recent market transactions are taken into account, if available. If no such transactions can be identified, an appropriate valuation model is used.
The Company bases its impairment calculation on detailed budgets and forecast calculations which are prepared separately for each of the Company’s cash-generating units to which the individual assets are allocated. These budgets and forecast calculations are generally covering a period of five years. For longer periods, a long term growth rate is calculated and applied to project future cash flows after the fifth year.
After impairment, depreciation is provided on the revised carrying amount of the asset over its remaining useful life.
An assessment is made at each reporting date as to whether there is any indication that previously recognised impairment losses may no longer exist or may have decreased. If such indication exists, the Company estimates the asset’s or cash-generating unit’s recoverable amount. A previously recognised impairment loss is reversed only if there has been a change in the assumptions used to determine the asset’s recoverable amount since the last impairment loss was recognised. The reversal is limited so that the carrying amount of the asset does not exceed its recoverable amount, nor exceed the carrying amount that would have been determined, net of depreciation, had no impairment loss been recognised for the asset in prior years. Such reversal is recognised in the statement of profit and loss.
i) LeasesWhere the Company is a lesseeFinance Lease, which effectively transfer to the Company substantially all the risks and benefits incidental to the ownership of the leased items, are capitalised at the inception of the lease term at the lower of fair value of the leased item and the present value of minimum lease payments. Lease payments are apportioned between the finance charges and reduction of the lease liability so as to achieve a constant rate of interest on the remaining balance of the liability. Finance charges are recognised as finance costs in the statement of profit and loss. Lease management fees, legal charges and other initial direct costs of lease are capitalised.
A leased asset is depreciated on a straight-line basis over the useful life of the asset or the useful life envisaged in Schedule XIV to the Companies Act, 1956, whichever is lower. However, if there is no reasonable certainty that the Company will obtain the ownership by the end of the term of hire, the capitalised asset is depreciated on a straight-line basis over the shorter of the estimated useful life of the asset, the term of hire or the useful life envisaged in Schedule XIV to the Companies Act, 1956.
Leases, where the lessor effectively retains substantially all risks and benefits of ownership of the leased item, are
Notes forming part of the Standalone Financial Statements for the year ended March 31, 2012 (Contd.)
classified as operating leases. Operating lease payments are recognised as an expense in the Statement of Profit and Loss on a straight line basis over the lease term.
j) InventoriesInventories are valued as follows:
Raw Materials, Stores, Spares and Packing Materials, Goods Purchased for Resale and Work in progress
At the lower of cost and net realisable value. The cost for this purpose has been computed on FIFO basis
Work in progress Lower of cost and net realisable value. Cost includes direct materials and labour and a proportion of manufacturing overheads, if any
Net realisable value is the estimated selling price in the ordinary course of business, less estimated costs of completion and to make the sale.
k) InvestmentsInvestments which are readily realisable and intended to be held for not more than one year from the date on which such investments are made, are classified as current investments. All other investments are classified as long-term investments.
On initial recognition, all investments are measured at cost. The cost comprises purchase price and directly attributable acquisition charges such as brokerage, fees and duties.
Current investments are carried in the financial statement at lower of cost and fair value determined on an individual investment basis. Long-term investments are carried at cost. However, provision for diminution in value is made to recognise a decline other than temporary in the value of the investments.
On disposal of an investment, the difference between its carrying amount and net disposal proceeds is charged or credited to the statement of profit and loss.
l) Revenue RecognitionRevenue is recognised to the extent that it is probable that the economic benefits will flow to the Company and the revenue can be reliably measured.
Sale of GoodsRevenue from the sale of goods is recognised upon passage of title to the customers which coincides with their delivery.
InterestRevenue is recognised on a time proportion basis taking into account the amount outstanding and the rate applicable.
DividendsRevenue is recognised when the right to receive the payment is established by the balance sheet date.
Franchisee FeeRevenue is recognised on accrual basis in accordance with the terms of the relevant agreement, if there is significant certainty as to its collectability.
m) Foreign Currency TranslationForeign currency transactions(i) Initial Recognition
Foreign currency transactions are recorded in the reporting currency, by applying to the foreign currency amount the exchange rate between the reporting currency and the foreign currency on the date of the transaction.

54 JUBILANT FOODWORKS LIMITED
Notes forming part of the Standalone Financial Statements for the year ended March 31, 2012 (Contd.)
(ii) ConversionForeign currency monetary items are reported using the closing rate. Non-monetary items which are carried in terms of historical cost denominated in a foreign currency are reported using the exchange rate at the date of the transaction.
(iii) Exchange DifferencesExchange differences arising on the settlement of monetary items, or on reporting such monetary items of Company at rates different from those at which they were initially recorded during the year, or reported in previous financial statements, are recognised as income or as expenses in the year in which they arise.
n) Retirement and other employment Benefits(i) Gratuity liability is defined benefit obligation and is
provided for on the basis of an actuarial valuation on projected unit credit method made at the end of each financial year. The liability so provided is unfunded.
(ii) The Provident Fund (administered by a Trust) is a defined benefit scheme whereby the Company deposits an amount determined as a fixed percentage of basic pay to the fund every month. The benefit vests upon commencement of employment. The interest credited to the accounts of the employees is adjusted on an annual basis to confirm to the interest rate declared by the government for the Employees Provident Fund. The Guidance Note on implementing AS-15, Employee Benefits (revised 2005) states that provident funds set up by employers, which requires interest shortfall to be met by the employer, needs to be treated as defined benefit plan.
(iii) Short term compensated absences are provided for based on estimates. Long term compensated absences are provided for based on actuarial valuation carried by an actuary as at the end of the year. The actuarial valuation is done as per projected unit credit method.
(iv) Actuarial gains/losses are immediately taken to Statement of Profit and Loss and are not deferred.
o) Income TaxTax expense comprises of current & deferred tax.Current income tax is measured at the amount expected to be paid to the tax authorities in accordance with the Indian Income Tax Act, 1961. Deferred income taxes reflects the impact of current year timing differences between taxable income and accounting income for the year and reversal of timing differences of earlier years.
Deferred tax is measured based on the tax rates and the tax laws enacted or substantively enacted at the balance sheet date. Deferred tax assets are recognised only to the extent that there is reasonable certainty that sufficient future taxable income will be available against which such deferred tax assets can be realised. If the Company has carry forward of unabsorbed depreciation and tax losses, deferred tax assets are recognised only if there is virtual certainty supported by convincing evidence that such deferred tax assets can be realised against future taxable profits.
Unrecognised deferred tax assets of earlier years are reassessed and recognised to the extent that it has become reasonably certain or virtually certain, as the case may be that sufficient future taxable income will be available against which such deferred tax assets can be realised.
MAT credit is recognised as an asset only when and to the extent there is convincing evidence that the Company will pay normal income tax during the specified period. In the year
in which the Minimum Alternative Tax (MAT) credit becomes eligible to be recognised as an asset in accordance with the recommendations contained in Guidance Note issued by the Institute of Chartered Accountants of India, the said asset is created by way of a credit to the Statement of Profit and Loss and shown as MAT Credit Entitlement. The Company reviews the same at each balance sheet date and writes down the carrying amount of MAT Credit Entitlement to the extent there is no longer convincing evidence to the effect that Company will pay normal income tax during the specified period.
p) Earnings Per ShareBasic earnings per share is calculated by dividing the net profit or loss for the year attributable to equity shareholders by the weighted average number of equity shares outstanding during the year.
For the purpose of calculating diluted earning per share, the net profit or loss for the year attributable to equity shareholders and the weighted average number of shares outstanding during the year are adjusted for the effects of all dilutive potential equity shares.
q) ProvisionsA provision is recognised when an enterprise has a present obligation as a result of past event and it is probable that an outflow of resources will be required to settle the obligation, in respect of which a reliable estimate can be made. Provisions are not discounted to its present value and are determined based on best management estimate required to settle the obligation at the balance sheet date. These are reviewed at each Balance Sheet date and adjusted to reflect the current best management estimates.
r) Segment Reporting PoliciesAs the Company’s business activity primarily falls within a single business and geographical segment, thus there are no additional disclosures to be provided under Accounting Standard 17 – “Segment Reporting’. The management considers that the various goods and services provided by the Company constitutes single business segment, since the risk and rewards from these services are not different from one another. The Company’s operating businesses are organised and managed separately according to the nature of products and services provided, with each segment representing a strategic business unit that offers different products and serves different markets. The analysis of geographical segments is based on geographical location of the customers.
s) Cash Flow StatementCash flows are reported using indirect method, whereby profit before tax is adjusted for the effects transactions of a non-cash nature and any deferrals or accruals of past or future cash receipts or payments. The cash flows from regular revenue generating, financing and investing activities of the Company are segregated. Cash and cash equivalents in the cash flow comprise cash at bank, cash/cheques in hand and short-term investments with an original maturity of three months or less.
t) Employee Stock Compensation CostMeasurement and disclosure of the employee share-based payment plans is done in accordance with SEBI (Employee Stock Option Scheme and Employee Stock Purchase Scheme) Guidelines, 1999 and the Guidance Note on Accounting for Employee Share-based Payments, issued by the Institute of Chartered Accountants of India. The Company measures compensation cost relating to employee stock options using the intrinsic value method.
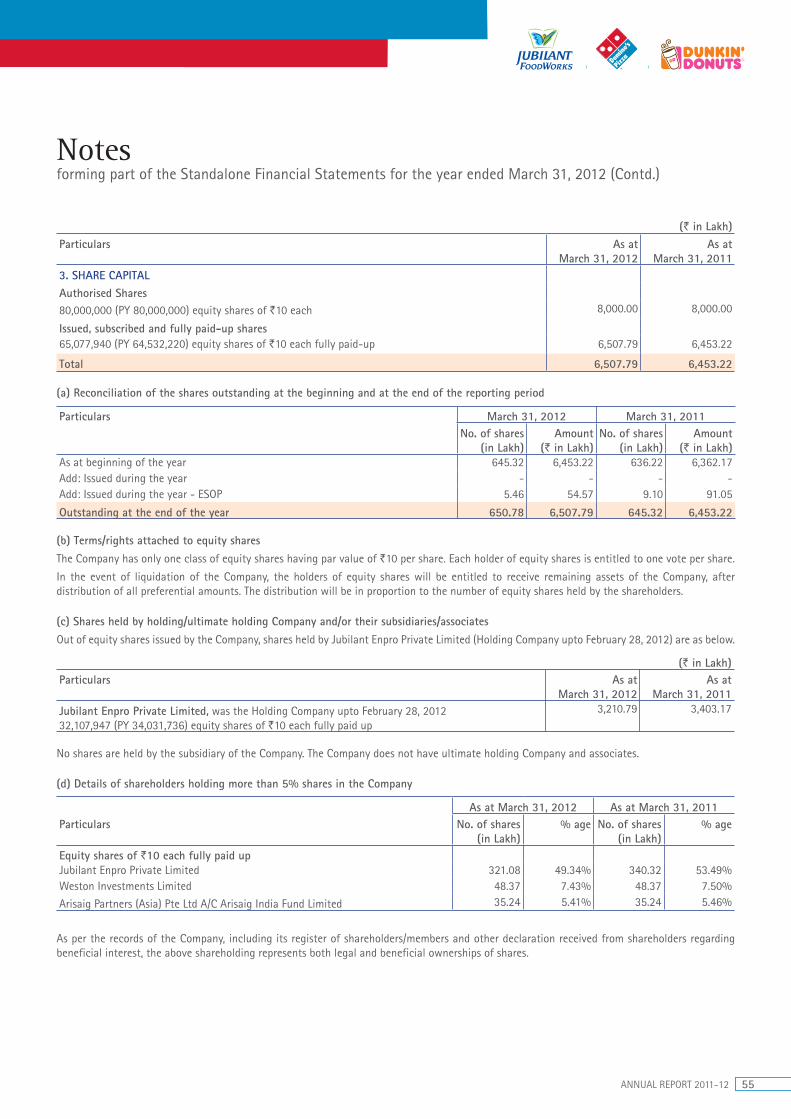
ANNUAL REPORT 2011-12 55
(` in Lakh)Particulars As at
March 31, 2012As at
March 31, 20113. SHARE CAPITALAuthorised Shares80,000,000 (PY 80,000,000) equity shares of `10 each 8,000.00 8,000.00
Issued, subscribed and fully paid-up shares65,077,940 (PY 64,532,220) equity shares of `10 each fully paid-up 6,507.79 6,453.22
Total 6,507.79 6,453.22
(a) Reconciliation of the shares outstanding at the beginning and at the end of the reporting period
Particulars March 31, 2012 March 31, 2011No. of shares
(in Lakh)Amount
(` in Lakh) No. of shares
(in Lakh) Amount
(` in Lakh) As at beginning of the year 645.32 6,453.22 636.22 6,362.17 Add: Issued during the year - - - - Add: Issued during the year - ESOP 5.46 54.57 9.10 91.05
Outstanding at the end of the year 650.78 6,507.79 645.32 6,453.22
(b) Terms/rights attached to equity sharesThe Company has only one class of equity shares having par value of `10 per share. Each holder of equity shares is entitled to one vote per share.
In the event of liquidation of the Company, the holders of equity shares will be entitled to receive remaining assets of the Company, after distribution of all preferential amounts. The distribution will be in proportion to the number of equity shares held by the shareholders.
(c) Shares held by holding/ultimate holding Company and/or their subsidiaries/associatesOut of equity shares issued by the Company, shares held by Jubilant Enpro Private Limited (Holding Company upto February 28, 2012) are as below.
(` in Lakh)Particulars As at
March 31, 2012As at
March 31, 2011Jubilant Enpro Private Limited, was the Holding Company upto February 28, 2012 32,107,947 (PY 34,031,736) equity shares of `10 each fully paid up
3,210.79 3,403.17
No shares are held by the subsidiary of the Company. The Company does not have ultimate holding Company and associates.
(d) Details of shareholders holding more than 5% shares in the Company
As at March 31, 2012 As at March 31, 2011Particulars No. of shares
(in Lakh) % age No. of shares
(in Lakh) % age
Equity shares of `10 each fully paid upJubilant Enpro Private Limited 321.08 49.34% 340.32 53.49%Weston Investments Limited 48.37 7.43% 48.37 7.50%
Arisaig Partners (Asia) Pte Ltd A/C Arisaig India Fund Limited 35.24 5.41% 35.24 5.46%
As per the records of the Company, including its register of shareholders/members and other declaration received from shareholders regarding beneficial interest, the above shareholding represents both legal and beneficial ownerships of shares.
Notes forming part of the Standalone Financial Statements for the year ended March 31, 2012 (Contd.)

56 JUBILANT FOODWORKS LIMITED
Notes forming part of the Standalone Financial Statements for the year ended March 31, 2012 (Contd.)
(` in Lakh)Particulars As at
March 31, 2012As at
March 31, 20114. RESERVES & SURPLUSSecurities Premium Reserve:Balance as per last financial statements 9,545.75 9,291.63 Add: Premium on issue of equity shares 167.55 254.12
Closing Balance (A) 9,713.30 9,545.75 Surplus/(deficit) in the statement of profit and lossBalance as per last financial statements 3,169.81 (4,030.23)
Add: Profit for the year 10,564.31 7,200.05
Net surplus in the statement of profit & loss (B) 13,734.12 3,169.82 Employee Stock Option outstanding*
Total (A+B) 23,447.42 12,715.57 * The outstanding option under the ESOP Plan 2007 at the end of year are 746,667 (PY 1,292,387) Equity Shares & outstanding option under the ESOP Scheme 2011 at the end of year are 230,100 (PY Nil) (Refer note 29)
5. OTHER LONG TERM LIABILITIESTradeCreditors 372.99 248.09
OthersSecurity Deposits 13.00 13.00
Total 385.99 261.09
6. LONG TERM PROVISIONProvision for employee benefits - Gratuity (Refer Note 32) 224.19 316.95- Leave benefits 339.87 230.06
Total 564.06 547.01
7. TRADE PAYABLECreditors for goods and services (Refer note 35 for details of dues to micro and small enterprises) 10,959.58 7,746.33
Total 10,959.58 7,746.33
8. OTHER CURRENT LIABILITIESSecurity deposits 42.54 23.74Unearned Income 56.82 60.95Book overdraft 1,307.05 990.18Investor Education and Protection Fund shall be credited by following amounts (as and when due)- Unpaid application money received for allotment of shares and due for refund 0.29 0.29
OthersCreditors for Capital goods 1,443.72 752.03Statutory dues 1,478.83 1,013.60
Total 4,329.25 2,840.79
9. SHORT TERM PROVISIONSProvision for employee benefits- Gratuity (Refer Note 32) 5.27 17.37- Leave benefits 98.80 80.78
Total 104.07 98.15

ANNUAL REPORT 2011-12 57
10. F
IXED
ASS
ETS
(` in
Lak
h)Pa
rtic
ular
s Gr
oss
Bloc
kDe
prec
iatio
n / A
mor
tisat
ion
Net
Blo
ckAs
at
01-0
4-11
Addi
tion
durin
g th
e ye
ar
Dele
tions
du
ring
the
year
As a
t 31
-03-
12As
at
01-0
4-11
For
the
year
(R
efer
not
e 38
)
Dele
tions
du
ring
the
year
As a
t 31
-03-
12As
at
31-0
3-12
As A
t 3
1-03
-11
Tang
ible
Ass
ets
Free
hold
Lan
d 3
.41
-
-
3.4
1 -
-
-
-
3
.41
3.4
1 Le
aseh
old
Impr
ovem
ents
8
,796
.35
3,4
95.4
9 1
80.3
3 1
2,11
1.51
2
,618
.68
1,1
28.9
2 1
40.7
6 3
,606
.84
8,5
04.6
7 6
,177
.67
Plan
t &
Mac
hine
ry
14,
519.
77
5,0
09.1
6 7
74.5
5 1
8,75
4.38
5
,565
.27
1,4
87.8
7 5
33.9
3 6
,519
.21
12,
235.
17
8,9
54.5
0 O
ffic
e Eq
uipm
ent
349
.25
73.
15
30.
95
391
.45
165
.06
44.
55
27.
22
182
.39
209
.06
184
.19
Furn
iture
& F
ixtu
res
1,9
41.9
9 8
73.5
0 5
1.66
2
,763
.83
996
.50
441
.98
42.
85
1,3
95.6
3 1
,368
.20
945
.49
Vehi
cles
2
,495
.45
976
.66
166
.49
3,3
05.6
2 1
,255
.17
468
.84
158
.32
1,5
65.6
9 1
,739
.93
1,2
40.2
8
Inta
ngib
le A
sset
sSt
ore
Ope
ning
Fee
s &
Ter
ritor
y Fe
es
724
.46
692
.04
-
1,4
16.5
0 3
08.8
0 1
55.7
4 -
4
64.5
4 9
51.9
6 4
15.6
6 So
ftw
are
212
.09
-
-
212
.09
118
.51
52.
36
-
170
.87
41.
22
93.
58
Tota
l 2
9,04
2.77
1
1,12
0.01
1
,203
.90
38,
958.
86
11,
027.
99
3,7
80.2
7 9
03.0
8 1
3,90
5.18
2
5,05
3.62
1
8,01
4.78
Ca
pita
l Wor
k in
Pro
gres
s (R
efer
not
e 34
) Ta
ngib
le A
sset
s 1
,179
.00
281
.24
1,1
79.0
0 2
81.2
4 To
tal
29,
042.
77
11,
120.
01
1,2
03.9
0 3
8,95
8.86
1
1,02
7.99
3
,780
.27
903
.08
13,
905.
18
26,
232.
62
18,
296.
02
Prev
ious
Yea
r 2
2,75
5.41
7
,000
.12
712
.76
29,
042.
77
8,7
23.4
4 2
,933
.88
629
.33
11,
027.
99
18,
296.
02
14,
279.
34
Notes forming part of the Standalone Financial Statements for the year ended March 31, 2012 (Contd.)
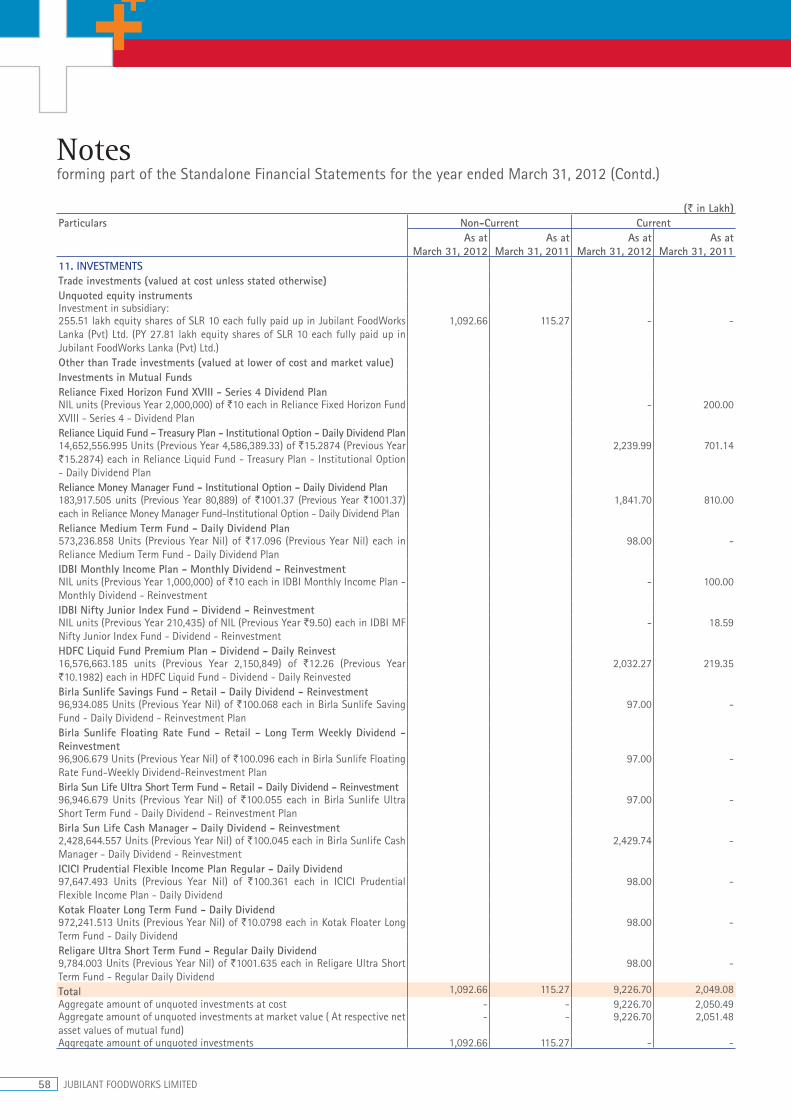
58 JUBILANT FOODWORKS LIMITED
(` in Lakh)Particulars Non-Current Current
As at March 31, 2012
As at March 31, 2011
As at March 31, 2012
As at March 31, 2011
11. INVESTMENTSTrade investments (valued at cost unless stated otherwise)Unquoted equity instrumentsInvestment in subsidiary:255.51 lakh equity shares of SLR 10 each fully paid up in Jubilant FoodWorks Lanka (Pvt) Ltd. (PY 27.81 lakh equity shares of SLR 10 each fully paid up in Jubilant FoodWorks Lanka (Pvt) Ltd.)
1,092.66 115.27 - -
Other than Trade investments (valued at lower of cost and market value)Investments in Mutual FundsReliance Fixed Horizon Fund XVIII - Series 4 Dividend PlanNIL units (Previous Year 2,000,000) of `10 each in Reliance Fixed Horizon Fund XVIII - Series 4 - Dividend Plan
- 200.00
Reliance Liquid Fund - Treasury Plan - Institutional Option - Daily Dividend Plan14,652,556.995 Units (Previous Year 4,586,389.33) of `15.2874 (Previous Year `15.2874) each in Reliance Liquid Fund - Treasury Plan - Institutional Option - Daily Dividend Plan
2,239.99 701.14
Reliance Money Manager Fund - Institutional Option - Daily Dividend Plan183,917.505 units (Previous Year 80,889) of `1001.37 (Previous Year `1001.37) each in Reliance Money Manager Fund-Institutional Option - Daily Dividend Plan
1,841.70 810.00
Reliance Medium Term Fund - Daily Dividend Plan573,236.858 Units (Previous Year Nil) of `17.096 (Previous Year Nil) each in Reliance Medium Term Fund - Daily Dividend Plan
98.00 -
IDBI Monthly Income Plan - Monthly Dividend - ReinvestmentNIL units (Previous Year 1,000,000) of `10 each in IDBI Monthly Income Plan - Monthly Dividend - Reinvestment
- 100.00
IDBI Nifty Junior Index Fund - Dividend - ReinvestmentNIL units (Previous Year 210,435) of NIL (Previous Year `9.50) each in IDBI MF Nifty Junior Index Fund - Dividend - Reinvestment
- 18.59
HDFC Liquid Fund Premium Plan - Dividend - Daily Reinvest16,576,663.185 units (Previous Year 2,150,849) of `12.26 (Previous Year `10.1982) each in HDFC Liquid Fund - Dividend - Daily Reinvested
2,032.27 219.35
Birla Sunlife Savings Fund - Retail - Daily Dividend - Reinvestment96,934.085 Units (Previous Year Nil) of `100.068 each in Birla Sunlife Saving Fund - Daily Dividend - Reinvestment Plan
97.00 -
Birla Sunlife Floating Rate Fund - Retail - Long Term Weekly Dividend - Reinvestment96,906.679 Units (Previous Year Nil) of `100.096 each in Birla Sunlife Floating Rate Fund-Weekly Dividend-Reinvestment Plan
97.00 -
Birla Sun Life Ultra Short Term Fund - Retail - Daily Dividend - Reinvestment 96,946.679 Units (Previous Year Nil) of `100.055 each in Birla Sunlife Ultra Short Term Fund - Daily Dividend - Reinvestment Plan
97.00 -
Birla Sun Life Cash Manager - Daily Dividend - Reinvestment2,428,644.557 Units (Previous Year Nil) of `100.045 each in Birla Sunlife Cash Manager - Daily Dividend - Reinvestment
2,429.74 -
ICICI Prudential Flexible Income Plan Regular - Daily Dividend 97,647.493 Units (Previous Year Nil) of `100.361 each in ICICI Prudential Flexible Income Plan - Daily Dividend
98.00 -
Kotak Floater Long Term Fund - Daily Dividend972,241.513 Units (Previous Year Nil) of `10.0798 each in Kotak Floater Long Term Fund - Daily Dividend
98.00 -
Religare Ultra Short Term Fund - Regular Daily Dividend9,784.003 Units (Previous Year Nil) of `1001.635 each in Religare Ultra Short Term Fund - Regular Daily Dividend
98.00 -
Total 1,092.66 115.27 9,226.70 2,049.08 Aggregate amount of unquoted investments at cost - - 9,226.70 2,050.49 Aggregate amount of unquoted investments at market value ( At respective net asset values of mutual fund)
- - 9,226.70 2,051.48
Aggregate amount of unquoted investments 1,092.66 115.27 - -
Notes forming part of the Standalone Financial Statements for the year ended March 31, 2012 (Contd.)
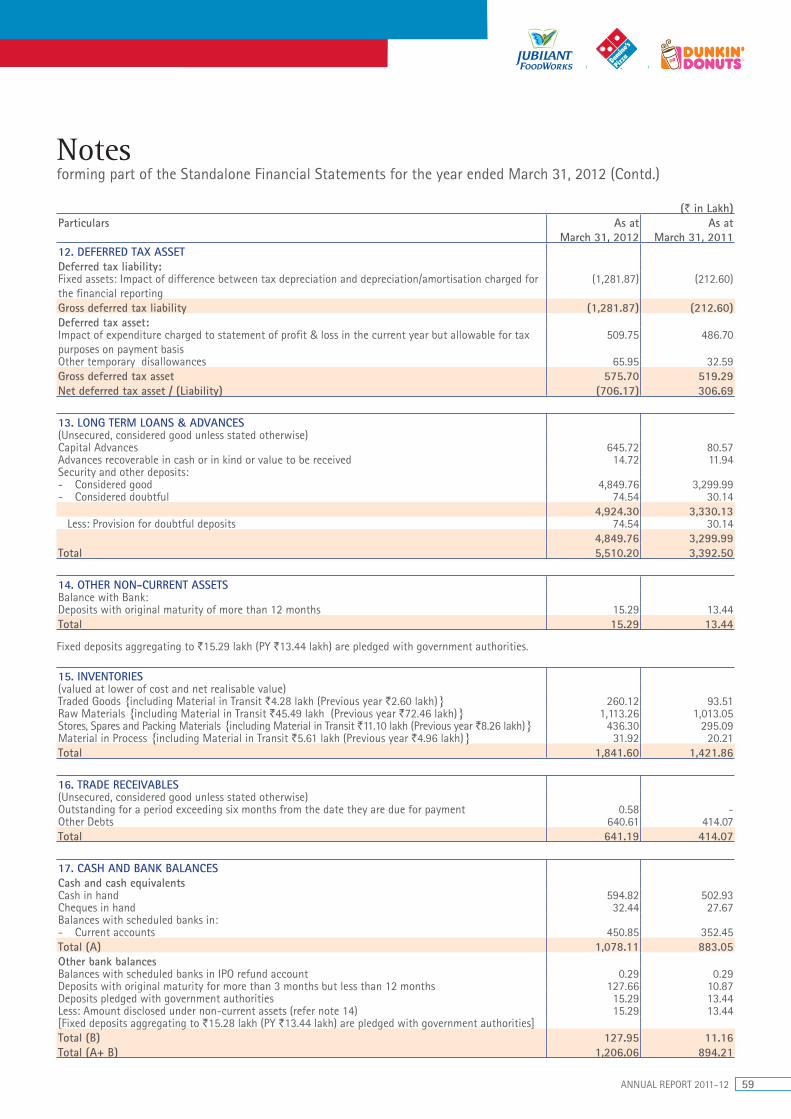
ANNUAL REPORT 2011-12 59
(` in Lakh)Particulars As at
March 31, 2012As at
March 31, 201112. DEFERRED TAX ASSETDeferred tax liability:Fixed assets: Impact of difference between tax depreciation and depreciation/amortisation charged for the financial reporting
(1,281.87) (212.60)
Gross deferred tax liability (1,281.87) (212.60) Deferred tax asset:Impact of expenditure charged to statement of profit & loss in the current year but allowable for tax purposes on payment basis
509.75 486.70
Other temporary disallowances 65.95 32.59 Gross deferred tax asset 575.70 519.29 Net deferred tax asset / (Liability) (706.17) 306.69
13. LONG TERM LOANS & ADVANCES(Unsecured, considered good unless stated otherwise)Capital Advances 645.72 80.57 Advances recoverable in cash or in kind or value to be received 14.72 11.94 Security and other deposits:- Considered good 4,849.76 3,299.99 - Considered doubtful 74.54 30.14
4,924.30 3,330.13 Less: Provision for doubtful deposits 74.54 30.14
4,849.76 3,299.99 Total 5,510.20 3,392.50
14. OTHER NON-CURRENT ASSETSBalance with Bank:Deposits with original maturity of more than 12 months 15.29 13.44 Total 15.29 13.44
Fixed deposits aggregating to `15.29 lakh (PY `13.44 lakh) are pledged with government authorities.
15. INVENTORIES(valued at lower of cost and net realisable value)Traded Goods {including Material in Transit `4.28 lakh (Previous year `2.60 lakh)} 260.12 93.51 Raw Materials {including Material in Transit `45.49 lakh (Previous year `72.46 lakh)} 1,113.26 1,013.05 Stores, Spares and Packing Materials {including Material in Transit `11.10 lakh (Previous year `8.26 lakh)} 436.30 295.09 Material in Process {including Material in Transit `5.61 lakh (Previous year `4.96 lakh)} 31.92 20.21 Total 1,841.60 1,421.86
16. TRADE RECEIVABLES(Unsecured, considered good unless stated otherwise)Outstanding for a period exceeding six months from the date they are due for payment 0.58 - Other Debts 640.61 414.07 Total 641.19 414.07
17. CASH AND BANK BALANCESCash and cash equivalentsCash in hand 594.82 502.93 Cheques in hand 32.44 27.67 Balances with scheduled banks in:- Current accounts 450.85 352.45 Total (A) 1,078.11 883.05 Other bank balancesBalances with scheduled banks in IPO refund account 0.29 0.29 Deposits with original maturity for more than 3 months but less than 12 months 127.66 10.87 Deposits pledged with government authorities 15.29 13.44 Less: Amount disclosed under non-current assets (refer note 14) 15.29 13.44[Fixed deposits aggregating to `15.28 lakh (PY `13.44 lakh) are pledged with government authorities]Total (B) 127.95 11.16Total (A+ B) 1,206.06 894.21
Notes forming part of the Standalone Financial Statements for the year ended March 31, 2012 (Contd.)
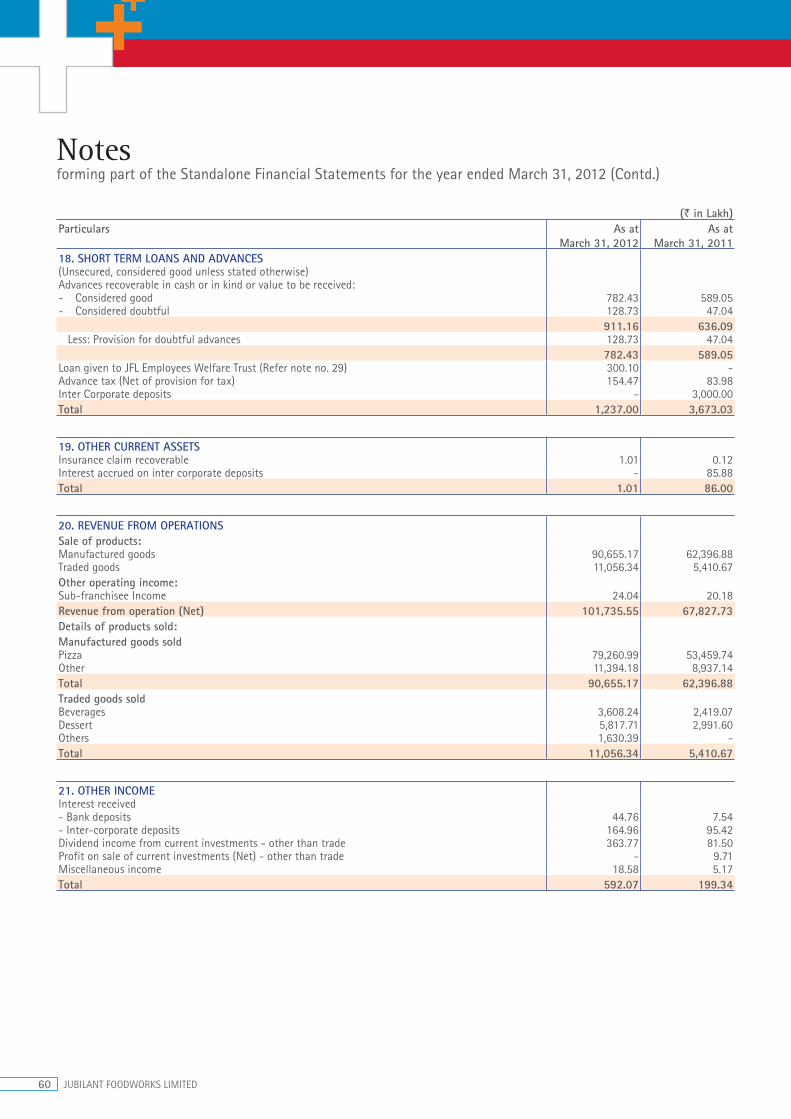
60 JUBILANT FOODWORKS LIMITED
(` in Lakh)Particulars As at
March 31, 2012As at
March 31, 201118. SHORT TERM LOANS AND ADVANCES(Unsecured, considered good unless stated otherwise)Advances recoverable in cash or in kind or value to be received:- Considered good 782.43 589.05 - Considered doubtful 128.73 47.04
911.16 636.09 Less: Provision for doubtful advances 128.73 47.04
782.43 589.05 Loan given to JFL Employees Welfare Trust (Refer note no. 29) 300.10 - Advance tax (Net of provision for tax) 154.47 83.98 Inter Corporate deposits - 3,000.00 Total 1,237.00 3,673.03
19. OTHER CURRENT ASSETSInsurance claim recoverable 1.01 0.12 Interest accrued on inter corporate deposits - 85.88 Total 1.01 86.00
20. REVENUE FROM OPERATIONSSale of products:Manufactured goods 90,655.17 62,396.88 Traded goods 11,056.34 5,410.67 Other operating income:Sub-franchisee Income 24.04 20.18 Revenue from operation (Net) 101,735.55 67,827.73 Details of products sold:Manufactured goods soldPizza 79,260.99 53,459.74 Other 11,394.18 8,937.14 Total 90,655.17 62,396.88 Traded goods soldBeverages 3,608.24 2,419.07 Dessert 5,817.71 2,991.60 Others 1,630.39 - Total 11,056.34 5,410.67
21. OTHER INCOMEInterest received- Bank deposits 44.76 7.54 - Inter-corporate deposits 164.96 95.42 Dividend income from current investments - other than trade 363.77 81.50 Profit on sale of current investments (Net) - other than trade - 9.71 Miscellaneous income 18.58 5.17 Total 592.07 199.34
Notes forming part of the Standalone Financial Statements for the year ended March 31, 2012 (Contd.)
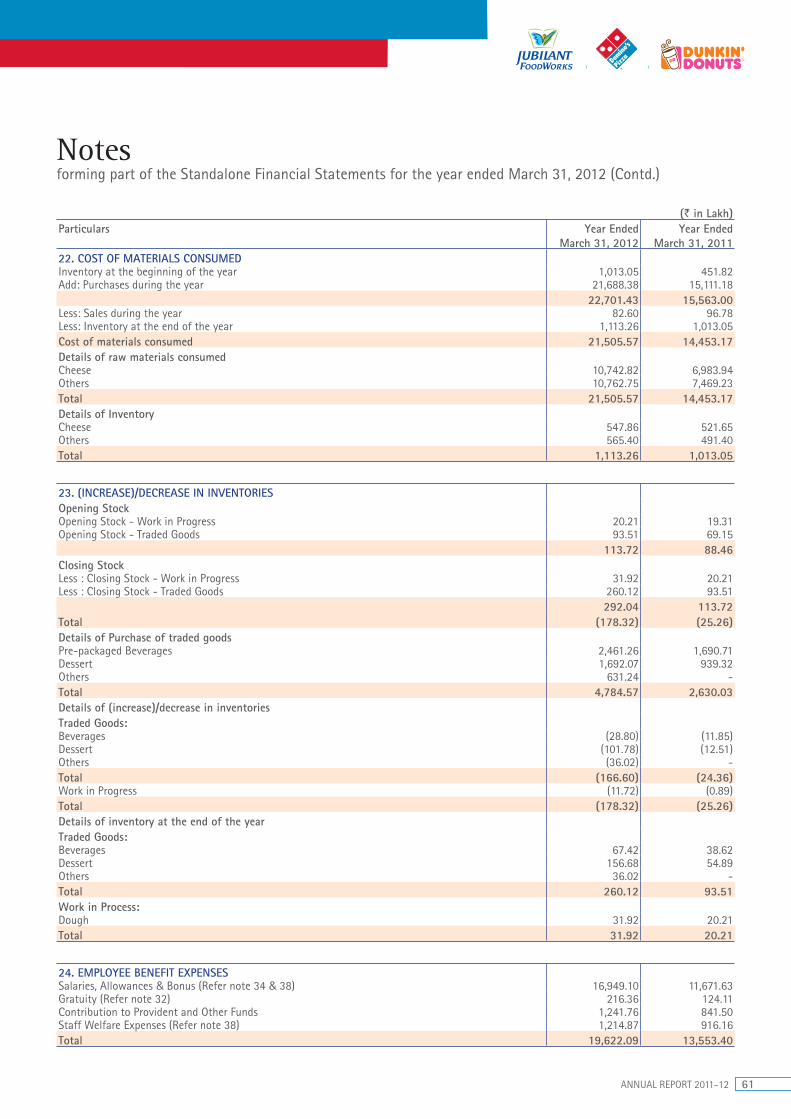
ANNUAL REPORT 2011-12 61
(` in Lakh)Particulars Year Ended
March 31, 2012Year Ended
March 31, 201122. COST OF MATERIALS CONSUMEDInventory at the beginning of the year 1,013.05 451.82 Add: Purchases during the year 21,688.38 15,111.18
22,701.43 15,563.00 Less: Sales during the year 82.60 96.78Less: Inventory at the end of the year 1,113.26 1,013.05Cost of materials consumed 21,505.57 14,453.17 Details of raw materials consumedCheese 10,742.82 6,983.94 Others 10,762.75 7,469.23 Total 21,505.57 14,453.17 Details of InventoryCheese 547.86 521.65 Others 565.40 491.40 Total 1,113.26 1,013.05
23. (INCREASE)/DECREASE IN INVENTORIESOpening StockOpening Stock - Work in Progress 20.21 19.31 Opening Stock - Traded Goods 93.51 69.15
113.72 88.46 Closing Stock Less : Closing Stock - Work in Progress 31.92 20.21Less : Closing Stock - Traded Goods 260.12 93.51
292.04 113.72Total (178.32) (25.26)Details of Purchase of traded goodsPre-packaged Beverages 2,461.26 1,690.71 Dessert 1,692.07 939.32 Others 631.24 - Total 4,784.57 2,630.03 Details of (increase)/decrease in inventoriesTraded Goods:Beverages (28.80) (11.85)Dessert (101.78) (12.51)Others (36.02) - Total (166.60) (24.36)Work in Progress (11.72) (0.89)Total (178.32) (25.26)Details of inventory at the end of the yearTraded Goods:Beverages 67.42 38.62 Dessert 156.68 54.89 Others 36.02 - Total 260.12 93.51Work in Process:Dough 31.92 20.21 Total 31.92 20.21
24. EMPLOYEE BENEFIT EXPENSESSalaries, Allowances & Bonus (Refer note 34 & 38) 16,949.10 11,671.63 Gratuity (Refer note 32) 216.36 124.11 Contribution to Provident and Other Funds 1,241.76 841.50 Staff Welfare Expenses (Refer note 38) 1,214.87 916.16 Total 19,622.09 13,553.40
Notes forming part of the Standalone Financial Statements for the year ended March 31, 2012 (Contd.)
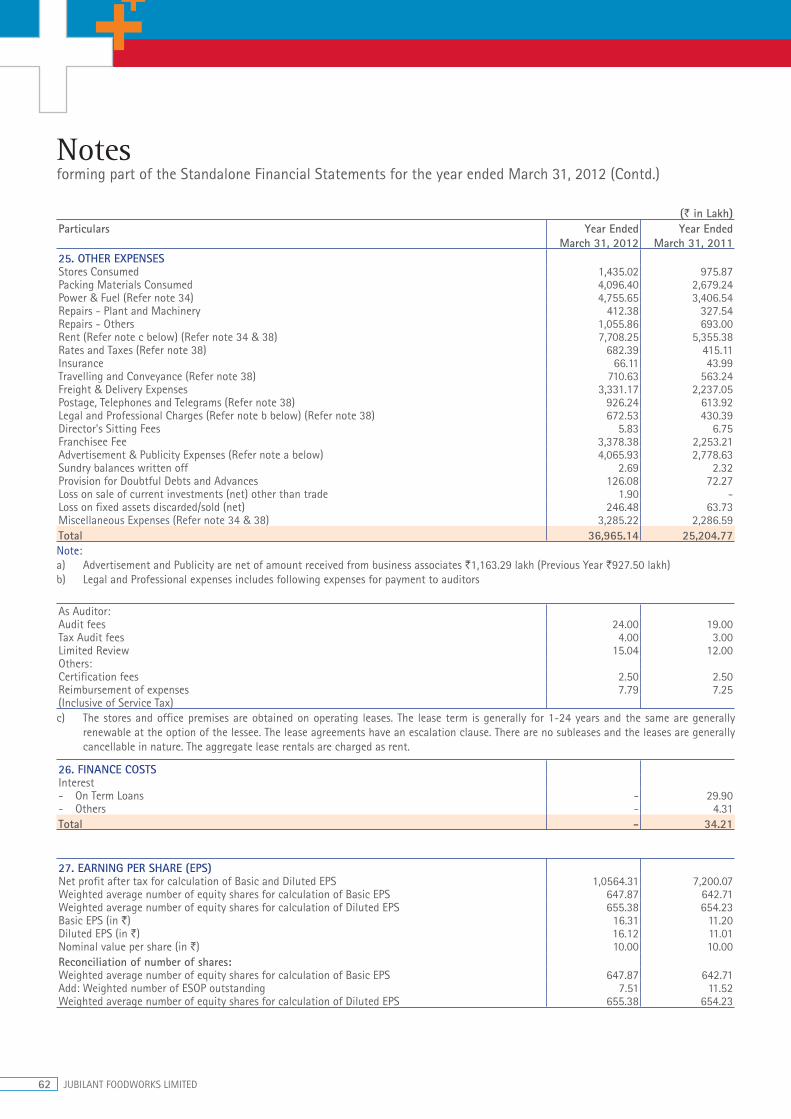
62 JUBILANT FOODWORKS LIMITED
(` in Lakh)Particulars Year Ended
March 31, 2012Year Ended
March 31, 201125. OTHER EXPENSESStores Consumed 1,435.02 975.87 Packing Materials Consumed 4,096.40 2,679.24 Power & Fuel (Refer note 34) 4,755.65 3,406.54 Repairs - Plant and Machinery 412.38 327.54 Repairs - Others 1,055.86 693.00 Rent (Refer note c below) (Refer note 34 & 38) 7,708.25 5,355.38 Rates and Taxes (Refer note 38) 682.39 415.11 Insurance 66.11 43.99 Travelling and Conveyance (Refer note 38) 710.63 563.24 Freight & Delivery Expenses 3,331.17 2,237.05 Postage, Telephones and Telegrams (Refer note 38) 926.24 613.92 Legal and Professional Charges (Refer note b below) (Refer note 38) 672.53 430.39 Director's Sitting Fees 5.83 6.75 Franchisee Fee 3,378.38 2,253.21 Advertisement & Publicity Expenses (Refer note a below) 4,065.93 2,778.63 Sundry balances written off 2.69 2.32 Provision for Doubtful Debts and Advances 126.08 72.27 Loss on sale of current investments (net) other than trade 1.90 - Loss on fixed assets discarded/sold (net) 246.48 63.73 Miscellaneous Expenses (Refer note 34 & 38) 3,285.22 2,286.59 Total 36,965.14 25,204.77 Note:a) Advertisement and Publicity are net of amount received from business associates `1,163.29 lakh (Previous Year `927.50 lakh)b) Legal and Professional expenses includes following expenses for payment to auditors
As Auditor:Audit fees 24.00 19.00 Tax Audit fees 4.00 3.00 Limited Review 15.04 12.00 Others:Certification fees 2.50 2.50 Reimbursement of expenses 7.79 7.25 (Inclusive of Service Tax)c) The stores and office premises are obtained on operating leases. The lease term is generally for 1-24 years and the same are generally
renewable at the option of the lessee. The lease agreements have an escalation clause. There are no subleases and the leases are generally cancellable in nature. The aggregate lease rentals are charged as rent.
26. FINANCE COSTSInterest- On Term Loans - 29.90 - Others - 4.31 Total - 34.21
27. EARNING PER SHARE (EPS)Net profit after tax for calculation of Basic and Diluted EPS 1,0564.31 7,200.07Weighted average number of equity shares for calculation of Basic EPS 647.87 642.71Weighted average number of equity shares for calculation of Diluted EPS 655.38 654.23Basic EPS (in `) 16.31 11.20 Diluted EPS (in `) 16.12 11.01 Nominal value per share (in `) 10.00 10.00 Reconciliation of number of shares:Weighted average number of equity shares for calculation of Basic EPS 647.87 642.71Add: Weighted number of ESOP outstanding 7.51 11.52Weighted average number of equity shares for calculation of Diluted EPS 655.38 654.23
Notes forming part of the Standalone Financial Statements for the year ended March 31, 2012 (Contd.)
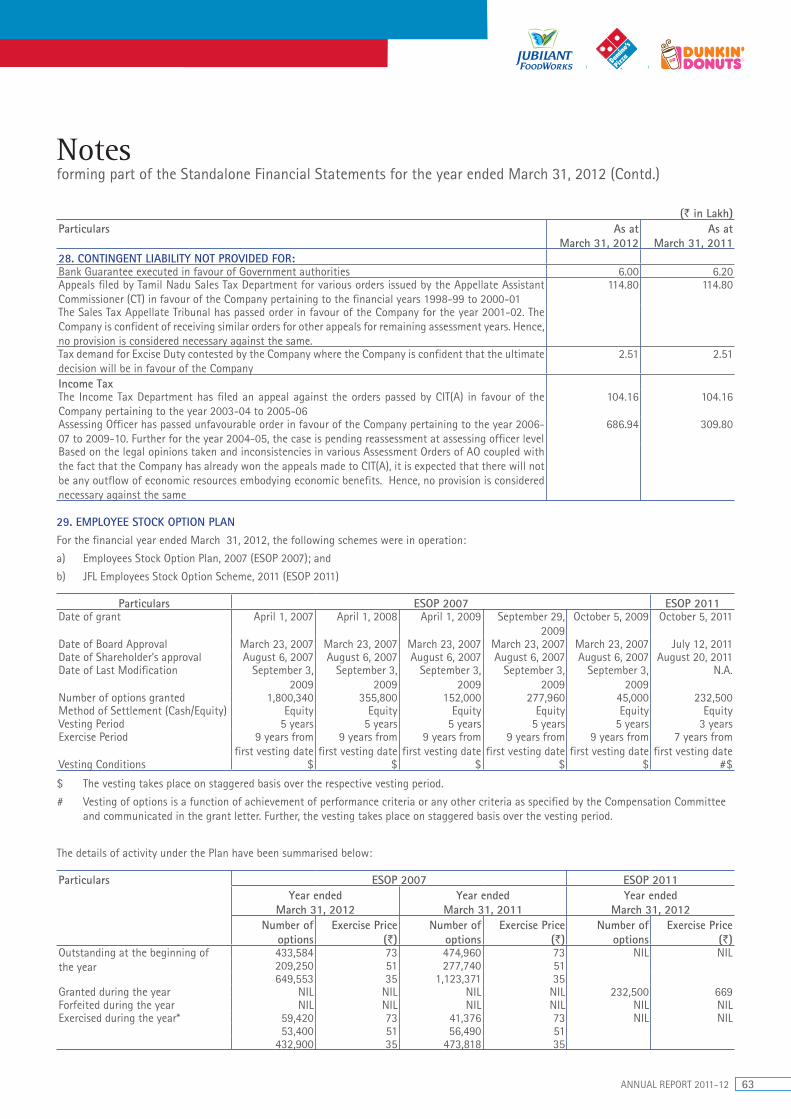
ANNUAL REPORT 2011-12 63
(` in Lakh)Particulars As at
March 31, 2012As at
March 31, 201128. CONTINGENT LIABILITY NOT PROVIDED FOR:Bank Guarantee executed in favour of Government authorities 6.00 6.20 Appeals filed by Tamil Nadu Sales Tax Department for various orders issued by the Appellate Assistant Commissioner (CT) in favour of the Company pertaining to the financial years 1998-99 to 2000-01
114.80 114.80
The Sales Tax Appellate Tribunal has passed order in favour of the Company for the year 2001-02. The Company is confident of receiving similar orders for other appeals for remaining assessment years. Hence, no provision is considered necessary against the same.Tax demand for Excise Duty contested by the Company where the Company is confident that the ultimate decision will be in favour of the Company
2.51 2.51
Income TaxThe Income Tax Department has filed an appeal against the orders passed by CIT(A) in favour of the Company pertaining to the year 2003-04 to 2005-06
104.16 104.16
Assessing Officer has passed unfavourable order in favour of the Company pertaining to the year 2006-07 to 2009-10. Further for the year 2004-05, the case is pending reassessment at assessing officer level
686.94 309.80
Based on the legal opinions taken and inconsistencies in various Assessment Orders of AO coupled with the fact that the Company has already won the appeals made to CIT(A), it is expected that there will not be any outflow of economic resources embodying economic benefits. Hence, no provision is considered necessary against the same
29. EMPLOYEE STOCK OPTION PLANFor the financial year ended March 31, 2012, the following schemes were in operation:
a) Employees Stock Option Plan, 2007 (ESOP 2007); and
b) JFL Employees Stock Option Scheme, 2011 (ESOP 2011)
Particulars ESOP 2007 ESOP 2011Date of grant April 1, 2007 April 1, 2008 April 1, 2009 September 29,
2009October 5, 2009 October 5, 2011
Date of Board Approval March 23, 2007 March 23, 2007 March 23, 2007 March 23, 2007 March 23, 2007 July 12, 2011Date of Shareholder’s approval August 6, 2007 August 6, 2007 August 6, 2007 August 6, 2007 August 6, 2007 August 20, 2011Date of Last Modification September 3,
2009September 3,
2009September 3,
2009September 3,
2009September 3,
2009N.A.
Number of options granted 1,800,340 355,800 152,000 277,960 45,000 232,500Method of Settlement (Cash/Equity) Equity Equity Equity Equity Equity EquityVesting Period 5 years 5 years 5 years 5 years 5 years 3 years Exercise Period 9 years from
first vesting date9 years from
first vesting date9 years from
first vesting date9 years from
first vesting date9 years from
first vesting date7 years from
first vesting dateVesting Conditions $ $ $ $ $ #$
$ The vesting takes place on staggered basis over the respective vesting period.
# Vesting of options is a function of achievement of performance criteria or any other criteria as specified by the Compensation Committee and communicated in the grant letter. Further, the vesting takes place on staggered basis over the vesting period.
The details of activity under the Plan have been summarised below:
Particulars ESOP 2007 ESOP 2011Year ended
March 31, 2012Year ended
March 31, 2011Year ended
March 31, 2012Number of
optionsExercise Price
(`)Number of
optionsExercise Price
(`)Number of
optionsExercise Price
(`)Outstanding at the beginning of the year
433,584 73 474,960 73 NIL NIL209,250 51 277,740 51649,553 35 1,123,371 35
Granted during the year NIL NIL NIL NIL 232,500 669 Forfeited during the year NIL NIL NIL NIL NIL NILExercised during the year* 59,420 73 41,376 73 NIL NIL
53,400 51 56,490 51432,900 35 473,818 35
Notes forming part of the Standalone Financial Statements for the year ended March 31, 2012 (Contd.)
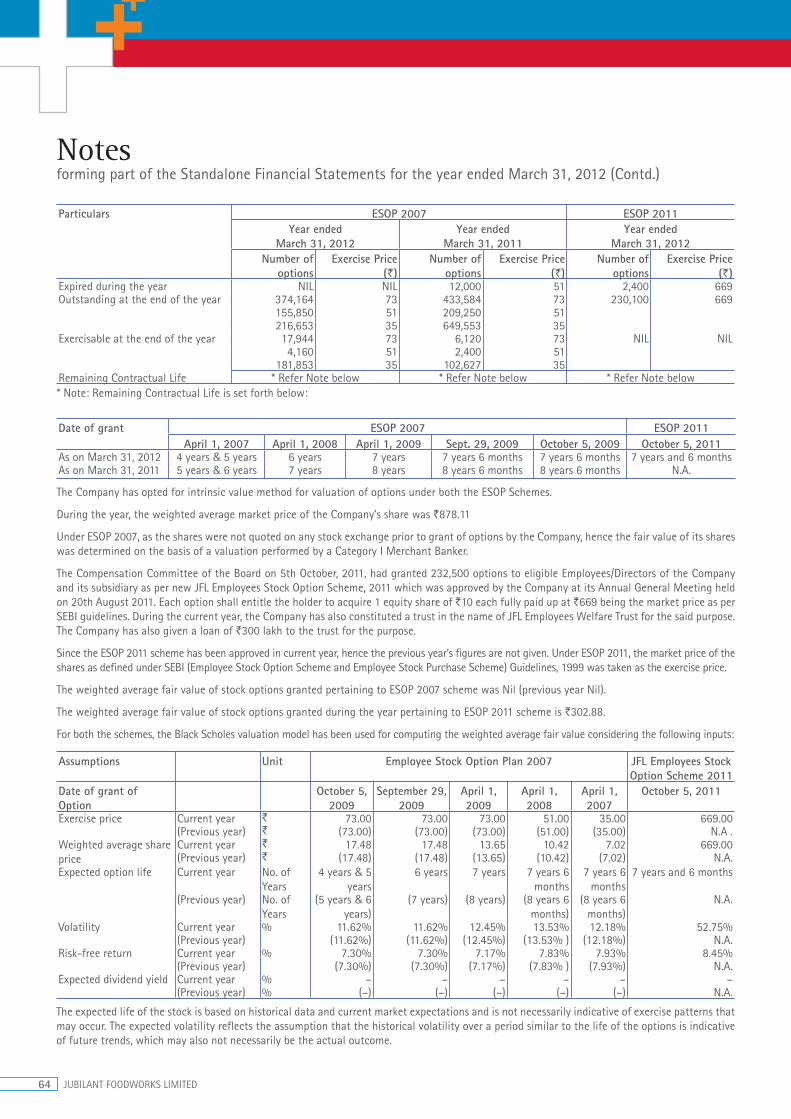
64 JUBILANT FOODWORKS LIMITED
Particulars ESOP 2007 ESOP 2011Year ended
March 31, 2012Year ended
March 31, 2011Year ended
March 31, 2012Number of
optionsExercise Price
(`)Number of
optionsExercise Price
(`)Number of
optionsExercise Price
(`)Expired during the year NIL NIL 12,000 51 2,400 669 Outstanding at the end of the year 374,164 73 433,584 73 230,100 669
155,850 51 209,250 51216,653 35 649,553 35
Exercisable at the end of the year 17,944 73 6,120 73 NIL NIL4,160 51 2,400 51
181,853 35 102,627 35Remaining Contractual Life * Refer Note below * Refer Note below * Refer Note below* Note: Remaining Contractual Life is set forth below:
Date of grant ESOP 2007 ESOP 2011April 1, 2007 April 1, 2008 April 1, 2009 Sept. 29, 2009 October 5, 2009 October 5, 2011
As on March 31, 2012 4 years & 5 years 6 years 7 years 7 years 6 months 7 years 6 months 7 years and 6 monthsAs on March 31, 2011 5 years & 6 years 7 years 8 years 8 years 6 months 8 years 6 months N.A.
The Company has opted for intrinsic value method for valuation of options under both the ESOP Schemes.
During the year, the weighted average market price of the Company’s share was `878.11
Under ESOP 2007, as the shares were not quoted on any stock exchange prior to grant of options by the Company, hence the fair value of its shares was determined on the basis of a valuation performed by a Category I Merchant Banker.
The Compensation Committee of the Board on 5th October, 2011, had granted 232,500 options to eligible Employees/Directors of the Company and its subsidiary as per new JFL Employees Stock Option Scheme, 2011 which was approved by the Company at its Annual General Meeting held on 20th August 2011. Each option shall entitle the holder to acquire 1 equity share of `10 each fully paid up at `669 being the market price as per SEBI guidelines. During the current year, the Company has also constituted a trust in the name of JFL Employees Welfare Trust for the said purpose. The Company has also given a loan of `300 lakh to the trust for the purpose.
Since the ESOP 2011 scheme has been approved in current year, hence the previous year’s figures are not given. Under ESOP 2011, the market price of the shares as defined under SEBI (Employee Stock Option Scheme and Employee Stock Purchase Scheme) Guidelines, 1999 was taken as the exercise price.
The weighted average fair value of stock options granted pertaining to ESOP 2007 scheme was Nil (previous year Nil).
The weighted average fair value of stock options granted during the year pertaining to ESOP 2011 scheme is `302.88.
For both the schemes, the Black Scholes valuation model has been used for computing the weighted average fair value considering the following inputs:
Assumptions Unit Employee Stock Option Plan 2007 JFL Employees Stock Option Scheme 2011
Date of grant of Option
October 5, 2009
September 29, 2009
April 1, 2009
April 1, 2008
April 1, 2007
October 5, 2011
Exercise price Current year ` 73.00 73.00 73.00 51.00 35.00 669.00(Previous year) ` (73.00) (73.00) (73.00) (51.00) (35.00) N.A .
Weighted average share price
Current year ` 17.48 17.48 13.65 10.42 7.02 669.00(Previous year) ` (17.48) (17.48) (13.65) (10.42) (7.02) N.A.
Expected option life Current year No. of Years
4 years & 5 years
6 years 7 years 7 years 6 months
7 years 6 months
7 years and 6 months
(Previous year) No. of Years
(5 years & 6 years)
(7 years) (8 years) (8 years 6 months)
(8 years 6 months)
N.A.
Volatility Current year % 11.62% 11.62% 12.45% 13.53% 12.18% 52.75%(Previous year) (11.62%) (11.62%) (12.45%) (13.53% ) (12.18%) N.A.
Risk-free return Current year % 7.30% 7.30% 7.17% 7.83% 7.93% 8.45%(Previous year) (7.30%) (7.30%) (7.17%) (7.83% ) (7.93%) N.A.
Expected dividend yield Current year % – – – – – –(Previous year) % (–) (–) (–) (–) (–) N.A.
The expected life of the stock is based on historical data and current market expectations and is not necessarily indicative of exercise patterns that may occur. The expected volatility reflects the assumption that the historical volatility over a period similar to the life of the options is indicative of future trends, which may also not necessarily be the actual outcome.
Notes forming part of the Standalone Financial Statements for the year ended March 31, 2012 (Contd.)
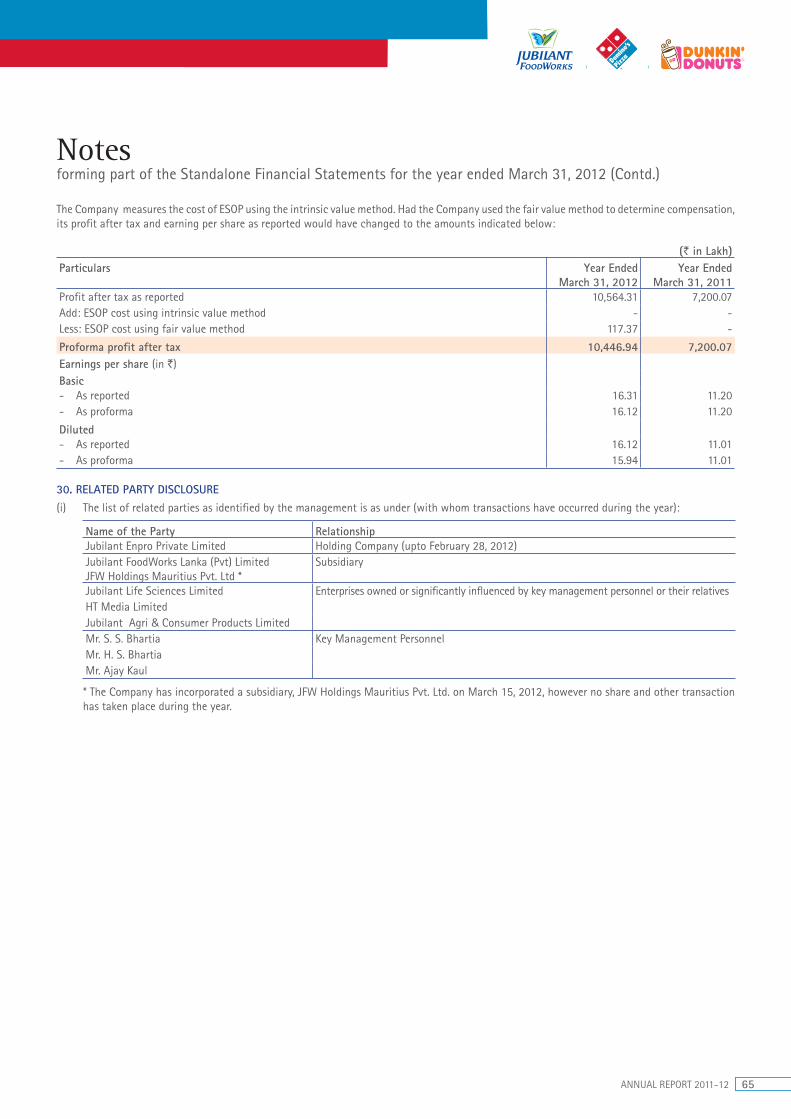
ANNUAL REPORT 2011-12 65
The Company measures the cost of ESOP using the intrinsic value method. Had the Company used the fair value method to determine compensation, its profit after tax and earning per share as reported would have changed to the amounts indicated below:
(` in Lakh)Particulars Year Ended
March 31, 2012Year Ended
March 31, 2011Profit after tax as reported 10,564.31 7,200.07 Add: ESOP cost using intrinsic value method - - Less: ESOP cost using fair value method 117.37 -
Proforma profit after tax 10,446.94 7,200.07 Earnings per share (in `)Basic- As reported 16.31 11.20 - As proforma 16.12 11.20
Diluted- As reported 16.12 11.01 - As proforma 15.94 11.01
30. RELATED PARTY DISCLOSURE(i) The list of related parties as identified by the management is as under (with whom transactions have occurred during the year):
Name of the Party RelationshipJubilant Enpro Private Limited Holding Company (upto February 28, 2012)Jubilant FoodWorks Lanka (Pvt) LimitedJFW Holdings Mauritius Pvt. Ltd *
Subsidiary
Jubilant Life Sciences Limited Enterprises owned or significantly influenced by key management personnel or their relativesHT Media LimitedJubilant Agri & Consumer Products LimitedMr. S. S. Bhartia Key Management PersonnelMr. H. S. BhartiaMr. Ajay Kaul
* The Company has incorporated a subsidiary, JFW Holdings Mauritius Pvt. Ltd. on March 15, 2012, however no share and other transaction has taken place during the year.
Notes forming part of the Standalone Financial Statements for the year ended March 31, 2012 (Contd.)
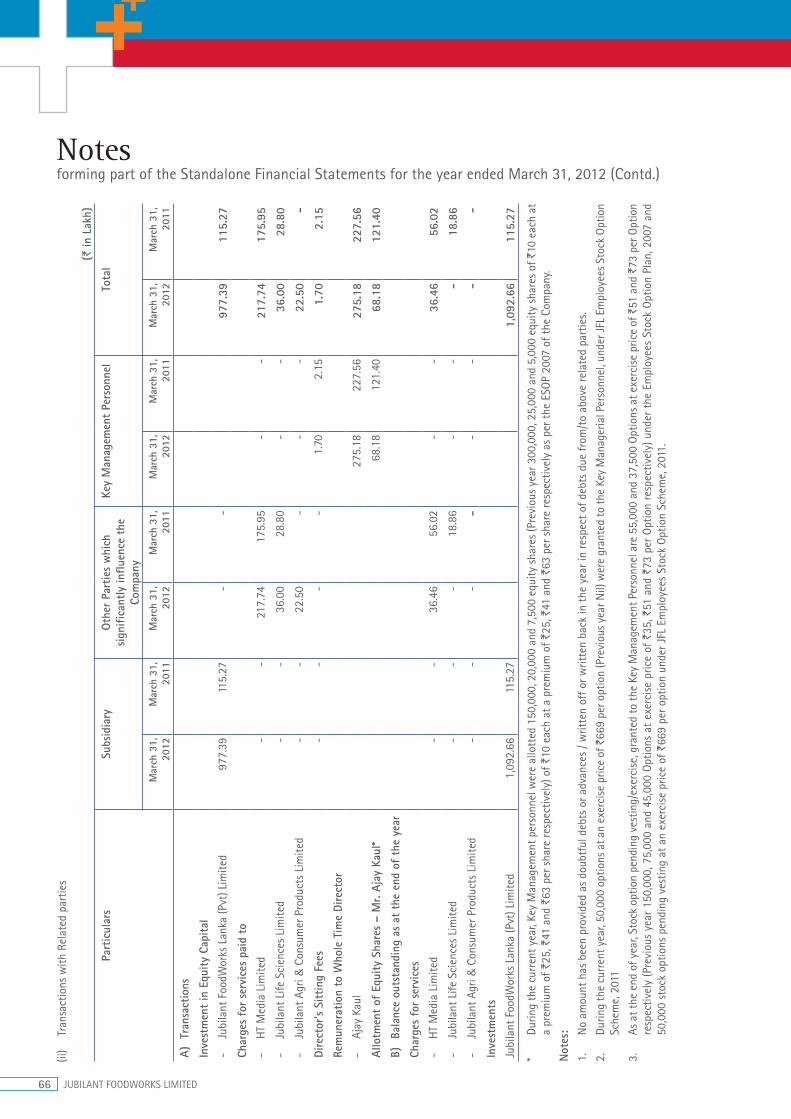
66 JUBILANT FOODWORKS LIMITED
(ii)
Tran
sact
ions
with
Rel
ated
par
ties
(` in
Lak
h)
Part
icul
ars
Subs
idia
ryO
ther
Par
ties
whi
ch
sign
ifica
ntly
influ
ence
the
Co
mpa
ny
Key
Man
agem
ent
Pers
onne
lTo
tal
Mar
ch 3
1,
2012
Mar
ch 3
1,
2011
Mar
ch 3
1,
2012
Mar
ch 3
1,
2011
Mar
ch 3
1,
2012
Mar
ch 3
1,
2011
Mar
ch 3
1,
2012
Mar
ch 3
1,
2011
A)
Tran
sact
ions
Inve
stm
ent
in E
quity
Cap
ital
- Ju
bila
nt F
oodW
orks
Lan
ka (P
vt) L
imite
d 9
77.3
9 1
15.2
7 -
-
9
77.3
9 1
15.2
7
Char
ges
for
serv
ices
pai
d to
- H
T M
edia
Lim
ited
-
-
217
.74
175
.95
-
-
217
.74
175
.95
- Ju
bila
nt L
ife S
cien
ces
Lim
ited
-
-
36.
00
28.
80
-
-
36.
00
28.
80
- Ju
bila
nt A
gri &
Con
sum
er P
rodu
cts
Lim
ited
-
-
22.
50
-
-
-
22.
50
-
Dire
ctor
's Si
ttin
g Fe
es -
-
-
-
1
.70
2.1
5 1
.70
2.1
5
Rem
uner
atio
n to
Who
le T
ime
Dire
ctor
- Aj
ay K
aul
275
.18
227
.56
275
.18
227
.56
Allo
tmen
t of
Equ
ity S
hare
s –
Mr.
Ajay
Kau
l* 6
8.18
1
21.4
0 6
8.18
1
21.4
0
B)
Bala
nce
outs
tand
ing
as a
t th
e en
d of
the
yea
r
Char
ges
for
serv
ices
- H
T M
edia
Lim
ited
-
-
36.
46
56.
02
-
-
36.
46
56.
02
- Ju
bila
nt L
ife S
cien
ces
Lim
ited
-
-
-
18.
86
-
-
-
18.
86
- Ju
bila
nt A
gri &
Con
sum
er P
rodu
cts
Lim
ited
-
-
-
-
-
-
-
-
Inve
stm
ents
Jubi
lant
Foo
dWor
ks L
anka
(Pvt
) Lim
ited
1,0
92.6
6 1
15.2
7 1
,092
.66
115
.27
* Du
ring
the
curr
ent y
ear,
Key
Man
agem
ent p
erso
nnel
wer
e al
lott
ed 1
50,0
00, 2
0,00
0 an
d 7,
500
equi
ty s
hare
s (P
revi
ous
year
300
,000
, 25,
000
and
5,00
0 eq
uity
sha
res
of `
10 e
ach
at
a pr
emiu
m o
f `25
, `41
and
`63
per
sha
re re
spec
tivel
y) o
f `10
eac
h at
a p
rem
ium
of `
25, `
41 a
nd `
63 p
er s
hare
resp
ectiv
ely
as p
er t
he E
SOP
2007
of t
he C
ompa
ny.
Not
es:
1.
No
amou
nt h
as b
een
prov
ided
as
doub
tful
deb
ts o
r adv
ance
s / w
ritte
n of
f or w
ritte
n ba
ck in
the
yea
r in
resp
ect
of d
ebts
due
from
/to
abov
e re
late
d pa
rtie
s.
2.
Durin
g th
e cu
rren
t yea
r, 50
,000
opt
ions
at a
n ex
erci
se p
rice
of `
669
per o
ptio
n (P
revi
ous
year
Nil)
wer
e gr
ante
d to
the
Key
Man
ager
ial P
erso
nnel
, und
er J
FL E
mpl
oyee
s St
ock
Opt
ion
Sche
me,
201
1
3.
As a
t the
end
of y
ear,
Stoc
k op
tion
pend
ing
vest
ing/
exer
cise
, gra
nted
to th
e Ke
y M
anag
emen
t Per
sonn
el a
re 5
5,00
0 an
d 37
,500
Opt
ions
at e
xerc
ise
pric
e of
`51
and
`73
per
Opt
ion
resp
ectiv
ely
(Pre
viou
s ye
ar 1
50,0
00, 7
5,00
0 an
d 45
,000
Opt
ions
at
exer
cise
pric
e of
`35
, `51
and
`73
per
Opt
ion
resp
ectiv
ely)
und
er t
he E
mpl
oyee
s St
ock
Opt
ion
Plan
, 200
7 an
d 50
,000
sto
ck o
ptio
ns p
endi
ng v
estin
g at
an
exer
cise
pric
e of
`66
9 pe
r opt
ion
unde
r JFL
Em
ploy
ees
Stoc
k O
ptio
n Sc
hem
e, 2
011.
Notes forming part of the Standalone Financial Statements for the year ended March 31, 2012 (Contd.)
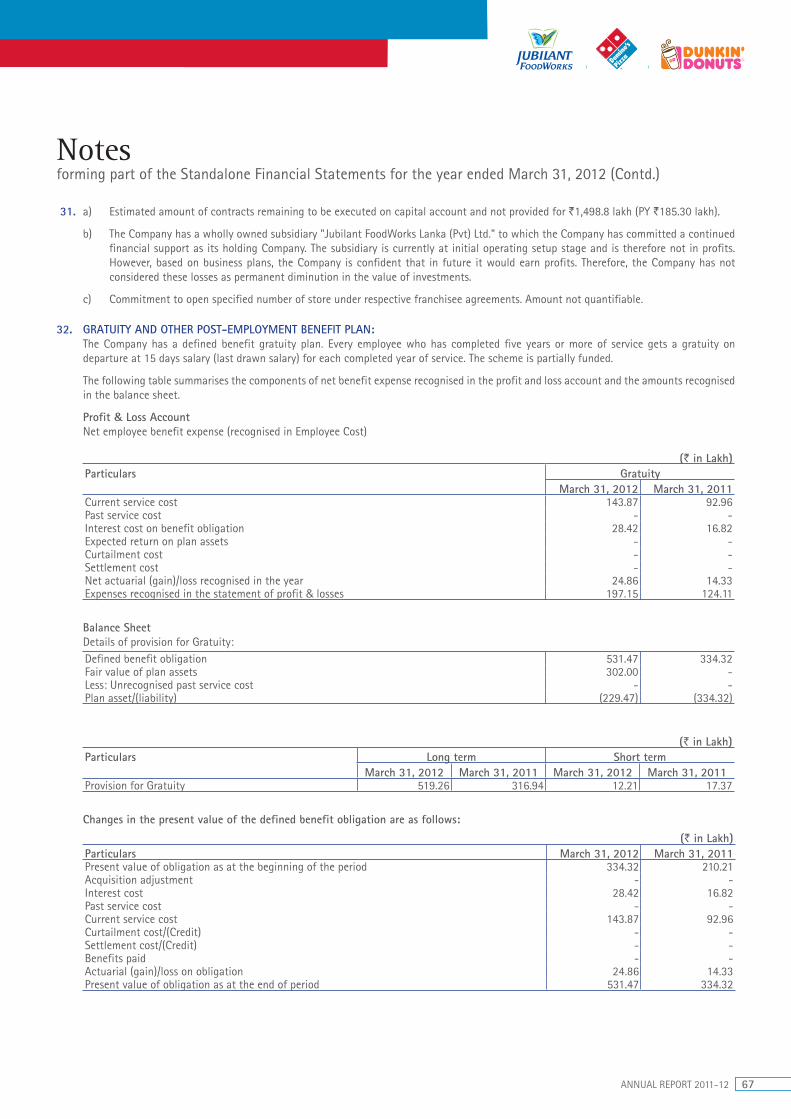
ANNUAL REPORT 2011-12 67
31. a) Estimated amount of contracts remaining to be executed on capital account and not provided for `1,498.8 lakh (PY `185.30 lakh).
b) The Company has a wholly owned subsidiary "Jubilant FoodWorks Lanka (Pvt) Ltd." to which the Company has committed a continued financial support as its holding Company. The subsidiary is currently at initial operating setup stage and is therefore not in profits. However, based on business plans, the Company is confident that in future it would earn profits. Therefore, the Company has not considered these losses as permanent diminution in the value of investments.
c) Commitment to open specified number of store under respective franchisee agreements. Amount not quantifiable.
32. GRATUITY AND OTHER POST-EMPLOYMENT BENEFIT PLAN: The Company has a defined benefit gratuity plan. Every employee who has completed five years or more of service gets a gratuity on
departure at 15 days salary (last drawn salary) for each completed year of service. The scheme is partially funded.
The following table summarises the components of net benefit expense recognised in the profit and loss account and the amounts recognised in the balance sheet.
Profit & Loss Account Net employee benefit expense (recognised in Employee Cost)
(` in Lakh)Particulars Gratuity
March 31, 2012 March 31, 2011Current service cost 143.87 92.96 Past service cost - - Interest cost on benefit obligation 28.42 16.82 Expected return on plan assets - - Curtailment cost - - Settlement cost - - Net actuarial (gain)/loss recognised in the year 24.86 14.33 Expenses recognised in the statement of profit & losses 197.15 124.11
Balance SheetDetails of provision for Gratuity:Defined benefit obligation 531.47 334.32 Fair value of plan assets 302.00 - Less: Unrecognised past service cost - - Plan asset/(liability) (229.47) (334.32)
(` in Lakh)Particulars Long term Short term
March 31, 2012 March 31, 2011 March 31, 2012 March 31, 2011Provision for Gratuity 519.26 316.94 12.21 17.37
Changes in the present value of the defined benefit obligation are as follows:
(` in Lakh)Particulars March 31, 2012 March 31, 2011Present value of obligation as at the beginning of the period 334.32 210.21 Acquisition adjustment - - Interest cost 28.42 16.82 Past service cost - - Current service cost 143.87 92.96 Curtailment cost/(Credit) - - Settlement cost/(Credit) - - Benefits paid - - Actuarial (gain)/loss on obligation 24.86 14.33 Present value of obligation as at the end of period 531.47 334.32
Notes forming part of the Standalone Financial Statements for the year ended March 31, 2012 (Contd.)

68 JUBILANT FOODWORKS LIMITED
Change in the fair value of plan assets are as follows:Fair value of plan assets at the beginning of the period - - Acquisition adjustment - - Expected return on plan assets - - Contributions 302.00 - Benefits paid - - Actuarial gain/(loss) on plan assets - - Fair value of plan assets at the end of the period 302.00 -
The Company expects to contribute `216.35 lakh (PY `170.87 lakh) to gratuity in the next year.
The principal assumptions used in determining gratuity for the Company’s plans are shown below:Demographic Assumption :
Particulars GratuityMarch 31, 2012 March 31, 2011
Discount Rate (%) 8.50 8.00 Future salary increase (%) 6.00 5.50 Expected rate of return on plan assets (%) 8.00 -
The estimates of future salary increases, considered in actuarial valuation, take account of inflation, seniority, promotion and other relevant factors, such as supply and demand in the employment market
Particulars March 31, 2012 March 31, 2011Retirement Age 58 YearsMortality Table LIC (1994-96) duly modifiedAges Withdrawal
Rate (%)Withdrawal
Rate (%)Up to 30 years 3.00 3.00 From 31 to 44 years 2.00 2.00 Above 44 years 1.00 1.00
Amounts for the current and previous years are as follows:
(` in Lakh)Particulars Gratuity
Year ended March 31, 2012
Year ended March 31, 2011
Year ended March 31, 2010
Year ended March 31, 2009
Year ended March 31, 2008
Defined benefit obligation 531.47 334.32 210.21 148.09 89.20 Plan assets 302.00 - - - - Surplus/(deficit) (229.47) (334.32) (210.21) (148.09) (89.20)Experience loss/(gain) on plan liabilities (25.79) (14.33) 0.92 (17.52) (3.34)
Provident FundThe provident fund being administered by a Trust is a defined benefit scheme whereby the Company deposits an amount determined as a fixed percentage of basic pay to the fund every month. The benefit vest upon commencement of employment. The interest credited to the accounts of the employee is adjusted on an annual basis to confirm to the interest rate declared by the government for the Employees Provident Fund. The Guidance Note on implementing AS-15, Employee Benefits (Revised 2005) issued by the Accounting Standard Board, states that providend funds set up by employers, which requires interest shortfall to be met by employer, needs to be treated as defined benefit plan. The Actuarial Society of India has issued the final guidance for measurement of provident fund liabilities. The actuary has accordingly provided a valuation and based on the below provided assumptions, there is no shortfall as at 31st March, 2012.
(` in Lakh)Defined contribution plan: March 31, 2012 March 31, 2011 March 31, 2010 March 31, 2009 March 31, 2008Contibution to provident and other funds 786.41 527.52 353.65 260.50 207.71
The detail of fund and plan asset position as at March 31, 2012 is given below:
(` in Lakh)Particulars March 31, 2012Plan assets at fair value 3,345.40 Present value of the defined benefit obligation 3,315.58 Surplus in fund 29.82 Asset recognised in the balance sheet -
Notes forming part of the Standalone Financial Statements for the year ended March 31, 2012 (Contd.)
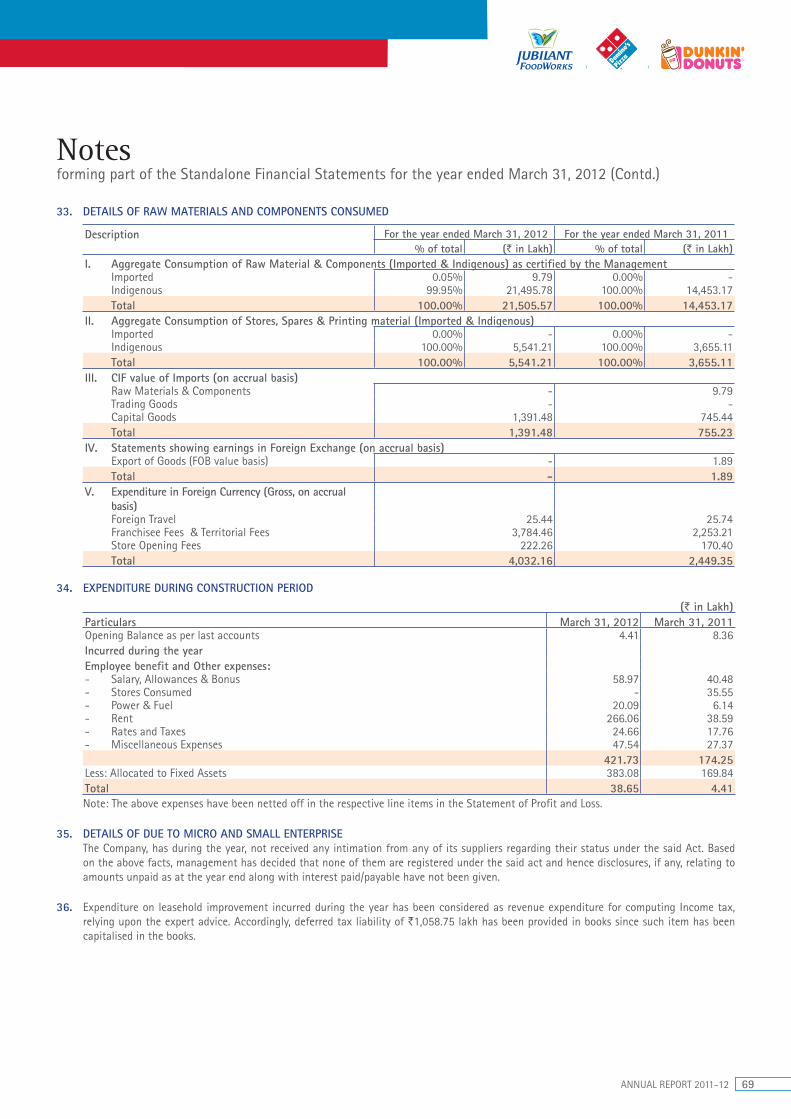
ANNUAL REPORT 2011-12 69
33. DETAILS OF RAW MATERIALS AND COMPONENTS CONSUMED
Description For the year ended March 31, 2012 For the year ended March 31, 2011 % of total (` in Lakh) % of total (` in Lakh)
I. Aggregate Consumption of Raw Material & Components (Imported & Indigenous) as certified by the ManagementImported 0.05% 9.79 0.00% - Indigenous 99.95% 21,495.78 100.00% 14,453.17 Total 100.00% 21,505.57 100.00% 14,453.17
II. Aggregate Consumption of Stores, Spares & Printing material (Imported & Indigenous)Imported 0.00% - 0.00% - Indigenous 100.00% 5,541.21 100.00% 3,655.11 Total 100.00% 5,541.21 100.00% 3,655.11
III. CIF value of Imports (on accrual basis)Raw Materials & Components - 9.79 Trading Goods - - Capital Goods 1,391.48 745.44 Total 1,391.48 755.23
IV. Statements showing earnings in Foreign Exchange (on accrual basis)Export of Goods (FOB value basis) - 1.89 Total - 1.89
V. Expenditure in Foreign Currency (Gross, on accrual basis)Foreign Travel 25.44 25.74 Franchisee Fees & Territorial Fees 3,784.46 2,253.21 Store Opening Fees 222.26 170.40 Total 4,032.16 2,449.35
34. EXPENDITURE DURING CONSTRUCTION PERIOD
(` in Lakh)Particulars March 31, 2012 March 31, 2011Opening Balance as per last accounts 4.41 8.36 Incurred during the yearEmployee benefit and Other expenses:- Salary, Allowances & Bonus 58.97 40.48 - Stores Consumed - 35.55 - Power & Fuel 20.09 6.14 - Rent 266.06 38.59 - Rates and Taxes 24.66 17.76 - Miscellaneous Expenses 47.54 27.37
421.73 174.25 Less: Allocated to Fixed Assets 383.08 169.84Total 38.65 4.41 Note: The above expenses have been netted off in the respective line items in the Statement of Profit and Loss.
35. DETAILS OF DUE TO MICRO AND SMALL ENTERPRISE The Company, has during the year, not received any intimation from any of its suppliers regarding their status under the said Act. Based
on the above facts, management has decided that none of them are registered under the said act and hence disclosures, if any, relating to amounts unpaid as at the year end along with interest paid/payable have not been given.
36. Expenditure on leasehold improvement incurred during the year has been considered as revenue expenditure for computing Income tax, relying upon the expert advice. Accordingly, deferred tax liability of `1,058.75 lakh has been provided in books since such item has been capitalised in the books.
Notes forming part of the Standalone Financial Statements for the year ended March 31, 2012 (Contd.)
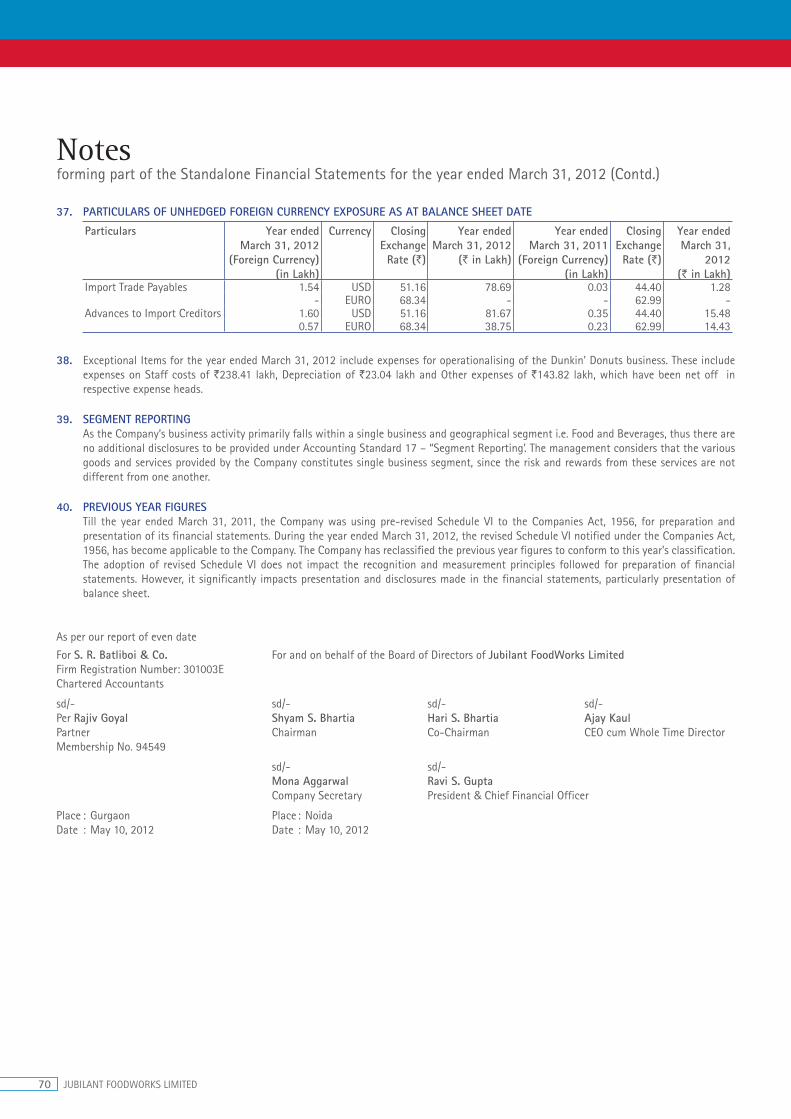
70 JUBILANT FOODWORKS LIMITED
37. PARTICULARS OF UNHEDGED FOREIGN CURRENCY EXPOSURE AS AT BALANCE SHEET DATE
Particulars Year ended March 31, 2012
(Foreign Currency) (in Lakh)
Currency Closing Exchange Rate (`)
Year ended March 31, 2012
(` in Lakh)
Year ended March 31, 2011
(Foreign Currency) (in Lakh)
Closing Exchange Rate (`)
Year ended March 31,
2012(` in Lakh)
Import Trade Payables 1.54 USD 51.16 78.69 0.03 44.40 1.28 - EURO 68.34 - - 62.99 -
Advances to Import Creditors 1.60 USD 51.16 81.67 0.35 44.40 15.48 0.57 EURO 68.34 38.75 0.23 62.99 14.43
38. Exceptional Items for the year ended March 31, 2012 include expenses for operationalising of the Dunkin’ Donuts business. These include expenses on Staff costs of `238.41 lakh, Depreciation of `23.04 lakh and Other expenses of `143.82 lakh, which have been net off in respective expense heads.
39. SEGMENT REPORTINGAs the Company’s business activity primarily falls within a single business and geographical segment i.e. Food and Beverages, thus there are no additional disclosures to be provided under Accounting Standard 17 – “Segment Reporting’. The management considers that the various goods and services provided by the Company constitutes single business segment, since the risk and rewards from these services are not different from one another.
40. PREVIOUS YEAR FIGURES Till the year ended March 31, 2011, the Company was using pre-revised Schedule VI to the Companies Act, 1956, for preparation and
presentation of its financial statements. During the year ended March 31, 2012, the revised Schedule VI notified under the Companies Act, 1956, has become applicable to the Company. The Company has reclassified the previous year figures to conform to this year’s classification. The adoption of revised Schedule VI does not impact the recognition and measurement principles followed for preparation of financial statements. However, it significantly impacts presentation and disclosures made in the financial statements, particularly presentation of balance sheet.
Notes forming part of the Standalone Financial Statements for the year ended March 31, 2012 (Contd.)
As per our report of even date
For S. R. Batliboi & Co. For and on behalf of the Board of Directors of Jubilant FoodWorks LimitedFirm Registration Number: 301003EChartered Accountants
sd/- sd/- sd/- sd/-Per Rajiv Goyal Shyam S. Bhartia Hari S. Bhartia Ajay KaulPartner Chairman Co-Chairman CEO cum Whole Time DirectorMembership No. 94549
sd/- sd/- Mona Aggarwal Ravi S. Gupta Company Secretary President & Chief Financial Officer
Place : Gurgaon Place : NoidaDate : May 10, 2012 Date : May 10, 2012
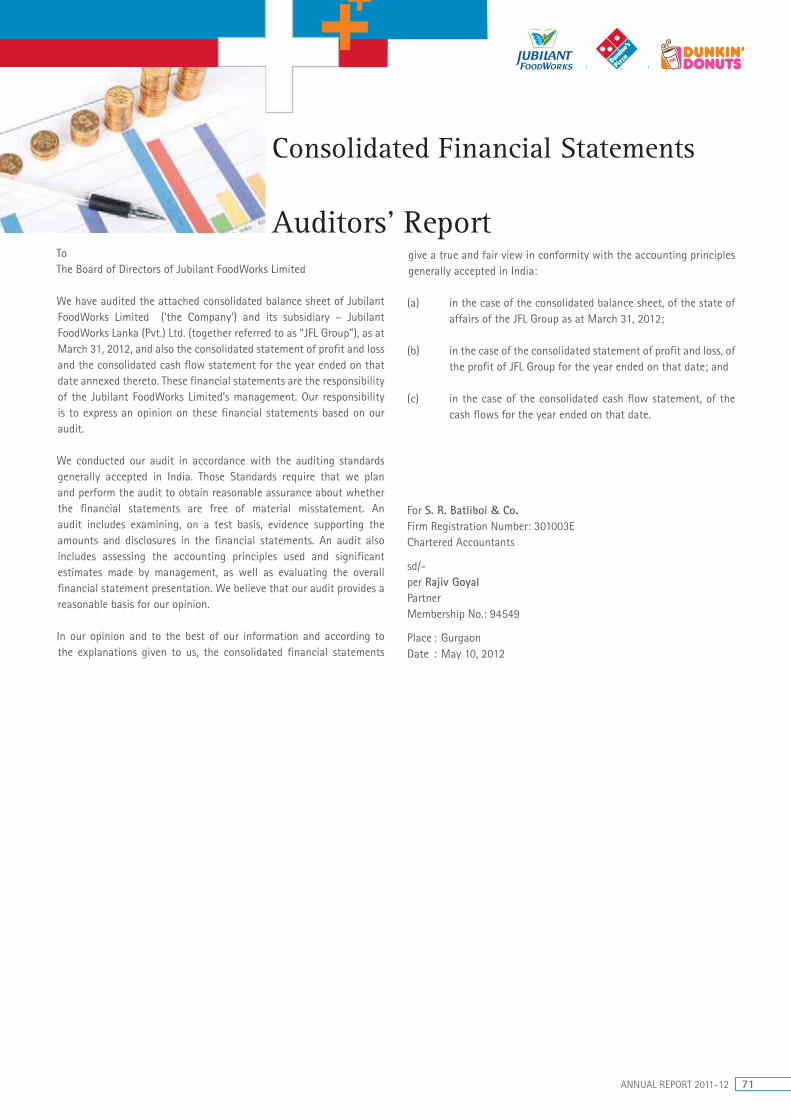
ANNUAL REPORT 2011-12 71
ToThe Board of Directors of Jubilant FoodWorks Limited
We have audited the attached consolidated balance sheet of Jubilant FoodWorks Limited (‘the Company’) and its subsidiary – Jubilant FoodWorks Lanka (Pvt.) Ltd. (together referred to as “JFL Group”), as at March 31, 2012, and also the consolidated statement of profit and loss and the consolidated cash flow statement for the year ended on that date annexed thereto. These financial statements are the responsibility of the Jubilant FoodWorks Limited’s management. Our responsibility is to express an opinion on these financial statements based on our audit.
We conducted our audit in accordance with the auditing standards generally accepted in India. Those Standards require that we plan and perform the audit to obtain reasonable assurance about whether the financial statements are free of material misstatement. An audit includes examining, on a test basis, evidence supporting the amounts and disclosures in the financial statements. An audit also includes assessing the accounting principles used and significant estimates made by management, as well as evaluating the overall financial statement presentation. We believe that our audit provides a reasonable basis for our opinion.
In our opinion and to the best of our information and according to the explanations given to us, the consolidated financial statements
Auditors’ Reportgive a true and fair view in conformity with the accounting principles generally accepted in India:
(a) in the case of the consolidated balance sheet, of the state of affairs of the JFL Group as at March 31, 2012;
(b) in the case of the consolidated statement of profit and loss, of the profit of JFL Group for the year ended on that date; and
(c) in the case of the consolidated cash flow statement, of the cash flows for the year ended on that date.
For S. R. Batliboi & Co.Firm Registration Number: 301003EChartered Accountants
sd/-per Rajiv GoyalPartnerMembership No.: 94549
Place : GurgaonDate : May 10, 2012
Consolidated Financial Statements
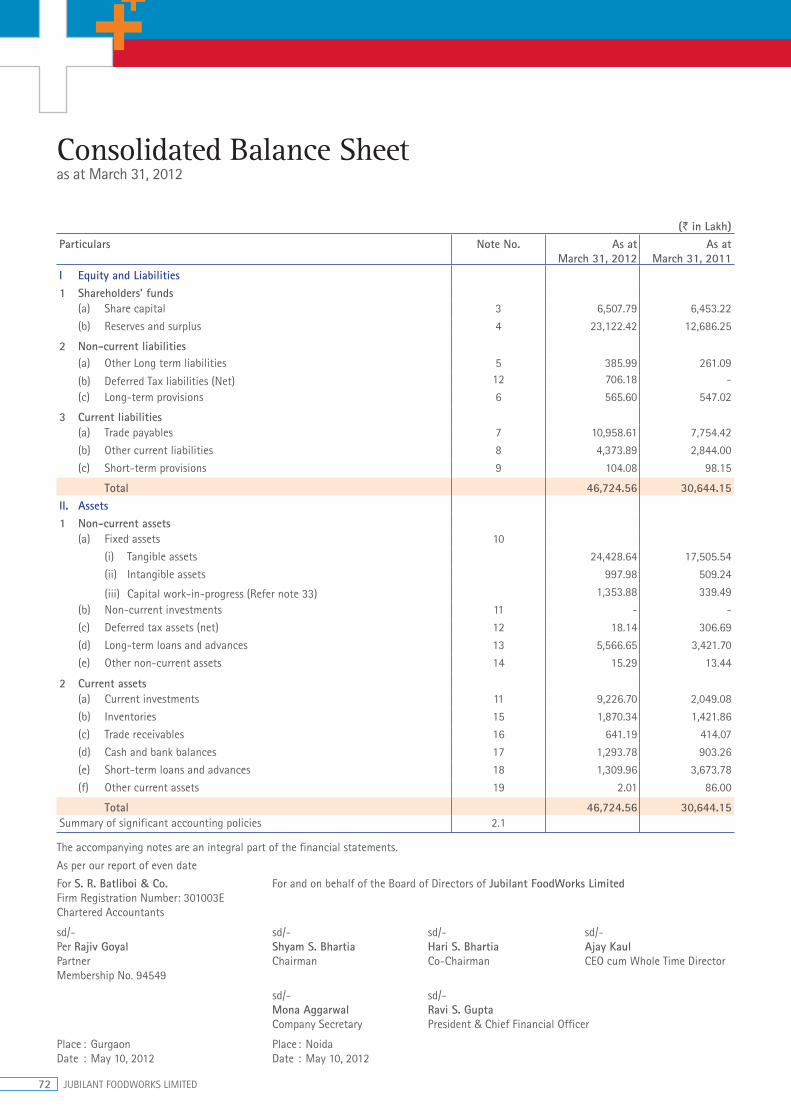
72 JUBILANT FOODWORKS LIMITED
Consolidated Balance Sheet as at March 31, 2012
(` in Lakh)Particulars Note No. As at
March 31, 2012As at
March 31, 2011I Equity and Liabilities1 Shareholders’ funds (a) Share capital 3 6,507.79 6,453.22
(b) Reserves and surplus 4 23,122.42 12,686.25
2 Non-current liabilities (a) Other Long term liabilities 5 385.99 261.09
(b) Deferred Tax liabilities (Net) 12 706.18 -
(c) Long-term provisions 6 565.60 547.02
3 Current liabilities (a) Trade payables 7 10,958.61 7,754.42
(b) Other current liabilities 8 4,373.89 2,844.00
(c) Short-term provisions 9 104.08 98.15
Total 46,724.56 30,644.15 II. Assets1 Non-current assets (a) Fixed assets 10
(i) Tangible assets 24,428.64 17,505.54
(ii) Intangible assets 997.98 509.24
(iii) Capital work-in-progress (Refer note 33) 1,353.88 339.49
(b) Non-current investments 11 - -
(c) Deferred tax assets (net) 12 18.14 306.69
(d) Long-term loans and advances 13 5,566.65 3,421.70
(e) Other non-current assets 14 15.29 13.44
2 Current assets (a) Current investments 11 9,226.70 2,049.08
(b) Inventories 15 1,870.34 1,421.86
(c) Trade receivables 16 641.19 414.07
(d) Cash and bank balances 17 1,293.78 903.26
(e) Short-term loans and advances 18 1,309.96 3,673.78
(f) Other current assets 19 2.01 86.00
Total 46,724.56 30,644.15 Summary of significant accounting policies 2.1
The accompanying notes are an integral part of the financial statements.
As per our report of even date
For S. R. Batliboi & Co. For and on behalf of the Board of Directors of Jubilant FoodWorks LimitedFirm Registration Number: 301003EChartered Accountants
sd/- sd/- sd/- sd/-Per Rajiv Goyal Shyam S. Bhartia Hari S. Bhartia Ajay KaulPartner Chairman Co-Chairman CEO cum Whole Time DirectorMembership No. 94549
sd/- sd/- Mona Aggarwal Ravi S. Gupta Company Secretary President & Chief Financial Officer
Place : Gurgaon Place : NoidaDate : May 10, 2012 Date : May 10, 2012
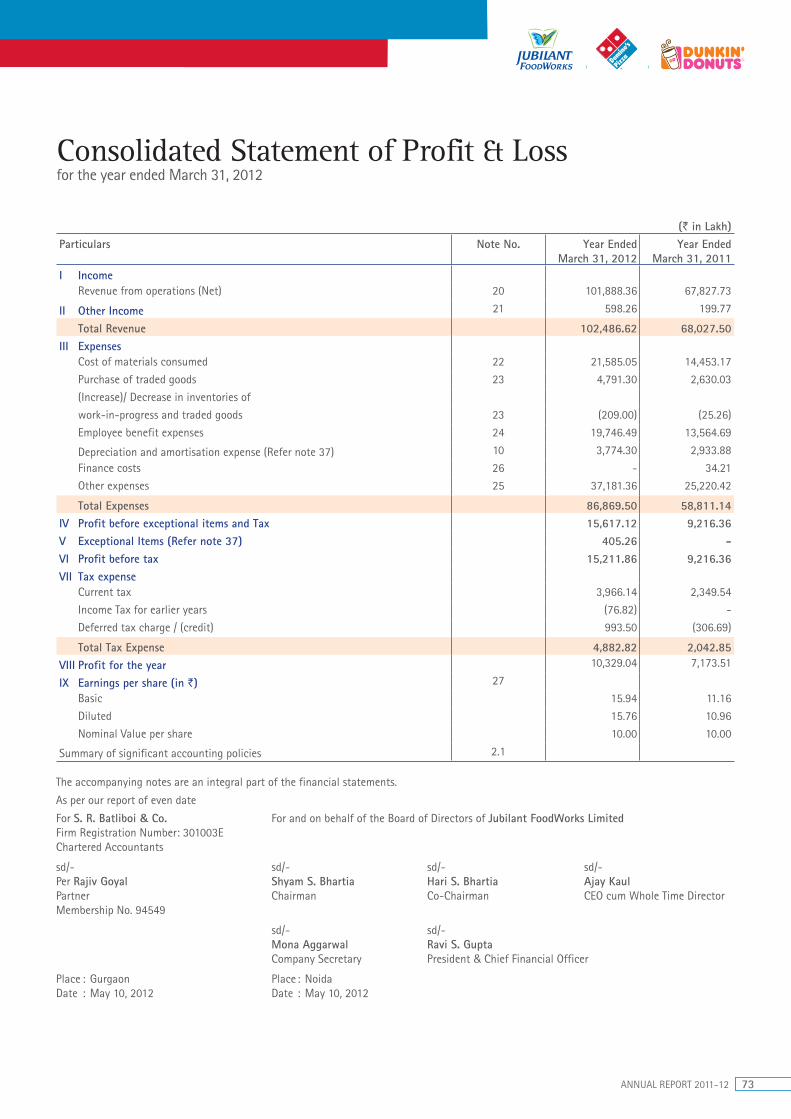
ANNUAL REPORT 2011-12 73
Consolidated Statement of Profit & Loss for the year ended March 31, 2012
(` in Lakh)Particulars Note No. Year Ended
March 31, 2012Year Ended
March 31, 2011I Income Revenue from operations (Net) 20 101,888.36 67,827.73
II Other Income 21 598.26 199.77
Total Revenue 102,486.62 68,027.50III Expenses Cost of materials consumed 22 21,585.05 14,453.17
Purchase of traded goods 23 4,791.30 2,630.03
(Increase)/ Decrease in inventories of
work-in-progress and traded goods 23 (209.00) (25.26)
Employee benefit expenses 24 19,746.49 13,564.69
Depreciation and amortisation expense (Refer note 37) 10 3,774.30 2,933.88
Finance costs 26 - 34.21
Other expenses 25 37,181.36 25,220.42
Total Expenses 86,869.50 58,811.14 IV Profit before exceptional items and Tax 15,617.12 9,216.36 V Exceptional Items (Refer note 37) 405.26 - VI Profit before tax 15,211.86 9,216.36 VII Tax expense Current tax 3,966.14 2,349.54
Income Tax for earlier years (76.82) -
Deferred tax charge / (credit) 993.50 (306.69)
Total Tax Expense 4,882.82 2,042.85VIII Profit for the year 10,329.04 7,173.51
IX Earnings per share (in `) 27
Basic 15.94 11.16
Diluted 15.76 10.96
Nominal Value per share 10.00 10.00
Summary of significant accounting policies 2.1
The accompanying notes are an integral part of the financial statements.
As per our report of even date
For S. R. Batliboi & Co. For and on behalf of the Board of Directors of Jubilant FoodWorks LimitedFirm Registration Number: 301003EChartered Accountants
sd/- sd/- sd/- sd/-Per Rajiv Goyal Shyam S. Bhartia Hari S. Bhartia Ajay KaulPartner Chairman Co-Chairman CEO cum Whole Time DirectorMembership No. 94549
sd/- sd/- Mona Aggarwal Ravi S. Gupta Company Secretary President & Chief Financial Officer
Place : Gurgaon Place : NoidaDate : May 10, 2012 Date : May 10, 2012
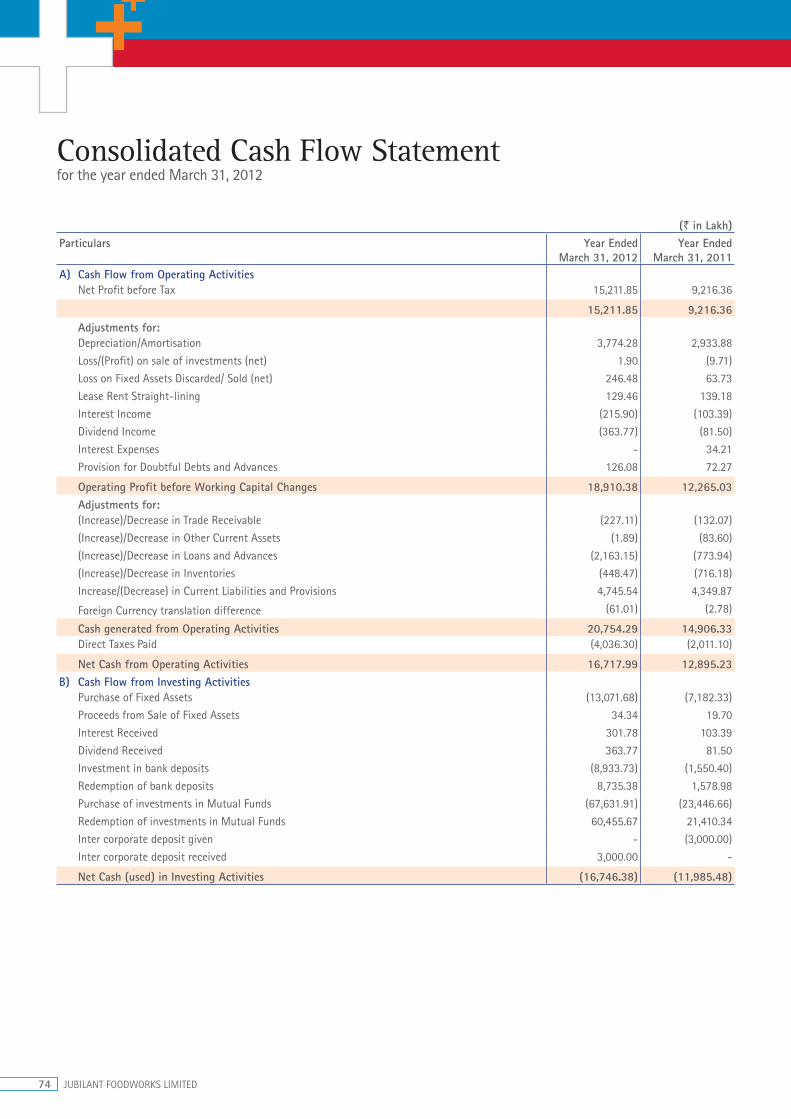
74 JUBILANT FOODWORKS LIMITED
Consolidated Cash Flow Statement for the year ended March 31, 2012
(` in Lakh)Particulars Year Ended
March 31, 2012Year Ended
March 31, 2011A) Cash Flow from Operating Activities
Net Profit before Tax 15,211.85 9,216.36
15,211.85 9,216.36 Adjustments for:Depreciation/Amortisation 3,774.28 2,933.88
Loss/(Profit) on sale of investments (net) 1.90 (9.71)
Loss on Fixed Assets Discarded/ Sold (net) 246.48 63.73
Lease Rent Straight-lining 129.46 139.18
Interest Income (215.90) (103.39)
Dividend Income (363.77) (81.50)
Interest Expenses - 34.21
Provision for Doubtful Debts and Advances 126.08 72.27
Operating Profit before Working Capital Changes 18,910.38 12,265.03 Adjustments for:(Increase)/Decrease in Trade Receivable (227.11) (132.07)
(Increase)/Decrease in Other Current Assets (1.89) (83.60)
(Increase)/Decrease in Loans and Advances (2,163.15) (773.94)
(Increase)/Decrease in Inventories (448.47) (716.18)
Increase/(Decrease) in Current Liabilities and Provisions 4,745.54 4,349.87
Foreign Currency translation difference (61.01) (2.78)
Cash generated from Operating Activities 20,754.29 14,906.33 Direct Taxes Paid (4,036.30) (2,011.10)
Net Cash from Operating Activities 16,717.99 12,895.23 B) Cash Flow from Investing Activities
Purchase of Fixed Assets (13,071.68) (7,182.33)
Proceeds from Sale of Fixed Assets 34.34 19.70
Interest Received 301.78 103.39
Dividend Received 363.77 81.50
Investment in bank deposits (8,933.73) (1,550.40)
Redemption of bank deposits 8,735.38 1,578.98
Purchase of investments in Mutual Funds (67,631.91) (23,446.66)
Redemption of investments in Mutual Funds 60,455.67 21,410.34
Inter corporate deposit given - (3,000.00)
Inter corporate deposit received 3,000.00 -
Net Cash (used) in Investing Activities (16,746.38) (11,985.48)

ANNUAL REPORT 2011-12 75
Consolidated Cash Flow Statement for the year ended March 31, 2012 (Contd.)
(` in Lakh)Particulars Year Ended
March 31, 2012Year Ended
March 31, 2011C) Cash Flow from Financing Activities
Proceeds from Issue of Share Capital (including Share Premium) 222.13 224.85
Repayment of Long Term Borrowings - (859.05)
Proceeds of Long Term Borrowings - -
Proceeds from Inter Corporate Deposits - -
Repayment of Inter Corporate Deposits - -
Interest Paid - (34.21)
Net Cash from / (used in) Financing Activities 222.13 (668.41)Net Increase/(Decrease) in Cash and Cash Equivalents (A+B+C) 193.74 241.34 Cash and Cash Equivalents as at beginning of the Year 892.39 651.05 Cash and Cash Equivalents as at end of the Year 1,086.13 892.39 Components of Cash and Cash Equivalents:Cash in Hand 602.84 502.93
Cheques in Hand 32.44 27.67
Balances with Scheduled Banks in:- Current Accounts * 450.85 361.79
- Fixed Deposit Accounts 15.29 24.31
Less: Fixed deposits not considered as cash equivalents (15.29) (24.31)
Cash & Cash Equivalents in Cash Flow Statement 1,086.13 892.39
* Includes `0.29 lakh (Previous Year `0.29 lakh) for IPO Refund Account and is restrictive in natureNotes :1. Previous year/Period figures have been regrouped, where necessary to conform to current year’s classification.2. The above Cash Flow has been prepared under the ‘Indirect Method’ as set out in the Accounting Standard-3 on Cash Flow Statements,
issued by the Institute of Chartered Accountants of India.
As per our report of even date
As per our report of even date
For S. R. Batliboi & Co. For and on behalf of the Board of Directors of Jubilant FoodWorks LimitedFirm Registration Number: 301003EChartered Accountants
sd/- sd/- sd/- sd/-Per Rajiv Goyal Shyam S. Bhartia Hari S. Bhartia Ajay KaulPartner Chairman Co-Chairman CEO cum Whole Time DirectorMembership No. 94549
sd/- sd/- Mona Aggarwal Ravi S. Gupta Company Secretary President & Chief Financial Officer
Place : Gurgaon Place : NoidaDate : May 10, 2012 Date : May 10, 2012

76 JUBILANT FOODWORKS LIMITED
1. BASIS OF PREPARATIONThe Consolidated Financial Statements relate to Jubilant FoodWorks Limited (Parent Company), and its wholly owned subsidiary Company incorporated in Sri Lanka - Jubilant FoodWorks Lanka (Pvt.) Ltd. (hereinafter collectively referred to as the “Group”).
The financial statements of the Group have been prepared in accordance with generally accepted accounting principles in India (Indian GAAP). The Company has prepared these financial statements to comply in all material respects with the accounting standards notified under Companies (Accounting Standards) Rules, 2006, (as amended) and the relevant provisions of the Companies Act, 1956. The financial statements have been prepared under the historical cost convention on an accrual basis.
The accounting policies have been consistently applied by the Company and are consistent with those used in the previous year, except for the change in accounting policy explained below.
2.1 SUMMARY OF SIGNIFICANT ACCOUNTING POLICIESa) Basis of Accounting The Consolidated Financial Statements (CFS) have been
prepared to comply in all material respects with the Accounting Standards notified by Companies (Accounting Standards) Rules, 2006 (as amended) and the relevant provisions of the Companies Act, 1956. The financial statements have been prepared under the historical cost convention on an accrual basis. The accounting policies have been consistently applied by the Group and are consistent with those used in the previous year.
Principles of Consolidation The financial statements of the Parent Company and its
Subsidiary Company have been combined on a line by line basis by adding together the book values of like items of assets, liabilities, income and expenses after fully eliminating intra group balances and intra group transactions resulting in unrealised profits or losses, if any, as per Accounting Standard –21, Consolidated Financial Statements.
The Consolidated Financial Statements have been prepared using uniform accounting policies to the extent possible for like transactions and other events in similar circumstances and are presented in the same manner as the Parent Company’s separate financial statements.
The financial statements of the subsidiary Company used in the consolidation are drawn for the same period as that of the parent Company i.e. year ended March 31, 2012.
Details of subsidiary considered for consolidation:
Name of the Company
Nature of relationship
Country of Incorpora-tion
Extent of Holding (%) as on March 31, 2012
Jubilant FoodWorks Lanka (Pvt.) Ltd.
Direct Subsidiary
Sri Lanka 100.00
Change in accounting policyPresentation and disclosure of financial statementsDuring the year ended March 31, 2012, the revised Schedule VI notified under the Companies Act, 1956, has become
applicable to the Company, for preparation and presentation of its financial statements. The adoption of revised Schedule VI does not impact recognition and measurement principles followed for preparation of financial statements. However, it has significant impact on presentation and disclosures made in the financial statements. The Company has also reclassified the previous year figures in accordance with the requirements applicable in the current year.
b) Use of EstimatesThe preparation of financial statements in conformity with Indian GAAP, requires management to make judgments, estimates and assumptions that affect the reported amounts of revenue, expenses, assets and liabilities and disclosure of contingent liabilities at the end of the reporting period. Although these estimates are based upon management’s best knowledge of current events and actions, uncertainty about these assumptions and estimates could result in the outcomes requiring a material adjustment to the carrying amounts of assets or liabilities in future periods.
c) Tangible Fixed AssetsFixed assets are stated at cost, less accumulated depreciation and impairment losses, if any. The cost comprises purchase price, borrowing cost if capitalisation criteria are met and directly attributable cost of bringing the asset to its working condition for the intended use. Any trade discounts and rebates are deducted in arriving at the purchase price.
Subsequent expenditure related to an item of fixed asset is added to its book value only if it increases the future benefits from the existing asset beyond its previously assessed standard of performance. All other expenses on existing fixed assets, including day-to-day repair and maintenance expenditure and cost of replacing parts, are charged to the statement of profit and loss for the period during which such expenses are incurred.
Gains or losses arising from derecognition of fixed assets are measured as the difference between the net disposal proceeds and the carrying amount of the asset and are recognised in the statement of profit and loss when the asset is derecognised.
d) DepreciationDepreciation on fixed assets is calculated on a straight-line basis using the rates arrived at based on the useful lives estimated by the management, or those prescribed under Schedule XIV to the Companies Act, 1956, whichever is higher. The Company is charging depreciation on fixed assets based on the following estimated useful life.
Fixed Assets Estimated Useful Life(in no. of years)
Leasehold Improvements 9 or Actual lease period, whichever is lower
Plant & Machinery 5 to 20 *Office Equipment 2 to 10Furniture & Fixtures 5 to 10Vehicles 5* As per schedule XIV of Companies Act, 1956
Fixed Assets costing below `5,000 are depreciated @ 100% p.a.
Notes forming part of the Consolidated Financial Statements for the year ended March 31, 2012

ANNUAL REPORT 2011-12 77
e) IntangiblesIntangible assets acquired separately are measured on initial recognition at cost. Following initial recognition, intangible assets are carried at cost less accumulated amortisation and accumulated impairment losses, if any.
Intangible assets are amortised on a straight line basis over the estimated useful economic life.
Gains or losses arising from derecognition of an intangible asset are measured as the difference between the net disposal proceeds and the carrying amount of the asset and are recognised in the statement of profit and loss when the asset is derecognised.
A summary of amortisation policies applied to the Company’s intangible assets is as below:
Intangible assets Estimated Useful Life(in no. of years)
Software 5Store opening fees 5Territory fees 15
f) Expenditure during Construction PeriodExpenditure directly relating to construction activity of New Commissary / Outlets is capitalised (net of income, if any). Indirect expenditure incurred during construction period is capitalised as part of the indirect construction cost to the extent to which the expenditure is indirectly related to construction or is incidental thereto. Other indirect expenditure incurred during the construction period which is not related to construction activity nor is incidental thereto is charged to Statement of Profit & Loss.
g) Borrowing CostsBorrowing cost includes interest, amortisation of ancillary costs incurred in connection with the arrangement of borrowings and exchange differences arising from foreign currency borrowings to the extent they are regarded as an adjustment to the interest cost.
Borrowing costs that are attributable to the acquisition or construction of qualifying assets are capitalised as part of the cost of such assets. A qualifying asset is one that necessarily takes substantial period of time to get ready for intended use. All other borrowing costs are expensed in the period they occur.
h) Impairment of tangible and intangible assetsThe Company assesses at each reporting date whether there is an indication that an asset may be impaired. If any indication exists, or when annual impairment testing for an asset is required, the Company estimates the asset’s recoverable amount. An asset’s recoverable amount is the higher of an asset’s or cash-generating unit’s (CGU) net selling price and its value in use. The recoverable amount is determined for an individual asset, unless the asset does not generate cash inflows that are largely independent of those from other assets or groups of assets. Where the carrying amount of an asset or CGU exceeds its recoverable amount, the asset is considered impaired and is written down to its recoverable amount. In assessing value in use,
the estimated future cash flows are discounted to their present value using a pre-tax discount rate that reflects current market assessments of the time value of money and the risks specific to the asset. In determining net selling price, recent market transactions are taken into account, if available. If no such transactions can be identified, an appropriate valuation model is used.
The Company bases its impairment calculation on detailed budgets and forecast calculations which are prepared separately for each of the Company’s cash-generating units to which the individual assets are allocated. These budgets and forecast calculations are generally covering a period of five years. For longer periods, a long term growth rate is calculated and applied to project future cash flows after the fifth year.
After impairment, depreciation is provided on the revised carrying amount of the asset over its remaining useful life.
An assessment is made at each reporting date as to whether there is any indication that previously recognised impairment losses may no longer exist or may have decreased. If such indication exists, the Company estimates the asset’s or cash-generating unit’s recoverable amount. A previously recognised impairment loss is reversed only if there has been a change in the assumptions used to determine the asset’s recoverable amount since the last impairment loss was recognised. The reversal is limited so that the carrying amount of the asset does not exceed its recoverable amount, nor exceed the carrying amount that would have been determined, net of depreciation, had no impairment loss been recognised for the asset in prior years. Such reversal is recognised in the statement of profit and loss.
i) LeasesWhere the Company is a lesseeFinance Lease, which effectively transfer to the Company substantially all the risks and benefits incidental to the ownership of the leased items, are capitalised at the inception of the lease term at the lower of fair value of the leased item and the present value of minimum lease payments. Lease payments are apportioned between the finance charges and reduction of the lease liability so as to achieve a constant rate of interest on the remaining balance of the liability. Finance charges are recognised as finance costs in the statement of profit and loss. Lease management fees, legal charges and other initial direct costs of lease are capitalised.
A leased asset is depreciated on a straight-line basis over the useful life of the asset or the useful life envisaged in Schedule XIV to the Companies Act, 1956, whichever is lower. However, if there is no reasonable certainty that the Company will obtain the ownership by the end of the term of hire, the capitalised asset is depreciated on a straight-line basis over the shorter of the estimated useful life of the asset, the term of hire or the useful life envisaged in Schedule XIV to the Companies Act, 1956.
Leases, where the lessor effectively retains substantially all risks and benefits of ownership of the leased item, are classified as operating leases. Operating lease payments are recognised as an expense in the Statement of Profit & Loss on a straight-line basis over the lease term.
Notes forming part of the Consolidated Financial Statements for the year ended March 31, 2012 (Contd.)
78 JUBILANT FOODWORKS LIMITED
j) InventoriesInventories are valued as follows:
Raw Materials, Stores, Spares and Packing Materials, Goods Purchased for Resale and work in progress
At the lower of cost and net realisable value. The cost for this purpose has been computed on FIFO basis.
Work in progress Lower of cost and net realisable value. Cost includes direct materials and labour and a proportion of manufacturing overheads, if any
Net realisable value is the estimated selling price in the ordinary course of business, less estimated costs of completion and to make the sale.
k) InvestmentsInvestments which are readily realisable and intended to be held for not more than one year from the date on which such investments are made, are classified as current investments. All other investments are classified as long-term investments.
On initial recognition, all investments are measured at cost. The cost comprises purchase price and directly attributable acquisition charges such as brokerage, fees and duties.
Current investments are carried in the financial statement at lower of cost and fair value determined on an individual investment basis. Long-term investments are carried at cost. However, provision for diminution in value is made to recognise a decline other than temporary in the value of the investments.
On disposal of an investment, the difference between its carrying amount and net disposal proceeds is charged or credited to the statement of profit and loss.
l) Revenue RecognitionRevenue is recognised to the extent that it is probable that the economic benefits will flow to the Company and the revenue can be reliably measured.
Sale of GoodsRevenue from the sale of goods is recognised upon passage of title to the customers which coincides with their delivery.
InterestRevenue is recognised on a time proportion basis taking into account the amount outstanding and the rate applicable.
DividendsRevenue is recognised when the right to receive the payment is established by the balance sheet date.
Franchisee FeeRevenue is recognised on accrual basis in accordance with the terms of the relevant agreement, if there is significant certainty as to its collectability.
m) Foreign Currency TranslationForeign currency transactions(i) Initial Recognition
Foreign currency transactions are recorded in the
reporting currency, by applying to the foreign currency amount the exchange rate between the reporting currency and the foreign currency on the date of the transaction.
(ii) ConversionForeign currency monetary items are reported using the closing rate. Non-monetary items which are carried in terms of historical cost denominated in a foreign currency are reported using the exchange rate at the date of the transaction.
(iii) Exchange DifferencesExchange differences arising on the settlement of monetary items, or on reporting such monetary items of Company at rates different from those at which they were initially recorded during the year, or reported in previous financial statements, are recognised as income or as expenses in the year in which they arise.
In case of foreign subsidiaries, being non-integral foreign operations, revenue items are consolidated at the average rate prevailing during the year. All assets and liabilities are converted at rates prevailing at the end of the year. Any exchange difference arising on consolidation is recognised in the foreign currency translation reserve included in “Reserves and Surplus”.
n) Retirement and other employment Benefits(i) Gratuity liability is defined benefit obligation and is
provided for on the basis of an actuarial valuation on projected unit credit method made at the end of each financial year. The liability so provided is unfunded.
(ii) The Provident Fund (administered by a Trust) is a defined benefit scheme whereby the Company deposits an amount determined as a fixed percentage of basic pay to the fund every month. The benefit vests upon commencement of employment. The interest credited to the accounts of the employees is adjusted on an annual basis to confirm to the interest rate declared by the government for the Employees Provident Fund. The Guidance Note on implementing AS-15, Employee Benefits (revised 2005) states that provident funds set up by employers, which requires interest shortfall to be met by the employer, needs to be treated as defined benefit plan.
(iii) Short term compensated absences are provided for based on estimates. Long term compensated absences are provided for based on actuarial valuation carried by an actuary as at the end of the year. The actuarial valuation is done as per projected unit credit method.
(iv) Actuarial gains/losses are immediately taken to Statement of Profit & Loss and are not deferred.
o) Income TaxTax expense comprises of current & deferred tax.
Current income tax is measured at the amount expected to be paid to the tax authorities in accordance with the Indian Income Tax Act, 1961. Deferred income taxes reflects the impact of current year timing differences between taxable
Notes forming part of the Consolidated Financial Statements for the year ended March 31, 2012 (Contd.)
ANNUAL REPORT 2011-12 79
income and accounting income for the year and reversal of timing differences of earlier years.
Deferred tax is measured based on the tax rates and the tax laws enacted or substantively enacted at the balance sheet date. Deferred tax assets are recognised only to the extent that there is reasonable certainty that sufficient future taxable income will be available against which such deferred tax assets can be realised. If the Company has carry forward of unabsorbed depreciation and tax losses, deferred tax assets are recognised only if there is virtual certainty supported by convincing evidence that such deferred tax assets can be realised against future taxable profits.
Unrecognised deferred tax assets of earlier years are reassessed and recognised to the extent that it has become reasonably certain or virtually certain, as the case may be that sufficient future taxable income will be available against which such deferred tax assets can be realised.
MAT credit is recognised as an asset only when and to the extent there is convincing evidence that the Company will pay normal income tax during the specified period. In the year in which the Minimum Alternative Tax (MAT) credit becomes eligible to be recognised as an asset in accordance with the recommendations contained in Guidance Note issued by the Institute of Chartered Accountants of India, the said asset is created by way of a credit to the Statement of Profit & Loss and shown as MAT Credit Entitlement. The Company reviews the same at each balance sheet date and writes down the carrying amount of MAT Credit Entitlement to the extent there is no longer convincing evidence to the effect that Company will pay normal income tax during the specified period.
p) Earnings Per ShareBasic earnings per share is calculated by dividing the net profit or loss for the year attributable to equity shareholders by the weighted average number of equity shares outstanding during the year.
For the purpose of calculating diluted earning per share, the net profit or loss for the year attributable to equity shareholders and the weighted average number of shares outstanding during the year are adjusted for the effects of all dilutive potential equity shares.
q) ProvisionsA provision is recognised when an enterprise has a present obligation as a result of past event and it is probable that an outflow of resources will be required to settle the
obligation, in respect of which a reliable estimate can be made. Provisions are not discounted to its present value and are determined based on best management estimate required to settle the obligation at the balance sheet date. These are reviewed at each Balance Sheet date and adjusted to reflect the current best management estimates.
r) Segment Reporting PoliciesAs the Company’s business activity primarily falls within a single business and geographical segment, thus there are no additional disclosures to be provided under Accounting Standard 17 – “Segment Reporting’. The management considers that the various goods and services provided by the Company constitutes single business segment, since the risk and rewards from these services are not different from one another. The Company’s operating businesses are organised and managed separately according to the nature of products and services provided, with each segment representing a strategic business unit that offers different products and serves different markets. The analysis of geographical segments is based on geographical location of the customers.
The geographical segments considered for disclosure are as follows:
within India
outside India
s) Cash Flow StatementCash flows are reported using indirect method, whereby profit before tax is adjusted for the effects transactions of a non-cash nature and any deferrals or accruals of past or future cash receipts or payments. The cash flows from regular revenue generating, financing and investing activities of the Company are segregated. Cash and cash equivalents in the cash flow comprise cash at bank, cash/cheques in hand and short-term investments with an original maturity of three months or less.
t) Employee Stock Compensation CostMeasurement and disclosure of the employee share-based payment plans is done in accordance with SEBI (Employee Stock Option Scheme and Employee Stock Purchase Scheme) Guidelines, 1999 and the Guidance Note on Accounting for Employee Share-based Payments, issued by the Institute of Chartered Accountants of India. The Company measures compensation cost relating to employee stock options using the intrinsic value method.
Notes forming part of the Consolidated Financial Statements for the year ended March 31, 2012 (Contd.)
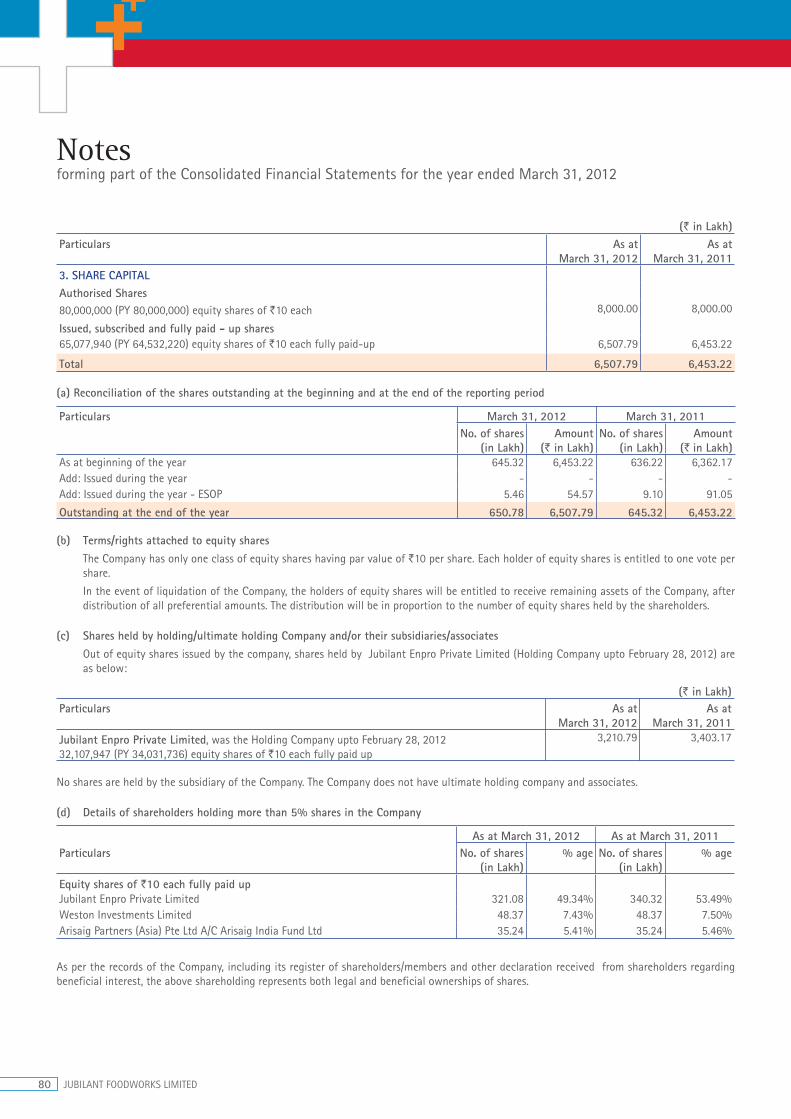
80 JUBILANT FOODWORKS LIMITED
(` in Lakh)Particulars As at
March 31, 2012As at
March 31, 20113. SHARE CAPITALAuthorised Shares80,000,000 (PY 80,000,000) equity shares of `10 each 8,000.00 8,000.00
Issued, subscribed and fully paid - up shares65,077,940 (PY 64,532,220) equity shares of `10 each fully paid-up 6,507.79 6,453.22
Total 6,507.79 6,453.22
(a) Reconciliation of the shares outstanding at the beginning and at the end of the reporting period
Particulars March 31, 2012 March 31, 2011No. of shares
(in Lakh) Amount
(` in Lakh) No. of shares
(in Lakh) Amount
(` in Lakh)As at beginning of the year 645.32 6,453.22 636.22 6,362.17 Add: Issued during the year - - - - Add: Issued during the year - ESOP 5.46 54.57 9.10 91.05
Outstanding at the end of the year 650.78 6,507.79 645.32 6,453.22
(b) Terms/rights attached to equity shares The Company has only one class of equity shares having par value of `10 per share. Each holder of equity shares is entitled to one vote per
share.
In the event of liquidation of the Company, the holders of equity shares will be entitled to receive remaining assets of the Company, after distribution of all preferential amounts. The distribution will be in proportion to the number of equity shares held by the shareholders.
(c) Shares held by holding/ultimate holding Company and/or their subsidiaries/associatesOut of equity shares issued by the company, shares held by Jubilant Enpro Private Limited (Holding Company upto February 28, 2012) are as below:
(` in Lakh)Particulars As at
March 31, 2012As at
March 31, 2011Jubilant Enpro Private Limited, was the Holding Company upto February 28, 2012 32,107,947 (PY 34,031,736) equity shares of `10 each fully paid up
3,210.79 3,403.17
No shares are held by the subsidiary of the Company. The Company does not have ultimate holding company and associates.
(d) Details of shareholders holding more than 5% shares in the Company
As at March 31, 2012 As at March 31, 2011Particulars No. of shares
(in Lakh) % age No. of shares
(in Lakh) % age
Equity shares of `10 each fully paid upJubilant Enpro Private Limited 321.08 49.34% 340.32 53.49%Weston Investments Limited 48.37 7.43% 48.37 7.50%Arisaig Partners (Asia) Pte Ltd A/C Arisaig India Fund Ltd 35.24 5.41% 35.24 5.46%
As per the records of the Company, including its register of shareholders/members and other declaration received from shareholders regarding beneficial interest, the above shareholding represents both legal and beneficial ownerships of shares.
Notes forming part of the Consolidated Financial Statements for the year ended March 31, 2012

ANNUAL REPORT 2011-12 81
Notes forming part of the Consolidated Financial Statements for the year ended March 31, 2012 (Contd.)
(` in Lakh)Particulars As at
March 31, 2012 As at
March 31, 20114. RESERVES & SURPLUSSecurities Premium Reserve:Balance as per last financial statements 9,545.75 9,291.63 Add: Premium on issue of equity shares 167.55 254.12
Closing Balance (A) 9,713.30 9,545.75 Surplus/(deficit) in the statement of profit and lossBalance as per last financial statements 3,143.28 (4,030.23)Add: Profit for the year 10,329.04 7,173.51
Net surplus in the statement of profit & loss account (B) 13,472.32 3,143.28 Employee Stock option outstanding*Foreign Currency Translation Reserve (63.20) (2.78)
Total (A+B) 23,122.42 12,686.25 * The outstanding option under the ESOP Plan 2007 at the end of year are 746,667 (PY 1,292,387) Equity Shares & outstanding option under the ESOP Plan 2011 at the end of year are 230,100 (PY Nil) (Refer note 29)
5. OTHER LONG TERM LIABILITIESTradeCreditors 372.99 248.09
OthersSecurity deposits 13.00 13.00
Total 385.99 261.09
6. LONG TERM PROVISIONProvision for employee benefits - Gratuity (Refer Note 32) 225.47 316.95- Leave benefits 340.13 230.07
Total 565.60 547.02
7. TRADE PAYABLECreditors for goods and services (Refer note 34 for details of dues to micro and small enterprises) 10,958.61 7,754.42
Total 10,958.61 7,754.42
8. OTHER CURRENT LIABILITIESSecurity deposits 42.54 23.74Unearned Income 56.81 60.95Book overdraft 1,334.71 990.18Investor Education and Protection Fund shall be credited by following amounts (as and when due)- Unpaid application money received for allotment of shares and due for refund 0.29 0.29
OthersCreditors for Capital goods 1,463.71 753.71Statutory dues 1,475.83 1,015.13
Total 4,373.89 2,844.00
9. SHORT TERM PROVISIONSProvision for employee benefits- Gratuity (Refer Note 32) 5.27 17.37- Leave benefits 98.81 80.78
Total 104.08 98.15

82 JUBILANT FOODWORKS LIMITED
Notes forming part of the Consolidated Financial Statements for the year ended March 31, 2012 (Contd.)
10. F
IXED
ASS
ETS
(` in
Lak
h)Pa
rtic
ular
s Gr
oss
Bloc
kDe
prec
iatio
n / A
mor
tisat
ion
Net
Blo
ckAs
at
01-0
4-11
Addi
tion
durin
g th
e ye
ar
Dele
tions
du
ring
the
year
As a
t 31
-03-
12As
at
01-0
4-11
For
the
Year
(R
efer
not
e 37
)
Dele
tions
du
ring
the
year
As a
t 31
-03-
12As
at
31-0
3-12
As A
t 3
1-03
-11
Tang
ible
Ass
ets
Free
hold
Lan
d 3
.41
-
-
3.4
1 -
-
-
-
3
.41
3.4
1 Le
aseh
old
Impr
ovem
ents
8
,796
.35
3,6
92.9
1 1
80.3
2 1
2,30
8.94
2
,618
.68
1,1
37.5
3 1
40.7
7 3
,615
.44
8,6
93.5
0 6
,177
.67
Plan
t &
Mac
hine
ry
14,
519.
77
5,1
28.6
4 7
74.5
5 1
8,87
3.86
5
,565
.27
1,4
91.7
2 5
33.9
1 6
,523
.08
12,
350.
78
8,9
54.5
0 O
ffic
e Eq
uipm
ent
349
.25
80.
00
30.
95
398
.30
165
.06
45.
23
27.
22
183
.07
215
.23
184
.19
Furn
iture
& F
ixtu
res
1,9
41.9
9 9
15.7
0 5
1.58
2
,806
.11
996
.50
444
.32
42.
84
1,3
97.9
8 1
,408
.13
945
.49
Vehi
cles
2
,495
.45
995
.56
166
.49
3,3
24.5
2 1
,255
.17
470
.08
158
.32
1,5
66.9
3 1
,757
.59
1,2
40.2
8 In
tang
ible
Ass
ets
St
ore
Ope
ning
Fee
s &
Ter
ritor
y Fe
es
724
.46
697
.19
-
1,4
21.6
5 3
08.8
0 1
56.0
9 -
4
64.8
9 9
56.7
6 4
15.6
6 So
ftw
are
212
.09
-
-
212
.09
118
.51
52.
36
-
170
.87
41.
22
93.
58
Tot
al
29,
042.
77
11,
510.
00
1,2
03.8
9 3
9,34
8.88
1
1,02
7.99
3
,797
.33
903
.06
13,
922.
26
25,
426.
62
18,
014.
78
Capi
tal W
ork
in P
rogr
ess
(Ref
er n
ote
33)
Tang
ible
Ass
ets
1,3
53.8
8 3
39.4
9 1
,353
.88
339
.49
Tot
al
29,
042.
77
11,
510.
00
1,2
03.8
9 3
9,34
8.88
1
1,02
7.99
3
,797
.33
903
.06
13,
922.
26
26,
780.
50
18,
354.
27
Prev
ious
Yea
r 2
2,75
5.41
7
,000
.12
712
.76
29,
042.
77
8,7
23.4
4 2
,933
.88
629
.33
11,
027.
99
18,
354.
27
14,
279.
34
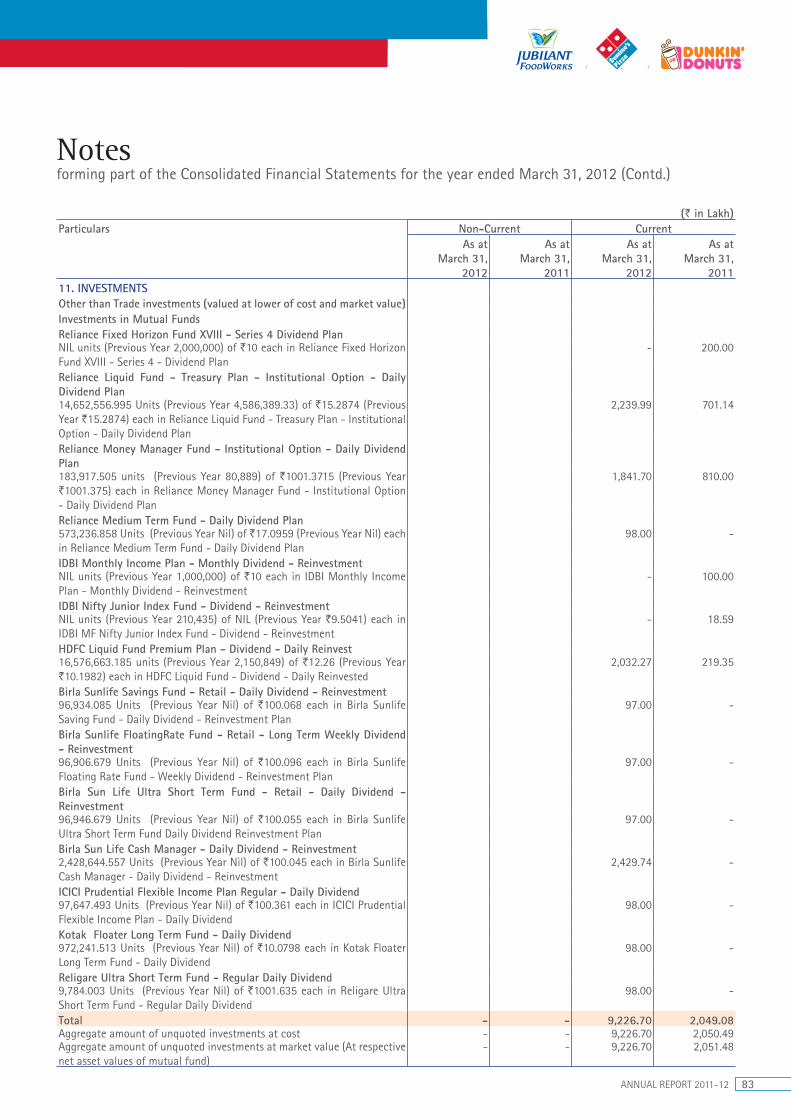
ANNUAL REPORT 2011-12 83
(` in Lakh)Particulars Non-Current Current
As at March 31,
2012
As at March 31,
2011
As at March 31,
2012
As at March 31,
201111. INVESTMENTSOther than Trade investments (valued at lower of cost and market value)Investments in Mutual FundsReliance Fixed Horizon Fund XVIII - Series 4 Dividend PlanNIL units (Previous Year 2,000,000) of `10 each in Reliance Fixed Horizon Fund XVIII - Series 4 - Dividend Plan
- 200.00
Reliance Liquid Fund - Treasury Plan - Institutional Option - Daily Dividend Plan14,652,556.995 Units (Previous Year 4,586,389.33) of `15.2874 (Previous Year `15.2874) each in Reliance Liquid Fund - Treasury Plan - Institutional Option - Daily Dividend Plan
2,239.99 701.14
Reliance Money Manager Fund - Institutional Option - Daily Dividend Plan183,917.505 units (Previous Year 80,889) of `1001.3715 (Previous Year `1001.375) each in Reliance Money Manager Fund - Institutional Option - Daily Dividend Plan
1,841.70 810.00
Reliance Medium Term Fund - Daily Dividend Plan573,236.858 Units (Previous Year Nil) of `17.0959 (Previous Year Nil) each in Reliance Medium Term Fund - Daily Dividend Plan
98.00 -
IDBI Monthly Income Plan - Monthly Dividend - ReinvestmentNIL units (Previous Year 1,000,000) of `10 each in IDBI Monthly Income Plan - Monthly Dividend - Reinvestment
- 100.00
IDBI Nifty Junior Index Fund - Dividend - ReinvestmentNIL units (Previous Year 210,435) of NIL (Previous Year `9.5041) each in IDBI MF Nifty Junior Index Fund - Dividend - Reinvestment
- 18.59
HDFC Liquid Fund Premium Plan - Dividend - Daily Reinvest16,576,663.185 units (Previous Year 2,150,849) of `12.26 (Previous Year `10.1982) each in HDFC Liquid Fund - Dividend - Daily Reinvested
2,032.27 219.35
Birla Sunlife Savings Fund - Retail - Daily Dividend - Reinvestment96,934.085 Units (Previous Year Nil) of `100.068 each in Birla Sunlife Saving Fund - Daily Dividend - Reinvestment Plan
97.00 -
Birla Sunlife FloatingRate Fund - Retail - Long Term Weekly Dividend - Reinvestment96,906.679 Units (Previous Year Nil) of `100.096 each in Birla Sunlife Floating Rate Fund - Weekly Dividend - Reinvestment Plan
97.00 -
Birla Sun Life Ultra Short Term Fund - Retail - Daily Dividend - Reinvestment 96,946.679 Units (Previous Year Nil) of `100.055 each in Birla Sunlife Ultra Short Term Fund Daily Dividend Reinvestment Plan
97.00 -
Birla Sun Life Cash Manager - Daily Dividend - Reinvestment2,428,644.557 Units (Previous Year Nil) of `100.045 each in Birla Sunlife Cash Manager - Daily Dividend - Reinvestment
2,429.74 -
ICICI Prudential Flexible Income Plan Regular - Daily Dividend 97,647.493 Units (Previous Year Nil) of `100.361 each in ICICI Prudential Flexible Income Plan - Daily Dividend
98.00 -
Kotak Floater Long Term Fund - Daily Dividend972,241.513 Units (Previous Year Nil) of `10.0798 each in Kotak Floater Long Term Fund - Daily Dividend
98.00 -
Religare Ultra Short Term Fund - Regular Daily Dividend9,784.003 Units (Previous Year Nil) of `1001.635 each in Religare Ultra Short Term Fund - Regular Daily Dividend
98.00 -
Total - - 9,226.70 2,049.08 Aggregate amount of unquoted investments at cost - - 9,226.70 2,050.49 Aggregate amount of unquoted investments at market value (At respective net asset values of mutual fund)
- - 9,226.70 2,051.48
Notes forming part of the Consolidated Financial Statements for the year ended March 31, 2012 (Contd.)
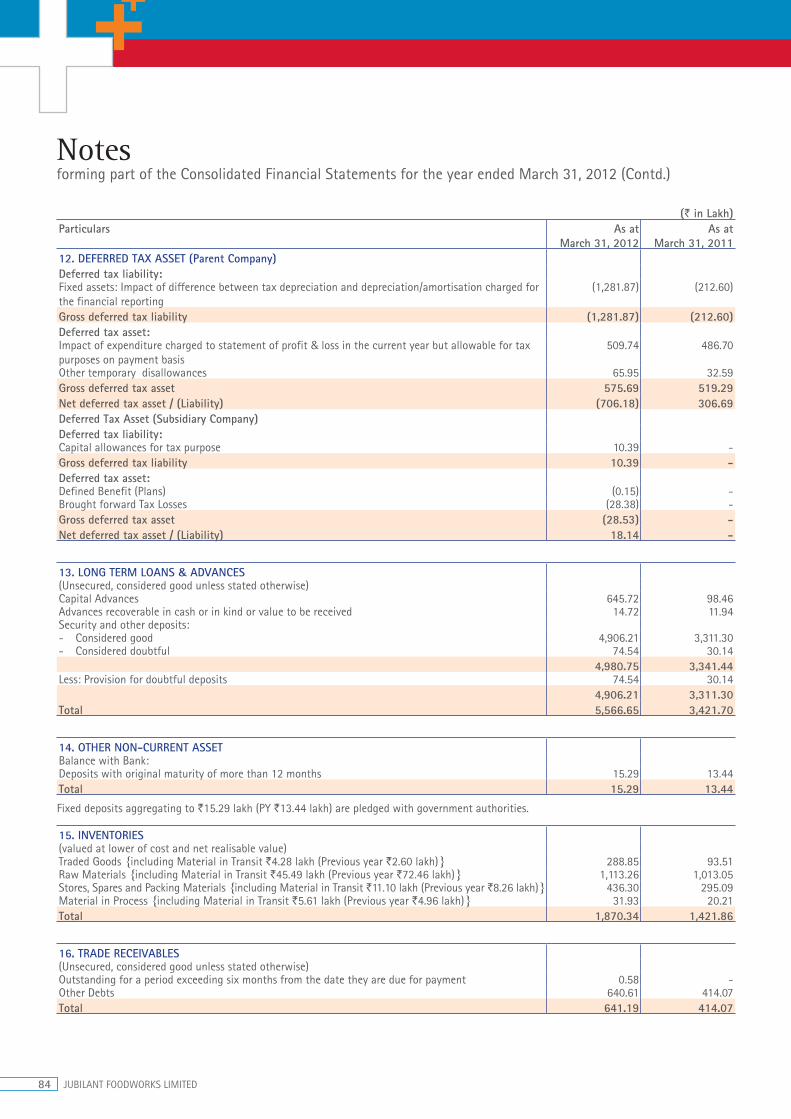
84 JUBILANT FOODWORKS LIMITED
(` in Lakh)Particulars As at
March 31, 2012As at
March 31, 201112. DEFERRED TAX ASSET (Parent Company)Deferred tax liability:Fixed assets: Impact of difference between tax depreciation and depreciation/amortisation charged for the financial reporting
(1,281.87) (212.60)
Gross deferred tax liability (1,281.87) (212.60) Deferred tax asset:Impact of expenditure charged to statement of profit & loss in the current year but allowable for tax purposes on payment basis
509.74 486.70
Other temporary disallowances 65.95 32.59 Gross deferred tax asset 575.69 519.29 Net deferred tax asset / (Liability) (706.18) 306.69 Deferred Tax Asset (Subsidiary Company)Deferred tax liability:Capital allowances for tax purpose 10.39 - Gross deferred tax liability 10.39 - Deferred tax asset:Defined Benefit (Plans) (0.15) - Brought forward Tax Losses (28.38) - Gross deferred tax asset (28.53) - Net deferred tax asset / (Liability) 18.14 -
13. LONG TERM LOANS & ADVANCES(Unsecured, considered good unless stated otherwise)Capital Advances 645.72 98.46 Advances recoverable in cash or in kind or value to be received 14.72 11.94 Security and other deposits:- Considered good 4,906.21 3,311.30 - Considered doubtful 74.54 30.14
4,980.75 3,341.44 Less: Provision for doubtful deposits 74.54 30.14
4,906.21 3,311.30 Total 5,566.65 3,421.70
14. OTHER NON-CURRENT ASSETBalance with Bank:Deposits with original maturity of more than 12 months 15.29 13.44 Total 15.29 13.44
Fixed deposits aggregating to `15.29 lakh (PY `13.44 lakh) are pledged with government authorities.
15. INVENTORIES(valued at lower of cost and net realisable value)Traded Goods {including Material in Transit `4.28 lakh (Previous year `2.60 lakh)} 288.85 93.51 Raw Materials {including Material in Transit `45.49 lakh (Previous year `72.46 lakh)} 1,113.26 1,013.05 Stores, Spares and Packing Materials {including Material in Transit `11.10 lakh (Previous year `8.26 lakh)} 436.30 295.09 Material in Process {including Material in Transit `5.61 lakh (Previous year `4.96 lakh)} 31.93 20.21 Total 1,870.34 1,421.86
16. TRADE RECEIVABLES(Unsecured, considered good unless stated otherwise)Outstanding for a period exceeding six months from the date they are due for payment 0.58 - Other Debts 640.61 414.07 Total 641.19 414.07
Notes forming part of the Consolidated Financial Statements for the year ended March 31, 2012 (Contd.)

ANNUAL REPORT 2011-12 85
Notes forming part of the Consolidated Financial Statements for the year ended March 31, 2012 (Contd.)
(` in Lakh)Particulars As at
March 31, 2012As at
March 31, 201117. CASH AND BANK BALANCESCash and cash equivalentsCash in hand 602.84 502.93 Cheques in hand 32.44 27.67 Balances with scheduled banks in:- Current accounts 450.85 361.50 Total (A) 1,086.13 892.10 Other bank balancesBalances with scheduled banks in IPO refund account 0.29 0.29 Deposits with original maturity for more than 3 months but less than 12 months 207.36 10.87 Deposits pledged with government authorities 15.29 13.44 Less: Amount disclosed under non-current assets (refer note 14) 15.29 13.44[Fixed deposits aggregating to `15.29 lakh (PY `13.44 lakh) are pledged with government authorities]Total (B) 207.65 11.16Total (A+ B) 1,293.78 903.26
18. SHORT TERM LOANS AND ADVANCES(Unsecured, considered good unless stated otherwise)Advances recoverable in cash or in kind or value to be received:- Considered good 855.76 589.84 - Considered doubtful 128.73 47.04
984.49 636.88 Less: Provision for doubtful advanvces 128.73 47.04
855.76 589.84 Loan given to JFL Employees Welfare Trust (Refer note no. 29) 300.10 - Advance tax (Net of provision for tax) 154.10 83.94 Inter Corporate deposits - 3,000.00 Total 1,309.96 3,673.78
19. OTHER CURRENT ASSETSInsurance claim recoverable 2.01 0.12 Interest accrued on inter corporate deposits - 85.88 Total 2.01 86.00
20. REVENUE FROM OPERATIONSSale of products:Manufactured goods 90,800.75 62,396.87 Traded goods 11,063.57 5,410.67 Other operating income:Sub-franchisee Income 24.04 20.19 Revenue from operation (Net) 101,888.36 67,827.73 Details of products sold:Manufactured goods soldPizza 79,406.57 53,459.73 Other 11,394.18 8,937.14 Total 90,800.75 62,396.87 Traded goods soldBeverages 3,615.47 2,419.07 Dessert 5,817.71 2,991.60 Others 1,630.39 - Total 11,063.57 5,410.67
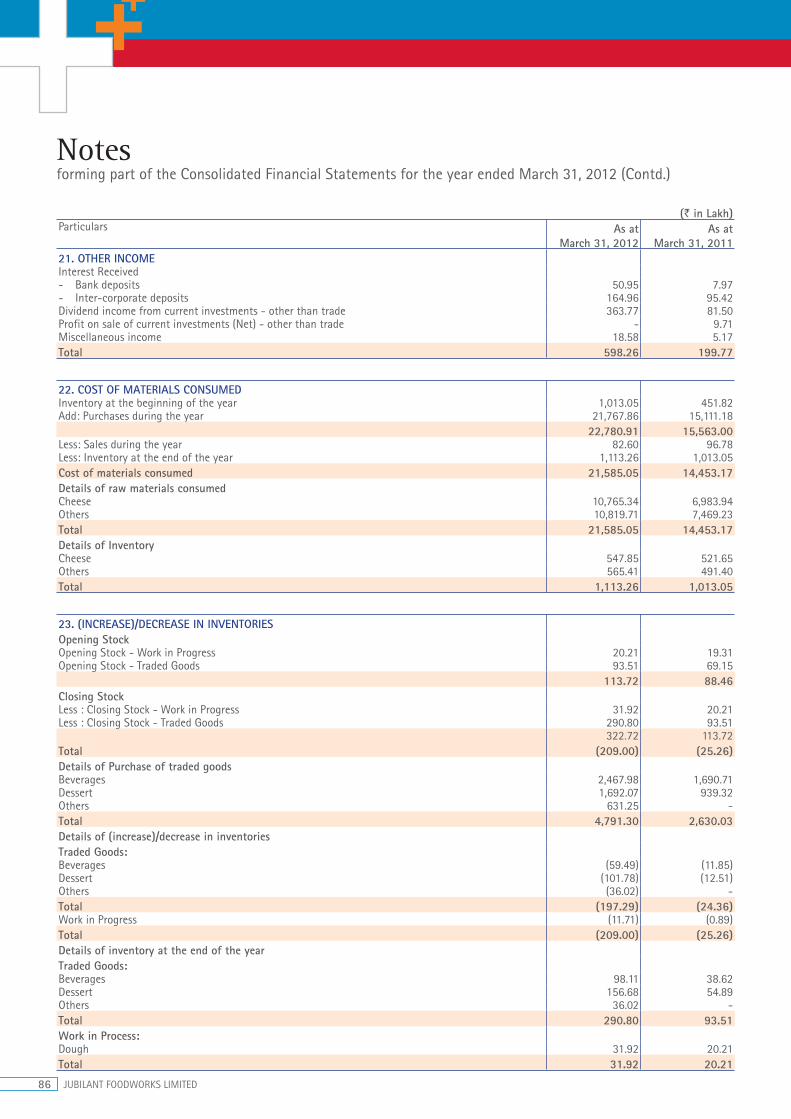
86 JUBILANT FOODWORKS LIMITED
Notes forming part of the Consolidated Financial Statements for the year ended March 31, 2012 (Contd.)
(` in Lakh)Particulars As at
March 31, 2012As at
March 31, 201121. OTHER INCOMEInterest Received- Bank deposits 50.95 7.97 - Inter-corporate deposits 164.96 95.42 Dividend income from current investments - other than trade 363.77 81.50 Profit on sale of current investments (Net) - other than trade - 9.71 Miscellaneous income 18.58 5.17 Total 598.26 199.77
22. COST OF MATERIALS CONSUMEDInventory at the beginning of the year 1,013.05 451.82 Add: Purchases during the year 21,767.86 15,111.18
22,780.91 15,563.00 Less: Sales during the year 82.60 96.78Less: Inventory at the end of the year 1,113.26 1,013.05Cost of materials consumed 21,585.05 14,453.17 Details of raw materials consumedCheese 10,765.34 6,983.94 Others 10,819.71 7,469.23 Total 21,585.05 14,453.17 Details of InventoryCheese 547.85 521.65 Others 565.41 491.40 Total 1,113.26 1,013.05
23. (INCREASE)/DECREASE IN INVENTORIESOpening StockOpening Stock - Work in Progress 20.21 19.31 Opening Stock - Traded Goods 93.51 69.15
113.72 88.46 Closing Stock Less : Closing Stock - Work in Progress 31.92 20.21Less : Closing Stock - Traded Goods 290.80 93.51
322.72 113.72Total (209.00) (25.26)Details of Purchase of traded goodsBeverages 2,467.98 1,690.71 Dessert 1,692.07 939.32 Others 631.25 - Total 4,791.30 2,630.03 Details of (increase)/decrease in inventoriesTraded Goods:Beverages (59.49) (11.85)Dessert (101.78) (12.51)Others (36.02) - Total (197.29) (24.36)Work in Progress (11.71) (0.89)Total (209.00) (25.26)Details of inventory at the end of the yearTraded Goods:Beverages 98.11 38.62 Dessert 156.68 54.89 Others 36.02 - Total 290.80 93.51Work in Process:Dough 31.92 20.21 Total 31.92 20.21
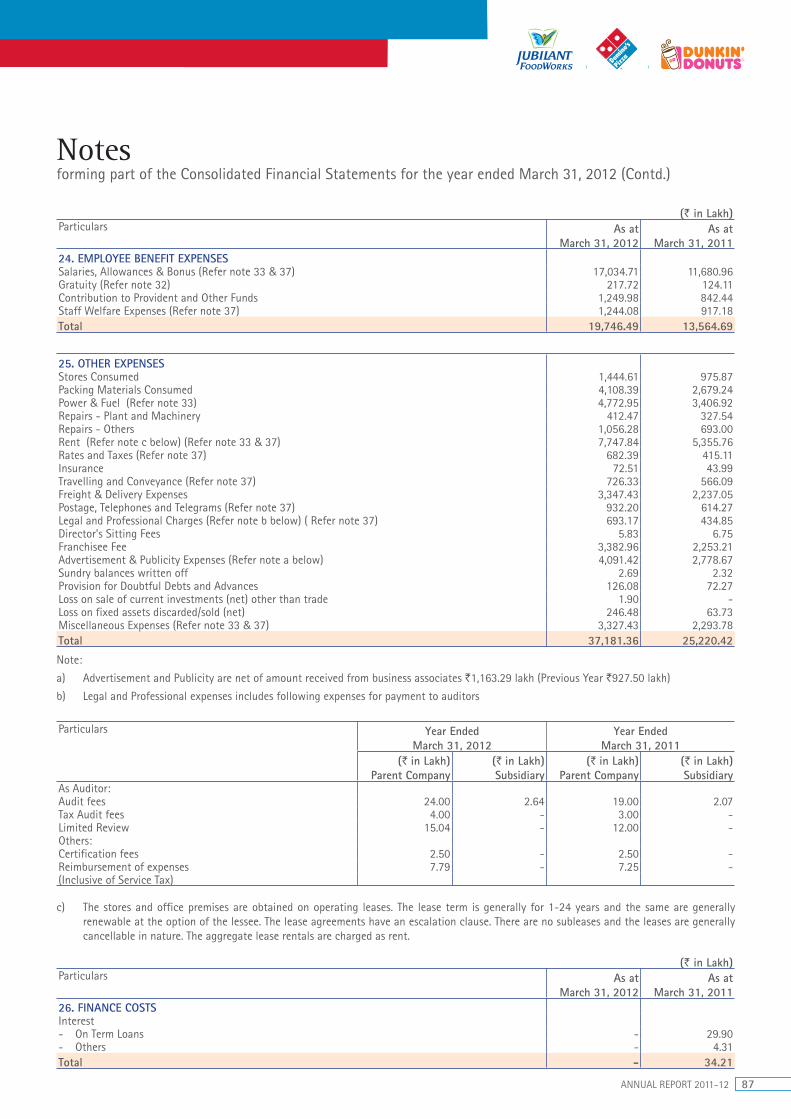
ANNUAL REPORT 2011-12 87
(` in Lakh)Particulars As at
March 31, 2012As at
March 31, 201124. EMPLOYEE BENEFIT EXPENSESSalaries, Allowances & Bonus (Refer note 33 & 37) 17,034.71 11,680.96 Gratuity (Refer note 32) 217.72 124.11 Contribution to Provident and Other Funds 1,249.98 842.44 Staff Welfare Expenses (Refer note 37) 1,244.08 917.18 Total 19,746.49 13,564.69
25. OTHER EXPENSES Stores Consumed 1,444.61 975.87 Packing Materials Consumed 4,108.39 2,679.24 Power & Fuel (Refer note 33) 4,772.95 3,406.92 Repairs - Plant and Machinery 412.47 327.54 Repairs - Others 1,056.28 693.00 Rent (Refer note c below) (Refer note 33 & 37) 7,747.84 5,355.76 Rates and Taxes (Refer note 37) 682.39 415.11 Insurance 72.51 43.99 Travelling and Conveyance (Refer note 37) 726.33 566.09 Freight & Delivery Expenses 3,347.43 2,237.05 Postage, Telephones and Telegrams (Refer note 37) 932.20 614.27 Legal and Professional Charges (Refer note b below) ( Refer note 37) 693.17 434.85 Director's Sitting Fees 5.83 6.75 Franchisee Fee 3,382.96 2,253.21 Advertisement & Publicity Expenses (Refer note a below) 4,091.42 2,778.67 Sundry balances written off 2.69 2.32 Provision for Doubtful Debts and Advances 126.08 72.27 Loss on sale of current investments (net) other than trade 1.90 - Loss on fixed assets discarded/sold (net) 246.48 63.73 Miscellaneous Expenses (Refer note 33 & 37) 3,327.43 2,293.78 Total 37,181.36 25,220.42
Note:
a) Advertisement and Publicity are net of amount received from business associates `1,163.29 lakh (Previous Year `927.50 lakh)
b) Legal and Professional expenses includes following expenses for payment to auditors
Particulars Year EndedMarch 31, 2012
Year EndedMarch 31, 2011
(` in Lakh) Parent Company
(` in Lakh) Subsidiary
(` in Lakh) Parent Company
(` in Lakh) Subsidiary
As Auditor:Audit fees 24.00 2.64 19.00 2.07 Tax Audit fees 4.00 - 3.00 - Limited Review 15.04 - 12.00 - Others:Certification fees 2.50 - 2.50 - Reimbursement of expenses 7.79 - 7.25 - (Inclusive of Service Tax)
c) The stores and office premises are obtained on operating leases. The lease term is generally for 1-24 years and the same are generally renewable at the option of the lessee. The lease agreements have an escalation clause. There are no subleases and the leases are generally cancellable in nature. The aggregate lease rentals are charged as rent.
(` in Lakh)Particulars As at
March 31, 2012As at
March 31, 201126. FINANCE COSTSInterest- On Term Loans - 29.90 - Others - 4.31 Total - 34.21
Notes forming part of the Consolidated Financial Statements for the year ended March 31, 2012 (Contd.)
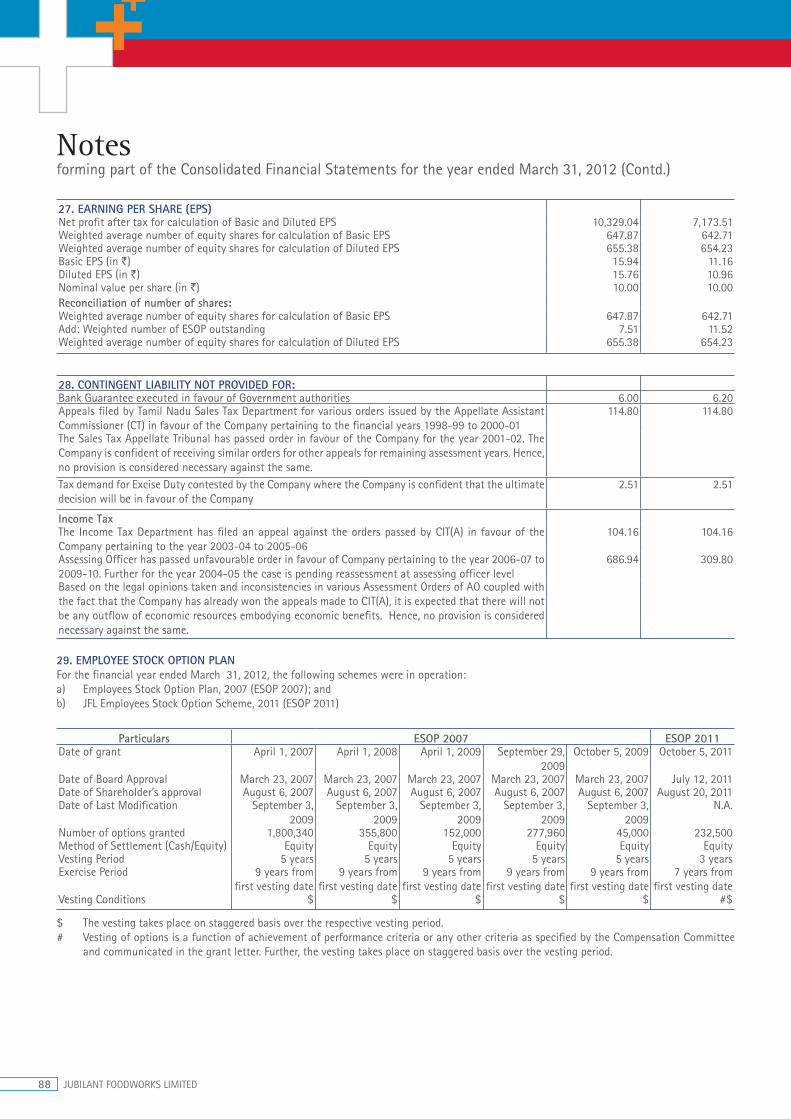
88 JUBILANT FOODWORKS LIMITED
27. EARNING PER SHARE (EPS)Net profit after tax for calculation of Basic and Diluted EPS 10,329.04 7,173.51Weighted average number of equity shares for calculation of Basic EPS 647.87 642.71Weighted average number of equity shares for calculation of Diluted EPS 655.38 654.23Basic EPS (in `) 15.94 11.16 Diluted EPS (in `) 15.76 10.96 Nominal value per share (in `) 10.00 10.00 Reconciliation of number of shares:Weighted average number of equity shares for calculation of Basic EPS 647.87 642.71Add: Weighted number of ESOP outstanding 7.51 11.52Weighted average number of equity shares for calculation of Diluted EPS 655.38 654.23
28. CONTINGENT LIABILITY NOT PROVIDED FOR:Bank Guarantee executed in favour of Government authorities 6.00 6.20 Appeals filed by Tamil Nadu Sales Tax Department for various orders issued by the Appellate Assistant Commissioner (CT) in favour of the Company pertaining to the financial years 1998-99 to 2000-01
114.80 114.80
The Sales Tax Appellate Tribunal has passed order in favour of the Company for the year 2001-02. The Company is confident of receiving similar orders for other appeals for remaining assessment years. Hence, no provision is considered necessary against the same.Tax demand for Excise Duty contested by the Company where the Company is confident that the ultimate decision will be in favour of the Company
2.51 2.51
Income TaxThe Income Tax Department has filed an appeal against the orders passed by CIT(A) in favour of the Company pertaining to the year 2003-04 to 2005-06
104.16 104.16
Assessing Officer has passed unfavourable order in favour of Company pertaining to the year 2006-07 to 2009-10. Further for the year 2004-05 the case is pending reassessment at assessing officer level
686.94 309.80
Based on the legal opinions taken and inconsistencies in various Assessment Orders of AO coupled with the fact that the Company has already won the appeals made to CIT(A), it is expected that there will not be any outflow of economic resources embodying economic benefits. Hence, no provision is considered necessary against the same.
29. EMPLOYEE STOCK OPTION PLANFor the financial year ended March 31, 2012, the following schemes were in operation:a) Employees Stock Option Plan, 2007 (ESOP 2007); and b) JFL Employees Stock Option Scheme, 2011 (ESOP 2011)
Particulars ESOP 2007 ESOP 2011Date of grant April 1, 2007 April 1, 2008 April 1, 2009 September 29,
2009October 5, 2009 October 5, 2011
Date of Board Approval March 23, 2007 March 23, 2007 March 23, 2007 March 23, 2007 March 23, 2007 July 12, 2011Date of Shareholder’s approval August 6, 2007 August 6, 2007 August 6, 2007 August 6, 2007 August 6, 2007 August 20, 2011Date of Last Modification September 3,
2009September 3,
2009September 3,
2009September 3,
2009September 3,
2009N.A.
Number of options granted 1,800,340 355,800 152,000 277,960 45,000 232,500Method of Settlement (Cash/Equity) Equity Equity Equity Equity Equity EquityVesting Period 5 years 5 years 5 years 5 years 5 years 3 years Exercise Period 9 years from
first vesting date9 years from
first vesting date9 years from
first vesting date9 years from
first vesting date9 years from
first vesting date7 years from
first vesting dateVesting Conditions $ $ $ $ $ #$
$ The vesting takes place on staggered basis over the respective vesting period.# Vesting of options is a function of achievement of performance criteria or any other criteria as specified by the Compensation Committee
and communicated in the grant letter. Further, the vesting takes place on staggered basis over the vesting period.
Notes forming part of the Consolidated Financial Statements for the year ended March 31, 2012 (Contd.)
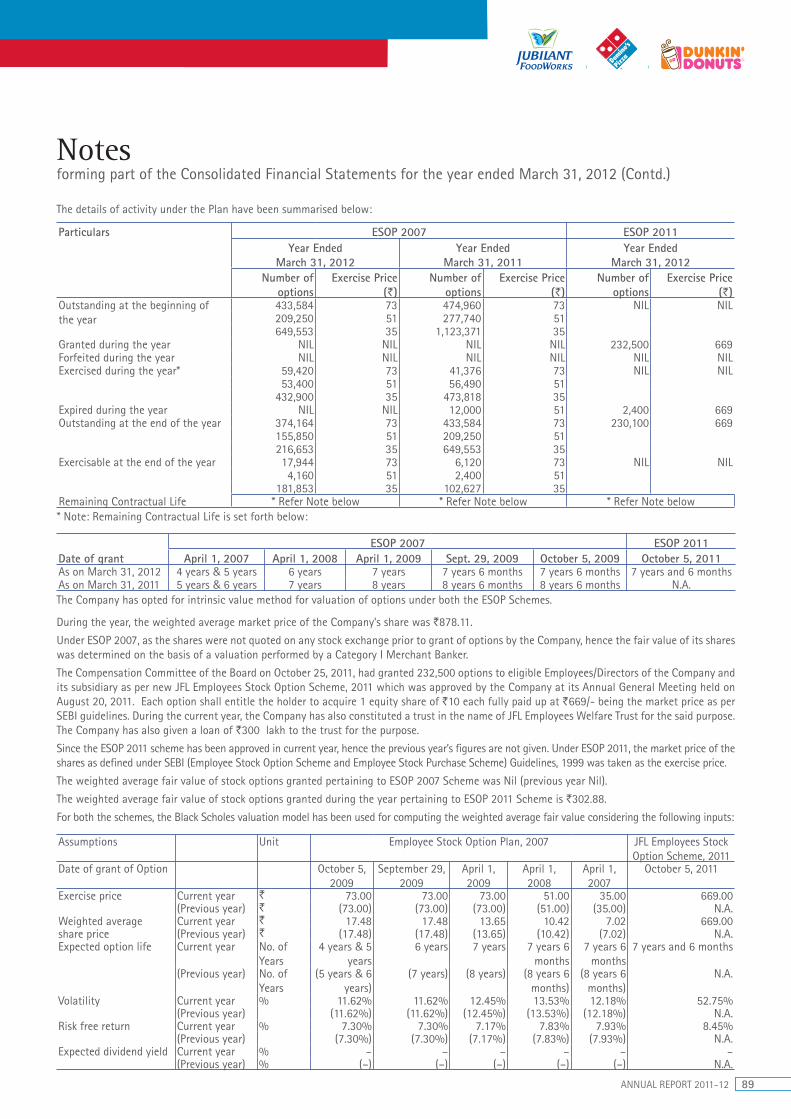
ANNUAL REPORT 2011-12 89
The details of activity under the Plan have been summarised below:
Particulars ESOP 2007 ESOP 2011Year Ended
March 31, 2012Year Ended
March 31, 2011Year Ended
March 31, 2012Number of
optionsExercise Price
(`)Number of
optionsExercise Price
(`)Number of
optionsExercise Price
(`)Outstanding at the beginning of the year
433,584 73 474,960 73 NIL NIL209,250 51 277,740 51649,553 35 1,123,371 35
Granted during the year NIL NIL NIL NIL 232,500 669 Forfeited during the year NIL NIL NIL NIL NIL NILExercised during the year* 59,420 73 41,376 73 NIL NIL
53,400 51 56,490 51432,900 35 473,818 35
Expired during the year NIL NIL 12,000 51 2,400 669 Outstanding at the end of the year 374,164 73 433,584 73 230,100 669
155,850 51 209,250 51216,653 35 649,553 35
Exercisable at the end of the year 17,944 73 6,120 73 NIL NIL4,160 51 2,400 51
181,853 35 102,627 35Remaining Contractual Life * Refer Note below * Refer Note below * Refer Note below* Note: Remaining Contractual Life is set forth below:
ESOP 2007 ESOP 2011Date of grant April 1, 2007 April 1, 2008 April 1, 2009 Sept. 29, 2009 October 5, 2009 October 5, 2011As on March 31, 2012 4 years & 5 years 6 years 7 years 7 years 6 months 7 years 6 months 7 years and 6 monthsAs on March 31, 2011 5 years & 6 years 7 years 8 years 8 years 6 months 8 years 6 months N.A.The Company has opted for intrinsic value method for valuation of options under both the ESOP Schemes.
During the year, the weighted average market price of the Company’s share was `878.11.
Under ESOP 2007, as the shares were not quoted on any stock exchange prior to grant of options by the Company, hence the fair value of its shares was determined on the basis of a valuation performed by a Category I Merchant Banker.
The Compensation Committee of the Board on October 25, 2011, had granted 232,500 options to eligible Employees/Directors of the Company and its subsidiary as per new JFL Employees Stock Option Scheme, 2011 which was approved by the Company at its Annual General Meeting held on August 20, 2011. Each option shall entitle the holder to acquire 1 equity share of `10 each fully paid up at `669/- being the market price as per SEBI guidelines. During the current year, the Company has also constituted a trust in the name of JFL Employees Welfare Trust for the said purpose. The Company has also given a loan of `300 lakh to the trust for the purpose.
Since the ESOP 2011 scheme has been approved in current year, hence the previous year’s figures are not given. Under ESOP 2011, the market price of the shares as defined under SEBI (Employee Stock Option Scheme and Employee Stock Purchase Scheme) Guidelines, 1999 was taken as the exercise price.
The weighted average fair value of stock options granted pertaining to ESOP 2007 Scheme was Nil (previous year Nil).
The weighted average fair value of stock options granted during the year pertaining to ESOP 2011 Scheme is `302.88.
For both the schemes, the Black Scholes valuation model has been used for computing the weighted average fair value considering the following inputs:
Assumptions Unit Employee Stock Option Plan, 2007 JFL Employees Stock Option Scheme, 2011
Date of grant of Option October 5, 2009
September 29, 2009
April 1, 2009
April 1, 2008
April 1, 2007
October 5, 2011
Exercise price Current year ` 73.00 73.00 73.00 51.00 35.00 669.00(Previous year) ` (73.00) (73.00) (73.00) (51.00) (35.00) N.A.
Weighted average Current year ` 17.48 17.48 13.65 10.42 7.02 669.00share price (Previous year) ` (17.48) (17.48) (13.65) (10.42) (7.02) N.A.Expected option life Current year No. of
Years4 years & 5
years6 years 7 years 7 years 6
months7 years 6
months7 years and 6 months
(Previous year) No. of Years
(5 years & 6 years)
(7 years) (8 years) (8 years 6 months)
(8 years 6 months)
N.A.
Volatility Current year % 11.62% 11.62% 12.45% 13.53% 12.18% 52.75%(Previous year) (11.62%) (11.62%) (12.45%) (13.53%) (12.18%) N.A.
Risk free return Current year % 7.30% 7.30% 7.17% 7.83% 7.93% 8.45%(Previous year) (7.30%) (7.30%) (7.17%) (7.83%) (7.93%) N.A.
Expected dividend yield Current year % – – – – – –(Previous year) % (–) (–) (–) (–) (–) N.A.
Notes forming part of the Consolidated Financial Statements for the year ended March 31, 2012 (Contd.)

90 JUBILANT FOODWORKS LIMITED
Notes forming part of the Consolidated Financial Statements for the year ended March 31, 2012 (Contd.)
The expected life of the stock is based on historical data and current market expectations and is not necessarily indicative of exercise patterns that may occur. The expected volatility reflects the assumption that the historical volatility over a period similar to the life of the options is indicative of future trends, which may also not necesssarily be the actual outcome.
The Company measures the cost of ESOP using the intrinsic value method. Had the Company used the fair value method to determine compensation, its profit after tax and earning per share as reported would have changed to the amounts indicated below:
(` in Lakh)Particulars As at
March 31, 2012As at
March 31, 2011Profit after tax as reported 10,329.04 7,173.51 Add: ESOP cost using intrinsic value method - - Less: ESOP cost using fair value method 117.37 - Proforma profit after tax 10,211.67 7,173.51 Earnings per share (in `)Basic- As reported 15.94 11.16 - As proforma 15.76 11.16 Diluted- As reported 15.76 10.96 - As proforma 15.58 10.96
30. RELATED PARTY DISCLOSURE(i) The list of related parties as identified by the management is as under (with whom transactions have occurred during the year):
Name of the Party RelationshipJubilant Enpro Private Limited Holding Company (upto February 28, 2012)JFW Holdings Mauritius Pvt. Ltd.* SubsidiaryJubilant Life Sciences Limited Enterprises owned or significantly influenced by key management personnel or their relativesHT Media LimitedJubilant Agri & Consumer Products LimitedMr. S. S. Bhartia Key Management PersonnelMr. H. S. BhartiaMr. Ajay Kaul
* The Company has incorporated a subsidiary, JFW Holdings Mauritius Pvt. Ltd. at Mauritius on March 15, 2012, however no share and other transaction has been done in the same.
(ii) Transactions with Related parties (` in Lakh)
Particulars Other Parties which significantly influence the
Company
Key Management Personnel Total
March 31, 2012 March 31, 2011 March 31, 2012 March 31, 2011 March 31, 2012 March 31, 2011A) Transactions Charges for services paid to - HT Media Limited 217.74 175.95 - - 217.74 175.95 - Jubilant Life Sciences Limited 36.00 28.80 - - 36.00 28.80 - Jubilant Agri & Consumer Products Limited
22.50 - - - 22.50 -
Director's Sitting Fees - - 1.70 2.15 1.70 2.15 Remuneration to Whole Time Director - Ajay Kaul 275.18 227.56 275.18 227.56 Allotment of Equity Shares – Mr. Ajay Kaul*
68.18 121.40 68.18 121.40
B) Balance outstanding as at the end of the yearCharges for services - HT Media Limited 36.46 56.02 - - 36.46 56.02 - Jubilant Life Sciences Limited - 18.86 - - - 18.86 - Jubilant Agri & Consumer Products Limited
- - - - - -
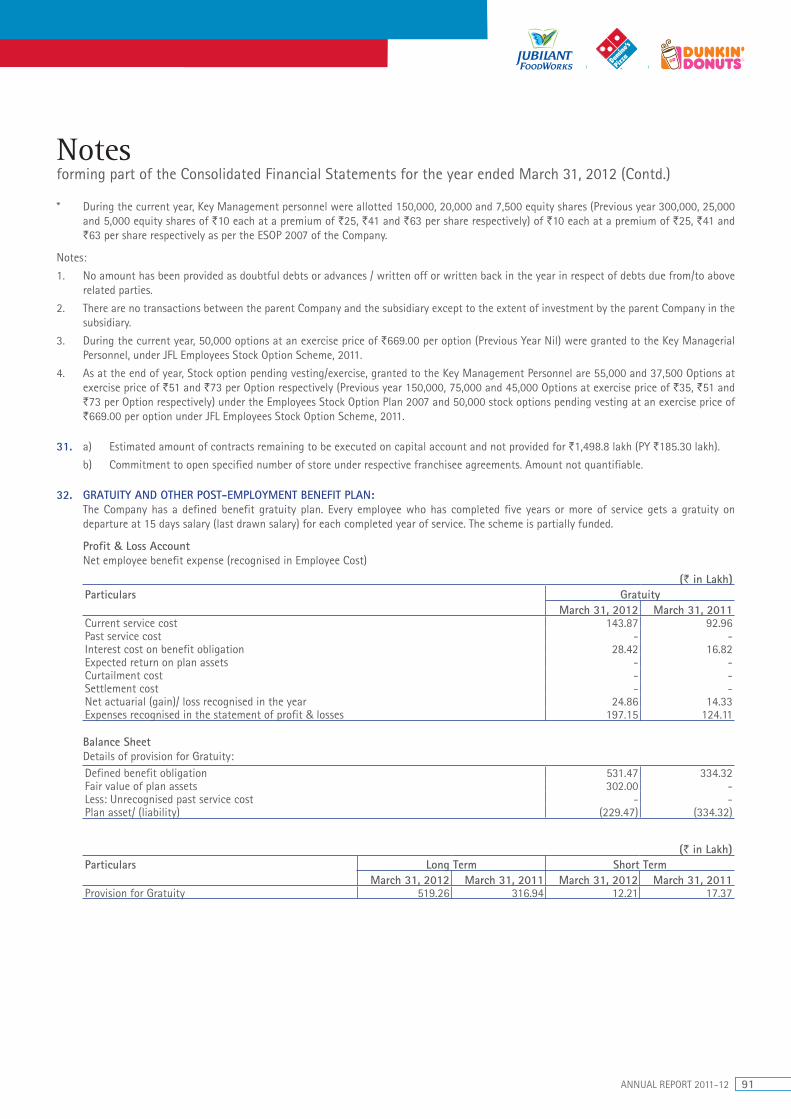
ANNUAL REPORT 2011-12 91
* During the current year, Key Management personnel were allotted 150,000, 20,000 and 7,500 equity shares (Previous year 300,000, 25,000 and 5,000 equity shares of `10 each at a premium of `25, `41 and `63 per share respectively) of `10 each at a premium of `25, `41 and `63 per share respectively as per the ESOP 2007 of the Company.
Notes:
1. No amount has been provided as doubtful debts or advances / written off or written back in the year in respect of debts due from/to above related parties.
2. There are no transactions between the parent Company and the subsidiary except to the extent of investment by the parent Company in the subsidiary.
3. During the current year, 50,000 options at an exercise price of `669.00 per option (Previous Year Nil) were granted to the Key Managerial Personnel, under JFL Employees Stock Option Scheme, 2011.
4. As at the end of year, Stock option pending vesting/exercise, granted to the Key Management Personnel are 55,000 and 37,500 Options at exercise price of `51 and `73 per Option respectively (Previous year 150,000, 75,000 and 45,000 Options at exercise price of `35, `51 and `73 per Option respectively) under the Employees Stock Option Plan 2007 and 50,000 stock options pending vesting at an exercise price of `669.00 per option under JFL Employees Stock Option Scheme, 2011.
31. a) Estimated amount of contracts remaining to be executed on capital account and not provided for `1,498.8 lakh (PY `185.30 lakh).
b) Commitment to open specified number of store under respective franchisee agreements. Amount not quantifiable.
32. GRATUITY AND OTHER POST-EMPLOYMENT BENEFIT PLAN: The Company has a defined benefit gratuity plan. Every employee who has completed five years or more of service gets a gratuity on
departure at 15 days salary (last drawn salary) for each completed year of service. The scheme is partially funded.
Profit & Loss Account Net employee benefit expense (recognised in Employee Cost)
(` in Lakh)Particulars Gratuity
March 31, 2012 March 31, 2011Current service cost 143.87 92.96 Past service cost - - Interest cost on benefit obligation 28.42 16.82 Expected return on plan assets - - Curtailment cost - - Settlement cost - - Net actuarial (gain)/ loss recognised in the year 24.86 14.33 Expenses recognised in the statement of profit & losses 197.15 124.11
Balance SheetDetails of provision for Gratuity:Defined benefit obligation 531.47 334.32 Fair value of plan assets 302.00 - Less: Unrecognised past service cost - - Plan asset/ (liability) (229.47) (334.32)
(` in Lakh)Particulars Long Term Short Term
March 31, 2012 March 31, 2011 March 31, 2012 March 31, 2011Provision for Gratuity 519.26 316.94 12.21 17.37
Notes forming part of the Consolidated Financial Statements for the year ended March 31, 2012 (Contd.)

92 JUBILANT FOODWORKS LIMITED
Changes in the present value of the defined benefit obligation are as follows:
(` in Lakh)Particulars March 31, 2012 March 31, 2011Present value of obligation as at the beginning of the period 334.32 210.21 Acquisition adjustment - - Interest cost 28.42 16.82 Past service cost - - Current service cost 143.87 92.96 Curtailment cost/(Credit) - - Settlement cost/(Credit) - - Benefits paid - - Actuarial (gain)/loss on obligation 24.86 14.33 Present value of obligation as at the end of period 531.47 334.32
Change in the fair value of plan assets are as follows:
(` in Lakh)Particulars March 31, 2012 March 31, 2011Fair value of plan assets at the beginning of the period - - Acquisition adjustment - - Expected return on plan assets - - Contributions 302.00 - Benefits paid - - Actuarial gain/(loss) on plan assets - - Fair value of plan assets at the end of the period 302.00 -
The Company expects to contribute `216.35 lakh (PY `170.87 lakh) to gratuity in the next year.
The principal assumptions used in determining gratuity for the Company’s plans are shown below:Demographic Assumption
Particulars GratuityMarch 31, 2012 March 31, 2011
Discount Rate (%) 8.50 8.00 Future salary increase (%) 6.00 5.50 Expected rate of return on plan assets (%) 8.00 -
The estimates of future salary increases, considered in actuarial valuation, take account of inflation, seniority, promotion and other relevant factors, such as supply and demand in the employment market
March 31, 2012 March 31, 2011Retirement Age 58 YearsMortality Table LIC (1994-96) duly modifiedAges Withdrawal
Rate (%)Withdrawal
Rate (%)Up to 30 years 3.00 3.00 From 31 to 44 years 2.00 2.00 Above 44 years 1.00 1.00
Amounts for the current and previous years are as follows
(` in Lakh)Particulars Gratuity
Year ended March 31, 2012
Year ended March 31, 2011
Year ended March 31, 2010
Year ended March 31, 2009
Year ended March 31, 2008
Defined benefit obligation 531.47 334.32 210.21 148.09 89.20 Plan assets 302.00 - - - - Surplus / (deficit) (229.47) (334.32) (210.21) (148.09) (89.20)Experience loss/(gain) on plan liabilities (25.79) (14.33) 0.92 (17.52) (3.34)
Provident FundThe provident fund being administered by a Trust is a defined benefit scheme whereby the Company deposits an amount determined as a fixed percentage of basic pay to the fund every month. The benefit vest upon commencement of employment. The interest credited to the accounts of the employee is adjusted on an annual basis to confirm to the interest rate declared by the government for the Employees Provident Fund. The Guidance Note on implementing AS-15, Employee Benefits (Revised 2005) issued by the Accounting Standard Board,
Notes forming part of the Consolidated Financial Statements for the year ended March 31, 2012 (Contd.)
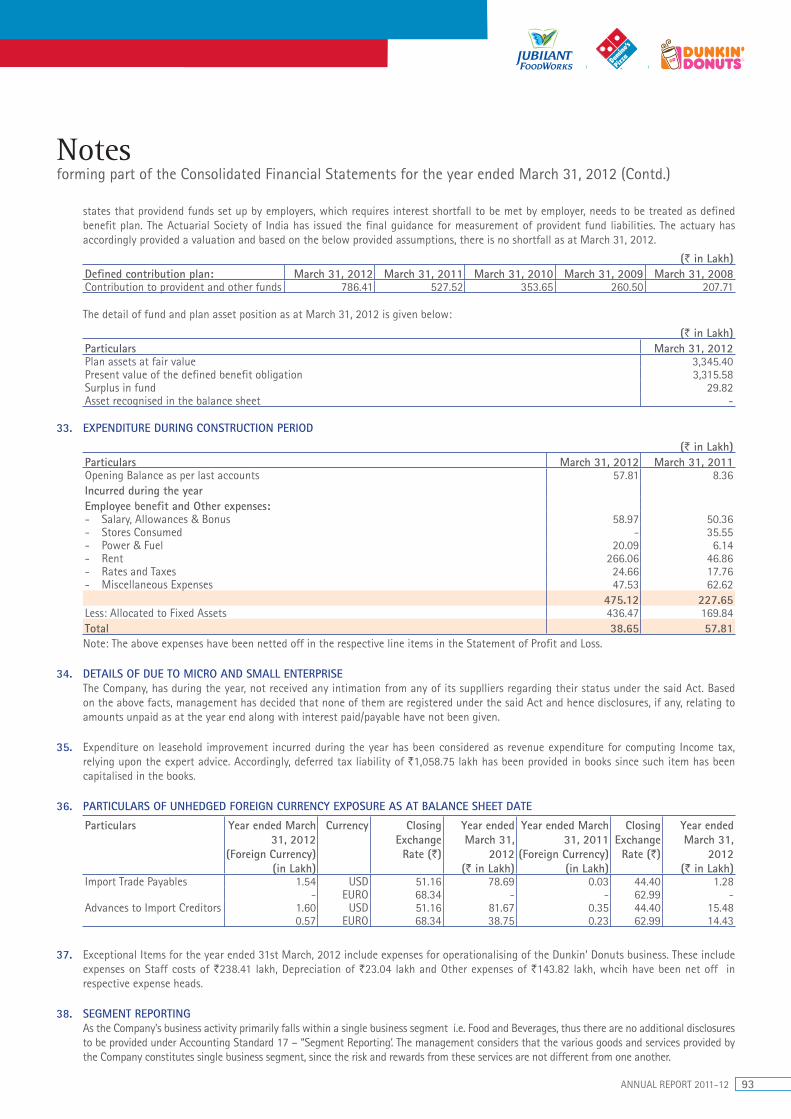
ANNUAL REPORT 2011-12 93
states that providend funds set up by employers, which requires interest shortfall to be met by employer, needs to be treated as defined benefit plan. The Actuarial Society of India has issued the final guidance for measurement of provident fund liabilities. The actuary has accordingly provided a valuation and based on the below provided assumptions, there is no shortfall as at March 31, 2012.
(` in Lakh)Defined contribution plan: March 31, 2012 March 31, 2011 March 31, 2010 March 31, 2009 March 31, 2008Contribution to provident and other funds 786.41 527.52 353.65 260.50 207.71
The detail of fund and plan asset position as at March 31, 2012 is given below:
(` in Lakh)Particulars March 31, 2012Plan assets at fair value 3,345.40 Present value of the defined benefit obligation 3,315.58 Surplus in fund 29.82 Asset recognised in the balance sheet -
33. EXPENDITURE DURING CONSTRUCTION PERIOD
(` in Lakh)Particulars March 31, 2012 March 31, 2011Opening Balance as per last accounts 57.81 8.36 Incurred during the yearEmployee benefit and Other expenses:- Salary, Allowances & Bonus 58.97 50.36 - Stores Consumed - 35.55 - Power & Fuel 20.09 6.14 - Rent 266.06 46.86 - Rates and Taxes 24.66 17.76 - Miscellaneous Expenses 47.53 62.62
475.12 227.65 Less: Allocated to Fixed Assets 436.47 169.84Total 38.65 57.81 Note: The above expenses have been netted off in the respective line items in the Statement of Profit and Loss.
34. DETAILS OF DUE TO MICRO AND SMALL ENTERPRISE The Company, has during the year, not received any intimation from any of its supplliers regarding their status under the said Act. Based
on the above facts, management has decided that none of them are registered under the said Act and hence disclosures, if any, relating to amounts unpaid as at the year end along with interest paid/payable have not been given.
35. Expenditure on leasehold improvement incurred during the year has been considered as revenue expenditure for computing Income tax, relying upon the expert advice. Accordingly, deferred tax liability of `1,058.75 lakh has been provided in books since such item has been capitalised in the books.
36. PARTICULARS OF UNHEDGED FOREIGN CURRENCY EXPOSURE AS AT BALANCE SHEET DATE
Particulars Year ended March 31, 2012
(Foreign Currency) (in Lakh)
Currency Closing Exchange Rate (`)
Year ended March 31,
2012(` in Lakh)
Year ended March 31, 2011
(Foreign Currency) (in Lakh)
Closing Exchange Rate (`)
Year ended March 31,
2012(` in Lakh)
Import Trade Payables 1.54 USD 51.16 78.69 0.03 44.40 1.28 - EURO 68.34 - - 62.99 -
Advances to Import Creditors 1.60 USD 51.16 81.67 0.35 44.40 15.48 0.57 EURO 68.34 38.75 0.23 62.99 14.43
37. Exceptional Items for the year ended 31st March, 2012 include expenses for operationalising of the Dunkin’ Donuts business. These include expenses on Staff costs of `238.41 lakh, Depreciation of `23.04 lakh and Other expenses of `143.82 lakh, whcih have been net off in respective expense heads.
38. SEGMENT REPORTINGAs the Company’s business activity primarily falls within a single business segment i.e. Food and Beverages, thus there are no additional disclosures to be provided under Accounting Standard 17 – “Segment Reporting’. The management considers that the various goods and services provided by the Company constitutes single business segment, since the risk and rewards from these services are not different from one another.
Notes forming part of the Consolidated Financial Statements for the year ended March 31, 2012 (Contd.)

94 JUBILANT FOODWORKS LIMITED
Information about secondary segment The geographical segments considered for disclosure are as follows: * Sales within India include sales to customers located within India. * Sales outside India include sales to customers located outside India.
(` in Lakh)Particulars Revenue Sundry Debtors Fixed Assets Capital Expenditure
during the year2012 2011 2012 2011 2012 2011 2012 2011
India 101,735.55 67,827.74 641.19 446.03 26,232.67 18,296.02 12,017.77 7,106.21Outside India 152.81 - - - 547.82 76.15 564.88 76.12Total 101,888.36 67,827.74 641.19 446.03 26,780.49 18,372.17 12,582.65 7,182.33
39. PREVIOUS YEAR FIGURES Till the year ended March 31, 2011, the Company was using pre-revised Schedule VI to the Companies Act, 1956, for preparation and presentation
of its financial statements. During the year ended March 31, 2012, the revised Schedule VI notified under the Companies Act, 1956, has become applicable to the Company. The Company has reclassified the previous year figures to conform to this year’s classification. The adoption of revised Schedule VI does not impact the recognition and measurement principles followed for preparation of financial statements. However, it significantly impacts presentation and disclosures made in the financial statements, particularly presentation of balance sheet.
Notes forming part of the Consolidated Financial Statements for the year ended March 31, 2012 (Contd.)
As per our report of even date
For S. R. Batliboi & Co. For and on behalf of the Board of Directors of Jubilant FoodWorks LimitedFirm Registration Number: 301003EChartered Accountants
sd/- sd/- sd/- sd/-Per Rajiv Goyal Shyam S. Bhartia Hari S. Bhartia Ajay KaulPartner Chairman Co-Chairman CEO cum Whole Time DirectorMembership No. 94549
sd/- sd/- Mona Aggarwal Ravi S. Gupta Company Secretary President & Chief Financial Officer
Place : Gurgaon Place : NoidaDate : May 10, 2012 Date : May 10, 2012
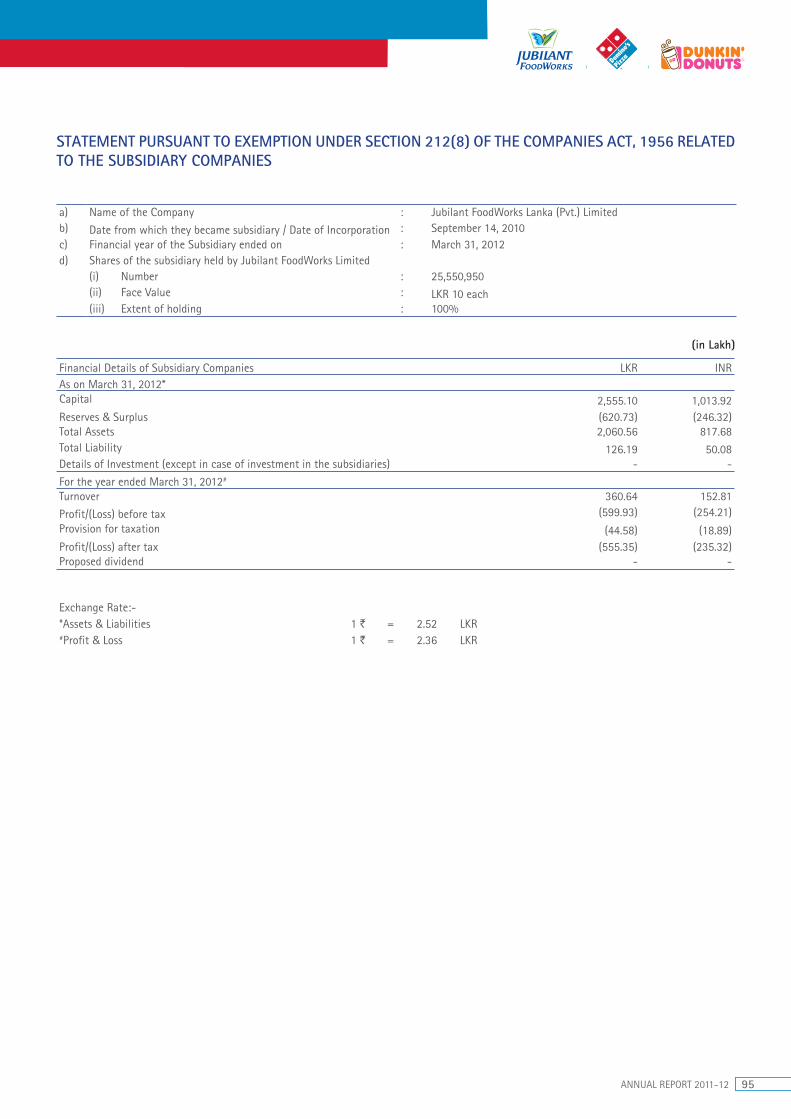
ANNUAL REPORT 2011-12 95
STATEMENT PURSUANT TO EXEMPTION UNDER SECTION 212(8) OF THE COMPANIES ACT, 1956 RELATED TO THE SUBSIDIARY COMPANIES
a) Name of the Company : Jubilant FoodWorks Lanka (Pvt.) Limitedb) Date from which they became subsidiary / Date of Incorporation : September 14, 2010c) Financial year of the Subsidiary ended on : March 31, 2012d) Shares of the subsidiary held by Jubilant FoodWorks Limited
(i) Number : 25,550,950(ii) Face Value : LKR 10 each(iii) Extent of holding : 100%
(in Lakh)
Financial Details of Subsidiary Companies LKR INRAs on March 31, 2012*Capital 2,555.10 1,013.92Reserves & Surplus (620.73) (246.32)Total Assets 2,060.56 817.68Total Liability 126.19 50.08Details of Investment (except in case of investment in the subsidiaries) - -
For the year ended March 31, 2012#
Turnover 360.64 152.81
Profit/(Loss) before tax (599.93) (254.21)Provision for taxation (44.58) (18.89)Profit/(Loss) after tax (555.35) (235.32)Proposed dividend - -
Exchange Rate:-*Assets & Liabilities 1 ` = 2.52 LKR#Profit & Loss 1 ` = 2.36 LKR

Notes
_________________________________________________________________________________________________________________
_________________________________________________________________________________________________________________
_________________________________________________________________________________________________________________
_________________________________________________________________________________________________________________
_________________________________________________________________________________________________________________
_________________________________________________________________________________________________________________
_________________________________________________________________________________________________________________
_________________________________________________________________________________________________________________
_________________________________________________________________________________________________________________
_________________________________________________________________________________________________________________
_________________________________________________________________________________________________________________
_________________________________________________________________________________________________________________
_________________________________________________________________________________________________________________
_________________________________________________________________________________________________________________
_________________________________________________________________________________________________________________
_________________________________________________________________________________________________________________
_________________________________________________________________________________________________________________
_________________________________________________________________________________________________________________
_________________________________________________________________________________________________________________
_________________________________________________________________________________________________________________
_________________________________________________________________________________________________________________
_________________________________________________________________________________________________________________
_________________________________________________________________________________________________________________
_________________________________________________________________________________________________________________
_________________________________________________________________________________________________________________
_________________________________________________________________________________________________________________
_________________________________________________________________________________________________________________
_________________________________________________________________________________________________________________
_________________________________________________________________________________________________________________
_________________________________________________________________________________________________________________
_________________________________________________________________________________________________________________


www.jubilantfoodworks.com
BOOK-POST