delivering life’s essential service
TRANSCRIPT

Delivering life’s essential serviceThames Water Combined Report – Annual Report, Annual Performance Report and Sustainability Report 2019/20
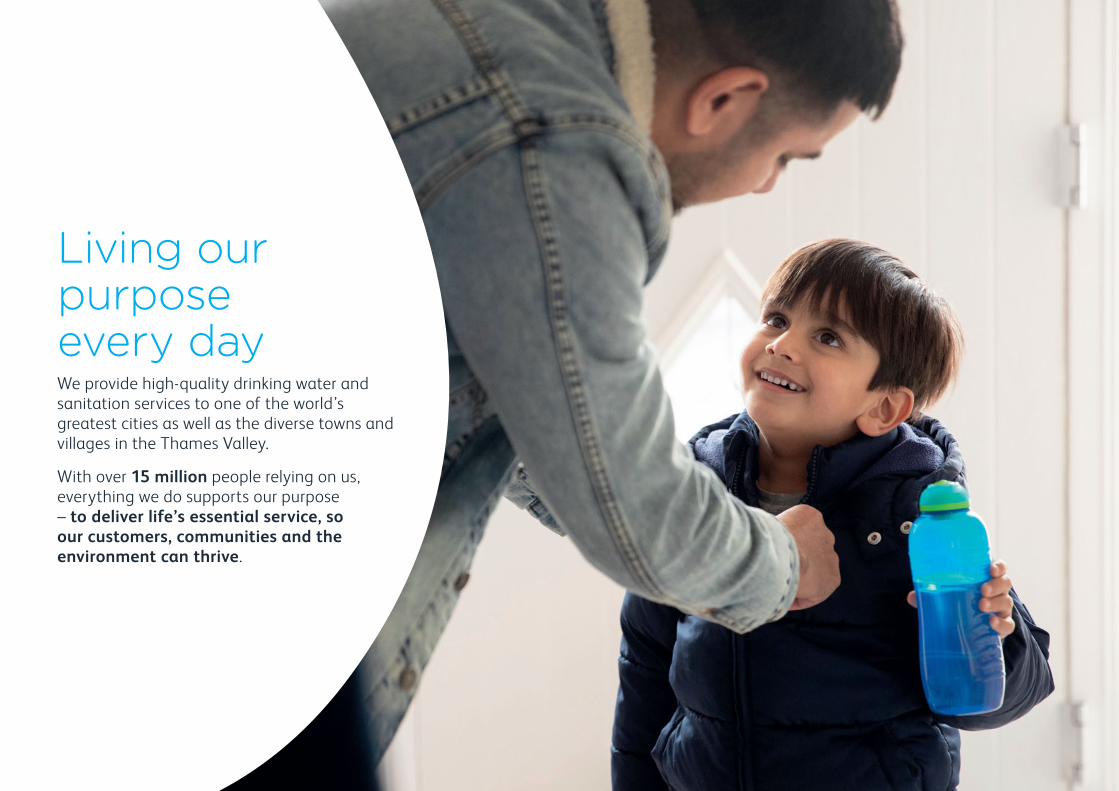
Living our purpose every dayWe provide high-quality drinking water and sanitation services to one of the world’s greatest cities as well as the diverse towns and villages in the Thames Valley.
With over 15 million people relying on us, everything we do supports our purpose – to deliver life’s essential service, so our customers, communities and the environment can thrive.
Environment, Social and Governance (ESG)
To support our strategic ambitions and our approach to sustainability, we continue to put the Environment, Social and Governance agenda at the heart of our financial decision-making.
Wherever you see this green box, you can learn more about how we’re performing against ESG metrics and making a positive difference to our customers, employees and the communities we serve.
Every year we produce a standalone ESG statement, bringing the last four years of ESG data together in one place. We will publish our latest 2020 statement on our website later this year.
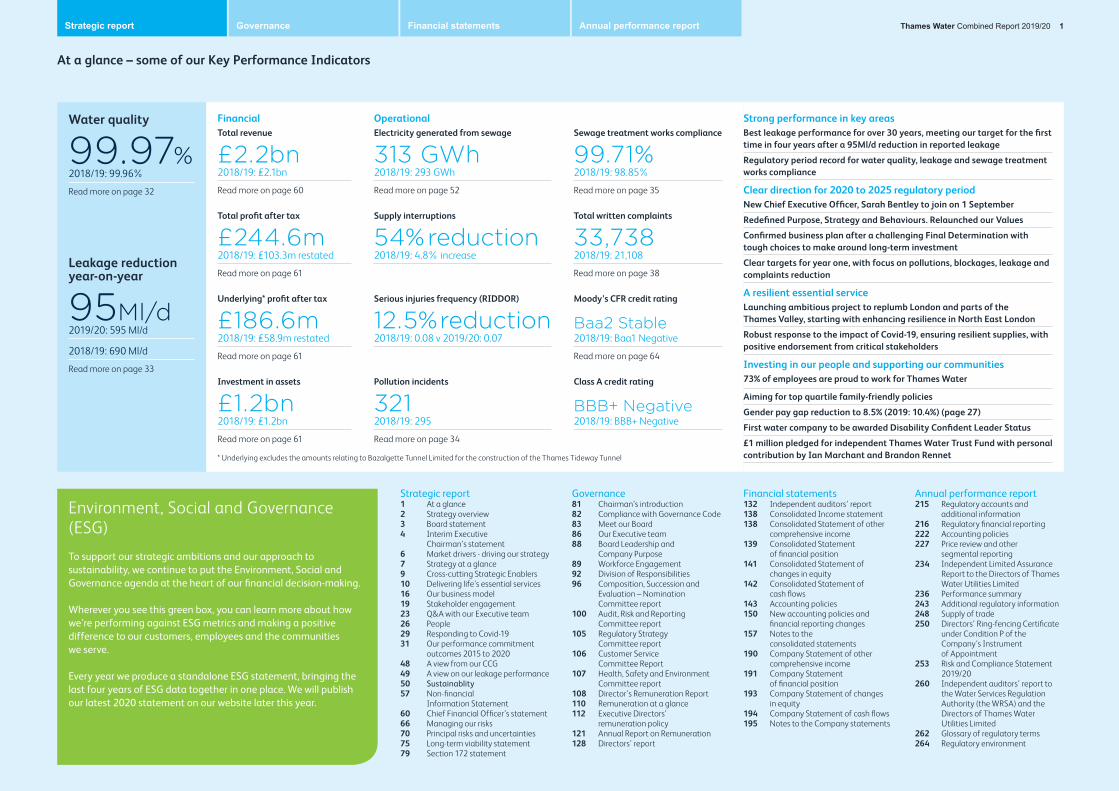
At a glance – some of our Key Performance Indicators
Strategic report1 At a glance2 Strategy overview3 Board statement4 Interim Executive
Chairman’s statement 6 Market drivers - driving our strategy7 Strategy at a glance9 Cross-cutting Strategic Enablers10 Delivering life’s essential services16 Our business model19 Stakeholder engagement 23 Q&A with our Executive team26 People29 Responding to Covid-1931 Our performance commitment
outcomes 2015 to 202048 A view from our CCG49 A view on our leakage performance50 Sustainablity57 Non-financial
Information Statement60 Chief Financial Officer’s statement66 Managing our risks70 Principal risks and uncertainties75 Long-term viability statement79 Section 172 statement
Governance81 Chairman’s introduction82 Compliance with Governance Code 83 Meet our Board86 Our Executive team88 Board Leadership and
Company Purpose89 Workforce Engagement92 Division of Responsibilities96 Composition, Succession and
Evaluation – Nomination Committee report
100 Audit, Risk and Reporting Committee report
105 Regulatory Strategy Committee report
106 Customer Service Committee Report
107 Health, Safety and Environment Committee report
108 Director’s Remuneration Report110 Remuneration at a glance112 Executive Directors’
remuneration policy121 Annual Report on Remuneration128 Directors’ report
Financial statements132 Independent auditors’ report 138 Consolidated Income statement138 Consolidated Statement of other
comprehensive income139 Consolidated Statement
of financial position141 Consolidated Statement of
changes in equity142 Consolidated Statement of
cash flows143 Accounting policies150 New accounting policies and
financial reporting changes157 Notes to the
consolidated statements190 Company Statement of other
comprehensive income191 Company Statement
of financial position193 Company Statement of changes
in equity194 Company Statement of cash flows195 Notes to the Company statements
Annual performance report215 Regulatory accounts and
additional information216 Regulatory financial reporting222 Accounting policies227 Price review and other
segmental reporting234 Independent Limited Assurance
Report to the Directors of Thames Water Utilities Limited
236 Performance summary243 Additional regulatory information248 Supply of trade250 Directors’ Ring-fencing Certificate
under Condition P of the Company’s Instrument of Appointment
253 Risk and Compliance Statement 2019/20
260 Independent auditors’ report to the Water Services Regulation Authority (the WRSA) and the Directors of Thames Water Utilities Limited
262 Glossary of regulatory terms264 Regulatory environment
Financial OperationalTotal revenue
£2.2bn2018/19: £2.1bn
Read more on page 60
Electricity generated from sewage
313 GWh2018/19: 293 GWh
Read more on page 52
Sewage treatment works compliance
99.71%2018/19: 98.85%
Read more on page 35
Total profit after tax
£244.6m2018/19: £103.3m restated
Read more on page 61
Supply interruptions
54% reduction2018/19: 4.8% increase
Total written complaints
33,7382018/19: 21,108
Read more on page 38
Underlying* profit after tax
£186.6m2018/19: £58.9m restated
Read more on page 61
Serious injuries frequency (RIDDOR)
12.5% reduction2018/19: 0.08 v 2019/20: 0.07
Moody’s CFR credit rating
Baa2 Stable2018/19: Baa1 Negative
Read more on page 64
Investment in assets
£1.2bn2018/19: £1.2bn
Read more on page 61
Pollution incidents
3212018/19: 295
Read more on page 34
Class A credit rating
BBB+ Negative2018/19: BBB+ Negative
* Underlying excludes the amounts relating to Bazalgette Tunnel Limited for the construction of the Thames Tideway Tunnel
Water quality
99.97%2018/19: 99.96%
Read more on page 32
Leakage reduction year-on-year
95Ml/d2019/20: 595 Ml/d
2018/19: 690 Ml/d
Read more on page 33
Strong performance in key areasBest leakage performance for over 30 years, meeting our target for the first time in four years after a 95Ml/d reduction in reported leakage
Regulatory period record for water quality, leakage and sewage treatment works compliance
Clear direction for 2020 to 2025 regulatory periodNew Chief Executive Officer, Sarah Bentley to join on 1 September
Redefined Purpose, Strategy and Behaviours. Relaunched our Values
Confirmed business plan after a challenging Final Determination with tough choices to make around long-term investment
Clear targets for year one, with focus on pollutions, blockages, leakage and complaints reduction
A resilient essential serviceLaunching ambitious project to replumb London and parts of the Thames Valley, starting with enhancing resilience in North East London
Robust response to the impact of Covid-19, ensuring resilient supplies, with positive endorsement from critical stakeholders
Investing in our people and supporting our communities73% of employees are proud to work for Thames Water
Aiming for top quartile family-friendly policies
Gender pay gap reduction to 8.5% (2019: 10.4%) (page 27)
First water company to be awarded Disability Confident Leader Status
£1 million pledged for independent Thames Water Trust Fund with personal contribution by Ian Marchant and Brandon Rennet
Thames Water Combined Report 2019/20 1Strategic report Governance Financial statements Annual performance report

Strategy overview
Our sustainability reportingWe have a longstanding commitment to becoming more sustainable, which touches all areas of the business.
As we reset our strategy and streamline our annual reporting to give our stakeholders a ‘one-stop-shop’ for content, we’re aligning our sustainability reporting with our Annual Report and Annual Performance Report.
While our sustainability focus starts on page 50, our approach to being more sustainable runs through this report as it does Thames Water. Fully integrating ‘generating public value’ into our strategy – which is very much aligned with our approach to sustainability – underlines how seriously we take being a responsible business and going above and beyond our core functions to do the right thing for today and tomorrow.
Our PurposeTo deliver life’s essential service, so our customers,
communities and the environment can thrive
Our Strategic Ambitions
To invest in resilient systems and assets
Read more on page 7
To deliver brilliant customer engagement
Read more on page 7
To generate public valueRead more on page 8
Our Strategic Enablers: People Digital Efficiency Read more on page 9
Near-term priorities for 2020/21
15%Reduction in customer complaints and contacts
£2 billion to be spent to make improvements for customers in a smart and efficient way
50%reduction in supply interruptions lasting more than three hours and reduce leakage to less than
570Ml/d
10%reduction in blockages and pollutions
Launcha new approach to managing our water networks
How culture supports our strategy – our values and supporting behaviours
Delivering our essential service safely and securely to all of our customers is always at the very heart of all that we do.
Over the last few months, we’ve defined our Purpose, re-evaluated our Strategy, set new near-term priorities and created Behaviours to support our long-standing Values.
Aligning what we need to do with how we need do it we’re entering this new regulatory period with a clear direction for the future as we commit to living our purpose.
Be proud, be blue
We celebrate and promote the great things we do
Be respectful and value everyone
We embrace differences and work as a team
Be passionate about everything we do
We’re enthusiastic and positive
Take care
We look after ourselves, our customers and our environment
Take ownership
We own problems until resolved
Reach higher, be better
We’re always learning, always improving
Thames Water Combined Report 2019/20 2Strategic report Governance Financial statements Annual performance report

‘External shareholders’ is the term used to describe the ultimate owners of the company. Most of our external shareholders are pension funds. They own the shares in our ultimate parent company.
Board statementA strong position for 2020
This statement outlines how, as the Board of Thames Water Utilities Limited (“Thames Water”), we’re driving the delivery of our Purpose
Bringing the regulatory period to a close in a strong position for the start of 2020/21 was our key focus for the year. As a Board, we appointed Sarah Bentley as our new Chief Executive Officer, engaged on the definition of our new Purpose and worked with the Executive team to identify key near-term priorities and confirm our business plan for the next five years, as we complete a chapter of unprecedented change. Since the start of 2017, we’ve had a 54% change in ownership, three quarters of our Directors are new to the Board and we have a completely new Executive team.
Defining our PurposeAs a 400-year-old essential services business, our purpose has always been very clear. This year, we, along with the Executive team and employees from across the business, have been through a process to articulate that purpose in a way that drives everything we do.
Our Purpose is to deliver life’s essential service, so our customers, communities and the environment can thrive. It’s not a tagline, but our fundamental reason for being, and everything we do will align with its sentiment. To foster a culture that drives the delivery of our Purpose and ensures it runs through the organisation, we’ve also tested our Values and defined new supporting Behaviours. We will both monitor and become ambassadors for these new Behaviours at Board level.
To strengthen our engagement with employees and work with them to drive the delivery of our Purpose, we appointed Ian Pearson, one of our Independent Non-Executive Directors, as our Workforce Engagement Lead Director. Along with other members of the Board, he has spent a lot of time engaging with our employees to understand their key concerns, giving us a more direct link to the challenges and experiences of those on the front line. Employee pride and commitment is something that shines through in every one of the engagement sessions.
Strong governanceWe’ve continued to unite as a Board to deliver ‘best in class’ governance. We welcomed two new external shareholder representatives to the Board – Michael McNicholas became the Non-Executive Director for OMERS, the Canadian pension fund and our largest shareholder, and Paul Donovan joined as the representative for QIC, BCI, PGGM and Aquila. Both bring a wealth of experience and a skillset aligned with the delivery of our strategy.
During the recruitment process for our new Chief Executive Officer, Ian Marchant has continued to act as Interim Executive Chairman, with his tenure in the role covering the majority of 2019/20. To maintain high levels of governance during this period we appointed Nick Land as Deputy Chairman, and Ian will return to his role as Chairman when Sarah joins the business on 1 September 2020.
Our external shareholders supported the Board’s decision not to pay them any external dividends during the three years to 2019/20 as a commitment to improving performance in critical metrics. As such, they received zero dividends for the third consecutive year. The only dividends paid by the operating company, Thames Water Utilities Limited, were those paid to service external debt at £56.5 million.
As we look to the future, we will be transparent about any dividends paid to our external shareholders. We will be clear about their level, how they relate to the delivery for customers, and why they have been awarded, in line with our dividend policy. We will also set out how any dividend compares to the returns our
external shareholders would have received if our debt levels were lower.
During the year, we’ve amended our remuneration policy to increase alignment with our revised Strategic Ambitions. For full details see our remuneration report.
Business resilience At the end of the year, the onset of Covid-19 tested our resilience and ability to adapt, as we mobilised a robust response to the pandemic, which had the potential to disrupt our services. We also recognised the significant impact that this pandemic has and continues to have on our customers, our colleagues and our business. We were proud to continue to deliver essential services to our customers, and to keep our colleagues safe as they performed their roles as key workers. Our thorough approach to business continuity ensured the resilience of our workforce and the delivery of our essential services during this unprecedented time.
As a Board, we’re proud of how our people have pulled together to do their best for our customers and the communities around us. Now, more than ever, we’re all living and breathing our Purpose. Page 29 gives more detail about how we’ve mitigated the potential risks of Covid-19 to our business model.
Operational performanceFor the 2015 to 2020 regulatory period, we set 55 performance commitments with our economic regulator, Ofwat. During 2019/20, 61% of our performance commitments achieved green status, 13% amber and 26% red – this includes our performance commitments assessed over the entire regulatory period. To make our reporting as accessible and transparent as possible, we’ve included full regulatory period performance graphs in our performance section, with further information in our Interim Executive Chairman’s statement, Executive Q&A and table 3A.
Long term aspirations and measurement We’ve completed our price review process with Ofwat to agree our business plan for the 2020 to 2025 regulatory period. While it’s a very challenging plan, it’s important we maintain our focus on our
improving trajectory, work collaboratively with our regulator and provide certainty for the next five years.Appropriate investment in our water network will require us spending more than we’ve been allowed by Ofwat, which is something our Board and external shareholders support.
As we move through the next regulatory period and the implementation of our plan for the next five years, we’ve set near-term priorities to help deliver our performance commitments.
Given the ongoing uncertainty regarding the impact of Covid-19 on our workforce, our customers and our ability to work in the community on non-essential projects, our Executive team will regularly review our priorities to ensure they continue to balance our long-term goals and the short-term needs of our region. We will continue to work collaboratively with our regulators and other water companies to share learnings and manage the impact of the pandemic together.
As a Board, we’re privileged to be the guardians of Thames Water. It’s one of the fundamental building blocks of a healthy and prosperous society, and we’re committed to maintaining strong leadership and the highest levels of governance as we deliver our Purpose, every single day.
Thames Water Combined Report 2019/20 3Strategic report Governance Financial statements Annual performance report

Interim Executive Chairman’s statementA positive year
Making fundamental changes to rebuild trust and getting back on track with the basics defined the latter part of our 2015 to 2020 regulatory period – and we start 2020/21 in a solid position with aclear plan for the future.
When I became Interim Executive Chairman in May 2019, my first task was to set our priorities for the year to give the business a clear focus. Since then, we’ve made positive strides forward in critical performance areas.
Solid operational performanceReducing leakage was one of our most important priorities for 2019/20, and we’ve made very good progress. At 595Ml/d, our annual leakage is at its lowest level for over 30 years, and we met our target for the first time in four years, with a 95Ml/d year-on-year reduction in reported leakage. Given the age and location of much of our water network, tackling leakage isn’t an easy task. We all knew it would be incredibly challenging to get leakage back on track with our target after missing it for three years in a row. However, our increased focus and productivity, coupled with the dedication and sheer determination of our people and the contractors supporting us, meant we were able to go beyond our 2019/20 target of 606 Ml/d. As we move through the new regulatory period, we’re committed to keeping up the positive momentum and maintaining this improving trend.
We continue to provide our millions of customers with an excellent product, with our drinking water quality being extremely high and improving further during the year to 99.97% compliance with the Drinking Water Inspectorate’s stringent tests. We also improved our supply interruptions performance during the year to
7.2 minutes per property served, our best performance for three years. We’ve met our pollutions target every year of this regulatory period and maintained our 3-star rating under the Environmental Protection Assessment. There was, however, an increase in incidents compared to calendar year 2018, so pollution reduction is one of our key priorities for 2020/21. We made significant headway elsewhere on our waste network, with our best performance of the regulatory period for sewage treatment works compliance.
Reducing complaints has continued to be a challenge, and we’re not where we wanted to be at the end of the regulatory period. We have, however, made huge progress with the migration of the majority of our 3.6 million households to our major new billing platform in the space of just 12 months. Once optimised, the capabilities of this new system will help us drive the step change we need in our customer service performance, with complaint reduction continuing to be one of our key focuses for the current year.
One of our other priorities for 2019/20 was to drive increased cost efficiency. As part of that, we restructured the business, overhauled processes and implemented more efficient ways of doing things, leading to an in-year saving of £47 million. As we move through this regulatory period, the changes we’ve embedded will continue to deliver efficiencies. However, it doesn’t stop there. Ensuring maximum value from every pound we spend will drive all our decision making.
“ At 595Ml/d, our annual leakage is at its lowest level for over 30 years, and we met our target for the first time in four years, with a 95Ml/d year-on-year reduction in reported leakage.”
Ian Marchant Interim Executive Chairman
A new Chief Executive Officer In April 2020, we announced the appointment of Sarah Bentley as our new Chief Executive Officer. Sarah has invaluable experience of the water sector, with her most recent role, as Severn Trent’s Chief Customer Officer, covering customer service, network operations, digital and transformation. We look forward to welcoming her to Thames Water on 1 September 2020.
During the year, we also welcomed four new members of the Executive team – John Bentley as Capital Delivery Director, Nicola Cocks as Regulation Director, Lynne Graham as Human Resources Director and George Mayhew as Corporate Affairs Director. The skills and experience of our new Executive team members complement those of existing members of the team to ensure we have the right capabilities to deliver our priorities. When Sarah joins, over 50% of our Executive team will have been new to their roles since June 2019 and the number of women on the team will have doubled.
Living our Purpose Now, more than ever, our Purpose rings true. The last few weeks of the 2019/20 financial year saw us face an unprecedented, and rapidly evolving, situation in the face of the Covid-19 pandemic – probably the biggest operational challenge to face our business since World War Two. I’m proud of the way our people have risen to the challenge to live our Purpose, at a time when water services resilience is more critical than ever, and we’ve had some great feedback from our customers and stakeholders. Our front-line teams worked round the clock to increase the resilience of water supplies to 120 hospitals across our region, including the new NHS Nightingale, to increase protection for the NHS as it does its vital job.
Priorities for 2019/20
Drive cost efficiency £47 million savings
Successful transition of customers to new customer relationship management and billing platform
3.4 million customer accounts transitioned
Reduce leakage to 606 Ml/d
Achieved 595 Ml/d
Reduce complaints by 20%
Ongoing ONGOING
Mobilise our plan for 2020 to 2025
Met
Thames Water Combined Report 2019/20 4Strategic report Governance Financial statements Annual performance report

Chairman’s statement continued
While many of our front-line roles can’t be done remotely, we’ve rapidly improved our digital capabilities, so 3,500 of our employees could work from home, including many call agents – a first for us. We’ve also stepped up our financial support for customers who find themselves in increasingly vulnerable circumstances, including those affected by the virus, with over 80,000 more customers on our social tariff. We’ve also just set up a new relief fund, donating £400,000 to financially support our community partners during the pandemic.
Resetting our strategyDuring the year we reset our strategy, to make sure we’re focusing on what’s most important as we head into the next regulatory period. Our ambitions to ‘deliver brilliant customer engagement’ and ‘invest in resilient assets and systems’ are still very much at the forefront of our plans for 2020 to 2025.
As a monopoly water provider embedded in the daily lives of millions of customers in London and the Thames Valley, and reliant on a healthy relationship with the environment and the communities around us, ‘generating public value’ is hugely important. That’s why we’ve brought it front and centre as our third Strategic Ambition. While we have a longstanding commitment to create value for society, communities and the environment, it’s not always been fully embedded into the way we do things every day. Recently, we’ve made some important commitments as we go beyond the delivery of our core services, including our pledge to achieve net zero carbon emissions from our operations by 2030 and then to go beyond zero. We’re also doubling our investment in our independent trust fund to £1 million, to provide support to our customers outside the traditional remit of a water company.
As well as working to deliver brilliant customer engagement, effective stakeholder engagement and partnerships are also really important to the delivery of our priorities. Working with the third sector to deliver our services to customers in vulnerable circumstances, with the Mayor of London to install London’s water fountains and with environmental groups to look after rivers are just some of the ways we’re collaborating with our stakeholders to create value for our region.
Investing in resilienceBetween 2015 and 2020 we invested more than £5 billion in infrastructure across our region to increase our resilience in the face of challenges such as climate change and population growth. Our larger investment projects included the £700 million Lee Tunnel – a circa 6.4km ‘super sewer’ diverting millions of tonnes of sewage away from the River Lee, the upgrade of Deephams sewage treatment works to accommodate growth in North London and the Axford pipeline to eliminate the need to abstract water from the River Kennet in Wiltshire. We’ve also invested in hundreds of smaller projects to drive benefits for customers both individually and collectively as communities across our region.
This year marked the 25th anniversary of the London Ring Main, one of the first major projects we completed after privatisation. Since then, we’ve continued to invest heavily – we’re currently investing three times the average annual amount compared to the five years pre-privatisation.
While we met our leakage and supply interruptions targets in 2019/20, it’s obvious our network requires continued high levels of investment. In October 2019, we were again reminded of the fragility of our network when one of our 36-inch water mains burst near Finsbury Park, flooding a large number of nearby properties and causing short-term supply interruptions. We need to make fundamental changes to our water network to protect our customers from the devastating impact of bursts and secure the future of life’s essential service in one of the world’s greatest cities. That’s why we’re planning our most aspirational and innovative project to date, as we make plans to replumb London and parts of the Thames Valley. It is set to be the biggest project on our pipe network since Sir Joseph Bazalgette engineered our Victorian sewer network, and we’ll be taking our stakeholders on the journey with us to help us make the right decisions for the future of our region.
ESG performance
Defined new purpose
Generating public valuebecomes one of our three Strategic Ambitions
Over £5 billioninvested in assets during the regulatory period
p17 Read more about how we contributepositively to the circular economy
£1 million to be invested in our independent Trust Fund, including personal contributions made by Ian Marchant, our Interim Executive Chairman, and Brandon Rennet, our Chief Financial Officer
£400,000 donated to new relief fund to support our community partners in financially vulnerable circumstances due to Covid-19
Looking to the future2019/20 was a pivotal year for the business. After a period of unprecedented change and refocus to get Thames back on track, culminating in the appointment of our new Chief Executive Officer, we’re building on that stability and working together with our stakeholders to address the challenges we face. There’s no doubt that delivering our plan for 2020 to 2025 will be very challenging, as some risks will remain unmitigated, and it will require overspend in some areas, particularly on our water network. It was a finely balanced decision as to whether we should go to the Competition Markets Authority, however, we decided not to risk jeopardising the good progress we’ve made by being distracted this year.
We’re committed to delivering our Purpose and building our reputation as a water company that provides a resilient service in a way that our customers, stakeholders and employees can be proud of, and our regulators recognise.
Ian MarchantInterim Executive Chairman29 June 2020
Thames Water Combined Report 2019/20 5Strategic report Governance Financial statements Annual performance report

Market drivers
Driving our strategy
Affordability and customer expectations Environmental protection Population growth and urbanisation
16%of customers are over the age of 65
3.9%increase in unemployment due to Covid-19
2.2 millionclinically vulnerable people advised to shield following Government guidance
Employment rate down 0.19 to
76.4%between February and April 2020
1.5°C expected global temperature rise between 2030 and 2052 if emissions continue to increase at the current rate
3 million species live in the Thames Valley area, including 670,000 protected and notable species
21% of the UK’s chalk streams are in our region
150 plastic water bottles, on average, are used per person each year in the UK and 6.9% of bottles are littered
360 Ml/d predicted water shortfall by 2045, if we don’t work with our customers to take action
2 millionexpected inrease in number of customers in our region by 2045
£75 million per year – costs associated with working in London could increase by this much
28% increase in traffic on Great Britain’s roads in the 25 years to 2018 having an impact on our ability to make repairs
Link to Strategic Ambitions Link to Strategic Ambitions
Link to Strategic Ambitions
Markets and regulatory changes Technology Our workforce
PR19 Business plan for 2020 to 2025 confirmed
20.4% fall in GDP in April 2020 due to COVID-19 impact
£200 millionproposed industry-wide innovation fund -a collectively funded innovation competition, focused on addressing long-term strategic challenges
Ofwat launches new strategy, setting out its ambition for the water sector
2018 Corporate Governance Code 2018 applies for 2019/20
New Bill Proposed Environment Bill for 2020 to bring environmental protection and recovery into UK law
87% of adults use the internet each day
4 out of 5customers have a smartphone
45 million social media users in the UK
13.7 million Twitter users in the UK
6%under 24 years
c.16%over 55 years old
c.15% BAME employees
73% of employees are proud to work for Thames Water
15% employee turnover
64% employee engagement (2018/19: 71%)
Link to Strategic Ambitions
Link to Strategic Ambitions
Link to Strategic Ambitions
Thames Water Combined Report 2019/20 6Strategic report Governance Financial statements Annual performance report

To invest in resilient assets and systems
Read more about our operational performance pages 32 to 37
To deliver brilliant customer engagement
Read more about customer engagement pages 38 to 43
The priorities we outlined last year • Invest £1 billion during 2019/2020
• Reduce leakage to 606Ml/d
• Rehabilitate 173km of water mains by March 2020
• Improve Security of Supply Index to 100 by March 2020
• Replace 36,500 lead pipes between 2015 and 2020
Progress during 2019/20£1.2 billion investment in our assets
95Ml/d reduction in leakage to 595Ml/d
195 km of water mains rehabilitated
Security of Supply Index at 100
Nearly 13,000 lead pipes replaced
Reduced supply interruptions to 7.2 minutes per property served
99.97% water quality
900km sewers cleaned
99.71% sewage treatment works compliance
Completed major upgrade of Deephams sewage treatment works
Increased resilience for 120 hospitals during Covid-19 pandemic
Priorities for 2020/21 • Trial the implementation of a digital
wastewater network
• Reduce supply interruptions by 50% and leakage to less than 570Ml/d
• Reduce blockages and pollutions by 10%
• Commence a two-year programme to overhaul how we manage our water network
• Launch strategies to replumb our region and to increase North East London resilience
• Replace over 10,000 lead pipes with a focus on primary school communication pipes
Longer-term priorities • Reduce leakage by over 20% and supply
interruptions to between 6 and 7 minutes by 2025
• Reduce pollutions by 30% by 2025
• Build a longer-term roadmap for replumbing London and parts of the Thames Valley
• Replace over 50,000 lead pipes
• Create more intelligent water and wastewater networks to enable a more proactive approach
• Proposed reservoir in Oxfordshire to secure long-term water resources and explore options for water reuse and transfer
Key risks • Risk numbers 1,2,3,4,5,6,7,8,9,10,11,12,14
Link to remuneration 2019/20 • Performance commitments for sewer flooding
and minimising supply interruptions form part of our Annual Manager’s bonus
• Leakage reduction and asset health form part of the Transformation Incentive
The priorities we outlined last year • Move majority of customers to new billing
system by March 2020
• Reduce complaints by 15%
• 200,000 families on social tariffs by 2025
• 410,000 on Priority Services Register by 2025
Progress during 2019/20Deployment of new industry leading billing and customer management system to improve customer experience and revenue assurance – 94% customer accounts transitioned, with all now migrated
24% reduction in water written complaints
Over 150,000 customers now on social tariff, a doubling of volume year-on-year
Over 80,000 customers on priority services register, an 18% year-on-year increase
Helped 5,613 customers through our customer assistance fund
Overhaul of website to make it easier for customers to interact with us online and find the information and support they need
Overhauled approach to incident management to improve collaboration, communication and support to customers and stakeholders
Nearly 55,000 smarter home visits to help customers save water and money
Priorities for 2020/21 • Reduce customer contact and complaints by
15% after billing and charging complaints spiked during the year
• Deliver potential of new billing system
• Digitise our high-volume customer journeys to improve customer satisfaction
Longer-term priorities • Make it easy for customers to pay their bill by
improving customer channels and support
• Reduce bad debt, supporting everyone to pay their fair share
• Support growth and competition in our region through our wholesale service offerings
• 1.3% reduction in real terms in average household bills by 2025
Key risks • Risk numbers 1,3,5,6,7,8,9,10,13
Link to remuneration 2019/20 • Customer complaints performance forms part
of the annual managers bonus
• The migration of customers to our new billing platform and our Net Promoter Score relating to customer perception, including those who may not have contacted us, form part of the Transformation Incentive
Strategy at a glanceDelivering our strategic ambitions
Thames Water Combined Report 2019/20 7Strategic report Governance Financial statements Annual performance report
Strategy at a glance continued
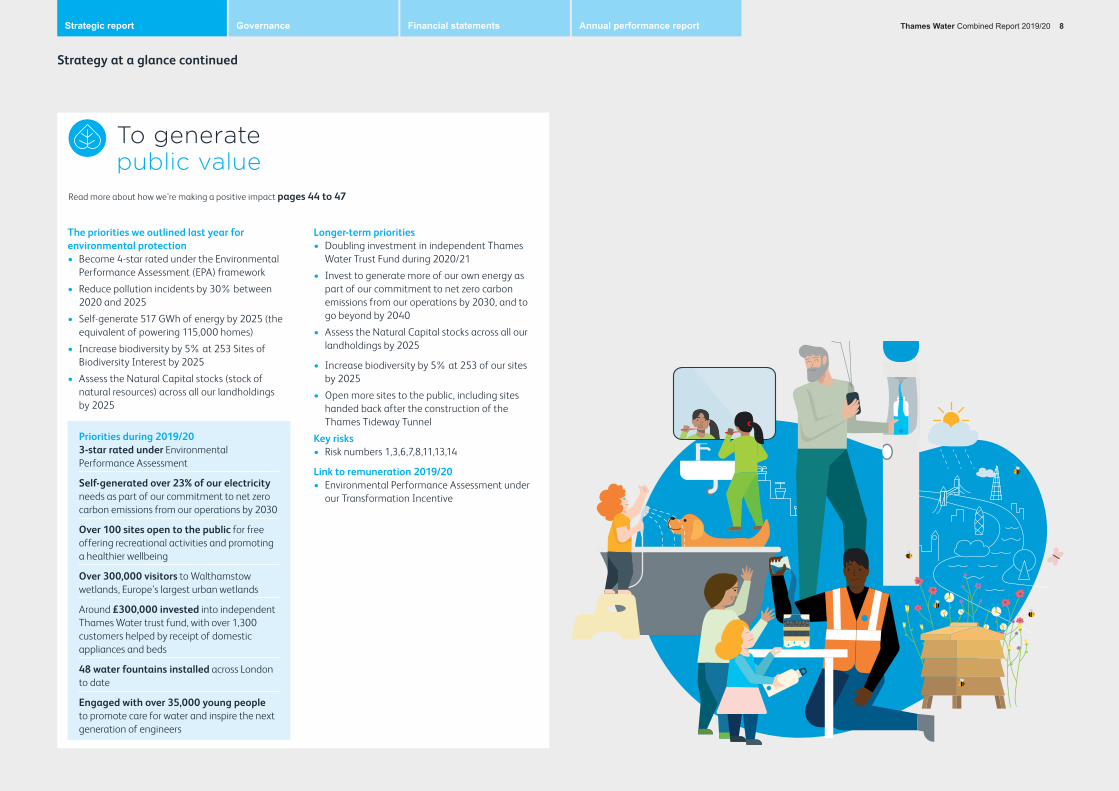
To generate public value
Read more about how we’re making a positive impact pages 44 to 47
The priorities we outlined last year for environmental protection
• Become 4-star rated under the Environmental Performance Assessment (EPA) framework
• Reduce pollution incidents by 30% between 2020 and 2025
• Self-generate 517 GWh of energy by 2025 (the equivalent of powering 115,000 homes)
• Increase biodiversity by 5% at 253 Sites of Biodiversity Interest by 2025
• Assess the Natural Capital stocks (stock of natural resources) across all our landholdings by 2025
Priorities during 2019/203-star rated under Environmental Performance Assessment
Self-generated over 23% of our electricity needs as part of our commitment to net zero carbon emissions from our operations by 2030
Over 100 sites open to the public for free offering recreational activities and promoting a healthier wellbeing
Over 300,000 visitors to Walthamstow wetlands, Europe’s largest urban wetlands
Around £300,000 invested into independent Thames Water trust fund, with over 1,300 customers helped by receipt of domestic appliances and beds
48 water fountains installed across London to date
Engaged with over 35,000 young people to promote care for water and inspire the next generation of engineers
Longer-term priorities • Doubling investment in independent Thames
Water Trust Fund during 2020/21
• Invest to generate more of our own energy as part of our commitment to net zero carbon emissions from our operations by 2030, and to go beyond by 2040
• Assess the Natural Capital stocks across all our landholdings by 2025
• Increase biodiversity by 5% at 253 of our sites by 2025
• Open more sites to the public, including sites handed back after the construction of the Thames Tideway Tunnel
Key risks • Risk numbers 1,3,6,7,8,11,13,14
Link to remuneration 2019/20 • Environmental Performance Assessment under
our Transformation Incentive
Thames Water Combined Report 2019/20 8Strategic report Governance Financial statements Annual performance report

Cross-cutting Strategic EnablersOur Strategic Ambitions are supported by three Strategic Enablers
People Digital Efficiency
Building a skilled workforce and high performance culture • Tested Values and set supporting Behaviours to drive the right
culture and encourage better performance management
• Restructured the business to align with the delivery of strategy and priorities
• Trained almost 1,600 employees on new customer relationship management and billing system
Service resilience and improved engagement • Major new customer relationship management and billing
engine launched, proving integrity of metering, billing and collections processes
• Launched new website to improve accessibility, engagement and to enable customers to better self-serve
• Incident viewer and supply demand tool to enable real-time management of supply issues
Cost savings • Embedded cost saving culture and transformation into day-to-
day life
• Improved collections techniques and streamlined working practises
• Reduced power costs through increased energy efficiency and generation – significant energy consumption reduction at two of the biggest sites – Beckton 2.5 GWh (1.8%) and Mogden 4.3 GWh (5.2%)
• Improved productivity of assets
A diverse and inclusive environment • Reduced our gender pay gap to 8.5%
• Increase in minority talent in management and leadership positions to 10%
• Jumped 113 places on the Stonewall Workplace Equality Index
• First water company awarded Disability Confident Leader Status
• Revised family-friendly policies around maternity, paternity and dependants leave, putting us in top quartile of employers in terms of support provision
New IT infrastructure and technology, improving ways of working and underpinning IT resilience
• Installed new network and migrated to new data centres (latter completed in June 2020)
• New laptops rolled out to employees, increasing capabilities and the ability to collaborate virtually across the business. Improved communication across the business enhances the benefits of our more collaborative operational design
• New cloud platform leading to 99.8% availability
• New collaboration software, including ability to run “live events” across the company
Operational efficiencies • Restructured the business, increasing collaboration and
alignment around the delivery of business priorities
• Insourcing core capabilities including capital delivery, IT project delivery, engineering design and logistics management, including tankering.
• New IT equipment leading to more efficient and productive ways of working
• Increased productivity and flexibility of engineers to increase speed of job completion
Health and safety • 41% reduction in number of days lost for work-related injuries
• 26% reduction in serious incidents (RIDDOR)
• Reached 17 ‘Perfect Days’ in a month – days without a physical or mental health work-related incident
Smarter networks to enable data driven decision making • In the past two years, we’ve built a “Smart Water” data platform,
that allows us to develop data products very rapidly
• In the last 18 months we’ve built products to see real-time supply and demand; manage large incidents (battlefield planning); help us find where to look for leaks; and to predict likely points of trunk mains failure
• Collecting far more intelligent network data – we now have 449,000 smart meters and 27,000 acoustic loggers
• In the 2020 to 2025 regulatory period we will be expanding this capability to deliver our performance commitments
• A particular focus for 2020 to 2025 is the roll-out of DMA (area of water network) fingerprinting to understand how each area will respond to different weather and operational conditions, so we can tailor our plans to reduce leakage and supply interruptions. Building a similar capability for wastewater operations
Supply chain efficiency • Increased workforce productivity
• Restructuring procurement frameworks to optimise quality and commercial return
• Strengthening contract management capability through people investment
A resilient and happy workforce • 73% of employees proud to work for Thames Water
• 64% engagement score
• Employee networks including BAME, DisAbility, LGBT+, Women’s and multi-faith networks
• Revised approach to internal communications to improve communication with our employees
Thames Water Combined Report 2019/20 9Strategic report Governance Financial statements Annual performance report

London
Supporting the NHS
Teams were out checking the water pipes supplying the NHS Nightingale hospital at the London ExCel Centre, to make sure there was a resilient supply of water. We checked the supplies to 120 hospitals in our region.
p29 Read more about our response to Covid-19 here
Reading
A real-time view of incidents
With this new tool, teams are able to see what’s happening during an incident in real-time. Created in response to the impact of March 2018’s freeze thaw, it tells our teams how many calls are coming in, the types of queries and the locations of bottled water stations. It increases collaboration between teams, with real-time access to the same information, and enables a more proactive and nimble response to fixing the problem and communicating effectively with customers.
By investing in resilient assets and systems
In the face of population growth, climate change and the challenges associated with our ageing network, we’re investing in resilient systems and assets to protect the provision of life’s essential service now and for the future.
We’re spending billions of pounds to strengthen our infrastructure by replacing hundreds of miles of pipes, upgrading our treatment works and rolling out smart technology.
Delivering life’s essential service – 24 hours a day, 7 days a week, 365 days a year
Over the next few pages we highlight just some of the ways we’re delivering our strategy in a typical day
Kirsty O’Connor/PA Wire
Thames Water Combined Report 2019/20 10Strategic report Governance Financial statements Annual performance report

All across our region
Ensuring high water quality
Our water quality technicians in London and the Thames Valley start their day. They head to our sites and customer properties to collect water samples, which are checked to make sure the quality complies with a wide range of microbiological and chemical criteria. In case there are any urgent water quality issues during the night, we have a team working 24/7 to make sure our water is always high quality
During the year we performed over
400,000tests on our water
p32 Read more about our water quality performance here
Regent’s Park, London
Fixing a leak during the pandemic
Our engineers respond to a burst on a major pipe near Regents Park to prevent supply interruptions to customers in the area. Management around the repair site was stepped up, with barriers in place to help customers and employees maintain social distancing during a critical repair.
p33 Read more about how we’re reducing leakage
Reading
Keeping an eye on the weather
Our meteorologist works with the wastewater networks team to predict weather patterns and their potential impact on the operation of our sewers. They kept an eye on Storm Ciara as it approached giving us a better understanding of how the storm might impact our operations and more time to get ready to protect our network
p34 Read more about how we’re reducing pollutions
ESG performance
Fixing 200 leaks a week
Over 400,000smart meters installed to date to help detect leaks where consumption levels are unusually high
Shinynewpipes
Thames Water Combined Report 2019/20 11Strategic report Governance Financial statements Annual performance report

Swindon
A platform to improve service
We’ve trained over 1,300 customer service colleagues on our new billing platform so they have an improved toolkit to better support our customers with metering and billing queries.
Our teams successfully moved over 1 million households to the platform in one weekend in October 2019, 30% of our customers.
Across our region
Helping customers with their household debts
We’ve helped 5,613 families through our customer assistance fund in 2019/20
Delivering life’s essential service – 24 hours a day, 7 days a week, 365 days a year
By making changes to deliver brilliant customer engagement
We exist to serve our customers and our customers’ expectations of us are, quite rightly, extremely high. We don’t just want to meet their expectations – we want to exceed them.
That’s why making every customer interaction as positive as possible is important to us, and we’ve been making fundamental changes to improve our customer engagement.
If we engage brilliantly, we create lifelong advocates.
Thames Water Combined Report 2019/20 12Strategic report Governance Financial statements Annual performance report

Reading
Talking to children about the importance of water
Under normal circumstances, we speak to an average of almost 100 young people a day about the importance of water. During lockdown, our educational team have taken to social media to keep up the conversation with young people.
Across our region
Looking out for customers
We’ve trained our customer agents to proactively identify customers who might need a bit of extra support to pay their water and wastewater bills, and to highlight the options on offer to them. Now, more than ever, many customers need our support and we’re helping many more customers through our social tariffs.
Netley Mill
Delivering bottled water
After a problem at Netley Mill water treatment works led to supply interruptions in the local area, teams set up two ‘drive-thru’ bottled water stations where water was put directly into the boots of customers’ cars to maintain social distancing. Our customer care teams also dropped water to care homes and the doorsteps of vulnerable customers in the area.
ESG performance
Over 80,000customers on priority services register
Over 150,000customers on social tariff
Thames Water Combined Report 2019/20 13Strategic report Governance Financial statements Annual performance report
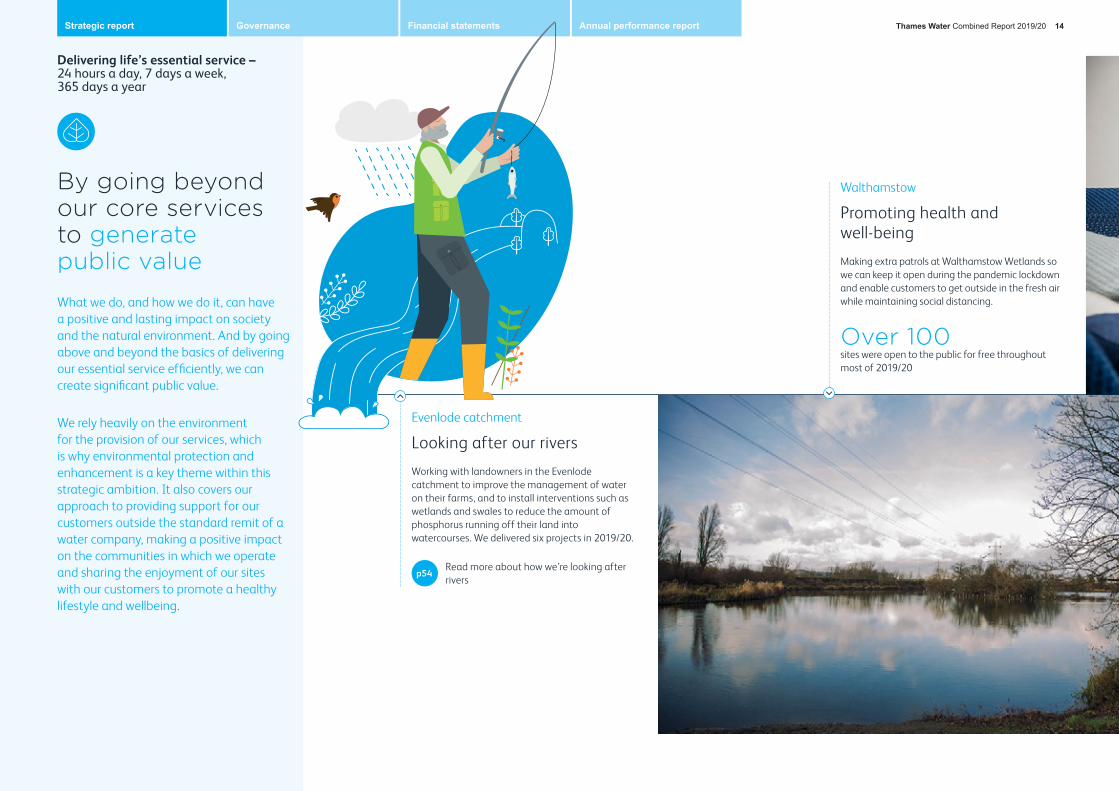
Evenlode catchment
Looking after our rivers
Working with landowners in the Evenlode catchment to improve the management of water on their farms, and to install interventions such as wetlands and swales to reduce the amount of phosphorus running off their land into watercourses. We delivered six projects in 2019/20.
p54Read more about how we’re looking after rivers
Walthamstow
Promoting health and well-being
Making extra patrols at Walthamstow Wetlands so we can keep it open during the pandemic lockdown and enable customers to get outside in the fresh air while maintaining social distancing.
Over 100sites were open to the public for free throughout most of 2019/20
Delivering life’s essential service – 24 hours a day, 7 days a week, 365 days a year
By going beyond our core services to generate public value
What we do, and how we do it, can have a positive and lasting impact on society and the natural environment. And by going above and beyond the basics of delivering our essential service efficiently, we can create significant public value.
We rely heavily on the environment for the provision of our services, which is why environmental protection and enhancement is a key theme within this strategic ambition. It also covers our approach to providing support for our customers outside the standard remit of a water company, making a positive impact on the communities in which we operate and sharing the enjoyment of our sites with our customers to promote a healthy lifestyle and wellbeing.
Thames Water Combined Report 2019/20 14Strategic report Governance Financial statements Annual performance report

Across our network
Preventing sewer blockages during the ‘loo-roll’ shortage
Running a radio and social media campaign to remind customers not to flush wet wipes, tissues and kitchen roll, as they block drains and cause sewer flooding.
The campaign reached
5 millioncustomers over two weeks during the Covid-19 lockdown.
During 2019/20, we also reached
5.4 millioncustomers through our Bin it. Don’t block it campaign
Reading
Supporting debt advice
By donating to our independent trust fund, we’re helping customers in financially vulnerable circumstances who need debt advice. The fund also helped 1,300 customers with life-changing, essential items, such as fridges and washing machines during 2019/20, after we donated £300,000 to the fund. During 2020/21, we aim to invest £1 million.
Crossness sewage treatment works
Our road to net zero carbon
Constructing our new, innovative pyrolysis plant to increase the amount of energy we’re able to generate, as well as make more efficient use of residual sludge. Pyrolysis is the processing of sludge at high temperatures to extract energy
It will enable us to produce
45% more energy from sewage when in full operation.
p56 Read more about pyrolysis here
ESG performance
Commitment to net zero carbonemissions from our operations by 2030
55,000smarter home visits to help customers save water and money
Thames Water Combined Report 2019/20 15Strategic report Governance Financial statements Annual performance report

WaterAbstracted from rivers and aquifers for treatment and supply
2.6bn litresof high quality, drinking water supplied to our customers each day
Our business modelA circular economy
Our peopleOur employees, suppliers and their know-how
over 6,300employees
Wastewater
4.6bn litres of wastewater removed from our customers’ homes each day, before being treated and safely returned to rivers. We also use sewage to generate energy to power our operations and reduce energy costs.
Our financesRevenue and expenditure
£2.2bnin revenue
£1.2bnInvestment in assets
Our land and propertyNeeded to collect, treat and return water to the environment, and also rich in wildlife and recreational opportunities
97water treatment works
354sewage treatment works
How we deliver on our purpose What we use to create value
We provide clean and safe drinking water, and environmentally responsible wastewater treatment, to our customers every day.
Our service is one of the building blocks of a healthy and prosperous society, both now and in the future.
What we do is essential, and the way we do it is incredibly important.
Thames Water Combined Report 2019/20 16Strategic report Governance Financial statements Annual performance report

Biosolid and wastewaterseparation
THP and ADsludge treatment
Incineration
Recycle to land to providenutrients for crops
Nutrient rich sludge isrecycled to land, avoiding the
use of man-made fertiliserto grow foodcrops
Aggregate for constructionThe residual ash from our
sludge powered generator is used to create synthetic
aggregate, avoiding landfill, the extraction of natural resources and associated
carbon emissions
Electricity generatedSludge is used to produce
renewable energy, avoiding the use of fossil fuel
electricity from the grid
Residual ash
Our water cycle
1 Abstraction from rivers and aquifersWe minimise the impact of abstracting water by monitoring river levels. That way we can abstract water more efficiently to boost reservoir levels when water levels are high
3 Deliver directly to customers’ homes and businesses via our network of pipesEncouraging water efficiency is an essential part of our long-term plans to manage water more sustainably. We’re delivering water efficiency initiatives for households, businesses, schools, local authorities and housing associations
2 Clean water at our treatment worksEvery day we supply drinking water to nearly
10 million people across London and the Thames Valley
4 Remove wastewaterTo protect public health and the environment, we collect and treat sewage from our
15 million customers, using our sewer network to transport it to one of our sewage treatment works
5 Treat wastewater at our sewage treatment worksWastewater and the solid by-product, sludge, are separated and both are treated to high standards
6 Safely return clean water to the environmentTreated wastewater is recycled safely to rivers
Smarter water catchmentsHelping improve river water quality in the environment, avoiding the need for additional treatment which would affect the environment and customers’ bills.
Our business model continued
Thames Water Combined Report 2019/20 17Strategic report Governance Financial statements Annual performance report

In a monopoly sector like the water industry, it’s our economic regulator, Ofwat, which provides an alternative to competition. It drives performance and delivery, and determines the prices we can charge. We’ve just completed the latest price review process – PR19 – which determines our bills until 2025. Our average combined household bill for 2020/21 is £397.
We’ve invested more than £16 billion in our assets over the last 16 years to increase the resilience of life’s essential service across our region. As with the two previous financial years, our profits for 2019/20, after taking into consideration the dividends made to service group debt obligations and working capital requirements, are being reinvested in the business.
The water cycle is a true circular economy. We’re driving efficiency in the cycle to increase our contribution to a circular economy, through energy generation, recycling sludge to land and creating aggregate for construction.
How we generate revenue
Reinvesting for the long-term
Our contribution to the circular economy
Our business model continued
4p GovernmentWe paid over £196 million in business rates, PAYE and national insurance contributions in 2019/20
We have not paid any corporation tax, primarily due to tax deductions for our interest payments and because of heavy investment in our network, for which we receive tax relief under the Government’s “capital allowances” regime
64p Customers (and suppliers)24p – Operational expenditureTo provide our day-to-day services and improve our customer service30p – Investment in our infrastructureTo increase the long-term resilience of our services, including 3p for Thames Tideway Tunnel5p – Energy to power operationsTo keep this cost down, we’re increasing the amount of electricity we self-generate
5p net profit which is reinvested
15p LendersBy borrowing money at efficient rates, we’re able to continue investing heavily in our infrastructure while keeping customer bills as low as we can
17p Paying our peopleSo we’re able to deliver essential services to our customers and protect the environment
External shareholdersOur external shareholders have not taken a dividend in the three years to 2019/20, so the money could be reinvested in the business to improve performance
The value we share with our stakeholders
How we spend every £1
of revenue
Thames Water Combined Report 2019/20 18Strategic report Governance Financial statements Annual performance report

Stakeholder engagementEngagement is at the core of our business
To deliver brilliant customer engagement is one of our strategic ambitions, and we want to make every interaction as positive as possible. That builds lifelong advocates and is crucial to us understanding individual customer needs and preferences, so we can focus on what matters most to them.
Working in partnership with our customers helps us increase our resilience and drive an efficient water cycle, for example customer education drives water efficiency and better flushing habits. We continue to measure the effectiveness of our engagement through customer satisfaction and brand perception surveys, with the findings used to improve our service and inform our engagement.
What our customers expect of us • To be treated as individuals
• A clear plan for the future, ensuring long-term resilience and future supply
• A personal, proactive service, resolving issues quickly and efficiently
• A safe, dependable wastewater service; reducing sewer flooding
• A safe, dependable water service; including a constant supply of high-quality water and leakage reduction
• A responsible, ethical and transparent company that supports customers in vulnerable circumstances and improves and protects the quality of rivers
How we engageEvery day we engage with thousands of our customers in lots of different ways
To deliver customer service and look after customers’ needs
• Phone call and text • Written communication via letter, email and
social media • Through up-to-date information on our website • Face to face engagement with customers
during incidents
To promote health and wellbeing • Opening over 100 sites to the public for free, and
offering recreational activities such as fishing
To make sure there’s enough water to go around • Education programme
• Marketing campaigns to promote water efficiency
• Smarter Homes and Smarter Business Visits
To keep our sewers healthy and protect customers from sewer flooding
• Letters and texts to hotspot areas • Targeted marketing campaigns to discourage the
flushing of wet wipes and other ‘unflushables’ • Media campaigns
To understand key issues and make a positive impact in communities
• Quarterly brand perception surveys with customers to understand their view of Thames Water and the service we provide.
• Customer research focus groups about helping with leaks on customer pipes and how we finance our company
• Events such as TideFest and by providing tap bars at public events such as Ride London and the Notting Hill Carnival
• Community investment projects • Via customer groups such as our Customer
Challenge Group and the Consumer Council for Water
Positive, proactive and constructive engagement with all our stakeholders is crucial in the pursuit of our purpose, to deliver life’s essential service, so our customers, communities and the environment can thrive.
Working in a geographically and socially diverse region, we run an extensive programme of engagement with a wide range of different stakeholders to understand and address their individual needs and concerns.
As we face increasing challenges around climate change, growth and our ageing network, we’re evolving the way we engage and collaborate with our stakeholders, and we’ve started a comprehensive review of our approach. It will look at areas including systems and processes; relationships with individuals and organisations, and how we work with the communities we serve. The review will inform both our day-to-day approach in the shorter term as well as our engagement leading up to and during the next price review in 2024. Together we can make the right decisions to deliver a resilient, life essential service for London and the Thames Valley. For more information, see section 172 on page 79 and Board workforce engagement programme on page 89.
Customer engagement
Some of the ways we’re using customer insightUsing insight from our engagement with customers in vulnerable circumstances we have modified our priority services communications – the language, the colour contrasts, and channel offering. Our colleague training to support customers with priority services was also informed by this engagement. Feedback from a number of leakage engagement sessions with customers has also provided important insight in creating the new “report a leak” functionality and incident management areas on our website, and we’ve seen in increase in the number of customers using this as a result.
Thames Water Combined Report 2019/20 19Strategic report Governance Financial statements Annual performance report

Stakeholder engagement continued
We directly employ thousands of people across the South East of England and work with many more contractors and suppliers. Listening to our employees and understanding how they feel is crucial to the successful delivery of our priorities – we’ve been making big improvements to the way we engage with our employees during 2019/20.
Investment in new IT equipment and capabilities has meant we’ve been able to continue engaging effectively with our employees during the Covid-19 lockdown, including through our new, virtual presentations which have been regularly attended by thousands of employees.
What they expect• To have clear priorities, and to understand how
their role contributes to the delivery of our purpose, long-term strategy and near-term priorities
• An inclusive environment where their individuality is celebrated, and their views and ideas are listened to
• Management which lives our values and behaviours, and listens to, recognises and develops their teams
Driving outcomes through engagement To engage in a two-way dialogue so we can make better decisions and engage everyone with our purpose, strategy, challenges and success stories• Annual employee survey (right)
• New – Live and interactive webcasts with senior management – launched in 2019/20
• Meet and greets with our Executive team
• Manager briefings and facilitated team meetings
• Manager 1-2-1s
• Regular emails from senior management with opportunities to feed back
• New – Launched mechanisms to have a two-waydialogue about what we could improve about our business
• Yammer – our social media platform, BlueBytes – our internal website and Source – our longstandinginternal magazine
• New for 2020/21 – a ‘pulse’ survey during the Covid–19 pandemic provides a more real-time view of how our people are feeling during this unprecedented time, when keeping our essential services running smoothly is more critical than ever
• New Bi-annual employee engagement forum
To foster the right culture and promote diversity and inclusion• Promoting values and behaviours through
performance management and assessment
• A range of employee networks including BAME, DisAbility, LGBT+, Women’s and Multi Faith networks
• Mental health ambassadors across the business engage proactively and reactively with employeeswho need support
Employee engagement
Board workforce engagement programmeFollowing the appointment of Ian Pearson as our Workforce Engagement Lead Director, he worked with other members of the Board to engage with employees across the business, understand their day-to-day challenges and ensure their feedback is appropriately considered by the Board. As well as meeting employees on an ad-hoc basis, a monthly programme of engagement was put in place so Ian and his peers could make sure they met with and listened to teams from different disciplines including front-line operations, providing employees with greater opportunities to engage face-to-face with Directors. As part of the engagement programme, representatives from each of the three trade unions recognised by Thames Water – Unison, GMB and Unite – attended the first bi-annual employment engagement forum chaired by Ian Pearson, which was also attended by our lead engagement champions from each area of the business.
Annual employee survey – Hear for you
Over 84%of employees took part in our annual survey, our highest ever response rate
64%After a period of change and a restructure within the business, our overall engagement score of 64% was down on last year (2018/19: 71%) – it’s not where we want it to be and we’re making changes to improve this score, however it highlighted that employees felt comfortable expressing how they’re feeling. It also gave us a better understanding of what we can do to make our employees feel happier and more engaged at work. Improving the way we engage and support our employees is fundamental to our people strategy and we hope the improvements we have made, and will be making, will have a positive impact on the way our people feel
76%of employees believe that we’re an inclusive, equal opportunities employer
73%of employees believe they can strike a good work/life balance
86%of employees said, ‘health and safety is taken seriously at Thames Water’.
Thames Water Combined Report 2019/20 20Strategic report Governance Financial statements Annual performance report

How we engage with our stakeholders continued
Investors
Our debt and equity investors play an important role in funding our investment needs which allows us to serve the long-term interests of customers and the environment
Regulators
Our business is managed through a regulatory framework, with our main regulators being Ofwat, the Drinking Water Inspectorate, the Environment Agency, Natural England and Historic England.
NGOs and community groups
Many community groups and non-governmental organisations (NGOs), particularly those focused on the natural environment, take a keen interest in our activities
What they expect • An open dialogue with the business, in order to understand
performance, opportunities, risks and challenges
• Timely updates via group calls, presentations and/or 1-on-1 meetings with a balanced view of performance
• Access to key information via publications such as the Annual Report, Investor Report, ESG Statement, Green Bond Impact Report and Debt Prospectus
What they expect • To understand our business strategy and long-term plans
• Proactive engagement about performance, in line with agreed targets, and issues that could have an impact on our customers and the environment
• For us to work collaboratively with regulators and peers to help shape the future regulatory agenda and drive maximum benefit for customers and the environment
What they expect • For us to make a positive contribution to communities, and
protect and enhance the natural environment
• To proactively engage on local projects and initiatives which will directly affect them
How we engage • Equity investors have direct communication with the Board
and Executive Directors, with four external shareholder representatives sitting on the Board
• Face-to-face briefings with senior management
• Operational site visits
• Regulatory information disclosures
• Debt investor calls, presentations and meetings to discuss performance
• Making relevant information available on our website
• Investor presentations
How we engage • Engagement at all levels across the business including the Board
and senior management
• Regular performance meetings
• Day-to-day operational meetings
• Long-term strategic planning, including constructive engagement around projects such as the Thames Tideway Tunnel and proposed reservoir in Oxfordshire
• Hosted events at our sites
• Engagement with regulators through joint working groups on key topics, such as the impact of the Covid-19 pandemic
How we engage • Meetings to understand their views on our work in their areas and
to inform neighbourhood plans
• Develop partnerships to deliver projects and programmes such as those with Age UK, Citizens Advice Bureau and debt advice charity Step Change
• Face-to-face engagement
• Through the Blueprint for Water coalition, which is made up of organisations with an interest in water policy, including WWF, RSPB and the Wildlife Trusts
Outcome of the engagementExternal shareholders are committed to prioritising the long-term security of supply and are supportive of the notion that financial returns should flow from good business performance. Engagement is a valuable tool to obtain constructive advice and different viewpoints from external shareholders and debt investors.
Outcome of the engagementOur regulators understand our business decisions and act as an important sounding board. Engagement supports regulators in considering the impact of regulatory decisions and new policies on the industry. Fostering strong, trusting relationships means we can openly discuss issues and opportunities, while respecting their roles as regulators and ours as a service provider.
Outcome of the engagementThey are armed with a greater understanding of our community work and improving environmental performance. Partnership working is instrumental to our smarter water catchments work to improve river water quality and the opening of our sites, such as Walthamstow Wetlands. Collaboration also increases the reach of our “Bin it, don’t block it” and water efficiency messaging.
Stakeholder engagement continued
Thames Water Combined Report 2019/20 21Strategic report Governance Financial statements Annual performance report

Stakeholder engagement continued
How we engage with our stakeholders continued
Policy makers and elected representatives
Policy and legislative changes have a significant influence on the water sector and, therefore, our business activities and strategies. Councillors and MPs are interested in how our activities affect the people they represent
Suppliers
Suppliers are a critical part of the effective delivery of water to our customers. We need confidence that the organisations we choose to work with have shared values and support our vision, and that they are able to help us deliver on our services to customers.
Media
The media helps us to communicate our news to our customers and stakeholders. Appearance in the media extends our reach and is an effective way to deliver important messages and share information with a wider audience.
What they expect • For Thames Water to provide a reliable, affordable service – and
to be responsive when things go wrong
• For us to support economic prosperity in the regions we serve
• To play an active role in shaping the future direction of the sector
What they expect • Clear and honest communication
• For us to share information that affects their businesses as early as possible so mitigating plans can be made
• Information about upcoming opportunities
• To understand how we view their performance, whilst being given the chance to feedback on our processes
• Fair procurement processes
• The opportunity to engage to drive improved outcomes through innovation
What they expect • For us to be open and transparent
• For us to be available to provide timely information during incidents around the clock
How we engage • We engage on a wide variety of issues through a structured
programme of discussions with officials at all levels of Government, MPs, councillors and London Assembly Members
• We discuss and contribute to the development of policies affecting water and the environment, and changes to legislation
• We invite stakeholders to our sites and projects to give them first-hand experience of Thames Water
• We hold memberships with groups such as London First and BiTC which help magnify our voice to policy makers
How we engage • Direct emails and newsletters
• Discussing best practice at health and safety conferences and category forums
• Review performance at quarterly meetings
• Facilitate engagement with our operational teams via on-site “meet the supplier days”
• Engagement with the wider supply market through high profile pre-tender market engagement and launch events
• Host “innovation exchanges” to encourage new solutions and partner with organisations representing the supply chain
How we engage • Publishing news on our social and digital channels
• Regularly offering stories on a range of subjects and sharing information
• Media briefings and filming opportunities
Outcome of the engagementFeedback provides insight to improve delivery of projects in the communities we serve and inform future plans. It supports successful delivery of major projects like the Thames Tideway Tunnel and site upgrades. It keeps us close to changes to policy that affect the regulatory environment in which we operate.
Outcome of the engagementEngagement helps build a diverse supply community. It keeps us at the forefront of market trends and allows us to develop our operational approach alongside our supply chain, to assist the delivery of our Strategic Ambition. It provides insight to help mitigate risk, improve resilience and drive added value for customers.
Outcome of the engagementWorking with the media has helped raise awareness about the issues that matter most to our customers and communities, including water resources and how we invest to improve service and protect the environment.
Thames Water Combined Report 2019/20 22Strategic report Governance Financial statements Annual performance report

How have you performed operationally?We’ve made great progress during the year in some of our critical performance areas such as leakage, supply interruptions and sewage treatment works compliance, and we’ve continued to excel in health and safety and water quality metrics – our water quality is now better than ever. We set ourselves tough targets and I’m really proud of what the teams across Thames Water have achieved in just one year – we’ve taken a leap forward from where we were last year and that’s despite the impact of the wettest February in history; two severe storms – Dennis and Ciara; and the onset of the Covid-19 pandemic.
However, we recognise there’s still a lot more to do to keep up the positive momentum. We don’t yet know what the lasting impact of Covid-19 will be on our operations and the customers and communities we serve, but we do recognise there are aspects of our operations where we’re still not performing at the levels expected. Getting all the basics right underpins our plans for the future, and reductions in complaints, supply interruptions, pollutions and sewer blockages are key focuses for the coming year.
We continue to face the unique challenges associated with the age and location of our London water network.
To ensure the sustainable provision of our services and be able to protect our customers from the sometimes-devastating effects of a burst, we need to fundamentally overhaul our water network.
What have you been doing to improve service to customers?With our region covering London, the suburbs and small villages, such as those in the Cotswolds, our customer base is socially and geographically diverse, and that presents some unique service and billing challenges in making sure we tailor our approach to meet the needs of all our customers. We have focused a lot of our efforts over the past year in improving our approach to customer communications and supporting customers in vulnerable circumstances. London’s population is also the most transient in the UK, which adds complexity to our billing operations. This is one of the reasons our bad debt is higher and we’ve been taking steps to reduce it so that everyone can pay their fair share. Improving our ‘moving home’ process on our website has been an important part of this. Excluding the effects of Covid-19, our bad debt charge reduced by £4.0 million (6.4%) in 2019/20, however we need to go further.
Looking after our customers in vulnerable circumstances remains core to our plans, and we’ve been increasing our support via our social tariffs, priority services register and independent Thames Water trust fund. With plans to contribute £1 million to the fund during 2020/21, we’re one of the largest funders of debt advice counselling in our region, supporting organisations such as the Citizens Advice Bureau, as they help customers manage their debt. As society realises the lasting impact of Covid-19, these support services are likely to become ever more critical to our customers.
We don’t provide retail services to businesses following the sale of our non-household business in 2017, however we are very mindful they depend on us to deliver their wholesale services and we’ve been making improvements to the service we provide whilst encouraging water efficiency from this important segment of consumers. We’ve also
Kelly MacfarlaneCustomer Services Director
Steve SpencerOperations Director
In tandem, with our longer-term, ambitious plans to replumb London and parts of the Thames Valley which really is the key to driving the change we need, we’re transforming the way we approach the management of our water network to improve performance and operational efficiency. We’ve hired a new Director of Water Transformation who will be leading the implementation of a new operating model which will transform our approach and enhance our capabilities to deliver the improved service our customers expect.
p29 Read more about our response to the Covid-19 pandemic
Innovation is an important part of our DNA, and we’re always looking for more innovative ways of delivering our services and driving efficiency in our water cycle.
p17 Read more about our water cycle
We’re in the final stages of construction of our ground-breaking new pyrolysis plant, which will reduce sludge waste and enable us to generate more energy than ever before, benefiting the environment. While we’ve been making huge improvements, we know this year will be even more challenging as we face some really stretching targets. Rest assured, we as a business and our teams remain committed to delivering strong performance.
improved our services for our broad range of developer services customers, as we support the vast growth in our region.
Whilst we are very disappointed with the overall number of customer complaints during the year for a number of reasons, there were real green shoots. We saw a 24% reduction in our water complaint volumes, as we focused on initiatives to improve performance of our water network during the year.
We made huge progress with the transition of the majority of our 3.6 million customer accounts to our new customer relationship management and billing platform, which was a major upgrade to our legacy platform that was decades old. And we’ve now successfully moved every single one of our customer accounts. As evidenced by others making a similar move, it was fraught with risk, yet we successfully migrated our customers within a relatively short timeframe. We absolutely recognise the move to a brand-new system, the focus and customer engagement it required, had a significant knock-on impact on our billing service performance during the year. Our immediate and current priority is to embed and optimise the system, upskilling our colleagues to unlock the benefits for our customers. We are realistic that will take a little more time, however we have great confidence having successfully completed the transition and observed early performance indicators, about its potential to improve customer outcomes. The continuous improvement of customer satisfaction is our overriding focus for 2020/21 as we work to deliver a step change in our service performance during this regulatory period.
100%accounts now moved to new billing system
While much of our focus during the next year will be to drive efficiency from our new customer relationship management and billing system, we’re also improving our digital customer service capabilities to make it easier for customers to interact with us, how and when they choose.
Q&A with our Executive teamPursuing our purpose
Thames Water Combined Report 2019/20 23Strategic report Governance Financial statements Annual performance report

What role is digital playing?
Over recent years we’ve been stepping up our digital transformation, to get better data about the operation of our network, and to give our people the right tools to be able to operate efficiently and deliver the best service for our customers.
The roll-out of new laptops to employees across the business during the year, with a range of new tools including Microsoft Teams, hugely increased our IT capabilities. It meant we were able to adapt quickly to the evolving impact of Covid-19 on our operations and enable thousands of our employees to work effectively and collaboratively from home during the pandemic lockdown. This widespread testing of the reliability of our IT capabilities opens new opportunities to ways of working as the lockdown eases, giving us more flexibility and allowing us to drive cost and productivity efficiencies. We’ve also been rolling out new data and IT network infrastructure, as we increase our resilience and drive efficiency in our business model.
p9 Read more about our strategy
As we move into the next regulatory period and create the Thames Water of the future, one of our key focuses is to build on the foundations we’ve laid, to upscale the creation of our smarter networks and give us a better view of how our networks are operating in real-time. Part of the initiative involves the development and mass deployment of thousands of innovative, low-cost sewer monitors across the network, as well as the continued installation of smart meters across our region. We’ve also built a range of tools to better interpret our data so we can be more proactive in
How do you feel about the business plan outcome?With extremely stretching performance targets and revenue allowances, particularly in relation to our water network, along with a high penalty rate for any overspend we are facing a very challenging regulatory period. To deliver within the budget parameters set by Ofwat we need to make some tough choices about what we can deliver between 2020 and 2025 and the years beyond this, and that could have a knock-on impact on our future resilience. That said, we decided against a referral to the Competition Markets Authority and we’re embracing the challenge we’ve been set. We remain absolutely committed to delivering a better service to our customers as we pursue our purpose.
It’s also been an important year for our Water Resources Management Plan which received Government approval in March 2020. The plan sets
John Beaumont Asset, Digital and Transformation Director
Nicola CocksRegulation Director
John BentleyCapital Delivery Director
our approach to detecting leaks, predicting and preventing bursts, managing demand and targeting sewer cleaning to prevent pollutions, putting us on the front foot and giving us more control over operational performance. We’ve also created a new tool to give us a more holistic and real-time view of incidents, to enable us to react more effectively.
Our website has been a source of frustration in the past for stakeholders, customers, and employees alike, and we’re in the midst of a major overhaul of the site, due for completion in 2020/21, to increase customers’ ability to self-serve and reduce the pressure on our call centres. That gives them increased capacity to deal with complaints and more complex queries, quickly and more effectively.
out how we intend to provide a resilient water supply for our customers over the next 80 years and considers water storage needs in our region including the proposed reservoir in Oxfordshire, water transfer and water reuse. In tandem, we’re working with our peers in the South East to develop a regional resilience plan, with a draft due in 2022.
Investment in the future of our region is critical and we need the input, support and endorsement of our stakeholders as we shape our longer-term plans, such as those to improve resilience in North-East London and ‘replumbing’ our region. As such we’re evolving the way we engage with our stakeholders, including all our regulators, to increase collaboration and give us better insight as we make decisions that will have an impact on us all.
As well as investment, innovation is key to improving water services resilience across the UK. We need to act now for the benefit of future generations, and we look forward to continuing to engage with Ofwat on their plans for a much-needed innovation fund to rise to the challenge for our customers today and in the future.
What’s your view at the start of this regulatory period? It’s an exciting time for Thames Water and Capital Delivery – this is my seventh regulatory period and there’s always something special about the start of a new one. It’s an opportunity to both reflect and look forward. We finished the regulatory period strongly delivering our contribution to the National Environment Programme; laying 650km of new water mains; and exceeding our Pressure Management programme,
contributing to our best leakage performance since privatisation. We also invested £100 million more in our trunk mains and delivered all our Drinking Water Inspectorate projects except two, due to Covid 19.
£100 millionmore invested in trunk mains
And more of our people than ever before have been kept safe from the hazards prevalent in construction. We’re really proud that between 2015 and 2020, we had a RIDDOR rate of 0.09 and Lost Time Incident rate of 0.11, outperforming other major infrastructure programmes.
As we take more control of the capital programme, we’re transitioning to a new Intelligent Client model. This will see us control the key investment and delivery decisions and allow our suppliers to focus on what they are great at – safe, efficient and effective construction. We’ve already started insourcing capability and we’ll be developing our own as well. At the same time we’re in the final stages of selecting our construction design and build partners. To inject more efficiency and improved service into the delivery process, we’re targeting higher levels of productivity through the use of technology and digital tools, including AI, faster decision making, better risk management, more off-site manufacturing with digital rehearsals and using some of the innovative ways of working we’ve adopted as a result of the pandemic, such as remote visits and remote commissioning.
We also have a number of large projects underway this year – the upgrade of Beckton sewage treatment works, in readiness for the Thames Tideway Tunnel, will start as well as the upgrade to Mogden sewage treatment works, and the relocation of Guildford sewage treatment works will be tendered. Finally, I want to highlight the emerging impacts of Covid-19 on our delivery programme – whilst we’ve identified a few benefits ,our investment activity levels in 2020/21 will be lower than we originally planned, however we will plan to catch up this deferment in the next year or two.
Q&A with our Executive team continued
Thames Water Combined Report 2019/20 24Strategic report Governance Financial statements Annual performance report

Q&A with our Executive team continued
What were your first priorities? Having a strong sense of purpose drives better outcomes for our customers and the environment.
That’s why one of my first priorities was to engage with the business to define a purpose which really captures our fundamental reason for being and drives everything we do.
And over the last few months we’ve been talking to the entire business about how our purpose – to deliver life’s essential service, so our customers, communities and the environment can thrive – links with our strategy, near-term priorities, values and behaviours. In the face of the Covid-19 pandemic and the need to provide resilient essential services it’s clear our purpose is the right one.
How are you supporting your people? Our people are, and always have been, fundamental to us delivering for our customers, communities and the environment. We want to ensure that everyone in Thames Water is aligned with our purpose, is supported and valued in their roles and is enabled to be the very best they can be.
Together, our purpose, strategy, values and behaviours provides us with our bigger picture, so we understand how we all fit together to help make Thames Water a great place to work.
In 2014, many of our people were involved in articulating our values and over the years these values have guided our decisions and actions. In recent years, we did lose a little focus on the importance of our values so it has been important to remind and re-connect with them. And we have built on this strong foundation by developing new, measurable behaviours to further signpost and embed how we are expected to behave at work. Our new behaviours describe the ‘how’ and will underpin all of our people processes, such as our performance development reviews that connect everyone’s personal objectives with our Strategic Ambition.
Lynne GrahamHuman Resources Director
During this unprecedented time, we’ve been communicating regularly with our employees, customers and stakeholders about how we’re adapting to the evolving situation and ensuring the sustained delivery of the services they rely on.
Being more sustainable is a longstanding commitment of ours, and one of our key areas of focus over the next ten years is to reduce the carbon emissions from our operations to zero, and then beyond. Our commitment to sustainability aligns with our strategic approach to generating public value and going beyond the delivery of our basic services to deliver better outcomes for our customers, communities and the environment.
p50 Read more about our approach to sustainability
We’ve also been overhauling our approach to incident management – while parts of it were working well, it felt disjointed and inconsistent. We weren’t always clear in our approach to communication with our customers and stakeholders during major incidents, which has been frustrating, so we’ve been making significant changes to the way we do things. In April, we launched a more holistic and aligned approach to improve our internal handling of incidents, provide increased support to our customers and improve engagement with our stakeholders
Authentic and engaging leadership is key to our success. We’ve embarked on a significant programme of management and leadership development. We’ve designed a leadership attributes framework based on three leadership domains – people, personal, performance – and are committed to ensuring our leaders have the right capabilities to support their teams and to drive the delivery of our priorities.
One of our values is ‘to be respectful and value everyone’. We want our people to feel able to bring their whole self to work and we have active networks representing many different diverse communities in Thames Water. We were delighted to be awarded Disability Confident Leader status during the year, as well as jumping over 100 places on the Stonewall Workplace Equality Index, increasing ethnic diversity in management grades and reducing our mean gender pay gap to 8.5%
We’ve also revised our sick pay, maternity/paternity and dependants leave policies into a cohesive family friendly policy to ensure colleagues are supported during significant events in their personal lives as we aim to be upper quartile in family friendly care provision.
Employees rated the question ‘How supported do you feel at work?’ as
8.48/10
Recent months, more than ever, have underlined the importance of putting our people first. One of the first decisions we took was to confirm that anyone absent as a result of COVID-19 or requiring to self-isolate or requiring to support dependants would receive full pay, irrespective of the normal absence policy. We supported our front-line key workers, both those that continued to work as normal and those relocated to work from home – and in our pulse surveys employees rated the question ‘How supported do you feel at work?’ as 8.48 out of 10.
George Mayhew Corporate Affairs Director
Thames Water Combined Report 2019/20 25Strategic report Governance Financial statements Annual performance report

PeopleInvesting in our people
We have a proud, capable and dedicated workforce, and we’re continuing to evolve our people strategy to support and celebrate our colleagues’ experience of working at Thames Water.
From fostering the right culture and promoting engagement, to driving performance and looking after our safety and wellbeing, we’re focused on creating the right environment to deliver our purpose and make Thames Water a great place to work.
Fostering the right culture Values and behavioursFostering the right attitude and behaviour of our people has a positive impact on our reputation, both as an essential services provider and as an employer, and supports the delivery of our purpose. In 2014 we ran focus groups and engaged with everyone to develop our values and, five years on in 2019, we re-evaluated those values to test their continuing relevance. It was clear that they still resonate with our people, align with our purpose and guide our culture as we head into the next regulatory period. To build on our values and what they mean in practice for each of us every day, we’ve defined new behaviours, which will be embedded in all of our people processes.
Be proud, be blue We celebrate and promote the great things we do
Be respectful and value everyone We embrace differences and work as a team
Be passionate about everything we do We’re enthusiastic and positive
Take care We look after ourselves, our customers and our environment
Take ownership We own problems until resolved
Reach higher, be better We’re always learning, always improving
Restructuring the business During the year, we restructured the business to align with the delivery of our strategy and priorities, and to drive operational and cost efficiency. The restructuring resulted in a number of roles being made redundant, however we were successful in redeploying some individual employees into new or different roles. The restructure has led to more collaboration between functions and we’ve invested in new capabilities to enable us to be smarter in our approach, for example, in the use of data and in the way we communicate with our customers.
A resilient workforceAs we focus on our longer-term priorities, it’s important we’re hiring and developing the right skills and expertise within our workforce.
We have a longstanding graduate programme with 27 former graduate trainees currently in management roles across Thames Water. In September 2019 25 graduate trainees were recruited, 11 undertaking the operations pathway, 6 in science, 5 in engineering and 3 in finance.
We run a successful apprenticeship scheme, with 28 apprentices joining our company in 2019/20, making a total of 131 during the 2015 to 2020 regulatory period. Our apprentices are hired on a permanent contract and complete an extensive programme of on and off the job learning both at College/University and in the workplace. Already running programmes in engineering and science, we’re planning to build on our apprenticeship programme in 2020/21, expanding into areas such as digital and customer service to help increase the competence and resilience of our workforce in all areas of the business.
Inspiring the engineering workforce of the future is an important part of our longstanding education programme, with the promotion of STEM skills featuring in our engagement with thousands of young people during 2019/20.
Our approach to human rights, modern slavery and ethicsOur code of conduct covers our approach to business activities and how we work, providing a clear, ethical and legal framework for our employees, customers and stakeholders. All elements of our code of conduct apply to both our permanent and temporary employees and our contractors and alliance partners have committed to follow the provisions of this code.
Underpinning the code of conduct and in line with human rights principles, we have a range of policies covering health and safety, equality, diversity and inclusion, anti-corruption and bribery, human rights and modern slavery and honest and ethical behaviour. These policies are available on our website. We also have a 24-hour Employee Assistance Helpline available and a robust whistleblowing mechanism in place.
Thames Water Combined Report 2019/20 26Strategic report Governance Financial statements Annual performance report

2019/20 saw us drive another reduction in both mean and median pay gaps, since we first reported our pay gaps as at 5 April 2017
Mean gender pay gap
8.5%Mean gender pay gap reduced from 10.4% as at 5 April 2019
Median gender pay gap
11.2%Median gender pay gap reduced from 12.2% as at 5 April 2019
Bonus gap • mean gender bonus gap (including management
bonus, incentive payments and money-based awards) has decreased to 39% and the median gender bonus gap has decreased to -10.1%.
• proportion of females who received a management bonus increased from 6.4% as at 5 April 2019 to 8.1% at 5 April 2020 compared with 7.6% for men. If we include money-based awards the proportion is 44.6% for females compared with 38.2% for men.
• introduced a non-contributory ‘share in your success’ bonus scheme for everyone not eligible for the manager bonus.
*For this report we’ve excluded an allowance paid to our Network Service Technicians (NSTs) which most closely approximates “pre-paid” overtime and distorts the outcome.
Diversity across the business As at 5 April 2020:
33%/67%Salaried employees 2,077 female; 4,343 male
17%/83%Board – 2 female; 10 male (including Interim Executive Chairman and Executive Director)
33%/67% Executive team – 3 female; 6 male (including Interim Executive Chairman)
39%/61%Direct reports of senior management 32 female; 51 male
First female CEO appointedp124 Read more about our remuneration policy
Celebrating the strength of individualityPromoting diversity and inclusion is at the forefront of our people strategy, as we value and harness the unique skills, experiences and background that each individual brings to their role at Thames Water. And we’re making good progress, as we continue to take steps to maintain an inclusive workplace and to ensure the diversity of our workforce better reflects the diversity of our customer base.
During 2019/20 we saw an increase in Black, Asian and Minority Ethnic (“BAME”) in management and leadership positions to 10%, and a year-on-year reduction in our mean gender pay gap to 8.5% (see left) – that means we’ve reduced our gender pay gap by 4.8% from 13.3% (as at 5 April 2017) in just three years. In January 2020 we became 189th of more than 500 companies in the Stonewall Workplace Equality Index, a leading benchmarking tool for LGBT inclusion in the workplace. Jumping 113 places since last year, we met our target to be in the top 250, which is testament to our commitment to be an inclusive organisation.
We also became the first water company to be awarded the coveted Disability Confident Leader status in July 2019. This is the highest award in the UK Government’s nationally recognised accreditation scheme to attract, recruit and retain disabled employees including people with long-term health conditions. It recognises our continued success in improving access at our sites; the implementation of “adjustment passports” – a tool designed in partnership with occupational health to help employees and managers make adjustments to support employees in the workplace; and our Give Someone A Start programme. Since the pilot in September 2012, this programme has given valuable work experience opportunities to people who are not in education, employment or training, as well as those with physical and mental disabilities who need extra support – within the last year, 40% of candidates secured a job at Thames Water after completing the programme. As part of our approach to ensure we continue to address the needs of those who might need extra support in the workplace, we have a DisAbility employee network. The network
People continued
Gender Pay GapApril 2020 – Excluding NST Additional Pay*
Female 40.5%Male 59.5%
Female 26.6%Male 73.4%
Female 33.4%Male 66.6%
Female 27.1%Male 72.9%
Lower quartile
Upper middle quartile
Lower middle quartile
Upper quartile
Embracing diversity in all its forms makes us both stronger and more effective as a company, leading to a better service for our customers.Our gender pay gap as at 5 April 2020
Thames Water Combined Report 2019/20 27Strategic report Governance Financial statements Annual performance report

runs educational sessions on supporting people with disabilities, with some employees learning sign language to be able to support their colleagues and customers. The group also provides feedback on ‘adjustment passports’ to ensure they appropriately reflect the needs of individuals. During the year, we also hosted mock assessment centres for job seekers with disabilities.
Supporting our employeesHighly engaged employees deliver better service for our customers, so we’re committed to supporting our people both at work and in their personal lives. During the year, we made changes to various policies, to make them more family friendly and give our people comfort they will be supported during major life events, such as the birth of a child. As such, we’ve improved and aligned our maternity, adoption, paternity and shared paternity leave policies, as well as our parental leave and time off for dependents policy. We’re aiming to be in the top quartile of employers in terms of the support we provide our employees.
Ensuring a healthy and safe working environmentThe health, safety and wellbeing of our employees and customers is of paramount importance and we are determined to lead our industry in health, safety and well-being best practice. With that in mind, we’re committed to achieving our vision of “zero incidents, zero harm, zero compromise”, every day we are at work. And it promotes the notion that every employee, without exception, has the authority to stop any activity that can’t be done safely. We also work with our supply chain partners to ensure they also share our “zero compromise” approach and together we produce the Essential Standards – that detail how we work safely in the key activities that we all jointly undertake, but that also influence the wider water industry approaches.
During 2019/20, our colleagues and supply chain partners worked for a combined total of 28.4 million work hours and there was a 41 day gap between injuries requiring a person to take time off work. The number of ‘lost-time’ injuries, where an employee needs to take time off work, continues to be broadly in line with the previous year, however there was a 41% decrease in the volume of days lost for work-related injuries and a 30% decrease in near miss (‘high potential’) incidents. During 2019/20, we started to record ‘Perfect Days’, the number of days in a month without a physical or mental health work-related incident, whether or not it resulted in lost-time absence. The record was 17 days in a month.
Underpinning our activities is our health and safety management system, and during the period the company was audited and successfully achieved accreditation to ISO 45001 – the international standard for management systems of occupational health and safety.
We’ve also seen a 26% decrease in serious incidents reported under the Reporting of Injuries, Diseases and Dangerous Occurrences Regulations (RIDDOR), with an end of year RIDDOR rate at 0.07. Regrettably there was a serious injury at one of our sewage treatment works, when an employee’s arm was trapped in a piece of machinery –the employee is recovering and is expected to return to full employment at Thames Water.
Openness and transparency are key to better health and wellbeing. By reporting potential hazards we’re able to put things right before they cause incidents. During 2019/20 there was a 29% increase in these reports, with over 80,000 being submitted by our employees and supply chain partners. The same cultural behaviours are key to looking after people’s mental health. Creating an environment where people feel confident to be able to talk about their mental health helps reduce the stigma and empowers people to seek the help they might need. We continue to set best-practise trends with our mental health strategy and we have a network of over 460 trained Mental Health First Aiders throughout the business to support our people. They’ve helped drive more proactive and reactive conversations about mental health.
We’re also taking steps to further support physical wellbeing. As well as continuing our personal medical assessment programme, which offers every one of our employees and contractors a free annual health check, we’ve increased the availability of physiotherapy support for both work and non-work related musculoskeletal conditions. As well as looking after the long-term health of our employees, the support helps keep people in the workplace, with an average, employee absence costing businesses £124 a day in lost productivity.
Nurturing our talentDuring 2019/2020, we launched a ‘blended’ approach to training, supplementing traditional classroom learning with e-learning interventions and carried out over 19,500 training days, covering Health, Safety and Wellbeing, technical process and knowledge training, Contact Centre systems, process and behavioural, Personal and Management Development. Our new customer relationship management and billing system is key to improving our service performance, so we’ve transformed our Revenue Contact Centre training, which has introduced a range of training solutions for employees including e-learning, videos, system simulations, interactive PDF’s, Knowledge Management, as well as traditional face to face training. Much of our training to upskill users of our new billing platform, including our partners at Capita and Wipro, has focused on flexible, learner-led, engaging content and delivery so giving our employees more ownership of their learning sche dule and driving a more efficient approach to training, both in terms of time and cost. To improve our oversight of the training process and monitor competency for key roles, we’ve launched a new learning management system, ‘Learning on tap’.
Authentic, capable leadership is crucial to creating a high performance culture and engaged teams. As such, we’ve designed, piloted and are now rolling out two new management training programmes designed to improve the competency of our managers in terms of leadership, strategic thinking and collaboration.
People continued
Thames Water Combined Report 2019/20 28Strategic report Governance Financial statements Annual performance report
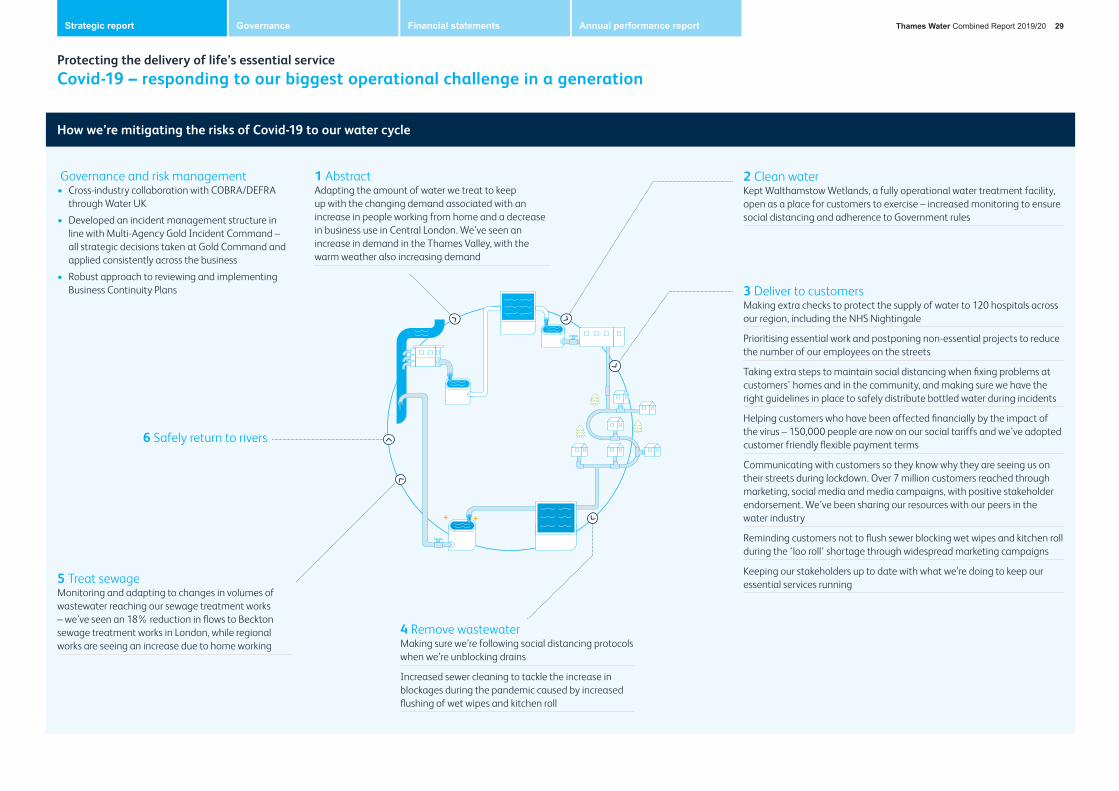
How we’re mitigating the risks of Covid-19 to our water cycle
Protecting the delivery of life’s essential serviceCovid-19 – responding to our biggest operational challenge in a generation
1 AbstractAdapting the amount of water we treat to keep up with the changing demand associated with an increase in people working from home and a decrease in business use in Central London. We’ve seen an increase in demand in the Thames Valley, with the warm weather also increasing demand
Governance and risk management • Cross-industry collaboration with COBRA/DEFRA
through Water UK
• Developed an incident management structure in line with Multi-Agency Gold Incident Command – all strategic decisions taken at Gold Command and applied consistently across the business
• Robust approach to reviewing and implementing Business Continuity Plans 3 Deliver to customers
Making extra checks to protect the supply of water to 120 hospitals across our region, including the NHS Nightingale
Prioritising essential work and postponing non-essential projects to reduce the number of our employees on the streets
Taking extra steps to maintain social distancing when fixing problems at customers’ homes and in the community, and making sure we have the right guidelines in place to safely distribute bottled water during incidents
Helping customers who have been affected financially by the impact of the virus – 150,000 people are now on our social tariffs and we’ve adopted customer friendly flexible payment terms
Communicating with customers so they know why they are seeing us on their streets during lockdown. Over 7 million customers reached through marketing, social media and media campaigns, with positive stakeholder endorsement. We’ve been sharing our resources with our peers in the water industry
Reminding customers not to flush sewer blocking wet wipes and kitchen roll during the ‘loo roll’ shortage through widespread marketing campaigns
Keeping our stakeholders up to date with what we’re doing to keep our essential services running
2 Clean waterKept Walthamstow Wetlands, a fully operational water treatment facility, open as a place for customers to exercise – increased monitoring to ensure social distancing and adherence to Government rules
5 Treat sewageMonitoring and adapting to changes in volumes of wastewater reaching our sewage treatment works – we’ve seen an 18% reduction in flows to Beckton sewage treatment works in London, while regional works are seeing an increase due to home working
6 Safely return to rivers
4 Remove wastewaterMaking sure we’re following social distancing protocols when we’re unblocking drains
Increased sewer cleaning to tackle the increase in blockages during the pandemic caused by increased flushing of wet wipes and kitchen roll
Thames Water Combined Report 2019/20 29Strategic report Governance Financial statements Annual performance report

How we’re looking after our people Working together with our regulators Working with our stakeholders Supporting the supply chain
Looking after the health of our employees by ensuring the right PPE for those on the frontline, encouraging people to work from home where possible, and revising sick and dependent pay policies
Managing our finances to avoid furloughing any employees so we’re able to protect our people and keep our services running
Monitoring absenteeism trends in crucial areas, so we can redeploy employees and provide increased training where necessary to ensure the resilience of our core essential services
Digital investment over the last year has increased our remote working capability across the company, with call agents being able to work from home for the first time.
Robust approach to internal communications to keep staff up to date with company activity and evolving protocols. Introduced a regular survey to understand how employees are feeling
We welcome our regulators’ support during Covid-19 as we work together to support our customers, our people and society, and focus on our core activities. Covid-19 will have an impact on our year one priorities, for example the advice to customers about washing their hands more frequently to hinder the spread of the virus, conflicts with our performance incentive to reduce per capita consumption, and Ofwat has agreed to work with us to reassess our plans when the time is right.
Stakeholders want us to ensure a reliable service for customers and the environment, and to manage the impacts of unpredictable external events, such as the Covid-19 pandemic.
We’ve maintained a frequent and constructive dialogue with key stakeholders, including Defra and the Greater London Authority, to explain our work to continue to deliver our services despite the constraints of restrictions on movement and contact.
This contact has included our Operations Director acting as co-chair of the water sector’s Platinum Incident Management group liaising with Defra; and participating in a weekly discussion convened by the GLA for London utility providers. These discussions, and many others, have helped us gather insights and factor them into our response.
During the Covid-19 pandemic we’ve continued to work closely with our supply chain to make sure they’re well informed of our response to the impact of the virus and the safety measures we’ve put in place. We’ve been issuing a weekly update to them and have continued to engage with them about how confident they are in being able to continue functioning during the pandemic and to answer any questions they may have. We’ve been offering support, both in terms of assistance and adapting our ways of working to enable the supply chain to continue functioning effectively.
Protecting the delivery of life’s essential serviceCovid-19 – responding to our biggest operational challenge in a generation continued
We illuminated our water tower in Tilehurst, Berkshire to show our support for the NHS and the key workers supporting the community and our region during the Covid-19 pandemic
Thames Water Combined Report 2019/20 30Strategic report Governance Financial statements Annual performance report

Ofwat’s outcome delivery incentive (ODI) rewards and penalties link operational performance to company returns.
Here we outline our progress over the regulatory period against all 55 of our performance commitments, aligned with the delivery of our strategic ambitions to invest in resilient systems and assets, to deliver brilliant customer engagement and to generate public value. Further details can be found in table 3A
RAG Rating and DescriptionPerformance at, or favourable to, our committed performance level for 2019/20, or improving trend for T3
Performance within the range allowed without a penalty (the “deadband”) if defined or, if not, within 5% of our committed performance level, or marginal asset health, or stable trend for T3
Performance below the deadband (if defined) or more than 5% adverse to our committed performance level
Performance information either not available, not applicable or not relevant
Rewards£3.13m WB5: Average hours lost supply per property served, due to interruptions > 4 hours
£1.49m SB4: Number of internal flooding incidents, excluding those due to overloaded sewers (SFOC)
£0.51mSC7: Modelled reduction in properties affected by odour
£0.48mSB5: Contributing area disconnected from combined sewers by retrofitting sustainable drainage
Penalties£3.59m WB7: Compliance with SEMD advice notes with or without derogation
£1.02m WB8: Ml/d of sites made resilient to future extreme rainfall events
£0.02m WC5: Deliver 100% of agreed measures to meet new environmental regulations
£0.09m SB7: Population equivalent of sites made resilient to future extreme rainfall events
Our performance commitment outcomes – 2015 to 2020Delivering our core services
Counters Creek SB3: Properties protected from flooding due to rainfall (including Counters Creek project)
As part of our 2015 to 2020 business plan, we were given a £227 million allowance for the construction of a new sewer to protect properties in an area of West London from recurring sewer flooding after rainfall. As part of the pre-project planning process, we identified an alternative and more effective solution, which would be less disruptive to customers and offer better value for money. Under the regulatory framework we’ve incurred an ‘underperformance’ payment of £130 million (2012/13 prices) due to a cancellation of the original project, which is largely made up of the money we didn’t spend and has been applied to our 2020 to 2025 business plan agreement as an adjustment to our Regulatory Capital Value (see glossary on page 263 for a definition).
Thames Water Combined Report 2019/20 31Strategic report Governance Financial statements Annual performance report

Invest in resilient systems and assets
Performance dashboard continued
100.00%
99.98%
99.96%
99.94%
99.92%
99.90%2016 20182017 2019 2020
Compliance with drinking water quality standards (MZC) – Ofwat/ DWI KPI: WB3
2019–20: 99.97%
Target:
100%
Water quality
Performance
99.97%of the tests carried out on our water complied with regulatory requirements in 2019/20
Our best performance in five years
Our water
2.6 billion litresof clean, fresh drinking water supplied to more than 10 million customers every day
650xTap water is up to 650 times cheaper than commercial bottled water
p18 Find out more in our business model
Testing
400,000tests carried out every year on our water
• Samples are taken from reservoirs; treatment worksand randomly selected homes and businesses
• We test our water for more than 50 different parameters, including parasites, metals and even radioactivity
• We carry out most of our testing at our specialist laboratory, but also perform simple tests, for things like chlorine and cloudiness, on site where water is stored at reservoirs and treatment works
• Water is also tested at customers’ homes and businesses and at water sources including the riversand boreholes we abstract from
• We perform 25,000 tests a year to check for pesticides
Activity • We’ve launched a new water quality transformation
programme, working with the DWI, which will help identify potential hazards and will also increase investment to eliminate the risk of cryptosporidium – an illness passed on by parasites.
Nearly 13,000lead pipes replaced in 2019/20 with a newer and safer polyethylene version
• We ‘flush’ water mains to reduce iron accumulation.
• The condition of customers’ pipes can have animpact on water quality
• To improve river water quality, to benefit local ecosystems and reduce the amount of treatment needed at our works, we’ve launched our smarter water catchments initiative, which will help reducethe amount of pesticides leaching into rivers from farms.
p54 Read more about how we're looking after our rivers
Our target, set by the Drinking Water Inspectorate, is 100% compliance
To make our drinking water more accessible to customers on the go, we’ve installed 48 drinking water fountains across London in partnership with the Mayor.
Thames Water Combined Report 2019/20 32Strategic report Governance Financial statements Annual performance report

Invest in resilient systems and assets
Leakage
750
625650675700725
575600
550525500
2015–16 2016–17 2017–18 2018–19
Leakage: WC2
2019–20: 595 Ml/dTarget:
606 Ml/d
2019–20
Performance dashboard continued
What is leakage? Definition and types of leaks
34%of the leaks we fix are at customer properties
Hidden leaks are underground and rarely reach the surface – they are the most difficult to locate
c.98%of the total water lost from our pipes is from these leaks
Visible leaks can be seen above ground and are easier to spot and repair, so they don’t contribute significantly to our annual leakage
Illegal connections contribute to our leakage calculation as unaccounted for water. During the year, we increased our investigations by 29% as we clamp down on those who ‘steal’ water
Performance
95Ml/dyear-on-year reduction in leakage, equivalent to 13.8%
Best performance in over 30 yearsMet target for first time in
four years
What we’ve been doing to tackle leakage Increasing investment
• Average of £1 million a day spent on leakage prevention and maintenance of the network during 2019/20
• Extra c.£100 million invested in largest pipes between 2015 and 2020
Better management • Collaborative, cross-functional Leakage
Taskforce oversees, aligns and prioritises leakage reduction activities
Improved repair and maintenance • 21% average increase in teams fixing leaks
• Average of nearly 1,400 leaks fixed each week
• Almost 20,000 customer leaks fixed
• 13% year-on-year increase in the number of non-visible and customer side leaks we repaired
Using innovation and data to make more informed decisions
• Our 27,000 acoustic loggers helped detect over 65Ml/d of leakage during 2019/20
• Over 400,000 smart meters produce data which helps us locate leaks where continuous water usage is recorded – contributed to over 33Ml/d of leakage reduction during 2019/20
• We’re using a range of digital tools to help us predict which areas of our network are most likely to be leaking and which section of pipes technicians should check in detail for leaks
• We have c.1,700 District Meter Areas (“DMA”s) – each of these areas has different leakage characteristics depending on pipe characteristics, soil type, demand patterns and pumping pressure for example. We’re creating a “fingerprint” for each DMA that will inform the tailored leakage strategy to drive leakage reduction in that area
• An important part of tackling leakage is to understand exactly where the water goes and what is usage, leakage or wastage – for example leaky toilets. Understanding requires piecing together many different data sources to estimate leakage. We’re investing in digitalising and automating this process to ensure we have a more “real time” view of our leakage position. This will improve leakage targeting and detection, and help us reduce leakage
• Calm systems – pressure changes weakens vulnerable areas of the water network, which can lead to leaks and bursts. We’ve been taking steps to ‘calm’ the water pressure in our network, including optimising pump operation and valve monitors, improving training and using new technology to detect and reduce system shock
Challenges
63% pipes over 65 years old
55% of our water pipes are under the streets of London
Thames Water Combined Report 2019/20 33Strategic report Governance Financial statements Annual performance report

Invest in resilient systems and assets
Performance dashboard continued
• Maintained 3-star Environmental Performance Assessment rating
• Record and industry-leading performance in self-reporting incidents during 2019 at 78%
• We met our pollutions target; however we have more work to do after 15 serious pollutions during the year – four at treatment works, three from pumping stations and eight from the sewer network. The latter increased during 2019 when a long period of dry weather followed by heavy rain highlighted blockages in the network, and low flows caused by dry weather led to more serious effects of pollutions on waterways
• There was one environmental prosecution during the year, relating to discharges of sewage from Maidenhead Sewage Treatment Works in June and August 2014
Pollutions performance
350
330
290
310
250
270
230
210
1902015 2016 2017 2018 2019
Total category 1-3 pollution incidents from sewage related premises: SC2
2019–20: 321
Target:
340
• We achieved over 99% compliance against our treated effluent quality permits, our best performance in a decade. We continue to expand our monitoring capability at our treatment sites, to ensure effluent quality continuously meets standards.
What we’re doing to reduce pollutions Using data and innovation
732 sewer monitors installed during 2019/20, bringing the total to 1,700 and detecting
278 blockages. Plans to install thousands more
Working with our customers • Targeting the biggest cause of sewer blockages,
our January to March “Bin It – Don’t Block It” marketing campaign encouraged customers not to flush wetwipes
Better management • Compliance and Pollution Steering group drives
a more proactive approach to the management of our waste network, focusing on root cause analysis to inform tailored mitigation measures to prevent repeat incidents
• New Pollution Incident Reduction Plan, monitored by the Board will track reduction initiatives
Improving our understanding of weather impact • We’re using new technology, have improved
our communication and hired a meteorologist, responsible to better understand and mitigate the impact of adverse weather on our sewer network
• We’re developing adverse weather plans for rainfall, extreme temperatures, wind, lightning, floods and space weather
• We’re trialling site-specific rainfall alerts
What is a pollution? • A pollution is when wastewater escapes sewers
or treatment works and makes its way into a watercourse.
• There are two different methodologies for pollutions performance monitoring – our outcome delivery incentive set with Ofwat as reported in the graph, and our measure set by the Environment Agency. Under the Environment Agency methodology there were 325 total pollutions in 2019, of which 15 were classified as serious pollutions – both total and serious pollutions were in the ‘slightly below target’ and attracted an amber rating.
900kmLargest ever sewer cleaning programme with 900km of sewers cleaned in one year
up 50% on previous year
Being proactive in maintenance
Thames Water Combined Report 2019/20 34Strategic report Governance Financial statements Annual performance report
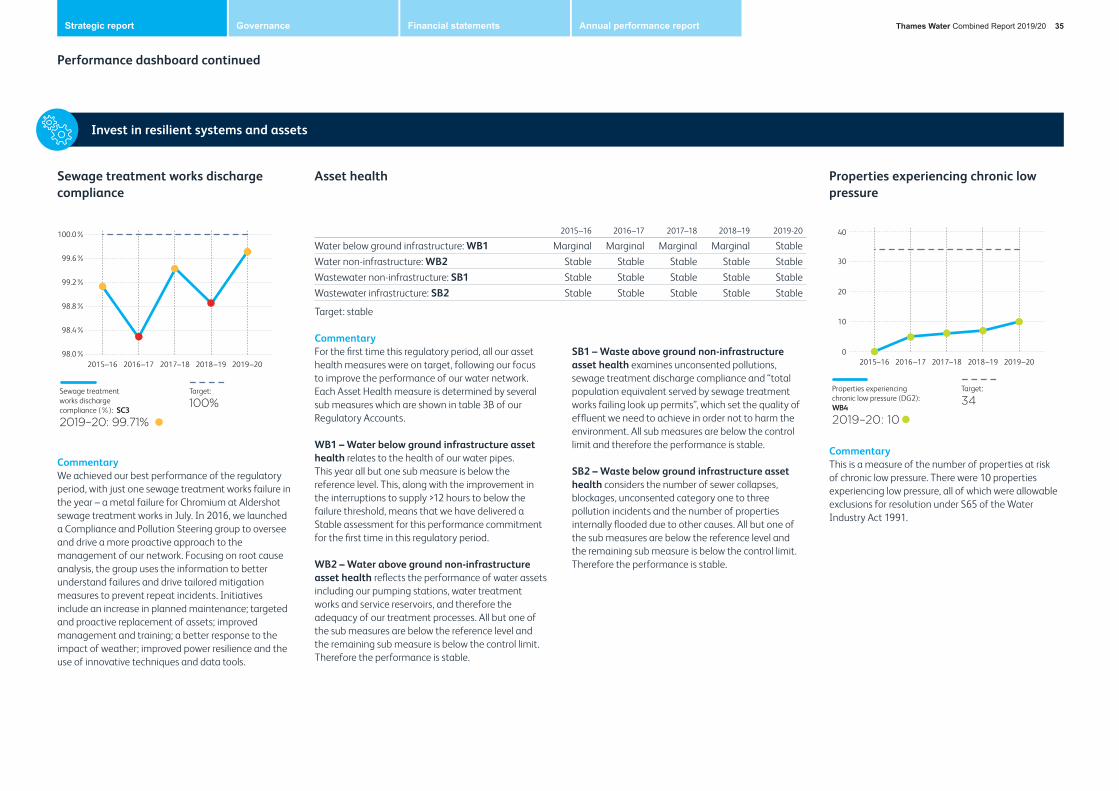
Invest in resilient systems and assets
Performance dashboard continued
2015–16 2016–17 2017–18 2018–19 2019-20
Water below ground infrastructure: WB1 Marginal Marginal Marginal Marginal StableWater non-infrastructure: WB2 Stable Stable Stable Stable StableWastewater non-infrastructure: SB1 Stable Stable Stable Stable StableWastewater infrastructure: SB2 Stable Stable Stable Stable Stable
Target: stable
CommentaryFor the first time this regulatory period, all our asset health measures were on target, following our focus to improve the performance of our water network. Each Asset Health measure is determined by several sub measures which are shown in table 3B of our Regulatory Accounts.
WB1 – Water below ground infrastructure asset health relates to the health of our water pipes. This year all but one sub measure is below the reference level. This, along with the improvement in the interruptions to supply >12 hours to below the failure threshold, means that we have delivered a Stable assessment for this performance commitment for the first time in this regulatory period.
WB2 – Water above ground non-infrastructure asset health reflects the performance of water assets including our pumping stations, water treatment works and service reservoirs, and therefore the adequacy of our treatment processes. All but one of the sub measures are below the reference level and the remaining sub measure is below the control limit. Therefore the performance is stable.
SB1 – Waste above ground non-infrastructure asset health examines unconsented pollutions, sewage treatment discharge compliance and “total population equivalent served by sewage treatment works failing look up permits”, which set the quality of effluent we need to achieve in order not to harm the environment. All sub measures are below the control limit and therefore the performance is stable.
SB2 – Waste below ground infrastructure asset health considers the number of sewer collapses, blockages, unconsented category one to three pollution incidents and the number of properties internally flooded due to other causes. All but one of the sub measures are below the reference level and the remaining sub measure is below the control limit.Therefore the performance is stable.
CommentaryThis is a measure of the number of properties at risk of chronic low pressure. There were 10 properties experiencing low pressure, all of which were allowable exclusions for resolution under S65 of the Water Industry Act 1991.
Properties experiencing chronic low pressure
40
30
20
10
02015–16 2016–17 2017–18 2018–19 2019–20
Properties experiencing chronic low pressure (DG2): WB4
2019–20: 10
Target:
34
Sewage treatment works discharge compliance
2015–16 2016–17 2017–18 2018–19 2019–20
Sewage treatment works discharge compliance (%): SC3
2019–20: 99.71%
Target:
100%
98.0%
98.4%
98.8%
99.2%
99.6%
100.0%
CommentaryWe achieved our best performance of the regulatory period, with just one sewage treatment works failure in the year – a metal failure for Chromium at Aldershot sewage treatment works in July. In 2016, we launched a Compliance and Pollution Steering group to oversee and drive a more proactive approach to the management of our network. Focusing on root cause analysis, the group uses the information to better understand failures and drive tailored mitigation measures to prevent repeat incidents. Initiatives include an increase in planned maintenance; targeted and proactive replacement of assets; improved management and training; a better response to the impact of weather; improved power resilience and the use of innovative techniques and data tools.
Asset health
Thames Water Combined Report 2019/20 35Strategic report Governance Financial statements Annual performance report
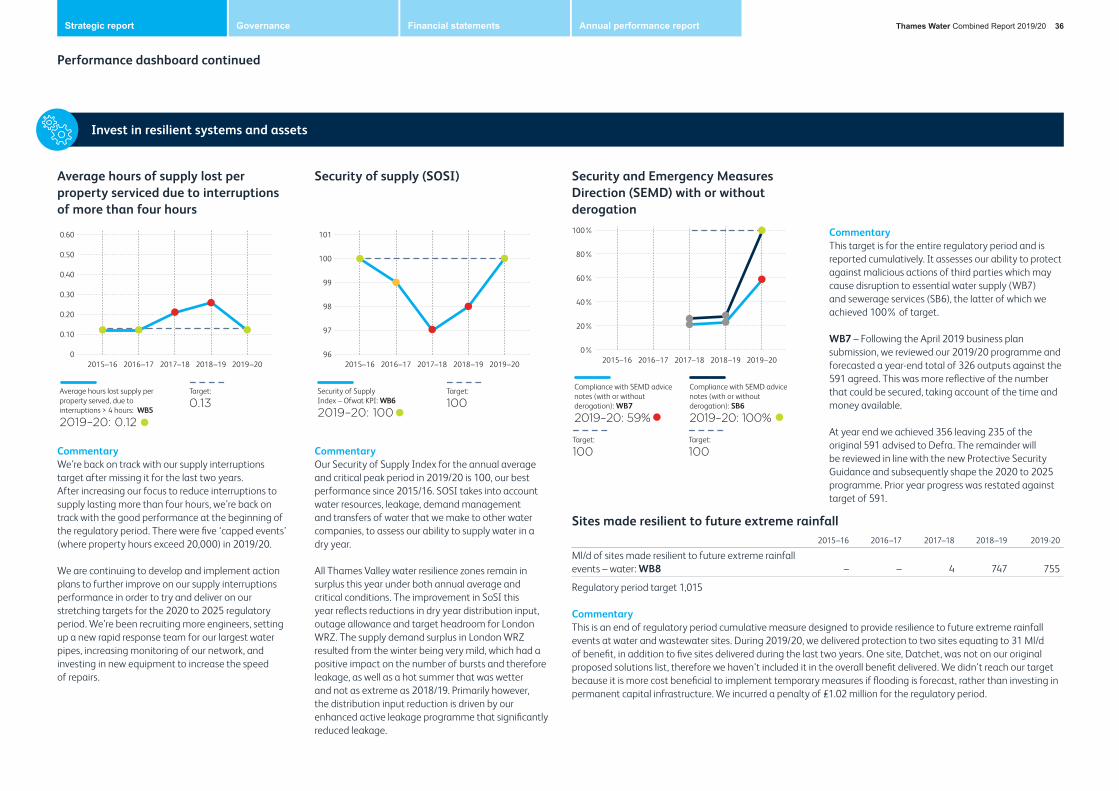
Performance dashboard continued
CommentaryOur Security of Supply Index for the annual average and critical peak period in 2019/20 is 100, our best performance since 2015/16. SOSI takes into account water resources, leakage, demand management and transfers of water that we make to other water companies, to assess our ability to supply water in a dry year.
All Thames Valley water resilience zones remain in surplus this year under both annual average and critical conditions. The improvement in SoSI this year reflects reductions in dry year distribution input, outage allowance and target headroom for London WRZ. The supply demand surplus in London WRZ resulted from the winter being very mild, which had a positive impact on the number of bursts and therefore leakage, as well as a hot summer that was wetter and not as extreme as 2018/19. Primarily however, the distribution input reduction is driven by our enhanced active leakage programme that significantly reduced leakage.
Security of supply (SOSI)
101
99
100
98
97
962015–16 2016–17 2017–18 2018–19 2019–20
Security of SupplyIndex – Ofwat KPI: WB6
2019–20: 100
Target:
100
Invest in resilient systems and assets
CommentaryThis target is for the entire regulatory period and is reported cumulatively. It assesses our ability to protect against malicious actions of third parties which may cause disruption to essential water supply (WB7) and sewerage services (SB6), the latter of which we achieved 100% of target.
WB7 – Following the April 2019 business plan submission, we reviewed our 2019/20 programme and forecasted a year-end total of 326 outputs against the 591 agreed. This was more reflective of the number that could be secured, taking account of the time and money available.
At year end we achieved 356 leaving 235 of the original 591 advised to Defra. The remainder will be reviewed in line with the new Protective Security Guidance and subsequently shape the 2020 to 2025 programme. Prior year progress was restated against target of 591.
Security and Emergency Measures Direction (SEMD) with or without derogation100%
80%
60%
40%
20%
0%2015–16 2016–17 2017–18 2018–19 2019–20
Compliance with SEMD advice notes (with or without derogation): WB7
2019–20: 59%
Compliance with SEMD advice notes (with or without derogation): SB6
2019–20: 100%
Target:
100Target:
100
Sites made resilient to future extreme rainfall2015–16 2016–17 2017–18 2018–19 2019-20
Ml/d of sites made resilient to future extreme rainfall events – water: WB8 – – 4 747 755
Regulatory period target 1,015
Commentary This is an end of regulatory period cumulative measure designed to provide resilience to future extreme rainfall events at water and wastewater sites. During 2019/20, we delivered protection to two sites equating to 31 Ml/d of benefit, in addition to five sites delivered during the last two years. One site, Datchet, was not on our original proposed solutions list, therefore we haven’t included it in the overall benefit delivered. We didn’t reach our target because it is more cost beneficial to implement temporary measures if flooding is forecast, rather than investing in permanent capital infrastructure. We incurred a penalty of £1.02 million for the regulatory period.
Commentary We’re back on track with our supply interruptions target after missing it for the last two years. After increasing our focus to reduce interruptions to supply lasting more than four hours, we’re back on track with the good performance at the beginning of the regulatory period. There were five ‘capped events’ (where property hours exceed 20,000) in 2019/20.
We are continuing to develop and implement action plans to further improve on our supply interruptions performance in order to try and deliver on our stretching targets for the 2020 to 2025 regulatory period. We’re been recruiting more engineers, setting up a new rapid response team for our largest water pipes, increasing monitoring of our network, and investing in new equipment to increase the speed of repairs.
Average hours of supply lost per property serviced due to interruptions of more than four hours
0.60
0.50
0.40
0.30
0.20
0.10
02015–16 2016–17 2017–18 2018–19 2019–20
Average hours lost supply per property served, due to interruptions > 4 hours: WB5
2019–20: 0.12
Target:
0.13
Thames Water Combined Report 2019/20 36Strategic report Governance Financial statements Annual performance report

Performance dashboard continued
Invest in resilient systems and assets
Thames Tideway Tunnel
Bazalgette Tunnel Limited, known to the public as Tideway, was appointed as the independent infrastructure provider responsible for the construction of the 25km Thames Tideway Tunnel. The construction project hit some key milestones during 2019/20. Excavation of the main tunnel passed the halfway mark in February 2020, while 16 of the project’s 21 shafts have now been fully excavated. The project celebrated the completion of a 5km section of tunnel between Kirtling Street and Carnwarth Road and the project’s first Tunnel Boring Machine breakthrough at King George’s Park. 2019/20 also saw the peak in river transport for the project, with 3.3 million tonnes of material moved by river, avoiding 400,000 HGV journeys. The health, safety and wellbeing of everyone on the project is a top priority and there have been no major injuries or significant incidents relating to construction or marine operations to date.
We are responsible for the connecting works and our working group, the Tideway Integration Group (TIG), worked collaboratively with Tideway, and achieved major milestones during the year. We made significant progress at the three tunnel “System Works” sites with all planned civil construction works for the 2015-2020 regulatory period completed at Shad Thames, Bekesbourne Street and Beckton sewage treatment works, ahead of the dates required by Tideway. We have also been planning, preparing and investing in critical assets which will support Tideway commissioning planned for 2020 to 2025. The TIG has worked closely with a number of key stakeholders, including the Environment Agency, with whom new Operating Techniques were agreed for the London Tideway Tunnels system.
The Thames Tideway Tunnel is due to be completed in 2024
T1A – Successful procurement of the Infrastructure ProviderThis scheme was delivered in 2015/16.
T1B – Thames Water will fulfil its land related commitments in line with the TTT programme requirements
T1C – Completion of category 2 and 3 construction works and timely availability of sites to the Infrastructure Provider
T2 – Thames Water will engage effectively with the infrastructure provider, and other stakeholders, both in terms of integration and assuranceA survey of relevant stakeholders on the Liaison Committee associated with the Thames Tideway Tunnel project was conducted. A significant majority have agreed that in terms of integration and assurance, and from the interviews completed so far, it indicates we will be reporting ‘effective engagement’ again this year, is in line with the current target.
T3 – Thames Water will engage with its customers to build understanding of the Thames Tideway Tunnel project. Thames Water will liaise with the IP on its surveys of local communitiesSurveys of a representative sample of our customers were conducted to measure the awareness and understanding of the Thames Tideway Tunnel project and its benefits.
15
12
9
6
3
02015–16 2016–17 2017–18 2018–19 2019–20
T1B – Thames Water will fulfil its land related commitmentsin line with the TTT programme requirements
2019–20: 1
25
20
15
10
5
02015–16 2016–17 2017–18 2018–19 2019–20
T1C – Completion of category 2 and 3 construction works and timely availability of sites to the Infrastructure Provider
2019–20: 23
All access was completed in the year in line with the requirements of the Tideway programme.
This measure which reports completion of category 2 and 3 construction works, has an end of AMP target and is reported cumulatively from the beginning of the AMP.
Two sites were due for completion in 2019/20 bringing our AMP end total to 23 sites.
Thames Water Combined Report 2019/20 37Strategic report Governance Financial statements Annual performance report

Performance dashboard continued
Deliver brilliant customer engagement
We’ve seen an improvement in our written water complaints during the year, however a disappointing, but not entirely unexpected, performance relating to charging and billing complaints as a result of our major system upgrade.
Water written complaintsWe saw a 24% year-on-year reduction in water services written complaint volumes in 2019/20.
Written complaints about supply interruptions are down by 59%; complaints about leaks are down 25%; and low pressure complaints are down 24%. This reinforces the progress we’ve made in the performance of our water network during the year.
We’ve also made improvements in reducing complaints relating to other areas of our water services. Complaints about customer side leakage and the speed of repairing them are down 21% year-on-year, and those about the condition or maintenance of our pipework and assets were down 5% year-on-year.
Charging and billing written complaints Complaints relating to billing and charges have more than doubled during the year. This is particularly disappointing for both our customers and our colleagues and remains a key focus area for the forthcoming year. A high number of these complaints occurred between December 2019 and March 2020 for two key reasons.
Firstly, an increase in complaints during our annual billing cycle and following our transition to our new billing engine and customer management system. The billing system upgrade meant our customers received new account numbers and online registration details which caused some inevitable frustration and confusion resulting in higher volumes of customer contacts and complaints.
Secondly, an IT issue meant there was a delay in responding to a batch of email customer contacts in the final quarter. We acted urgently to address this issue, but it resulted in complaints as we failed to respond to those customer enquiries in a timely manner.
Waste written complaints The prolonged wet weather of the autumn and winter impacted our overall wastewater complaint volumes which increased by 6%. As a result, we saw a spike in complaints relating to flooding and blockages. This reflected customers’ experiences of sewers becoming overloaded by the heavy rainfall and their understandable disappointment where we were unable to attend to clear blockages the same day. During this period we needed to extend our lead time to the next day due to the significant increase in volume.
Complaints about flooding are up 60% and blockage complaints are up 41% reflecting the impact of the wet weather.
Specifically, we saw an increase in flooding due to sewers becoming overloaded and customers were understandably disappointed we were unable to resolve all blockage issues on the same day due to the significant increase in volumes.
Odour complaint volumes were 19% lower than last year with steady reductions across 2019/20 as a result of work with local communities to mitigate this.
What we’ve been doing to improve complaints performanceImprovements in water network led to improved water complaints performance
24% reduction in written complaints relating to our water services after improvements in the way we manage our water network
25% reduction in complaints about leakage
Getting things right first time
88%water complaints resolved first time, 86% of waste and 92% of charging and billing
Investment in new billing system
100%customer accounts now moved to new customer relationship management and billing platform, with 94% transitioned during 2019/20 and the remainder since year end
TrainingUpskilling 1,300 employees on new system
We’re also:Offering a wide range of communication channels including phone, email, webchat, webforms, our dedicated website tool and social media
Improving speed to fix leaks in response to customer feedback and further support to fix customer side leaks
Dedicated case management of follow on work in the case of complex network issues, repair and upgrades
Improving our website to enable customers to better self-serve, whilst also freeing up our contact centre to colleagues to case manage more complex customer queries
Improving our digital contact channels remains a priority as we build on the foundation of our new billing and customer platform to digitise high volume customer journeys to improve customer satisfaction.
Call centre colleagues enabled to work from home during Covid-19, keeping all our services running
2020/21 target
15%reduction in customer complaints and contacts
Thames Water Combined Report 2019/20 38Strategic report Governance Financial statements Annual performance report

Performance dashboard continued
Deliver brilliant customer engagement
Improve handling of written complaints by increasing first time resolution
Written complaints per 10,000 connected properties
98%
96%
94%
92%
90%
88%
86%
84%
82%
80%2015–16 2016–17 2017–18 2018–19 2019–20
Improve handling of written complaints by increasing 1st time resolution – water: WA1
2019–20: 88%
Target:
95%
98%
96%
94%
92%
90%
88%
86%
84%
82%
80%2015–16 2016–17 2017–18 2018–19 2019–20
Improve handling of written complaints by increasing first time resolution – wastewater: SA1
2019–20: 86%
Target:
95%
98%
96%
94%
92%
90%
88%
86%
84%
82%
80%2015–16 2016–17 2017–18 2018–19 2019–20
Improve handling of written complaints by increasing first time resolution – charging and billing: RA2
2019–20: 92%
Target:
95%
201816141210
86420
2015–16 2016–17 2017–18 2018–19 2019–20
Number of written complaints per 10,000 connected properties - water: WA2
2019–20: 14.01
Target water:
6.53
201816141210
86420
2015–16 2016–17 2017–18 2018–19 2019–20
Number of written complaints per 10,000 connected properties – wastewater: SA2
2019–20: 5.56
Target waste water:
5.80
50
45
40
35
30
25
20
15
102015–16 2016–17 2017–18 2018–19 2019–20
Minimise the number of written complaints received from customers (relating to charging and billing): RA1
2019–20: 40.98
Target charging and billing:
15.00
Thames Water Combined Report 2019/20 39Strategic report Governance Financial statements Annual performance report

Deliver brilliant customer engagement
CommentaryWA3, SA3, RA4 – Customer satisfaction across the operational side of the business. Our water and wastewater networks teams consistently achieved scores of more than four out of five across all metrics, however scores have been very sensitive to supply interruptions and we therefore recognise we have more to do to consistently deliver for our customers in AMP7. Our performance in waste having consistently improved over the regulatory period, saw a drop in score compared to last year, driven by a prolonged period of wet weather in Q4 where high volumes impacted our speed of attendance. Our key areas of focus to improve customer satisfaction in AMP7 are where we have built momentum this year in improving the speed and quality of our response and resolution alongside proactive, tailored customer communications.
Customer satisfaction (CSAT): water/wastewater and the operations contact centre
CommentaryRA3 – Improve customer satisfaction of retail customers – charging and billing service. Whilst our customers consistently scored our services related to billing and charging more than four out of five and we achieved a yearly high of 4.55 in Q2 the major upgrade we made to our billing and customer management platform during the year has resulted in a deterioration in our overall score. The transition of 3.6million customers to a new platform meant we needed to engage with customers relating to new account numbers and account registration details which caused some frustration and confusion. In addition, we embarked on the task of retraining all our colleagues to use the new system.
We did see longer than average times to resolve customer queries during the year as our teams moved up a learning curve, and lower customer satisfaction as a result of this. However, the new platform has provided more feature rich online self-serve functionality and the continuous improvement of this in response to customer feedback means we have seen improved scores in this channel. This progress alongside the new processes the platform enables means we have strong foundations on which to build improved customer satisfaction in AMP7.
Customer satisfaction: charging and billing (CSAT)
4.9
4.7
4.5
4.3
4.1
3.9
3.7
3.52015–16 2016–17 2017–18 2018–19 2019–20
Customer satisfaction surveys (internal CSAT monitor) – water: WA3
2019–20: 4.40
Target water:
4.60
4.9
4.7
4.5
4.3
4.1
3.9
3.7
3.52015–16 2016–17 2017–18 2018–19 2019–20
Customer satisfaction surveys (internal CSAT monitor) – wastewater: SA3
2019–20: 4.49
Target waste water:
4.70
4.9
4.7
4.5
4.3
4.1
3.9
3.7
3.52015–16 2016–17 2017–18 2018–19 2019–20
Improve customer satisfaction of retail customers – operations contact centre: RA4
2019–20: 4.46
Target operations contact centre:
4.65
4.9
4.7
4.5
4.3
4.1
3.9
3.7
3.52015–16 2016–17 2017–18 2018–19 2019–20
Improve customer satisfaction of retail customers – charging and billing service: RA3
2019–20: 4.42
Target charging and billing:
4.65
Performance dashboard continued
Thames Water Combined Report 2019/20 40Strategic report Governance Financial statements Annual performance report
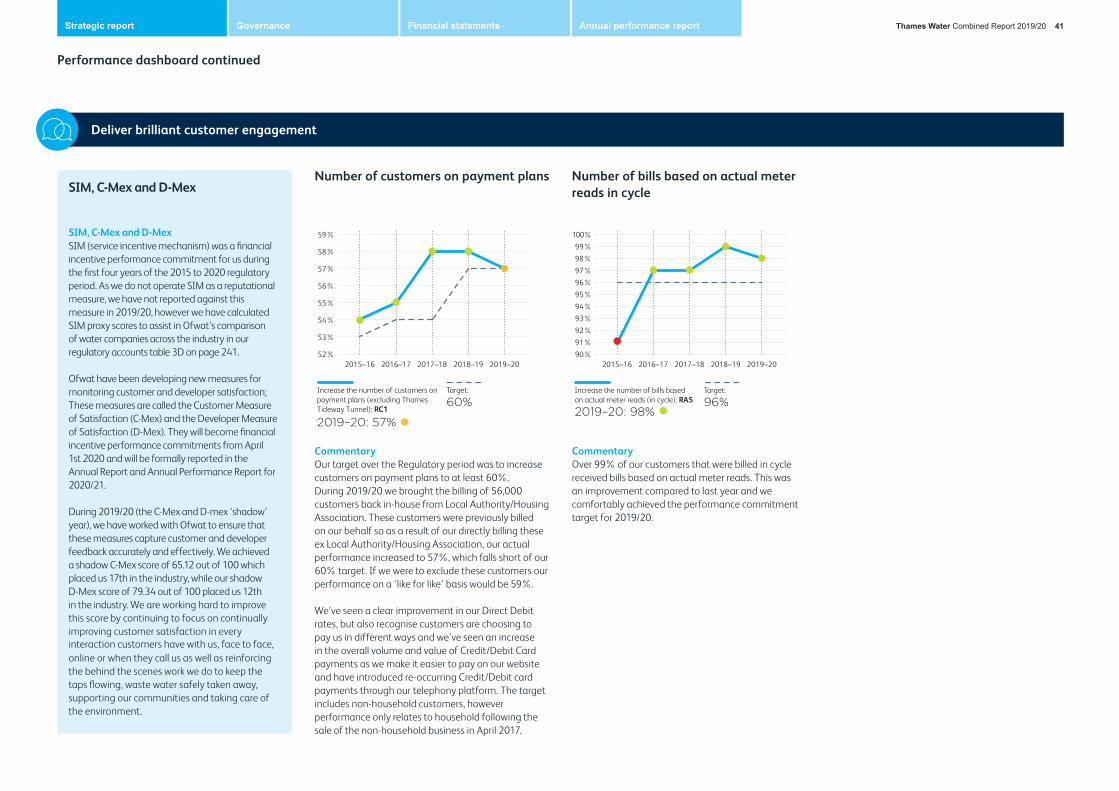
Deliver brilliant customer engagement
Number of customers on payment plans Number of bills based on actual meter reads in cycleSIM, C-Mex and D-Mex
SIM, C-Mex and D-MexSIM (service incentive mechanism) was a financial incentive performance commitment for us during the first four years of the 2015 to 2020 regulatory period. As we do not operate SIM as a reputational measure, we have not reported against this measure in 2019/20, however we have calculated SIM proxy scores to assist in Ofwat’s comparison of water companies across the industry in our regulatory accounts table 3D on page 241.
Ofwat have been developing new measures for monitoring customer and developer satisfaction; These measures are called the Customer Measure of Satisfaction (C-Mex) and the Developer Measure of Satisfaction (D-Mex). They will become financial incentive performance commitments from April 1st 2020 and will be formally reported in the Annual Report and Annual Performance Report for 2020/21.
During 2019/20 (the C-Mex and D-mex ‘shadow’ year), we have worked with Ofwat to ensure that these measures capture customer and developer feedback accurately and effectively. We achieved a shadow C-Mex score of 65.12 out of 100 which placed us 17th in the industry, while our shadow D-Mex score of 79.34 out of 100 placed us 12th in the industry. We are working hard to improve this score by continuing to focus on continually improving customer satisfaction in every interaction customers have with us, face to face, online or when they call us as well as reinforcing the behind the scenes work we do to keep the taps flowing, waste water safely taken away, supporting our communities and taking care of the environment.
CommentaryOur target over the Regulatory period was to increase customers on payment plans to at least 60%. During 2019/20 we brought the billing of 56,000 customers back in-house from Local Authority/Housing Association. These customers were previously billed on our behalf so as a result of our directly billing these ex Local Authority/Housing Association, our actual performance increased to 57%, which falls short of our 60% target. If we were to exclude these customers our performance on a ‘like for like’ basis would be 59%.
We’ve seen a clear improvement in our Direct Debit rates, but also recognise customers are choosing to pay us in different ways and we’ve seen an increase in the overall volume and value of Credit/Debit Card payments as we make it easier to pay on our website and have introduced re-occurring Credit/Debit card payments through our telephony platform. The target includes non-household customers, however performance only relates to household following the sale of the non-household business in April 2017.
CommentaryOver 99% of our customers that were billed in cycle received bills based on actual meter reads. This was an improvement compared to last year and we comfortably achieved the performance commitment target for 2019/20.
59%
57%
58%
56%
55%
54%
53%
52%2015–16 2016–17 2017–18 2018–19 2019–20
Increase the number of customers on payment plans (excluding Thames Tideway Tunnel): RC1
2019–20: 57%
Target:
60%
100%
98%99%
97%96%95%94%93%92%91%90%
2015–16 2016–17 2017–18 2018–19 2019–20
Increase the number of bills based on actual meter reads (in cycle): RA5
2019–20: 98%
Target:
96%
Performance dashboard continued
Thames Water Combined Report 2019/20 41Strategic report Governance Financial statements Annual performance report
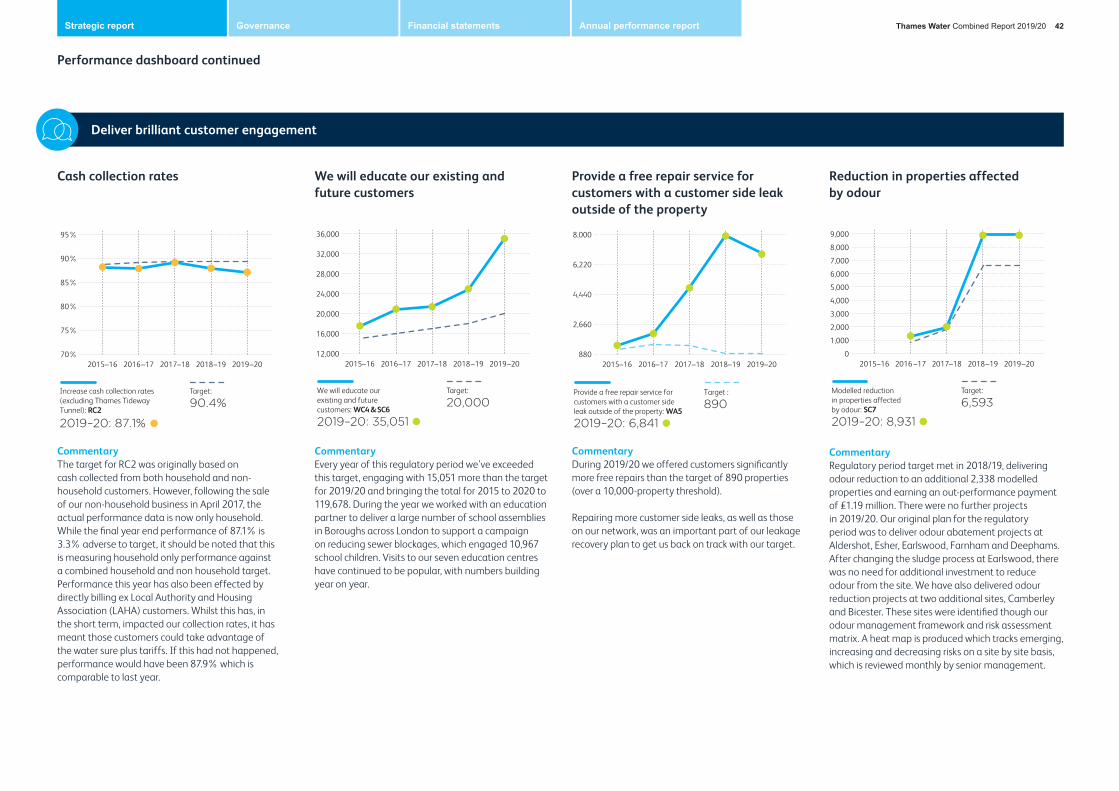
Performance dashboard continued
Deliver brilliant customer engagement
CommentaryDuring 2019/20 we offered customers significantly more free repairs than the target of 890 properties (over a 10,000-property threshold).
Repairing more customer side leaks, as well as those on our network, was an important part of our leakage recovery plan to get us back on track with our target.
Provide a free repair service for customers with a customer side leak outside of the property
CommentaryEvery year of this regulatory period we’ve exceeded this target, engaging with 15,051 more than the target for 2019/20 and bringing the total for 2015 to 2020 to 119,678. During the year we worked with an education partner to deliver a large number of school assemblies in Boroughs across London to support a campaign on reducing sewer blockages, which engaged 10,967 school children. Visits to our seven education centres have continued to be popular, with numbers building year on year.
Reduction in properties affected by odour
We will educate our existing and future customers
8,000
6,220
4,440
2,660
8802015–16 2016–17 2017–18 2018–19 2019–20
Provide a free repair service for customers with a customer side leak outside of the property: WA5
2019–20: 6,841
Target :
890
36,000
28,000
32,000
24,000
20,000
16,000
12,0002015–16 2016–17 2017–18 2018–19 2019–20
We will educate our existing and future customers: WC4 & SC6
2019–20: 35,051
Target:
20,000
9,000
7,000
8,000
6,000
5,000
4,000
3,000
2,000
1,000
02015–16 2016 –17 2017–18 2018–19 2019–20
Modelled reduction in properties affected by odour: SC7
2019–20: 8,931
Target:
6,593
CommentaryThe target for RC2 was originally based on cash collected from both household and non-household customers. However, following the sale of our non-household business in April 2017, the actual performance data is now only household. While the final year end performance of 87.1% is 3.3% adverse to target, it should be noted that this is measuring household only performance against a combined household and non household target. Performance this year has also been effected by directly billing ex Local Authority and Housing Association (LAHA) customers. Whilst this has, in the short term, impacted our collection rates, it has meant those customers could take advantage of the water sure plus tariffs. If this had not happened, performance would have been 87.9% which is comparable to last year.
Cash collection rates
95%
90%
85%
80%
75%
70%2015–16 2016–17 2017–18 2018–19 2019–20
Increase cash collection rates (excluding Thames Tideway Tunnel): RC2
2019–20: 87.1%
Target:
90.4%
CommentaryRegulatory period target met in 2018/19, delivering odour reduction to an additional 2,338 modelled properties and earning an out-performance payment of £1.19 million. There were no further projects in 2019/20. Our original plan for the regulatory period was to deliver odour abatement projects at Aldershot, Esher, Earlswood, Farnham and Deephams. After changing the sludge process at Earlswood, there was no need for additional investment to reduce odour from the site. We have also delivered odour reduction projects at two additional sites, Camberley and Bicester. These sites were identified though our odour management framework and risk assessment matrix. A heat map is produced which tracks emerging, increasing and decreasing risks on a site by site basis, which is reviewed monthly by senior management.
Thames Water Combined Report 2019/20 42Strategic report Governance Financial statements Annual performance report

Account management2015–16 2016–17 2017–18 2018–19 2019–20
Implement new online account management for customers supported by web-chat: RB1
Limited online
Limited online
New online self serve
channel
Online self serve
channel
Online self serve
channelTarget: New online self serve channel
CommentaryFollowing implementation in 2015/16, we continue to maintain our online account management tool.
Reducing water consumption by customersWater efficiency 2015–16 2016–17 2017–18 2018–19 2019–20
Reduced water consumption from issuing water efficiency devices to customers (Ml/d): WA4
Not available
Not available
20.22 28.25 34.42
Target: 15.45
CommentaryThis measure has an end of regulatory period target of 15.45 Ml/d. The 2019/20 figure is reported cumulatively from the beginning of the regulatory period and is based on an assumed savings methodology.
At the end of 2019/20 we have outperformed our target by 123% due to completing a higher number of water efficiency visits to customers. During these visits, customers are offered the installation of water efficiency devices, internal plumbing fixes to reduce “wastage” such as dripping taps, leaking toilets and water efficiency advice on how to better use water in the home.
Performance dashboard continued
Deliver brilliant customer engagement
Thames Water Combined Report 2019/20 43Strategic report Governance Financial statements Annual performance report

Performance dashboard continued
Generate public value
Environmental regulations
Commentary WC5 – This is a five year measure with a target of 100% compliance at the end of the regulatory period, against the agreed measures as listed on the latest version of the National Environment Programme (NEP). At the end of the year we had achieved 99% compliance.
We were not able to meet our overall target as the river restoration scheme for Pann Mill was not completed by the end of March 2020, due to a health and safety concern, however this is expected to complete within two months.
Schemes for the River Og and Amwell Magna have been delivered during the year, with several other planned river restoration schemes (Oxford Watercourses, Letcombe Brook (Venn Mill) and River Cray) due to be completed during the summer as agreed by the Environment Agency.
In line with the NEP, license reductions were delivered at Axford, Ogbourne, Children Warren and Pann Mill
2015/16 2016/17 2017/18 2018/19 2019/20
Deliver 100% of agreed measures to meet new environmental regulations: WC5 0 0
Not available
Not available 99
Reduce the amount of phosphorus entering rivers to help improve aquatic plant and wildlife: SC9 – – 0 0 59.3Water bodies improved or protected from deterioration as a result of our activities: SC4 – – 0 0 10Deliver 100% of agreed measures to meet new environmental regulations: SC8 0 0
Not available
Not available 100
by March 2020 and Mogden aeration is completed in agreement with the Environment Agency.
Our water quality monitoring and investigation schemes were all delivered on time during the regulatory period and we have delivered 10 schemes towards our eel screen target earlier than required by the Environment Agency.
SC9 – We delivered the target 59.3kg/day of phosphorus reduction through 25 schemes by 31 March 2020, as per the reinstated performance commitment criteria from 2018. 24 met the criteria on the new permit stated on the latest version of the NEP. The final scheme, originally planned for Rusper STW, achieved the reduction by transferring the flow to nearby Crawley STW which already has phosphorus treatment already installed, with agreement from the Environment Agency.
SC4 – The target for this performance over the regulatory period is 13 and is assessed based on evidence of changes in river concentrations of phosphorus – our own research suggests it can take five to ten years to evidence.
While measures have been taken across the whole catchment, to date we have only been able to evidence improvement in 10 waterbodies with a further 2 waterbodies that will show benefits from 2020/21 (wet weather has hampered the scheme delivery for these sites and therefore realisation of benefits). The final waterbody is being improved in partnership with one of the large estates in the catchment and due to the scale of ambition, will be delivered on a longer timescale. We plan to continue this trial into the 2020 to 2025 regulatory period where it will form part of our Smarter Water Catchments project.
SC8 – We achieved 100% for this five-year measure, which has a 100% target. Over the regulatory period there have been changes to the number of schemes agreed by the Environment Agency with a net increase in the number of schemes recorded as delivered.
Within the NEP, there are five schemes that have been given a revised deadline of June 2020, due to the Environment Agency requesting external certification of their delivery and the impact of Covid-19 delaying that certification. Each of the five schemes, for flow monitoring, have been completed and are fully functional.
Thames Water Combined Report 2019/20 44Strategic report Governance Financial statements Annual performance report

Performance dashboard continued
Generate public value
CommentaryWD1 – In 2019/20 we achieved a year-on-year reduction in our grid imported electricity of 14 GWh. This improvement was achieved through a combination of targeted efficiency improvement projects, and through improvements to the mix of sites from which we sourced, treated and distributed water.
This reduction was 30 GWh less than what was required to achieve the performance commitment. Water demand has not fallen as we forecast when we set the performance commitment, with last year’s demand over 13,000 ML higher than in 2014/15. The rate of delivery of energy efficiency projects has been slower than planned due to the hotter, drier summers we have experienced. These have also resulted in us pumping more water which in turn resulted in more energy consumption during this stress event and meant that our water production processes and distribution routes had to draw upon more energy intensive options. This, coupled with below average summer rainfall, meant that reservoir levels dropped substantially.
During the wetter winter period we made the decision to abstract more water to recover our storage levels and sustain resilience. We imported more energy to meet this requirement, which has further affected our net energy performance. Consequently, we have not met the 2019/20 target. This additional energy used to pump water into our reservoirs has helped to ensure our customers will be kept in supply going into 2020.
SD1 – We were successful in reducing our imported electricity by 13 GWh compared to 2018/19 through increased energy efficiency. However, our plans to increase our renewable generation have delivered more slowly than expected, which resulted in us missing our target of 295 GWh. This is in part due to exceptionally high rainfall in the last six months of 2019/20, which resulted in us pumping and treating 3% more wastewater than the previous year.
Energy imported less energy exported CommentaryWC1 – We continued to reduce the carbon emissions from our water operations during 2019/20, with emissions at 40.5kTCO2e – 110.7kTCO2e less than our 151.2kTCO2e target. This is due to our switch to our green tariff electricity supply in October 2016.
SC1 – We continued to reduce our carbon emissions from our waste business with a further fall of 12.6 kTCO2e since last year – 52.5 kTCO2e better than our 269.9 kTCO2e target. This is due to a 76% increase in our renewable electricity generation from sludge since 2014/15, the switch to our green tariff electricity supply in October 2016, and through a reduction in emissions from sludge incineration, as we switch to advanced digestion. In the last year we have also significantly improved our methane recovery from secondary digestion, which has saved 7.4kTCO2e of emissions.
Greenhouse gas emissions
500450400350300250200150100
500
2015–16 2016–17 2017–18 2018–19 2019–20
From water operations (kTCO2e): WC1
2019–20: 40.5
From wastewater operations (kTCO2e): SC1
2019–20: 217.4
Target water operations:
151.2
Target waste operations:
269.9
600
550
500
450
400
350
300
250
200
1502015–16 2016–17 2017–18 2018–19 2019–20
Net energy to power our water business (GWh): WD1
2019–20: 506Net energy to power our waste business (GWh): SD1
2019–20: 383
Target forwater business:
476
Target for waste business:
295
Abstraction
CommentaryThe Abstraction Incentive Mechanism (AIM) is an Ofwat scheme to reduce abstraction from sources that are environmentally sensitive. It is triggered when local rivers fall below an agreed flow. We complied with AIM at all our sites, individually and overall. This was achieved despite a dry year in which water resources were a challenge. During 2019/20, we achieved 99.89% compliance with our daily water abstraction licences.
2015/16 2016/17 2017/18 2018/19 2019/20
Abstraction Incentive Mechanism (AIM): WC3 Not available
0 -1,676.29 -170.69 -1,017.08
Thames Water Combined Report 2019/20 45Strategic report Governance Financial statements Annual performance report

Performance dashboard continued
Flooding
CommentarySB3 – As part of our 2015 to 2020 business plan, we were given a £227 million allowance for the construction of a new sewer at Counters Creek to protect properties from recurring sewer flooding after rainfall. As part of the pre-project planning process, we identified an alternative and more effective solution, which would be less disruptive to customers and offer better value for money. The numbers above have been restated to report equivalent properties delivered by both the Counters Creek scheme and other schemes, in the year in which the benefit was delivered.
Under the regulatory framework we’ve incurred an ‘underperformance’ payment of £130 million (2012/13 prices) due to a cancellation of the original project, which is largely made up of the money we didn’t spend and has been applied to our 2020 to 2025 business plan agreement as an adjustment to our Regulatory Capital Value
2015/16 2016/17 2017/18 2018/19 2019/20
Properties protected from flooding due to rainfall: SB3 379 60 40 86 394Contributing area disconnected from combined sewers by retrofitting sustainable drainage: SB5 – – – 0 21
CommentaryOur performance was reviewed by the Environment Agency on 28 February 2020, with no non-conformances against the Sludge Use in Agricultural Regulations and other codes of practice identified. Internal monitoring showed no inconsistencies between the issuing of permits for biosolids to be removed from our sites and confirmations of where biosolids have been stored and which fields they have been spread on.
We have continued to attain 100% certification under the industry wide Biosolids Assurance Scheme. The purpose of the UK Biosolids Assurance Scheme is to provide food chain and consumer reassurance that Certified Biosolids can be safely and sustainably recycled to agricultural land.
Satisfactory sludge disposal compliance
2015–16 2016–17 2017–18 2018–19 2019–20
Satisfactory sludge disposal compliance: SC5
2018–19: 100%
Target:
100%
100%
98%
99%
97%
96%
95%
CommentaryWe met our performance commitment for this measure however we saw a slight rise during the year, due to persistent rainfall over the winter months. The improving trend during this regulatory period is a result of our increased focus on proactive preventative measures such as increased use of data insight, customer education campaigns, food service establishment visits and our sewer cleaning programme.
Internal flooding incidents (other causes)
1,500
1,100
1,300
900
7002015–16 2016–17 2017–18 2018–19 2019–20
Number of internal flooding incidents, excluding those due to overloaded sewers (SFOC): SB4
2019–20: 1,058
Target:
1,085
Generate public value
SB5 – This an end of regulatory period target reported cumulatively. During the five years we delivered seven schemes disconnecting / attenuating 20.952 hectares from our network. In 2019/20 we delivered six of those schemes totalling 20.728 hectares, with 18.235 of those hectares a result of two schemes at Battersea’s Nine Elms.
Thames Water Combined Report 2019/20 46Strategic report Governance Financial statements Annual performance report

Performance dashboard continued
Major investments in wastewater infrastructure
2015/16 2016/17 2017/18 2018/19 2019/20
Lee Tunnel including Shaft G: SB8 This scheme was delivered in 2015/16Deephams sewage treatment works: SB9 This scheme was delivered in 2016/17
Sites made resilient to future extreme rainfall
Commentary This a regulatory period measure reported cumulatively from 2015/16 and sets out the increase in capacity at sewage treatment works (in population terms) following our investment to protect our services/network from extreme weather (defined as a 1:100 rainfall event).
We installed flood protection measures at nine sites including Chesham, Maple Lodge, East Hyde, Swindon, Aylesbury, Camberley, Little Marlow, Sandhurst and Rye Meads. With cost efficiency being one of our strategic enablers and our focus on making every pound count, we missed this target as it’s more cost effective to install temporary flood prevention measures compared to investing in permanent infrastructure. We will therefore incur a penalty of 71k.As part of our Drainage Wastewater Management Plan (DWMP) programme we will be preparing resilience assessments across all our catchments and this work will be published in 2022.
2015/16 2016/17 2017/18 2018/19 2019/20
Population equivalent of sites made resilient to future extreme rainfall events: SB7 – – 495,160 962,842 1,569,343
Generate public value
Thames Water Combined Report 2019/20 47Strategic report Governance Financial statements Annual performance report

IntroductionAnne Heal was Chair of the CCG for a period of four years up to 31 March 2020. The Group would like to pay tribute to the immense contribution she made in managing and overseeing the CCG’s work through the Price Review and the effective monitoring of the company’s performance. Her clarity of thought and sound judgement helped to ensure that the customer interest was always prominent when challenging Thames Water’s service delivery.
The outcome of the Price Review for all water companies in England and Wales covering the Business Plans for the period 2020-25 is a key consideration for CCG given its involvement in the way Thames Water engaged with its customers to test acceptability of its proposals. There is much to commend the company in its listening to customer feedback in shaping its plans for the next five years. Areas of focus during extensive customer engagement have been tackling resilience of the network to avoid water supply interruptions and pollution incidents, alongside affordable bills. The company has sought to accommodate these customer priorities within the Ofwat Final Determination and the CCG will monitor delivery of the plan to seek to ensure it meets its objectives.
Much of the last twelve months has been spent observing, monitoring and challenging the company’s approach to customer engagement in the price review. The CCG had the opportunity to engage and question Thames Water on a number of important topics such as innovation, customer education ambition, and its new approach to incident management, which have proved fundamental in the company’s response to the current Covid-19 situation.
A key responsibility of the CCG is to monitor the company’s performance during the year against its performance commitments and plans for the year. The results for 2019/20 revealed in this combined report represent a mixed picture in terms of performance.
In discharging this responsibility, the CCG has, throughout the year, monitored all aspects of performance in respect of Waste, Water and Retail, and we would note that the company has welcomed our challenge across their performance measures. In previous reports we have highlighted our key areas of concern including leakage, customer satisfaction and complaint levels. These offer a good barometer of service quality and standards and it is important here to highlight how the company has responded to this challenge.
The leakage performance in 2019/20 shows that, with water balance adjustments, the company has outperformed its target, which the CCG acknowledges as a positive outcome after a prolonged period of failure to meet the leakage target. The Group notes that the improvement was achieved in the latter part of the year, by the company addressing issues around its ‘operational grip’ on leakage, and through a more detailed analysis of water lost, due largely to improved data being available. The CCG recognises that the company has an ambitious plan to build on this positive achievement and has been clear that every effort must be made to address any operational gap when tackling this stretching leakage target in the future. The Group stresses that focus must be maintained in this area to ensure that performance does not revert to previous poor levels. The CCG notes that sadly Thames’ performance on leakage remains the worst in the sector. Retail performance, which applies across key areas of customer service, was a very disappointing result, not only due to the significant gap between target and performance across many measures, but particularly given that the migration to a new customer contact and complaints system was presented to the CCG as likely to secure early and significant benefits for customer service. These benefits have not yet been seen and so this is an area that will continue to be of keen interest to the CCG. Thames’ retail performance measures do not carry financial penalties; the CCG notes that across the sector for 2019-20 the C-Mex or C-SAT measure did not apply pending adoption of a new measure for 2020-25, so no financial penalties apply.
A view on our performance from our independent Customer Challenge Group
Sir Tony RedmondInterim Chair
The Thames Water Customer Challenge Group (CCG) exists as a group which is independent of Thames Water. Many water companies in England and Wales have similar groups. The Thames Water CCG’s main role is; to monitor if Thames Water is meeting its performance commitments; report progress it finds on an annual basis; and also, to see if Thames Water’s future plans reflect what customers need and want. It then reports on its findings to Thames Water customers, the wider public and Ofwat.
This is the fifth year of Thames Water’s business plan 2015-2020, and is the fifth time the Thames Water CCG has reported on Thames Water’s commitments. Thames Water update the CCG every quarter and describe the progress they have – or have not – made.
Covid-19 represented a huge and unprecedented challenge to the company in March, towards the end of the financial year, with significant operational challenges around changes in demand; Thames Water quickly instituted a range of measures to assist customers. The CCG has been very impressed with the company’s response. The CCG notes that there remain major issues for many customers in terms of declining income and household debt as a result of this national crisis, which are likely to endure over forthcoming months.
Thames Water Combined Report 2019/20 48Strategic report Governance Financial statements Annual performance report

A view on our leakage performance
Thames Water has taken the challenge to reduce leakage very seriously. The Executive team’s determination to focus on this issue by directing operational resources, combined with a commitment to innovation, has helped secure the improved performance this year.
The business has made important changes to the way it tackles leakage to lay the groundwork for continuing reductions in the future. The launch of a dedicated Leakage Task Force to give a holistic, data-driven view was an important step in being able to examine leakage and future demand.
I witnessed first-hand the operation of the taskforce and the collaboration and commitment of teams across Thames Water to drive real change. The task force has been looking at how the business is organised, the drivers behind leakage performance and the infrastructure as a whole. A forensic approach to the detection and repair of leaks has enabled Thames to tackle leakage and will guide ongoing investment in the renewal of the network across London and the Thames Valley.
There isn’t one key to reducing leakage – it’s about getting the right combination of innovation, new materials, digital technology and collaboration with partners. Increased investment, which is at a record high for leakage and network activity, has led to an increase in repair gangs repairing leaks more promptly, a reduction in supply interruptions and enabled the roll-out of more sophisticated technology.
To be able to look after the network and plan for the future, the teams need accurate and real-time data. The thousands of smart meters and acoustic loggers already installed across the network are enabling strategic decisions to be made on continued investment to modernise the capital’s Victorian network and protect the city against the ongoing challenges of drought and flooding. As London continues to grow and the demand for water increases, Thames has enhanced its leak detection capability, examining each district and area and updating its detailed knowledge on commercial and residential customers, to inform the investment strategy for the long-term renewal of London’s infrastructure.
The significant reduction in leakage and ongoing investment in the network shows Thames Water is on the right track with its approach, as it renews the infrastructure in London and the Thames Valley. I look forward to continuing to work with Thames Water as it makes continued improvements in its leakage reduction.
Victoria BorwickIndependent Monitor Thames Water, former Deputy Mayor of London and former Member of Parliament.
Thames Water Combined Report 2019/20 49Strategic report Governance Financial statements Annual performance report

Our role in societyTo generate public value
Protecting the environment Helping those in needCommitting to net zero carbon operational carbon emissions by 2030
Go beyond net zero by 2040
Fully understand natural capital stocks across all our landholdings by 2025
Looking after the health of our rivers with our smarter water catchments initiative
Aiming for zero pollutions and a cleaner Thames
Tackling plastic pollution through customer education and by installing drinking fountains
Investing in nature-based infrastructure
Read more on pages 52 to 54
Provide extra support for customers who need it through our social tariffs and priority services register
Support our corporate, local and national charities through internal fundraising activities
Help customers save water, energy and money with our smarter home visits and water efficiency advice
Continuing support for the Thames Water Trust Fund
Read more on page 55
Positively impacting communities Creating public realmWe support the local community through volunteering events and contributions to community investment funds
We’re committed to reaching every schoolchild in our region with our education programme
Providing a public voice for water and wastewater
Encouraging employee volunteering and community speakers
Making a sustained contribution to the economy
Read more on page 56
Increase biodiversity by 5% at 253 of our sites by 2025
We’re committed to opening our sites where possible and build on the success of Walthamstow Wetlands and our nature reserves
Improving access to sites for sport and recreation
Supporting special interest groups and citizen science
Creating new public realm
Read more on page 56
Built through our partnerships
Driven by our Purpose and Values
Our role in societyAs an essential services provider for London and the Thames Valley we have a duty to deliver our services in a responsible and sustainable way. And we want to leave a positive legacy for society and future generations of customers.
We provide a service to every single person in our region, whether they live here or are visiting, and we need to make sure our services are resilient to our changing world, so our customers know they can always rely on us.
At the heart of our sustainable thinking are nine themes making up our sustainability policy, which is agreed by our Board. Our policy touches all areas of our business, helping us make the critical decisions that safeguard the delivery of our services over the long-term.
Our longstanding approach to being more sustainable has been making a positive impact on society and the environment around us for many years, beyond the delivery of our day-to-day services. Contributing to the circular economy through renewable energy generation, energy efficiency, responsible financing, a far-reaching water efficiency programme and inspiring future engineers, are just some of the activities we’ve been driving.
This year however, we’re taking our approach to going beyond our core services a step further with the integration of ‘generating public value’ as one of our three strategic ambitions – it is synonymous with being more sustainable. The ambition is aligned with four themes – protecting the environment, helping those in need, positively impacting communities and creating public realm. On page 14 we describe what we mean by generating public value, as well as progress and our future priorities. Over the next few pages we bring generating public value to life.
Opportunities and risk By incorporating our approach to being more sustainable, and managing the risks associated with challenges such as climate change and population growth we are able to become effective, efficient and innovative in the delivery of our strategic ambitions.
p70 Find out more in our risks section
SustainabilityOur approach to sustainability
Thames Water Combined Report 2019/20 50Strategic report Governance Financial statements Annual performance report

Sustainability continued
UN Sustainable Development GoalsThe United Nations set 17 Sustainable Development Goals (SDGs) and 169 targets which together will build a more sustainable future for all. Targets are set for 2030 and they address global challenges such as poverty, inequality, climate, environmental degradation, prosperity, peace and justice. With just ten years to go, the achievement of these goals relies on the collaboration and action of governments, businesses, society and individuals.
As an essential services provider serving over 15 million people in London and the Thames Valley, and with a focus on ensuring the long-term provision of our services, we play a key role in helping achieve some of the SDGs.
Clean water and sanitation for all is essential to a more sustainable world and supports many of the SDGs. And in the face of climate change and population growth, we need to carefully manage our water resources to ensure a sustainable service.
Although we fully support the aspiration of all 17 SDGs, we focus on four specific goals where we think we can make a real contribution.
SDG 6Clean Water and Sanitation
SDG 7Affordable and Clean Energy
SDG 12Responsible Consumption and Production
SDG 13Climate Action
Ensure availability and sustainable management of water and sanitation for all
Ensure access to affordable, reliable, sustainable and modern energy for all
Ensure sustainable consumption and production patterns
Take urgent action to combat climate change and its impacts
How we’re contributingSupplying 2.6 billion litres of safe clean drinking water daily
Treating around 4.6 billion litres of sewage daily
99.97% water quality compliance
100 out of 100 for SOSI
99.71% sewage treatment works compliance
Our desalination plant provides resilience in case of drought
How we’re contributing We use 100% renewable electricity
We generated 24% of our electricity needs from on-site renewables
We help our customers save water and energy through our water efficiency programme
How we’re contributing Our smarter home visits programme has driven over 4 Ml/d reduction in the amount of water customers are using since it was launched in 2015
100% of sewage sludge is put to beneficial use, including recycling as fertiliser to land
Working with supply chain to deliver more sustainable procurement
Over 100 water fountains being installed across London to make our tap water more accessible and reduce the use of single use plastic
Supporting and advocating the ‘Fine to flush’ label on wet wipes
How we’re contributing Our net operational emissions have reduced by 17.8 ktCO2e to 257.9 ktCO2e during 2019/20
We use 100% renewable electricity
We self-generated 23% of our electricity needs during 2019/20
Our ambitions 100% compliance with drinking water quality target set by Drinking Water Inspectorate
Security of supply (SOSI) index of 100 for the growing population
Reduce pollution incidents by 30% between 2020 and 2025
Sucessful delivery of our Water Resources Management Plan and our Drainage and Wastewater Management Plan
Our ambitions Self-generate 517 GWH of renewable energy by 2025 (equivalent to 115,000 homes)
Operate our new pyrolysis plant
Our ambitions 15.45 Ml/D water to be saved by the end of the regulatory period through water efficiency devices.
Zero waste to landfill
Our ambitions Committing to net zero carbon operational carbon emissions by 2030
We’re committed to going beyond net zero by 2040.
Security and Emergency Measures Direction 100%
Thames Water Combined Report 2019/20 51Strategic report Governance Financial statements Annual performance report

Sustainability continuedA climate resilient future
Given the nature of our business, and our reliance on the environment’s natural resources, we face acute challenges as climate change takes hold. Volatile weather patterns test the resilience of our services – and the UK is regularly breaking newclimate records.
In 2019/20 we had the wettest February on record and the fifth wettest winter overall with two storms, Ciara and Dennis, in quick succession. In March 2018, we faced the impact from the Beast from the East, the most significant cold spell across the UK since 2010, followed quickly by the joint hottest summer on record.
Our approach to tackling climate change focuses on both adapting our business to its challenges and playing our part in mitigating it. Both have formed part of our decision-making for many years and are cornerstones of our sustainability policy.
We currently report on our understanding and our response to climate change. We evaluate the risks, opportunities and our responsibilities associated with this. This is broadly equivalent to the recommendations of the Task Force on Climate-Related Financial Disclosures (TCFD) and we will work to be fully aligned from 2022.
Our climate targetsNet zero carbon emissions by 2030, and then beyondIn 2019/20, we made an important pledge to reduce our net carbon emissions from our operations to zero by 2030 and we’re making headway. And we don’t want to stop there – we’re committed to going beyond net zero by 2040.
We’ve already beaten our original target, to reduce our greenhouse gas emissions (scope 1 and 2) by 34% by 2020 compared to 1990 levels. We went way beyond that target with a 70% reduction in our net emissions and a 41% reduction in our gross emissions by March 2020.
As we move towards our target for 2030, we’re putting together a roadmap which will build on our existing carbon reduction progress. The ‘lockdown’ associated with Covid-19 has led to a reduction in global emissions, with many of our employees working from home and less of our vehicles on the roads. However, before the pandemic we’d already been investing in IT equipment to make virtual meetings more effective and to reduce the amount of travel. By rolling out new videoconferencing capabilities in Autumn of 2019, we’ve achieved a 15% reduction in emissions from private and public transport. Producing record amounts of renewable energy, reducing fossil fuel use on site and improving energy efficiency are all parts of our plan.
Achievements • We self-generated 313 GWh or 23% of our own
electricity needs during 2019/20
• Our Security of Supply Index, our ability to providewater in a dry year, reached 100 during the year (2018/19: 98)
• We buy 100% of renewable electricity to power ouroperations, following our agreement with a green tariff electricity supplier
OpportunitiesAs well as having a positive impact on the environment, self-generating our own electricity reduces our electricity costs, which are currently over
£113 million a year and our second biggest single cost – the less we pay for electricity, the more money we can invest in the long-term resilience of our operations.During 2019/20, we produced the equivalent of £37 million in electricity from sludge.
The last year has seen climate change move up the global agenda, with Sir David Attenborough and Greta Thunberg raising the profile of the world’s environmental challenges. Increasing public engagement with the knock-on impact of climate change helps messages about using less water resonate more effectively with our customers.
Planning and risk management Planning for the future
• Climate change is one of our principal risks and its mitigation is monitored and managed by our Audit,Risk and Reporting Committee.
• Our Water Resources Management Plan (“WRMP”)outlines how we will ensure the sustainable delivery of water to our customers over the next 80 years, in the face of population growth and climate change, and is based on the best available information. We agreed our WRMP with Government in March 2020.
• Our drainage and wastewater management plans, although not yet on a statutory basis, use the same information. We also have a drought plan
in place, identifying the actions we will take to protect supplies to our customers during periods of exceptionally dry weather.
Climate change reportingDuring 2020 we will be working on our regular update to Government on our understanding and preparedness for the impacts of climate change under the 2008 Climate Change Act.
Climate change adaptation Through a review of the potential impacts of climate change on the business, we identified that our key issues are still broadly associated with either too much, too little or the wrong sort of water. This challenge is reflected in the performance commitments below which were agreed with our regulator, Ofwat, and were included in our business planning period which ended in 2020. Our performance on these metrics can be seen in table 3A.
WB8 – Ml/d of sites made resilient to future extreme rainfall events – water – page 36
WC2 – Leakage – page 33
SB7 – Population equivalent of sites made resilient to future extreme rainfall events – page 47
SB5 – Contributing area disconnected from combined sewers by retrofitting sustainable drainage page 46
0
50
100
150
200
250
300
350
2016/17 2017/18 2018/19 2019/20
Water target Water actual
160.7
46.2 45.7 40.50
100
200
300
400
500
600
2016/17 2017/18 2018/19 2019/20
Waste target Waste actual
346.7
231.7 230.0 217.4
Greenhouse gas emissions from water operations in ktCO2e – WC1 Greenhouse gas emissions from waste operations in ktCO2e – SC1
Thames Water Combined Report 2019/20 52Strategic report Governance Financial statements Annual performance report
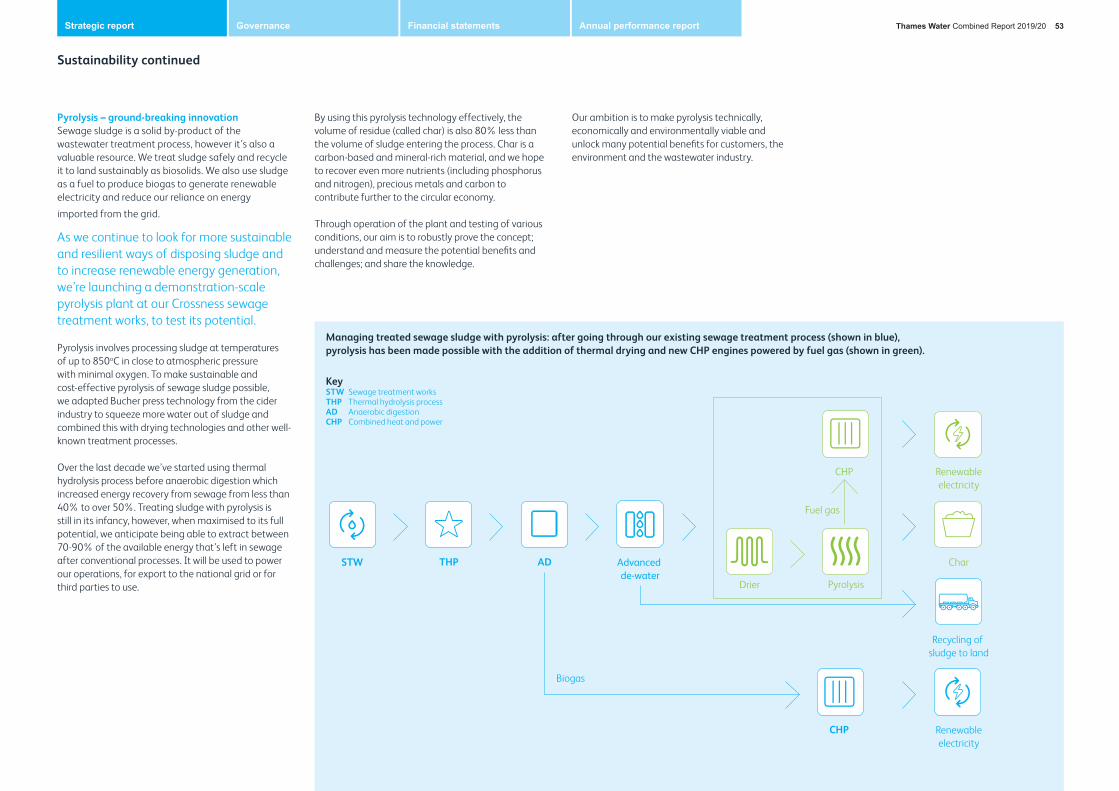
Sustainability continued
Pyrolysis – ground-breaking innovation Sewage sludge is a solid by-product of the wastewater treatment process, however it’s also a valuable resource. We treat sludge safely and recycle it to land sustainably as biosolids. We also use sludge as a fuel to produce biogas to generate renewable electricity and reduce our reliance on energy
imported from the grid.
As we continue to look for more sustainable and resilient ways of disposing sludge and to increase renewable energy generation, we’re launching a demonstration-scale pyrolysis plant at our Crossness sewage treatment works, to test its potential.
Pyrolysis involves processing sludge at temperatures of up to 850oC in close to atmospheric pressure with minimal oxygen. To make sustainable and cost-effective pyrolysis of sewage sludge possible, we adapted Bucher press technology from the cider industry to squeeze more water out of sludge and combined this with drying technologies and other well-known treatment processes.
Over the last decade we’ve started using thermal hydrolysis process before anaerobic digestion which increased energy recovery from sewage from less than 40% to over 50%. Treating sludge with pyrolysis is still in its infancy, however, when maximised to its full potential, we anticipate being able to extract between 70-90% of the available energy that’s left in sewage after conventional processes. It will be used to power our operations, for export to the national grid or for third parties to use.
By using this pyrolysis technology effectively, the volume of residue (called char) is also 80% less than the volume of sludge entering the process. Char is a carbon-based and mineral-rich material, and we hope to recover even more nutrients (including phosphorus and nitrogen), precious metals and carbon to contribute further to the circular economy.
Through operation of the plant and testing of various conditions, our aim is to robustly prove the concept; understand and measure the potential benefits and challenges; and share the knowledge.
STW THP AD Char
CHP
Biogas
CHP Renewableelectricity
Renewableelectricity
Recycling of sludge to land
Drier
Advanced de-water
Pyrolysis
Fuel gas
KeySTW Sewage treatment worksTHP Thermal hydrolysis processAD Anaerobic digestionCHP Combined heat and power
Our ambition is to make pyrolysis technically, economically and environmentally viable and unlock many potential benefits for customers, the environment and the wastewater industry.
Managing treated sewage sludge with pyrolysis: after going through our existing sewage treatment process (shown in blue), pyrolysis has been made possible with the addition of thermal drying and new CHP engines powered by fuel gas (shown in green).
Thames Water Combined Report 2019/20 53Strategic report Governance Financial statements Annual performance report

Sustainability continued
Looking after rivers Last year we completed the preparatory work for our Smarter Water Catchments initiative. It provides a more holistic approach to catchment management that seeks to work in partnership with all the interested stakeholders in a catchment, to improve our understanding of the main issues in that location and develop partnership projects to build better functioning river catchments. This helps ensure the catchments are able to support both the needs of our services and those of the ecosystem.
We’ve also further developed our catchment partnerships framework, building a dedicated team to support our internal volunteer members for each of the 27 catchment partnerships in our area. Through these relationships we’ve delivered the first stage of our engagement on our drainage and wastewater management plans (“DWMP”s) with environmental NGOs. We also invited representatives from the host organisations of each catchment partnership to our annual stakeholder review in November 2019. We discussed collaborative working and ways we could improve our approach as well as the value we create for the environment.
Enhancing biodiversity on our sitesFrom 2020 to 2025 we’ve committed to enhance biodiversity by 5% at 253 Sites of Biodiversity Interest. The area of land to be improved by this five-year biodiversity programme is almost 4,000 hectares, which is two and a half times the size of Heathrow Airport. To do this, we’ll be improving the condition of existing habitats through changes in mowing regimes of grassland, and with the creation of new habitats with improved connectivity, such as wetlands, woodlands and hedgerows. We have an ambition to lead the way for other companies to follow in the field of biodiversity net gain, and for all Thames Water capital projects where biodiversity habitats will be lost, we require that these projects demonstrate a 10% increase to biodiversity compared to their biodiversity baseline.
We manage 12 Sites of Special Scientific Interest (SSSI) which are legally protected wildlife areas, and with more than 40 of the UK’s chalk streams in our region we’re committed to protecting these rare and biodiverse sites. Around 99% of our SSSI land area is classified as ‘favourable’ or ‘unfavourable recovering’ by Natural England. We’re working with Natural England and other specialists to understand how we can make further improvements to the condition of the ‘unfavourable recovering’ areas which can be a result of wider population trends rather than specific conditions on site.
Our sites are home to a wide variety of species of plants and animals, some of which are critically endangered and require protection. A range of new discoveries were made during the year, including some rare species: Frog Rush, Meadow Clary, Willow Emerald Damselfly, Penduline Tit and London’s first Great Reed Warbler.
Last year saw the highest number of Shrill Carder Bees and Brown-banded Carder Bees at Long Reach sewage works, which is a positive result of the habitat improvements we’ve made as part of The Making a Buzz for the Coast partnership project with the Bumblebee Conservation Trust. Our work includes altering our mowing regime to leave grassland to flower and set seed before cutting at the end of the summer, planting bulbs with volunteers and a Lavender hedge next to our Education Centre, building bug hotels with school children, and surveying bumblebees.
We’ve also added new habitats to key Sites of Biodiversity Interest, such as Walthamstow Reservoirs. We’ve created a surface area total of 1440m2 of floating islands within three of the reservoirs, installed four tern rafts on the West Warwick reservoir, created a small wetland on the East Warwick island for wading birds and carried out water vole habitat improvements in the Coppermill Stream.
From 2020 to 2025 we’ve committed to enhance biodiversity by 5% at
253 Sites of Biodiversity Interest
We manage
12Sites of Special Scientific Interest (SSSI) which are legally protected wildlife areas
We’ve created
1,440m2of floating islands within three of the reservoirs at Walthamstow
Thames Water Combined Report 2019/20 54Strategic report Governance Financial statements Annual performance report

Sustainability continued
Charitable fundraising During the year, we raised £266,058 for WaterAid, with a further £32,987 of income pledged for our Thames Loves Malawi campaign, which is being used to improve access to clean water and sanitation for two towns in Malawi.
In addition, we raised a further £63,842 for 40 other local and national charities through internal fundraising activities. We match funded these employee fundraising efforts with £36,674.
We support the local community through volunteering events and contributions to community investment funds. We supported 25 local organisation’s projects that fulfilled our application criteria of ‘water and the environment’ and ‘water and health’ through our small grants programme with a total of £68,911. Our employees also volunteered for 4,764 hours during the year.
We also support our employees with a payroll giving scheme, contributing an additional 10% on top of their combined donations. Our employees donated a total of £83,833 (2018/19: £82,661) to 139 (2018/19: 143) charities which the group donated a further £8,383 (2018/19: £8,216).
55,000 visits carried out during 2019/20, leading to an estimated water saving of 4.03 million litres per day
4,500internal leaks fixed, which saved an additional 1.76 million litres of water a day
Helping customers save water, energy and money Smarter Home Visits is our award-winning, in-home water efficiency initiative which helps customers save water and energy, which saves money and helps protect our precious water resources.
The programme, started at the beginning of the regulatory period, offers customers free water saving device installations, free internal leak repairs and tailored water-saving advice.
Through the programme we’re also able to suggest extra support for customers who need it, through our social tariffs and priority services register. During 2019/20, we carried our nearly 55,000 of these visits with our partners resulting in estimated water savings of 4.03 million litres a day. After fixing more than 4,500 internal leaks detected through the programme, we saved an additional 1.76 million litres a day. In 2017, we expanded our programme to include businesses with the launch of Smarter Business Visits. It’s an innovative and water industry-leading programme that has helped almost 3,800 businesses across the region save water in 2019/20 alone. Our qualified plumbers improve the performance of everyday fittings by converting older, single-flush toilets to dual-flush and installing urinal sensors for free. They also find and fix visible internal leaks such as leaky loos or taps. This has saved 8.60 million litres per day (based on calculated savings from installed products and fixes).
£266,058 raised for WaterAid during the year.
£32,987of income pledged for our Thames Loves Malawi campaign
£63,842raised for 40 other local and national charities
35,000young people engaged
Thames Water Combined Report 2019/20 55Strategic report Governance Financial statements Annual performance report

Sustainability continued
Positive impact on communities through educationWe’re passionate about talking to our future customers and we are committed to engaging with school age children in our region to encourage them to consider their role in the water cycle. For more information about our performance commitment please see page 42.
We help students to understand our business through visits to our education centres, workshops, talks and hands-on challenges. We have opened a new education centre at Deephams, one of London’s largest sewage treatment works, to allow children to see first-hand the sewage treatment process. Many of the school tours at this site are run in partnership with the Engineering Development Trust who also offer additional learning opportunities around STEM.
We now have seven education centres across our region where children have the opportunity to carry out water and energy related experiments in our on-site classrooms and to take a tour of our operational works.
This includes our Angling Academy at our reservoir complex in Walthamstow which helps us promote well-being and social inclusion via angling, and to teach young people about the environment and sustainable water usage.
We have found other innovative ways to engage with schoolchildren. Over the past year we’ve worked with Mad Science, an education workshop franchise which specialises in educational and entertaining science programmes for children. They have helped engage children at schools in blockage hotspot areas about the growing problem of Fatbergs.
We’ve also been working with The Leigh University Technical College since 2015 and last year we were awarded Business Partner of the Year in recognition of the work we’ve done over the last academic year. This included Industrial Cadets work experience placements at our sites, encouraging more students into STEM based careers, one-to-one mentoring and even assemblies covering topics such as mental health.
We have been commended for our work in schools across the Basingstoke area, volunteering and supporting a variety of careers related events for young people and were shortlisted for the ‘Business Promoting Careers in STEM’ Skillstree 2019/20 Award by staff at Basingstoke Consortium, one of our education business partners.
Public realm – sharing the enjoyment of our sitesWe recognise the positive impact access to our sites can have on our customers and communities, and we’re committed to opening our sites where possible with over 100 sites usually open to the public.
Last year we held 19 community events at Crossness Nature Reserve, including birdwatching events and nature walks, and also an open day at Farmoor reservoir offering a range of activities for 250 people supported by a wide range of partners.
Walthamstow Wetlands, one of our operational sites and home to Europe’s largest urban wetlands, has seen over 860,000 visitors since opening in October 2017, and this year won the national tourism award for ‘Best UK and Ireland Tourism Project’ by the British Guild of Travel Writers.
We ran another successful London Open House which enables members of the public to catch a rare glimpse inside some of the iconic Thames Water buildings, which are still in use. The sites included the King George V pumping station in Enfield, Greenwich pumping station, the historic Oak Room in Islington and our iconic 150-year-old pumping station – Abbey Mills.
Thames Water Combined Report 2019/20 56Strategic report Governance Financial statements Annual performance report

Non-financial Information Statement
To comply with the Non-financial reporting requirements, contained in sections 414CA and 414CB of the Companies Act 2006, we are providing the details below to help stakeholders understand our position on key non-financial matters.
We have used cross referencing as appropriate to deliver clear, concise and transparent reporting.Non-financial information Section Pages
Business model Business model 12-15Policies Non-financial information statement –Principal risks Our principal risks and uncertainties 70Strategic Ambitions Strategy at a glance 7
Performance against our strategic non-financial performance measures, as shown on pages 31 to 47, is one indicator of the effectiveness and outcome of our policies and guidance.
Within the year, we implemented a new policy framework to ensure consistency and accessibility of all corporate and business policies to all employees. This activity included a focus on ensuring policies are up to date and approved by the relevant Board or committee, scheduling regular
communications to our employees regarding changes to policies and aligning our systems and processes (where applicable) to be compliant Across Thames Water, policies and statements of intent are in place to ensure consistent governance on a range of issues. For the purposes of the Non-financial reporting requirements, these include, but are not limited to:
Our peoplePeople are at the heart of our business. We value and harness the unique skills, experiences and backgrounds that each individual brings to our family. Our ongoing commitment to maintaining a safe, inclusive, and great place to work enables us to attract and retain diverse talent. This helps us ensure we are representative of our communities, who flourish with us, helping us to succeed, driving the right outcomes for our customers, business and environment. We have a comprehensive suite of policies that support our people which are available on our company intranet.
Further information is available via the following sections of this combined report:
Market drivers on page 6People strategic enabler and progress on page 8Performance commitments, page 31People, including gender pay gap information page 26
Diversity of the Board, page 98Ratio of CEO/Directors remuneration compared to employees, page 123
Policy Description
Code of conduct Our code of conduct covers our approach to business activities and how we work, providing a clear, ethical and legal framework for our employees, customers and stakeholders.
Health and safety policy
We aim to protect our people, our contractors, and the customers who live and work in the communities that we serve, by ensuring Thames Water operations are carried out safely every single day.
Employee relations policy
Our employees are our most important assets. We recognise that sound and effective employee relations are an integral part of the success of our business. We’re committed to building strong relationships with our employees which are based on trust and mutual respect.
Diversity and inclusion policy
Our equality, diversity and inclusion policy provides employees and managers with the knowledge, guidance and support needed to drive a diverse and inclusive great place to work.
Board diversity policy
We recognise and embrace the benefits of having an effective and diverse Board and see increasing diversity at Board level as an essential element in promoting the long-term sustainability of the company.
Mandatory training policy
We recognise the importance of continuous training and development and there are some topics that are essential for all our staff and, in some cases, our business partners. Our mandatory training policy provides clarity on the process for agreeing and developing new training, including how we roll out training to our workforce, measure progress and measure compliance.
Membership of the reserve forces policy
This policy supports employees who are members of, or wish to join, the Volunteer Reserve Forces which consist of the Royal Navy Reserve (RNR), the Royal Marine Reserve (RMR), the Army Reserve and the Royal Auxiliary Air Force (RauxAF).
Thames Water Combined Report 2019/20 57Strategic report Governance Financial statements Annual performance report

Non-financial Information Statement continued
EnvironmentThe health of the environment has an impact on our ability to deliver our essential services and we’re committed to continually improving our environmental performance and, at a minimum, complying with environmental and regulatory standards. We aim to deliver our services in the most sustainable way and make sustained improvements, leaving the environment in a better state at the end of each regulatory period.
We have many policies in place to help us address our impact on the environment, all of which are available on our website.
Further information is available via the following sections of this report:
Market drivers, page 6 Generating public value strategic ambition progress, page 8Performance commitments, pages 31 to 47Environmental stakeholders, page 21
Policy Description
Environment policy
We are committed to continually improving our environmental performance, aiming to deliver our services in the most sustainable way, which as a minimum, is compliant with environmental and regulatory drivers.
Climate change policy
We believe that a twin track approach of managing the unavoidable impacts of climate change on our business (‘adaptation’), combined with a reduction in our greenhouse gas emissions (‘mitigation’), is essential if we are to manage the challenges that climate change represents.
Biosecurity policy
As custodians of large areas of land and water, the increasing threat of invasive, non-native species is of real concern to us. To take care of our estate we are committed to ensuring compliance with all invasive, non-native species (INNS) regulatory guidance through the implementation of good biosecurity practice.
Policy Description
Biodiversity policy
To balance the needs of the animals, plants, birds and insects that call our sites home we are committed to continually improving our biodiversity performance at those sites and beyond, whilst aiming to deliver our services in the most sustainable way.
As a minimum we will ensure compliance with all biodiversity, environmental and regulatory requirements, and through our ambitious delivery programme we aim to achieve much more.
Energy policy Managing our energy use innovatively has an important part to play in delivering efficiency and resilience. This ensures the services we provide are sustainable for future generations.
We are committed to continually improving our energy performance, increasing our use of renewable energy, and minimising our greenhouse gas emissions.
Sustainability policy
Striking a balance, doing the right thing for people, for the performance of our business and for the natural environment is what being more sustainable means to us.
Heritage policy We provide the essential service at the heart of daily life. We have a unique heritage with historic assets that we wish to maintain to tell the story of water supply and sewage treatment in the UK.
Human rightsWe acknowledge and operate in accordance with the United Nation’s guiding principles on business and human rights. We promote human rights through our employment policies and practices and through our supply chain. We have policies (including those mentioned in the section on Our people), and processes in place which ensure we’re compliant with these requirements, and they’re enforced throughout our business.
Further information is available via the following sections of this report:
People strategic enabler and progress on page 8People, including gender pay gap information on page 26 Stakeholder engagement on page 19
Policy Description
Modern slavery act statement
We recognise our responsibility to comply with all relevant legislation including the UK Modern Slavery Act 2015. In accordance with the requirements of the Act, we release an annual Statement on Modern Slavery, which outlines the actions we have taken to address the risks of modern slavery and human trafficking in our operations, supply chain, and customer and client relationships.
Our modern slavery act statement is also available on our website. https://www.thameswater.co.uk/legal
Privacy notice Our privacy notice governs how we collect, handle, store, share, use and dispose of information about people. We also set out our policy on our use of cookies on our website. We regard sound privacy practices as a key element of corporate governance and accountability.
Data protection policy
Across our business the privacy and security of personal information is respected and protected.
Thames Water Combined Report 2019/20 58Strategic report Governance Financial statements Annual performance report

Social mattersWe are proud of our record in supporting our people, our business partners and the community we operate in.
As well as the specific policies mentioned below, we have guidance and initiatives in place to support the following:
• Age UK, Citizens Advice Bureau and debt advice bodies
• An employee ‘Time to give’ programme and an employee charitable donations matching scheme to support local charities and groups
• Promotion of skills development through partnerships with universities and colleges
• Environmental groups – WWF, RSPB and the Wildlife Trust
Further information is available via the following sections of this report as follows:
Our approach to sustainability, page 50
Policy Description
Public value policy
Our aim is to understand what others expect of us and to look for opportunities to work in partnership with them. We aim to be responsive to the needs of all our stakeholders, including our customers, employees, government, shareholders, investors, regulators, suppliers, alliance partners, and the wider community in which we operate.
Tax We comply with all tax legislation. Our tax arrangements are covered in ‘Our Finances Explained’, which is published on our website
Procurement policy (incorporating our position on maintaining a sustainable supply chain)
Our procurement policy sets out how we source and procure all goods and services across the business responsibly, ethically and sustainably
Membership of the reserve forces policy
This policy supports employees who are members of, or wish to join, the Volunteer Reserve Forces which consist of the Royal Navy Reserve (RNR), the Royal Marine Reserve (RMR), the Army Reserve and the Royal Auxiliary Air Force (RauxAF).
Non-financial Information Statement continued
Anti-corruption and anti-bribery We seek to promote a culture of honesty and integrity in all our dealings, and we will not tolerate acts of fraud, dishonesty, bribery, corruption or theft of assets or data from the business. In addition to our code of conduct we have additional policies in place to guide our people. These are available on our company intranet.
In addition, we have a confidential 24-hour anonymous ‘speak up’ hotline, details of which are published on our website. This, and a robust whistleblowing process is available to all to raise concerns. We also have a responsive internal Business Integrity team available to answer questions or address concerns raised.
Policy Description
Honesty and ethical behaviour policy
To provide the best possible service and safeguard our employees, we’re committed to conducting all aspects of our business in an honest, ethical and transparent manner.
Competition compliance policy
The purpose of this policy is to set out Thames Water’s policy with regard to competition law compliance and the steps that will be taken to mitigate the risk of breach of competition law.
Thames Water Combined Report 2019/20 59Strategic report Governance Financial statements Annual performance report

Chief Financial Officer’s statementIntroduction
So much has changed at Thames Water over the last three years, from ownership, to senior management, our approach to governance and our strategic direction.
Along with the wider transformation of the business, these major developments impact our financial profile, and it is in this context that the last financial year has been hugely significant.
Brandon RennetChief Financial Officer
Increased investment driving improvements Financial year 2019/20 was the third consecutive year in which our Board limited dividend payments to those required to service debt obligations at companies elsewhere in the group, with no dividends being paid to external shareholders. This decision, which was supported by our external shareholders, has enabled us to make significant incremental investment to improve our resilience and performance for customers in critical areas, such as leakage and asset health as outlined in our performance section. It also enabled us to improve IT stability and lay the foundations for improved service.
Delivering our business plan will be challenging and efficiency will be crucial in everything we do. To this end, we’ve launched a wide-ranging transformation programme to drive improvements across the business. Our focus on cost discipline and efficiency is a central theme right across this programme as we seek to maximise the value of every pound we spend.
Financial performance Year ended 31 March 2020 31 March 20191
Underlying (Excludes
BTL) BTL* TotalUnderlying
(Excludes BTL) BTL* Total
Revenue (£m) 2,108.5 64.3 2,172.8 2,036.9 47.5 2,084.4Operating expenses (£m) (1,667.5) (0.2) (1,667.7) (1,634.6) (0.3) (1,634.9)Operating profit (£m)** 513.4 64.1 577.5 474.1 47.2 521.3Net finance expense (£m) (334.5) – (334.5) (368.6) – (368.6)Net gains/(losses) on financial instruments (£m) 190.8 – 190.8 (37.7) – (37.7)Profit before tax (£m) 369.7 64.1 433.8 67.8 47.2 115.0Profit after tax (£m) 186.6 58.0 244.6 58.9 44.4 103.3Capital expenditure including intangibles (£m) 1,223.0 n/a 1,223.0 1,206.6 n/a 1,206.6Net debt (statutory) (£m) 12,137.5 – 12,137.5 11,687.1 – 11,687.1Dividends paid to immediate parent company (£m) 56.5 – 56.5 60.0 – 60.0Distributions paid to external shareholders (£m) – – – – – –Interest cover (PMICR)*** 1.8 – – 1.6 – –Gearing (%)**** 82.3 – – 82.2 – –Moody’s Corporate Family Rating – – Baa2 stable – – Baa1 negativeS&P Class A Debt Rating – – BBB+ negative – – BBB+ negative
* Refer to page 143 for information about the Bazalgette Tunnel Limited (“BTL”) arrangement** Operating profit includes revenue and other operating income (disclosed in note 2), offset by operating expenses*** As defined on page 153**** Ratio of covenant net debt to Regulatory Capital Value (“RCV”), defined on page 153. Reported ratios for 31 March 2019 before restatements1 The prior year results have been restated due to the impact of the transition to new accounting standard IFRS 16 “Leases” on 1 April 2019 as discussed on pages 150-152 as well as other restatements which
are discussed on page 152.
Transforming the business Efficiency is one of our strategic enablers and we launched our cost efficiency programme during 2019/20. To date, the programme has successfully identified initiatives which have been, or are being, implemented and will deliver underlying operating cost run rate reductions in excess of £100 million per year by early 2021/22, compared to where we were at the end of 2018/19.
As part of our drive to reduce costs and improve operational efficiency in line with our key priorities, we restructured the business, which led to a headcount reduction. This was offset, to an extent, by the increased focus on insourcing activities we can do more effectively and efficiently in house.
Thames Water Combined Report 2019/20 60Strategic report Governance Financial statements Annual performance report

Chief Financial Officer’s statement continued
Performance overviewOur total operating profit for the year ended 31 March 2020 was £577.5 million (2019: £521.3 million restated). The increase in total operating profit is primarily attributable to the increase in revenue compared to the previous year.
Our financial statements include the amounts billed in relation to the construction of the Thames Tideway Tunnel, which are passed to Bazalgette Tunnel Limited (“BTL”), the independent company appointed to construct the tunnel. Excluding these revenues our underlying operating profit for the year was £513.4 million (2019 restated: £474.1 million).
Our total profit before tax (“PBT”) for the year ended 31 March 2020 was £433.8 million (2019 restated: £115.0 million) and underlying PBT was £369.7 million (2019 restated £67.8 million).
A summary of the movement in our total profit before tax split by recurring and exceptional activity, is provided in the chart below:
RevenueOur revenue is generated from the bills we send our customers for the essential water and wastewater services we provide 24 hours a day, 365 days a year. The amount we bill our customers is determined every five years, through a price review process, and is ultimately driven by the costs we expect to incur to invest in and operate our business over that five-year regulatory period.
Our revenue also includes amounts billed to our wastewater customers for construction costs for the Thames Tideway Tunnel. As cash is collected, we pass it directly to BTL, and we therefore show this separately in our financial reporting.
Our total revenue for the year ended 31 March 2020 increased by £88.4 million to £2,172.8 million (2019: £2,084.4 million). While £16.8 million of this increase is due to BTL related revenue, driven by the phasing of construction work, the majority (£71.6 million) relates to our underlying revenue, which for the year ended 31 March 2020 was £2,108.5 million (2019: £2,036.9 million).
A summary of the movement in our Profit Before Tax (PBT)
This year-on-year increase is in line with the phasing in our regulatory allowances, and also reflects our decision to defer revenues of £17 million to mitigate the impact of bill increases for customers, as well as the rebate of £31 million to customers as part of the overall customer compensation package we agreed in relation to missing our leakage targets earlier in the 2015 to 2020 regulatory period.
Operating expensesOverall, our total operating expenses have increased by £32.8 million (2.0%) to £1,667.7 million ( 2019 restated: £1,634.9 million). The increase can be attributed to:
• an increase in employee costs of £20.2 million arising from increased resources within the business to deliver our priorities;
• a £35.2 million increase in depreciation and amortisation, as the significant investment programme continues;
• ‘exceptional’ costs of £27.7 million relating to our recent company restructure and associated programme management costs; offset by
• a £19.1 million decrease in our rates costs, arising primarily from a large rebate due for overpayments in previous years; and
• a £31.2 million reduction in the wider operating costs, such as direct operating costs, consumables, hired and contracted costs and professional fees.
Cash flowUnderlying net cash generated from operating activities for the year ended 31 March 2020 was £1,131.1 million, and therefore broadly in line with £1,113.6 million (restated) generated in the previous year.
Capital expenditure – investment in our assetsDuring the year, we continued with our significant investment programme, investing a total of £1,223.0 million (2019: £1,206.6 million restated) in our assets. The largest area of investment was our water assets, which attracted 56% of the spend, with waste at 41%, and the remainder in retail and central areas of spend such as facilities.
Some examples of the focus of our investment are:
• £20.6 million on our new customer relationship management and billing system on to which the vast majority of our customers have now been migrated
• £47.0 million on our metering programme (water) allowing us to complete the delivery of more than 400,000 smart meters to date
• £16.6 million on the critical enabling works that will allow us to connect our existing waste network to the Thames Tideway Tunnel that will be commissioned later this decade and will transform the health of the River Thames in London.
Gearing We invested over £1 billion every year during the 2015 to 2020 regulatory period which led to significant growth in our Regulatory Capital Value – from £11,848.1 million in April 2015 to £14,729.3 million in March 2020, with an increase of £455.6 million (3.2%) in the last year alone. Funding this level of investment has required an increase in net debt over the same period and this, combined with the impact of regulatory adjustments and penalties, has meant overall gearing has also increased over the regulatory period.
In April 2019, part of the increase was offset by a £249.8 million cash injection into Thames Water Utilities Limited, funded from incremental debt at a holding company. The movement of funds was effected by the repayment of intercompany balances due to Thames Water Utilities Limited by its parent company, Thames Water Utilities Holdings Limited.
As such, gearing as at 31 March 2020 was 82.3%, as compared to 80.1% at 31 March 2015.
£0m
£50m
£100m
£150m
£200m
£250m
£300m
£350m
£400m
£450m
£500m
2019
PBT
Reve
nue
Ope
ratin
g ex
pens
es
Total operating expenses
Exce
ptio
nal c
osts
Net
inte
rest
pay
able
Oth
er o
pera
ting
inco
me
Chan
ge in
net
(los
ses)
/gai
ns
on fi
nanc
ial in
stru
men
ts
2020
PBT
115.0
88.4 5.1 27.7 34.1 0.6
228.5 433.8
0.74%
Thames Water Combined Report 2019/20 61Strategic report Governance Financial statements Annual performance report

As part of the PR19 Final Determination, Ofwat confirmed the 1 April 2020 adjustment to apply to RCV in respect of past ODI and totex performance, land sales and other items including IFRS16. The net downward adjustment is £193.3 million (2017/18 CPIH deflated prices), with the largest component being a sector-wide RCV reduction relating to an inflation mismatch within the 2010 to 2015 regulatory period Capital Incentive Scheme. Had this adjustment taken place on 31 March 2020, rather than 1 April per the regulatory framework, gearing would have been around 1% higher.
DividendsDuring the year, we paid dividends of £56.5 million (2019: £60.0 million) to our immediate parent company, Thames Water Utilities Holdings Limited (“TWUHL”). All of the current year dividends have been applied to servicing debt obligations and working capital requirements of other companies within the wider Kemble Water Group. No distributions were paid by the Kemble Water Holdings Group to external shareholders for 2019/20 in line with our commitment to withhold paying an external dividend until 2020/21, at the earliest.
Taxation In 2019/20, we paid over £196 million in business rates, national insurance contributions, PAYE and other taxes. We incurred £127 million directly, mainly through business rates, and collected £69 million on behalf of our employees. As in prior years, we have not paid any corporation tax to HMRC primarily because of interest costs and tax relief for our capital investment programme. The 2019/20 corporation tax charge of £189.2 million consists of a deferred tax charge of £180.2 million and a current tax charge of £9.0 million, the latter arising because Thames Water Utilities Limited pays for tax losses from other group companies, which should ultimately benefit customers through lower tax funding in future regulatory settlements.
PensionsWe operate three pension schemes for our employees – two defined benefit schemes (Thames Water Pension Scheme (“TWPS”) and Thames Water
Chief Financial Officer’s statement continued
Mirror Image Pension Scheme (“TWMIPS”)) and one defined contribution scheme. During the year ended 31 March 2020, we contributed £13.1 million (31 March 2019: £11.0 million) to our defined contribution scheme.
In December 2019, we completed the triennial valuation dated 31 March 2019 for our two defined benefit pension schemes. This resulted in a combined net deficit across the two schemes of £148.9 million.
Our defined benefit scheme accounting valuation has been updated to 31 March 2020 on our behalf by independent consulting actuaries, Hymans Robertson LLP. The total net pension deficit for the two schemes as at 31 March 2020 was £114.6 million (2019: £293.0 million), which includes a pension deficit of £209.1 million (2019: £338.8 million) for the TWPS scheme, offset by a pension surplus of £94.5 million (2019: £45.8 million) for the TWMIPS scheme. The reduction in the deficit is mostly driven by a change in actuarial assumptions primarily driven by external market factors, with lower inflation expectations being a key driver.
We have also been taking measures to reduce the overall deficit by making regular contributions and deficit repair payments and, as part of the last triennial valuation dated 31 March 2019, a recovery plan was agreed with the trustees aimed at reducing the deficit to zero by 2027.
Bad debt Bad debt is the amounts billed that are considered to be uncollectable from customers. Our bad debt charge for the year ended 31 March 2020 was
Dividends
Kemble WaterFinance Limited
Externalshareholders1
Financing costs onthird party debt
Thames WaterLimited
Thames WaterUtilities Holdings
Limited
Thames WaterUtilities Limited
£54m interest£0m
£54m inter-company loan repayment
£56.5m inter-company loan interest
£56.5m dividend
Working capital requirements and
other costs
£2.5m
1 Dividends are typically distributed to external shareholders via Thames Water Utilities Limited’s ultimate parent holding company Kemble Water Holdings Limited
Thames Water Combined Report 2019/20 62Strategic report Governance Financial statements Annual performance report

Chief Financial Officer’s statement continued
£73.9 million – an increase of £11.3 million compared to the previous year reflecting an additional provision of £15.3 million which we made in response to the potential impact of Covid-19 on collections. Before the impact of this increase, the bad debt charge actually reduced by £4.0 million compared to the previous year due to new initiatives which increased our confidence in the recovery of some older debt previously considered irrecoverable.
The current year bad debt charge is split between bad debt relating to current year bills (amounts that are not expected to be collected when invoiced) of £33.1 million (2019: £33.4 million), which is shown as a deduction in revenue, and bad debt relating to bills from prior years and expected credit losses as a result of Covid-19 of £40.8 million (2019: £29.2 million), which is shown within operating expenses. Our total bad debt charge of £73.9m (2019: £62.6m) equates to 3.4% (2019: 3.0%) of total gross revenue.
Financial flowsBreakdown of 2019/20 actual return Our revenues are set according to a very detailed regulatory process which allows for the recovery of efficient costs plus a return for investors in the business. The actual return to external shareholders in any period is therefore determined by these allowed revenues, and by the degree to which actual costs are higher or lower than the efficient levels allowed. Other key factors affecting returns are the level of rewards or penalties, and the amount of equity invested by the external shareholders. The analysis opposite refers to the Company and is only based on the regulatory accounts.
In order to provide a consistent metric capable of being used as a basis of comparison, we are presenting returns based on a measure of “regulatory equity” that has been developed with Ofwat. Here, the value of equity is calculated as the Regulatory Capital Value (“RCV”) less the amount of net debt in the regulated business.
In the year to 31 March 2020, the allowed level of return for external shareholders for a company with the notional capital structure (i.e. debt equal to 62.5%
of RCV) was 8.18%. This return includes 2.59% of RCV growth arising from RPI inflation.
Total external shareholder return on an equivalent basis was 6.12% (before the impact arising from the sale of the retail non-household business in 2017/18), which is 2.06% below the allowed base level. As the retail non-household business was sold, we no longer recover the corresponding retail margin which was awarded in the PR14 Final Determination. This results in a 0.45% reduction in return, giving an overall return of 5.67%.
Outperformance in this financial year has been driven primarily by our cost of debt being lower than the allowed level, and by the level of debt being higher than the “notional” level, giving higher returns of 4.29% and 3.25%, respectively. The cost of debt reflects our lower underlying cost of debt than the allowance.
When it comes to overall gearing (i.e. the ratio of debt to RCV), levels above the regulatory assumption of 62.5% amplify the percentage return to external shareholders, because debt has a lower required return than equity. Another impact of higher gearing levels is that it increases the volatility of external shareholder returns, which become proportionately more sensitive to levels of out or under performance. Our average gearing level in 2019/20 was around 82%, which resulted in a 3.25% increase in overall shareholder returns.
We are responsible for financing our business as efficiently as possible. Our financing structure, the Whole Business Securitisation, offers additional protections to debt investors enabling us to have higher levels of debt without reducing our credit worthiness. For the avoidance of doubt, any additional risk associated with having a higher level of debt remains with our external shareholders and is not transferred to customers.
Placing a number of the other factors in context, our total expenditure (“Totex”) associated with investing in and operating the business was £224.0 million above our allowance for the year – this amount represents
Breakdown of 2019/20 actual return
Base
allo
wed
equ
ity re
turn
Addi
tiona
l inve
stm
ent
oper
atin
g co
sts
Valu
e re
turn
ed to
cus
tom
ers
thro
ugh
pena
lties
Effic
ienc
ies i
n th
e co
st o
f deb
t(n
et o
f hed
ging
)
Impa
ct o
n ac
tual
leve
l of d
ebt
exce
edin
g na
tiona
l leve
ls
Oth
er fi
nanc
ial f
acto
rs
Nor
mal
ised
equi
ty re
turn
Non
reco
very
of r
etai
l m
argi
n fo
llow
ing
sale
of
non
hous
ehol
d bu
sines
s in
201
7/18
Tota
l equ
ity re
turn
8.18% (8.62)%
(0.98)%
4.29%
3.25% 6.12% (0.45)%5.67%
£100
-2%
10%
0%
2%
4%
6%
8%
Base
allo
wed
equ
ity re
turn
Addi
tiona
l inve
stm
ent a
ndop
erat
ing
cost
s
Valu
e re
turn
ed to
cus
tom
ers
thro
ugh
pena
lties
Effic
ienc
ies i
n th
e co
st o
f deb
t(n
et o
f hed
ging
)
Impa
ct o
n ac
tual
leve
l of d
ebt
exce
edin
g no
tiona
l leve
ls
Oth
er fi
nanc
ial f
acto
rs
Nor
mal
ised
equi
ty re
turn
Impa
ct o
f sal
e of
non
hous
ehol
d re
tail
Tota
l equ
ity re
turn
8.13% (5.46)%
(3.20)% 3.15%
3.45% (0.27)% 5.79%0.48% 6.28%
0.74%
-2%
10%
0%
2%
4%
6%
8%
Breakdown of actual return for the past five years
Thames Water Combined Report 2019/20 63Strategic report Governance Financial statements Annual performance report

Chief Financial Officer’s statement continued
have already commenced and the related debt has been issued.
Credit ratings Driven by a challenging 2019 Price Review, the UK water sector has seen downward pressure on credit ratings over the last year.
Following similar rating actions taken with a number of peers, in March 2020, Moody’s downgraded TWUL’s Corporate Family Rating (“CFR”) to Baa2 with stable outlook (2019: Baa1 with negative outlook). Moody’s also downgraded the Company’s senior secured (Class A) debt rating to Baa1 with stable outlook (2019: A3 with negative outlook) and subordinated (Class B) debt rating to Ba1 with stable outlook (2019: Baa3 with negative outlook).
In February 2020, S&P affirmed the Company’s credit rating of BBB+ and BBB- (2019: BBB+ & BBB-) in respect of our senior secured (Class A) debt and our subordinated (Class B) debt respectively, with negative outlook (2019: negative outlook).
These credit ratings continue to enable us to access efficiently priced debt to fund our investment programme, which is an important factor in keeping bills affordable for our customers.
Financing our investment As we are investing heavily in the business, we continue to focus on the importance of ongoing investor engagement to support our strategy of diversifying our sources of funding and maintaining a balanced debt maturity profile. The strategy of adopting a prudent approach to liquidity has become particularly relevant given the uncertainty that the Covid-19 pandemic has introduced to the global economy.
In anticipation of our 2020 to 2025 investment programme, during the year ended 31 March 2019 we increased the size of our Revolving Credit Facility (RCF) from £950.0 million to around £1.65 billion. The RCF matures in 2024, subject to a further one-year extension option.
our share of overspend. Further, we are returning £25.8 million to customers through penalties. Significantly less penalties were incurred this year mainly due to meeting our leakage targets.
Of the total regulatory return noted above, the vast majority (83%) was retained in the business, with the remainder distributed to cover debt financing costs elsewhere in the group. No dividends were paid to external shareholders.
Average return (2015/16 to 2019/20) Based on an average of the past five years, actual external shareholder return on regulated equity was lower by 2.34% than the allowed return, prior to the impact from the sale of the retail non-household business. Operational underperformance (including penalties) outweighed the benefits from financial factors. The operational underperformance is mainly driven by the additional totex spend in excess of our allowance which reflects our commitment to prioritise customer interests through higher investment levels.
Net gains/(losses) on financial instrumentsWe raise debt in a variety of currencies and use derivative contracts to manage the foreign exchange risk exposure on this debt along with the interest rate risk and inflation risk that we are exposed to. Fluctuations in external market variables such as changes in interest rates, inflation and foreign exchange rates do generate changes in the balance sheet value of these financial instruments with the associated accounting gains or losses impacting profits. We only use derivatives for risk management purposes and both the debt and derivative contracts are generally held until maturity, so there is no cash impact due to these changes. This year, we made a gain on financial instruments of £190.8 million (2019: loss of £37.7 million). The gain of £190.8 million this year was comprised of exchange losses on foreign currency denominated debt of £52.1 million due to a weakening in sterling, offset by gains arising on swaps of £277.8 million primarily due to lower RPI and interest rate expectations and a £34.9 million cash flow hedge transferred to the income statement mainly in relation to forward starting swaps that
Financial impact of Covid-19 The scale of impact of the Covid-19 pandemic remains unclear, however we’re benefitting from the additional investment we’ve made in resilience, for example IT and workforce resilience, and we’ve taken steps to protect our financial resilience in the face of uncertainty. While we don’t expect to know the lasting impact of Covid-19 for some time, on both our finances and those of our suppliers, contractors and our customers, including retailers, we know there will be a material financial impact on our business including:
• A reduction in cash collections from customers who may be finding themselves in increasingly vulnerable financial circumstances as a result of the virus;
• A reduction in total expenditure arising from fewer activities involving direct engagement with customers and disruption to capital programmes;
• Fluctuating services demand across our region due to lockdown and increased working from home
• A reduction in revenue from retailers in the competitive retail water market, due to the impact of the virus on businesses and their ability to pay
After selling our retail non-household business in 2017, around 20% of our wholesale revenues are collected on our behalf by retailers. We’ve worked collaboratively with Ofwat and our peers to identify and implement a range of support measures for retailers, which are expected to reduce cash collection during the current financial year – 2020/21 – with part of that relating to the amount due from 2019/20.
Our expectation is that the majority of the revenue impact should be one of timing, with the well-established regulatory mechanisms allowing for shortfalls to be recovered in future periods. Increased bad debt costs, however, are not recoverable and, in the face of these exceptional circumstances, we have recognised a further £15.3 million for Covid-19 in our provision for bad debts for 2019/20.
While Covid-19 had little impact on total expenditure in 2019/20, it is expected we will see an overall reduction in 2020/21 caused primarily by the disruption to capital delivery and also to some activities where there is a direct interface with customers, such as the fixing of leaks in customer properties. We are carefully assessing the potential impact of disruption, as a basis to engage with Ofwat, which has clearly stated its willingness to factor in such consequences to their assessment of the sector’s delivery against performance commitments.
Our assumptions around the impacts that Covid-19 will have on our business, either directly or indirectly, are detailed within the going concern section of the Directors’ Report and our Long-Term Viability Statement.
Thames Water Combined Report 2019/20 64Strategic report Governance Financial statements Annual performance report

Chief Financial Officer’s statement continued
Throughout the year, we continued to monitor funding opportunities:
• In January 2019, a £227.3 million equivalent ($106.0 million 7-year, $131 million 10-year and €50.0 million 11-year) US Private Placement was priced and funded in April 2019.
• During March 2019, a £189.2 million bilateral term loan facility (split equally over 8-, 10- and 12-year maturities) was signed and funded in November 2019.
• During May 2019, a £175.0 million (£125.0 million 5-year and £50.0 million 3-year) bilateral term loan facility was signed and funded in June 2019.
• In December 2019, a £300.0 million 3.5-year Class B term loan facility was signed, with £150.0 million drawn in March 2020.
Through Kemble Water Finance Limited, a holding company within the wider group, £649.8 million of new Sterling debt was committed in November 2018 (of which £310.0 million was drawn at 31 March 2019 and £338.9 million in April 2019), using the bank and private placement markets. £400.0 million of this was used to refinance the £400.0 million bond guaranteed by Kemble Water Finance Limited which was repaid in April 2019. The remaining amount, £249.8 million, was used to de-gear Thames Water Utilities Limited in April 2019.
As a result, at 31 March 2020, Thames Water Utilities Limited had £1.4 billion of cash, short term investments and undrawn bank facilities available to it. TWUL also has £550.0 million of undrawn liquidity facilities which can only be drawn in limited circumstances. Since 31 March 2020, TWUL has further strengthened its liquidity position by:
• Issuing a £350.0 million 20-year Class A bond and a £40.0 million 30-year Class A private placement
• Signing an additional £110.0 million 3.5-year Class A Term Loan facility.
We currently therefore expect to have in excess of 18 months of liquidity.
The following piechart shows the overall debt mix excluding the impact of swaps.
Borrowings carrying value – £m
GBP EIB loans 464United States Private Placements 1,455GBP index-linked bonds 2,723GBP fixed rate bonds 5,180Foreign currency bonds 399GBP other loans 2,733
Alongside our funding plan, we also manage our exposure to interest rate and inflation risk on an ongoing basis:
• In July and August 2019, we extended the maturity of £4.0 billion fixed and floating interest rate swaps to 2030.
• In October and November 2019, we transacted a number of index-linked swaps with a total notional value of around £2.1 billion with maturities of 5 years and 10 years. These swaps help manage inflation risk and effectively convert existing debt which was issued at a fixed nominal rate into a fixed real rate with the underlying principal amount linked to inflation. All of the swaps transacted are structured to pay the inflation accretion amount at maturity.
• In November 2019, we also extended the maturity of £400.0 million notional of index-linked swaps.
Environment, Social and Governance (ESG)To support our Strategic Ambition and our approach to sustainability, we continue to focus on placing the Environment, Social and Governance (ESG) agenda at the heart of our financial decision making.
Back in November 2018, we tied the interest cost on our £1.65 billion Revolving Credit Facility to our sustainability performance. We committed that any outperformance would be donated to charitable causes and any underperformance would be borne by our external shareholders.
This has been measured by our participation in the Infrastructure Global Real Estate Sustainability Benchmark (GRESB) assessment. GRESB is an independent external ESG benchmark which assesses the sustainability performance of real estate and infrastructure portfolios and assets worldwide. Our latest GRESB score is 86 out of 100. Whilst this score resulted in neither a penalty or reward in the current period, it ranks us 13th globally out of 393 infrastructure companies and top for water and sewerage companies.
In 2018, in line with the ICMA Green Bond Principles, we established our first Green Bond Framework to support the financing of our water and wastewater recycling projects related to the environmentally sustainable management of natural resources and land use, as well as climate adaptation. We aim to provide transparency, disclosure, integrity and quality in our Green Bond reporting and expect to update our Framework in the coming months to reflect ongoing investor feedback and the latest market standards.
86/100GRESB score
For the 12-month period ended 31 March 2020, these derivative transactions reduced interest costs on a cash basis by £47.1 million, although this will be offset by increased costs in later years.
The associated net finance expense has decreased by £34.1 million to £334.5 million (2019 restated: £368.6 million), and we expect this to result in a material ongoing reduction in interest costs over the next 5 years, mainly driven by interest income generated from the new and restructured index-linked swaps.
Some of our interest expense is incurred in relation to borrowings raised to deliver major capital projects. Under IFRS accounting rules we are able to capitalise the interest costs related to major capital projects with the finance expense in the income statement being shown net of these capitalised costs. Capitalised interest costs were £97.6 million this year (2019: £109.3 million).
Alongside managing liquidity and credit ratings, we also monitor a number of financial covenants within our lending documentation. Overall gearing (on a covenant basis as defined on page 153), as at March 2020 was 82.3% (2019: 82.2%), below the mandated maximum of 95.0%. Additionally, our PMICR (see PMICR definition on page 153) in 2019/20 was 1.8x (2019: 1.6x) and was above the covenanted minimum of 1.1x.
Thames Water Combined Report 2019/20 65Strategic report Governance Financial statements Annual performance report

Our approach to risk management Our approach to risk management is to ensure risk is managed effectively and within tolerable limits. Making sure that every effort is made to maximise potential opportunities, minimise the adverse effects of risk and increase our ability to effectively deliver value to our customers, people, communities, environment, stakeholders and shareholders.
There has been a lot of movement in our risk profile during the year, which reflects changes in the political and regulatory environment, which saw the immediate threat of nationalisation of the water industry diminish, the level of uncertainty around Brexit decrease and challenges presented through the transition between AMPs. Many of our risks were also compounded by the Covid-19 pandemic, but overall, the end point is relatively stable compared to this time last year. In 2020/21, we anticipate the risk landscape will continue to fluctuate, remain challenging and complex in both our internal and external
environment. We will be reflecting on the impacts of Covid-19 on our business, our risk management processes and our internal control environment.
Our risk management process is aligned with the Risk Management International Standard, ISO 31000, which supports our compliance with the Financial Reporting Council’s UK Corporate Governance Code guidance on risk management. We have therefore adopted the ISO31000 definition of risk: ‘the effect of uncertainty on our objectives.’
Legal and regulatory compliance
Supply chain management
Asset protection and cyber security
Supply of enough clean,
safe water
Wastewater treatment
Changes to the political
and regulatory environment
Information and operational
technology system
resilience
Business planning and delivery
Health and safety
Environmental protection and climate change
Customer service
Maintaining the trust and confidence
of stakeholders
People
Financing our business
Principal risks
Operational
Strategic
Risk categories
ComplianceFinancial
Diagram 1 shows the key elements of our risk management process: identification, assessment and treatment of our risks, and the overall arrangements for implementing, monitoring, reviewing, and continually improving our system of risk management and internal control.
Source: ISO31000:2018
Diagram 2 shows our risk structure.
Financing our business
Scope, Criteria, Context
Risk Identification
Risk Analysis
Risk Evaluation
Risk Assessment
Risk Treatment
Recording & Reporting
Com
mun
icat
ion
& C
onsu
ltat
ion
Monitoring &
Review
“ The Thames Water Board and our Executive team are committed to ensuring the effective management of both risks and opportunities to meet the expectations and needs of our customers and to ensure the long-term success of the business. I am pleased in the way our management of risk is evolving in what for Thames Water, as for many other organisations, is an increasingly complex and challenging environment and I am confident that we have in place a strong base on which we will build over the next few years.”
Nick Land Chair of the Audit, Risk and Reporting Committee
Our risk framework covers all types of risks which affect the Company and could impact the achievement of our purpose and strategic ambitions. Each identified risk is categorised as strategic, operational, compliance or financial, and aligned to one of our 14 principal risks within these categories. Each principal risk is sponsored by a member of our Executive team.
Day-to-day risk management is carried out throughout our business. The design and co-ordination of the risk management process and the enterprise-wide
reporting on risk is undertaken by a dedicated central risk team with the support of an established network of risk champions embedded within each business function. The risk champions take a lead role in engaging local management in the identification and assessment of risk, reporting updated risk information on a regular basis.
In addition to identifying, assessing and monitoring new and changing risks, through our horizon scanning we also consider emerging risks. Those that, over time,
Managing our risks
Thames Water Combined Report 2019/20 66Strategic report Governance Financial statements Annual performance report

have the potential to increase in significance and affect performance or the achievement of objectives, but which are difficult to assess at the initial point of identification.
Emerging risks are identified, reported and monitored to ensure we are prepared for the potential threats or opportunities they present. Current emerging risks include Sludge to Land and the potential for increased restrictions on sludge recycling to agriculture; the impact of the Environment Bill reforming abstraction licensing; and delivering net zero carbon emissions from our operations by 2030. New, changing risks are prioritised and reported, according to our defined risk scoring criteria, and where appropriate, aggregated to enable quarterly review of the Company’s top risks and mitigation activities by our Executive Risk Committee.
Governance and oversightRisk governance is integral to effective risk management. The Board has overall responsibility for the Company’s risk management framework and systems of internal control. This includes the determination of the nature and extent of risk it is willing to take to achieve its strategic objectives, and for ensuring that an appropriate risk culture has been embedded throughout our organisation.
The Audit, Risk and Reporting Committee (“ARRC”), on behalf of the Board, approves the Company’s overall governance arrangements, the risk and control framework and risk appetite. It receives regular reports on top risks, the effectiveness of controls in place to manage them and, where appropriate, the status of further mitigation strategies being developed to bring risk to within acceptable levels.
These reviews form the basis for our annual principal risks and uncertainties disclosure.
The structure shown in diagram 3 outlines the flow and escalation of risk information and reporting from our business functions, up through established governance forums, such as the Regulatory Policy Group, Data Protection Committee, Data Governance Board and
Environmental Governance Board, the Executive Risk Committee to the ARRC and our Board. Conversely, strategic direction and guidance is cascaded down from the Board and the Executive Risk Committee.
During 2019/20, and with oversight and challenge provided by the ARRC, we continued to evolve our risk management framework and approach to help us clarify, simplify and standardise how risk is managed and reported across the business, and used to support decision making. We refreshed our principal risk model and our risk appetite statements and the ARRC oversaw improvements to the way we responded to risks such as Brexit, the threat of political intervention/re-nationalisation of the water industry, financeability, and improved its understanding of catastrophic loss risk mitigations.
During 2019/20 the ARRC carried out deep-dives and received updates from operational teams on our management of key risks and performance measures covering the following topics:
Principal risk Risk deep dives and updates
Supply of enough clean, safe water
Trunk mains strategic review
Supply of enough clean, safe water
Water quality
Legal and regulatory compliance
Data protection
Information and operational technology system resilience
Managing technology infrastructure and performance Data quality
Legal and regulatory compliance
External reporting
People Critical skills and employees
Wastewater treatment Pollution incidents
During the year we began a programme of Board level risk workshops covering our principal risks. The first two workshops, covering six of our 14 principal risks shown below, have already taken place, with the remainder due to be covered through the coming year:
• Supply of enough clean, safe water;
• Wastewater treatment
• Information and operational system resilience
• Asset protection and cyber security
• Financing our business
• Supply chain management
Managing our risks continued
Continuous improvement of our risk management processOur key focus areas over the year were:
• Risk policy, standards and guidelines – refreshed and published guidance materials to support the business in operating a consistent, high-quality risk identification and assessment process;
• Risk appetites – commenced a programme to refresh our risk appetite based on our principal risks and strategic objectives. Our first six statements have been agreed with our Executive team and the Board;
• Policy framework – designed and implemented a new policy framework for the business, utilising a common format and single policy hub to host all approved policies, to support business awareness and understanding; and
• Schedule of delegated authority (SoDA) – revised and relaunched corporate and operational SoDAs.
Our key priorities for 2020/21 to further develop our risk management framework are:
• Long-term sustainability risk – enhance our process for the identification, assessment and response to emerging threats and long-term vulnerabilities to the future business;
• Risk appetites and key risk indicators (KRIs) – continue the programme to refresh our risk appetite statements and define and implement a suite of KRIs to assist with decision-making process and performance management;
• Risk and resilience frameworks – establish a resilience framework and align it with our approach to risk to help minimise impacts to our business and service to customers both now and in the future;
• Interconnectivity of risks – enhance the risk landscape and our visibility of risks across the business to provide early sight of common causes and consequences; and
• Controls and assurance – expand the documented controls framework and enhance assurance activities.
Diagram 3
Board
ARRC
Executive Risk Committee
Enterprise Risk Team
Risk Oversight Forums
Business Functions
Thames Water Combined Report 2019/20 67Strategic report Governance Financial statements Annual performance report

Diagram 4 shows our 3 lines of defence assurance model
Risk, control and assurance activitiesOur risk management utilises the “three lines of defence” approach to providing assurance over the processes, procedures and controls in place to manage risk to the achievement of our goals and objectives. The first line of defence is the design and continual operation of controls by our front line and core business operations, such as water production; the second line provides support and oversight to these first line activities. Second line activities are carried out by, for example, health and safety specialists and environmental and other compliance professionals. The third line of defence, that of providing independent assurance to the Executive and Board over the first two lines is carried out by our internal and/or external auditors and where appropriate, by technical / professional external bodies, such as ISO/BSI certification bodies. Diagram 4 demonstrates how this structure is applied to our business.
The specific tasks or activities undertaken by our various lines of defence, help us control and obtain confidence that we are effectively and efficiently delivering against our objectives and goals. The combination of reporting from the functions involved provides insight on the company’s risk profile allowing proportionate and targeted management action.
We are continuing to enhance our company-wide internal control framework to support the business in demonstrating its management of risk.
Key elements of our control framework include:
• Established company policies, standards and procedures
• Suite of management and performance reports
• Financial controls covering for example, investment appraisal, planning, budgeting and forecasting, schedule of delegated authority that defines approval and authorisation thresholds and segregation of duties
• Mandatory training programme
• Insurance programme reflective of business activities
Managing our risks continued
Routine assurance activities include:
• Programme of testing of documented controls and use of data analytics to assess compliance with policies and procedures
• External reporting assurance framework
• Targeted external assurance reviews, including those performed by our external auditors PwC
• Oversight, governance forums, such as the Regulatory Policy Group, Data Protection Committee, Data Governance Board, Environmental Governance Board
• Risk based internal audit reviews of the design and operation of the internal control environment
Aligning our approach to risk and resilienceOur customers expect a continuous and consistently high level of service from us at all times, so we are investing to deliver brilliant customer service and drive public value through resilient assets and systems.
We have defined resilience as ‘our ability to anticipate, cope with, recover from and learn from disruptive events in order to maintain and improve the quality of service for our customers and protect the natural environment, both now and in the future.’
In order to create and maintain a resilient business, we are establishing a resilience framework which is an extension of our current risk management process. It focuses on understanding the key interdependencies between systems and services across our business. It will help us to maximise customer and shareholder value by prioritising improvement and investment at a system, rather than just an individual asset level, with consideration of longer-term trends and high-impact low-likelihood risks.
We are taking steps to review our baseline resilience and identify areas for further improvement. We will continue to progress and develop our resilience action plan, building on good practice both within and outside the sector, ensuring it is integrated with our enterprise-wide risk management and wider governance frameworks.
We recognise our services also rely on and impact a wide range of other systems including the natural environment, other infrastructure providers, the economy and agriculture and we are working with external stakeholders to understand these interdependencies.
Our approach aligns with Ofwat’s interpretation of ‘resilience in the round’, incorporating corporate, operational and financial resilience.
Governance Committees and Board
Senior Management
1st line of defence Business functions that own
and manage risks and controls
• Water production
• Water distribution
• Water transport
• Water treatment
• Customer services
2nd line of defence Business functions that oversee
risks and controls
• Water quality compliance
• Health, safety and wellbeing
• Enterprise risk management
• Ofwat regulatory compliance
• Environmental regulatory compliance
• Internal control testing
3rd line of defenceBusiness functions that provide
independent assurance
• Internal audit
• External audit
• Other third-party assurance providers
Thames Water Combined Report 2019/20 68Strategic report Governance Financial statements Annual performance report

Managing our risks continued
Catastrophic lossWe have defined catastrophic loss risks as ‘risks that lie outside the realm of regular expectations (low-likelihood) but which could have extreme consequences (high-impact) for our business, such as a major health, safety or environmental event, fundamental change to our business model or operations, or financial concern; which in some cases were perhaps predictable’. Steps are taken to understand such risks fully and ensure we anticipate and prepare for them by enhancing our organisational resilience.
The Covid-19 pandemic has shown how important it is to understand and be prepared for catastrophic loss events. A ‘major health event’ was one of our previously identified catastrophic loss risks, with a corresponding Flu Pandemic Playbook developed to direct early action; this was supported by enhancements to our incident management process which enabled us to scale up our actions in response to this event.
To move towards a more resilient model for the business, we need greater visibility of these risks. Preventing, preparing and responding to catastrophic loss events in a considered manner and ensuring that when events do occur, the business emerges more resilient from the experience is a critical activity. However, the costs of risk mitigation will need to be considered to ensure any measures are proportionate to the risk faced. Catastrophic loss risks are assessed annually through the risk management framework and will also strengthen the severe but plausible shocks and scenarios used in building the Long-Term Viability Statement (see pages 75-78).
Changes to our principal risks during the yearWe have refreshed our principal risk model during the year to improve clarity and transparency of the risks we deem to be significant for our business. As a result, we have increased our principal risks from 12 to 14. The main changes provide clearer visibility on how we manage risks associated with the supply of water and the treatment of wastewater, but we also now differentiate between risks associated with the operational resilience of our information and technology infrastructure from risks associated with deliberate, malicious security threats to / attacks on, our sites, assets or our information and operational technology infrastructures.
Over the course of 2019-20 several incidents and / or external factors have directly driven and/or influenced the risk agenda. These are summarised below:
• Resilience of our water infrastructure – significant bursts and the management of operational incidents, together with support for customers and the wider community and other stakeholders that are impacted;
• Rise in significant pollution incidents;
• Level of scrutiny from our regulators, for example in relation to our competition law compliance and our leakage reduction plans;
• Our Final Determination and plans for the delivery of our AMP7 business plan
• Uncertainty around Brexit
• Impact of Coronavirus (Covid-19); and
• Quantum of change we embarked upon to optimise the business
The principal risks have been used as the basis for the adverse assumptions and risk scenarios in the Long-Term Viability Statement disclosed on pages 75-78.
More information on our principal risks can be found in the following pages where we describe in detail the principal risks we face and how we are managing them.
Thames Water Combined Report 2019/20 69Strategic report Governance Financial statements Annual performance report

Our principal risks and uncertainties
1. Environmental protection andclimate changeWhat this risk means to us: Without robust operational resilience plans and environmental management systems, we may be unable to deal with the impact of extreme and unpredictable weather events, or operational incidents, on our assets and infrastructure resulting in damage to the natural environment, and/or are unable to successfully plan for future water resource supply and demand due to climate change.
Link to strategic ambitions: Risk trend over the year:
Explanation of trend • 15 serious pollutions during the year. This number increased during 2020. • Covid-19 – we are already experiencing supply impacts due to unexpected
increases in demand. This may cause us to have to use emergency abstractions and drought permits to maintain supply leading to adverse environmental impacts.
• The evolving markets of bioresources and sludge treatmentintroduced uncertainty.
Key drivers • Short-term – prolonged wet weather and high groundwater causing sustained
storm discharges or unusually high temperatures for prolonged periods • Impacts of Covid19 restrictions • Longer-term – implications of climate change, changing weather patterns and
population growth on water resources • Potential for operational incidents to cause significant pollutions • Abstraction impacts leading to low flows in rivers
How we are managing the risks: • During the Covid-19 pandemic, we are prioritising essential work and
postponing non-essential projects • Pollution incident reduction plan • Long-term – management of water resource issues and drainage and
wastewater issues as set out in our Water Resource Management Plan andWastewater Management Plan respectively
• Focus on influencing a change in manufacturer and customer behaviour toreduce water demand and to prevent sewer misuse
• Development of Groundwater Impacted Catchments Management Plans • Development of a comprehensive Environmental Management System for the
Wastewater business
Looking forward: • Mitigating long-term risks requires a robust and well-evidenced business
case for PR24, focussed on enhancing resilience of both our assets and thenatural environment.
• Commitment to protecting and enhancing the health of the rivers in our area. • Delivery of our Smarter Water Catchments initiative to increase understanding
of our river catchments and enhance natural resilience through delivery of partnership projects
• Development of stronger relationships with Catchment Partnerships and otherenvironmental NGO’s to enable greater partnership working
• Commitment to net-zero carbon emissions
2. Changes in the political andregulatory environmentWhat risk means to us: We may be unable to effectively anticipate and/or influence future developments in the UK water industry resulting in changes which may affect our ability to meet our strategic ambitions and best serve our customers and the environment
Link to strategic ambitions: Risk trend over the year:
Explanation of trend • The outcome of the 2019 election sets the medium-term political direction in
relation to political intervention in the water sector. The conclusion of PR19 alsoprovides clarity on the basis for investment over the coming 5 years
Key drivers • PR19 determination • Country’s political direction / potential intervention in the water sector, for
example around any move to nationalise the sector • Introduction of more stringent environmental regulations, for example in relation
to permitting and sludge recycling • Changes to the economic regulatory environment, some of which may be related
to Covid-19
How we are managing the risks: • Making a proactive and constructive contribution to the public policy debate
around the water sector • Active and ongoing engagement and consultation with regulators and politicians • Wide and in-depth engagement with a wide range of other stakeholders including
engaging on mitigating the risks and uncertainty arising from Covid-19
Looking forward: • Implications of changes in law/regulations around future sludge disposal. We will
be developing a long-term plan (AMP8+) to address the challenges around wasteto land process
Overview of our principal risks
Principal riskRisk
trendCurrent
risk level
Strategic
1. Environmental protection and climate change
2. Changes in the political and regulatory environment
3. Maintaining the trust and confidence of our stakeholders
4. Business planning and delivery
Operational
5. Customer service
6. People
7. Health and safety
8. Information and operational technology system resilience’
9. Supply of enough clean, safe water
10. Wastewater treatment
11. Supply chain management
12. Asset protection and cyber security
Compliance
13. Legal and regulatory compliance
Financial
14. Financing our business
KeyRisk trend
Increasing
Stable
Decreasing
Risk level
Major High
Moderate Minor
Our Strategic Ambitions
To invest in resilient systems and assets
To deliver brilliant customer engagement
To generate public value
Thames Water Combined Report 2019/20 70Strategic report Governance Financial statements Annual performance report

Our principal risks and uncertainties continued
4. Business planning and delivery
What this risk means to us: Without a clear strategy supported by robust planning, transformational change and operational processes we may be unable to meet our regulatory operational performance targets and/or deliver our capital investment programme
Link to strategic ambitions:
Risk trend over the year:
Explanation of trend • No significant change in the risk profile during 2019/20
Key drivers • Strategic business planning • Delivery of company’s vision • Delivery of the company’s capital investment programme • Business transformation plans • Data quality improvements • Business and service continuity plans
How we are managing the risks: • Clear strategy for delivery of challenging business plan • Prioritised business and asset investment process • Business transformation/change programme and governance • Improved robustness of financial governance arrangements • Performance and financial management reporting process • During the Covid-19 pandemic, we continue to monitor decisions which impact
our performance targets and have postponed some non-essential projects, and have assessed the impact of these to our business
Looking forward: • AMP7 transformation programme • Enhancing the business planning and price review process • Continue to drive efficiency through the business • Programme to improve approach to risk and resilience
5. Customer service
What risk means to us: We may be unable to improve and maintain our levels of customer service to deliver what our customers tell us they want: an effortless customer experience, a safe and dependable water service and wastewater service, plan for the future, and for us to be a responsible company.
Link to strategic ambitions:
Risk trend over the year:
Explanation of trend • Response to customers during, and post, significant incidents, such as Finsbury
Park burst water main, does not meet customer or stakeholder expectations • Level of complaints received, specifically on charging and billing • Performance against regulatory targets
Key drivers • Incident response and management does not meet customer/
stakeholder expectation • Customer service dissatisfaction leads to poor CMEX and DMEX scores • Impact of Covid-19 on wholesale and retail revenue, cash and service delivery
How we are managing the risks: • Improved incident response including actioning lessons learnt from major events, • Customer service improvement initiatives enabled by significant investment in
new platform to enhance capability within our call centre, reduce complaints and service resolution timescales,
• Continued improvements to our propositions to support customers in vulnerable circumstances
• Continued engagement to understand what our customers want and to prioritise improvements
• Offered financial assistance to household customers affected by Covid-19 such as social tariffs and flexible payment terms
Looking forward: • Stabilisation and optimisation of new customer service and billing platform • Water Networks Transformation Programme to improve customer
service outcomes • Incident Management improvement initiatives and growth of Priority Services
Register and support wrap • Bad Debt Transformation programme
3. Maintaining the trust and confidence of our stakeholders What risk means to us: Without robust stakeholder understanding and relationship management we may be unable to meet the needs and expectations of all our stakeholders (customers, regulators, investors, communities, pressure groups, etc), leading to a loss of trust and confidence, as well as damage to our brand
Link to strategic ambitions: Risk trend over the year:
Explanation of trend • No significant change in the risk profile during 2019/20
• Key drivers • Operational and customer service performance • Management of communications in the event of major incidents (mains bursts,
significant pollutions) • Quality and impact of dialogue with, and response to, our stakeholders
How we are managing the risks: • Full review of our approach to stakeholder engagement, looking at areas including
systems and processes; relationships with key individuals and organisations, and how we work with communities
• Extensive engagement with all stakeholders to understand their needs, expectations and preferences
• Regular communications, for example on key company announcements, through our quarterly stakeholder newsletter, and on individual projects
• Bespoke engagement on issues of interest, such as long-term water resource and wastewater management planning
• Improved levels of transparency
Looking forward: • Build new, and strengthen existing stakeholder relationships • Forge deeper links with our communities to better understand their needs
and preferences • Develop our capability in stakeholder relationship management
Thames Water Combined Report 2019/20 71Strategic report Governance Financial statements Annual performance report
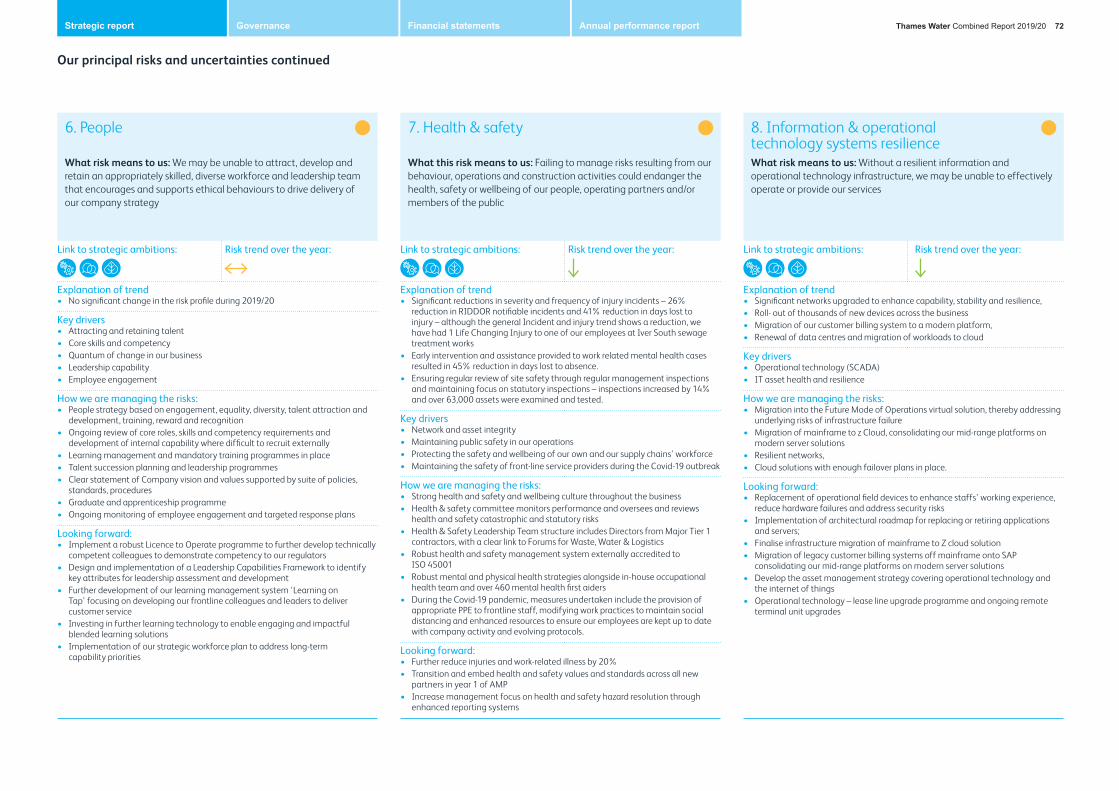
Our principal risks and uncertainties continued
7. Health & safety
What this risk means to us: Failing to manage risks resulting from our behaviour, operations and construction activities could endanger the health, safety or wellbeing of our people, operating partners and/or members of the public
Link to strategic ambitions: Risk trend over the year:
Explanation of trend • Significant reductions in severity and frequency of injury incidents – 26%
reduction in RIDDOR notifiable incidents and 41% reduction in days lost to injury – although the general Incident and injury trend shows a reduction, we have had 1 Life Changing Injury to one of our employees at Iver South sewage treatment works
• Early intervention and assistance provided to work related mental health cases resulted in 45% reduction in days lost to absence.
• Ensuring regular review of site safety through regular management inspections and maintaining focus on statutory inspections – inspections increased by 14% and over 63,000 assets were examined and tested.
Key drivers • Network and asset integrity • Maintaining public safety in our operations • Protecting the safety and wellbeing of our own and our supply chains’ workforce • Maintaining the safety of front-line service providers during the Covid-19 outbreak
How we are managing the risks: • Strong health and safety and wellbeing culture throughout the business • Health & safety committee monitors performance and oversees and reviews
health and safety catastrophic and statutory risks • Health & Safety Leadership Team structure includes Directors from Major Tier 1
contractors, with a clear link to Forums for Waste, Water & Logistics • Robust health and safety management system externally accredited to
ISO 45001 • Robust mental and physical health strategies alongside in-house occupational
health team and over 460 mental health first aiders • During the Covid-19 pandemic, measures undertaken include the provision of
appropriate PPE to frontline staff, modifying work practices to maintain social distancing and enhanced resources to ensure our employees are kept up to date with company activity and evolving protocols.
Looking forward: • Further reduce injuries and work-related illness by 20% • Transition and embed health and safety values and standards across all new
partners in year 1 of AMP • Increase management focus on health and safety hazard resolution through
enhanced reporting systems
8. Information & operational technology systems resilienceWhat risk means to us: Without a resilient information and operational technology infrastructure, we may be unable to effectively operate or provide our services
Link to strategic ambitions: Risk trend over the year:
Explanation of trend • Significant networks upgraded to enhance capability, stability and resilience, • Roll- out of thousands of new devices across the business • Migration of our customer billing system to a modern platform, • Renewal of data centres and migration of workloads to cloud
Key drivers • Operational technology (SCADA) • IT asset health and resilience
How we are managing the risks: • Migration into the Future Mode of Operations virtual solution, thereby addressing
underlying risks of infrastructure failure • Migration of mainframe to z Cloud, consolidating our mid-range platforms on
modern server solutions • Resilient networks, • Cloud solutions with enough failover plans in place.
Looking forward: • Replacement of operational field devices to enhance staffs’ working experience,
reduce hardware failures and address security risks • Implementation of architectural roadmap for replacing or retiring applications
and servers; • Finalise infrastructure migration of mainframe to Z cloud solution • Migration of legacy customer billing systems off mainframe onto SAP
consolidating our mid-range platforms on modern server solutions • Develop the asset management strategy covering operational technology and
the internet of things • Operational technology – lease line upgrade programme and ongoing remote
terminal unit upgrades
6. People
What risk means to us: We may be unable to attract, develop and retain an appropriately skilled, diverse workforce and leadership team that encourages and supports ethical behaviours to drive delivery of our company strategy
Link to strategic ambitions: Risk trend over the year:
Explanation of trend • No significant change in the risk profile during 2019/20
Key drivers • Attracting and retaining talent • Core skills and competency • Quantum of change in our business • Leadership capability • Employee engagement
How we are managing the risks: • People strategy based on engagement, equality, diversity, talent attraction and
development, training, reward and recognition • Ongoing review of core roles, skills and competency requirements and
development of internal capability where difficult to recruit externally • Learning management and mandatory training programmes in place • Talent succession planning and leadership programmes • Clear statement of Company vision and values supported by suite of policies,
standards, procedures • Graduate and apprenticeship programme • Ongoing monitoring of employee engagement and targeted response plans
Looking forward: • Implement a robust Licence to Operate programme to further develop technically
competent colleagues to demonstrate competency to our regulators • Design and implementation of a Leadership Capabilities Framework to identify
key attributes for leadership assessment and development • Further development of our learning management system ‘Learning on
Tap’ focusing on developing our frontline colleagues and leaders to deliver customer service
• Investing in further learning technology to enable engaging and impactful blended learning solutions
• Implementation of our strategic workforce plan to address long-term capability priorities
Thames Water Combined Report 2019/20 72Strategic report Governance Financial statements Annual performance report

Our principal risks and uncertainties continued
10. Wastewater treatment
What this risk means to us: We may be unable to effectively remove and treat wastewater, or impact the environment should our processes, sewers and pumping stations fail
Link to strategic ambitions:
Risk trend over the year:
Explanation of trend • Rise in significant pollution incidents
Key drivers • Pollution incidents • Condition of critical wastewater assets results in asset failure/poor performance • Capacity of small treatment works (that were not designed for large volumes) due
to low population movement (Covid-19) • Sewer abuse resulting in poor performance of the assets. • Future restrictions on sludge recycling
How we are managing the risks: • Pollution incident reduction plan • EA agreed, national investment plan covering several AMPs • Go to Green programme • Enhanced monitoring of assets (asset health measures) • Mitigation plans for sites experiencing high load as a result of Covid-19 related
population movements • Engagement with WaterUK regarding the future of sludge recycling
Looking forward: • Risk-based wastewater network maintenance and investment plans • Development of an asset management strategy and investment plans that
extend across AMP7-10 and strategically to 2100 • Development of an Asset management strategy that is ISO 55001 certified • Programme underway to increase technical competence of operational teams
11. Supply chain management
What risk means to us: We may be unable to effectively deliver day to day services, capital, operational or change programmes without a sustainable, resilient, cost-effective supply of goods, services, and high calibre third party contractors
Link to strategic ambitions:
Risk trend over the year:
Explanation of trend • Covid-19’s long-term impact on Supply Chains are likely to be significant in some
areas as economic shocks emerge post governmental financial support. • e.g. more financial failure of businesses which may disrupt supply of goods
and services • Potential shortages of some base products • Price volatility in some supply markets
Key drivers • Supply chain resilience to deliver AMP7 plan • Supplier relationship management • Robustness of contract management activities • Short term impact of Brexit • Critical chemical supply • Financial stability/solvency of key suppliers • Market impact post-Covid19
How we are managing the risks: • Enhanced monitoring of supply chain health in face of Covid-19 economic fallout • Ensure appropriate supply contingencies are in place to deal with supply shocks,
such as Brexit • Support of small suppliers • Contractual relationships built on achieving long-term value • Contract management processes and ongoing performance review • A supplier management framework to deliver ongoing value • Despite the uncertainty around Brexit, we continue to monitor and develop
preparations, with ongoing monitoring of Government Brexit proposals
Looking forward: • Collaboration with our supply chain to deliver innovations that drive towards a
more sustainable service, including mitigating single source supply • Improved engagement across the business to better understand future business
needs to drive best value • Enhance contract management capabilities and capacity within our business • Further development of the supplier management programme to build best
practice supplier relationship management to deliver further innovation and supply chain improvement.
9. Supply of enough clean, safe water What risk means to us: We may be unable to provide a secure, resilient supply of clean, safe drinking water with the potential for a negative impact on public confidence in water supply
Link to strategic ambitions:
Risk trend over the year:
Explanation of trend • No significant change in the risk profile during 2019/20
Key drivers • Water quality incident • Condition of critical water assets resulting in asset failure/poor performance or
safety incident • Supply disruption to some customers in island zones • Leakage reduction targets • Reliance on pumping stations to pump water around our network • Increased demand due to environmental changes
How we are managing the risks: • Drinking water quality transformation programme agreed with DWI • Monitoring of assets (asset health measures) • Contingency arrangements for areas at risk of supply failure • Leakage reduction plan achieved best result this year • Plans to reduce demand (leakage and per capita consumption/water
efficiency programme)
Looking forward: • Risk-based water network maintenance and investment plans being developed to
improve resilience in key areas of London and Thames Valley • Transformation of the water network – development of an asset management
strategy and investment plans that extend across AMP7-10 and strategically to 2100
• Implementation of an asset management system that is ISO 55000 certified • Continue work to enhance the understanding of our assets through improved
data collection • Programme underway to enhance the technical competence of
operational teams • Implementation of an asset management system that is ISO 55001 certified
Thames Water Combined Report 2019/20 73Strategic report Governance Financial statements Annual performance report

13. Legal and regulatory compliance
What this risk means to us: Our processes may fail or may not effectively keep pace with changes in legislative and/or complex regulatory landscape leading to instances of non-compliance with our obligations.
Link to strategic ambitions:
Risk trend over the year:
Explanation of trend • No significant change in the risk profile during 2019/20
Key drivers • Compliance with the terms and conditions of our licence • Compliance with all legal and statutory obligations • Compliance with regulatory obligations, e.g. environmental obligations, water
quality regulations, environmental permitting regulations and consents
How we are managing the risks: • The Board promotes high ethical standards of behaviour and ensures the
effective contribution of all Directors. • Robust policies, processes and controls to understand and meet legal and
regulatory compliance obligations, including standards and policies in third party contracts
• Continued focus on delivery of leakage target and associated commitments, with regular reporting to customers, Ofwat and other stakeholders during the year
• Data protection improvement programme aligned with IT transformation programme and migration of sensitive data onto new platforms
• Policy framework and mandatory training programmes • Robust H&S culture and audit / review programme • Monitoring of consent and permit compliance • Horizon scanning for changes to the legal and regulatory environment with
associated risk assessment of impacts to our business
Looking forward: • Programme to improve the legal and regulatory compliance control environment
and assurance activities
14. Financing our business
What risk means to us: We are unable to fund the business sufficiently in order to meet our liabilities as they fall due.
Link to strategic ambitions:
Risk trend over the year:
Explanation of trend • Risk heightened due to broader economic uncertainty and potential impact on
financial markets, in addition to increased economic pressure on our customer base affecting collections
Key drivers • Efficient access to future funding • Credit rating downgrade • Gearing levels and financial covenants headroom • Pension scheme deficit • Financial consequences arising from Coronavirus outbreak (delays to revenue and
cash, increased bad debt, additional unforeseen operating costs) • Delivery risk on cost transformation initiatives
How we are managing the risks: • Strong liquidity position supported by cash and available committed
banking facilities • Agreed schedule of contributions to reduce pension deficit combined with
significant overall deficit reduction driven by economic factors • Ongoing focus on credit ratings and financial covenant headroom in
budget setting • Treasury strategy covering funding, hedging and cash management in place • Cost transformation programme delivering efficiency savings to the business
• See viability statement (on pages 75-78) for further details on financial resilience
Looking forward: • Further review of business plan and budget to achieve challenging cost
saving targets
Our principal risks and uncertainties continued
12. Asset protection and cyber securityWhat risk means to us: We may be unable to protect our assets from internal / external threats and vulnerabilities, due to inadequate or ineffective security controls protecting sites, data, systems, processes and people and as a result we may experience loss, or corruption of personal and business data, or significant disruption of our key business systems and services.
Link to strategic ambitions:
Risk trend over the year:
Explanation of trend • No significant change in the risk profile during 2019/20
Key drivers • Cyber security • Physical site security • Obligations arising from Networks and Information Systems Directive (NIS)
How we are managing the risks: • Collaboration with CPNI and regulators (e.g. DWI and Defra) to drive
improvements in approach to security across the water sector • Technological security measures, including effective modern firewalls, patching
policies, threat/vulnerability monitoring, identity management controls, multi-factor authentication, encryption of information,
• Physical and electronic site security controls, including site alarms and CCTV that are actively monitored
• Clear policies and procedures and mandatory security awareness training and communications.
• Regular risk assessments of physical security threats and measures • Incident response process
Looking forward: • Improving the quality and accuracy of user information in our systems. • Limiting, controlling and monitoring the use of standard users and administrators • Increasing the use of incident alerting tools, and tools to prevent the deliberate
and accidental loss of data. • Improving the quality and utility of data collected and collated within our incident
monitoring solution • A significant program of work to maintain and improve our physical and electronic
site security controls including upgrading CCTV and hatch alarms on service reservoirs and boreholes.
Thames Water Combined Report 2019/20 74Strategic report Governance Financial statements Annual performance report

Introduction In accordance with provision 31 of the Corporate Governance Code 2018 the Directors have undertaken a robust assessment of the longterm viability of the Company. This reflects an extension of the Company’s usual business planning process, and incorporates the key matters concerning resilience that have featured in the Company’s business plan submission for the next five year regulatory period 2020–2025.
This viability statement is set out in three sections:
1) The Board’s approach to the viability assessment;
2) Severe but plausible downsides and the Board’s conclusion; and
3) The Board’s considerations of a more extreme outcome and assessment around how the customer will always be protected in terms of the Company’s ability to continue to deliver an effective service.
The Board’s viability assessment is subject to review by our external auditors who comment on whether there are any inconsistencies between this and the rest of the financial statements. Their audit opinion on pages 132 to 137 of this Report has not highlighted any inconsistencies.
Board’s approach to the viability assessment Throughout the year the Board assesses, on a regular basis, the key risks facing the Company, and the actions available to help mitigate against the impact of such risks – both individually and collectively, recognising that different risks can, and do, materialise at the same time. The assessment includes robust challenge by the Board over financial forecasting, the risk management assessment process, regular and timely budget reviews and finally scenario planning incorporating severe but plausible scenarios. The overriding objective is for the Board to assess the long-term prospects for the Company, ensuring the operations and financing arrangement are sustainable to support the delivery of critical customer service. Similar to the prior year, the Board continues to use a rolling ten year assessment period to assess the prospects and viability of the Company. The assessment period is therefore up to 31 March 2030 – covering both the whole of AMP7 and AMP8.
In making this assessment, the Directors have considered the current position of the Company, its ability to effectively and efficiently manage its finances, the current regulatory regime, its continued access to debt markets and ability to maintain an investment grade credit rating, whilst having regard to the principal risks and uncertainties as described on pages 70 to 74. Due to the ten year look-forward period, the level of certainty of the assumptions used reduces the further into the future we look. The high degree of confidence for first few years of AMP7, is followed by moderate confidence in remaining years of AMP7 and a lower level of confidence for AMP8. In spite of the reduced confidence levels in the later years of the look forward period, the Directors continue to consider the ten year period to be appropriate given the long term nature of the business.
In response to the Final Determination (“FD”) issued by Ofwat in December 2019, a Base Case was developed. Whilst the FD is an improvement over the Draft Determination, it remains challenging. The Company’s Base Case forecasts high levels of investment which would most likely result in totex overspend. Given the operational performance targets set by the FD, regulatory penalties are also expected. As mentioned in the going concern assessment, the Base Case has been updated to reflect an estimate of the Covid-19 impact. This includes factors impacting 2020/21 such as lower non-household revenues due to lower billable consumption, reductions in cash receipts from household customers (which incorporates our view around debt recoverability) and various mitigants such as totex efficiencies, some of which are a result of lower activities due to lockdown restrictions. Lower inflation over the short to medium term due to lower economic growth from Covid-19 has been considered. The plan also reflects the two year lagged impact of both the revenue true-up due to shortfalls in 2020/21 and the higher regulatory penalties arising from lower than expected operating performance in 2020/21 caused by lockdown restrictions.
Severe but plausible downsides and conclusion The Board’s approach has been to test the financial resilience of the business against a range of severe but plausible downside events derived primarily from the principal risks and uncertainties set out on pages 70 to 74. Such downsides have been applied to the Company’s Business Plan. Stress testing has considered the impact on the covenants attached to the Company’s funding position, the credit rating and liquidity (taking into account the dependency of existing financing arrangements and the availability of new debt) as these are key to the overall assessment of financial resilience. Each event has been considered individually, with the aim of identifying and quantifying the impact of severe but plausible outcomes, which typically manifest themselves as cost increases, reductions in revenue, performance penalties, regulatory fines and/or reputational damage. Timing has been an important consideration and the Board has also considered the impacts being sustained for periods of multiple years. As part of the review, the Directors have identified and factored
in certain preventative and mitigating controls which could be used to reduce the financial and/or reputational impact. Furthermore, the Board has considered a range of combined scenarios whereby two or more of the individual principal risks compound each other, to reflect circumstances that can arise in practice where two or more events can combine in the same time frame. Descriptions of the individual events and how they relate to the principal risks are outlined overleaf.
Long-term viability statement
Thames Water Combined Report 2019/20 75Strategic report Governance Financial statements Annual performance report

RefPrincipal riskname Impact Description
A Changes in the political and regulatory environment; Financing our business
Economic downturn
• In the event of a poor macroeconomic environment materialising over a prolonged period of time, growth would be adversely affected resulting in low inflation. This has been highlighted by the Covid-19 pandemic which is expected to result in an economic downturn, the magnitude and duration of which are uncertain
• The Company’s wholesale revenue, RCV growth and totex is linked to the underlying rate of inflation. As such our financial performance is likely to be negatively affected by low inflation or in a severe scenario deflation
• In response to depressed economic growth, it is expected that interest rates would be relatively low to promote growth. This would in turn reduce interest costs for the Company, partially mitigating the adverse financial impact arising from low inflation
• We have stress tested for low growth taking place over the majority of the assessment period
B Changes in the political and regulatory environment; Financing our business
Increase in bad debt
• Regulations prohibit water companies from disconnecting domestic / residential properties for non-payment of water supplies. This can present difficulties in recovering full and timely payments from customers. We have modelled an adverse trend where bad debt would increase by up to 20% for each year, starting in the second year of the assessment period. This would take into account unforeseen shortfalls in achieving the expected cash collection rates as well as an economic recession where certain customers would be unwilling to pay their bills
C Environmental protection and climate change; Supply of enough clean, safe water; Wastewater treatment; Customer service; Maintaining the trust and confidence of our stakeholders
Adverse weather
• Adverse weather is assumed to take place for the majority of the assessment period. We have considered wet weather, cold weather and dry weather. These events attempt to take into account the potential impacts of climate change:
• severe wet weather event leading to additional sewer flooding which is in excess of operational limits
• severe cold weather event leading to higher than expected burst pipes and leakage repairs
• severe dry summer event leading to emergency reinforcement of water supplies including the use of de-salination and temporary usage bans resulting in compensating customers for interruptions
RefPrincipal riskname Impact Description
D Health and safety; Environmental protection and climate change; Supply of enough clean, safe water; Wastewater treatment; Customer service; Maintaining the trust and confidence of our stakeholders
Loss of operational capacity/asset failure
• Assumed failure of a critical water production asset causing severe water supply interruptions. This leads to the use of more expensive alternative water production facilities, the provision of customer compensation and costs incurred to repair / replace the associated assets
• Assumed failure of a critical asset on the wastewater network leading to over pumping for an extended period and costs incurred to repair / replace the associated assets
• We have modelled that these costs are incurred for the majority of the assessment period
E Maintaining the trust and confidence of our stakeholders; Legal and regulatory compliance
Significant non-compliance of regulations
• Unforeseen non-compliance with regulations such as General Data Protection Regulation (GDPR) and environmental legislation could result in significant fines and reputational damage
F Business planning and delivery; Changes in the political and regulatory environment; Legal and regulatory compliance delivery; Legal and regulatory compliance
Failure to achieve performance commitments
• The adverse effect of more stringent performance targets has been taken into account. We have assumed a similar penalty pattern to risk event E
• We have modelled that this takes place for the majority of the assessment period
G Supply of enough clean, safe water; Health & safety; Customer service; Maintaining the trust and confidence of our stakeholders; Legal and regulatory compliance
Significant water quality incident
• We have assumed a Cryptosporidium outbreak taking place twice over the assessment period, with each incident crystallising five years apart
• Such an incident would involve the contamination of a localised water treatment site which serves a significant customer base
• This leads to the use of more expensive alternative water production facilities, cost associated with monitoring and eliminating contamination in the water supply, the provision of customer compensation and reputational damage
H Asset protection and cyber security; Customer service; Maintaining the trust and confidence of our stakeholders; Legal and regulatory compliance
Significant comprise of cyber security
• A severe compromise of technology and systems such as through a cyber-attack has been assessed. Systems are essential in the effective and efficient control and operation of our infrastructure assets
Long-term viability statement continued
Thames Water Combined Report 2019/20 76Strategic report Governance Financial statements Annual performance report

RefPrincipal riskname Impact Description
I Information and operational technology resilience; Customer service; Maintaining the trust and confidence of our stakeholders
Loss of IT capability
• Compared with last year, this risk has reduced due to significant network upgrades to enhance our capability, stability and resilience and the migration of the majority of our customers to a new, modern Customer Relationship Management and Billing System
• Notwithstanding such reduction, we have assumed costs for the parallel running of both the legacy and new Customer Relationship Management and Billing System
J Business planning and delivery; Supply of enough clean, safe water; Wastewater treatment; People; Supply chain management
Failure to achieve Business Plan objectives
• We have modelled further totex investment over and above what is allowed by the regulator for the majority of the assessment period. This is assumed in order for the Company to deliver its performance commitments and maintain its asset base at the expected levels
K Financing our business; Business planning and delivery
Increase in the cost of new debt issuance
• An increase in the cost of new debt issuance has been assumed to reflect any potential credit rating downgrade arising from adverse operational and / or financial performance
L Changes in the political and regulatory environment; Financing our business; Business planning and delivery
Implementation of Ofwat’s original gearing sharing mechanism
• We have tested the impact of implementing Ofwat’s original gearing sharing mechanism
In addition to the specific risks highlighted above, for completeness the Board has also considered how the forecast economic downsides would impact the Company’s defined benefit pension liability as recognised in the statement of financial position. In conclusion the Board determined that a decrease in inflation would probably result in a decrease in the pension liability and a decrease in interest rates would likely result in an increase in the pension liability. These two impacts would not be expected to directly offset each other, however, overall the impact of such macroeconomic factors is not considered to have a severe impact on the defined benefit pension liability over the assessment period. Additionally, for the assumption around longevity the Directors concluded that it is not considered that a plausible change in this assumption would be significant enough to have a severe impact on the defined benefit pension liability.
In conducting the viability assessment, the Board has assessed the intercompany arrangements and the corporate structure of the Group (as detailed on page 90). No scenarios were identified that would impact the fundamental viability of the Company.
The impact of each event identified above has been considered and for the purpose of the long-term viability assessment the Board has considered four combined downsides which have been designed to be severe but plausible. Such downsides have been developed taking into account historical events and performance, the probability of such events taking place in a combined manner and consideration of how the individual principal risks and uncertainties have been combined. Descriptions of these linked scenarios, along with the underlying constituent risk events, are detailed below.
All downsides include (i) the impact of an adverse macroeconomic environment, (ii) significant cash flow shocks from regulatory penalties for failure to achieve certain performance targets, (iii) additional expenditure required to achieve business plan
objectives, (iv) an increase in the cost of new debt issuance associated with any potential credit rating downgrade arising from adverse operational and/or financial performance and (v) implementation of Ofwat’s gearing sharing mechanism as per the FD.
Ref Scenario Description/rationale
1 Adverse weather with economic downturn
• Consecutive adverse weather events resulting in short-term service failure and regulatory and performance penalties.
• A severe wet weather event
• A severe cold weather event
• A severe dry weather event
• Simultaneous critical asset failures resulting in interruptions to water supply and compromises in the wastewater networks
• Consequential, overspend on our business plan to remediate damage and compensate customers
• Backdrop of prolonged economic downturn leading also to increases in bad debt
• An increase in the cost of new debt issuance reflecting any potential credit rating downgrade
• Application of Ofwat’s original gearing sharing mechanism
• Combining risk events: A, B, C, D, E, F, J, K, L
2 IT failure with economic downturn
• A cyber-attack on our IT systems leading to a short-term IT asset failure and data breach, resulting in short-term service failure and regulatory and performance penalties
• Consequential overspend on our business plan to remediate damage and compensate customers
• Backdrop of prolonged economic downturn leading also to increases in bad debt
• An increase in the cost of new debt issuance reflecting any potential credit rating downgrade
• Application of Ofwat’s original gearing sharing mechanism
• Combining risk events: A, B, E, F, H, I, J, K, L
Long-term viability statement continued
Thames Water Combined Report 2019/20 77Strategic report Governance Financial statements Annual performance report

Ref Scenario Description/rationale
3 Water quality failture with economic downturn
• Cryptosporidium event at a localised water treatment site resulting in supply interruptions to a significant customer base and regulatory and performance penalties
• Consequential overspend to remediate damage and compensation to customers
• Backdrop of prolonged economic downturn leading also to increases in bad debt
• An increase in the cost of new debt issuance reflecting any potential credit rating downgrade
• Application of Ofwat’s original gearing sharing mechanism
• Combining risk events: A, B, E, F, H, J, K, L
4 Cyber and asset failure with economic downturn
• A cyber-attack on IT systems which are integrated with our operational asset infrastructure leads to short-term operational asset failure and regulatory and performance penalties
• Simultaneous critical asset failures resulting in interruptions to water supply and compromises in the wastewater networks
• Consequential overspend on our business plan to remediate damage and compensate customers
• Backdrop of prolonged economic downturn leading also to increases in bad debt
• An increase in the cost of new debt issuance reflecting any potential credit rating downgrade
• Application of Ofwat’s original gearing sharing mechanism
• Combining risk events: A, B, D, E, F, H, I, J, K, L
Board’s conclusionIn assessing the impact of the principal risks, the Board has considered the preventative and mitigating actions that are available to address the aggregated impact and importantly the impact on the covenants that attach to the Company’s key funding facilities. Based on this assessment the Board has a reasonable expectation that the Company will be able to operate within its financial covenants, maintain an investment grade credit rating and maintain sufficient liquidity facilities to meet its funding needs over the ten year assessment period. This conclusion has been made assuming capital markets continue to operate under normal market conditions and that no renationalisation of the water sector takes place over the assessment period.
Extreme events and protection for our customersIn the unlikely circumstance of certain extreme events crystallising and unsuccessful renegotiation with external funding parties, the Company would be unable to satisfy certain financial covenants which would result in an 18 month standstill of creditor claims taking effect. During this standstill period, secured creditors cannot take enforcement action on the Company and the period allows creditors and management time to resolve the cause of the non-compliance. If no agreement with creditors was reached upon expiry of the standstill period, the Company would be placed into “Special Administration”. Under this regime, a Special Administrator would be appointed whose primary duty would be to act in the best interests of customers, to ensure continuity of services, and to seek new owners who are deemed to be “fit and proper”.
The consequences of non-compliance with the financial covenants have been considered to provide comfort to customers that their services would continue if such an extreme circumstances, which are remote in nature, were to materialise.
Long-term viability statement continued
Thames Water Combined Report 2019/20 78Strategic report Governance Financial statements Annual performance report

Section 172 statement
The Board of Directors of the Company consider, both individually and together, that they have acted in the way they consider, in good faith, would be most likely to promote the success of the company for the benefit of its members as a whole, having regard to the stakeholders and matters set out in s172(1)(a-f) of the Companies Act 2006.
The directors of the Company must act in accordance with the duties contained in s172(1) of the Companies Act 2006 as follows:
• “A director of a company must act in the way he considers, in good faith, would be most likely to promote the success of the company for the benefit of its members as a whole, and in doing so have regard (amongst other matters) to—
• (a) the likely consequences of any decision in the long term,
• (b) the interests of the company’s employees,
• (c) the need to foster the company’s business relationships with suppliers, customers and others,
• (d) the impact of the company’s operations on the community and the environment,
• (e) the desirability of the company maintaining a reputation for high standards of business conduct, and
• (f) the need to act fairly as between members of the company.”
As part of their induction, each director is briefed on their duties and the availability of professional advice from either the company secretary or, if they consider it necessary, from an independent adviser. As part of this process the directors also have meetings with members of the executive team to gain insight into the operational aspects of the business to enable them to understand the potential impact of their decision making. Deep dive sessions for all directors were also conducted during the year on relevant strategic topics which included the website, dry weather, pollutions, smart metering journey and biodiversity.
The skills matrix for directors on page 98 in this report demonstrates the experience and knowledge of each director. Whilst the selection of directors must
be made on merit, the collective skills at Board level reflects the aim of having a Board composition that can adequately over-see and monitor the Company’s activities. This is to ensure the Board applies the purposes, values and strategy approved by the directors and the shareholders.
As a large organisation, it’s relevant to appreciate that the directors fulfil their duties partly via the governance framework which delegates authority for the executive management of the business to the CEO and their executive management team for the day to day running of the business. Specific matters that are reserved for decision by the Board have typically first been considered and discussed by the CEO’s executive committee and, if appropriate, by a Board committee as well. In this way there are checks and balances for the integrity of the management information being provided to the Board.
The Statement of Delegated Authority (SoDA) setting out the decision-making framework within the business includes authority levels for individual executive directors as well as the Board collectively and was reviewed and updated during the year. Further details of this governance framework can be found in our governance report from page 81.
All directors and shareholders receive a monthly report detailing the prior month’s performance of the business. The report contains a range of management information covering health & safety, customer experience, operations, digital strategy and transformation, asset management, regulation, capital delivery, corporate affairs and sustainability, people, finances and commercial activity plus most recently has also covered Covid -19.
In addition, at each Board meeting a session is devoted to the CEO and each member of the executive management team providing an update covering key aspects of the management report providing the directors with the opportunity to ask questions on these and any other issues. Individual directors also contact the management team directly when they require additional information on any aspect of the business.
Our stakeholders include customers, employees, shareholders, investors, suppliers, business partners, regulators, local and national government, other third-party interest groups, the community, the environment and society as a whole. Further information about stakeholder engagement can be found on page 19. The potential impact on relevant stakeholders is considered by the Board and is taken into account when reaching their decisions as reflected in the table below. In all of the above ways, our directors can demonstrate having regard to their statutory duties to support their effective decision making.
The following provides further information on how the directors have discharged their s172 duties during the year.
Long Term implications of decision makingMuch of the Board’s decision making is focussed around ensuring that the business is sustainable in the long term. Consequently, each year the Board takes 2 days to consider the long-term strategy of the business, incorporating presentations and discussions on longer term opportunities and threats to the business. Topics included this year covered innovation, asset management, education programme, our purpose, Strategic Ambitions including public value and our Values.
Risk ManagementThe Board recognises that it is vital that there is effective identification and evaluation of risks that the business faces and that they are managed and mitigated. The Board supports the on-going evolution of the approach to risk management and has delegated detailed oversight of principal risks and how our risk environment is managed to the Board Audit Risk and Reporting Committee (“ARRC”). At each Board meeting the Chair of the ARRC reports on matters that have been considered by it. In addition, there is regular reporting on risk directly to the Board by executive management where Board approvals may be sought. For the ARRC’s report for this year see pages 100 to 104 and further detail about how we manage our risk environment on pages 66 to 69.
Our People People are at the heart of our business and critical to its success. Therefore the health, safety and well-being of our employees is one of the Board’s primary considerations. As a responsible business our behaviour is aligned with the expectations of our people as well as customers, shareholders, investors, communities and society as a whole. For our business to succeed we need to manage our people’s performance and develop and bring through talent while ensuring we operate as efficiently as possible. During the year the board considered culture and values at one of its meetings and an example of the decisions and planned outcomes is in the table below.
During the year Ian Pearson was appointed by the Board as the designated independent non-executive director to lead on workforce engagement and supported by the other directors. The workforce engagement programme has the objective of engaging with and understanding employees’ views on key issues and providing evidence to the Board to allow directors to include these in their considerations. The schedule of engagement aims to provide the Board with appropriate information on employees’ views on workforce and business issues from the company engagement activity (e.g. “Hear-for-you”). The Board then agrees which issues it wishes particularly to focus on during the following year.
Business RelationshipsAs a board of directors our intention is to behave responsibly and to ensure executive management operate the business in a responsible manner operating within the high standards of business conduct and good governance expected of a business like ours and in so doing contribute to the delivery of our corporate strategy for the next AMP and beyond.
Our plan for AMP7 was informed by extensive engagement with customers enabling us to gain an understanding of their views and priorities and underpinned by the work of our customer challenge group. The output from this activity was then shared with the Board as well as being considered and discussed at our Customer Services Committee.
Thames Water Combined Report 2019/20 79Strategic report Governance Financial statements Annual performance report

Our Board also considered and approved a number of policies (such as for whistleblowing plus honest and ethical behaviour) both of which were reviewed in advance by the ARRC. These policies are designed to help us maintain high standards of business conduct. Annually the board also considers and reviews our modern slavery statement and compliance with competition legislation.
Community and Environment The Board is committed to seeking to continually improve the delivery of our services in the most sustainable way, which means complying with regulation, delivering public value and leaving the environment in a better state than we found it at the end of each regulatory period. These issues were all considered by the Board at its meetings during the year with some aspects given more detailed consideration by the Board’s Health, Safety & Environment Committee (“HS&EC”). Page 107 provides further information about topics that this committee considered during the year.
At each Board meeting the Chair of the HS&EC provides an update on what was discussed and considered at the previous committee meeting as well as making recommendations to the Board for approval to actions identified together with their rationale. Other topics are brought directly to the Board by the CEO or a member of the executive management team for consideration and discussion with approval to some activity on their recommendation. For further information on how the Company interacts with communities and the environment see pages 50 to 56.
External shareholdersThe Board openly engages with our external shareholders as we recognise the importance of a continuing effective dialogue. It is essential to us that shareholders understand our long-term strategy and objectives so these must be explained clearly, feedback heard as well as any issues or questions raised properly considered. Joint sessions with both the Board and shareholders took place throughout the year on several strategy related topics including Ofwat’s draft and final determinations as well as the financeability of the business plan for the next
Principal Board decisions during the year based on Board activities Assessment by Board of s172 Stakeholder Engagement Impact on decision Planned Outcomes
AMP 7 business plan S172 a to f collectively • All stakeholders Versions prepared and discussed with stakeholders with resulting changes producing the final plan
To drive operational and cost efficiency to maximize value for money for our customers and improve shareholder returns
Financeability of draft and final determinations
S 172 a and f
Long term consequences
Act fairly between business members
• Shareholders • Investors • Regulators • Customers
Advised Ofwat draft determination not financeable and then accepted final determination
To enable the business to invest in resilient systems and assets now and in the future to improve performance in key areas such as leakage, supply interruptions and pollution reduction
Integration of public value as a strategic ambition and overarching framework
S172 a and d
Long term consequences
Impact on community and environment
• The community • Environment • Customers • Employees • Interest groups • Society as a whole
Inclusion following internal and external discussion with the stakeholders identified
To ensure the right governance framework exists to monitor the impact of the business on the environment to make a positive impact on communities and society as a whole
Migration of customers to new customer relationship management and billing system
S172 a , c
Long term consequences
Foster business relationships
• Customers • Employees • Business partners • Shareholders
Customer and employee feedback with financial implications supported by shareholders
To deliver brilliant customer engagement by improved customer service thereby ensuring customers remain at the heart of our business
Investment in new IT equipment for all employees to improve IT capabilities and stability
S172 a and b
Long term consequences
Interests of company’s employees
• Employees • Shareholders • Customers • Business partners • Suppliers
Employee views with prioritisation endorsed by shareholders
To deliver current and future business plans including the strategic approach to data and to be recognised internally and externally as a great place to work
Approval and engagement in the definition of Purpose and new Behaviours
S172 a , b and e
Long term consequences
Interests of company’s employees
• All stakeholders Versions prepared and discussed with stakeholders with resulting changes producing final version
To maintain the highest standards of business integrity and to create a highly engaged, results focused culture.
Key
a the likely consequences of any decision in the long term
b the interests of the company’s employees
c the need to foster the company’s business relationships with suppliers, customers and others
d the impact of the company’s operations on the community and the environment
e the desirability of the company maintaining a reputation for high standards of business conduct
f the need to act fairly as between members of the company.
Section 172 statement continued
regulatory period and in the long term. Additionally, several shareholder representatives are directors which also enables them to report back firsthand on all issues discussed and considered by the Board.
The Strategic Report was approved by the Board of Directors on 29 June 2020 and signed on its behalf by
Brandon RennetChief Financial OfficerBelow are some key strategic decisions made during the year by the Board with references to the relevant
sections of s172 when performing their duties. In this context a principal board decision is one with an anticipated impact on the business of 5 or more years. The Board took many factors into account in reaching each of the decisions below which included the impact on stakeholders.
Thames Water Combined Report 2019/20 80Strategic report Governance Financial statements Annual performance report

Chairman’s introduction to corporate governance
It’s been another busy year for the Board of Thames Water Utilities Limited. After a wholesale change to the Board since 2017, and the recent appointment of Paul Donovan and Michael McNicholas, we’ve been working together to ensure effective oversight of the executive team and to support the development of the business plan for 2020 to 2025. Following this period of significant change and after making a series of fundamental improvements to reflect ‘best in class’ governance, we’ve undergone a full independent, external evaluation by Lintstock (see page 99).
We’ve also been preparing for the arrival of our newly appointed Chief Executive Officer on 1 September, after a robust recruitment process. At that point, I will return to being Non-Executive Chairman of the Board of Thames Water Utilities Limited. Kemble Water Holdings Limited has a different Chair to maintain high levels of governance and a separation between the operating company and external shareholder owned holding company. Nick Land, the Chair of our Audit, Risk and Reporting Committee (“ARRC”) was reappointed during the year as a Director and continues in his roles as Interim Deputy Chairman, as well as Senior Independent Director.
Culture and engagementAs a Board, we’re taking steps to increase our oversight of company culture to ensure it supports the delivery of our purpose, strategy and near-term priorities, while also making Thames Water an attractive employer. We were involved in the definition of our new purpose during the year and are committed to ensuring it is embedded across the organisation, with regular updates and engagement with teams across the business. We were also involved in the process to test our values and approve new supporting behaviours. With our purpose, values and behaviours now in place, we’re increasing our focus on monitoring and assessing culture at Board level.
The appointment of Ian Pearson as our Workforce Engagement Lead Director supports our cultural ethos. Together with other members of the Board, Ian has been meeting with employees from across the business to listen to the challenges they face and report back to the Board, to be able to drive change from Board level. This more robust approach to workforce engagement also enables Ian and the Board to gain a better understanding of how the spirit of our Purpose is running through the organisation, from senior management to front line staff, and how our people are living and breathing our Values and Behaviours.
We’ve also engaged with external stakeholders during the year through our Annual Stakeholder Review in November 2019, which was attended by over 100 representatives from Environmental NGOs, charities, banks and regulators, as well as via our Customer Challenge Group (CCG) and meetings with our regulators. This is to ensure we understand the needs and expectations of all the groups we both engage with and support.
ESG and the role of the Board Akin to our purpose, we’re committed to delivering strong ESG performance, with this report highlighting our performance against a range of ESG metrics. As a Board, we’re focused on maintaining high levels of governance.
Priorities of the committees and our approach to managing riskOur Board Committees have been focusing on the key challenges and strategic decisions facing the business as we head into this regulatory period, from appointing our new Chief Executive Officer, to confirming our business plan, aligning remuneration with our strategic ambitions and priorities and overseeing the launch of our major new billing platform to drive future service improvements.
“ Our Board Committees have been focusing on the key challenges and strategic decisions facing the business as we head into this regulatory period, from appointing our new Chief Executive Officer, to confirming our business plan, aligning remuneration with our strategic ambitions and priorities and overseeing the launch of our major new billing platform to drive future service improvements”.
Ian Marchant Interim Executive Chairman
Our ARRC has been overseeing the assurance of our business plan submissions, ensuring best practise reporting and evolving our more robust approach to managing risks. During the year, we identified 15 new or emerging risks, reflecting the evolving challenges facing our business.
At the end of the last financial year, and as we move through this one, the ARRC has been working with the Executive team to ensure an effective response to the onset of the Covid-19 pandemic to protect the wellbeing of our people and our customers, and ensure the resilience of our essential services. The unpredictability and risks associated with the Covid-19 pandemic haven’t gone away, however we’re in a more resilient position as we tackle both the potential short and longer-term impact of the virus. Our business continuity plans are robust, as has been demonstrated in recent months, and we will continue to approach the evolving situation with a considered approach to risk management and a flexible approach to our plans for the year.
We look forward to continuing to work with our regulators to balance the short and long-term needs of our customers, our communities and the environment as we deliver life’s essential service.
Thames Water Combined Report 2019/20 81Strategic report Governance Financial statements Annual performance report

Compliance with Governance Code
Compliance Statement The UK Corporate Governance Code 2018 (the “Code”) applies to accounting periods beginning on or after 1 January 2019. In addition, in January 2019 Ofwat issued a revised set of Board Leadership, Transparency and Governance Principles (BLTG Principles) which superseded the previous BLTG Principles issued in 2014.
The Company is committed to high standards of governance and has applied the principles of the Code, and the BLTG Principles. The Board has complied with all the relevant provisions of the Code with the exception of Provisions 9, 17 and 38.
Provision 9 requires that the roles of the Chair and the Chief Executive should not be exercised by the same individual. During the period Ian Marchant has carried out the role of Interim Executive Chairman, whilst the search for a new CEO took place. This interim arrangement was considered and agreed by both the Board and Shareholders, with Nick Land being appointed as Deputy Chairman to ensure that effective governance continued and that the Executive team, the Board and Shareholders had a point of contact to resolve any issues should it be considered that the Interim Executive Chairman was not discharging his dual role appropriately and effectively.
It was not necessary for Nick Land to intervene in any situations during the year and the Board review undertaken by Lintstock, highlighted that the leadership demonstrated by the Chair during this challenging period was universally commended and the commitment greatly appreciated by the whole Board.
Provision 17 of the Code says that the majority of members of the Nomination Committee should be independent non-executive directors. During the year only two of the five members of the committee were independent non-executive directors. The chairman, who was independent on appointment, was also a member of the committee during the year.
Provision 38 , aligning Executive Director pension contributions with those available to the workforce. An explanation of how this will be addressed in future is set out on page 109 in the Remuneration Report.
Corporate Governance Code Principles Further Information
Where to find further information
Board leadership and Company purpose
Strategy OverviewS172 statementBoard Stakeholder EngagementStakeholder EngagementManaging our RisksStrategy at a glance Long term viability statementChairman’s Introduction to Corporate GovernanceBoard Leadership and Company Purpose Board Activities aligned with Strategy
Page 2Page 79Page 88Page 19Page 66Page 7Page 75Page 81 Page 88Page 91
Division of responsibilities
Board and Resource AllocationRoles and Responsibilities of the DirectorsDivision of ResponsibilitiesBoard Committees
Page 93Page 93Page 92Page 92
Composition, succession and evaluation
Board Evaluation 2020Nomination Committee reportDirectors and their other interestsDirectors’ Appointment and Induction ProgrammeTraining and Professional Development
Page 99Page 96Page 95Page 95Page 95
Audit, risk and internal control
Audit Risk & Reporting Committee reportManaging our RisksOur Principal Risks and UncertaintiesRisk and Compliance Statement
Page 100Page 66Page 70Pages 253-259
Remuneration Director’s Remuneration Report 2019/20Approach to Remuneration 2020/21Summary of Remuneration Policy across wider groupExecutive Director’s RemunerationDirectors’ RemunerationRemuneration Committee Report
Page 108Page 111Page 111Pages 112-120Pages 121-124Pages 126-127
Thames Water Combined Report 2019/20 82Strategic report Governance Financial statements Annual performance report

Our Chairman Our Independent Non-Executive Directors
Ian Marchant Interim Executive Chairman – Thames Water Utilities Limited
Appointed to the Board: December 2017 Appointed as Chairman: January 2018
N S R
Relevant skills • Highly experienced Chairman, CEO and
Non-Executive Director with a focus on the utilities sector
• Expertise in governance, finance, regulation, renewable energy and climate change mitigation
Relevant experienceDuring his ten years as CEO of SSE plc, as part of a 21-year tenure at the energy company, Ian led transformational change, performance improvements and the development of renewables. He is currently Chair of Nova Innovation Ltd and a Non-Executive Director of Aggreko plc. Through his company Dunelm Energy Limited, Ian advises and invests in start-up businesses.
He is the former Chairman and founder of the Scotland 2020 Climate Group and served as the President of the Energy Institute and Chairman of the renewable energy firm, Infinis. He was also the Chairman of Wood. Ian is the founder of Scotland’s ‘Lights up Malawi’ campaign for Climate Justice and was recently appointed Honorary President of the Royal Zoological Society of Scotland.
Alistair Buchanan CBE Independent Non-Executive Director
Appointed to the Board: July 2018
S A
Relevant skills • Highly experienced chartered accountant with
significant expertise in the regulation of utilities and public policy
• Board level experience within the water sector and energy sector Board experience at Electricity North West
Relevant experienceAlistair has a strong track record in developing regulation and public policy after being CEO of Ofgem for ten years until 2013. He was a Non-Executive Director of Scottish Water and was Chairman of KPMG’s UK Power and Utilities Practice for five years until 2018. Before Ofgem, he spent the majority of his career in financial services with investment banks, where he was the top ranked analyst in his sector. He was awarded a CBE in 2008 for his services to energy policy making. He currently also sits on Boards of WHIreland plc and Atlas Corporation.
Nick Land Deputy Chairman/Senior Independent Non-Executive Director
Appointed to the Board: February 2017
A R N C H
Relevant skills • Significant experience on the Boards of leading,
global companies
• A highly experienced Chartered Accountant, with global financial and governance experience spanning more than three decades
Relevant experienceNick brings a wealth of multi-sector finance and governance experience following ten years as Chairman of Ernst & Young as part of his 36-year career at one of the world’s largest accounting firms. He was also a member of the Global Executive Board. He is was a Non-Executive Director of the Financial Reporting Council until March 2020 and Chairs the Private Equity Reporting Group of the British Venture Capital Association. He is also Chairman of the Board of trustees of the Vodafone Group Foundation. This follows a long history of Non-Executive Director roles at global companies such as Vodafone Group, Alliance Boots GmbH and Royal Dutch Shell.
Catherine Lynn Independent Non-Executive Director
Appointed to the Board: November 2018
C H
Relevant skills • Expertise in strategic business management within
a regulated, highly dynamic environment
• Proven success embedding customer needs at the heart of business decision making in a large scale, complex organisation serving millions of customers
Relevant experienceCatherine brings a wealth of commercial, operational, strategic and senior management experience having played a leadership role in Europe’s low-cost aviation sector for 20 years, with a focus on delivering outstanding customer service. She is the former Group Commercial Director of easyJet, where she was directly responsible for a number of major initiatives underpinning easyJet’s successful exponential growth. She was also part of the start-up team for British Airways’ budget carrier Go Fly, as founding Head of Customer Services, and has ten years’ experience as a Non-Executive Director.
Key to CommitteesA = Audit, Risk and Reporting CommitteeS = Regulatory Strategy Committee
R = Remuneration CommitteeN = Nominations CommitteeC = Customer Service Committee
H = Health, Safety and Environment Committee
= Committee Chair
Meet our BoardThe right skills and experience to deliver our strategy – see skills matrix on page 98
Thames Water Combined Report 2019/20 83Strategic report Governance Financial statements Annual performance report

Board of Directors continued
Our Independent Non-Executive Directors
Ian Pearson Independent Non-Executive Director
Appointed to the Board: September 2014
A S R N
Relevant skills • Experienced Company Chairman, Non-Executive
Director and adviser, with expertise in strategic orientation and value creation
• Wealth of experience in the development of public policy relating to climate change and the environment
Relevant experienceIan brings extensive business and public sector insight to the Board. During a distinguished Ministerial career from 2001-2010 he held a number of positions, including Minister for Trade & Foreign Affairs, Minister of State for Climate Change and the Environment, Minister for Science, and Economic Secretary to the Treasury.
He spent five years as the Chairman of AIM listed OVCT2, a company which invested in a variety of renewable energy companies. He is also Chairman of Code Investing Ltd, a Senior Advisor to BAI Communications plc and has previously been a member of the UK Advisory Board of PwC.
.
Jill Shedden MBE Independent Non-Executive Director
Appointed to the Board: October 2018
R C
Relevant skills • 30 years directing people strategies within a
regulated utility
• Expertise in leading successful transformation programmes and driving the diversity and inclusion agenda
Relevant experienceJill is currently Group HR Director of Centrica Plc after holding senior HR positions across the Centrica group. She has championed diversity and inclusion throughout her career and has focused on building a high performing environment and a great place to work. In her role at Centrica, she has led major culture change, cost reduction and reorganisation programmes, as well as achieving “Best Companies” and “Great Places to Work” awards. Jill was awarded an MBE for her work with the Women’s Business Council, a group set up to advise ministers how to maximise women’s contribution to the future economic growth of the country.
David Waboso CBE Independent Non-Executive Director
Appointed to the Board: February 2019
H A
Relevant skills • A highly experienced Chartered engineer and
project manager, leading major infrastructure projects both in the UK and internationally
• Expertise in maximising the potential of digital technology and digitised assets to increase capability, connectivity and reliability
Relevant experienceDavid brings decades of experience leading capital investment and digital transformation projects. After an early career in highways and water supply, he worked on major infrastructure upgrades including the Docklands Light Railway and Jubilee Line Extension. He has held senior positions at London Underground, as well as being the UK representative for the European Rail Agency and a Non-Executive Director of the Rail Safety and Standards Board. He was awarded a CBE for services to transport in London and has been the President of the Association of Project Management since 2015. Until March 2019 he was Managing Director, Digital Railway at Network Rail.
Key to CommitteesA = Audit, Risk and Reporting CommitteeS = Regulatory Strategy Committee
R = Remuneration CommitteeN = Nominations CommitteeC = Customer Service Committee
H = Health, Safety and Environment Committee
= Committee Chair
Former Directors
Kenton Bradbury Non-Executive DirectorA S R N H
Christopher DeaconNon-Executive DirectorA S R N
Steve RobertsonChief Executive Officer
Thames Water Combined Report 2019/20 84Strategic report Governance Financial statements Annual performance report

Our Non-Executive Directors
Board of Directors continued
Michael McNicholas Non-Executive Director
Appointed to the Board: July 2019
Represents the interests of long-term investor, OMERS.
A S R N H
Relevant skills • Chartered Engineer with a wealth of
management experience
• Expertise in Asset Management internationally
Relevant experienceMichael is currently Managing Director, Asset Management at OMERS Infrastructure, with a focus on Europe. His asset management experience currently focuses on regulated utilities and includes Scotia Gas Networks, Caruna and Ellevio.
Michael previously held the position of Group CEO of Ervia, with responsibility for Ireland’s National Gas Networks and its national Water Utility. Prior to that he was Group CEO of NTR Plc., an infrastructure investment company with a focus on renewable and sustainable infrastructure. He was also an Executive Director in ESB, Ireland’s national electricity utility, where he held responsibility for Generation & Wholesale Markets, Customer Supply and latterly as Managing Director of ESB International.
Paul Donovan Non-Executive Director
Appointed to the Board: July 2019
Represents the interests of Aquila, BCI, QIC and PGGM
A C
Relevant skills • Proven multi-sector Chief Executive Officer
• Expertise in leading successful transformation programmes
• Extensive international board level experience
Relevant experiencePaul brings extensive senior executive experience to the Board. He is CEO of Arqiva Group (appointed 2020/21), a leading provider of critical national infrastructure to the Broadcast and Utility sectors. Earlier CEO roles include Odeon and UCI Cinemas Group, and Eir – Ireland’s leading telecommunications provider. He has held senior roles at global customer-focused companies such as Vodafone, where he was a member of the Group’s Executive Committee, as well as at Apple Computer, Cable and Wireless, Coca-Cola and Schweppes Beverages, Mars Inc. and BT. Paul is Chair at Action Artificial Intelligence Ltd. He is a Doctor of the University of Bradford, and a Trustee of the Oxfordshire Community Foundation.
John Morea Non-Executive Director
Appointed to the Board: January 2019
Represents the interests of investors, Infinity and CIC.
H
Relevant skills • Expertise in driving efficiency and embedding
innovation to deliver performance improvements, while maintaining priority focus on safety and customer service
• Strong track record in driving sustainability including promoting environmental protection and climate change mitigation
Relevant experienceWith a 30-year career in the utility sector, including ten years as the first, and current, CEO of Scotia Gas Networks (SGN), John has successfully led the regulated utility through four price controls and secured its place as the UK energy industry’s leader for customer service. He has led the Company’s digital transformation to drive operational and cost efficiencies. He has a personal interest in people development, including the diversity and inclusion agenda and promoting STEM subjects to young people. He is a current Director of the Energy Networks Association and past Non-Executive Director of Associated British Ports.
Greg Pestrak Non-Executive Director
Appointed to the Board: November 2017
Represents the interests of investor, Wren House.
S C R N
Relevant skills • Board level experience advising regulated and non-
regulated global companies
• Expertise in delivering value creation programmes and bringing a constructively challenging perspective to business and operating models
Relevant experienceGreg brings a strong track record in asset management and over 18 years’ consulting expertise working with investors and corporates to drive performance improvements. This included time at KPMG where he was the Partner leading on infrastructure. He is currently an Executive Vice President at Wren House Infrastructure, with a focus on Asset Management across the global portfolio.
Key to CommitteesA = Audit, Risk and Reporting CommitteeS = Regulatory Strategy Committee
R = Remuneration CommitteeN = Nominations CommitteeC = Customer Service Committee
H = Health, Safety and Environment Committee
= Committee Chair
Thames Water Combined Report 2019/20 85Strategic report Governance Financial statements Annual performance report

Our Executive Director Our Executive team
Brandon Rennet Chief Financial Officer
Appointed to the Board: March 2017
Relevant skills • Strong expertise in leading the execution
of multi-billion-pound funding, primarily in the public debt capital markets and creating sustainable financing structures to support corporate sustainability aims
• Valuable utility experience combined with public policy exposure
Relevant experienceBrandon brings substantial financial leadership success to his role as Chief Financial Officer having spent three years of a ten-year tenure as Managing Director of Finance at regulated energy company, SSE Plc. While in post he led the execution of more than £7 billion of funding and initiated a finance transformation programme.
John BeaumontAsset, Digital, & Transformation Director
Appointed: September 2017
Relevant skills • Deep strategy, planning and
transformation expertise
• Experience driving complex change in regulated industries
• Expertise in technology and asset intensive businesses
Relevant experienceJohn is accountable for the company strategy, asset management and the transformation of the business. A significant element of this is applying digital technology and data analytics to our assets and operations to improve service, increase resilience and reduce cost. Prior to joining Thames Water, he spent 12 years at Bain & Company, where he was a Partner leading a range of complex, multi-year transformation programmes in a range of industries from telecommunications and airlines to financial services and mining. He has also been involved in the pre- and post-deal side of a number of M&A transactions and has extensive strategic, commercial and operational capabilities.
John Bentley Capital Delivery Manager
Appointed: October 2019
Relevant skills • Experience of developing and implementing
different operating models and bringing together people from multiple organisations to deliver investment needs
• Shaped capital investment plans across three price reviews
Relevant experienceJohn is a chartered civil engineer and has 28 years water industry experience working for Severn Trent Water. During this time, he managed £billion, complex capital investment programmes.
As the Capital Delivery Director, John’s responsible for the safe and efficient delivery of AMP6 investment through the eight2O Alliance partners. He is leading the development of, and transition to, a new capital operating model which will secure more value for customers throughout AMP7.
Nicola Cocks Regulation Director
Appointed: October 2019
Relevant skills • Significant experience in utility regulation,
in the public and private sector
• Proven track record in regulatory compliance, performance reporting and delivery
Relevant experienceNicola has over fifteen years of utility regulation experience. This includes nearly ten years at the energy regulator Ofgem, where her roles included acting as Project Manager for some of Ofgem’s most critical and high profile projects, including the DPCR5 price control review, the Retail Market Review, Ofgem’s first REMIT investigation and the joint State of the Market Assessment with the OFT and CMA, which led to the referral of the sector to the CMA in June 2014.
Nicola spent over five years at KPMG, as Director of Power and Utilities. The role focused on regulatory and economic analysis and project delivery. This included acting as strategic advisor to a number of UK leading network companies on their price control reviews, in providing regulatory insight and assistance to companies facing compliance and/or enforcement action from their regulator and in undertaking agreed upon procedure reviews of companies’ regulatory reporting prior to submission.
Our Executive teamOur Executive team is responsible for the day-to-day running of our business. As at 29 June 2020, it consists of the CFO, and seven functional directors. Pending the arrival of Sarah Bentley as our new Chief Executive Officer, the team continues to be led by Ian Marchant, the Interim Executive Chairman
Thames Water Combined Report 2019/20 86Strategic report Governance Financial statements Annual performance report
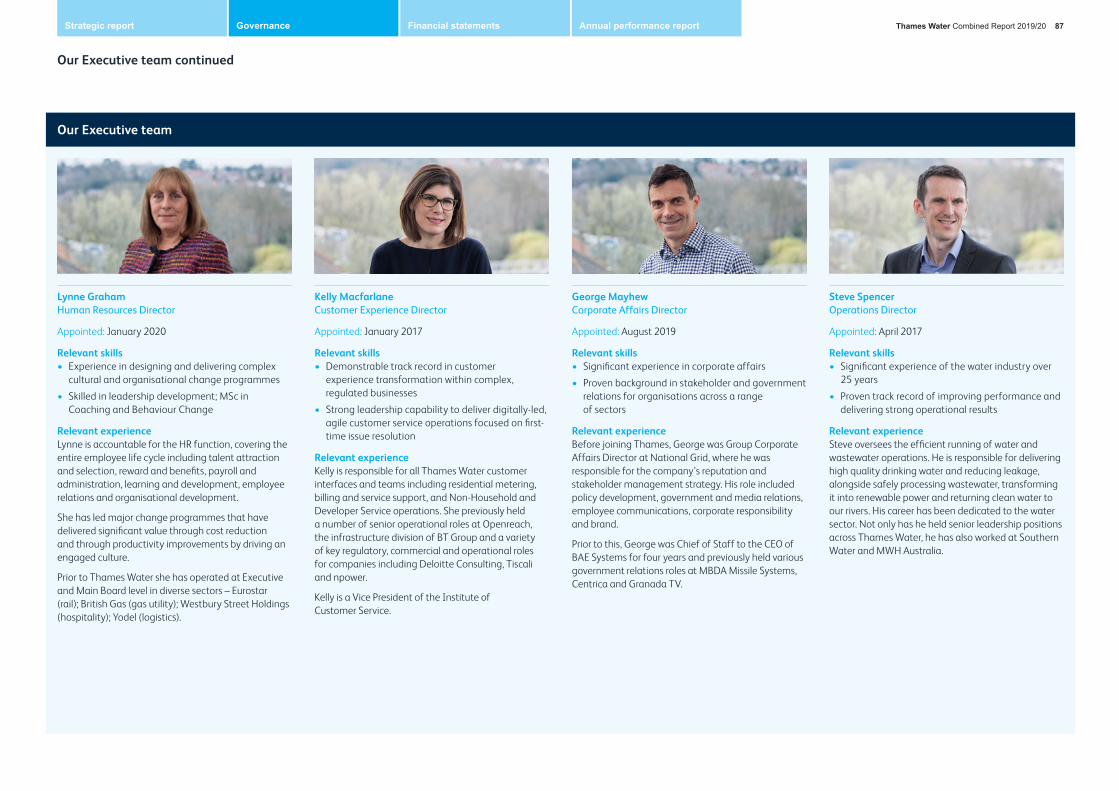
Our Executive team
Our Executive team continued
Lynne GrahamHuman Resources Director
Appointed: January 2020
Relevant skills• Experience in designing and delivering complex
cultural and organisational change programmes
• Skilled in leadership development; MSc inCoaching and Behaviour Change
Relevant experienceLynne is accountable for the HR function, covering the entire employee life cycle including talent attraction and selection, reward and benefits, payroll and administration, learning and development, employee relations and organisational development.
She has led major change programmes that have delivered significant value through cost reduction and through productivity improvements by driving an engaged culture.
Prior to Thames Water she has operated at Executive and Main Board level in diverse sectors – Eurostar (rail); British Gas (gas utility); Westbury Street Holdings (hospitality); Yodel (logistics).
Kelly MacfarlaneCustomer Experience Director
Appointed: January 2017
Relevant skills• Demonstrable track record in customer
experience transformation within complex,regulated businesses
• Strong leadership capability to deliver digitally-led, agile customer service operations focused on first-time issue resolution
Relevant experienceKelly is responsible for all Thames Water customer interfaces and teams including residential metering, billing and service support, and Non-Household and Developer Service operations. She previously held a number of senior operational roles at Openreach, the infrastructure division of BT Group and a variety of key regulatory, commercial and operational roles for companies including Deloitte Consulting, Tiscali and npower.
Kelly is a Vice President of the Institute of Customer Service.
George Mayhew Corporate Affairs Director
Appointed: August 2019
Relevant skills• Significant experience in corporate affairs
• Proven background in stakeholder and governmentrelations for organisations across a range of sectors
Relevant experienceBefore joining Thames, George was Group Corporate Affairs Director at National Grid, where he was responsible for the company’s reputation and stakeholder management strategy. His role included policy development, government and media relations, employee communications, corporate responsibility and brand.
Prior to this, George was Chief of Staff to the CEO of BAE Systems for four years and previously held various government relations roles at MBDA Missile Systems, Centrica and Granada TV.
Steve SpencerOperations Director
Appointed: April 2017
Relevant skills• Significant experience of the water industry over
25 years
• Proven track record of improving performance and delivering strong operational results
Relevant experienceSteve oversees the efficient running of water and wastewater operations. He is responsible for delivering high quality drinking water and reducing leakage, alongside safely processing wastewater, transforming it into renewable power and returning clean water to our rivers. His career has been dedicated to the water sector. Not only has he held senior leadership positions across Thames Water, he has also worked at Southern Water and MWH Australia.
Thames Water Combined Report 2019/20 87Strategic report Governance Financial statements Annual performance report

How the Board engages with StakeholdersOur stakeholder engagement programme extends to our Board’s engagement with stakeholders, which has evolved in recent years.
We are continuing to enhance our engagement programme and use the valuable insight to inform our plans for the 2025 to 2030 regulatory period and as we make investment decisions to ensure the long-term resilience of our region.
Covid-19 had an impact on our engagement programme at the latter part of 2019/20 and into the current year.
A number of Board Directors were due to participate in a customer immersion session on leakage in March 2020 – it has been postponed until July and will take the form of a virtual session. This will give Directors the opportunity to engage directly with customers.
Stakeholder group How the Board engages Key issues raised Outcomes of engagement
Customers Catherine Lynn, Ian Marchant and Paul Donovan attended different Customer Challenge Group meetings during the year
Customer insight considered by the Customer Services Committee
• Update on customer commitments, our business plan submission and how customer insight had been used to inform the plan
• Customer views on leakage
• Customer complaints and Ofwat’s customer measure of experience (C-MeX), including views captured in Thames Water’s customer service and brand surveys (June 2019)
Directors noted the CCG’s observations and challenge on company performance against its customer commitments.
Board can be satisfied that customer views are being listened to through quality engagement and that their views help to shape our operations and future plans.
Ensures the Board maintains effective oversight of the customer engagement programme and receives and discusses customer feedback on leakage on a regular basis
Employees Through our Workforce Engagement programme led by Ian Pearson
Through internal communications initiatives led by Ian Marchant and Brandon Rennet
• The day-to-day challenges of employees providing front line services
• The launch of our new Purpose, strategic direction,Values and Behaviours
• Culture
• Cost efficiency
• Restructuring the business to increase alignment with the delivery of our priorities
The Board is able to understand the day-to-day challenges of employees across the business and use insight to inform Board level decisions which will improve our service
The Board can see first-hand how employees are living our Purpose, Values and Behaviours
Employees can understand the key decisions being made at Board level and our strategic direction
Investors Regular presentations and update calls held throughout the year, typically hosted by Brandon Rennet and with Ian Marchant also attending some events
• Alongside operational updates, significant focus in 2019/20 on the PR19 process and the impact for financeability and credit ratings
• More recent calls focused on the operational and financial impact of Covid-19
Ensured banks and debt investors were kept up-to-date by senior management on key news, assisting in the long run objective of maintaining access to capital markets at efficient pricing
Regulators Meetings and calls with all our regulators
Non-Executive Directors met frequently with senior Executive level management of Ofwat throughout the year
Quarterly sessions with Ofwat on transformation progress
• Business plan for 2020 to 2025
• Water Resources Management Plan
• Innovation
• Transformation programme
• Financial, customer and operational performance
Provides Board with further understanding of regulatory challenges and priorities
Informs our decision making
Provides further insight into Thames Water’s relative performance in the industry, and opportunity to explain and demonstrate commitment to our improvement plans
NGOs and community groups
Board Directors attended our Annual Stakeholder Review in November 2019, engaging with groups of stakeholders
• Environmental protection and enhancement
• Local investment projects
• The impact of our services on communities, including incident management
Gives the Board an understanding of issues and priorities of groups in the community
Informs our decision-making at a local level
Policy makers and elected representatives
Board Directors attended our Annual Stakeholder Review in November 2019, engaging with groups of stakeholders
• Operational performance
• The Price Review
• The need for investment in our region
Informs our operational priorities and future resilience plans
Media Brandon Rennet engages with the media about our financial results
• Financial performance
• Operational performance
• Long-term strategy and plans for the future
Building trust and a greater understanding of our challenges and priorities
Board leadership and Company Purpose
Thames Water Combined Report 2019/20 88Strategic report Governance Financial statements Annual performance report

Timeline of activities
25 OctoberFirst workforce forum and a tour of Mogden sewage treatment works to understand the issues faced in the day-to-day operation of one of our largest treatment works
8 November Listening to employees at Ashford water treatment works and attendance at the Remembrance service with the opportunity to meet informally with colleagues
23 January Met and listened to the People team, with insights into the learning system, our approach to developing talent and the services provided to employees
4 DecemberVisit to our laboratory where we perform water quality testing (pictured below)
19 FebruaryMet the newly insourced team of tanker drivers at our Logistics Management Centre where there was also a tour of the warehouse and a demonstration of equipment to drive efficiency
Board leadership and Company Purpose continuedWorkforce Engagement programme – led by Ian Pearson
It was a pleasure to be asked by the Board to be the designated non-executive director to lead on workforce engagement. Along with the bi-annual employee engagement forum that we have introduced, we have strengthened our mechanisms for engaging with and understanding the views of our employees, which helpfully the 2018 UK Corporate Governance Code changes encouraged us to so do.
As a Board we are committed to formally discussing workforce issues at least twice in the year. Workforce perspectives are however also fed in more regularly from myself and colleagues who are out and about in the business meeting with employees.
An initial 12-month programme of engagement based on site visits was developed and I would like to personally thank the Board directors who have joined me at some of these events. These have included visits to Mogden sewage treatment works, Ashford water treatment works, our laboratories, OPAL and the logistics centre in Didcot, our HR function in Reading and Walthamstow Wetlands.
Separate to the site visit itself, we hold one-and-a-half to two-hour forums with a cross-section of employees, as part of the engagement process. The sessions cover company Purpose, Values and Behaviours, culture, strategy, workforce issues – and anything else anyone wants to raise – in an informal way with it being clear that anything said is under the Chatham House rule. This gives us, as a Board, some direct insight into whether the desired culture and Values we want to see are reflected in the workforce. The impact of Covid-19 meant we’ve had to postpone some of our face-to-face visits; however, we held a virtual forum to keep up the conversation with our employees, and we look forward to being able to meet employees at our sites again soon.
Depending on the issues coming out from the sessions, I, and Board colleagues attending, will raise these with a member of the executive team in the first instance. They may also be raised directly at Board or committee meetings and views are summarised for the twice-a-year Board discussions to complement the insights coming from the annual employee survey.
Some of the themes identified as a result of the feedback from employees during the year have included:
• A feeling of being proud to work for Thames Waterbut that more can be done to get rid of the ‘silos’ and genuinely be One Thames
• The need for strengthened leadership
• Recognition there is a strong health and safetyculture and we need to keep at it
• A strong desire to improve environmental performance and meet our net zero carbonemissions by 2030 target
• Support for MS Teams and investing in new technology to transform the business generally, but some frustration in its application in the field
The Board has considered these and a range of other workforce and stakeholder views during Board discussions and in its decision making.
Being proud to work for Thames Water was also very evident in the most recent employee survey. I have reviewed the results and themed comments and look forward to discussing them with employees over the coming 12 months.
Judging by the enthusiastic response we have received from staff who want to air their views to us, this step change in engagement has been warmly welcomed. A BlueBytes internal communication piece I did on employee engagement received over 1300 views in three days. I look forward to exploring more ways of hearing the voice of employees – and more ways of feeding back how we are considering their voice as a Board – during the year ahead.
Thames Water Combined Report 2019/20 89Strategic report Governance Financial statements Annual performance report

Our shareholders
OMERS 31.777% • Ontario Municipal Employees Retirement System (OMERS) is one of Canada’s largest pension plans with C$109bn of net assets and considerable experience of managing essential infrastructure globally
• Acquired stake through a series of 4 transactions between May 2017 and July 2018
USS 10.939% • The Universities Superannuation Scheme (USS) is a UK pension scheme for academic staff of UK universities
• Acquired stake in July 2017
Infinity 9.900% • Infinity Investments S.A is a subsidiary of the Abu Dhabi Investment Authority (ADIA) is one of the world’s largest sovereign wealth funds
• Acquired stake in December 2011
Wren House 8.772% • The global direct infrastructure investment vehicle of the Kuwait Investment Authority (“KIA”), one of the world’s largest sovereign wealth funds
• Acquired stake in May 2017
BCI 8.706% • British Columbia Investment Management Corporation (BCI) provides investment management services to BritishColumbia’s public sector.
• Shareholders since 2006
Hermes 8.699% • Hermes GPE is one of Europe’s leading independent specialists in global private markets. Manages the BT Pension Scheme (BTPS), one of the largest UK private- sector pension schemes.
• Shareholder since 2012
CIC 8.688% • China Investment Corporation (CIC) is one of the world’s largest sovereign wealth funds
• Shareholder since 2012
QIC 5.352% • Queensland Investment Corporation (QIC) is a global diversified alternative investment firm, one of the largest institutional investment managers in Australia.
• Shareholder since October 2006
Aquila 4.995% • Aquila GP Inc. is a leading infrastructure management firm and a wholly owned subsidiary of Fiera Infrastructure Inc., a leading investor across all subsectors of the infrastructureasset class.
• Shareholder since May 2013
PGGM 2.172% • PGGM (Stiching Pensioenfonds Zorg en Welzijm) are a pension fund service provider and manage the pensions for different pension funds, the affiliated employers and their employees
• Shareholder since October 2006
Thames Water Utilities Limited
Thames Water Utilities Finance Plc
Thames Water Utilities Holdings Limited
Thames Water Limited
Kemble Water Eurobond plc
Kemble Water Finance Limited
Thames Water (Kemble) Finance plc
Kemble Water Holdings Limited
External shareholders
TWUL Group Financing company
Regulated Water company
Whole Business Securitisation Group
This chart sets out an abridged version of the Kemble Water Holdings Limited Group Structure.
Our structure explained
Canada 45.5%UK 19.6%China 8.7%Middle East 18.7%Australia 5.4%Europe 2.2%
Dedicated pension fund 53.6%Partially pension backed 13.7%Other investors 5.4%Sovereign wealth funds 27.4%
Shareholders by geography
Shareholders by type
Board leadership and Company Purpose continuedShareholder Engagement
Re-electionAll the Directors are required to seek annual re-election at the Annual General Meeting of the Company.
Shareholder engagementWe recognise the importance of our wider stakeholders in delivering our purpose and strategy and have detailed our engagement with all our stakeholders including customers, employees, regulators, shareholders and other groups in the Strategic Report.
The presence of external shareholder appointed Non-Executive Directors on our Board allows effective face-to-face dialogue with our external shareholders and enables all members of the Board, particularly the Independent Non-Executive Directors, to develop an understanding of external shareholders’ views. The Board composition includes four external shareholder appointed Non-Executive Directors. As at March 2020 they were Michael McNicholas, representing OMERS; Greg Pestrak, representing USS and Wren House; John Morea, representing Infinity and CIC; and Paul Donovan representing Aquila, BCI, QIC and PGGM.
Thames Water Combined Report 2019/20 90Strategic report Governance Financial statements Annual performance report

Board leadership and Company Purpose continuedBoard activities aligned with strategy
Strategic ambition The Board’s governance role Board activity in 2019/20
To deliver brilliant customer engagement
p7 Read more
• To review the development and execution of the customer service, communications and media strategiesto ensure customers remain at the heart of business decisions
• Our approach to customer engagement receives additionalfocus through the Customer Service Committee
• Oversight of the migration of the majority of customers to new customer relationshipmanagement and billing system
• Approval of strategy to support customers affected by Covid-19, for implementation during the 2020/21 financial year
• Monitored the website upgrade
• Considered the marketing approach to manage water demand and discourage flushing of wet wipes
To invest in resilient systems and assets
p7 Read more
• To review key proposals to increase resilience of systems and assets, with a focus on improving performance in key areas such as leakage, supply interruptions and pollutions reduction
• To approve expenditure and plans for capital projects to increase resilience
• Oversight of the business planning process, including engagement with Ofwat
• Monitored leakage activity with regular updates from the leakage task force
• Pollutions were considered at each meeting of the HS&E Committee
• Engagement in the planning to replumb London and parts of the Thames Valley, as well as long-term strategic water resource management plans
• Considered investment projects including Deephams sewage treatmentworks upgrade
• Reviewed water quality transformation plan
To generate public value
p8 Read more
• To review our sustainability policy,as well as associated policies, and monitor progress
• To ensure we have the right governance framework in place to monitor the impact of our operationson the environment, and to make a positive impact on the communities around us
• The Health, Safety and Environment Committee considers our impact on the environment, as well as the safety of our operations on our sites and in the community
• Approved integration of public value as a strategic ambition and overarching framework
• Engaged in the definition of a roadmap to get to zero net carbon from our operations by 2030
• Approved the sustainability policy, which runs through our entire operations
• Agreed to increase investment in the Independent Thames Water trust fund
• Oversight of the water fountain roll-out and implications of Covid-19 on programme milestones
• Monitored the smarter water catchment programme
Strategic enablers The Board’s governance role Board activity in 2019/20
People
p9 Read more
• To provide oversight and review the implementation of the People Strategyincluding the employee survey, personal development reviews and corporate values
• To champion diversity and ourapproach to health, safety and wellbeing
• Our People Strategy received additional focus through the Remuneration Committee
• Reviewed the remuneration policy
• Recruitment of new Chief Executive Officer and four new members of the Executive team
• Appointment of Workforce Engagement Lead Director to improve engagement between the Board and employees across the business
• Approval and engagement in the definitionof corporate purpose and new behaviours
• Deep dive into serious safety incidents
• Monitored diversity plans, including approach to reduce gender pay gap
• Approval of new family friendly people policies
• Updated on employee engagementsurvey and initial plans to improve engagement score
Digital
p9 Read more
• To review the development and execution of our strategic approach to data to ensure it reflects the growing expectations of our customers and complies with regulations
• Our approach to data risks receives additional focus from the Audit, Risk and Reporting Committee
• Agreed investment in new IT equipment for all employees to improve IT capabilities and stability
• Updated on the creation of smarter water and waste networks and benefits to date
• Updated on GDPR compliance
Efficiency
p9 Read more
• To review our operational and cost efficiency to drive maximum value for money for our customers and drive efficiency in the water cycle
• Updated on restructure proposals to align business with strategic ambitions to drive cost and operational efficiency
• Approval of cost transformation plans to drive efficiency in spending
• approved new debt facilities, renewal of revolving credit facilities, intercompany loans as well as updates of debt issuance programme documentation and the restructuring of index-linked swaps
Thames Water Combined Report 2019/20 91Strategic report Governance Financial statements Annual performance report
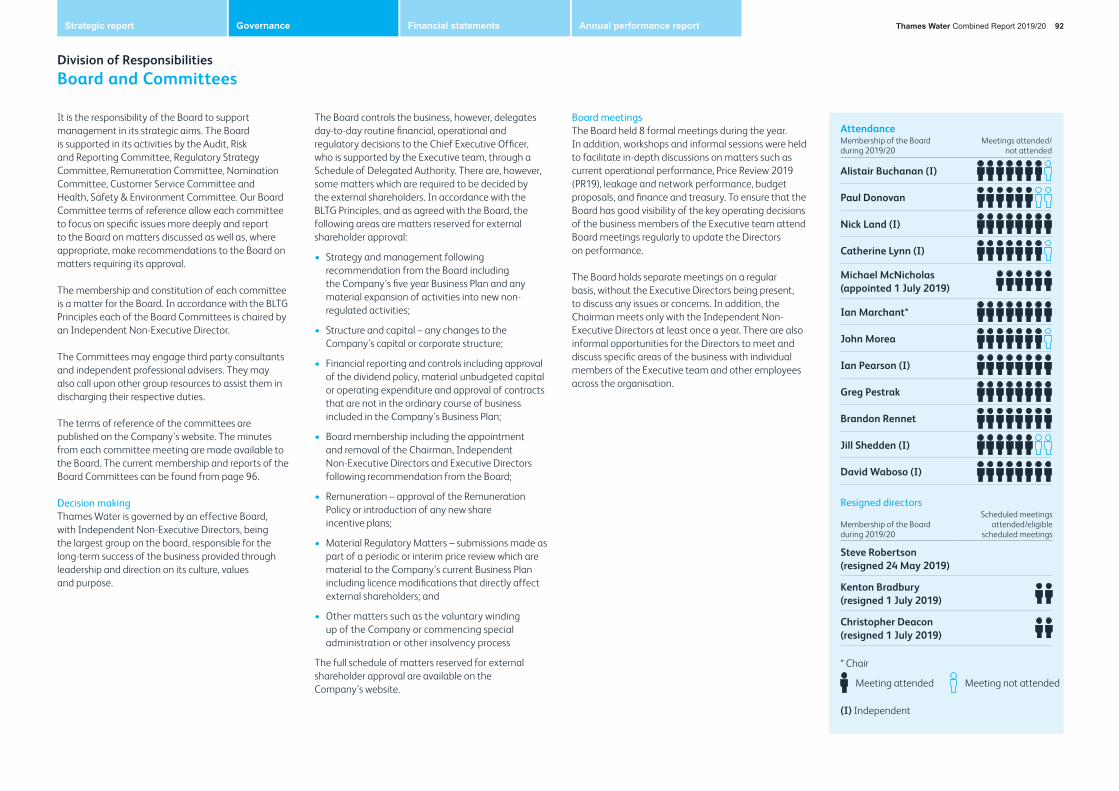
It is the responsibility of the Board to support management in its strategic aims. The Board is supported in its activities by the Audit, Risk and Reporting Committee, Regulatory Strategy Committee, Remuneration Committee, Nomination Committee, Customer Service Committee and Health, Safety & Environment Committee. Our Board Committee terms of reference allow each committee to focus on specific issues more deeply and report to the Board on matters discussed as well as, where appropriate, make recommendations to the Board on matters requiring its approval.
The membership and constitution of each committee is a matter for the Board. In accordance with the BLTG Principles each of the Board Committees is chaired by an Independent Non-Executive Director.
The Committees may engage third party consultants and independent professional advisers. They may also call upon other group resources to assist them in discharging their respective duties.
The terms of reference of the committees are published on the Company’s website. The minutes from each committee meeting are made available to the Board. The current membership and reports of the Board Committees can be found from page 96.
Decision making Thames Water is governed by an effective Board, with Independent Non-Executive Directors, being the largest group on the board, responsible for the long-term success of the business provided through leadership and direction on its culture, values and purpose.
The Board controls the business, however, delegates day-to-day routine financial, operational and regulatory decisions to the Chief Executive Officer, who is supported by the Executive team, through a Schedule of Delegated Authority. There are, however, some matters which are required to be decided by the external shareholders. In accordance with the BLTG Principles, and as agreed with the Board, the following areas are matters reserved for external shareholder approval:
• Strategy and management following recommendation from the Board including the Company’s five year Business Plan and any material expansion of activities into new non-regulated activities;
• Structure and capital – any changes to theCompany’s capital or corporate structure;
• Financial reporting and controls including approval of the dividend policy, material unbudgeted capital or operating expenditure and approval of contracts that are not in the ordinary course of business included in the Company’s Business Plan;
• Board membership including the appointment and removal of the Chairman, Independent Non-Executive Directors and Executive Directorsfollowing recommendation from the Board;
• Remuneration – approval of the Remuneration Policy or introduction of any new share incentive plans;
• Material Regulatory Matters – submissions made aspart of a periodic or interim price review which are material to the Company’s current Business Plan including licence modifications that directly affect external shareholders; and
• Other matters such as the voluntary winding up of the Company or commencing special administration or other insolvency process
The full schedule of matters reserved for external shareholder approval are available on the Company’s website.
AttendanceMembership of the Board during 2019/20
Meetings attended/not attended
Alistair Buchanan (I)
Paul Donovan
Nick Land (I)
Catherine Lynn (I)
Michael McNicholas (appointed 1 July 2019)
Ian Marchant*
John Morea
Ian Pearson (I)
Greg Pestrak
Brandon Rennet
Jill Shedden (I)
David Waboso (I)
Resigned directors
Membership of the Board during 2019/20
Scheduled meetings attended/eligible
scheduled meetings
Steve Robertson (resigned 24 May 2019)
Kenton Bradbury (resigned 1 July 2019)
Christopher Deacon (resigned 1 July 2019)
* Chair
Meeting attended Meeting not attended
(I) Independent
Board meetingsThe Board held 8 formal meetings during the year. In addition, workshops and informal sessions were held to facilitate in-depth discussions on matters such as current operational performance, Price Review 2019 (PR19), leakage and network performance, budget proposals, and finance and treasury. To ensure that the Board has good visibility of the key operating decisions of the business members of the Executive team attend Board meetings regularly to update the Directors on performance.
The Board holds separate meetings on a regular basis, without the Executive Directors being present, to discuss any issues or concerns. In addition, the Chairman meets only with the Independent Non-Executive Directors at least once a year. There are also informal opportunities for the Directors to meet and discuss specific areas of the business with individual members of the Executive team and other employees across the organisation.
Division of ResponsibilitiesBoard and Committees
Thames Water Combined Report 2019/20 92Strategic report Governance Financial statements Annual performance report

The Chairman – see page 83The Chairman is responsible for creating the conditions for the effective working of the Board. The Chairman is specifically responsible for the following:
• Setting the agenda and conduct of Board meetings. In doing so he shall take full account of the issues andconcerns of all Directors and encourage their active engagement in Board discussion
• Leading the Board in ensuring a coherent strategic plan or framework is agreed
• Promoting the highest standards of corporate governance, including compliance with the UK CorporateGovernance Code 2018 as updated from time to time wherever possible
• Ensuring that the Board and its Committees comprise individuals with an appropriate mixture of skills,experience and knowledge to support the needs of the business
• Ensuring that the Company maintains effective communication with external shareholders and other keystakeholders, and that their views and any concerns are understood by the Board
• Working with the Chief Executive to ensure that the Board receives accurate and timely information on theperformance of the Company
• Leading the evaluation of the performance of the Board, its Committees and individual Directors asrequired and at least annually
• Establishing an effective working relationship with the Chief Executive, providing support and advice whilstrespecting executive responsibility
• Ensuring that a well-constructed induction programme is provided for new Directors, that all Directors have the opportunity to develop their understanding of the Company and that they are kept informed of matters affecting the Company
• Representing the Company at the highest level and in conjunction with the Chief Executive developingstrategic relationships with key stakeholders and political leaders
Kemble Water
Holdings Limited
Thames Water
Utilities Limited
External Shareholders
The Board – see pages 83 to 85
• Entrepreneurial leadership • Principal decisionmaking forum
• Approves strategic direction to promote, collectively, the long-term success of the Company
• Ensures the Company manages risk effectively
• Sets Company’s values and standards
Board and resource allocationRoles and responsibilities of the DirectorsThe Board is responsible for the overall long-term success of the Company’s business including setting the Purpose and Values, strategy and risk appetite and monitoring performance to ensure the necessary resources and controls are in place to deliver the plans and ensuring that the Company meets its responsibilities.
The operation of the Board is underpinned by the collective experience of the Directors and the range of skills and expertise that they bring as individuals. Decision making is approached with independent thought and judgement through open and honest discussions that ensure that even the most challenging decisions are taken for the benefit of the Company as a whole with due consideration for all stakeholders.
The division of responsibilities across the Board are set out here. As has been referenced earlier in the report, this year Ian Marchant has been Interim Executive Chairman covering both the Chairman and CEO roles on a temporary basis. Wherever possible, Ian has kept these roles separate and with the arrival of Sarah Bentley in September the division will be re-established.
Division of Responsibilities continued
Thames Water Combined Report 2019/20 93Strategic report Governance Financial statements Annual performance report

Chief ExecutiveThe Chief Executive is responsible for the leadership and operational management of the Company within the strategy and business plan agreed by the Board.
The Chief Executive is specifically responsible for the following in respect of the relationship with the Board:
• Developing the business strategy for the Company to be approvedby the Board on an annual basis
• Implementing, with the Executive Team, the decisions of the Board and its Committees
• Producing a business plan and a budget for the Company to beapproved by the Board on an annual basis, and ensuring the implementation of same
• Ensuring the highest standards of Health, Safety and Environment are set throughout the Company on behalf of the community and the Company’s employees
• Ensuring that the Company’s reputation for customer service is maintained at the highest level, and that a culture of customer service is embedded throughout the Company
• Overseeing the management of the executive resource and succession planning processes and presenting annually the outputfrom these to the Board (including advice to the Remuneration Committee on the remuneration and appointment of senior managers and executives)
• Ensuring that effective business and financial controls and risk management processes are in place across the Company and that all relevant laws and regulations are complied with, making recommendations to the Board on the appropriate delegation ofauthority with the Group
• Keeping the Board informed regularly of the performance of the Company and bringing promptly to the Board’s attention all matters that materially affect, or are capable of materially affecting, the performance of the Company and the achievement of its strategy
• Developing for the Board’s approval appropriate values and standards to guide all activities undertaken by the Company
• Representing the Company at the highest level and, in conjunction with the Chairman, developing strategic relationships with key stakeholders, political leaders and customers
Non-Executive Directors see page 85
• Nominated and appointed by the shareholders of Kemble Water Holdings Limited and not classified as independent
• Provide strong experience and constructively challenge and monitor the performance and delivery of the strategy within the risk parameters set by the Board
• All subject to annual re-election
Company Secretary• Acts as Secretary to the Board and all
the Board’s Committees
• Provides advice to the Directors and is responsible for advising the Board on all governance matters, ensuring the Boardoperates in accordance with relevant laws and governance principles
• Ensures good information flow to the Board and its Committees
Independent Non-Executive Directors see pages 83-85• Independent in character and
judgement, and persons of standing with relevant experience
• Collectively having connectionswith, and knowledge of the Company’s industry
• Understand the interests of our customers and how these can be respected and protected see skills matrix page 98.
• Valued members of the Board who bring overall independent advice, review and challenge on behalf of all stakeholders, including customers
• Each has been appointed for their individual expertise and experience following a rigorous recruitment process
• All are subject to annual re-election
Deputy Chairman/Senior Independent Director• Available to all shareholders to
answer any queries that cannot be addressed by the Chairman or otherExecutive Directors
• Available to chair the Board and Committee meetings if the Chair is unable to attend and acts as an additional point of contact for shareholders
• Supports the Chairman in his role and leads the Non-Executive Directors in the oversight of the Chairman
Audit, Risk and Reporting
Committee
page 100
Regulatory Strategy Committee
page 105
Remuneration Committee
page 108
Nomination Committee
page 96
Customer Service Committee
page 106
Health, Safety & Environment Committee
page 107
Executive TeamSee the
Executive Team
composition on pages 86
and 87
Division of Responsibilities continued
Thames Water Combined Report 2019/20 94Strategic report Governance Financial statements Annual performance report

Appointment and induction programme Independent Non-Executive Directors are appointed for an initial term of three years with the expectation they will continue for at least a second three-year period. Directors are nominated by the Nominations Committee and their appointments subsequently approved by the Board. All Non-Executive Directors are required to have a pre-appointment meeting with Ofwat. This is an opportunity to share insights on the challenges and opportunities facing the sector and and ensure there is an understanding of the particular role of the non-executive directors in a water company.
Upon appointment all new Directors will receive a bespoke induction programme over a number of months that is tailored to their specific requirements and is designed to facilitate and develop their understanding of the business building upon their knowledge of the industry, as well as an understanding of the Company’s operations and culture. The programme provides an overview of our customer service, financial and operational performance, along with an explanation of the regulatory regime and governance framework.
It includes meetings with the Chairman, CEO and CFO, as well as the Executive team, external shareholders, the Company Secretary, other members of the senior management team and external advisers who provide support to the Board or Committees.
Inductions in actionEach Director is provided with an induction programme covering the following:
The business
Briefings on Company history, business background, operational performance and plans, strategy, key
performance indicators and targets
Site visits during the first few months, to allow each Director to experience, first hand, the operations of
the business
Presentations from management on topics such as our strategy and business plan, finance and commercial, key
operational areas and risk
One-to-one meetings with members of the Executive team
Culture and values
The Board recognises the importance of its role in setting the tone of Thames Water’s culture and embedding it throughout the Group. We are structured as “One Thames”, which encourages collaboration and the
breaking down of silos between teams
Each director is provided with: A briefing on our people and company culture; including health, safety and
wellbeing, talent and succession, trade unions and an overview of our remuneration policy
Governance
Training relevant to their duties as Independent Non-Executive Directors
Meetings with the Chairman and Chairs of the Board’s Committees
Briefing on the regulatory and governance framework, Company policies and Board procedures
An overview of our major risks and our internal risk management strategy
Regulators and other stakeholders
Participation inBriefings with the Environment Agency, Defra and Water UK
A briefing about customer engagement to understand our customers’ views including engagement with our Customer
Challenge Group and other key stakeholders.
Training and professional developmentTo support the Directors development through the year additional deep dives and technical sessions are incorporated into the Board and Committee meetings to ensure Directors remain up to date with key developments across the business. In addition, informal sessions are held during the year, with specific focus on topics of interest to the Board, including site visits, presentations and regular updates and briefings. The informal sessions also serve as an opportunity for the Board to discuss strategy and risks with local management teams and gain further insight into our business and management capability. The Board activities on page 91 sets out further detail of the topics covered during the year.
The Directors have access to professional development provided by external bodies and our advisers. We aim to continually refresh and expand the Board’s knowledge and skills to enable them to effectively fulfil their roles on the Board and its Committees and contribute to discussions on technical and regulatory matters.
Directors and their other interestsAs a matter of good governance and in order to ensure the influence of third parties does not compromise or override independent judgement, all Directors are required to disclose their other significant commitments to the Board. They are also required to advise the Company Secretary of any actual or potential conflicts of interest (including those resulting from significant shareholdings) as soon as they arise, so they can be considered by the Board at the next available opportunity.
Division of Responsibilities continued
As part of the regulatory accounting disclosures required (RAG 5.07), we set out on page 248-250 payments to companies in which Directors have interests.
Any Director with a potential conflict of interest in relation to a specific matter under consideration by the Board or one of its Committees is required to recuse themselves from the relevant meeting while this item is discussed and may not vote on the matter. It is the Board’s view that this procedure operated effectively during 2019/20. During the year, no Independent Non-Executive Director declared a material interest in any contract of significance with the Company or any of its subsidiary undertakings. Our Executive Director, Brandon Rennet, does not act for any FTSE company as a Non-Executive Director or Chairman.
Thames Water Combined Report 2019/20 95Strategic report Governance Financial statements Annual performance report

“ Following the interviews, the Committee discussed the shortlisted candidates and it was unanimously agreed that Sarah Bentley be recommended to the Board for appointment as CEO”
Ian Marchant Interim Executive Chairman
Committee membershipMembership of the Committee, excluding the Chair (who was not considered independent during the year), consists of two Independent Non-Executive Directors, Nick Land and Ian Pearson, and two Non-Executive Directors, Michael McNicholas and Greg Pestrak.
Other attendees are the Chair of the Remuneration Committee and the CFO, HR Director and other senior managers as appropriate. The Company Secretary acts as secretary to the Committee, thereby ensuring that all of the information required by the Committee to operate effectively is available.
Role of CommitteeThe main duties of the Committee are to:
• Review from time to time the structure, size and composition of the Board of the Company and to make recommendations to the Board regarding any changes it considers necessary; and
• Keep under review the leadership needs of the Company and make recommendations regarding the formulation of succession plans for appointments to the Board to maintain an appropriate balance of skills and experience as well as diversity.
Following each committee meeting, the chair provides a summary of the committee’s activity to the next board meeting and makes recommendations as appropriate.
Committee focus during the yearDuring the year, the Nominations Committee met five times. The Committee spent a significant amount of time considering the search for a new Chief Executive Officer (CEO) with the committee meetings focusing on identifying and recommending suitable candidates for the role.
CEO search processFollowing the departure of Steve Robertson as CEO in May 2019, the committee met to agree a detailed specification for the role of CEO including the attributes of the candidates to be considered. The Committee engaged the services of Spencer Stuart (an executive search firm unconnected to the Company) to evaluate, screen and identify suitable candidates.
The Committee considered potential candidates identified by the Committee and Spencer Stuart. It examined a long list of candidates in consultation with Spencer Stuart, assessing each candidate against the role specification. The Committee as a whole was involved in shortlisting and interviewing candidates and once preferred candidates had been identified the other Directors and members of the Executive team were also included in the interview process.
Following the interviews, the Committee discussed the shortlisted candidates and it was unanimously agreed that Sarah Bentley be recommended to the Board for appointment as CEO. It was announced in April that Sarah Bentley would be appointed as CEO.
Board compositionAs has been noted elsewhere within this report, the following changes to the Non-Executive Directors took place:
• Kenton Bradbury was replaced by Michael McNicholas with effect from 1 July 2019; and
• Christopher Deacon stepped down after 13 years on the Board and was replaced by Paul Donovan with effect from 1 July 2019.
Despite these changes, the Board composition remained stable with half the Board, excluding the chair, being Non-Executive Directors whom the Board considered independent.
DiversityAs a business Thames Water recognises the benefit and value of diversity across the organisation including in the composition of the Board. As people are at the heart of our business, we value the unique skills, experiences and backgrounds that every individual brings. We aspire to have a Board that reflects society as a whole.
All Board appointments must be made on merit. Gender and diversity generally will be taken into consideration when evaluating the combination of skills, experience, independence and knowledge the Board requires collectively to be effective. Whilst at this time the Board does not feel that it would be appropriate to set targets, the Board supports the recommendations set out in the Hampton-Alexander Review on gender diversity and the recommendations set out in the Parker Review on ethnic diversity.
Board effectiveness reviewThe Board undertakes a review of its effectiveness annually. This year an externally facilitated review of the effectiveness of the Board and Committees was undertaken by Lintstock along with a review of the Directors individual performance.
More information can be found in the Directors’ and Corporate Governance report.
2020/21 PrioritiesIn the forthcoming year the Committee will focus on the induction and onboarding of the new CEO. There will continue to be focus on succession planning for the Board, Executive and senior management level and ongoing development of a strong talent pipeline and associated leadership programmes.
In addition, the Committee will also undertake a review of the Committee Chairs and membership.
AttendanceMeetings attended/
not attended
Ian Marchant (Chairman)
Nick Land
Michael McNicholas (appointed 1 July 2019)
Greg Pestrak
Ian Pearson
Kenton Bradbury (resigned 1 July 2019)
Christopher Deacon (resigned 1 July 2019)
Meeting attended Meeting not attended
(I) Independent
Composition, succession and evaluationNomination Committee Report 2019/20
Thames Water Combined Report 2019/20 96Strategic report Governance Financial statements Annual performance report

Composition, succession and evaluationNomination Committee Report 2019/20 continued
Board compositionThe Board, chaired by Ian Marchant, with Deputy Chair, Nick Land, consists of 12 Directors: the Chairman, one Executive Director (currently only the Chief Financial Officer (“the CFO”), until our new Chief Executive Officer joins), four Non-Executive Directors and six Independent Non-Executive Directors (together the “Directors”). The details of their career, background and relevant skills can be found within their individual biographies on pages 83 to 85.
During the year we welcomed Michael McNicholas and Paul Donovan as Non-Executive Directors in July 2019 with Kenton Bradbury and Christopher Deacon stepping down as Non-Executive Directors at the same time.
The Board considers that each Director can devote sufficient time to fulfil their roles, including preparation for and attendance at the Board and Committee meetings, giving support and advice to the Executive
Directors as well as providing new ideas and healthy challenge. The Board looks closely at the other appointments held by its Directors. Any additional external appointments are required to be notified to the Board. We continue to meet Ofwat’s expectations and the Corporate Governance Code 2018, with all the Independent Non-Executive Directors being considered independent and forming the largest single group on the Board. The Chairman was also considered independent on appointment. The Board considers that the composition of the Board has an appropriate balance of Directors such that no one individual or small group of individuals dominates the Board’s decision making.
The Board values the contribution that all our Directors bring to the stewardship of the Company and believes their balance of skills, experience and knowledge of the Company provide strong leadership and governance.
Thames Water Combined Report 2019/20 97Strategic report Governance Financial statements Annual performance report

Composition, succession and evaluationNomination Committee Report 2019/20 continued
Composition of the Board & Board tenure (years)Board tenure (years)
Ian Marchant 2 years, 7 months
Catherine Lynn 1 year, 7 months
Jill Shedden 1 year, 9 months
Nick Land 3 years, 4 months
Michael McNicholas Appointed 01/07/2019
John Morea 1 year, 5 months
Brandon Rennet 3 years, 3 months
Alistair Buchanan 1 year, 11 months
Paul Donovan Appointed 01/07/2019
Ian Pearson 5 years, 10 months
Greg Pestrak 2 years, 7 months
David Waboso 1 year, 5 months
Male Female
Diversity overview
Independent Non-Executive 6/12 = 50%Non-Executive 4/12 = 33%Executive 2/12 = 17%
Male 10/12 = 83%Female 2/12 = 17%
Male 6/9 = 67%Female 3/9 = 33%
Composition of the Board Gender diversityBoard
Executive team
Board skills matrixThis Board skills matrix highlights the breadth of skills represented on our Board.
All Board Directors have regulated industry exposure and strategic leadership experience
Our Executive Chairman
Our Executive Director Our Independent Non-Executive Directors Our Non-Executive Directors
Ian Marchant Brandon Rennet Alistair Buchanan Nick Land Catherine Lynn Ian Pearson Jill Shedden David WabosoMichael
McNicholas Paul Donovan John Morea Greg Pestrak
Experience Utility industry experience or experience of network operations
Finance/ corporate
Economic regulation/ public policy
Finance
Customer Customer service
Technology Technology/ digital systems
Resilience Capital projects
Engineering
Environment Environmental/ sustainability
Team Culture change and transformation
Remuneration
Health and safety
Thames Water Combined Report 2019/20 98Strategic report Governance Financial statements Annual performance report

Composition, succession and evaluationBoard Evaluation
Board Evaluation 2020 Boards continually need to monitor and improve their performance which can be achieved through evaluation, providing a mechanism for improving effectiveness, maximising strengths and highlighting areas for further development.
This year, following the changes to the Board during 2018 and 2019, an externally facilitated evaluation was conducted by Lintstock LLP. Lintstock have no other connection with the Company.
In conducting the review, all the Directors completed a questionnaire providing information about how they viewed the role of the Board and how it functions. Lintstock then conducted 1 to 1 interviews with each of the Directors to discuss their responses across key areas of the questionnaire including Board composition, Board dynamics and support, strategic and operational oversight, risk management and internal control and succession and HR management.
Following analysis of the individual responses by Lintstock a report was presented to the Board in March 2020 setting out the findings. The key priorities identified by the Board for the coming year included:
• Securing a permanent CEO appointment – complete.
• Improvements to monitoring operational performance – identification of efficiencies and improvements in the management and monitoring of assets and water networks through clear metrics and targets.
• Improvements in the flow of information – Board papers need to be much more concise and targeted on the key issues and that the delivery of presentations should be more focussed. An improvement in the timeliness with which Board papers are circulated should also be prioritised.
• Agreeing the long term vision and strategy – more time to be spent devoted to the long term vision for Thames and achieving alignment in expectations between the Board, management and external shareholders.
A review of the individual performance of the Directors and the Chair discussed these areas with the respective Directors. The performance of the Chair was facilitated by Lintstock and led by the Senior Independent Director and was discussed with the Board and the findings communicated to the Chairman. It was considered that during the year the demands on the Interim Executive Chair were considerable and therefore it was agreed that greater operational support be provided to the Chair until July 2020.
Thames Water Combined Report 2019/20 99Strategic report Governance Financial statements Annual performance report

I am pleased to present our Audit, Risk and Reporting Committee (the “Committee” or “ARRC”) report for the year ended 31 March 2020. This report gives our stakeholders an overview of our activities and areas of focus during the year.
During the year the Committee held five formal meetings, in which we:
• Oversaw, evaluated and monitored the PR19 process and assurance thereon, including Ofwat’s Draft Determination and Final Determination;
• Received updates from: operational teams on our management of key risks and performance measures covering water quality, pollutions and trunk mains; our legal team on legal and data protection risks; our digital team on IT operations and data quality risks; our HR team on risks to critical roles and our regulation team relating to our management of regulatory reporting risks;
• Approved updated corporate policies;
• Reviewed and recommended to the Board for approval the six-monthly reporting to Ofwat in respect of the Section 19 Undertakings following its investigation into our leakage performance;
• Engaged with the Company’s auditors, PricewaterhouseCoopers LLP (“PwC”) on a regular basis in relation to the status of their audit work and matters arising;
• Approved and tracked the annual Internal Audit plan and key findings;
• Formally considered sufficiency of resources to deliver our obligations at each of our scheduled meetings (as detailed in our Ring-fencing Certificate, previously referred to as the “F6A statement” or “Sufficiency of Resources Certificate under Condition P”);
• Oversaw improvements to our risk management framework – reviewing (and assessing any improvements to) how we responded to risks such as Brexit, renationalisation, financeability, data and cyber security risks, and improved understanding of catastrophic loss risk mitigations; and
• Considered and discussed the impacts on the business, risks and controls relating to Covid-19.
Additionally, the Committee received reports on whistleblowing, fraud and anti-bribery. The Risk, Audit and Assurance team plays and integral role in managing these processes and brings to the attention of the Committee the key cases that have been investigated by a specialist team and, where applicable, look at lessons learned from those investigations.
Looking aheadAs we continue into the new five-year regulatory period (2020 to 2025), the Committee will continue to ensure we promote clarity and transparency in all our reporting and will oversee the Company’s assurance framework, ensuring processes and controls are appropriate, and that published information is accurate, complete and reliable. The Committee will also consider any impact of Covid-19 on the internal control environment and our risk management processes.
Nick LandChair of the Audit, Risk and Reporting Committee
Committee responsibility, composition and attendanceThe Committee’s primary responsibility is to provide support to the Company’s Board by exercising oversight of the integrity of the Group’s financial and regulatory reporting, engaging with the external auditors, and overseeing the Group’s control and risk management frameworks by challenging their effectiveness and monitoring compliance.
The Committee currently includes four Independent Non-Executive Directors and is chaired by Nick Land, the Company’s Senior Independent Director and Deputy Chairman. The Board considers the Committee has the appropriate composition, skills and experience to discharge its responsibilities.
The meetings are regularly attended by the Interim Executive Chairman, Chief Financial Officer, Head of Risk, Audit & Assurance, Company Secretary, Group Financial Controller and external auditors to ensure all the information required by the Committee for it to operate effectively is available. Other members of Thames Water’s senior management team are invited to attend meetings (including the Head of Financial Reporting, Systems & Control and Head of Regulatory Compliance & Reporting) when appropriate. In conjunction with each meeting, the external auditors, the CFO and the Head of Risk, Audit and Assurance hold private sessions with the Committee without Thames Water management being present.
In performing its duties, the Committee has access to the services of the Risk, Audit and Assurance function, the Company Secretary and, if required, external professional advisers. The Committee will advise the Board on matters falling within the scope of its responsibilities. Such advice may be in the form of minutes of its meetings, supporting papers and written and oral reports at Board meetings.
Audit, risk and internal controlAudit, Risk and Reporting Committee Report
The Committee’s primary responsibility is to provide support to the Company’s Board by exercising oversight of the integrity of the Group’s financial and regulatory reporting, engaging with the external auditors and overseeing the Group’s control and risk management framework.
Nick LandChair of the Audit, Risk and Reporting Committee
Attendance table:Committee member Meetings attended
Nick Land (I)
Alistair Buchanan (I) Paul Donovan (appointed 1 July 2019) Michael McNicholas (appointed 1 July 2019)
Ian Pearson (I)
David Waboso (I) Kenton Bradbury (resigned 1 July 2019)Christopher Deacon (resigned 1 July 2019)
Meeting attended Meeting not attended
(I) Independent
Thames Water Combined Report 2019/20 100Strategic report Governance Financial statements Annual performance report

Responsibilities:The Committee understands and acknowledges its primary role of protecting the interests of shareholders and stakeholders by ensuring the integrity of financial information published by the Company.
In this role, the Committee’s purpose is:
Financial and regulatory reporting External audit
• To exercise oversight over the accuracy and completeness of the Thames Water Combined Report – Annual Report, Annual Performance Report and Sustainability Report 2019/20 (the “Report”), including advising the Board on whether the Report presents a fair, balanced and understandable view of the Group;
• To ensure the Report gives a true and fair view of the Group’s results and performance and is compliant with IFRS financial reporting requirements, Ofwat’s Regulatory Accounting Guidelines, the UK Corporate Governance Code, Disclosure and Transparency Rules (“DTR”) and the Companies Act 2006 (“CA2006”); and
• To ensure accounting policies, practices and disclosures are appropriate and assess whether the key estimates and judgements made by management are reasonable and appropriate.
• To provide independent review and oversight of reporting of statutory data and regulatory data, ensuring compliance with Ofwat’s Company Monitoring Framework and that assurance is in line with Ofwat’s requirements;
• To ensure the Company goes above and beyond the requirements of Ofwat’s Company Monitoring Framework; and
• To formally review compliance with Condition P of our licence (now referred to as the “Ring-fencing Certificate”) on a regular basis and report to the Board. This review has taken place at each meeting since June 2018.
• To review the effectiveness, objectivity and independence of the external auditors;
• To make recommendations to the Board on the appointment of the auditors, to agree the fees paid to the auditors, and to be responsible for the tender of the statutory audit from time to time;
• To approve the provision of any non-audit services; and
• To review the scope and results of external audits and non-audit services.
Risk management and internal control Internal audit
• To monitor and review the effectiveness of the Company’s risk management framework;
• To monitor and review the effectiveness of the Company’s internal controls framework and the results of controls testing;
• To provide assurance over external reporting, including regulatory submissions to Ofwat;
• To review the Company’s arrangements for whistleblowing, reporting fraud and other unethical or inappropriate behaviour including appropriate follow up action of such matters; and
• To monitor and review the Group’s insurance claims, including associated business risks.
• To promptly review reports of the Company from the internal audit function;
• To monitor and review the effectiveness of the Company’s internal audit function in the context of the Group’s overall risk management systems.
• To approve the annual plan.
Overview of the actions taken by the Audit, Risk and Reporting Committee to discharge its duties:Financial and regulatory reporting
• Reviewed and recommended to the Board the 2019/20 Interim Financial Statements;
• Reviewed and recommended to the Board the Statement of Risks, Strengths and Weaknesses and Draft Assurance Plans for 2019/20;
• Reviewed compliance with Ofwat’s Company Monitoring Framework;
• Reviewed and recommended to the Board the Final Assurance Plans for 2019/20;
• Reviewed on a Quarterly basis, factors relevant to the annual approval of the Sufficiency of Resources (Condition P) Certificate
• Reviewed and recommended to the Board the 2019/20 combined Annual Report, Annual Performance Report and Sustainability Report, including specific review of going concern, formal considerations for approving the Sufficiency of Resources certificate for 2019/20 and Risk and Compliance statement; and
• Considered Financial Resilience and the 2019/20 Long-Term Viability Statement reported as such to the Board
Treasury and tax • Reviewed and recommended for approval:
• 2019/20 interim and annual covenant compliance certificates;
• Company’s tax policy; and
• Annual Debt Prospectus
External audit • Reviewed regular reports from PwC;
• Approved PwC’s audit plan for 2019/20; and
• Responded to the changes in EU regulation for non-audit fees following PwC’s appointment in 2018/19
Internal audit • Approved the Audit Plan for 2020/21;
• Reviewed the Open Audit Actions report; and
• Challenged, in detail (through presentation by the risk owner), all red-rated and high-risk amber internal audits and status of actions to address the risks highlighted within the audits
Risk management and internal control • Reviewed regular updates on the Company’s
top risks;
• Reviewed and provided guidance to our approach to managing catastrophic loss risks;
• Reviewed the appropriateness of our risk appetite statements;
• Reviewed updated corporate policies (including the launch of the ‘Policy Hub’ in December 2019)
• Reviewed updated Schedule of Delegated Authority (SoDA)
• Received an update on internal controls – controls self-assessment process; and
• Considered the internal controls testing results
Whistleblowing and unethical behaviour • Reviewed regular updates on the volume and type
of whistleblowing cases and actions taken around unethical behaviour of individuals within and outside of the Company
• Reviewed the Honest & Ethical Behaviour Policy before referring to the Board for approval
• Received an update on the ‘Speak-Up’ whistleblowing campaign (re-launched in October 2019 with companywide communications and posters at most sites)
Audit, risk and internal controlAudit, Risk and Reporting Committee Report continued
Thames Water Combined Report 2019/20 101Strategic report Governance Financial statements Annual performance report

2020-2025 Business Plan Received an update on queries from Ofwat in relation to the Company’s business plan submissions
Other areasThe committee received updates on:
• legal matters
• water quality (as a result of an internal audit report)
• the trunk mains strategic review
• pollutions performance
• data protection (as a result of an internal audit report)
• employees in critical roles
• IT operations performance
• external reporting assurance
• data quality and management (as a result of an internal audit report)
• 2020/21 tariffs
Significant financial statement and reporting mattersFollowing the receipt of a routine letter from the Corporate Reporting Review Panel of the Financial Reporting Council (“FRC”) in 2018/19, we provided further clarity in some of our 2018/19 Annual Report and Annual Performance Report disclosures. The FRC accepted our response to their letter and formally closed their review in July 2019.
Significant estimates, judgements and key focus areasThe matters below relate to the key estimates, judgements and focus areas reviewed by the ARRC in respect of the financial statements for the year under review.
Significant estimates, judgements and key focus areas Action taken
Bad debt provision The Committee reviewed management’s key assumptions underlying the bad debt provision via reviews of papers presented by management on the topic throughout the year, including understanding the debtors’ ageing and the basis for cash collection and write-off rates in the year, including the potential effects of Covid-19. The Committee also reviewed findings from PwC from their interim review and annual audit. Based on this review, the Committee was satisfied that potential bad debts were adequately provided for in the financial statements. The Committee acknowledged the change in risk profile following transition of customers previously billed through Local Authority Housing Association to being directly billed by the Company and the potential exposure arising from Covid-19. Based on their review the Committee was comfortable with the level of bad debt provision recognised by the Company, including the judgemental impact of the level of historic and current cash collections (including the effects of Covid-19), the effect of cancelling billings on expected debt recovery (for example, where the property occupier has moved without informing the Company or where the Company was unable to invoice for a period of time when the property was unoccupied) and the levels of debtors due to be collected on the Company’s behalf by water only companies (“WOCs”) and retailers in respect of non-household customers.
Other provisions The Committee reviewed the levels of provisions held by the Company throughout the year, questioning and challenging the basis for such provisions. The Committee was provided with details of the main assumptions around the recognition and valuation criteria applied over provisions. The Committee also reviewed findings from PwC from their interim review and annual audit. Based on the reviews and report the Committee concurred with the level of provisions made and management’s judgement of the completeness and valuation of the provisions in relation to potential legal and regulatory claims and other matters.
Capital vs operational expenditure
The Committee has reviewed the classification of costs within the financial statements, gained an understanding of the key investment projects and year-on-year movements, including policy changes with respect to capitalisation of certain leak detection costs. The Committee also reviewed reports on the audit work PwC had undertaken in this area. Based on these reviews and discussions with both management and PwC, the Committee considers the classification of expenditure is appropriate. Given the significant investments the Company makes in maintaining and improving its network infrastructure, the allocation of such expenditure between capital and operating costs is a critical area.
Valuation of financial derivatives
The Committee has reviewed the methodology adopted in valuation of various derivative instruments and reviewed the findings from PwC, and discussed with the Head of Treasury, Tax and Corporate Finance the techniques applied. Based on the review and discussions, the Committee was content with the methodology applied to value derivatives in the balance sheet in both the interim and annual reports.
Valuation of defined benefit obligations
The Committee considered the output of a valuation exercise as at 31 March 2020 undertaken by independent actuaries Hymans Robertson LLP. The Committee considered the assumptions used compared to previous years and other companies, as well as the effects of COVID-19. The Committee also reviewed findings from PwC from their interim review and annual audit. Based on the review and discussions, the Committee was content with the assumptions used to value the Company’s defined benefit obligations in both the interim and annual reports.
Going Concern The Committee reviewed the going concern and long-term viability statement disclosures within the financial statements, specifically taking into account the impact of Covid-19 and the Final Determination. The Committee was provided with details of the key assumptions, sensitivities and severe but plausible downside scenarios. The Committee also reviewed reports from PwC on the audit work undertaken in these areas. Based on these reviews and discussions with both management and PwC, the Committee is content with the preparation of the accounts on a going concern basis and the associated disclosures within the financial statements.
Exceptional items The Committee considered management’s policy for recognising exceptional items within the financial statements and reviewed the items to be classified as exceptional during the year. The Committee also reviewed PwC’s findings from their interim review and annual audit. Based on the review and discussions with management and PwC, the Committee is content with judgements made and associated disclosures within the financial statements.
Project Spring (new billing platform)
The Committee received regular progress updates from management on the new system and outcome of each migration of customers. In addition, they considered the findings from internal audit reports provided by the Audit and Assurance team, as well as findings from PwC. The Committee is content that there are no material issues arising from the implementation and subsequent customer migrations.
Audit, risk and internal controlAudit, Risk and Reporting Committee Report continued
Thames Water Combined Report 2019/20 102Strategic report Governance Financial statements Annual performance report

Review of the annual financial statementsPrior to the 2019/20 Thames Water Combined Report – Annual Report, Annual Performance Report and Sustainability Report 2019/20 being presented to the Board for formal approval, the ARRC, at the request of the Board, considered:
• whether it was appropriate to adopt the going concern basis in preparing the Report,
• the long-term viability of the Company and Group;
• whether the Report is fair, balanced and understandable; and
• whether it provides the necessary information for all stakeholders to assess the Group’s position and performance, business model and strategy.
In discharging their duties, the ARRC considered:
• compliance with financial covenants over an assessment period of at least 12 months;
• the consistency of accounting policies across the Group;
• the methods used to account for significant or unusual transactions;
• whether the Group had followed appropriate accounting standards; and
• whether the Group had made appropriate estimates and judgements, considering the independent auditors’ opinion on the annual report and financial statements. The ARRC further considered whether appropriate disclosure had been made in the financial statements, the Strategic Report, Directors’ Report, Remuneration Committee Report and the Corporate Governance Report.
Fair, balanced and understandableIn conclusion, the Committee advised the Board that the 2019/20 Combined Report and Financial Statements, taken as a whole, provide:
• A fair, balanced and understandable assessment of the Group’s position; and
• The information necessary for shareholders to assess the Group’s performance, business model and strategy.
To make this assessment, members of the Committee received drafts of the Combined Report to review early in the process to ensure key messages set out in the Report are aligned with the Group’s position, performance and strategy, and that the narrative sections were consistent with the financial statements. The significant issues considered by the Committee in relation to the 2019/20 financial statements included those identified by the external auditors in their report on pages 132-137.
External auditThe Committee reviewed PwC’s terms of engagement and the scope and execution of their audit work. The Committee assessed the independence and objectivity of the external auditors, considering relevant UK professional and regulatory requirements and the relationship with the auditors, including the provision of any non-audit services in accordance with the Policy for the Provision of Non-Audit Services.
Auditors’ independence and objectivityThe independence of the external auditors is essential to the provision of an objective opinion on the true and fair view presented by the financial statements. Auditors’ independence and objectivity is safeguarded by regularly reviewing the nature and value of non-audit services performed by the external auditors, ensuring employees of the external auditors who have worked on the audit in the past two years are not appointed to senior financial positions within the Group, and the rotation of the lead engagement partner at least every five years and key audit partner every five years. The current lead engagement partner, Katharine Finn, has held the position for two years, and has been a key audit partner for the same period.
The ARRC met with PwC on several occasions during the year without management present, providing the external auditors with the opportunity to raise any matters in confidence. In addition, the Chair of the ARRC met privately on a number of occasions with PwC. Following this year’s annual review, the ARRC is satisfied with the effectiveness, independence and objectivity of PwC.
Non-audit servicesTo safeguard the objectivity and independence of PwC, approval from the Committee Chairman is required for any services provided by the external auditor. As part of this process the Committee ensures the external auditors are not permitted to perform any work they may subsequently need to audit, or which could create a conflict of interest or constitute a breach of the external auditors’ independence and objectivity. Non-audit services are normally limited to assignments which are closely related to the performance of the audit or where detailed knowledge of the Company is necessary for its completion.
Total fees paid to the external auditors during the year ended 31 March 2020 for audit and non-audit services amounted to £2.1 million (see note 3) (2019: £2.1 million). Most of the non-audit services related to assurance work relating to various submissions to Ofwat. Further detail can be found in note 3 to the statutory financial statements.
The Committee considered the level of non-audit fees and safeguards put in place relating to non-audit work, including written representations from PwC which confirmed their independence, and was satisfied that the non-audit fees incurred have not resulted in a loss of independence or objectivity.
Auditors’ appointmentPwC was appointed as the Group’s auditors after a competitive tender for the 31 March 2019 financial year end audit. This is the second year PwC have been Thames Water’s external auditors. The Company adopts the same approach to audit tendering as a FTSE 100 company, ensuring the Company’s compliance with the UK Corporate Governance Code and the reforms of the audit market by the UK Competition and Markets Authority. In alignment with the EU regulatory framework for statutory audit, the Company plans to operate a ten-year tender process for its auditors; however, the ARRC may recommend that the Company puts the audit out to tender at any time, based on the results of the assessments of auditors’ independence and audit quality outlined above. There are no contractual obligations restricting our choice of external auditors and no auditors’ liability agreement has been entered by the Company.
Audit, risk and internal controlAudit, Risk and Reporting Committee Report continued
Thames Water Combined Report 2019/20 103Strategic report Governance Financial statements Annual performance report

Risk management and internal controlsThe Board has overall responsibility for the Company’s risk management framework and systems of internal control. These systems aim to ensure risk is managed effectively, rather than eliminating risk completely, and can only provide reasonable, not absolute, assurance against material impact.
Risks are prioritised, according to our defined risk scoring criteria, allowing for the most significant risks to be monitored quarterly by Senior and Executive Management, the ARRC and our Board. These reviews form the basis for our annual principal risks and uncertainties disclosure.
Within the year improvements have been made in our internal controls’ environment. These include:
• An updated framework of corporate policies, supported by operating standards and procedures, as well as authorisation and approval processes that provide the necessary guidance to our employees and business partners about how they should operate and conduct themselves when acting on behalf of the Company;
• An improved annual Controls Self-Assessment process which requires senior management to report on the maturity and effectiveness of the key internal controls in operation within their business area; identify opportunities for improvement; and implement remedial action if required;
• A revised Schedule of Delegated Authority (SoDA) providing a framework to detail how decision making is delegated through our organisation
As part of our continuous improvement process, we are further reviewing our business planning, risk assessment and financial reporting procedures, including increasing engagement of all Board members in our risk process and in defining our risk appetite. We have already undertaken two workshops covering six of our 14 principal risks and will have covered all principal risks in the coming year.
The ARRC routinely reviews the effectiveness of the risk management arrangements and systems of internal control and, principally by means of reports in respect of the above activities, makes reports to the Board. The ARRC approved for recommendation to the Board the statements to be included in the 2019/20 statutory and regulatory reports concerning risk management and systems of internal control. The ARRC ensured there were clear reporting lines for all issues associated with risk management and reviewed the adequacy of structures, processes and responsibilities for identifying and managing risks facing the organisation. The Committee was satisfied appropriate work was undertaken developing the maturity of risk management. The ARRC reviewed the principal risks and uncertainties appearing on pages 66-74.
Internal auditThe Committee monitored and reviewed the effectiveness of the Group’s internal audit function in the context of the Group’s overall risk management systems. In 2019/20 the Committee considered and approved the remit and activities of the internal audit function ensuring it had adequate resources and appropriate access to information to enable it to perform its function effectively, in accordance with the relevant professional standards, and was free from management or other restrictions.
The Committee reviewed and assessed the annual internal audit plan which contains a mix of risk based and cyclical reviews. The plan is delivered through appropriately skilled and qualified internal resources supported with external resources where more specialised skill sets are required, typically within Information Systems and Treasury. The plan is approved by the Committee each year with focus given to not only the areas which are being covered but also those that are not, to ensure the plan aligns with the Committee’s view of risks. The Committee Chairman discussed high priority issues directly with the relevant members of management to ensure he had a thorough understanding of the matters raised and the process for resolution. He also held private meetings with the internal audit team.
Audit, risk and internal controlAudit, Risk and Reporting Committee Report continued
Thames Water Combined Report 2019/20 104Strategic report Governance Financial statements Annual performance report

At a glanceI am pleased to present my Regulatory Strategy Committee report which describes the activities and areas of focus during the year. The Committee met on 7 occasions in this reporting period reflecting the significance of PR19 as the Committee continued to manage the Draft Determination in July 2019 and the Final Determination at the end of last year.
Looking ahead, the Committee will continue to provide a forum for discussion on the future direction of regulation, with particular reference to Ofwat’s strategic plans and guidance. In the short-term consideration will be given to “lessons learned” from the PR19 process as well as monitoring the issues arising from the on-going CMA challenges to PR19. The Committee will also provide the forum to discuss the evolving regulatory approach to NHH suppliers as well as markets and competition in general. During 2020/21 the Committee will also review the implications from rulings by other relevant regulators and monitor the broader relationship management with both Ofwat and other regulators.
The role of the CommitteeThe Committee has primary responsibility for regulatory and compliance matters linked to the corporate strategy and the business plan.
Membership and attendanceIncluding the Chairman, the Committee consists of two Independent Non-Executive and three Non-Executive Directors. The meetings are also attended by the Regulation Director and the CFO as required. The Company Secretary acts as secretary to the Committee, thereby ensuring that all of the information required by the Committee to operate effectively is available. Any person (including but not limited to any Executive Director or member of the Executive team) may attend meetings by invitation.
Committee activities during the year 2019/20 • While the Audit, Risk and Reporting Committee
focused on overseeing the assurance of the PR19 submissions, the Committee provided guidance on the approach and challenge prior to review by the full Board
• The Committee was updated and provided feedback as well as oversight on the work undertaken on the PR19 business plan on a regular basis which included considering the results of customer consultation and stakeholder engagement
• The Committee reviewed the Company’s proposed performance commitments and outcome delivery incentive for AMP7
• The Committee reviewed and provided feedback to the Board on Ofwat’s Draft and Final Determinations including assessing their financeability
• The Committee reviewed, challenged and provided guidance to the Board on the Company’s response to Ofwat’s Draft and Final Determinations
• The Committee received and reviewed updates on other regulatory developments including on Ofwat’s proposed licence modifications, potential political plans leading up to the 2019 General Election, regulatory investigations and compliance with regulatory undertakings.
Alistair BuchananChair of the Regulatory Strategy Committee
Regulatory Strategy Committee report
The Committee has primary responsibility for regulatory and compliance matters linked to the corporate strategy and the business plan.
Alistair BuchananChair of the Regulatory Strategy Committee
AttendanceMembership of the Committee during 2019/20:
Meetings attended/ not attended
Alistair Buchanan (I) (Chairman)
Ian Marchant Michael McNicholas (appointed 1 July 2019)
Ian Pearson (I)
Greg Pestrak Kenton Bradbury (resigned 1 July 2019)
Meeting attended Meeting not attended
(I) Independent
Thames Water Combined Report 2019/20 105Strategic report Governance Financial statements Annual performance report

Customer Service Committee Report
At a glanceThe purpose of the Committee is to advise the Board of the needs and priorities of customers to ensure high quality, effective services are provided to their satisfaction, both now and into the future.
The Committee looks at all users of our services including retail, wholesale, developer services customers, as well as the wider community within which we operate.
The role of the CommitteeThe core objectives of the Committee are to provide assurance, support and challenge on delivering better outcomes for customers, customer engagement and communications including:
• Customer strategy – Review the development of the customer strategy reflecting the challenges we face now and in the future, including the launch of our new customer relationship management and billing system and encouraging digital channel shift.
• Performance – Review our current position and performance against regulatory performance commitments, industry comparators and best practice.
• Customer consultation and engagement – Review and advise on the various customer communication and engagement channels. Oversaw customer engagement for the 2020 to 2025 business planning process.
Membership and attendanceThe Committee is made up currently of five Non-Executive Directors – Catherine Lynn, Jill Shedden and Nick Land (who are independent) plus Greg Pestrak and Paul Donovan – the latter joining in July 2019.
Executive Directors and the Company Secretary are invited to attend all meetings to ensure the availability of requisite information for the Committee to operate effectively. Other members of senior management are invited to attend when appropriate.
Committee activities during the year 2019/20During the year, the Customer Service Committee received and discussed updates on the delivery of our customer services strategy and our customer service performance, including:
• The transition of the majority of our customers to the new customer relationship management and billing platform
• Customer satisfaction drivers and complaint volumes and root causes
• Plans to optimise the performance of the newcustomer and billing platform
• Continuous improvement of our incident management response
• Affordability and vulnerability strategies
• Bad debt mitigation
• The overhaul of our website to improve customerexperience and digitise core customer journeys
• Considered proposals for the future of the CCG and made recommendations to the Board
I also attended a Customer Challenge Group (“CCG”) meeting on 14 June 2019 to listen to their views on behalf of the Committee and to give them the opportunity to ask questions on the work of the Committee.
Catherine LynnChair of the Customer Service Committee
The core objectives of the Committee are to provide assurance, support and challenge on delivering better outcomes for customers, customer engagement and communications.
Catherine LynnChair of the Customer Service Committee
AttendanceMembership of Committee during 2019/20:
Meetings attended/not attended
Catherine Lynn (I) (Chair)Paul Donovan (appointed 1 July 2019)
Nick Land (I)
Greg Pestrak
Jill Shedden (I)
Meeting attended Meeting not attended
(I) Independent
Thames Water Combined Report 2019/20 106Strategic report Governance Financial statements Annual performance report

At a glanceThe Committee met four times in this reporting period with one meeting taking place onsite at Hampton water treatment works.
At each Committee meeting there has been a presentation on the significant risks from experts within the Company on the health, safety and environmental performance. The meeting includes monitoring of key leading and lagging performance indicators, regulatory engagement, statutory compliance and cultural evolution.
The role of the CommitteeThe Committee is responsible on behalf of the Board for reviewing and monitoring health and safety, environment and drinking water quality as well as security matters arising from business activities and operations. As such, the Committee provides relevant challenge to the business and is responsible for reviewing significant health, safety and environmental trends/incidents and using the outcome and learnings to develop and promote a culture of continuous improvement in all aspects of Health, Safety and Environmental management at Thames Water. The Committee also considers the strategy and performance for pollution and environmental impact prevention/reduction as well as receiving updates on any current or potential environmental and Health and Safety prosecutions. The Committee also undertakes deep dives into specific areas of interest or concern to the Board.
Health, Safety and Environment Committee report
Membership and attendanceThe Committee is made up of three Independent Non-Executive Directors; David Waboso (Chair), Nick Land and Catherine Lynn and two Non-Executive Directors, John Morea and Michael McNicholas.
The current Executive Chairman, Operations Director, Asset Management Director and the Health, Chief Safety & Security Officer are permanent attendees. Any person may attend the meetings by invitation. The Company Secretary acts as secretary to the Committee to ensure that the information required by the Committee to operate effectively is available.
Committee activities during the year 2019/20In this reporting period, the Committee has undertaken several deep dives into specifically identified risk areas including:
• Trunk Mains Review
• Reservoirs Risk
• Street works
• Biogas
• Strategic Pumping Stations
• Occupational Road Risk
• Tunnel and Shaft Programme
• Sewers Crossing Railways
David WabosoChair of Health, Safety & Environment Committee
The Committee is responsible on behalf of the Board for reviewing and monitoring health and safety, environment and drinking water quality as well as security matters arising from business activities and operations.
David WabosoChair of Health, Safety & Environment Committee
AttendanceMembership of the Committee during 2019/20:
Meetings attended/ not attended
David Waboso (I) (Chair)
Nick Land (I)
Catherine Lynn (I) Michael McNicholas (appointed 1 July 2019) Kenton Bradbury (resigned 1 July 2019)
John Morea
Meeting attended Meeting not attended
(I) Independent
Thames Water Combined Report 2019/20 107Strategic report Governance Financial statements Annual performance report

Directors’ Remuneration Report 2019/2020
Chair’s statementOn behalf of the Remuneration Committee (Committee), I am pleased to present the Directors’ Remuneration Report for the year ended 31 March 2020. This report sets out our policies for Executive Director remuneration; how the policies were implemented in 2019/20; and how Executive Director reward links to Thames Water’s performance.
The report is split into three parts:
• this overview, which includes an ‘At a Glance’ summary of Executive Director remuneration
• our updated Remuneration Policy that furtherstrengthens the link between reward and the delivery of our strategic ambitions; and
• the Annual Report of Remuneration, which sets out Executive Director remuneration in 2019/20, as wellas how the Remuneration Policy will be applied for 2020/2021.
Overview of remuneration outcomes for 2019/20At the start of the year, the Committee set targets that focused on delivering stretching operational improvements and efficiencies to provide better service for our customers, linked to financial control.
In assessing performance against Annual Management Bonus targets, the Committee concluded we’ve driven a solid performance in many areas:
• achieving above target on key targets including leakage reduction, supply interruptions and sewer flooding. We secured our best leakage performancesince privatisation at 595Ml/d and made huge improvements in supply interruptions.
• maintaining our 3-star rating (with 4 being the highest) under the Environment Agency’sEnvironmental Performance Assessment
• improving our asset health performance to stableacross all areas
• maintaining financial controls with £137 million of in year savings through cost efficiency and financialoutcomes for incentives landed between threshold and on-target
Some areas were more challenging:
• While the price review (PR19) programme had delivered a final determination, which was accepted by the Board, the outcome and process had been challenging for both our shareholders and our regulator. As such, while an acceptable PR19 outcome was delivered, the Committee reduced theincentive outcome to below threshold.
• While we’ve driven a 24% year-on-year reduction in water complaints, we’re not yet performing at the level our customers expect in terms of retail andwaste complaints and results were disappointing.
This report details the activities of the Remuneration Committee for the financial year to 31 March 2020. It sets out the Remuneration Policy and remuneration details for the Executive Directors and Non-Executive Directors of the company.
Jill SheddenChair, Remuneration Committee
Despite a disappointing complaints performance, we reached a major milestone during the year with the accelerated, successful and ‘on target’ migration of the majority of our customers to our new customer relationship management and billing system. After the successful transition, important foundations are now in place for improved delivery between 2020 and 2025. Across the year our “Brand” Net Promoter Score (R-NPS) improved to average -18.25 between target and stretch although it fell below threshold in the last quarter partly due to the extreme weather – we saw the wettest February on record. Considering this, the Committee awarded no incentive payment for the complaint’s element and despite improvements in R-NPS, no incentive payment was awarded for thiselement in the Transformation incentive.
As reported in last year’s remuneration report, the two-year Transformation Incentive covering the performance period 2018 to 2020 is payable in July 2020. As set out later in this report, performance against challenging targets including leakage, asset health and environmental performance was either on or above target.
The performance outcomes against annual bonus targets as detailed on page 122 resulted in a year-on-year reduction in bonus payments by 11.8% compared with 2018/19, although the longer-term Transformation Incentive outcome means the overall outcome of incentives for Executive Directors is marginally above target.
AttendanceMembership of the Committee during 2019/20:
Meetings attended/ not attended
Jill Shedden (I) (Chair)
Nick Land (I)
Paul Donovan (appointed 1 July 2019)
Ian Marchant
Michael McNicholas (appointed 1 July 2019)
Greg Pestrak
Ian Pearson (I)
Kenton Bradbury (resigned 1 July 2019)Christopher Deacon (resigned 1 July 2019)
Meeting attended Meeting not attended
(I) Independent
Thames Water Combined Report 2019/20 108Strategic report Governance Financial statements Annual performance report

Directors’ Remuneration Report 2019/2020 continued
Covid-19 As a nation, we’re facing unprecedented times in the face of the Covid-19 pandemic and we don’t yet know what the lasting impact will be on our customers and communities. To support our customers at this unnerving time, we’re providing extra support to those who find themselves in financially vulnerable circumstances through our social tariff. We’ve also set up a community relief fund to support our community partners who have been affected by the impact of the virus.
As a personal contribution to support those in our communities, Ian Marchant, our Interim Executive Chairman and Brandon Rennet, our Chief Financial Officer have asked for 25% of their salaries for three months to be donated (post salary sacrifice) to our Independent Thames Water Trust Fund, which supports customers with debt advice and essential household items. The amounts will be matched by Thames Water.
Review of our Remuneration PolicyDuring the year, the Committee reviewed the Remuneration Policy and its approach to implementing it, considering the UK Corporate Governance Code 2018 (2018 Code) and associated Guidance on Board Effectiveness, and the Companies (Miscellaneous Reporting) Regulations 2018. The Committee takes seriously its role in ensuring the interests of Executive Directors are aligned with those of our customers, external shareholders and the wider workforce, as well as to wider societal expectations including our impact on the environment. The Committee reviewed the policy during the year with the support of independent external remuneration consultants, Mercer, and concluded that a number of changes were appropriate to enhance further this alignment of interests and reflect our business plan for 2020 to 2025.
The principal changes made to the Policy include:
• The alignment of pension entitlements for Executive Directors hired after 1 July 2019 with those offered to most of the workforce, equivalent to a pension contribution of 12% of salary. For Executive Directors hired before 1 July 2019, the value of their pension contribution will be capped going forward at the monetary amount received for the 12 months to 30 June 2020;
• The implementation of a “withholding period” of up to two years, to long-term incentive scheme awards granted to Executive Directors from 2020;
• The introduction of an aggregate maximum award limit for the Annual Management Bonus and long-term incentives, providing the Committee with greater flexibility to tailor the balance of incentives for each year of the regulatory period; and
• Greater transparency relating to the discretion available to the Committee.
As well as reviewing the policy, the Committee also undertook a detailed review of the measures and targets applied to both the short-term and long-term incentives going forward to ensure they fully support our priorities for 2020 to 2025 and beyond. We’ve retained the key focus on delivery for customer and the environment with these elements continuing to make up the majority of targets for both the short-term Annual Management Bonus and the long-term incentive plan (LTIP). We’ve also strengthened the linkage between on-target performance outcomes, to the key performance outcomes from our business plan, which in turn are directly linked to the delivery of targets in this area agreed with Ofwat.
Executive Director successionIn May 2019, Steve Robertson stepped down as our Chief Executive Officer. The Committee carefully considered the treatment to be applied to Steve’s remuneration arrangements as a result of his departure and details are outlined in Payments for loss of office on page.
p123 Read more about details of Steve’s remuneration in Payments for loss of office
Following Steve’s departure, Ian Marchant was appointed as Interim Executive Chairman assuming executive responsibilities on an interim basis until a permanent successor for the CEO role was appointed. Ian will continue in this role until Sarah Bentley joins on 1 September 2020. Details of the remuneration payable to Ian for 2019/20 are set out on page 121.
p121 Read more about details of the remuneration payable to Ian for 2019/20
2020/21 Remuneration As well as alignment with the delivery of our purpose, the Committee continues to place a strong emphasis on setting stretching targets that align with our strategic ambitions and enablers including driving brilliant customer engagement and operational performance, as well as financial outcomes and enhancing long-term shareholder value.
In 2020/21, the Annual Management Bonus scheme will operate in a similar way to 2019/20 with a continued focus on customer service. The Committee has also approved the introduction of two new performance measures to cover culture and safety. Details are shown on page 125.
p26 Read more about business culture and safety
The 2020/23 Long Term Incentive Plan (LTIP) award for Executive Directors will be subject to an additional withholding period post vesting and a “multiplier” approach has been introduced in the Integrated Performance Assessment element. Further details on the LTIP are on page 125.
We’ve continued to evolve as a business during 2019/20, and as a Remuneration Committee, we’ve been working to ensure our policy and the application of it aligns with our strategic ambitions and priorities, as well as the cultural behaviours we expect our people to adopt as we pursue our purpose, to deliver life’s essential service, so our customers, communities and the environment can thrive.
Jill SheddenChair, Remuneration Committee29 June 2020
Thames Water Combined Report 2019/20 109Strategic report Governance Financial statements Annual performance report

Our remuneration policy is built on principles designed to attract, retain and motivate our leaders and senior management and ensure they are focused on delivering business priorities within a framework designed to promote the long-term success of the Company.
Remuneration principles
Remuneration should be aligned with the interests of the Company’s key stakeholders, in particular our customers, external shareholders, suppliers and employees
The policy should link remuneration to the Company’s strategic priorities, promote its long-term success, and reinforce the Company’s culture
Promote demonstrable links between reward for Executive Directors and performance for customers and external shareholders, as well as performance against the Company’s environmental targets
Remuneration should be commensurate with packages provided by other companies of similar size and complexity, taking into account individual contribution and experience
Remuneration should include a mix of fixed and variable pay comprising basic salary plus performance related incentives.
Remuneration policy and structure
Remuneration at a glance
Remuneration outcomes for 2019/20
Annual Management Bonus – one year ending 31 March 2020
KPI Result Outcomes for Chief Financial Officer
Customer complaints -5%
Sewer Flooding Other Causes (SFOC) 1,058
Security of Supply – Supply Interruptions (SI4) 7.38 mins
PR19 Success outcome 15%
Group EBITDA (adjusted) £1,004 mn
Gross Opex £137 mn
Personal 70%
Transformation Incentive – two years ending 31 March 2020
KPI Result Outcomes for Chief Financial Officer
Leakage Target 595
Environmental Performance 3 Stars
Asset Health Waste Water
Customer Advocacy
Project Spring92% delivered ahead of time and on target
Non- contactor NPS
-18.25
0% 68.3%
25%
100%
100%
0%
57.8%
85%
15%
32.5%
45.9%
70%
Total 47.9% Total 62.3%
Remuneration policyElement Key elements Revisions from previously approved Policy
Base salary Reflects the scope and responsibilities of the role, the skills and experience of the individual and marketNo cap although increases will not normally exceed average increases for the wider workforce
Additional detail on Committee discretions Confirmed comparator groups for benchmarking
Pension Payment to the defined contribution pension schemes or cash in lieu of pensionFor Executive Directors hired after 1 July 2019, the pension contribution is 12% of salaryFor those hired before 1 July 2019, the pension contribution is frozen as a monetary amount
Pension contribution for new hires are now aligned to workforce norms and frozen for others
Other benefits
Competitive range of benefitsNo maximum limit although set to be in line with market and the rest of workforce
None
Annual Management Bonus
Based on customer service, customer and environmental delivery, business culture, safety and financial performance over one yearMalus and clawback provisions
Additional detail on Committee discretions
Long-term incentives
Based on achievement of the performance measures set over three yearsA withholding period of up to 2 yearsMalus and clawback provisions
Additional detail on Committee discretionsInclusion of a withholding period up to 2 years
Aggregate maximum incentive opportunity
320% of salary between all incentives New aggregate limits
Thames Water Combined Report 2019/20 110Strategic report Governance Financial statements Annual performance report
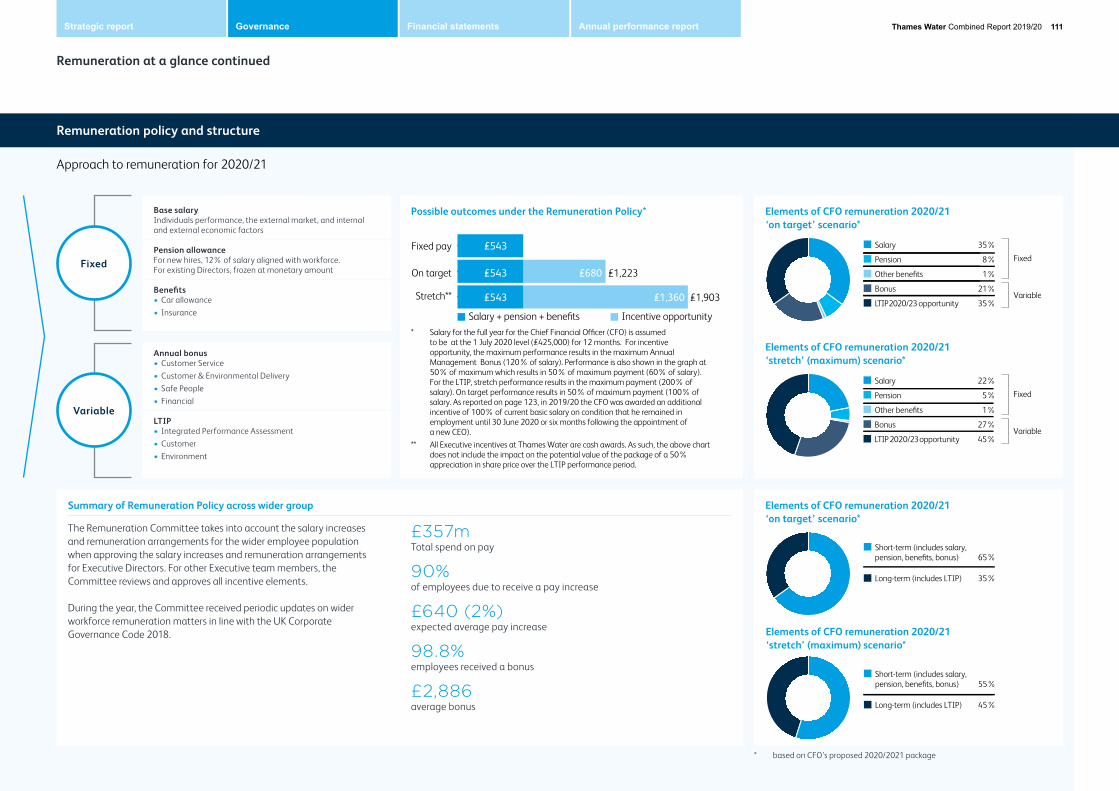
Approach to remuneration for 2020/21
Base salaryIndividuals performance, the external market, and internal and external economic factors
Pension allowanceFor new hires, 12% of salary aligned with workforce. For existing Directors, frozen at monetary amount
Benefits• Car allowance• Insurance
Annual bonus• Customer Service• Customer & Environmental Delivery• Safe People• Financial
LTIP• Integrated Performance Assessment• Customer• Environment
Variable
Fixed
Possible outcomes under the Remuneration Policy* Elements of CFO remuneration 2020/21 ‘on target’ scenario*
Elements of CFO remuneration 2020/21 ‘on target’ scenario*
Elements of CFO remuneration 2020/21 ‘stretch’ (maximum) scenario*
Elements of CFO remuneration 2020/21 ‘stretch’ (maximum) scenario*
On target
Fixed pay
Stretch**
£543
£543
£680
£1,360
£1,223
£1,903
Salary + pension + benefits
£543
Incentive opportunity* Salary for the full year for the Chief Financial Officer (CFO) is assumed
to be at the 1 July 2020 level (£425,000) for 12 months. For incentive opportunity, the maximum performance results in the maximum Annual Management Bonus (120% of salary). Performance is also shown in the graph at 50% of maximum which results in 50% of maximum payment (60% of salary). For the LTIP, stretch performance results in the maximum payment (200% of salary). On target performance results in 50% of maximum payment (100% of salary. As reported on page 123, in 2019/20 the CFO was awarded an additional incentive of 100% of current basic salary on condition that he remained in employment until 30 June 2020 or six months following the appointment of a new CEO).
** All Executive incentives at Thames Water are cash awards. As such, the above chart does not include the impact on the potential value of the package of a 50% appreciation in share price over the LTIP performance period.
Salary 22%
Pension 5%
Other benefits 1%
Bonus 27%
LTIP 2020/23 opportunity 45%
Fixed
Variable
Salary 35%
Pension 8%
Other benefits 1%
Bonus 21%
LTIP 2020/23 opportunity 35%
Fixed
Variable
Short-term (includes salary, pension, benefits, bonus) 55%
Long-term (includes LTIP) 45%
Short-term (includes salary, pension, benefits, bonus) 65%
Long-term (includes LTIP) 35%
Summary of Remuneration Policy across wider group
The Remuneration Committee takes into account the salary increases and remuneration arrangements for the wider employee population when approving the salary increases and remuneration arrangements for Executive Directors. For other Executive team members, the Committee reviews and approves all incentive elements.
During the year, the Committee received periodic updates on wider workforce remuneration matters in line with the UK Corporate Governance Code 2018.
£357mTotal spend on pay
90%of employees due to receive a pay increase
£640 (2%)expected average pay increase
98.8%employees received a bonus
£2,886average bonus
Remuneration policy and structure
Remuneration at a glance continued
* based on CFO’s proposed 2020/2021 package
Thames Water Combined Report 2019/20 111Strategic report Governance Financial statements Annual performance report

Executive Directors’ remuneration policy
Remuneration FrameworkThe overarching remuneration framework is designed to offer an appropriate mix of fixed and variable pay elements which, as a total remuneration package, attract, retain and motivate talented senior leaders to deliver great outcomes for our customers, external shareholders and other stakeholders. At the same time, the package is designed to ensure a balance between appropriate risk taking and careful stewardship.
The core underlying principles for remuneration at Thames Water, which are unchanged from 2017/18, are outlined below:
• Remuneration should be aligned with the interests of the Company’s key stakeholders, in particular our customers, external shareholders, suppliers and employees
• The policy should link remuneration to the Company’s strategic priorities, promote its long-term success, and reinforce the Company’s culture
Fixed remunerationThe table below breaks down the policy that applies to Executive Directors:
Element of remuneration Operation Maximum opportunity Performance conditions
Base salaryPurpose and link to strategyAttracting and retaining Executive Directors of the calibre required to deliver our strategy. Base salary reflects the scope and responsibilities of the role and the skills and experience of the individual.
Base salaries reflect the scope and responsibilities of the role and the skills and experience of the individual as well as the external market. Base salaries are paid in cash.
Base salaries are reviewed annually by the Committee, considering individual performance, the external market and internal and external economic factors. Changes are usually effective from 1 July.
There is no maximum salary increase. Although annual salary increases will not normally exceed average increases for the wider workforce, the Committee retains the flexibility to award larger increases in certain circumstances including, but not limited to:
• where role scope has changed;
• as part of salary progression for newly appointed Executive Directors, where the salary level is set below the market reference salary at the time of appointment, with the intention of bringing the salary level in line with the market as the individual gains the relevant experience; and
• where market conditions indicate a level of under-competitiveness in the context of an Executive Director’s performance and/or contribution.
None
Benefits Purpose and link to strategySupporting health and wellbeing to enable the Executive Director to focus on delivering performance for external shareholders and other key stakeholders and to provide a competitive package of benefits that is aligned with market practice.
The Company provides a range of market competitive benefits to Executive Directors that is aligned with that offered to our managers more widely, including (but not limited to) a car allowance, private medical insurance, and other insurance benefits such as group income protection, life assurance and where appropriate relocation and housing costs.
The Committee recognises the need to maintain suitable flexibility in the benefits provided to ensure it can support the objective of attracting and retaining personnel to deliver our strategy.
There is no set maximum. Benefits will be provided at a rate commensurate with the market and the level that is offered to employees.
The value of benefits is based on the cost to the Company and there is no pre-determined maximum limit. The range and value of the benefits offered is reviewed periodically in line with benefits of other employees at least every three years.
None
• Promote demonstrable links between reward for Executive Directors and performance for customers and external shareholders, as well as performance against the Company’s environmental targets
• Remuneration should be commensurate with packages provided by other companies of similar size and complexity, taking into account an individual’s contribution and experience
• Remuneration should include a mix of fixed and variable pay comprising basic salary plus performance related incentives.
Thames Water Combined Report 2019/20 112Strategic report Governance Financial statements Annual performance report

Executive Directors’ remuneration policy continued
Element of remuneration Operation Maximum opportunity Performance conditions
Pension allowancePurpose and link to strategy Attracting and retaining high calibre Executive Directors through the provision of cost effective saving benefits for retirement, aligned to the workforce.
Participation in our defined contribution pension scheme, or cash payments in lieu of pension contributions, payable in monthly instalments during the year, directly to the individual or into their pension scheme.
Executive Directors employed before 30 June 2019The employer contribution to a pension scheme and/or cash allowance will be frozen at the monetary value for the 12 months ending 30 June 2020. Alignment to the workforce will be reviewed at the next policy renewal.
Executive Directors employed after 1 July 2019The company contribution to a pension scheme and/or cash allowance will be up to a maximum of 12% of base salary, in line with the level of contribution offered to the wider workforce.
None
Variable remuneration (in addition to “Fixed remuneration” elements above)The total remuneration package is designed to ensure that a significant portion of the maximum opportunity for any Executive Director is at risk if key performance targets are not met. The design of the short-term and long-term incentives mean that the majority of an Executive Director’s total remuneration is dependent upon performance and delivered over a three- to five-year period.
The aggregate maximum incentive opportunity that shall be eligible to be awarded in any year to an Executive Director from the Annual Management Bonus and any longer-term incentive shall not exceed 320% of salary. However, to reflect the nature of the Company’s strategy and/or the evolution of its performance horizon over each Asset Management Plan period, the relative split of this aggregate incentive opportunity between the Annual Management Bonus and any longer-term incentive may vary from year to year.
Thames Water Combined Report 2019/20 113Strategic report Governance Financial statements Annual performance report

Executive Directors’ remuneration policy continued
Element of remuneration Operation Maximum opportunity Performance conditions
Annual Management BonusPurpose and link to strategyTo motivate and incentivise the Executive Director to achieve the Company’s key annual financial, customer and operational priorities, providing a direct link between annual performance and reward.
Bonuses are based on customer service, customer and environmental delivery, business culture, safety and financial performance, over a performance period of one financial year and are paid in cash.
The performance measures and targets for the annual bonus are selected annually to align with the business strategy and the key drivers of performance set under the regulatory framework.
Targets are set to deliver stretching performance for customers and other stakeholders, considering: the operating environment and priorities; customer, shareholder and regulatory expectations; and the business plan for the year ahead.
Other than in exceptional circumstances (e.g. a turnaround situation) bonus payments above target (50% of maximum) will only be paid out for performance above business plan.
Clawback provisions apply for a period of two years after any payment is made, in the event of financial misstatement, error in calculation, or gross misconduct.
The maximum annual bonus opportunity shall be agreed by the Committee at the start of each year, subject to the aggregate incentive award opportunity limit set out above this table (i.e. taking into account the opportunity awarded under any longer-term incentive plan).
The on-target opportunity shall be no more than 50% of the maximum opportunity.
Committee DiscretionAny payment remains subject to the absolute discretion of the Board to reduce it in whole or in part. If overall performance is not satisfactory, the award for any year may be reduced or forfeited, at the absolute discretion of the Committee and Board.
In exceptional circumstances, the Committee retains the discretion to:
• Change the performance measures and targets and the weighting attached to them part way through a performance year if there is a significant and material event which causes the Committee to believe the original measures, weightings or targets are no longer appropriate; and
• Make downward or upward adjustments to the amount of bonus resulting from the application of the performance conditions, if the Committee believes that the bonus outcomes are not a fair and accurate reflection of business performance.
The annual weighting of the bonus measures may vary depending on the key priorities of the business for the year ahead.
Details will be disclosed in the Annual Report on Remuneration for the relevant year.
Thames Water Combined Report 2019/20 114Strategic report Governance Financial statements Annual performance report

Executive Directors’ remuneration policy continued
Element of remuneration Operation Maximum opportunity Performance conditions
Longer-term Incentive (e.g. LTIP)Purpose and link to strategyIncentive schemes with performance periods longer than one year, incentivising performance that is aligned to the business strategy over the longer term and the creation of stakeholder value. These schemes act as a tool to retain and incentivise executives to deliver the long-term business strategy.
Executive Directors are eligible to participate in the LTIP. This is a non-contractual, discretionary scheme.
The Committee considers annually whether it will make an award under the LTIP, the performance period for which will normally be three financial years other than in exceptional circumstances.
The award will normally vest three years after the date of grant subject to the achievement of the performance conditions and will be paid in cash. The Committee may recommend, and the Board may approve, alternative arrangements (e.g. with a shorter or longer performance and/or vesting horizon) where a three year LTIP is not viewed as appropriate in the context of the Company’s strategy and/or regulatory framework.
Clawback provisions apply for a period of two years after any payment is made, in the event of financial misstatement, error in the calculation or gross misconduct.
For awards granted from 1 April 2020 onwards, a withholding period may apply to vested awards for an additional period of up to two years following the end of the performance period. The structure of any withholding period will be communicated to participants at the time of grant and detailed in the Annual Report on Remuneration. Vested but withheld payments are normally not subject to forfeiture if an individual leaves Thames Water during the withholding period.
The on-target and maximum annual potential opportunities shall be agreed by the Committee at the start of each year, subject to the aggregate incentive award opportunity limit set out above this table (i.e. taking into account the award opportunity under the Annual Management Bonus).
The on-target opportunity shall be no more than 50% of the maximum opportunity; the pay-out for meeting the threshold performance level set by the Committee shall normally not be more than 25% of the maximum award opportunity.
Committee DiscretionAny payment remains subject to the absolute discretion of the Board to reduce it in whole or in part. If overall performance is not satisfactory, the award for any year may be reduced or forfeited, at the absolute discretion of the Committee and Board.
In exceptional circumstances the Committee retains the discretion to:
• Change the performance measures and targets and the weighting attached to the performance measures and targets part way through the performance period if there is a significant and material event which causes the Committee to believe the original measures, weightings or targets are no longer appropriate;
• Make downward or upward adjustments to the level of incentive pay-out resulting from the application of the performance conditions, if the Committee believes that the outcome is not a fair and accurate reflection of business performance; and
• Reduce (in part or in whole) or cancel vested but withheld payments during the withholding period.
The performance measures, weightings and targets will be determined and approved by the Committee at the start of each cycle, taking into account shareholder, customer and regulatory expectations.
Details will be disclosed in the Annual Report on Remuneration for the relevant year.
Thames Water Combined Report 2019/20 115Strategic report Governance Financial statements Annual performance report
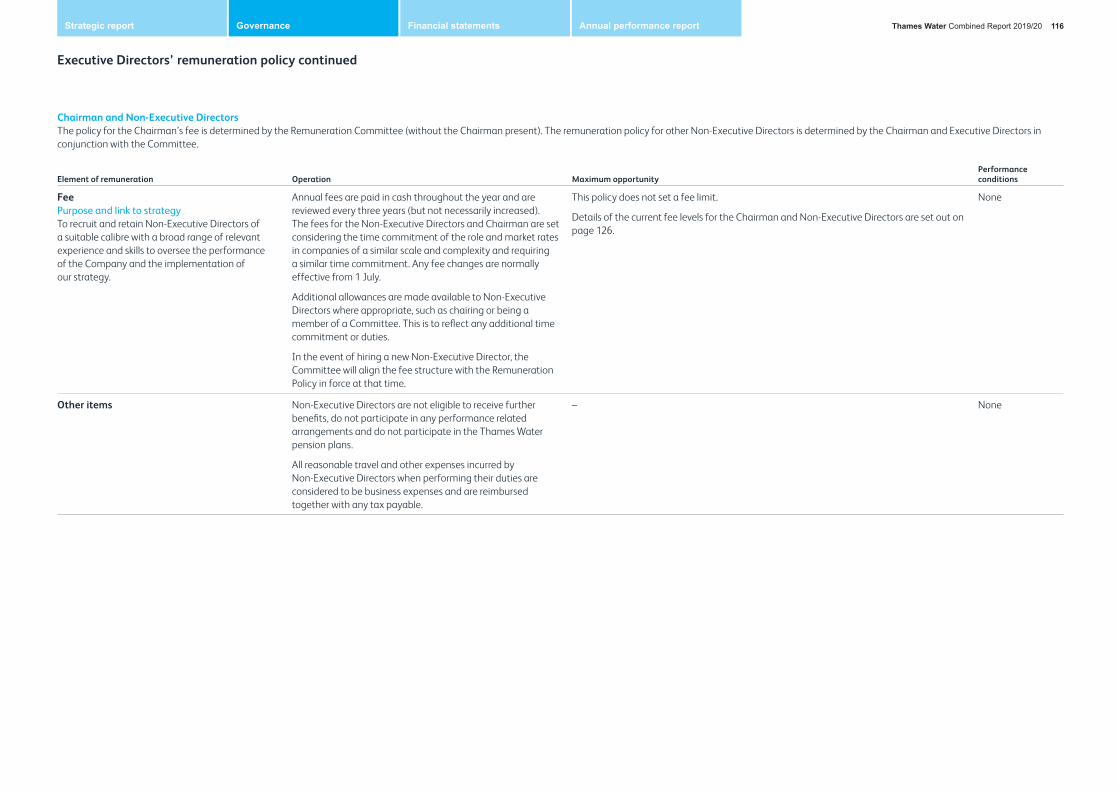
Chairman and Non-Executive DirectorsThe policy for the Chairman’s fee is determined by the Remuneration Committee (without the Chairman present). The remuneration policy for other Non-Executive Directors is determined by the Chairman and Executive Directors in conjunction with the Committee.
Element of remuneration Operation Maximum opportunity Performance conditions
FeePurpose and link to strategyTo recruit and retain Non-Executive Directors of a suitable calibre with a broad range of relevant experience and skills to oversee the performance of the Company and the implementation of our strategy.
Annual fees are paid in cash throughout the year and are reviewed every three years (but not necessarily increased). The fees for the Non-Executive Directors and Chairman are set considering the time commitment of the role and market rates in companies of a similar scale and complexity and requiring a similar time commitment. Any fee changes are normally effective from 1 July.
Additional allowances are made available to Non-Executive Directors where appropriate, such as chairing or being a member of a Committee. This is to reflect any additional time commitment or duties.
In the event of hiring a new Non-Executive Director, the Committee will align the fee structure with the Remuneration Policy in force at that time.
This policy does not set a fee limit.
Details of the current fee levels for the Chairman and Non-Executive Directors are set out on page 126.
None
Other items Non-Executive Directors are not eligible to receive further benefits, do not participate in any performance related arrangements and do not participate in the Thames Water pension plans.
All reasonable travel and other expenses incurred by Non-Executive Directors when performing their duties are considered to be business expenses and are reimbursed together with any tax payable.
– None
Executive Directors’ remuneration policy continued
Thames Water Combined Report 2019/20 116Strategic report Governance Financial statements Annual performance report

Executive Directors’ remuneration policy continued
Notes to Policy TablesSetting pay levels and principlesA basic principle of this policy is to offer remuneration commensurate with packages provided by other companies of similar size and complexity, taking into account an individual’s contribution and experience. To fulfil this principle, we benchmark all remuneration elements (including basic salary, benefits, pension, short-term and long-term incentives) periodically against a basket of comparator groups, including:
• Other water and sewerage companies (WASCs);
• FTSE-listed companies ranked 50 to 100 (excluding Financial Services); and
• A bespoke group of companies of similar size and complexity.
Clawback and Withholding provisionsClawback provisions apply to the Executive Directors’ incentive arrangements. The Committee has discretion to reclaim or claw back some (or all) of the incentive awards paid to individuals for up to two years following payment with respect to the Annual Management Bonus and LTIP. Circumstances in which the Committee may apply clawback include, but are not limited to, a material misstatement, any error in the calculation of an award or an error in the underlying results that leads to an overpayment of any bonus or incentive payment, or material misconduct.
To enhance the long-term alignment between customers, stakeholders and Executive Directors’ interests, LTIP awards granted after 1 April 2020 may be required to be withheld for an additional period of up to two years following the end of the performance period. During the vesting and withholding periods, the Committee shall have the discretionary powers to adjust the value of the awards or cancel the awards in certain circumstances (‘malus’).
Remuneration Committee discretionAll elements within the policy are subject to the discretion of the Committee.
In relation to incentives, the Committee will operate all incentive plans according to the rules of each respective plan and the discretions contained therein. The discretion available to the Committee covers aspects such as:
• The timing of the grant and vesting of awards;
• Performance criteria and targets;
• Determining the size of the award;
• Determining the outcome of an award;
• The treatment of leavers;
• Retrospective adjustment of awards; and
• In exceptional circumstances, the discretion to adjust previously set targets for an incentive award if events happen which cause the Committee to determine that it would be appropriate to do so.
All assessments of performance are ultimately subject to the Committee’s judgement. Where any discretion is exercised, the fact and the rationale will normally be disclosed in the relevant Annual Report on Remuneration.
Approach to recruitment remuneration Executive DirectorsThe Committee and Board approve the remuneration to be offered to Executive Directors on recruitment. The remuneration package offered will be in line with the market and will be no more than is necessary to attract appropriate candidates to a role. Any new Executive Directors’ remuneration would include the same elements, and be subject to the same limits, as those for existing Executive Directors (as set out on pages 112-115 of this report).
Element Policy and Operation
Base salary Salaries set by the Committee taking into consideration factors including the current pay for other Executive Directors, the experience, skill and current pay level of the individual and the external market.
Benefits The Committee will offer a benefits package in line with our benefits policy for Executive Directors.
Pension Maximum contribution in line with our policy.
Incentive opportunity
The aggregate maximum incentive opportunity that shall be eligible to be awarded in any year (i.e. across the Annual Management Bonus and LTIP) shall not exceed 320% of salary.
Annual Management Bonus
On-target and maximum bonus potential set in line with the Company’s policy for existing Executive Directors. The on-target bonus opportunity shall be 50% of the maximum opportunity. Bonus will be prorated to the number of working days worked during the plan year, typically with a minimum threshold of three months service in line with scheme rules.
Longer-term incentive plan (LTIP)
On-target and maximum award opportunities set in line with the Company’s policy for existing Executive Directors. If the individual joins the Company during the LTIP performance period, or alternative longer-term scheme approved by the Board, the individual may have the opportunity to participate in the next LTIP / alternative scheme, normally in April of each year. At the Committee’s absolute discretion, the individual may also have the opportunity to participate in the current LTIP / alternative scheme.
Buy-out awards for forfeited remuneration
At the discretion of the Committee, additional payments may be made to a new Executive Director, to replace forfeited remuneration opportunities and/or awards when leaving a previous employer.
In determining the structure and level of any ‘buyout’ award, the Committee will take account of relevant factors including any performance conditions attaching to forfeited awards, the likelihood of the awards vesting and the form and timing of the awards. The Committee will typically seek to make buy-out awards on a comparable basis to those that have been forfeited.
In exceptional circumstances, the Committee may grant a buy-out award under a structure not included in the policy but that is consistent with the principles set out above.
Internal Promotion
In the case of an internal appointment, any pay element awarded in respect of the prior role would be allowed to pay out according to the terms on which it was originally granted.
Relocation Assistance may include (but is not limited to) removal and other relocation costs, housing or temporary accommodation.
Thames Water Combined Report 2019/20 117Strategic report Governance Financial statements Annual performance report

Executive Directors’ remuneration policy continued
Policy on payments for loss of office and on change of controlThe following table sets out the key features of the service contracts and payment in the event of loss of office for Executive Directors, or on a change of control. In addition, the Committee retains the discretion to settle any other amount reasonably due to the Executive Director, for example to meet legal fees incurred by the Executive Director in connection with the termination of employment.
Element Policy and Operation
Notice periods in Executive Director contracts
12 months from the Company, 6 months from the Executive Director.
Executive Directors may be required to work during the notice period or may be provided with pay in lieu of notice or placed on “garden leave” at the discretion of the Company.
Termination payments
Any payment as compensation for loss of office will be made at the complete discretion of the Board on recommendation from the Committee.
If the Company wishes to terminate an Executive Director’s contract, other than in circumstances where the Company is entitled to summarily dismiss an Executive Director, it is required to give either 12 months’ notice or make a payment in lieu of base salary only.
If the reason for dismissal is redundancy, the Executive Director would be entitled to a statutory redundancy payment.
Annual Management Bonus
In accordance with the scheme rules of the Annual Management Bonus plan, an Executive Director is eligible to a bonus payment subject to being employed by the Company on the ‘Payment Date’.
An individual will normally not be eligible for any bonus payment for the plan year if they leave the employment of the Company or have been dismissed prior to the Payment Date unless for a Good Leaver reason (below).
Good Leaver* ReasonPerformance conditions will be measured at the normal bonus measurement date. Bonus will normally be pro-rated for the period of service during the financial year.
Leavers who have left through compulsory redundancy having completed the full bonus year remain eligible for a payment even if they are not employed on the Payment Date.
Payments are made on normal Payment Date and are based on actual performance.
Other reasonIf the individual is subject to formal disciplinary or capability procedures then eligibility for an incentive payment will be postponed pending the conclusion of any such procedure.
Change of controlNormal policy is to pro-rate the bonus for time and performance to date of change of control. In circumstances where there is an appropriate business case, the Committee may use discretion to determine that the award shall not be pro-rated for time. Use of any discretion will be explained to stakeholders.
Element Policy and Operation
Longer-Term Incentive Plan (e.g. LTIP, Transformation Incentive)
An Executive Director is eligible to a payment from the LTIP (or an alternative longer term incentive) in accordance with the scheme rules of the plan.
Good Leaver* ReasonPerformance conditions will be measured at the award measurement date. An LTIP or alternative award will normally be pro-rated for the period of service during the performance period.
If the individual leaves after the award has vested but before any payment in respect of that award, then the relevant payment will continue to be made in the normal way.
Payments are made on the normal payment date (taking into account any withholding periods that apply to awards made after 2020) and are based on actual performance.
Other reasonLapse of any unvested LTIP or alternative awards. Not eligible for any payment for the plan year if the individual leaves the employment of the Company or has been dismissed prior to the payment date.
If the individual is subject to a formal disciplinary procedure or has been subject to the Company’s capability procedure, then eligibility for a bonus payment will be postponed pending the conclusion of any such investigation and any subsequent disciplinary hearing or capability meeting.
Change of controlUnvested incentive awards will normally be pro-rated for time and take into account performance to date of change of control. In circumstances where there is an appropriate business case, the Committee may use discretion to determine that the award shall not be pro-rated for time. Use of any discretion will be explained to stakeholders.
* Good leavers are defined (as per the scheme rules) as an individual whose employment is terminated by the Company because of ‘special circumstances’ such as ill-health, injury or disability, redundancy or whose employment terminates automatically by reason of their death. The Committee also retains an overall discretion to determine that an individual is a good leaver.
Thames Water Combined Report 2019/20 118Strategic report Governance Financial statements Annual performance report
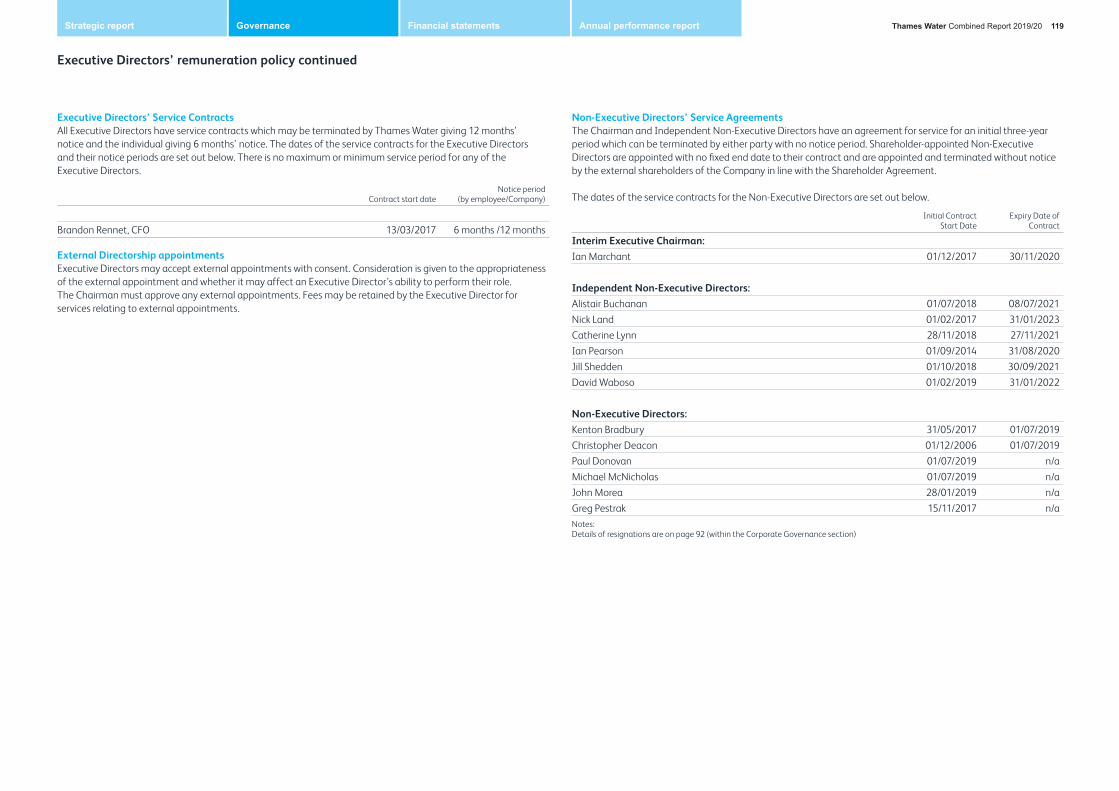
Executive Directors’ remuneration policy continued
Executive Directors’ Service ContractsAll Executive Directors have service contracts which may be terminated by Thames Water giving 12 months’ notice and the individual giving 6 months’ notice. The dates of the service contracts for the Executive Directors and their notice periods are set out below. There is no maximum or minimum service period for any of the Executive Directors.
Contract start dateNotice period
(by employee/Company)
Brandon Rennet, CFO 13/03/2017 6 months /12 months
External Directorship appointmentsExecutive Directors may accept external appointments with consent. Consideration is given to the appropriateness of the external appointment and whether it may affect an Executive Director’s ability to perform their role. The Chairman must approve any external appointments. Fees may be retained by the Executive Director for services relating to external appointments.
Non-Executive Directors’ Service AgreementsThe Chairman and Independent Non-Executive Directors have an agreement for service for an initial three-year period which can be terminated by either party with no notice period. Shareholder-appointed Non-Executive Directors are appointed with no fixed end date to their contract and are appointed and terminated without notice by the external shareholders of the Company in line with the Shareholder Agreement.
The dates of the service contracts for the Non-Executive Directors are set out below.
Initial Contract
Start DateExpiry Date of
Contract
Interim Executive Chairman: Ian Marchant 01/12/2017 30/11/2020
Independent Non-Executive Directors: Alistair Buchanan 01/07/2018 08/07/2021Nick Land 01/02/2017 31/01/2023Catherine Lynn 28/11/2018 27/11/2021Ian Pearson 01/09/2014 31/08/2020Jill Shedden 01/10/2018 30/09/2021David Waboso 01/02/2019 31/01/2022
Non-Executive Directors:Kenton Bradbury 31/05/2017 01/07/2019Christopher Deacon 01/12/2006 01/07/2019Paul Donovan 01/07/2019 n/aMichael McNicholas 01/07/2019 n/aJohn Morea 28/01/2019 n/aGreg Pestrak 15/11/2017 n/aNotes:Details of resignations are on page 92 (within the Corporate Governance section)
Thames Water Combined Report 2019/20 119Strategic report Governance Financial statements Annual performance report

Executive Directors’ remuneration policy continued
Directors’ remuneration in the context of wider workforce remunerationThe Company’s philosophy is to provide a fair and consistent approach with pay and benefits for our workforce aligned as per the remuneration arrangements for Executive Directors to delivering outstanding outcomes for our customers and stakeholders.
The Remuneration Committee invites the HR Director to present proposals for the annual salary review for managers and employees (including the Executive team) in February each year. Any other changes to remuneration policy within the Company are presented as and when they arise. The Remuneration Committee takes into account the salary increases and remuneration arrangements for the wider employee population when approving the salary increases and remuneration arrangements for Executive Directors. For other Executive team members, the Committee reviews and approves all incentive elements.
Ian Pearson has been appointed as the Non-Executive Director responsible for workforce engagement. This appointment gives the Board an opportunity to discuss with the wider workforce its views on a range of subjects, including the remuneration policy, how this impacts the Company’s culture and, in particular, how it strengthens the link between outcomes for customers and reward. The existing employee engagement survey ‘Hear for You’ is carried out annually and includes metrics on remuneration and leadership. Feedback from the survey is used in the Committee’s decision-making.
In addition, regular discussions take place with trade union and employee representatives on pay and benefits, for employees covered by collective bargaining as well as the wider employee population.
The Company’s defined benefit schemes have been closed to new members since April 2011. All new employees have the option (subject to auto-enrolment provisions) to join the Company’s Stakeholder scheme which is defined contribution. Following the review of our remuneration policy, the pension entitlement, for all new executives employed from 1 July 2019 or those executives receiving updated terms and conditions, are aligned to the workforce. In addition, the entitlement for other executives (i.e. those employed before 1 July 2019) have been capped in line with the policy for Executive Directors, and will be further reviewed at the next Remuneration Policy review.
Share in Your Success 2020 for all non-manager grade employeesIn 2020 all employees in non-managerial grades were eligible for delivery of the transformation plan under an incentive called “Share in Your Success 2020”. The objectives and measures for this payment are the same as those detailed in the Transformation Incentive relating to customer service performance, leakage, environment performance, asset health with an additional financial element (EBITDA) over the three-year period from 2017-2020.
Eligible employees are automatically enrolled into this incentive programme and the payment is awarded pro rata to service during the performance period on delivery of the objectives, subject to employees being in service at the payment date.
Together these incentives and payments demonstrate the Company’s commitment to providing a coherent and aligned approach to rewarding delivery of excellent customer, regulatory and stakeholder performance. For the Share in Your Success 2020, the outcome of circa 60% of maximum produces above target payments of circa 3% of basic salary for non-manager grade employees. This payment will be paid at the same time as incentive payments for all other managers within the Company in July 2020.
Consideration of the views of other stakeholdersThames Water is a privately-held organisation, with external shareholder representation on the Board of Directors and its committees (including the Remuneration Committee). This governance structure ensures that the Committee’s decision-making is subject to the direct input of external shareholder representatives and can take into account the views of other external shareholders as part of the normal course of business. The Committee also keeps under review executive remuneration at Thames Water in the context of developments in the wider remuneration governance landscape, including trends in generally-accepted best practice, the views of the wider investment community and their representative bodies, as well as those of our regulator, Ofwat.
Thames Water Combined Report 2019/20 120Strategic report Governance Financial statements Annual performance report

Annual Report on Remuneration
This section has been prepared in accordance with the Large and Medium-sized Companies and Groups (Accounts and Reports) (Amendment) Regulations 2013 and 2018 amendments. The information has been audited as indicated.
Single total figure of remuneration for Executive and Non-Executive Directors (audited) for 2019/20 and 2018/19
Salary/Fees£’000
Taxable Benefits£’000
Annual bonus £’000
LTIP/Transformation
Incentive£’000
Pension related benefit£’000
Total Group£’000
2020 2019 2020 2019 2020 2019 2020 2019 2020 2019 2020 2019
S Robertson1 153 610 5 17 – – – – 38 153 196 780 B Rennet2 413 363 15 83 407 448 530 – 103 91 1,468 985 Interim Executive Chairman:I Marchant3 596 325 – – – – – – – – 596 325 Independent Non-Executive Directors:A Buchanan 70 48 – – – – – – – – 70 48 N Land 75 75 – – – – – – – – 75 75 C Lynn 70 24 – – – – – – – – 70 24 I Pearson 70 60 – – – – – – – – 70 60 J Shedden 70 35 – – – – – – – – 70 35
D Waboso 70 12 – – – – – – – – 70 12 Non-Executive Directors:K Bradbury4 15 50 – – – – – – – – 15 50 C Deacon5 15 60 – – – – – – – – 15 60 P Donovan6 45 n/a 45 n/aM McNicholas7 58 n/a 58 n/aJ Morea 60 11 – – – – – – – – 60 11 G Pestrak 60 50 – – – – – – – – 60 50 Total 1,840 1,723 20 100 407 448 530 – 141 244 2,938 2,515 Notes:1 Steve Robertson’s remuneration for 2019/20 reflects annual salary, car allowance £3,750, annual pension of 25% of salary and around
£900 for medical benefits for his time in office until 24 May 2019. Details of Steve Robertson’s remuneration on departure are set out in the Payments for Loss of Office section in this report.
2 Brandon Rennet’s remuneration for 2019/20 reflects annual salary (£375,000 for three months and £425,000 for nine months), car allowance £12,500, annual pension of 25% of salary and around £2,200 for medical benefits.
3 Ian Marchant’s remuneration for 2019/20 reflects annual salary (£325,000 for two months and £650,000 for 10 months to reflect his role as Interim Executive Chairman).
4 Kenton Bradbury’s fee pro-rated to end of contract date 1 July 2019.5 Christopher Deacon’s fee pro-rated to end of contract date 1 July 2019.6 Paul Donovan’s fee pro-rated to start of contract date 1 July 2019. 7 Michael McNicholas’ fee pro-rated to start of contract date 1 July 2019.
The above emoluments are not inclusive of payments for loss of office for Steve Robertson and Nick Fincham, which together totalled £2.4 million (see note 4). Further details are in the payment for loss of office section on page 123.
Of the total Executive Directors’ remuneration of £1,664,000 (2019: 2,483,089), £1,248,000 (2019: £1,738,162) is for the Executive Directors for their services to Thames Water Utilities Limited and has been disclosed within note 4 to the financial statements. In addition, the Executive Directors received total remuneration of £416,000 (2019: £744,927) for their services to other companies within the Kemble Water Holdings Limited Group. No operational distinction is made between services provided by the Directors to one or the other.
Additional requirements in respect of the single total remuneration figure tableBase salary (audited)Base salaries are a fixed sum payable monthly in arrears. For the Executive Directors, these are reviewed annually, taking into account their individual performance, the external market and internal and external economic factors, with any changes taking effect from 1 July each year.
CEO/Interim Executive ChairmanThere was no salary increase for Steve Robertson. When Ian Marchant was appointed as the Interim Executive Chairman, his annual fee was adjusted from £325,000 to £650,000 and will revert to £325,000 following the appointment of the new CEO.
Chief Financial Officer (CFO)Brandon Rennet’s base salary increase of 13% from 1 July 2019 reflected the increased accountabilities of his role during the year (including the expansion of his department to cover all commercial activities including procurement) and the Committee’s policy to bring Brandon’s salary (which was intentionally set below market on appointment) more into line with the desired market positioning over time, subject to performance.
BenefitsFor Steve Robertson and Brandon Rennet, benefits are unchanged from 2018/19. These benefits are a car allowance of £12,500 (£15,000 for CEO) and private medical insurance.
Annual Management Bonus (audited) For 2019/20, all managers of the Company, excluding Steve Robertson and Ian Marchant, were eligible to participate in the Annual Management Bonus plan. The maximum opportunity for Executive Directors was 200% of salary. The performance period was from 1 April 2019 to 31 March 2020 with the potential for a payment in July 2020.
The 2019/20 Annual Management Bonus scheme was assessed by the Remuneration Committee and approved by the Board against a number of performance areas as follows:
Thames Water Combined Report 2019/20 121Strategic report Governance Financial statements Annual performance report

Annual Report on Remuneration continued
Annual Management Bonus 2019/20
Bonus Element Objective
Element as % of
Total Bonus Opportunity Threshold Target Stretch
Approved outcomes*
% of Element payable
% Bonus
Payable
Customer Service
Customer Complaints
15%
10% reduction to 19,480
Wholesale – 10,267Revenue – 9,213
15% reduction to 18,399
Wholesale – 9,697Revenue – 8,702
20% reduction to 17,315
Wholesale – 9,126Revenue – 8,189 -5% 0.0% 0.0%
Customer Delivery
Sewer Flooding Other Causes (SFOC) 2.5% 1,085 1,065 1,020 1,058 57.8% 1.4%
Security of Supply – Supply Interruptions (SI4) 2.5% 8.4 mins 7.8 mins 7.2 mins 7.38 85.0% 2.1%
PR19 Deliver successful PR19 outcome 10% Acceptable outcome based on Board feedback 15% 15.0% 1.5%
Financial Group EBITDA adjusted (millions) 10% 998 1,018 1,038 1,004 32.5% 3.3%
Gross OPEX annualised run rate achieved through actions taken by 31 March 2020 (millions) 10% 120 140 160 136.7 45.9% 4.6%
Personal Annual personal performance assessment** 50% 70% 70% 35.0%
Total payable 100% 47.9%
* The Committee reviewed performance outcomes and recommended the level of bonus payable for Board approval in May 2020. This was prior to the completion of the final audit of some elements and as such in some cases these outcomes vary from those included elsewhere in this report, such as customer complaints, and the supply interruptions of 4 hours.
** Personal: Brandon Rennet achieved 70% of his personal objectives.
Following the departure of the CEO in May 2019, the Committee approved an adjustment to the published Annual Management Bonus scheme to incentivise the remaining Executive team members to deliver against the significant challenges during the remainder of the year. Following this change 50% of the maximum bonus was based on as assessment of effective teamwork and delivery of both personal and corporate objectives. Evidence was submitted to the Committee covering a full range of performance outcomes and team working and this was assessed at 70% of maximum.
Customer Service: While there was a significant improvement in the level of water complaints, customer complaints including waste and revenue complaints increased year-on-year. There is no payment for this bonus element.
Customer Delivery: The Sewer Flooding (Other Causes) outcome was 57.8% of target. The Supply Interruptions of 4 hours outcome was 7.38 minutes which was 85% of maximum.
PR19 Preparation: Following detailed consideration of the PR19 outcome the Remuneration Committee assessed this element as being at threshold – however, reduced the formulaic pay out from 25% to 15% to reflect concerns raised regarding the process and the outcome for external shareholders.
Financial: Outturn of earnings before interest, tax, depreciation and amortization (EBITDA) was 32.5% of maximum which is between threshold and target. The run rate of transformation plans outcome was £136.7m which is between threshold and target and the Opex run rate outcome was 45.9% of maximum.
Team effectiveness/personal: Executive team effectiveness was identified as having supported delivery of the company’s strategic priorities in 2019/20, specifically linked to leakage, supply interruptions, water quality, waste treatment and sewer flooding as well as the delivery of critical programmes including, cost transformation and “Spring”. The outcome was determined between target and stretch at 70% of maximum.
As a result of this performance, Brandon Rennet, our Chief Financial Officer, will receive an Annual Management Bonus pay out at 47.9% of the maximum (2018/19 outcome: 59.7% of maximum). This outcome produces a payment of £407,209 which will be made in July 2020 at the same time as bonus payments for all other managers within the Company.
Transformation Incentive (2018/20) (audited)The Transformation Incentive was awarded at the discretion of the CEO to other Executive Directors, the whole Executive Team and invited senior managers. The plan was based on performance over a 2-year period from 1 April 2018 to 31 March 2020. The targets were focused on critical customer environmental, operational and regulatory outcomes. /
Bonus Element Objective
Element as % of
Total Bonus Opportunity Target Stretch
Approved outcomes*
% of Element payable
% Bonus
Payable
Leakage Target Leakage Ml/d Delivery 40.0% 606 576 595 68.3% 27.3%
Environmental Performance
Environmental Performance Assessment
20.0% 3 Stars and on track for 4
Stars
4 Stars 3 Stars 25% 5.0%
Asset Health Asset Health Measures 20.0% Waste Water Waste Water Waste Water 100% 20%
Customer Service
Project Spring: Customer migration delivered on stable platform by 31 March 2020
10.0% 80% of customers
90% of customers
92% delivered ahead of time and on target
100% 10%
Non-contactor NPS 10.0% -19 -17 Q4 = -24Ave 2019/20 =
-18.25
0% 0.0%
Total payable 100% 62.3%
* The Committee reviewed performance outcomes and recommended the level of bonus payable for Board approval in May 2020. This was prior to the completion of the final audit of some elements and as such in some cases these outcomes vary from those included elsewhere in this report e.g. customer service.
Note: From April 2019, the Committee approved a change to the Customer Service target from Contactor Net Promoter Score to the delivery of a critical milestone in the Spring programme. This change was brought about because we ceased measuring Contactor NPS. The new target was the successful migration of 80% of customers onto a stable platform by 31 March 2020 within budget. Stretch was set at 90% of customers migrated.
There has been a record in year improvement in leakage which has resulted in an outcome of 595 Ml/d. For Customer Service, 3.4 million accounts were transferred to our new billing platform, meaning 94% completion and on target. While the Non-Contactor NPS averaged -18.25 during the year, the final quarter resulted in an outcome of -24 following the wet weather impacts on waste. No bonus is payable on this element. All Asset Health segments were stable as at March 2020. With respect to the Environmental Performance Assessment, the outcome of the EPA was for all elements at green, which meant that stretch target was achieved.
Thames Water Combined Report 2019/20 122Strategic report Governance Financial statements Annual performance report

Annual Report on Remuneration continued
As a result of this performance, Brandon Rennet, our Chief Financial Officer, will receive a Transformation Incentive scheme pay out at 62.3% of maximum potential incentive. This outcome produces a payment of £529,550 which will be made in July 2020.
Long Term Incentive Plan (“LTIP”)There is no LTIP payment due for the period 2019/20.
Total pension entitlements (audited)The Executive Directors are currently eligible to participate in the Company’s defined contribution pension scheme, with the Company making contributions up to a maximum of 12% of base salary, for those appointed after 1 July 2019, to align with the wider workforce. No element of Annual Management Bonus, Transformation Incentive Scheme or LTIP is pensionable. Executive Directors may choose to receive a cash allowance in lieu of these pension contributions. For 2019/20, Steve Robertson and Brandon Rennet elected to receive only a cash allowance. None of the Executive Directors participate in either of the defined benefit pension schemes.
Payment for loss of office (audited)As indicated earlier in the report, Steve Robertson stepped down as Chief Executive Officer at the end of May 2019 according to agreed terms. In accordance with our Remuneration Policy, Steve continued to receive his contractual entitlements until 30 June 2019 when he ceased to be an employee of Thames Water (these payments are included in the relevant columns for 2020 in the single total figure of remuneration table). In addition, Steve received a contractual payment in lieu of notice of £777,500 for the 12-month notice period consisting of base salary, car allowance and pension cash allowance. An additional £2 million was paid in respect of loss of office. This additional £2 million cost will not be passed onto customers but funded through earnings generated from the non-appointed business (i.e. amounts that would be due to external shareholders). In order to preserve the Company’s gearing ratio, £2 million cash was received from Thames Water Limited, via the Company’s immediate parent company, Thames Water Utilities Holdings Limited.
As reported in last year’s remuneration report, Strategy and Regulation Director, Nick Fincham, stepped down as an Executive Director from the Board at the end of March 2019. Nick remained a member of the Executive team to complete the PR19 process and he left the Company on 31 March 2020. A final payment of £371,681 for termination of employment was paid to him on his departure.
Payments to past Directors (audited)No payments were made to past Directors other than those payments detailed above and in the single total figure of remuneration table as being made to Directors who resigned during the year and ceased to be employed by the Company as at 31 March 2020.
Incentive awards granted in 2019/20During the year, awards were granted under a three year LTIP covering the performance period 2019-2022, details of which were set out in the 2018/19 Annual Report (referred to as LTIP 2019/20). In addition, and to recognise the material additional responsibilities undertaken to support the Interim Executive Chairman during the period of transition to a new CEO, the CFO was granted an additional incentive of 100% of current basic salary on condition that he remained in employment until 30 June 2020 or six months following the appointment of a new CEO.
CEO remuneration compared to employeesPercentage change in CEO remuneration compared to employees The figures below present the percentage change in CEO remuneration from 2019/20 to 2018/19, by comparison to all employees in the Company, showing remuneration on a like-for-like basis to the prior year.
Employee Group Base salary Bonus Taxable Benefits
Change in CEO remuneration (5.3%)1 n/a2 n/a3
Change in employee remuneration 2.7%4 (19.0)%5 4.4%1 Ian Marchant received no pension or car allowance. To give a clearer view on the material changes in year, we have compared Steve
Robertson’s pro-rated fixed payments 2019/20 (base salary, pension, and car allowance) plus Ian’s Marchant’s pro-rated fee 2019/20 to Steve Robertson’s full year 2018/19 fixed payments. The actual base salary change was a 13.8% increase while taxable benefits reduced by 75%.
2 Steve Robertson did not receive a bonus payment for 2019/20 and Ian Marchant was not eligible for a bonus payment for 2019/203 The annual cost of Steve Robertson’s benefits did not increase year on year. Ian Marchant was not eligible for any benefits4 Incudes promotional increases. The headline salary increase for employees was 2.7%5 This applies to the Annual Management Bonus plan where all managers of the Company, excluding the Interim Executive Chairman,
were eligible to participate in this plan. The number of employees eligible for bonus increased by 5.8% year on year.
Ratio of CEO remuneration to average for workforceAs in previous years, we set out below the pay ratio between the CEO and the wider Thames Water employee population. We have decided to use the Department of Business, Energy and Industrial Strategy (BEIS) methodology’s Option A. This includes all remuneration elements such as overtime, long service awards and benefits.
The table below provides the ratio between the CEO single figure total remuneration and the median, 25th and 75th percentile total remuneration of all Thames Water’s full-time equivalent employees as at 31 March 2020. The CEO’s median pay ratio is broadly similar to the median 2019 pay ratio, with the slight decline year-on-year a result of the change in CEO incumbent (as Ian Marchant is not eligible for any incentive payments in his role as Interim Executive Chairman). The Committee is mindful that the year-on-year trend is likely to continue to evolve as a result of the CEO transition, and will keep under review the trend in the published pay ratio in this context.
Year Method25th percentile
pay ratioMedian
pay ratio75th percentile
pay ratio
2020 Option A 25:1 19:1 14:12019 Option A 29:1 21:1 15:1
Thames Water Combined Report 2019/20 123Strategic report Governance Financial statements Annual performance report

Annual Report on Remuneration continued
The table below shows the salary and total pay and benefits for the employees at the 25th, 50th and 75th percentiles.
Year Method 25th percentile 50th percentile 75th percentile
2020 Salary 24,870 32,173 42,796Total pay and benefits 29,267 39,434 52,697
NotesIn calculating the CEO data, we have used an aggregated figure which is the sum of the amount shown in the single figure table for Steve Robertson in respect of his services from the start of the year to 24 May 2019, and the pro rata fees paid to Ian Marchant in his role as Interim Executive Chairman for the period 1 June 2019 to 31 March 2020. This approach is consistent with legislative requirements.
Total remuneration reflects all remuneration including salary, benefits, employer pension contributions and incentives. Of the three alternatives available for calculating the ratio, we chose to use Option A as it is considered to be the most accurate way of identifying employees at P25, P50 and P75. Under this approach we calculate total remuneration on a full-time equivalent basis for all of our UK employees as at 31 March 2020 and rank them accordingly. No adjustments have been made to the calculation of the total remuneration for these employees from the methodology set out for the CEO’s single total figure remuneration.
Relative importance of spend on payThe following chart sets out the change in total operating profit, external shareholder distributions and overall spend on pay for the year ended 31 March 2020.
0
100
200
300
400
500
600
Total Operating profit Total payroll costs External shareholder distributions
2018/19 2019/20
521.3
577.5
11%
329.1 349.3
6%
0
Shareholder dividends are those made to external shareholders of the Kemble Water Holdings Limited group in respect of the relevant financial year. The Directors believe that this is the most relevant measure to use as a comparison. No distributions were made to external shareholders relating to 2019/20 (2018/19: £nil).
The Committee is mindful of the Covid-19 pandemic and the impact on the Company’s finances. On this basis we’re taking a cautious approach to pay and incentives in 2020/21. The Committee and the Executive team have agreed on no pay increases for managerial roles during 2020/21 and we’re seeking a modest inflationary increase for front line employees.
In addition, Ian Marchant, our Interim Executive Chairman and Brandon Rennet, our CFO, have asked the Company to donate 25% of their salaries for three months to the independent Thames Water Trust Fund. These amounts will be matched and donated by the Company in support for our customers in vulnerable circumstances. The Thames Water Trust Fund is an independent grant making trust which helps customers of Thames Water who are in difficult circumstances, including relating to the impact of Covid-19.
Ian Marchant will continue in his position as Interim Executive Chairman until Sarah Bentley joins the company as CEO, at which point he will revert back to his role as Chairman of Thames Water. Ian Marchant’s annual base fee will remain at £650,000 while he remains in the role as Interim Executive Chairman, following which his annual fee will revert to £325,000.
Remuneration for Sarah Bentley We welcome the arrival of our new CEO, Sarah Bentley over the coming months. A summary of Sarah’s remuneration from appointment (expected to be 1 September 2020) is set out below:
Element of remuneration
Base salary £750,000 per annumPension A contribution of 12% of salary (in line with that available to the wider
employee population)Benefits Car allowance, private medical insurance and life assuranceAnnual Management Bonus For 2020/21, a maximum opportunity of 120% of salary (based 70% on the
scorecard shown and 30% on an assessment of personal performance)LTIP For the 2020/23 cycle, a maximum opportunity of 200% of salary
In addition, and consistent with the provisions of our Remuneration Policy, the Committee agreed to replace in-flight incentive awards that were forfeited by Sarah on her joining Thames Water. Details of this buyout award will be finalised in due course, and disclosed in next year’s Annual Performance Report.
Implementation of remuneration policy in 2020/21
Thames Water Combined Report 2019/20 124Strategic report Governance Financial statements Annual performance report

Annual Management Bonus 2020/21The Annual Management Bonus scheme has been developed in conjunction with the 2020/23 LTIP to directly link reward to the delivery of the critical outcomes for stakeholders and specifically to delivery against the performance commitments in our business plan. The 2020/21 annual bonus aligns all Executives and managers to the delivery of stretching targets set against the strategic business priorities outlined on page 2 including:
• 15% reduction in customer complaints and contacts
• £2 billion to be spent to make improvements for customers in a smart and efficient way
• 50% reduction in supply interruptions and reduction in leakage to less than 570Ml/d.
• 10% reduction in blockages and pollutions
• Launching a new approach to managing our water networks.
In addition, the new “Safe People” elements are designed to incentivise our people to embrace a culture which is engaged in delivering life’s essential services with zero compromise on safety.
Details of the 2020/21 Annual Management Bonus measures including the targets for Executive Directors are detailed below. The on-target bonus opportunity for Executive Directors shall be 50% of the maximum opportunity. The CFO’s maximum opportunity for 2020/21 shall be a maximum opportunity 120% of salary. In all cases total incentive opportunity remains below the cap in the remuneration policy.
Bonus Element Objective Measure
Element as % of Total Bonus
Opportunity Threshold Target Stretch
Customer Service
Customer Complaints 10% -10% -15% -20%
Drive channel shift (improve core processes, complaints, CSAT) End year exit rate reduction of voice to other digital channels
10% 20% 25% 30%
Customer & Environmental Delivery
Supply Interruptions (SI>3) 10% 12 minutes 10 mins 30 seconds
9 minutes 26 seconds
Water Networks transformation 10% TOM proven in pilot
TOM and benefits
approved
TOM approved, contracts awarded, transition complete
Blockages 10% 76,000 75,000 72,500
Safe People Safety – Lost Time Injuries Reduction10%
10% 20% 30%
Safety – Strategic Safety Improvement Assessment
80% delivered 100% delivered >100% delivered
Culture – Improvement in H4U Engagement Score
10% 70% 72% 74%
Financial Group EBITDA (millions) 15% £1,030 £1,040 £1,060
Gross OPEX annualised run rate achieved through actions taken by 31 March 2021
15% £66m £76m £96m
Total 100%
Note:* The structure, quantum and all targets in the 2020/21 Annual Management Bonus scheme will be subject to review by the
Remuneration Committee in the context of the impacts of COVID-19.
LTIP 2020/23As part of its review of the Remuneration Policy and the approach to implementation for 2020/21, the Committee considered in detail the appropriate structure for a long-term incentive for the first three years of AMP7 to support the delivery of our business plan and critical customer and regulatory outcomes. The incentive recommended by the Committee and approved by the Board is a three-year LTIP scheme with a performance period from 1 April 2020 to 31 March 2023. All Executive Directors including the CEO (as well as other selected Executives and Senior Managers) are eligible to participate in the scheme. For the 2020/23 cycle, the on target pay out for the Executive Directors will be 100% of salary, with a maximum pay out of 200% of salary for delivery of stretch targets.
The targets for the LTIP have been set to deliver critical elements of the Company’s stretching business plan and as noted above these complement the annual bonus scheme, focussing on other critical performance commitments. 50% of the targets are focused on the delivery of an overarching “Integrated Performance Assessment” measured using the Return on Regulated Equity (RORE). This assessment provides a measure of successful delivery for customer, the environment and external shareholders since it is impacted by all aspects of our business plan. To provide additional focus on customer and the environment, the LTIP includes additional elements targeting delivery of business plans for customer service, leakage, water quality and pollutions.
An additional element which has been included in this scheme is the application of a “multiplier” for the Integrated Performance Assessment element only. This will have the effect of adjusting any formulaic outturn under this element by up to +/-50% depending on an assessment of Thames Water’s performance against two pre-defined criteria: AMP8 Readiness and the cost and organisation transformation. The Customer and Environmental elements are unaffected by this multiplier and the overall payment will be capped at 100% of maximum incentive.
The application of the multiplier is intended to ensure that participants focus on: (i) delivering Integrated Performance Assessment outcomes as well as the critical transformational changes which will set up Thames Water for AMP 8, and (ii) out-performing stretching customer and environment targets.
Element ObjectiveElement as % of
Total Bonus Threshold Target Stretch
Integrated Performance Assessment
Return on Reglated Equity (RORE)
50.0% 3.1% (3 yr average)
3.4% (3 yr average)
3.9% (3 yr average)
Customer Elements
C-MeX 12.5% 16th 15th 14thLeakage 12.5% Nil penalty/
reward£6.6m
Cumulative Reward
£13.14m Cumulative
RewardEnvironmental Elements
Water Quality Compliance 12.5% 2.07 2.03 1.99Pollutions (Cat 1 to 3) 12.5% 259 245 235
Total as a % of opportunity 100%Notes:RORE includes financing. Subject to ratification against actual outturn for 2019/20 and finalised agreed budget for 2020/21The targets are set in absence of an agreed Business Plan to 2023. Targets will be subject to review once the plan is agreed.The structure, quantum and all targets in the 2020/23 LTIP scheme will be subject to review by the Remuneration Committee in the context of the impacts of the Covid-19 pandemic.
Implementation of remuneration policy in 2020/21 continued
Thames Water Combined Report 2019/20 125Strategic report Governance Financial statements Annual performance report

Implementation of remuneration policy in 2020/21 continued
The 2020/23 LTIP awards for Executive Directors will be subject to an additional withholding period post vesting. Any payment due as a result of the performance conditions being met will be phased over a 2-year period following the end of the performance period, with a third payable shortly after the end of the performance period (typically this will be in July 2023), a further third payable a year later (i.e. in July 2024) and the remaining third payable after a further year (i.e. in July 2025). Malus and clawback provisions will also apply in line with the provisions of the Policy.
Non-Executive DirectorsNED annual fees (audited)The fees for the Interim Executive Chairman and Non-Executive Directors were last reviewed in March 2019.
The Interim Executive Chairman’s annual fee is £325,000 and will remain at this level for 2020/21. As highlighted earlier in the report the Interim Executive Chairman’s annual fee will revert to £325,000 following the arrival of the new CEO.
The base annual fee for Non-Executive Directors is £50,000. There is an additional £10,000 in respect of services as a committee member.
There is an additional £10,000 in respect of services as the role of Chairperson (e.g. Chair of the Customer Service Committee, Remuneration Committee, Health, Safety and Environment Committee, Regulatory Strategy Committee and Workforce Engagement Lead Director). However, there is an additional fee of £15,000 for the Chair of the Audit, Risk and Reporting Committee.
The table below summarises the Non-Executive Director Fees effective from 1 July 2020:
Total annual fees 01/07/2020
Total annual fees 01/07/2019
Percentage increase
Chairman £325,000 £325,000 0%Independent NED / NED (non-committee member) £50,000 £50,000 0%Independent NED / NED (committee member) £60,000 £60,000 0%Chair of the Customer Service Committee / Remuneration Committee / Health, Safety & Environment / Regulatory Strategy Committee / Workforce Engagement Lead Director £70,000 £70,000 0%Chair of the Audit, Risk and Reporting Committee £75,000 £75,000 0%
The Remuneration Committee
Members and attendanceThe Remuneration Committee is currently chaired by Jill Shedden and consists of a mix of Independent Non-Executive Directors and Non-Executive Directors. Half of the directors on this Committee are independent. They are appointed to the Committee on an ongoing basis. The attendance of the members of the Committee during the year is shown on page 108. Ian Marchant, as Interim Executive Chairman, was invited to attend the meetings. As Interim Executive Chairman, Ian Marchant attends meetings as a Committee member.
The role of the CommitteeThe role of the Remuneration Committee is to make recommendations to the Board regarding the remuneration strategy and framework to ensure that the Executive Directors and Senior Management, including the Executive Team, are appropriately rewarded for their contribution to the Company’s performance. The Committee’s activities cover a range of subjects along with Executive Director remuneration, including succession planning and people strategy. It is also responsible for recommending the structure of other aspects of remuneration for all employees, including setting a budget for employee pay reviews, reviewing the appropriateness and effectiveness of employee benefits including pensions, and the structure of incentive arrangements for managers.
Committee activities during the year 2019/20The Remuneration Committee met five times and below are the key remuneration activities for the year ended 31 March 2020:
• Review of updated remuneration policy
• Review and approve Annual Management Bonus 2018/19 pay out recommendations
• Update on pension strategy
• Review and approve Directors’ Remuneration Report
• Review and approve Annual Management Bonus 2019/20 targets
• Review of incentives for senior critical roles
• Update on sustainable pensions
• Review and approve target adjustment for Transformation Incentive
• Review of CEO remuneration benchmarking and recommendation
• Review of executive team pay
• AMP7 remuneration arrangements for key executives
• Review of proposals for Annual Management Bonus proposals for AMP7
• Review and agree AMP7 LTIP design
• Review of proposals for Executive incentives for AMP7
• Review of LTIP 2020 Proposed Targets
• Review of performance against targets for the 2019/20 Annual Management Bonus
• Review of proposals for incentives 2020/21
Thames Water Combined Report 2019/20 126Strategic report Governance Financial statements Annual performance report

Support to the CommitteeTo ensure that the Company’s remuneration practices are in line with best practice, the Committee has appointed independent external remuneration advisers, Mercer Limited (Mercer). This appointment in 2019 followed a selection process. Mercer attends meetings of the Committee by invitation. The Human Resources Director and the Head of Reward and Pensions also attended the Committee meetings to provide advice and respond to specific questions. Such attendances specifically excluded any matter concerning their own remuneration. The Company Secretary acts as secretary to the Committee.
Fees for advice provided by Mercer to the Committee during the year was in the region of £55,000 including VAT. The Committee is satisfied that the advice they received from external advisers is objective and independent.
The Remuneration Committee report was approved by the Board on 29 June 2020, and signed on its behalf by:
Jill SheddenChair, Remuneration Committee
The Remuneration Committee continued Directors’ report
The Directors present their Annual Report and the audited consolidated financial statements for the year ended 31 March 2020. Thames Water Utilities Limited (the Company) is a Company incorporated and domiciled in the United Kingdom. The financial statements are the Company’s statutory accounts as required to be delivered to the Registrar of Companies. This Directors’ report includes certain disclosures required under the Companies Act 2006.
The Directors consider that the Annual Report and the audited consolidated financial statements, taken as a whole, is fair, balanced and understandable and provides the information necessary for external shareholders to assess the Group’s position and performance, business model and strategy.
The Directors have carried out a robust assessment of the principal risks and emerging risks facing the Group, including those that would threaten its business model, future performance, solvency or liquidity, and details of these risks and their management or mitigation can be found on pages 66-74. The nature of the Group’s operations and its principal activities are set out in the Strategic Report on pages 1-80. The Strategic Report includes details of the market overview; key growth drivers; business model; strategic objectives; principal risks and uncertainties; key performance indicators and a summary of the Company’s performance during the year.
The Directors have voluntarily complied with the Disclosure and Transparency Rules (“DTR”), to the extent that these can be reasonably applied to the Group. The Company is required, under its licence, to conduct its business as if it were a public limited company, which includes the requirement to publish information about its results as if it were a company with a Listing on the London Stock Exchange. Consequently, the Company has prepared Corporate Governance, Remuneration Committee and Audit, Risk and Reporting Committee reports that are included within this Annual Report.
DirectorsThe current Directors of the Company, including their biographical details can be found on pages 83-86. Details of the Directors’ remuneration, service contracts and any interest in the shares of the Company are included within the Remuneration Committee report on pages 108-127.
On 24 May 2019, we announced Steve Robertson would step down as our Chief Executive and he resigned as Executive Director from the Board on the same date. Ian Marchant has been acting as Interim Executive Chairman since that date, whilst the the search for a new CEO was undertaken. Our new Chief Executive, Sarah Bentley, will take up her role on 1 September 2020.
Other Board changes up to the date of signing the financial statements were as follows:
• Michael McNicholas was appointed as Non-Executive Director on 1 July 2019;
• Paul Donovan was appointed as Non-Executive Director on 1 July 2019;
• Kenton Bradbury resigned as Non-Executive Director on 1 July 2019; and
• Christopher Deacon resigned as Non-Executive Director on 1 July 2019.
Directors’ indemnitiesSubject to the conditions set out in Section 234 of the Companies Act 2006 and subject to shareholder approval, the Company has made qualifying third party indemnity provisions for the benefit of its Directors and for the benefit of other persons who are directors of associated companies and these remain in force at the date of this report.
Thames Water Combined Report 2019/20 127Strategic report Governance Financial statements Annual performance report

Political donationsNo political donations were made by the Company during the year (2018/19: £nil).
BranchesThe Company does not have any branches outside of the UK.
Share capitalAs at 29 June 2020, the Company’s issued share capital was 29,050,000 ordinary shares of £1 each amounting to £29,050,000. There were no movements in the Company’s share capital during the year. Further details of the Company’s share capital can be found in note 39.
DividendsDuring AMP6, we made substantial changes to our governance arrangements to reinforce the independence of TWUL, including strengthening the oversight of and governance around dividend payments. This included the separation of the chairmanships of TWUL and its holding company with Independent Non-Executive Directors making up the largest group on the TWUL Board, reviewing the skillsets of the Directors to ensure there is sufficient breadth of operational experience to allow them to challenge effectively on all issues and refreshing the relationship between Kemble, our ultimate holding company, and TWUL by reviewing reserved matters to reinforce the appropriate degree of independence.
The Company’s dividend policy is to pay a progressive dividend commensurate with the long-term returns and performance of the business, after considering the business’s current and expected regulatory and financial performance, regulatory restrictions, management of economic risks and debt covenants. Directors, in assessing the dividend to be paid, are required to ensure that:
• Payment of a proposed dividend should not impair short term liquidity or compliance with our covenants
• Payment of a proposed dividend should not impair the longer term financability of the company’s business
• Assessment of the impact that payment of the dividend may have on all stakeholders including employees, pension members and customers
• Our financial performance, that underpins the opportunity to pay the dividend, is as a result of operational performance that meets the level required of a supplier of essential services
• If a net dividend is declared above Ofwat’s 5% dividend yield guidance, applied to Ofwat’s notional company, the Board will consider whether the additional returns result from performance (including progress towards degearing) that has benefited customers and may therefore be reasonably applied to finance a dividend.
The Company paid a total dividend of £56.5 million (2018/19: £60.0 million) during the financial year to its immediate parent company, Thames Water Utilities Holdings Limited. The dividends paid in the current financial year were utilised solely to service the debt obligations and working capital requirements of other companies in the Group. No distributions were ultimately paid to external shareholders during the year (2018/19: £nil).
Material financial instrumentsFinancial risk management and information on financial instruments is covered in note 18.
Directors’ report continued
Research and developmentThe Group’s research and development programme consists of a portfolio of projects designed to address technical needs across the range of water cycle activities, delivering innovative technical solutions aligned with business needs to address challenges and also provide specialist technical support to the business.
The development and application of new techniques and technology is an important part of the Company’s activities. The Company is a member of UK Water Industry Research (“UKWIR”) and participates and benefits from its research programme. The UKWIR research programme covers water, wastewater, sustainability, regulation, customers and asset management. In addition, we carry out research and development in-house, including solutions to improve the resilience of our water supplies, developing insight into the deterioration of critical assets, novel approaches to tackle leakage and pollutions from our water and wastewater networks respectively, and wastewater treatment processes to allow us to meet increasingly stringent regulatory requirements.
Expenditure on research and development totalled £3.8 million for the year (2018/19: £3.9 million).
Intellectual propertyThe Company protects intellectual property of material concern to the business as appropriate, including the filing of patents where necessary.
Charitable fundraisingDuring the year, the Group raised £266,058 (2018/19: £269,000) for WaterAid, with a further £32,987 (2018/19: £24,000) of income pledged, which is being used to improve access to clean water for two towns in Malawi.
In addition, the Group raised a further £63,842 (2018/19: £45,266) for other local and national charities through internal fundraising activities. The company match funded these employee fundraising efforts with £36,674 (2018/19: £31,820).
The Group supports the local community through volunteering events and contributions to community investment funds. We supported 25 local organisations’ projects that fulfilled our application criteria of ‘water and the environment’ and ‘water and health’ through our small grants programme with a total of £68,911 (2018/19: £38,510 for 20 projects).
We also support our employees with a payroll giving scheme, contributing an additional 10% on top of their combined donations. Our employees donated a total of £83,833 (2018/19: £82,661) to 139 (2018/19: 143) charities which the Group donated a further £8,383 (2018/19: £8,216).
Employee engagementOver 84% of employees took part in our annual survey, our highest ever response rate, with an overall engagement score of 64%. This demonstrates that our employees are willing to express how they are feeling about working at Thames – both the good aspects and what we can do to improve.
Employees commented favourably on health and safety, diversity and inclusion and work/ life balance as well as the fact that they are proud to work for Thames Water.
We continuously seek to listen to and act on feedback from our employees, putting voices into action throughout the year.
Thames Water Combined Report 2019/20 128Strategic report Governance Financial statements Annual performance report

Directors’ report continued
Earlier in the year the Board approved the appointment of Ian Pearson as a designated Non-Executive Director to take accountability for ensuring that workforce issues are appropriately considered at the Thames Water Board. Ian is supported in this by the other members of the Board who actively participate in engagement activities.
To support the Board, we expanded our engagement approach through regular engagement sessions across a range of functions and sites, providing employees with greater opportunities to meet with and be listened to by Board members.
Our Executive team continue to regularly meet and listen to employees in person as well as reviewing feedback from a variety of other sources. This includes formal channels such as our Hear For You survey and joint meetings with our recognised trade unions (UNISON, GMB and Unite), as well as our ‘stop’ mailbox, yammer communications and local feedback channels. This feedback is considered and included in Executive decision making.
Our lead engagement champions for each area of the business additionally came together along with representatives from each of the three Trade Unions recognised by Thames Water for our first bi-annual employee engagement forum chaired by NED Ian Pearson. The forum discussed what works well in addition to what else we can do to continually improve.
Stakeholder engagement For further information about our stakeholder engagement programme, please see pages 19-22.
Equal opportunities, diversity and inclusion and disability confidentPeople are at the heart of our company. We value and harness the unique skills, experiences and backgrounds that each individual brings.
Our ongoing commitment to maintaining an inclusive workplace enables us to attract and retain diverse talent that is representative of our communities. This supports the growth of a great place to work where everyone can flourish in helping us to succeed and drive the right outcomes for our customers, business and the environment.
Over the past year we have seen an increase in minority talent in management and leadership positions, and a year-on-year reduction in our mean gender pay gap.
Additionally, we were honoured to become the first water company to be awarded Disability Confident Leader status in July. This is the highest award in the UK and is in recognition of our continued success in enabling access improvements, the implementation of “adjustment passports” to further support employees in the workplace and the implementation of work experience for people who are not in education, employment or training as well as those with disabilities.
Furthermore, in January we received the results of our Stonewall Workplace Equality Index, a leading benchmarking tool for LGBT inclusion in the workplace. Our target was to be in the Top 250 so we were delighted to jump an incredible 113 places to rank 189th out of more than 500 companies.
Going concernThe Directors believe, after due and careful enquiry, that the Group has sufficient resources to meet its present obligations as they fall due and, therefore, consider it appropriate to adopt the going concern basis in preparing the 2019/20 financial statements. In forming this assessment the Directors have considered the following information:
The Group has considerable financial resources, a strong liquidity position, ongoing revenue streams and a diverse base of customers. Revenue includes the set amounts which can be expected to be collected from customers and the rewards/penalties associated with operational out/under performance compared against certain targets set by the regulator.
The water sector in England and Wales has been much less affected to date than many other sectors by the Covid-19 pandemic. The existing regulatory framework provides protection against reduced revenues arising from lower consumption and the regulatory recovery mechanisms ensure that the economic value impact is generally immaterial. In addition, the impact of Covid-19 on the Group’s ability to provide essential water and wastewater services has been mitigated through Government’s recognition that these services are essential and the Group’s quick response to enable effective working practices in the challenging operational environment. Moody’s, a credit rating agency, identified the water industry as having low exposure to the coronavirus.
Management has assessed the likely impact of Covid-19 to the financial position of the Group, with particular focus on operating cashflows and the AMP7 capital programme, and currently predicts a short-term reduction in cash receipts and a deferral of a reasonable portion of the capital programme into future AMP7 years. The cash receipts impact is anticipated to come from deferred payments from household customers and lower billable volumes in the non-household sector, due to reduced consumption. Management has analysed scenarios to assess its going concern, which include plausible and severe downside scenarios, and in all cases we are a going concern in compliance with covenants and have adequate liquidity for a period of at least 12 months from the signing of these financial statements. To mitigate the impact of potential lower cash collections, Management are closely reviewing the operating cashflow, assessing and implementing changes to the collections process and the cost base in a considered manner to ensure optimal financial and operational performance. There remains a risk that the impact of COVID-19 is greater than that modelled by the Group.
As a consequence of these factors and having accepted the five year plan for 2020-2025 (the Final Determination), the Directors believe that the Group is well placed to manage its business risks successfully and have a reasonable expectation that the Group has adequate resources to continue in operational existence for the foreseeable future.
• The Company’s business activities, together with the factors likely to affect its future development, performance and position are set out in the Strategic Report on pages 1-80. The financial position of the Company, its cash flows, liquidity position and borrowing facilities are described in the Strategic Report on pages 60-65;
• Day-to-day working capital requirements are funded by the business cash flows and by utilising the revolvingcredit facility, as needed;
• At 31 March 2020, TWUL had cash balances and liquid resources of £1.05 billion and undrawn committed facilities totalling £932m, including £550 million of undrawn liquidity facilities which can be only be drawn in limited circumstances. The undrawn facilities are made up of the £232.1 million undrawn portion of the £1,646.4 million revolving credit facility, the £150m undrawn portion of a Class B term loan facility and £550.0 million of 364-day liquidity facilities due for renewal in August 2020. As detailed in the Funding section below, since 31 March 2020 TWUL has raised a further £390 million of Class A funding via the capital markets and entered into a new £110 million Term Loan facility. A total of £604m of bank facility drawings have been repaid in April and May 2020;
• The Company is in compliance with its financial covenant requirements as at 31 March 2020; and
• The Company’s forecasts and projections, taking account of reasonably possible changes in trading performance, show that the Company should be able to operate within the level of its current facilities and covenant restrictions for at least 12 months from the date of this report.
Thames Water Combined Report 2019/20 129Strategic report Governance Financial statements Annual performance report

Directors’ report continued
FundingIn January 2019, a £227 million equivalent ($106m 7-year, $131m 10-year and €50m 11-year) US Private Placement was priced, and funded in April 2019. During March 2019, a £189.2m bilateral term loan facility (split equally over 8, 10 and 12 year maturities) was signed and funded in November 2019. During May 2019, a £175.0m (£125m 5-year and £50m 3-year) bilateral term loan facility was signed and funded in June 2019.
Through Kemble Water Finance Limited, a holding company within the wider group, around £650 million of new Sterling debt was committed in November 2018 (of which £310.0 million was drawn at 31 March 2019 and £340.0 million in April 2019), using the bank and private placement markets. Approximately £250 million of the proceeds were used to de-gear TWUL in April 2019.
In December 2019, a £300m 3.5-year Class B term loan facility was signed out of which £150m was drawn in March 2020.
In April 2020, a £350m 20-year Class A bond was issued, followed by a further £40m 30-year Class A bond in May 2020. In May 2020 a £110m 3.5-year Class A term loan facility was signed.
In October and November 2019, we executed a number of index-linked swaps with a total notional value of around £2.1bn with maturities of 5 years and 10 years. These swaps help manage inflation risk and effectively convert existing debt which was issued at a fixed nominal rate into a fixed real rate with the underlying principal amount linked to inflation. All of the swaps transacted are structured to pay the inflation accretion amount at maturity. In November 2019, we also extended the maturity of £400m notional of index linked swaps. These transactions allow the Group to defer finance expense payments into future years.
Energy Management and Operational Greenhouse Gas EmissionsIn 2019/20 we made significant progress reducing our greenhouse gas emissions and improving our energy performance. We achieved a reduction in our gross operational emissions of 9% and increased our renewable energy generation from sludge by 20 GWh to 313 GWh. Of our total 1,679 GWh of energy consumption, we have reduced our electricity consumption by over 16GWh to 1,305GWh. Together with our other renewables (wind and solar photovoltaics (PV)) we have increased our supply from on-site renewables in the year ended 31 March 2020 from 22% to 24%.
Where we’re not able to produce our own renewable electricity, we source Renewable Energy Guarantees of Origin (“REGO”) accredited renewable electricity through contracts with our suppliers. As a result, we have achieved our emissions targets for 2019/20 and for AMP6, for both water and wastewater. Our ambition for operational emissions is to reach Net Zero Carbon by 2030.
EmissionsDuring 2019/20, we reduced our gross operational emissions by 49.5 ktCO2e to 494.9 ktCO2e. 32 kTCO2e through reduced consumption and the generation of grid electricity from lower carbon sources (decarbonization). Our net operational emissions reduced by 17.8 ktCO2e to 257.9 ktCO2e a fall of 6%. 2.8kTCO2e of this reduction was achieved thanks to the decarbonization of the electricity transmission network. We have achieved numerous successes, realising emissions reductions through a combination of actions including;
• a 7.4 kTCO2e reduction by increasing methane capture from our sludge digestion at two sites
• a 6% reduction in our emissions from fossil fuels saving 2.6kTCO2e on our sites, by recovering more of our process heat requirements from our renewable CHP engines, and using less diesel in our standby generators
• our CHP engines exporting more renewable electricity when we did not need it ourselves, which generated an additional 0.6kTCO2e carbon offset
• changing how we deliver our digital capabilities, with a 1kTCO2e reduction in emissions from our outsourced IT partners.
• rolling out new videoconferencing capabilities in Autumn of 2019, we achieved a 15% reduction in emissions from private and public transport 0.4kTCO2e.
We also reduced the emissions associated with each megaliter (Ml) of water and wastewater we supply and treat; our emissions intensity.
Water: 19.6 kgCO2e per Ml down 1.0 kgCO2e per MlWastewater: 111.9 kgCO2e per Ml down 15.1 kgCO2e per Ml
kTCO2e
Scope 1 205.7Scope 2 232.9Scope 3 56.3Gross 494.9Net-offs (237.0)Net 257.9
EnergySupported by our recently ISO certified Energy Management System we have delivered energy efficiency improvements across both Water and Wastewater business units. We have reduced the net electricity intensity for each megaliter of water and wastewater we supply and treat.
Water: 525 kWh/Ml down 1%Wastewater: 254kWh/Ml down 9%
This was achieved through a series of actions including efficiencies and generation increases at several sites, notable examples being:
• Crossness STW which increased its renewable electricity generation from sludge by over 8.5GWh (27%) since March 2019 by expanding and optimising the capacity of its THP sludge treatment process.
• At Beckton STW the site team have optimised its secondary treatment, reducing its total consumption by 2.5 GWh since March 2019.
• We have invested in variable speed drives at our Amwell Marsh Water Pumping Station which has improvedthe performance and saved 290MWh, an amazing 49% reduction!
• At Aldershot STW we have invested in new high efficiency air blowers, achieving an 8% (180MWh) year-on-year reduction.
Emissions MethodologyWe calculate our greenhouse gas emissions using the UK Water Industry Research Carbon Accounting Workbook (“CAW”). The CAW is the industry standard which is updated annually to reflect changes to emission
Thames Water Combined Report 2019/20 130Strategic report Governance Financial statements Annual performance report

• Scope 1 (Direct emissions);
• Scope 2 (Indirect energy use emissions);
• Scope 3 (Emissions from outsourced services and business travel); and
• Carbon intensity ratios per megalitre day (Ml/d) of service delivered.
Emissions from the greenhouse gases are standardised to global warming potential represented as carbon dioxide equivalents (“CO2e”).
InsuranceThe Company maintains a comprehensive insurance programme, renewed annually. This includes cover for a range of insurance classes including Public Liability, Property, Employers Liability, Construction, Motor, and Directors’ & Officer Liability cover.
The insurance coverage has been reviewed and approved by an independent insurance adviser retained to ensure that the Company’s insurances: (i) have regard to the risk being covered; and (ii) address the interests of the Company.
Statement of Directors’ responsibilities in respect of the annual report and financial statementsThe Directors are responsible for preparing the Annual Report and the financial statements in accordance with applicable law and regulation.
Company law requires the Directors to prepare financial statements for each financial year. Under that law the Directors have prepared the group financial statements in accordance with International Financial Reporting Standards (IFRSs) as adopted by the European Union and Company financial statements in accordance with International Financial Reporting Standards (IFRSs) as adopted by the European Union. Under company law the Directors must not approve the financial statements unless they are satisfied that they give a true and fair view of the state of affairs of the group and Company and of the profit or loss of the group and Company for that period. In preparing the financial statements, the Directors are required to:
• select suitable accounting policies and then apply them consistently;
• state whether applicable IFRSs as adopted by the European Union have been followed for the group financial statements and IFRSs as adopted by the European Union have been followed for the Company financial statements, subject to any material departures disclosed and explained in the financial statements;
• make judgements and accounting estimates that are reasonable and prudent; and
• prepare the financial statements on the going concern basis unless it is inappropriate to presume that thegroup and Company will continue in business.
The Directors are also responsible for safeguarding the assets of the group and Company and hence for taking reasonable steps for the prevention and detection of fraud and other irregularities.
The Directors are responsible for keeping adequate accounting records that are sufficient to show and explain the group and Company’s transactions and disclose with reasonable accuracy at any time the financial position of the group and Company and enable them to ensure that the financial statements and the Directors’ Remuneration Report comply with the Companies Act 2006 and, as regards the group financial statements, Article 4 of the IAS Regulation.
The Directors are responsible for the maintenance and integrity of the Company’s website. Legislation in the United Kingdom governing the preparation and dissemination of financial statements may differ from legislation in other jurisdictions.
Directors’ confirmationsThe Directors consider that the annual report and accounts, taken as a whole, is fair, balanced and understandable and provides the information necessary for external shareholders to assess the group and Company’s position and performance, business model and strategy.
Each of the Directors, whose names and functions are listed in Governance confirm that, to the best of their knowledge:
• the Company financial statements, which have been prepared in accordance with IFRSs as adopted by the European Union, give a true and fair view of the assets, liabilities, financial position and profit of the Company;
• the group financial statements, which have been prepared in accordance with IFRSs as adopted by the European Union, give a true and fair view of the assets, liabilities, financial position and profit of the group; and
• the Strategic Report includes a fair review of the development and performance of the business and the position of the group and Company, together with a description of the principal risks and uncertainties thatit faces.
In the case of each Director in office at the date the Directors’ Report is approved.
Disclosure of information to the auditorsIn accordance with Section 418 of the Companies Act 2006, the Directors who held office at the date of approval of this Directors’ Report confirm that, so far as they are each aware, there is no relevant audit information of which the Company’s auditors are unaware and each Director has taken all the steps that they ought to have taken as a director to make themselves aware of any relevant audit information and to establish that the Company’s auditors are aware of that information.
Independent auditorsPursuant to section 487 of The Companies Act 2006, the auditors, PricewaterhouseCoopers LLP, will be deemed to be reappointed as the Company and wider Group’s external auditors.
The Directors’ Report was approved by the Board of Directors on 29 June 2020 and signed by order of the Board by:
David HughesCompany SecretaryThames Water Utilities LimitedClearwater Court, Vastern Road, Reading, Berkshire RG1 8DB
Directors’ report continued
factors and carbon reporting guidance from the Department of Environment, Food and Rural Affairs (Defra). Operational Greenhouse Gas Emissions (“GHG”) within the regulated business are calculated annually reflecting the six major greenhouse gases and the Defra Environmental Reporting Guidelines.
The emissions reported are associated with the operational emissions of the whole regulated operational business including our head offices and include:
Thames Water Combined Report 2019/20 131Strategic report Governance Financial statements Annual performance report

Independent auditors’ report to the members of Thames Water Utilities LimitedReport on the audit of the financial statements
OpinionIn our opinion, Thames Water Utilities Limited’s group financial statements and company financial statements (the “financial statements”):
• give a true and fair view of the state of the group’s and of the company’s affairs as at 31 March 2020 and of thegroup’s profit and the group’s and the company’s cash flows for the year then ended;
• have been properly prepared in accordance with International Financial Reporting Standards (IFRSs) as adopted by the European Union and, as regards the company’s financial statements, as applied in accordance with the provisions of the Companies Act 2006; and
• have been prepared in accordance with the requirements of the Companies Act 2006 and, as regards the groupfinancial statements, Article 4 of the IAS Regulation.
We have audited the financial statements, included within the Thames Water Combined Report – Annual Report, Annual Performance Report and Sustainability Report 2019/20 (the “Annual Report”), which comprise: the consolidated and company statements of financial position as at 31 March 2020; the consolidated income statement, the consolidated and company statement of other comprehensive income, the consolidated and company statements of cash flows, and the consolidated and company statements of changes in equity for the year then ended; the accounting policies; and the notes to the financial statements.
Our opinion is consistent with our reporting to the Audit, Risk and Reporting Committee.
Basis for opinionWe conducted our audit in accordance with International Standards on Auditing (UK) (“ISAs (UK)”) and applicable law. Our responsibilities under ISAs (UK) are further described in the Auditors’ responsibilities for the audit of the financial statements section of our report. We believe that the audit evidence we have obtained is sufficient and appropriate to provide a basis for our opinion.
IndependenceWe remained independent of the group in accordance with the ethical requirements that are relevant to our audit of the financial statements in the UK, which includes the FRC’s Ethical Standard, as applicable to listed public interest entities, and we have fulfilled our other ethical responsibilities in accordance with these requirements.
To the best of our knowledge and belief, we declare that non-audit services prohibited by the FRC’s Ethical Standard were not provided to the group or the company.
Our audit approachOverview
Materiality
Auditscope
Key auditmatters
• Overall group materiality: £30.0 million (2019: £30.0 million), based on0.15% of total assets.
• Overall company materiality: £28.5 million (2019: £28.5 million), basedon 0.14% of total assets.
• Our scoping is based on the group’s consolidation structure. We define a component as a single reporting unit which feeds into the consolidation.The group consists of two legal entities, Thames Water Utilities Limited and Thames Water Utilities Finance Plc. Both of the group’s reporting components were subject to full scope audits for group purposes.
Our assessment of the risk of material misstatement also informed our views of the areas of particular focus of our work which are listed below:
• Valuation of financial derivatives
• Provision for bad and doubtful debts
• Valuation of retirement benefit obligation
• Classification of costs between capital and operating expenditure
• Impact of COVID-19
Other than those disclosed in the Audit, Risk and Reporting Committee report, we have provided no non-audit services to the group or the company in the period from 1 April 2019 to 31 March 2020.
The scope of our auditAs part of designing our audit, we determined materiality and assessed the risks of material misstatement in the financial statements.
Capability of the audit in detecting irregularities, including fraudBased on our understanding of the group and industry, we identified that the principal risks of non-compliance with laws and regulations related to Water Industry Act 1991, Water Resources Act 1991, Environment Act 1995 and Competition Act 1998, and we considered the extent to which non-compliance might have a material effect on the financial statements. We also considered those laws and regulations that have a direct impact on the preparation of the financial statements such as the Companies Act 2006. We evaluated management’s incentives and opportunities for fraudulent manipulation of the financial statements (including the risk of override of controls), and determined that the principal risks were related to posting journal entries to increase profits or reclassify costs, management bias in accounting estimates especially in provisions and expected credit losses, or excluding transactions from underlying or free cash flow metrics. Audit procedures performed by the engagement team included:
• Challenging assumptions and judgements made by management in determining significant accounting estimates and independently reviewed and tested assumptions in relation to such judgements and estimates along with the related disclosures in the financial statements;
• Identifying and testing journal entries, in particular journal entries posted with unusual account combinations;and
Thames Water Combined Report 2019/20 132Strategic report Governance Financial statements Annual performance report

Independent auditors’ report continued
• Discussions and enquiries of management, internal audit function and legal counsel
There are inherent limitations in the audit procedures described above and the further removed non-compliance with laws and regulations is from the events and transactions reflected in the financial statements, the less likely we would become aware of it. Also, the risk of not detecting a material misstatement due to fraud is higher than the risk of not detecting one resulting from error, as fraud may involve deliberate concealment by, for example, forgery or intentional misrepresentations, or through collusion.
Key audit mattersKey audit matters are those matters that, in the auditors’ professional judgement, were of most significance in the audit of the financial statements of the current period and include the most significant assessed risks of material misstatement (whether or not due to fraud) identified by the auditors, including those which had the greatest effect on: the overall audit strategy; the allocation of resources in the audit; and directing the efforts of the engagement team. These matters, and any comments we make on the results of our procedures thereon, were addressed in the context of our audit of the financial statements as a whole, and in forming our opinion thereon, and we do not provide a separate opinion on these matters. This is not a complete list of all risks identified by our audit.
Key audit matter How our audit addressed the key audit matter
Valuation of financial derivativesThe group derivative position as at 31 March 2020 was an asset of £374m (2019: £162m) and liability of £1,061m (2019: £1,262m). The net derivative fair value as at 31 March 2020 was a liability of £687m (2019: £1,100m).
The valuation of derivatives is designated as a significant risk as the total fair value of the derivative contracts are material, the valuation methodology can be judgemental and some of the contracts are unusual, complex or long dated which can cause additional complexities.
Refer to page 102 of the Audit, Risk and Reporting Committee report and note 18 of the financial statements.
This risk is applicable to both the group and company.
We obtained independent confirmations from the external counterparties to confirm the existence and terms of all derivative contracts held.
Engaged with our specialist valuations team who have performed independent valuations for a sample of the derivative population by applying sampling methodology to determine an appropriate number of derivatives to test. The tested population had a fair value of £743m.
We also performed an analytic review of the derivative position by calculating expected movements in derivatives using independent sources of exchange rates and interest rates.
We tested management controls in operation to reconcile the derivative valuations to those provided by the external counterparties.
Overall, we consider that the valuation method and judgements management have used are reasonable and the fair values recorded at the balance sheet date are appropriate.
Key audit matter How our audit addressed the key audit matter
Provision for bad and doubtful debtsThe recoverability of customer debts is always a key issue for water companies. The company uses significant judgements and estimates to determine their provision for bad and doubtful debts, which amounted to £187.8m (2019: £176.6m).
The provision includes an additional overlay in the current year to reflect the potential impact of the COVID-19 pandemic, which involves a high degree of estimation uncertainty.
Management makes key assumptions based on historical trends relating to non-payment of invoices including comparisons of the relative age of the individual balance and consideration of the actual write-off history.
These historical trends are used as a basis to assess expected credit losses in the future. These assumptions are then used in a complex model to compute the provision for bad and doubtful debt, which is sensitive to changes in these assumptions. Management have also considered plausible downside scenarios in assessing the impact of COVID-19 on the receivable balance.
Refer to page 102 of the Audit, Risk and Reporting Committee report and note 14 of the financial statements.
This risk is applicable to both the group and company.
We evaluated the model used to calculate the provision and confirmed its consistency with prior years (excluding the COVID-19 overlay) and the appropriateness of the model in line with requirements of IFRS 9.
We also tested the underlying data upon which the calculations were based and assessed the appropriateness of the judgements applied in calculating the provision, using the latest available cash collection, cancellation and rebill data for the current year.
We re-performed the calculations used in the model and ensured accuracy of these calculations.
We challenged management’s assumptions used in the model and tested a sample of inputs. We also tested a sample of receivables to ensure appropriateness of the aging classifications used in the model.
We assessed the various downside scenarios considered by management on account of COVID-19 and tested the additional overlay provision. We challenged management’s assumptions with regards to the impact of COVID-19 on the future cash flows and recoverability of trade receivables based on our understanding of the business and industry knowledge. In addition, we performed sensitivity analysis on the downside scenarios considered by management. The result of the sensitivity analysis showed that the downside scenario considered by management is reasonable and did not have a material impact on management’s assessment.
We also assessed the adequacy of disclosures in the notes to the financial statements of the key judgements and estimates involved in the provision for bad and doubtful debts and the impact of COVID-19 on trade receivables.
Overall we consider that the provision and disclosure for bad and doubtful debts is reasonable as at 31 March 2020.
Thames Water Combined Report 2019/20 133Strategic report Governance Financial statements Annual performance report

Independent auditors’ report continued
Key audit matter How our audit addressed the key audit matterValuation of retirement benefit obligationValuation of total scheme liabilities £2,515.7m (2019: £2,606.4m).
The valuation of retirement benefit obligations requires significant levels of judgement and technical expertise, including the use of actuarial experts to support the directors in selecting appropriate assumptions. Small changes in a number of the key financial and demographic assumptions used to value the retirement benefit obligation, (including discount rates, inflation rates, salary increases and mortality) could have a material impact on the calculation of the liability.
The pension liability and disclosures are also an area of interest to key stakeholders; this is especially so in the current year in light of the COVID-19 crisis and the new triennial valuations completed.
Refer to page 102 of the Audit, Risk and Reporting Committee report and note 22 of the financial statements.
This risk is applicable to both the group and company.
We used our own actuarial experts to evaluate the assumptions made in relation to the valuation of the scheme liabilities.
We benchmarked the various assumptions used (e.g. discount and inflation rate) and compared them to our internally developed benchmarks; assessed the salary increase assumption against the group’s historical trends and expected future outlook; considered the consistency and appropriateness of methodology and assumptions applied compared to the prior year end.
The last formal triennial valuation took place as at 31st March 2019. However, the year end liabilities have been calculated using a roll forward approach based on cash flows from the 2016 valuations for the Schemes adjusted for the experience noted in the 31 March 2019 valuation. In order to get comfortable with this approach and conclude that the accounting liabilities are reasonable, we have performed an independent roll forward from the valuation results to the accounting results.
We assessed the impact on COVID-19 on the scheme assets by ensuring none had any material uncertainty over the valuation. COVID-19 had no impact on the financial assumptions as these were all based on market conditions at the reporting date and the impact of the pandemic at that time would have been included in bond yields and inflation curves.
Overall, we concur that the methodology and assumptions used by management at 31 March 2020 are reasonable.
Key audit matter How our audit addressed the key audit matterClassification of costs between capital and operating expenditureAdditions to Assets under construction (AUC) during the period amounted to £1,105m (2019: £1,098m). Within this is £192m (2019:£189m) of own works capitalised and £94.2m (2019: £102.7m) of borrowing costs incurred with the remainder being external costs incurred.
There is a high degree of judgement applied when allocating costs to operating and capital expenditure given the nature of certain projects which include both repairs and maintenance as well as asset enhancement. There is therefore the potential for misstatement between the income statement and the statement of financial position. In addition, internal expenditure including staff costs to support capital projects is capitalised only if it can be demonstrated that it is directly attributable to the asset, provides probable economic benefit to the company and can be measured reliably. There is a risk that costs capitalised do not meet these criteria.
Refer to note 10 of the financial statements.
This risk is applicable to both the group and company.
We have tested the controls regarding the assessment by management of each project as being either operating or capital in nature.
For a sample of projects open during the financial year we ensured that the classification of expenditure into capital or operating is consistent with how this has been classified in the financial statements.
We performed sample testing at an individual expense level of costs classified within both AUC additions and those shown as repairs and maintenance accounts in the period. We then agreed these to third party evidence to verify the amount and so to assess whether the costs have been classified appropriately.
We tested the borrowing costs calculation and the qualifying projects involved.
We have understood the methodology management have used to determine the value of spend on leak detection capitalised in the current year and that has been restated in respect of previous years. We have sample tested the underlying costs related to leak detection spend.
Our procedures over own works capitalised included:
We tested the control process over assessing the level of spend incurred by each cost centre that should be capitalised.
We obtained management’s assessments of what spend by cost centre should be capitalised and noted that a consistent approach to the prior year has been used, adequate consideration at an individual cost centre level is being applied and that there is no indication of bias.
We performed sample testing at a cost centre level and challenged management as to the nature of these costs and whether they meet the capitalisation criteria.
Overall, we consider that the judgements management have made over the classification of costs as operating or capital are reasonable at 31 March 2020.
Thames Water Combined Report 2019/20 134Strategic report Governance Financial statements Annual performance report

Independent auditors’ report continued
Key audit matter How our audit addressed the key audit matterImpact of COVID-19The COVID-19 pandemic is considered to have a significant impact on specific items in the Annual report. The specific areas of the financial statements where we have assessed the impact of COVID-19 are as below:
Going concern- COVID-19 is likely to have an impact on the group’s cash flows, macro-economic impact (financial markets) and in turn the ability of the group to access the financial markets.
Recoverability of trade receivables
Valuation of Pension Assets — In particular consideration of any Property backed Investments and impact on valuations performed by investment managers.
Disclosure of the impact on the business and impact on any Alternative Performance Measures (APMs)in the financial statements.
We have also incorporated the guidance for auditors issued by the FRC regarding Covid-19 and applied this where appropriate.
Refer to page 102 of the Audit, Risk and Reporting Committee report.
This risk is applicable to both the group and company.
We have considered the impact of COVID-19 on various areas of the Annual report and performed procedures to address the risk around the impact of COVID-19.
We have set out our responses to the risk in respective areas of the financial statements as below:
Going concern: We have understood how management have factored in the potential impact of COVID-19 on future cash flows and the potential impact of this on covenant compliance including; lower non-household consumption, delays in cash collection of household revenue and impacts on the cost base. In doing this we have validated management’s assumptions by looking at the actual impact on revenue and operating expense cash flows since 31 March 2020. Further we have assessed the availability of financial resources and the ability of the Group to absorb potential adverse circumstances over the going concern period.
Recoverability of trade receivables- Refer Key Audit Matter “Provision for bad and doubtful debts” above.
Valuation of Pension Assets — Refer Key Audit Matter “Valuation of retirement benefit obligation” above.
Disclosure of the impact on the business and impact on any Alternative Performance Measures (APMs) in the financial statements.
We have audited the disclosures provided in the financial statements and assessed the reasonableness of such disclosures. As a result of the procedures performed we consider that the disclosures are reasonable and appropriate.
Overall, we consider management’s assessment of the impact of COVID-19 on the financial statements to be reasonable.
How we tailored the audit scopeWe tailored the scope of our audit to ensure that we performed enough work to be able to give an opinion on the financial statements as a whole, taking into account the structure of the group and the company, the accounting processes and controls, and the industry in which they operate.
MaterialityThe scope of our audit was influenced by our application of materiality. We set certain quantitative thresholds for materiality. These, together with qualitative considerations, helped us to determine the scope of our audit and the nature, timing and extent of our audit procedures on the individual financial statement line items and disclosures and in evaluating the effect of misstatements, both individually and in aggregate on the financial statements as a whole.
Based on our professional judgement, we determined materiality for the financial statements as a whole as follows:
Group financial statements Company financial statementsOverall materiality £30.0 million (2019: £30.0 million). £28.5 million (2019: £28.5 million).
How we determined it 0.15% of total assets. 0.14% of total assets.
Rationale for benchmark applied
Total assets has been determined to be the appropriate benchmark for both significant components of the group (see company rationale), therefore group materiality is also based on total assets. For Public Interest Entities (PIE) a percentage of up to 1% of total assets is typical. However, we have considered multiple factors and given due consideration to other benchmarks and using the lower percentage of 0.15% of total group assets was deemed to be most appropriate.
We consider total assets to be the most appropriate benchmark on which to calculate materiality. The company is primarily an infrastructure company and generates revenues and profits almost entirely through using its infrastructure assets. Therefore, although Thames Water Utilities Limited is a trading entity, given its revenue and profits to a certain extent are regulated by Ofwat, we assess that the key focus is on the infrastructure and therefore the asset base. For PIE entities a percentage of up to 1% of total assets is typical. However, we have considered multiple factors and given due consideration to other benchmarks and using the lower percentage of 0.14% of total company assets was deemed to be most appropriate.
For each component in the scope of our group audit, we allocated a materiality that is less than our overall group materiality. The range of materiality allocated across components was between £25.5 million and £28.5 million.
We agreed with the Audit, Risk and Reporting Committee that we would report to them misstatements identified during our audit above £3.0 million (Group audit) (2019: £1.5 million) and £2.9 million (Company audit) (2019: £1.4 million) as well as misstatements below those amounts that, in our view, warranted reporting for qualitative reasons. The increase in the reporting threshold reflects the understanding of audit findings we gained last year, our first year as auditors, and was accepted by the Audit, Risk and Reporting Committee.
Going concernIn accordance with ISAs (UK) we report as follows:
Reporting obligation OutcomeWe are required to report if we have anything material to add or draw attention to in respect of the directors’ statement in the financial statements about whether the directors considered it appropriate to adopt the going concern basis of accounting in preparing the financial statements and the directors’ identification of any material uncertainties to the group’s and the company’s ability to continue as a going concern over a period of at least twelve months from the date of approval of the financial statements.
We have nothing material to add or to draw attention to.
However, because not all future events or conditions can be predicted, this statement is not a guarantee as to the group’s and company’s ability to continue as a going concern.
Reporting on other information The other information comprises all of the information in the Annual Report other than the financial statements and our auditors’ report thereon. The directors are responsible for the other information. Our opinion on the financial statements does not cover the other information and, accordingly, we do not express an audit opinion or, except to the extent otherwise explicitly stated in this report, any form of assurance thereon.
Thames Water Combined Report 2019/20 135Strategic report Governance Financial statements Annual performance report

Independent auditors’ report continued
In connection with our audit of the financial statements, our responsibility is to read the other information and, in doing so, consider whether the other information is materially inconsistent with the financial statements or our knowledge obtained in the audit, or otherwise appears to be materially misstated. If we identify an apparent material inconsistency or material misstatement, we are required to perform procedures to conclude whether there is a material misstatement of the financial statements or a material misstatement of the other information. If, based on the work we have performed, we conclude that there is a material misstatement of this other information, we are required to report that fact. We have nothing to report based on these responsibilities.
With respect to the Strategic Report and Directors’ Report, we also considered whether the disclosures required by the UK Companies Act 2006 have been included.
Based on the responsibilities described above and our work undertaken in the course of the audit, the Companies Act 2006 (CA06) and ISAs (UK) require us also to report certain opinions and matters as described below (required by ISAs (UK) unless otherwise stated).
Strategic Report and Directors’ ReportIn our opinion, based on the work undertaken in the course of the audit, the information given in the Strategic Report and Directors’ Report for the year ended 31 March 2020 is consistent with the financial statements and has been prepared in accordance with applicable legal requirements. (CA06)In light of the knowledge and understanding of the group and company and their environment obtained in the course of the audit, we did not identify any material misstatements in the Strategic Report and Directors’ Report. (CA06)
The directors’ assessment of the prospects of the group and of the principal risks that would threaten the solvency or liquidity of the groupAs a result of the directors’ reporting on how they have applied the UK Corporate Governance Code (the “Code”), we are required to report to you if we have anything material to add or draw attention to regarding:
• The directors’ confirmation on page 131 of the Annual Report that they have carried out a robust assessment of the principal risks facing the group, including those that would threaten its business model, future performance, solvency or liquidity.
• The disclosures in the Annual Report that describe those risks and explain how they are being managed or mitigated.
• The directors’ explanation on page 129 of the Annual Report as to how they have assessed the prospects of the group, over what period they have done so and why they consider that period to be appropriate, and their statement as to whether they have a reasonable expectation that the group will be able to continue in operation and meet its liabilities as they fall due over the period of their assessment, including any related disclosures drawing attention to any necessary qualifications or assumptions.
We have nothing to report in respect of this responsibility.
Other Code ProvisionsAs a result of the directors’ reporting on how they have applied the Code, we are required to report to you if, in our opinion:
• The statement given by the directors, on page 131, that they consider the Annual Report taken as a whole to be fair, balanced and understandable, and provides the information necessary for the members to assess the group’s and company’s position and performance, business model and strategy is materially inconsistent with our knowledge of the group and company obtained in the course of performing our audit.
• The section of the Annual Report on page 100-104 describing the work of the Audit, Risk and Reporting Committee does not appropriately address matters communicated by us to the Audit, Risk and Reporting Committee.
We have nothing to report in respect of this responsibility.
Responsibilities for the financial statements and the auditResponsibilities of the directors for the financial statementsAs explained more fully in the Statement of Directors’ responsibilities in respect of the Annual Report and financial statements, the directors are responsible for the preparation of the financial statements in accordance with the applicable framework and for being satisfied that they give a true and fair view. The directors are also responsible for such internal control as they determine is necessary to enable the preparation of financial statements that are free from material misstatement, whether due to fraud or error.
In preparing the financial statements, the directors are responsible for assessing the group’s and the company’s ability to continue as a going concern, disclosing, as applicable, matters related to going concern and using the going concern basis of accounting unless the directors either intend to liquidate the group or the company or to cease operations, or have no realistic alternative but to do so.
Auditors’ responsibilities for the audit of the financial statementsOur objectives are to obtain reasonable assurance about whether the financial statements as a whole are free from material misstatement, whether due to fraud or error, and to issue an auditors’ report that includes our opinion. Reasonable assurance is a high level of assurance, but is not a guarantee that an audit conducted in accordance with ISAs (UK) will always detect a material misstatement when it exists. Misstatements can arise from fraud or error and are considered material if, individually or in the aggregate, they could reasonably be expected to influence the economic decisions of users taken on the basis of these financial statements.
A further description of our responsibilities for the audit of the financial statements is located on the FRC’s website at: www.frc.org.uk/auditorsresponsibilities. This description forms part of our auditors’ report.
Use of this reportThis report, including the opinions, has been prepared for and only for the company’s members as a body in accordance with Chapter 3 of Part 16 of the Companies Act 2006 and for no other purpose. We do not, in giving these opinions, accept or assume responsibility for any other purpose or to any other person to whom this report is shown or into whose hands it may come save where expressly agreed by our prior consent in writing.
Thames Water Combined Report 2019/20 136Strategic report Governance Financial statements Annual performance report

Independent auditors’ report continued
Other required reportingCompanies Act 2006 exception reportingUnder the Companies Act 2006 we are required to report to you if, in our opinion:
• we have not received all the information and explanations we require for our audit; or
• adequate accounting records have not been kept by the company, or returns adequate for our audit have not been received from branches not visited by us; or
• certain disclosures of directors’ remuneration specified by law are not made; or
• the company financial statements are not in agreement with the accounting records and returns.
We have no exceptions to report arising from this responsibility.
AppointmentFollowing the recommendation of the Audit, Risk and Reporting Committee, we were appointed by the directors on 27 June 2018 to audit the financial statements for the year ended 31 March 2019 and subsequent financial periods. The period of total uninterrupted engagement is 2 years, covering the years ended 31 March 2019 to 31 March 2020.
Other voluntary reportingGoing concernThe directors have requested that we review the statement on page 129 in relation to going concern as if the company were a premium listed company. We have nothing to report having performed our review.
The directors’ assessment of the prospects of the group and of the principal risks that would threaten the solvency or liquidity of the groupThe directors have requested that we perform a review of the directors’ statements on pages 129 and 75 that they have carried out a robust assessment of the principal risks facing the group and in relation to the longer-term viability of the group, as if the company were a premium listed company. Our review was substantially less in scope than an audit and only consisted of making inquiries and considering the directors’ process supporting their statements; checking that the statements are in alignment with the relevant provisions of the Code; and considering whether the statements are consistent with the knowledge and understanding of the group and company and their environment obtained in the course of the audit. We have nothing to report having performed this review.
Other Code provisionsThe directors have prepared a corporate governance statement and requested that we review it as though the company were a premium listed company. We have nothing to report in respect of the requirement for the auditors of premium listed companies to report when the directors’ statement relating to the company’s compliance with the Code does not properly disclose a departure from a relevant provision of the Code specified, under the Listing Rules, for review by the auditors.
Directors’ remunerationThe company voluntarily prepares a Directors’ Remuneration Report in accordance with the provisions of the Companies Act 2006. The directors requested that we audit the part of the Directors’ Remuneration Report specified by the Companies Act 2006 to be audited as if the company were a quoted company.
In our opinion, the part of the Directors’ Remuneration Report to be audited has been properly prepared in accordance with the Companies Act 2006.
Katharine Finn (Senior Statutory Auditor)for and on behalf of PricewaterhouseCoopers LLPChartered Accountants and Statutory AuditorsReading29 June 2020
Thames Water Combined Report 2019/20 137Strategic report Governance Financial statements Annual performance report

Consolidated income statementFor the year ended 31 March
Consolidated statement of other comprehensive incomeFor the year ended 31 March
2020Restated1
2019
NoteUnderlying
£mBTL£m
Total£m
Underlying£m
BTL£m
Total£m
Revenue 2 2,108.5 64.3 2,172.8 2,036.9 47.5 2,084.4Operating expenses excluding impairment losses on financial and contract assets1,2 3 (1,626.9) – (1,626.9) (1,605.7) – (1,605.7)Impairment losses on financial and contract assets 3,14 (40.6) (0.2) (40.8) (28.9) (0.3) (29.2)Total operating expenses (1,667.5) (0.2) (1,667.7) (1,634.6) (0.3) (1,634.9)Other operating income 2 72.4 – 72.4 71.8 – 71.8
Operating profit 513.4 64.1 577.5 474.1 47.2 521.3 Finance income 5 90.1 – 90.1 42.1 – 42.1Finance expense1 5 (424.6) – (424.6) (410.7) – (410.7)Net gains/(losses) on financial instruments 6 190.8 – 190.8 (37.7) – (37.7)
Profit on ordinary activities before taxation 369.7 64.1 433.8 67.8 47.2 115.0Tax charge on profit on ordinary activities1 7 (183.1) (6.1) (189.2) (8.9) (2.8) (11.7)
Profit for the year 186.6 58.0 244.6 58.9 44.4 103.3
The Group activities above are derived from continuing activities.
Bazalgette Tunnel Limited (“BTL”) is an independent company, appointed in 2015 to construct the Thames Tideway Tunnel. We have recognised revenue, cost and profit on the arrangement with BTL and have disclosed our underlying performance separately as required by some of our financial covenants. Information on how the Group accounts for this arrangement is detailed in the accounting policies on pages 143-144.
The accounting policies and notes on pages 143-189 are an integral part of these consolidated financial statements.
1 The prior year results have been restated due to the impact of the transition to the new accounting standard IFRS 16 ‘Leases’ as discussed on pages 150-152 as well as other restatements relating to the recognition of a provision for property dilapidations and the capitalisation of leakage detection costs, which are discussed on page 152 .
2 Underlying operating expenses for the year ended 31 March 2020 includes £27.7 million (31 March 2019: £nil) of costs that are considered to be exceptional. A summary of exceptional costs is included within note 3.
2020Restated
2019
NoteUnderlying
£mBTL£m
Total£m
Underlying£m
BTL£m
Total£m
Profit for the year1 186.6 58.0 244.6 58.9 44.4 103.3
Other comprehensive incomeWill not be reclassified to the income statement:Net actuarial gain/(loss) on pension schemes 22 168.4 – 168.4 (23.4) – (23.4)Deferred tax (charge) /credit on net actuarial gain/loss including impact of deferred tax rate change 19 (29.7) – (29.7) 4.3 – 4.3
May be reclassified to the income statement:Losses on cash flow hedges (4.1) – (4.1) (8.9) – (8.9)Cash flow hedge transferred to income statement 18 34.9 – 34.9 34.2 – 34.2Deferred tax charge on cash flow hedge gains including impact of deferred tax rate change 19 (3.0) – (3.0) (4.3) – (4.3)
Other comprehensive income for the year 166.5 – 166.5 1.9 – 1.9
Total comprehensive income for the year 353.1 58.0 411.1 60.8 44.4 105.2
The accounting policies and notes on pages 143-189 are an integral part of these consolidated financial statements.
Bazalgette Tunnel Limited (“BTL”) is an independent company, appointed in 2015 to construct the Thames Tideway Tunnel. We have recognised revenue, cost and profit on the arrangement with BTL and have disclosed our underlying performance separately as required by some of our financial covenants. Information on how the Group accounts for this arrangement is detailed in the accounting policies on pages 143-144.
1 The prior year results have been restated due to the impact of the transition to the new accounting standard IFRS 16 ‘Leases’ as discussed on pages 150-152 as well as other restatements relating to the recording of a provision for property dilapidations and the capitalisation of leakage detection costs, which are discussed on page 152.
Thames Water Combined Report 2019/20 138Strategic report Governance Financial statements Annual performance report

Note
Restated1
31 March 2019Restated1
1 April 201831 March 2020Underlying
£mBTL£m
Total£m
Underlying£m
BTL£m
Total£m
Underlying£m
BTL£m
Total£m
Non-current assetsIntangible assets 9 273.4 – 273.4 217.8 – 217.8 168.8 – 168.8Property, plant and equipment 10 15,862.8 – 15,862.8 15,289.4 – 15,289.4 14,687.2 – 14,687.2Right-of-use assets 11 52.3 – 52.3 54.2 – 54.2 57.8 – 57.8Derivative financial assets 18 374.3 – 374.3 162.3 – 162.3 76.4 – 76.4Intercompany loans receivable 12 1,752.2 – 1,752.2 1,974.7 – 1,974.7 1,974.7 – 1,974.7Other receivables 14 70.7 159.0 229.7 39.3 101.9 141.2 39.4 56.7 96.1Pension asset 22 94.5 – 94.5 45.8 – 45.8 50.6 – 50.6
18,480.2 159.0 18,639.2 17,783.5 101.9 17,885.4 17,054.9 56.7 17,111.6Current assetsInventories and current intangible assets 13 13.6 – 13.6 13.5 – 13.5 18.1 – 18.1Intercompany loans receivable 12 11.8 – 11.8 27.3 – 27.3 3.2 – 3.2Contract assets 14 234.9 1.5 236.4 217.0 0.9 217.9 185.8 0.4 186.2Trade and other receivables 14 357.7 11.6 369.3 340.0 8.5 348.5 352.6 5.0 357.6Derivative financial assets 18 – – – – – – 8.5 – 8.5Short-term investments 18 300.0 – 300.0 – – – – – –Cash and cash equivalents 15 755.8 2.6 758.4 154.4 7.6 162.0 104.4 2.6 107.0
1,673.8 15.7 1,689.5 752.2 17.0 769.2 672.6 8.0 680.6Current liabilitiesContract liabilities 16 (123.8) (0.3) (124.1) (110.6) (3.4) (114.0) (125.3) (4.1) (129.4)Trade and other payables 16 (660.1) (16.4) (676.5) (671.2) (15.5) (686.7) (605.1) (5.1) (610.2)Borrowings 17 (1,797.7) – (1,797.7) (1,124.1) – (1,124.1) (266.3) – (266.3)Lease liabilities 11 (7.9) – (7.9) (7.4) – (7.4) (2.8) – (2.8)Derivative financial liabilities 18 (15.0) – (15.0) (38.6) – (38.6) (12.3) – (12.3)
(2,604.5) (16.7) (2,621.2) (1,951.9) (18.9) (1,970.8) (1,011.8) (9.2) (1,021.0)
Net current liabilities (930.7) (1.0) (931.7) (1,199.7) (1.9) (1,201.6) (339.2) (1.2) (340.4)
Consolidated statement of financial positionAs at
Thames Water Combined Report 2019/20 139Strategic report Governance Financial statements Annual performance report

Consolidated statement of financial position continuedAs at
Note
Restated1
31 March 2019Restated1
1 April 201831 March 2020Underlying
£mBTL£m
Total£m
Underlying£m
BTL£m
Total£m
Underlying£m
BTL£m
Total£m
Non-current liabilitiesContract liabilities 16 (707.3) – (707.3) (636.1) – (636.1) (589.9) – (589.9)Borrowings 17 (11,327.9) – (11,327.9) (10,657.7) – (10,657.7) (10,848.7) – (10,848.7)Lease liabilities 11 (62.4) – (62.4) (65.1) – (65.1) (72.5) – (72.5)Derivative financial liabilities 18 (1,045.9) – (1,045.9) (1,223.8) – (1,223.8) (1,225.9) – (1,225.9)Deferred tax 19 (1,063.1) – (1,063.1) (850.2) – (850.2) (842.8) – (842.8)Provisions for liabilities and charges 20 (144.3) – (144.3) (119.2) – (119.2) (142.9) – (142.9)Pension deficit 22 (209.1) – (209.1) (338.8) – (338.8) (300.8) – (300.8)
(14,560.0) – (14,560.0) (13,890.9) – (13,890.9) (14,023.5) – (14,023.5)
Net assets 2,989.5 158.0 3,147.5 2,692.9 100.0 2,792.9 2,692.2 55.5 2,747.7
EquityCalled up share capital 21 29.0 – 29.0 29.0 – 29.0 29.0 – 29.0Share premium 21 100.0 – 100.0 100.0 – 100.0 100.0 – 100.0Cash flow hedge reserve 21 (90.1) – (90.1) (117.9) – (117.9) (138.9) – (138.9)Revaluation reserve 21 934.3 – 934.3 989.3 – 989.3 1,021.2 – 1,021.2Retained earnings 21 2,016.3 158.0 2,174.3 1,692.5 100.0 1,792.5 1,680.9 55.5 1,736.4Total equity 2,989.5 158.0 3,147.5 2,692.9 100.0 2,792.9 2,692.2 55.5 2,747.71 The prior year results have been restated due to the impact of the transition to the new accounting standard IFRS 16 ‘Leases’ as
discussed on pages 150 to 152 as well as other restatements relating to the recording of a provision for property dilapidations and the capitalisation of leakage detection costs, which are discussed on page 152.
Bazalgette Tunnel Limited (“BTL”) is an independent company, appointed in 2015 to construct the Thames Tideway Tunnel. We have recognised amounts in the Statement of Financial Position in relation to the arrangement with BTL and have disclosed our underlying amounts separately as required by some of our financial covenants. Information on how the Group accounts for this arrangement is detailed in the accounting policies on pages 143-144.
The accounting policies and notes on pages 143-189 are an integral part of these consolidated financial statements.
The consolidated financial statements for Thames Water Utilities Limited, registered in England & Wales company number 02366661, were approved by the Board of Directors on 29 June 2020 and signed on its behalf by:
Brandon RennetChief Financial Officer
Thames Water Combined Report 2019/20 140Strategic report Governance Financial statements Annual performance report

Consolidated statement of changes in equityFor the year ended
Called up share capital
£m
Share premium
£m
Cash flow hedge
reserve£m
Revaluation reserve
£m
Retained earnings
£m
Total equity
£m
1 April 2018 as previously reported 29.0 100.0 (138.9) 1,021.2 1,744.0 2,755.3Restatement for IFRS 161 – – – – (14.2) (14.2)Other restatements1 – – – – 5.0 5.0Deferred tax on IFRS 16 and other restatements1 – – – – 1.6 1.6
Restated 1 April 2018 29.0 100.0 (138.9) 1,021.2 1,736.4 2,747.7 Profit for the year1 – – – – 103.3 103.3Loss on cash flow hedge – – (8.9) – – (8.9)Cash flow hedges transferred to income statement – – 34.2 – – 34.2Deferred tax charge on cash flow hedge – – (4.3) – – (4.3)Actuarial loss on pension scheme – – – – (23.4) (23.4)Deferred tax credit on actuarial loss – – – – 4.3 4.3
Total comprehensive income – – 21.0 – 84.2 105.2Transfer of depreciation2 – – – (38.4) 38.4 –Deferred tax on depreciation transfer2 – – – 6.5 (6.5) –Dividends paid3 – – – – (60.0) (60.0)Restated 31 March 2019 29.0 100.0 (117.9) 989.3 1,792.5 2,792.9
1 April 2019 (as previously reported) 29.0 100.0 (117.9) 989.3 1,786.7 2,787.1Restatement for IFRS 16 – – – – (12.3) (12.3)Other restatements – – – – 15.3 15.3Deferred tax on IFRS 16 and other restatements – – – – 2.8 2.8At 1 April 2019 as restated 29.0 100.0 (117.9) 989.3 1,792.5 2,792.9 Profit for the year – – – – 244.6 244.6Loss on cash flow hedge – – (4.1) – – (4.1)Cash flow hedge transfer to the income statement – – 34.9 – – 34.9Deferred tax charge on cash flow hedge losses including impact of deferred tax rate change – – (3.0) – – (3.0)Net actuarial gain on pension scheme – – – – 168.4 168.4 Deferred tax charge on net actuarial gain including impact of deferred tax rate change – – – – (29.7) (29.7)
Called up share capital
£m
Share premium
£m
Cash flow hedge
reserve£m
Revaluation reserve
£m
Retained earnings
£m
Total equity
£m
Total comprehensive income – – 27.8 – 383.3 411.1 Transfer of depreciation2 – – – (38.4) 38.4 – Deferred tax on depreciation transfer2 – – – (16.6) 16.6 – Dividends paid3 – – – – (56.5) (56.5) 31 March 2020 29.0 100.0 (90.1) 934.3 2,174.3 3,147.5
The accounting policies and notes on pages 143-189 are an integral part of these consolidated financial statements.
1 The prior year results have been restated due to the impact of the transition to the new accounting standard IFRS 16 ‘Leases’ as discussed on pages 150-152 as well as other restatements relating to the recording of a provision for property dilapidations and the capitalisation of leakage detection costs, which are discussed on page 152.
2 The movement between the revaluation reserve and retained earnings arising from the depreciation and associated deferred tax (including the impact of the deferred tax rate change) on the fair value uplift on assets.
3 Refer to Note 8 for information on dividends paid.
Thames Water Combined Report 2019/20 141Strategic report Governance Financial statements Annual performance report
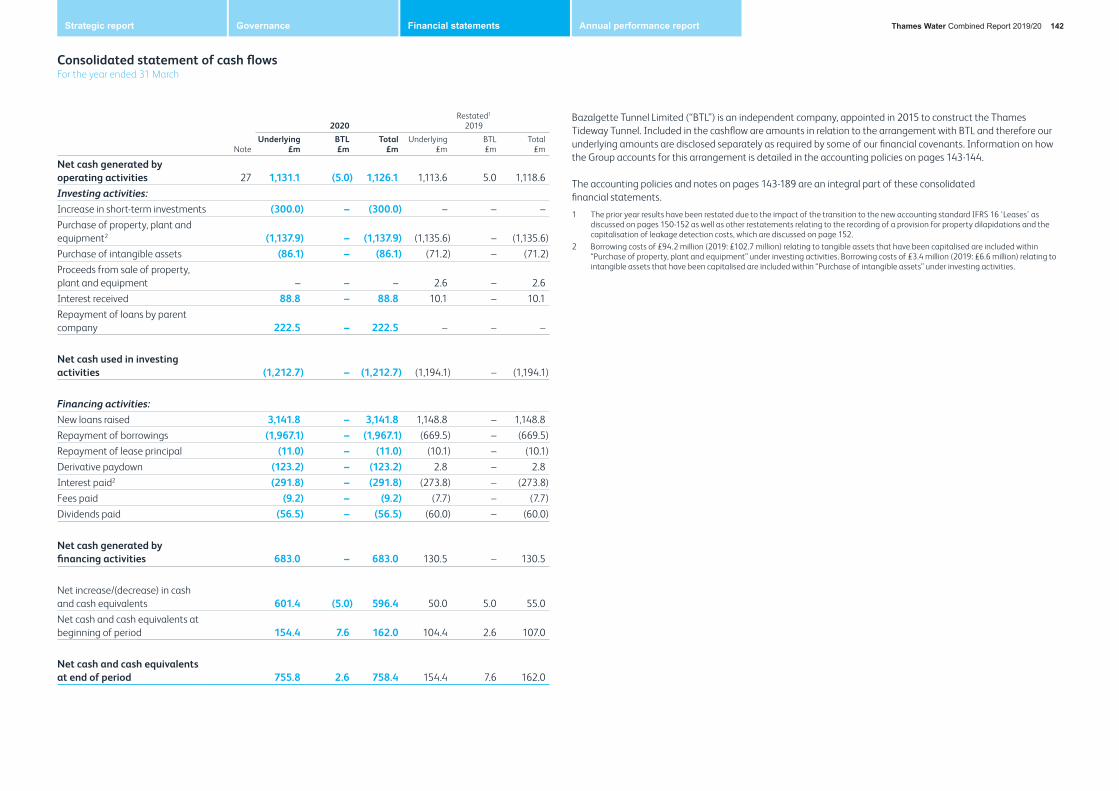
Consolidated statement of cash flowsFor the year ended 31 March
2020Restated1
2019
NoteUnderlying
£mBTL£m
Total£m
Underlying£m
BTL£m
Total£m
Net cash generated by operating activities 27 1,131.1 (5.0) 1,126.1 1,113.6 5.0 1,118.6Investing activities:Increase in short-term investments (300.0) – (300.0) – – –Purchase of property, plant and equipment2 (1,137.9) – (1,137.9) (1,135.6) – (1,135.6)Purchase of intangible assets (86.1) – (86.1) (71.2) – (71.2)Proceeds from sale of property, plant and equipment – – – 2.6 – 2.6Interest received 88.8 – 88.8 10.1 – 10.1Repayment of loans by parent company 222.5 – 222.5 – – –
Net cash used in investing activities (1,212.7) – (1,212.7) (1,194.1) – (1,194.1)
Financing activities:New loans raised 3,141.8 – 3,141.8 1,148.8 – 1,148.8Repayment of borrowings (1,967.1) – (1,967.1) (669.5) – (669.5)Repayment of lease principal (11.0) – (11.0) (10.1) – (10.1)Derivative paydown (123.2) – (123.2) 2.8 – 2.8Interest paid2 (291.8) – (291.8) (273.8) – (273.8)Fees paid (9.2) – (9.2) (7.7) – (7.7)Dividends paid (56.5) – (56.5) (60.0) – (60.0)
Net cash generated by financing activities 683.0 – 683.0 130.5 – 130.5
Net increase/(decrease) in cash and cash equivalents 601.4 (5.0) 596.4 50.0 5.0 55.0Net cash and cash equivalents at beginning of period 154.4 7.6 162.0 104.4 2.6 107.0
Net cash and cash equivalents at end of period 755.8 2.6 758.4 154.4 7.6 162.0
Bazalgette Tunnel Limited (“BTL”) is an independent company, appointed in 2015 to construct the Thames Tideway Tunnel. Included in the cashflow are amounts in relation to the arrangement with BTL and therefore our underlying amounts are disclosed separately as required by some of our financial covenants. Information on how the Group accounts for this arrangement is detailed in the accounting policies on pages 143-144.
The accounting policies and notes on pages 143-189 are an integral part of these consolidated financial statements.
1 The prior year results have been restated due to the impact of the transition to the new accounting standard IFRS 16 ‘Leases’ as discussed on pages 150-152 as well as other restatements relating to the recording of a provision for property dilapidations and the capitalisation of leakage detection costs, which are discussed on page 152.
2 Borrowing costs of £94.2 million (2019: £102.7 million) relating to tangible assets that have been capitalised are included within “Purchase of property, plant and equipment” under investing activities. Borrowing costs of £3.4 million (2019: £6.6 million) relating to intangible assets that have been capitalised are included within “Purchase of intangible assets” under investing activities.
Thames Water Combined Report 2019/20 142Strategic report Governance Financial statements Annual performance report
Accounting policies
The principal accounting policies adopted in the preparation of these consolidated and company financial statements, which have been applied consistently, unless otherwise stated, are set out below.
General informationThames Water Utilities Limited (“the Company”) is a private limited company incorporated and domiciled in the United Kingdom under the Companies Act 2006. The trading address and address of the registered office is Clearwater Court, Vastern Road, Reading, RG1 8DB.
The Company’s principal activity is that of an appointed water and wastewater services provider, including acting as a retailer for household customers in London, the Thames Valley and surrounding area in accordance with its licence of appointment. The Company is also an intermediate holding company within the Kemble Water Holdings Limited Group of companies (“the Kemble Water Holdings Group”).
During 2017/18, the Company announced its decision to close down its Cayman Islands Subsidiaries, Thames Water Utilities Cayman Finance Limited (“TWUCF”) and Thames Water Utilities Cayman Finance Holdings Limited (“TWUCFH”). The companies transferred the assets and liabilities to Thames Water Utilities Finance Plc (“TWUF”) on 31 August 2018 as a result of the above decision The Cayman Islands entities ceased to be subsidiaries of the Company on 27 September 2018. They were formally dissolved on 28 February 2019 and are no longer companies that exist within the Kemble Water Holdings Group. The results of the Cayman entities, up until they ceased to be subsidiaries of the Company, are included in the income statement for the year ended 31 March 2019.
As at 31 March 2020, the Group includes the Company and Thames Water Utilities Finance Plc (“TWUF”) as its sole subsidiary.
Statement of compliance with International Financial Reporting StandardsThe policies applied in these consolidated financial statements for the year ended 31 March 2020 are based on the IFRS, International Accounting Standards (“IAS”) and International Financial Reporting Interpretations Committee (“IFRS IC”) interpretations issued and effective and ratified by the EU as of 29 June 2020, the date that the Board of Directors approved these financial statements. The Company only financial statements are also prepared under EU-IFRS.
Basis of PreparationThe financial statements have been prepared in accordance with The Companies Act 2006 as applicable to companies using IFRS. IFRS 9 and IFRS 15 are applicable for the year ended 31 March 2020 and comparative period 31 March 2019. Financial information relating to year ended 31 March 2018 was restated to reflect IFRS 9 and IFRS 15.
Going concernThe consolidated financial statements for the year ended 31 March 2020, set out on pages 138-142, have been prepared on the going concern basis, under the historical cost convention, as modified by the revaluation of certain financial assets and liabilities at fair value, and the Disclosure and Transparency Rules (“DTR”) issued by the Financial Conduct Authority.
The Group has considerable financial resources, a strong liquidity position, ongoing revenue streams and a great diversification of customer types. Revenue includes the set amounts which can be expected to be collected from customers and the rewards/penalties associated with operational out/under performance compared against certain targets set by the regulator.
The water sector in England and Wales has been much less affected to date than many other sectors by the COVID-19 pandemic. The existing regulatory framework provides protection against reduced revenues arising from lower consumption and the regulatory recovery mechanisms ensure that the economic value impact is generally immaterial. In addition, the impact of COVID-19 on the Group’s ability to provide essential water and wastewater services has been mitigated through Government’s recognition that these services are essential and the Group’s quick response to enable effective working practices in the challenging operational environment. Moody’s, a credit rating agency, identified the water industry as having low exposure to the coronavirus.
Management has assessed the likely impact of COVID-19 to the financial position of the Group, with particular focus on operating cashflows and the AMP7 capital programme, and currently predicts a short-term reduction in cash receipts and a deferral of a reasonable portion of the capital programme into future AMP7 years. The cash receipts impact is anticipated to come from deferred payments from household customers and lower billable volumes in the non-household sector, due to reduced consumption. Management has analysed scenarios to assess its going concern, which include plausible and severe downside scenarios, and in all cases we are a going concern in compliance with covenants and have adequate liquidity for a period of at least 12 months from the signing of these financial statements. To mitigate the impact of potential lower cash collections, Management are closely reviewing the operating cashflow, assessing and implementing changes to the collections process and the cost base in a considered manner to ensure optimal financial and operational performance. There remains a risk that the impact of COVID-19 is greater than that modelled by the Group.
As a consequence of these factors and having accepted the five year plan for 2020-2025 (the Final Determination), the Directors believe that the Group is well placed to manage its business risks successfully and have a reasonable expectation that the Group has adequate resources to continue in operational existence for the foreseeable future.
Basis of ConsolidationThe Group’s consolidated financial statements consolidate the financial statements of the Company and it’s sole subsidiary. A subsidiary is an entity over which the Group has control. The Group has control over an entity where the Group is exposed to, or has the rights to, variable returns from its involvement with the entity and has the power over the entity to affect those returns.
Refer to the ‘General information’ section above for information on the Group.
Bazalgette Tunnel Limited (“BTL”) arrangement Bazalgette Tunnel Limited (“BTL”) is an independent company, appointed in 2015 to construct the Thames Tideway Tunnel. We have recognised revenue, cost and profit on the arrangement with BTL and disclosed our underlying performance separately, as required by some of our financial covenants.
The arrangement with BTL and Ofwat means the Group has included amounts to recover costs of the Thames Tideway Tunnel within its bills to wastewater customers. As cash is collected, these amounts are subsequently paid to BTL, under the ‘pay when paid’ principle.
Accounting standards require the Group to present the amounts billed as revenue in our financial statements, and with an associated cost representing bad debt on amounts billed, this also gives rise to reporting profit which is taxable. This non-appointed revenue, cost and profit are excluded from our key performance indicators, which is consistent with our financial covenants. The revenue, cost and resulting profit on this arrangement is disclosed separately to the Group’s underlying performance in the financial statements. As a result of this arrangement, a prepayment is created and recorded by the Group as BTL will transfer the use of the tunnel to Thames Water Utilities Limited once construction is complete, against which this prepayment will be utilised.
Thames Water Combined Report 2019/20 143Strategic report Governance Financial statements Annual performance report

Accounting policies continued
Revenue recognitionThe core principle of IFRS 15 “Revenue from Contracts with Customers” requires an entity to recognise revenue to depict the transfer of goods or services to customers in an amount that reflects the consideration that it expects to be entitled to in exchange for transferring those goods or services to the customer. The Company has a variety of customers including, household customers, non-household retailers and other Water Only Companies (“WOCs”).
Revenue is recognised when, or as, the performance obligations to the customer are satisfied. Consideration received in advance of recognising the associated revenue from the customer is recorded within contract liabilities (deferred income). Bad debt on bills raised in the year considered uncollectable based on historical experience is excluded from revenue, as it does not fall within the IFRS 15 criteria, to ensure that revenue is recorded at the amount which the Group expects to receive for providing its services to customers.
The Company considers the performance obligation associated with its core revenue to be the continued provision of water and wastewater services to customers.
The Company considers the performance obligation associated with Service Connections, Requisitions and Diversions to be the delivery of the associated asset and accordingly recognises this income over time. As such this income will be recognised on an individual basis in accordance with the delivery profile of each scheme. Typically amounts received in respect of service connections will be fully recognised within a year following receipt, however Requisitions & Diversions encompass a wide variety of schemes from those with short durations that would be fully recognised by the end of the year following receipt to large multi-phase developments for which income could be recognised over the course of several years.
For infrastructure charges the Company considers its performance commitment to align with its obligation to incur the expense to which the income relates, being the depreciation charge of the associated network reinforcement assets.
Revenue includes an estimate of the amount of mains water and wastewater charges unbilled at the period end, which are recorded within contract assets (accrued income). The usage is estimated using a defined methodology based upon historical data and assumptions.
For unmeasured customers, the amount to be billed is dependent upon the rateable value of the property, as assessed by an independent rating officer. The amount billed, typically in advance of delivery, is recorded within contract liabilities (deferred income) and is apportioned to revenue over the period to which the bill relates.
When the Group identifies the occupants the bill is billed in the customer’s name. If the Group has not identified an occupant within six months, and the bill remains unpaid, the bill is cancelled and the property is classified as empty.
Revenue includes amounts that the Group billed to wastewater customers in respect of construction costs for the Thames Tideway Tunnel. This is discussed in the BTL arrangement section above (on page 143).
Refer to page 154 for critical estimates and significant judgements around revenue.
Interest incomeInterest income is accrued on a time basis by reference to the principal outstanding and the Effective Interest Rate (“EIR”) applicable. The EIR is the rate that exactly discounts the estimated future cash receipts over the expected life of the financial instrument or a shorter period, where appropriate, to the net carrying amount of the financial asset or liability. Interest income is presented within finance income in the consolidated income statement.
Interest expenseInterest expense is accrued on a time basis by reference to the principal outstanding and the Effective Interest Rate (“EIR”) applicable. The EIR is the rate that exactly discounts the estimated future cash payments over the expected life of the financial instrument or a shorter period, where appropriate, to the net carrying amount of the financial asset or liability. Interest expense is presented within finance expense in the consolidated income statement.
Contract assetsContract assets are presented in the statement of financial position when the Group’s right to consideration is met in advance of billing. The Group applies the IFRS 9 simplified approach to measuring expected credit losses which uses a lifetime expected loss allowance. Refer to the “Trade and other receivables” below for more information.
Contract liabilitiesContract liabilities are presented in the statement of financial position where a customer has paid an amount of consideration prior to the Group performing the transfer of the related good or service to the customer. An example would be for an unmeasured customer where the amount billed is dependent upon the rateable value of the property. The amount is billed at the start of the financial year and is apportioned to revenue over the period. In addition, included within contract liabilities is deferred revenue in relation to nil cost assets adopted during the year and receipts in advance from our capital projects.
Net gains/(losses) on financial instrumentsThe Group raises debt in a variety of currencies and uses derivative contracts to manage the foreign exchange risk exposure on this debt. The Group also uses derivative contracts to manage interest rate and inflation risk.
Borrowings denominated in foreign currencies at the financial reporting date are retranslated to the functional currency at the foreign exchange rate ruling at that date. Foreign exchange differences arising on translation are recognised in the income statement as net losses / gains on financial instruments. The following are also recognised in the income statement as net losses / gains on financial instruments:
• movement in fair values of derivatives, which are not designated as hedging instruments, and
• in case of derivatives which are designated as hedging instruments, amounts recycled from cash flow hedge reserve.
Net gains/ (losses) on financial instruments do not include any interest expense or income. Refer to Derivative financial instrument and hedging accounting policy on page 149 for more details.
TaxationTax on the profit or loss for the period comprises current and deferred tax. Tax is recognised in the consolidated income statement except to the extent that it relates to items recognised directly within equity, in which case it is recognised within the consolidated statement of other comprehensive income.
Current taxCurrent tax is the expected tax payable or receivable on the taxable profit or loss for the period, using tax rates enacted or substantively enacted at the balance sheet date, and any adjustments to tax payable in respect of previous periods.
Taxable profit differs from the profit on ordinary activities before tax as reported in the income statement as it excludes items of income or expense that are taxable or deductible in other periods and items that are never taxable or deductible. It also includes the effect of tax allowances.
Thames Water Combined Report 2019/20 144Strategic report Governance Financial statements Annual performance report

Accounting policies continued
Deferred taxDeferred tax is the tax expected to be payable or recoverable on differences between the carrying amounts of assets and liabilities in the financial statements and the corresponding tax bases used in the computation of taxable profit, and is accounted for using the balance sheet liability method. Deferred tax is measured on a non-discounted basis using tax rates enacted or substantively enacted at the balance sheet date and that are expected to apply in the period when the deferred tax asset is realised or the deferred tax liability is settled.
Deferred tax liabilities are generally recognised for all taxable temporary differences. Deferred tax assets are recognised only to the extent that it is probable that sufficient future taxable profits will be available against which deductible temporary differences can be utilised.
Deferred tax assets and deferred tax liabilities are offset when there is a legally enforceable right to set off tax assets against tax liabilities and when they relate to income taxes levied by the same taxation authority and the Group intends to settle its current tax assets and liabilities on a net basis.
Uncertain tax positionsTax rules can be subject to interpretation and a tax provision is recognised where it is considered more likely than not that an amount will be paid to the tax authorities. Management use their experience, and seek professional advice where appropriate, to prudently assess the likelihood of an outflow arising. The amount recognised is the single most likely outcome. As at 31 March 2020, there are no uncertain tax positions (2019: none).
Non-current intangible assetsSeparately acquired intangible assets are stated at cost, less accumulated amortisation and any provision for impairment. Amortisation is charged to the income statement on a straight-line basis over the estimated useful economic life of the intangible asset from the date the intangible asset becomes available for use. The estimated useful economic lives are as follows:
Years
Software 5–10
Assets under development are not amortised until they are commissioned. Borrowing costs that have been capitalised within purchase of intangible assets are included within “Purchase of intangible assets” within investing activities in the statement of cash flows. All other borrowing costs are included as finance expenses within the consolidated income statement.
Property, plant and equipmentProperty, Plant and Equipment (“PP&E”) is comprised of network assets (including water mains, sewers, pumped raw water storage reservoirs and sludge pipelines) and non-network assets (including buildings, operational structures and fixtures & fittings). PP&E is stated at cost (or at deemed cost in the case of network assets, being the fair value at the date of transition to IFRS) less accumulated depreciation and provision for impairment.
The Group capitalises the directly attributable costs of procuring and constructing PP&E, which include labour and other internal costs incremental to the business. Subsequent costs are capitalised only when it is probable that future economic benefits associated with the item will flow to the Group and the cost can be measured reliably.
Where a qualifying asset takes a substantial period of time to get ready for its intended use, the borrowing costs directly attributable to the acquisition, construction or production of the asset are added to the cost. Borrowing costs that have been capitalised within purchase of property, plant and equipment are included within “Purchase of property, plant and
equipment” within investing activities in the statement of cash flows. All other borrowing costs are included as finance expenses within the consolidated income statement.
Where items of PP&E are transferred to the Group from customers or developers, generally in the form of adopted water mains, self-lay sewers or adopted pumping stations, the fair value of the asset transferred is recognised in the statement of financial position. Fair value is determined based on estimated replacement cost. Where the transfer is in exchange for connection to the network and there is no further obligation for ongoing services, the corresponding credit is recognised immediately within other operating income. Where the transfer is considered to be linked to the provision of ongoing services, the corresponding credit is recorded in contract liabilities (deferred income) and is released to other operating income over the expected useful economic lives of the associated assets. Please refer to the contract liabilities accounting policy on page 144.
PP&E is depreciated to its estimated residual value over its estimated useful life, with the exception of freehold land which is not depreciated. Assets in the course of construction are not depreciated until they are commissioned. The estimated useful economic lives are as follows and refer to non-current assets disclosed in note 10:
Years
Network assets:Reservoirs 250Strategic sewer components 200Wastewater network assets 150Water network assets 80–100Raw water tunnels and aqueducts 80
Non-network assets:Land and buildings: Buildings 15–60Operational structures 30–100
Plant and equipment:Other operational assets 7–40Fixtures & fittings 5–7Vehicles 4–5Computers 3–5Fixed and mobile plant 4–60
Leased assetsRefer to pages 150-152 for the impact of new accounting standards on leases.
On completion of construction of the Thames Tideway Tunnel, substantially all the risks and rewards of ownership will lie with the Group. The Group will therefore account for the transaction arrangement with BTL post construction in accordance with IFRS 16 ‘Leases’. The tunnel will be recognised as a right of use asset and depreciated over the life of the contract. On inception of the contract, the tunnel will be recognised at fair value, being the BTL prepayment (refer to BTL arrangement section on pages 143-144) plus the present value of the future minimum contract payments, with a corresponding liability being recognised as a lease liability. Interest will be recognised in the income statement over the period of the lease.
Thames Water Combined Report 2019/20 145Strategic report Governance Financial statements Annual performance report

Accounting policies continued
Impairment of non-financial assetsThe carrying amounts of the Group’s non-financial assets, other than inventories and deferred tax assets, are reviewed at each financial reporting date to determine whether there is any indication of impairment. If any such indication exists then the recoverable amount of the asset is estimated, which is the greater of its value in use and its fair value less costs to sell. In assessing value in use, the estimated future cash flows are discounted to their present value using a pre-tax discount rate that reflects current market assessments of the time value of money and the risks specific to the asset.
For the purpose of impairment testing, assets that cannot be tested individually are grouped together into the smallest group of assets that generate cash inflows from continuing use that are largely independent of the cash inflows of other assets or groups of assets (the “cash-generating unit”). Management do not consider there to be any significant judgements relating to the impairment of non-financial assets.
An impairment loss is recognised if the carrying amount of an asset or its cash generating unit exceeds its estimated recoverable amount. Impairment losses are recognised in the income statement, and those recognised in prior periods are assessed at each financial reporting date for any indications that the loss has decreased or no longer exists.
Investment in subsidiary undertakingInvestment in subsidiary undertaking is stated at cost, less any provision for impairment. This impairment would be recognised within the Company only Income Statement. An impairment review is performed on an annual basis.
Non-derivative financial instrumentsTrade and other receivables (excluding prepayments)Trade receivables are measured at their transaction price on initial recognition and subsequently at amortised cost using the effective interest method. Other receivables such as loans or insurance receivables are recognised at fair value on initial recognition.
Included within other receivables are amounts owed to the Group in respect of insurance claims. Insurance receivables and these other receivables are only recognised when the Group is virtually certain that the amount will be recoverable.
IFRS 9 requires an entity to reduce the gross carrying amount of a financial asset when the entity has ‘no reasonable expectations of recovering’ a financial asset. Write-offs are recognised as an expense within operating costs and can relate to a financial asset in its entirety or to a portion of it.
Expected credit lossesThe Group applies the IFRS 9 simplified approach to measuring expected credit losses which uses a lifetime expected loss allowance for all trade receivables, contract assets and insurance claims receivable. The Group’s assessment for calculating expected credit losses is made by reference to its historical collection experience, including comparisons of the relative age of the individual balance and the consideration of the actual write-off history. The provisioning rates applied in the calculation are reviewed on an annual basis to reflect the latest historical collection performance data and management’s expectation of future performance and industry trends. Management has considered the impact of COVID-19 and has increased the provision to reflect the expected adverse impact on customers’ ability to pay their water and wastewater bills.
There are three main types of customer for which an expected credit losses provision is calculated, directly billed customers, indirectly billed (such as non-household customers billed through non-household retailers) and billed through WOCs. There is also bad debt associated with the BTL arrangement.
(i) Directly billed and indirectly billed customersAn expected credit losses model is used to calculate the provision for directly and indirectly billed customers. This uses performance in the year to determine the level of provision required. The model takes the closing receivables balance and then deducts the amounts that are expected to be collected or cancelled based on performance in the year. The amount that remains will be uncollectable and therefore needs to be covered by an expected credit losses provision. Debt that is older than 5 years is fully provided for. There are also provisions to cover billing that is cancelled and not rebilled and also the collectability of any rebilling.
(ii) WOCsA provision is also made against debts due from Water Only Companies (WOCs) who bill their customers for sewerage services provided by the Group. As the bills relate to services provided by the Group, and the WOCs are acting in an agent capacity, any associated bad debt rests with the Group. As detailed information about the debt, including the ageing, is not readily available, the level of provision is therefore based on write offs covering a three-year period – prior year, current year and forecast for the year ahead.
(iii) BTLThe arrangement with BTL means the Group has included construction costs of the Thames Tideway Tunnel within its bills to wastewater customers. As cash is collected, these amounts are subsequently paid to BTL. This arrangement gives rise to recognising revenue within the Group and associated bad debt. Refer to pages 143-144 for more information on the BTL arrangement.
Impact of COVID-19COVID-19 is predicted to have an impact on cash collection as employment rates worsen and people find themselves unable to pay their water and wastewater bills. To help assess the implications on debtors and level of additional provision required, a range of outcomes impacting billing and collections performance were developed using available data. Subsequently, management has increased the provision by £15.2 million across directly billed customers and WOCs. No adjustment has been made for indirectly billed non-household customers as Management have assessed the future cash flows and the risk of non-payment was considered to be low.
Intercompany loans receivable Interest bearing loans issued to other group companies are initially recognised at fair value plus transaction costs that are directly attributable to the acquisition of the financial asset. They are subsequently measured at amortised cost using the effective interest rate method, less any provision for impairment. The amortisation is included within finance income in the income statement and is calculated by taking into account any discount or premium on acquisition and fees or costs that are an integral part of the effective interest rate. If an intercompany loan receivable continues to have an investment grade rating, then IFRS 9 permits an assumption that there has been no significant increase in credit risk. As such given the investment grade credit rating, an assessment of the 12 month expected credit loss is permitted rather than a lifetime credit loss assessment as per ‘stage 1’ of the IFRS 9 impairment model.
Thames Water Combined Report 2019/20 146Strategic report Governance Financial statements Annual performance report

Accounting policies continued
Trade and other payables (excluding other taxation and social security)Trade and other payables (excluding other taxation and social security) represent liabilities for goods and services provided to the Group prior to the end of the reporting period which are unpaid. These amounts are usually unsecured and are provided with credit terms of payment.
Trade and other payables are recognised in the statement of financial position when it is probable that an outflow of resources embodying economic benefits will result from the settlement of a present obligation and the amount at which the settlement will take place can be measured reliably. These conditions are satisfied when goods and services have been supplied to the Group. Therefore, payables and accruals must be recognised when goods and services have been received.
Trade and other payables include amounts owed to BTL that represent revenue collected and due to BTL for the construction of the Thames Tideway Tunnel, which have not yet been paid at the reporting date.
Cash and cash equivalentsCash and cash equivalents include cash on hand, deposits held at call with financial institutions, other short-term, highly liquid investments with original maturities of three months or less that are readily convertible to known amounts of cash and which are subject to an insignificant risk of changes in value.
Included within cash and cash equivalents are amounts collected in relation to BTL revenue which have not yet been paid across to BTL at the reporting date.
Short-term investmentsShort-term investments include term deposits which are not readily convertible into cash.
Interest bearing borrowings including those issued to other group companiesInterest bearing borrowings are financial liabilities recognised initially at fair value less attributable transaction costs and subsequently at amortised cost using the effective interest method.
An exchange or modification of interest-bearing borrowing with substantially different terms is accounted for as an extinguishment of the original financial liability and the recognition of new financial liability, with any costs or fees incurred are recognised as part of the gain or loss on the extinguishment. In case of exchange or modification of interest-bearing borrowings without substantially different terms, the difference between net present value of existing contractual cash flows and modified contractual cash flows, both discounted at the original effective interest rate, is recognised as a modification gain or loss on the income statement.
Inventories and current intangible assetsInventories are stated at the lower of cost and net realisable value (“NRV”).
Current intangible assets relate to purchased carbon emission allowances (relating to the emission of carbon dioxide in the UK) and are stated at cost, less accumulated amortisation and any provision for impairment. A provision is simultaneously recorded in respect of the obligation to deliver emission allowances in the period in which the emissions are made and the associated charge is recognised as an operating expense within the income statement. This is no longer relevant as at 31 March 2020 and beyond as the scheme has been closed.
PrepaymentsPrepayments are recorded where the Group has paid for goods or services before delivery of those goods or services. Included within prepayments are amounts paid and payable to BTL which represent a prepayment for the use of the Thames Tideway Tunnel once the tunnel has been constructed and is available for use. For more information on the BTL arrangement, refer to pages 143-144.
Retirement and other employment benefitsDefined benefit schemesThe Group operates two, independently administered, defined benefit pension schemes, both of which are closed to new employees. Actuarial valuations are carried out as determined by the Trustees, at intervals of not more than three years. The rates of contributions payable and the pension cost are determined on the advice of the actuaries, having regard to the results of these valuations.
The difference between the value of defined benefit pension scheme assets and liabilities is recorded within the statement of financial position as a retirement benefit surplus or deficit. A retirement benefit surplus is only recognised if the assessment contained within the accounting standard IFRIC 14 IAS 19 ‘The Limit of a Defined Benefit Asset, Minimum Funding Requirements and their Interaction’ is met, i.e. that the entity has an unconditional right to a refund or to reductions in future contributions on the wind-up of the pension scheme. In the prior year, following a review of the approach Management concluded that it was appropriate to recognise a surplus relating to the TWMIPS scheme.
Defined benefit pension scheme assets are measured at fair value using the bid price for assets with quoted prices. Defined benefit pension scheme liabilities are measured at the reporting date by an independent actuary using the projected unit credit method and discounted at the current rate of return on high quality bonds of equivalent term and currency to the liability.
Service costs, representing the cost of employee service in the period, and scheme administration expenses are included within operating expenses in the income statement. The net finance cost is calculated by applying the discount rate used for the scheme liabilities to the net (deficit) / surplus.
Changes in the retirement benefit surplus or obligation may arise from:
• differences between the return on scheme assets and interest included in the income statement;
• actuarial gains and losses from experience adjustments; or
• changes in demographic or financial assumptions.
Such changes are classified as re-measurements and are charged or credited to equity and recorded within the statement of other comprehensive income in the period in which they arise.
Defined contribution schemesThe Group operates a Defined Contribution Pension Scheme (“DCPS”) managed through Standard Life Assurance Limited. From 1 April 2011 the DCPS is the only scheme to which new employees of the Group are eligible. The assets of the DCPS are held separately from those of the Group and obligations for contributions to the scheme are recognised as an expense in the income statement in the periods during which they fall due.
The Group also operates a closed defined contribution pension scheme. The Group has no further payment obligations, however defined funds for some former employees are held within this scheme.
Thames Water Combined Report 2019/20 147Strategic report Governance Financial statements Annual performance report

Accounting policies continued
Long-term incentive plans (“LTIP”) and bonusCash based LTIP awards are accrued in the financial statements for the duration of the award. The accrual is based on the values assessed for the applicable schemes, taking into account the duration of the individual scheme, and by comparing the Company’s performance against the assumptions used to award payments. These are recognised as the present value of the benefit obligation. Where Company’s performance does not meet the criteria for the LTIP to be awarded, no accruals are recognised.
LTIP 2019/20 is a three year LTIP scheme with a performance period from 1 April 2019 to 31 March 2022. The targets for the LTIP have been set to deliver critical elements of the Company’s stretching business plan and 80% of the targets are focused on delivery of key customer outcomes including the delivery of leakage and environmental targets. This management incentive was accrued during the period based on management’s assessment of performance against the targets set. This incentive entitles the eligible senior management to an amount of up to 100% of their salary with a maximum payment of 200% for delivery of stretch targets.
The transformation incentive was based on performance over a 2-year period from 1 April 2018 to 31 March 2020. The targets were focused on critical customer, environmental, operational and regulatory outcomes. The transformation incentive was accrued during the period based on management’s assessment of performance against the targets set. This incentive entitles the eligible senior management to an amount of up to 100% of their salary following the end of the performance period.
Bonus payments are accrued in the period based on assessments of performance against targets set at the beginning of the financial year. Bonuses are paid in the following financial year, once performance has been measured against targets set.
Share in Your Success 2020 was introduced in the 2017/18 financial year. The scheme’s performance period runs from April 2017 to March 2020 and is open to all non-manager grade employees. The scheme entitles eligible employees to earn an amount of up to 5% of their salary following the end of the performance period.
Provisions for liabilities and chargesProvisions are recognised when:
• the Group has a present legal or constructive obligation as a result of past events;
• it is probable that an outflow of resources will be required to settle the obligation; and
• the amount can be reliably estimated.
Provisions for insured liabilities arise from insurance claims from third parties received by the Group and are recognised or released by assessing their adequacy using current estimates of future cash flows under insurance contracts. Where we have insurance cover for these claims, we recognise a receivable for the reimbursement value from third party insurance companies net of retentions. The timing for the insurance claims are uncertain and therefore both the liability and receivable have been recognised as non-current.
Provisions are discounted to present value using a pre-tax discount rate that reflects the risks specific to the liability, where the effect is material.
Outcome delivery incentivesThe Asset Management Plan (“AMP”) is the five-year period covered by a water company’s business plan. The current period 1 April 2015 to 31 March 2020 is known as AMP6, and the period for which we have recently submitted our plan and accepted the Final Determination, 1 April 2020 to 31 March 2025 is known as AMP7.
Outcome delivery incentives (“ODIs”) were introduced by Ofwat in the price determination process covering AMP6. The price determination process is undertaken by Ofwat where they determine the amount of revenues that can be earned from customer bills for delivering an agreed level of service.
ODIs introduce rewards for providing a service which exceeds the level committed and may incur penalties for delivering a lower level of service. These rewards and penalties are in the form of revenue adjustments or Regulatory Capital Value (“RCV”) adjustments. The Group adjusts future tariffs to reflect such amounts in response to the change in amount of revenues that the Group is entitled to earn over the AMP period. The ability to benefit from such increases or suffer from decreases is linked to the provision of future services as well as future performance over the rate setting period and therefore, is not an asset or liability (right or obligation) at the balance sheet date.
There is no financial reward or penalty in the rate setting period in which the ODI is incurred, and accordingly there is no accounting required. Instead, the reward or penalty is reflected in the following AMP period by way of increased or reduced revenues respectively. Ofwat assesses companies’ operational performance against agreed performance commitments. Each performance commitment contains an ODI, which can carry a financial reward or penalty or both that will be realised as part of the next price review process in the form of revenue or RCV adjustments. The Group does not recognise a provision for penalties or rewards in the financial year in which they are incurred or achieved, as the financial impact is realised in future AMPs.
Refer to ‘Outcome performance table’ in the Annual Performance Report on pages 236-240 for the summary of rewards and penalties incurred in AMP6.
Risks, opportunities and innovation (“ROI”) fundsThe Group has entered into certain alliance arrangements with a number of third parties. The alliance agreements include incentive mechanisms which result in the alliance partners sharing in any over or underspend on contracted works. Remuneration for services provided under the contract are also linked to TWUL’s performance commitments. During the year ended 31 March 2020 there were two alliances responsible for delivering works over AMP6 (2019: two).
A notional ROI fund for each alliance is created and built up over the AMP period and is ultimately paid to alliance partners at contractual percentages. This occurs once certain conditions are satisfied, as specified in the alliance contracts between the Group and the alliance partners.
A provision for ROI amounts is recognised when the Group has a present legal or constructive obligation as a result of past events; it is probable that an outflow of resources will be required to settle the obligation; and the amount can be reliably estimated. Conversely, a receivable for ROI will be recognised when: the Group has a right to receive cash at a future date; the amount can be reliably estimated; and receipt is virtually certain.
ROI amounts arising from an over or underspend against the contracted cost for a capital project, where the spend is directly attributable to the asset created, are deemed to be an integral cost in bringing an asset into the condition and location for use as intended by management. They are therefore capitalised as part of the cost of the asset and depreciated over the asset’s useful life.
ROI amounts arising from operating expenditure over or underspend against the contracted cost, where spend cannot be directly attributed to a capital asset, are recognised directly in operating expenses as the spend is incurred.
ROI amounts linked to an ODI or Service Incentive Mechanism (“SIM”) penalty or reward are recognised in the income statement at the point the penalty has been incurred or reward has been achieved.
Thames Water Combined Report 2019/20 148Strategic report Governance Financial statements Annual performance report
Accounting policies continued
Derivative financial instruments and hedgingDerivatives are used to manage exposure to movements in interest rates, foreign exchange rates and inflation. Derivatives are measured at fair value at each financial reporting date, using the methodology described in note 18.
Derivative financial instruments not designated as hedging instrumentsInitially recognition is at fair value, with transaction costs being taken to the income statement. Gains or losses on re-measurement to fair value are recognised immediately in the income statement.
Derivative financial instruments designated as hedging instrumentsThe group uses derivative financial instruments, such as forward starting interest rate swaps to hedge its interest rate risks. At the inception of each hedge relationship the Group documents:
• the relationship between the hedging instrument and the hedged item;
• its risk management objectives and strategy for undertaking the hedge transaction; and
• the results of tests to determine whether the hedging instrument is expected to be highly effective in offsetting changes in cash flows or fair values (as applicable) of the hedged item.
The economic relationship between the hedge item and the hedging instrument is determined by analysing the critical terms of the hedge relationship i.e. qualitative assessment of effectiveness is performed. Hedge ineffectiveness is determined at the inception of the hedge relationship, and through periodic prospective effectiveness assessment. The group uses hypothetical derivative method to assess effectiveness. Changes in critical terms and changes in credit rating may result in ineffectiveness. Hedge accounting discontinues when the hedging instrument no longer qualifies for hedge accounting.
Cash flow hedgesThe effective part of any gain or loss on the derivative financial instrument designated as a cash flow hedge is recognised directly in the cash flow hedge reserve. Any ineffective portion of the hedge is recognised immediately in the income statement as net gains/(losses) on financial instruments. When a hedging instrument expires or is sold, terminated or exercised, or the Group revokes designation of the hedge relationship but the hedged forecast transaction is still expected to occur, the cumulative gain or loss at that point remains in the cash flow hedge reserve within equity and is recognised in accordance with the above policy when the transaction occurs. If the hedged transaction is no longer expected to take place, the cumulative unrealised gain or loss recognised in equity is recognised in the income statement immediately as net gains/(losses) on financial instruments.
Embedded derivativesWhere a contract includes terms that cause some of its cash flows to vary in a similar way to a derivative financial instrument, that part of the contract is considered to be an embedded derivative. Embedded derivatives are separated from the host contract and measured at fair value with gains and losses taken to the income statement if:
• the risks and characteristics of the embedded derivative are not closely related to those of the host contract; and
• the contract is not carried at fair value with gains and losses reported in the income statement.
In all other cases embedded derivatives are accounted for in line with the accounting policy for the contract as a whole.
Offsetting financial instrumentsFinancial assets and financial liabilities are offset and the net amount reported in the statement of financial position if there is currently and in all circumstances an enforceable legal right to offset the recognised amounts and there is an intention to settle on a net basis or to realise the assets and settle the liabilities simultaneously.
Financial guaranteesThe Group is part of a Whole Business Securitisation (“WBS”) group as described in note 17. Companies in the WBS group raise debt in external debt markets through the issuance of secured bonds and loans. All companies in the WBS group guarantee the principal and interest payments due under the terms of the bonds. Where the Group enters into financial guarantee contracts to guarantee the indebtedness of other companies within this group, the Group considers these to be insurance arrangements and accounts for them as such. In this respect, the Group treats the guarantee contract as a contingent liability until such a time as it becomes probable that the Group will be required to make a payment under the guarantee.
Foreign currencyTransactions in foreign currencies are translated to sterling, the Group’s presentational currency, at the foreign exchange rate ruling at the date of the transaction.
Monetary assets and liabilities denominated in foreign currencies at the financial reporting date are retranslated to the functional currency at the foreign exchange rate ruling at that date. Foreign exchange differences arising on translation are recognised in the income statement except for differences arising on the retranslation of qualifying cash flow hedges, which are recognised directly in the cash flow hedge reserve.
Thames Water Combined Report 2019/20 149Strategic report Governance Financial statements Annual performance report

New accounting policies and financial reporting changes
The accounting policies adopted in the preparation of these financial statements are consistent with those of the previous financial year, with the exception of the policies noted below that have been adopted from 1 April 2019:
Exceptional itemsExceptional items are those charges or credits, and their associated tax effects, that are considered to be unusual by the Directors, either by nature or by scale and that are of such significance that separate disclosure is required for the financial statements to be properly understood by the users of the financial statements.
The determining factor for exceptional items is whether or not the item is considered unusual in nature, although exceptional charges may impact the same asset class or business segment over time. Market conditions that have deteriorated significantly over time will only be captured to the extent observable at the balance sheet date. Examples of items that may be considered exceptional include business restructuring and reorganisation or transformation costs, significant gains or losses on disposal, material impairment charges or reversals and provisions in relation to contractual settlements associated with significant disputes and claims.
The Directors consider that any individual gain or loss on disposal of greater than £30.0 million would be disclosed as being exceptional by nature of its scale. Other gains or losses on disposal below this level may be considered to be exceptional by reference to specific circumstances. These will be explained on a case-by-case basis where relevant.
Transition to new IFRSsRestatements to the comparative periods arising from the adoption of the new accounting standard IFRS 16 Leases, have been made.
IFRS 16: Leases BackgroundIFRS 16 Leases is effective for annual periods beginning on or after 1 January 2019 and such the Group and Company has applied the new accounting standard for the year ended 31 March 2020.
The Group and Company have applied the new rules retrospectively including the practical expedients permitted in the standard. As a result, the Group and Company have restated both comparative periods presented in the financial statements which include the financial periods ended 31 March 2018 and the 31 March 2019.
Restatements to the prior yearOn adoption of IFRS 16, the Group and Company have recognised right of use assets and associated lease liabilities in relation to certain leases which had previously been classified as ‘operating leases’ under the principles of the previous accounting standard, IAS 17 Leases. These liabilities were measured at the present value of the remaining lease payments, discounted at the borrowing rate applicable at inception of the lease. Please refer to Note 30 for full details of the adjustments made on transition.
This restatement to the prior year impacts the following Group disclosures:
• Consolidated income statement on page 138
• Consolidated statement of comprehensive income on page 138
• Consolidated statement of financial position on pages 139-140
• Consolidated statement of changes in equity on page 141
• Consolidated statement of cash flows on page 142
• Note 3 Operating expenses on pages 159-160
• Note 5 Finance income and finance expense on page 161
• Note 7 Taxation on pages 161-163
• Note 11 Leases on page 164
• Note 14 Trade and other receivables on pages 165-166
• Note 16 Trade and other payables on page 167
• Note 18 Financial Instruments on pages 169-175
• Note 27 Statement of cash flows on page 183
• Note 30 Restatements to the prior year on pages 185-189
This restatement to the prior year impacts the following Company disclosures:
• Statement of comprehensive income on page 190
• Statement of financial position on pages 191-192
• Statement of changes in equity on page 193
• Statement of cash flows on page 194
• Note 33 Trade and other receivables on pages 195-196
• Note 35 Trade and other payables on page 196
• Note 37 Financial Instrumentson pages 199-205
• Note 42 Statement of cash flows on page 207
• Note 45 Restatements to the prior year on pages 208-214
Thames Water Combined Report 2019/20 150Strategic report Governance Financial statements Annual performance report

New accounting policies and financial reporting changes continued
Recognition of Right of use assets and lease liabilitiesRefer to Note 30 Restatements to the prior year.
IFRS 16 Leases replaces IAS 17 Leases and related interpretations and sets out the principles for the classification, measurement, presentation and disclosure of lease arrangements. Under the provisions of IFRS 16, most leases, including those previously classified as operating leases, are recognised in the statement of financial position as both a right-of-use asset and a largely offsetting lease liability. The right-of-use asset and lease liability are both based on the present value of lease payments due over the term of the lease, with the asset being depreciated in accordance with IAS 16 Property, Plant and Equipment and the liability increased for the accretion of interest and reduced by lease payments.
In applying IFRS 16 for the first time, the Group has used the following practical expedients permitted by the standard:
• applying a single discount rate to a portfolio of leases with reasonably similar characteristics
• relying on previous assessments on whether leases are onerous as an alternative to performing an impairment review – there were no onerous contracts as at 1 April 2019
• accounting for operating leases with a remaining lease term of less than 12 months as at 1 April 2019 as short-term leases
• excluding initial direct costs for the measurement of the right-of-use asset at the date of initial application, and
• using hindsight in determining the lease term where the contract contains options to extend or terminate the lease
• contracts of low value (£5,000 as determined by the Group) will not be considered as leases
• the Group is not required to reassess whether a contract is, or contains, a lease at the date of initial application. The Group has therefore only applied IFRS 16 to contracts that were previously identified as leases under IAS 17 and IFRIC 4 with the date of initial application being 1 April 2019
Recognition of leasesAs a lesseeThe Group’s leasing activities consist of rentals payable for office properties and other land and buildings. Other rentals are short term or of low value. Lease terms are negotiated on an individual basis and contain a wide range of different terms and conditions. In previous years, the leasing activities of the Group consisted of solely operating leases. Payments made under operating leases were charged to the income statement on a straight-line basis over the period of the lease. The associated right-of-use assets for property leases were measured on a retrospective basis as if the new rules had always been applied.
A contract is, or contains, a lease if the contract conveys the right to control the use of an identified asset for a period of time in exchange for consideration. At commencement or on modification of a contract that contains a lease component, along with one or more other lease or non-lease components, the Group accounts for each lease component separately from the non-lease components. The Group allocates the consideration in the contract to each lease component on the basis of its relative stand-alone price and the aggregate stand-alone price of the non-lease components.
From 1 April 2019, leases are recognised as a right-of-use asset along with a corresponding liability with the date of recognition being the commencement date of the lease.
Right-of-use assetRight-of-use assets are recognised at cost comprising the following components:
• the amount of the initial measurement of lease liability;
• lease payments made less lease incentives received before the commencement date;
• initial direct costs; and
• restoration costs.
The right-of-use asset is depreciated over the lease term on a straight-line basis.
Lease liabilityLease liabilities include the net present value of the following lease payments:
• fixed payments (including in-substance fixed payments), less any lease incentives receivable;
• variable lease payments that are based on an index or a rate;
• amounts expected to be payable by the Group under residual value guarantees;
• the exercise price of a purchase option if the Group is reasonably certain to exercise that option; and
• payments of penalties for terminating the lease, if the lease term reflects the Group exercising that option.
The lease payment is discounted using the incremental borrowing rate “IBR”. The IBR is the rate of interest that the Group would have to pay to borrow the funds necessary to obtain the right-of-use asset in a similar economic environment at the date of lease inception.
The lease payment is allocated between the liability and the finance cost. The finance cost is recognised in the income statement within ‘finance expenses’ so as to produce a constant periodic rate of interest over the remaining balance of the liability for each period.
Lease payments represent rentals payable by the Group for certain office properties. Where the Group has the ability and intent to exit a property lease prior to the term end date and it is reasonably certain that this option will be exercised, we have only included lease payments up to the assumed lease exit date. The rent payable is not contingent in nature and the Group has the ability to mutually agree changes to the arrangement with the lessor.
The Group is subject to a loan covenant under which lease liabilities are classified as unsecured debt, the level of which cannot exceed a specified ratio of 0.8% as a percentage of RCV. However, leases that would have been identified as operating leases prior to the new standard do not contribute towards the specified ratio provided that the aggregate amount of financial indebtedness does not exceed a higher specified ratio of 2%.
Short-term leases and leases of low-value assets The Group has elected not to recognise right-of-use assets and lease liabilities for lease of low-value assets (£5,000) and short-term leases. The Group recognises the lease payments associated with these leases as an expense on a straight-line basis over the lease term.
Thames Water Combined Report 2019/20 151Strategic report Governance Financial statements Annual performance report
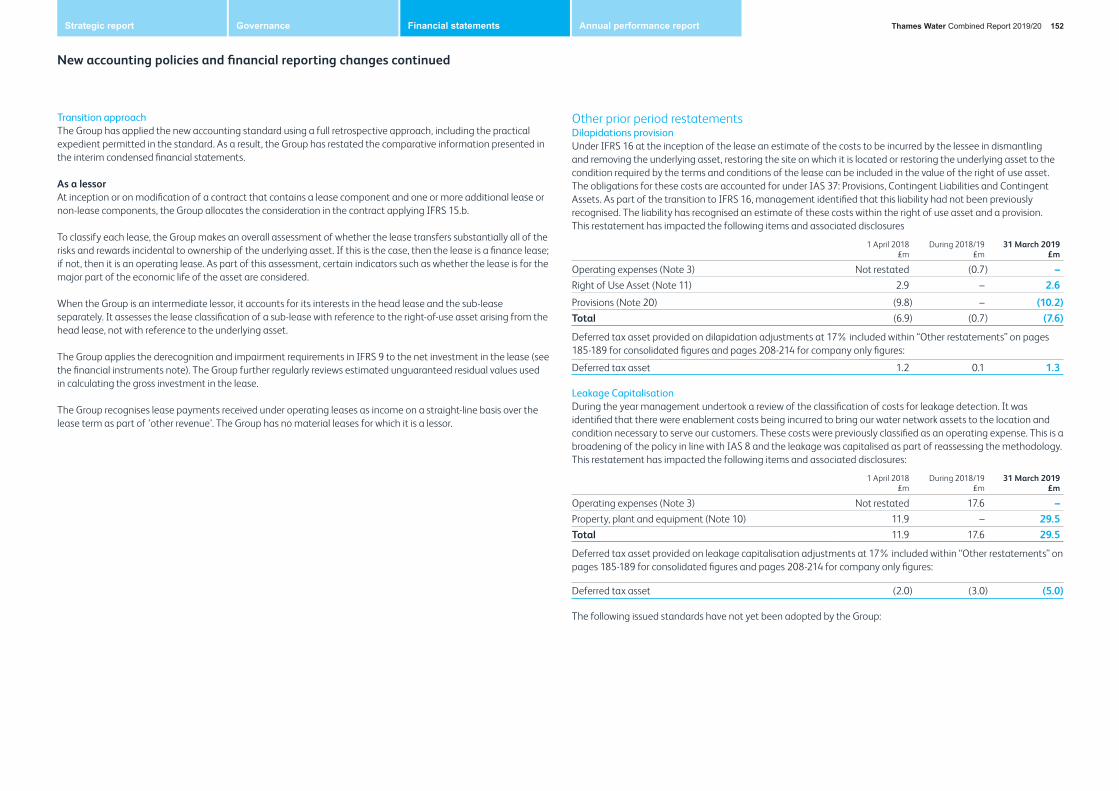
New accounting policies and financial reporting changes continued
Transition approachThe Group has applied the new accounting standard using a full retrospective approach, including the practical expedient permitted in the standard. As a result, the Group has restated the comparative information presented in the interim condensed financial statements.
As a lessorAt inception or on modification of a contract that contains a lease component and one or more additional lease or non-lease components, the Group allocates the consideration in the contract applying IFRS 15.b.
To classify each lease, the Group makes an overall assessment of whether the lease transfers substantially all of the risks and rewards incidental to ownership of the underlying asset. If this is the case, then the lease is a finance lease; if not, then it is an operating lease. As part of this assessment, certain indicators such as whether the lease is for the major part of the economic life of the asset are considered.
When the Group is an intermediate lessor, it accounts for its interests in the head lease and the sub-lease separately. It assesses the lease classification of a sub-lease with reference to the right-of-use asset arising from the head lease, not with reference to the underlying asset.
The Group applies the derecognition and impairment requirements in IFRS 9 to the net investment in the lease (see the financial instruments note). The Group further regularly reviews estimated unguaranteed residual values used in calculating the gross investment in the lease.
The Group recognises lease payments received under operating leases as income on a straight-line basis over the lease term as part of ‘other revenue’. The Group has no material leases for which it is a lessor.
Other prior period restatementsDilapidations provisionUnder IFRS 16 at the inception of the lease an estimate of the costs to be incurred by the lessee in dismantling and removing the underlying asset, restoring the site on which it is located or restoring the underlying asset to the condition required by the terms and conditions of the lease can be included in the value of the right of use asset. The obligations for these costs are accounted for under IAS 37: Provisions, Contingent Liabilities and Contingent Assets. As part of the transition to IFRS 16, management identified that this liability had not been previously recognised. The liability has recognised an estimate of these costs within the right of use asset and a provision. This restatement has impacted the following items and associated disclosures
1 April 2018 £m
During 2018/19£m
31 March 2019 £m
Operating expenses (Note 3) Not restated (0.7) –Right of Use Asset (Note 11) 2.9 – 2.6
Provisions (Note 20) (9.8) – (10.2)Total (6.9) (0.7) (7.6)
Deferred tax asset provided on dilapidation adjustments at 17% included within “Other restatements” on pages 185-189 for consolidated figures and pages 208-214 for company only figures:
Deferred tax asset 1.2 0.1 1.3
Leakage CapitalisationDuring the year management undertook a review of the classification of costs for leakage detection. It was identified that there were enablement costs being incurred to bring our water network assets to the location and condition necessary to serve our customers. These costs were previously classified as an operating expense. This is a broadening of the policy in line with IAS 8 and the leakage was capitalised as part of reassessing the methodology. This restatement has impacted the following items and associated disclosures:
1 April 2018 £m
During 2018/19£m
31 March 2019 £m
Operating expenses (Note 3) Not restated 17.6 –Property, plant and equipment (Note 10) 11.9 – 29.5Total 11.9 17.6 29.5
Deferred tax asset provided on leakage capitalisation adjustments at 17% included within “Other restatements” on pages 185-189 for consolidated figures and pages 208-214 for company only figures:
Deferred tax asset (2.0) (3.0) (5.0)
The following issued standards have not yet been adopted by the Group:
Thames Water Combined Report 2019/20 152Strategic report Governance Financial statements Annual performance report

New accounting policies and financial reporting changes continued
IBOR reformFollowing the financial crisis, the reform and replacement of benchmark interest rates such as the London Interbank Offer Rate (“LIBOR”) and other interbank offered rates (“IBORs”) has become a priority for global regulators. There is currently uncertainty around the timing and precise nature of these changes in the various jurisdictions affected.
We cannot rely on LIBOR being published after the end of 2021. It is currently expected that SONIA (Sterling Overnight Index Average) will replace GBP LIBOR as a reference rate. There are key differences between GBP LIBOR and SONIA. GBP LIBOR is a ‘term rate’, which means that it is published for a borrowing period (such as 3 months), and it is ‘forward-looking’, because it is published at the beginning of the borrowing period. SONIA is currently a ‘backward-looking’ rate; it is based on overnight rates from actual transactions, and it is published at the end of the overnight borrowing period. Furthermore, GBP LIBOR includes a credit spread over the risk-free rate, which SONIA does not explicitly incorporate. To transition existing contracts and agreements that reference GBP LIBOR to SONIA, adjustments for term differences and credit differences might need to be applied to SONIA, to enable the two benchmark rates to be economically equivalent on transition.
At the time of reporting, industry working groups are reviewing methodologies for calculating adjustments between GBP LIBOR and SONIA.
The Group is establishing a project to oversee the GBP LIBOR transition plan. This transition project will include changes to systems, processes, risk and valuation models, as well as managing related tax and accounting implications. The Group currently anticipates that the areas of greatest change will be amendments to the contractual terms of GBP LIBOR-referenced floating-rate debt and swaps.
The International Accounting Standards Board (“IASB”) has issued amendments to IFRS 9, IAS 39 and IFRS 7 in September 2019 that provide temporary relief from applying specific hedge accounting requirements to hedging relationships directly affected by IBOR reform. As at 31 March 2020, the Group had no designated hedge relationship and hedge accounting was not applied.
In addition to the IBOR reform, there are a number of other amendments and annual improvement project recommendations that are not yet effective but which have been endorsed by the EU. These are not anticipated to have a material impact on the financial statements of the Group.
Alternative performance measures In the reporting of financial information, the Directors have adopted various Alternative Performance Measures (“APMs”). These measures are not defined by IFRS and therefore may not be directly comparable with other companies’ APMs, including those in the Group’s industry. These APMs are not intended to be a substitute for, or superior to, IFRS measurements. Directors and management use APMs to provide additional useful information on the performance and position of the Company, and to enhance the comparability of information between reporting periods.
Capital expenditure (“capex”)Management review capex, which is the expenditure to acquire or upgrade tangible and intangible assets such as property, pipes, treatment works and software. The capex measure equates to intangible and tangible asset additions in the financial year including capitalised borrowing costs (see notes 9 and 10 respectively) and capital accruals.
Net debtNet debt is presented in note 18 on both a statutory and covenant basis. The covenant basis of net debt is the measure used when assessing the Group’s gearing (see below) against the level stipulated in the banking covenants. Net debt on a statutory basis consists of borrowings (including lease liabilities recorded under IFRS 16) less cash. Net debt on a covenant basis consists of borrowings less cash, excluding amounts owed to other group companies for which there is no related external debt, accrued interest, unamortised debt issuance costs and discounts, and including certain derivative financial liabilities as explained in note 18.
The Group is subject to a covenant under which lease liabilities are classified as unsecured debt. Refer to page 151 for more information.
Regulatory Capital Value (“RCV”)The RCV has been developed for regulatory purposes by Ofwat and is one of the critical components for setting our customers’ bills. When assessing the revenues that the Company needs, Ofwat consider the return on capital invested in the business, and the RCV is the capital base used in this assessment. There is no equivalent statutory measure.
GearingGearing is the percentage of the Company’s covenant net debt to RCV and is a key covenant ratio for the Group’s financing arrangements with its lenders. There is no equivalent statutory measure.
Post Maintenance Interest Cover Ratio (“PMICR”)PMICR measures the amount of underlying cash generated by operating activities of the Company, adjusted for RCV depreciation, relating to the interest paid on the Group’s debt. This ratio is a key covenant set by our lenders, and in modified forms, also used by rating agencies as part of their analysis when determining credit ratings. There is no equivalent statutory measure.
Credit ratingThe Company must maintain an investment grade credit rating in accordance with our licence of appointment as a water and wastewater service provider. An investment grade rating equates to BBB- or higher from Standard & Poor’s and Baa3 or higher from Moody’s. The assessment by these two agencies provides an independent view of the Group’s performance and future prospects. There is no equivalent statutory measure.
UnderlyingUnderlying represents the financial performance of the Group excluding the arrangement with Bazalgette Tunnel Limited (“BTL”). The underlying performance of the Group has been included within our financial statements and associated notes separate to our performance from the BTL arrangement which has been discussed in more detail in the section below.
As required by some of our financial covenants, we disclose our underlying performance separately.
BTLBTL represents the financial performance of the Group from the arrangement with Bazalgette Tunnel Limited. The performance from the BTL arrangement is included within our financial statements and associated notes separate to our underlying performance which has been discussed above. Refer to pages143-144 for more information on the BTL arrangement.
Thames Water Combined Report 2019/20 153Strategic report Governance Financial statements Annual performance report

New accounting policies and financial reporting changes continued
EBITEarnings before interest and taxation (“EBIT”) is a key performance metric used by management. As the Company has significant capital investment it is necessary that amounts relating to depreciation and amortisation are included in this metric. However, as interest expense and income and gains/losses on financial instruments are largely driven by external factors management deem it most appropriate to use EBIT as a key performance metric. EBIT has been reconciled to statutory profit before tax in Note 1 Segmental Analysis on page 157.
Significant accounting judgements and key sources of estimation uncertaintyThe preparation of annual financial statements requires the Group to make judgements, estimates and assumptions that affect the application of accounting policies and the reported amounts of assets, liabilities, income and expense. Actual results may differ from these estimates. The significant judgements made by management in applying the Group’s accounting policies and the key sources of estimation uncertainty for the year ended 31 March 2020 are contained in the sections below:
Accounting judgement – revenue recognitionWater and wastewater servicesThe Group bills customers in accordance with its entitlement to receive revenue in line with the limits established by the periodic regulatory review processes. Revenue is recognised when performance obligations are met and when collection of the resulting receivable is probable. Determination of the probability of collection and hence the fair value of revenue recognised during the year is judgemental. Management considers historical trends in determining an adjustment to revenue to reflect instances where collection is not probable at the point of delivery. This has resulted in a decrease in revenue for the current year of £33.1 million (2019: £33.4 million), with a corresponding decrease in receivables as shown in note 14.
When the criteria for revenue recognition for a transaction are not met, recognition of the revenue is delayed until collectability is reasonably certain. Payments received in advance of entitlement are recorded within contract liabilities. Advance payments received from unmeasured customers for the year ended 31 March 2020 was £78.2 million (2019: £75.6 million).
Connections, requisitions and diversionsManagement considers these types of income to be within the scope of IFRS 15, since a contract (as defined in the standard) exists with the developer or other third party.
The performance obligation is to install/extend the network to a property development (or to divert the network). This is a service since the control of the assets concerned is not transferred to the developer. In the case of connections, revenue is recognised at the point in time of completion. For diversions and requisitions, revenue is recognised over the period of service. The amount recognised is the transaction price multiplied by the percentage of completion, since an asset is created with no alternative use and Thames Water Utilities Limited will have a present right to payment for work performed to date.
The charges are standalone and are not reflective of the ongoing obligation to supply the occupants of the newly connected properties. Supply to the occupants is charged on a standalone basis. This supports the decision not to defer connections/requisitions charges beyond completion of the service to the developer.
Infrastructure chargesManagement consider that the obligation to invest in the network is highly interrelated with the ongoing and future obligation to provide water and wastewater services.
This right to charge comes from our licence of appointment as a water and wastewater services provider. The income earned from the infrastructure charges enables us to invest in the network, to continue to fulfil our obligation to provide water and wastewater services to our customers. As a result of this obligation and long term investment in our network, we deem that the income earned from infrastructure charges should be recognised over time rather than upfront.
Accounting estimate – provision for expected credit lossesProvisions are made against trade receivables based on an assessment of the recovery of debts including those which will:
• ultimately be cancelled and may or may not be rebilled; and
• of debts which have not yet been billed but are part of the metered sales accrual.
This assessment is typically made by reference to the Company’s historical collection experience, including comparisons of the relative age of the individual balance and consideration of what might happen in the future.
Management has reassessed the provision to consider the impact of COVID-19 on customers’ ability to pay their water and wastewater bills and has increased the provision by £15.2 million across directly billed customers and WOCs. No adjustment has been made for indirectly billed non-household customers as Management have assessed the future cash flows and the risk of non payment was considered to be low.
The actual level of receivables collected may differ from the estimated level of recovery which could affect operating results positively or negatively. The bad debt provision at 31 March 2020 was £187.8 million (2019: £176.6 million).
We have performed a sensitivity analysis on the main components of the directly billed and WOC bad debt models. The main component of the bad debt model for the directly billed customers is based on cash collection rates. The main component of the WOC bad debt model is based on historic write offs as the Group does not have direct access to cash collection data. The sensitivity analysis is summarised below:
Directly BilledScenario £m Outcome
Current year cash collection rates increase by 1% 3.4 Reduction in chargeCurrent year cash collection rates reduce by 1% (3.4) Increase in charge
WOCsScenario £m Outcome
£0.5m reduction in write offs 1.1 Reduction in charge£0.5m increase in write offs (1.1) Increase in charge
Thames Water Combined Report 2019/20 154Strategic report Governance Financial statements Annual performance report

New accounting policies and financial reporting changes continued
Property, plant and equipment and intangible assetsAccounting judgement – capitalisation of costsThe Group’s activities involve significant investment in construction and engineering projects and assessing the classification of these costs between capital expenditure and operating expenditure requires management to make judgements. The Group capitalises expenditure relating to water and wastewater infrastructure where such expenditure enhances assets or increases the capacity of the network. Maintenance expenditure is taken to the income statement in the period in which it is incurred. Differentiating between enhancement and maintenance works is subjective, particularly in the instances where a single project may include a combination of both types of activities. Property, plant and equipment additions for the year ended 31 March 2020 were £1,136.3 million (restated 2019: £1,135.4 million). Intangibles additions for the year ended 31 March 2020 were £86.7 million (2019: £71.2 million). Both figures include capitalised overheads and capitalised borrowing costs.
Management capitalises employee time and other expenses incurred by central functions on capital programmes and consequently judgement is applied concerning the capitalisation rate used. In addition, management capitalises borrowing costs incurred for significant projects that meet certain criteria and judgement is required to identify which projects qualify for this. The capitalised borrowing costs for both property, plant and equipment and intangibles for the year ended 31 March 2020, net of commissioning, were £95.6 million (2019: £109.3 million).
Accounting estimate – depreciation and amortisationCalculation of the depreciation and amortisation charges requires management to make estimates regarding the useful economic lives (“UELs”) of the assets. These estimates are based on the Group’s experience of similar assets and engineering data. Where management identifies that actual UELs materially differ from the estimate used to calculate the charge, that charge will be adjusted in the period that the difference occurred and future periods. The total depreciation charge for the year ended 31 March 2020 was £547.6 million (2019 restated: £523.5 million) and the total amortisation charge for the year was £32.8 million (2019: £22.0 million). As the Group makes significant investment in PP&E and intangible assets, the differences between the estimated and actual UELs could have a positive or negative impact on the financial statements. Sensitivity analysis has been performed on the useful lives, which can be summarised below:
Scenario £m Outcome
5 year increase in average remaining useful life 71.6 Decrease in total depreciation and amortisation charge
5 year decrease in average remaining useful life (95.3) Increase in total depreciation and amortisation charge
Provisions for other liabilities and chargesAccounting judgement – recognition of other provisionsA provision is recognised when it is probable that the Group has an obligation for which a reliable estimate can be made of the amount of the obligation. The Group is subject to commercial and legal claims that are incidental to the day-to-day operation of its business. These include contractual, employment and environmental matters which are defended and managed in the ordinary course of business, including ROI funds. Assessing the outcome of uncertain commercial and legal cases requires judgement to be made regarding the extent to which any claim against the Group is likely to be successful. On a case-by-case basis, management evaluates the likelihood of adverse verdicts or outcomes to these matters and makes a judgement about whether or not a provision should be recognised.
Other provisions, which are detailed in note 20, total £30.7 million as at the year ended 31 March 2020 (2019: £24.6 million).
Accounting estimate – valuation of provisionsAssessing the financial outcome of uncertain commercial and legal cases requires estimates to be made regarding the amount by which the Group is liable. These estimates are made after considering available information including notifications, settlements, estimates performed by independent parties and legal counsel, available facts, identification of other potentially responsible entities and their ability to contribute, and prior experience. The amount provided may change in the future as additional information becomes available as a result of new developments. In such circumstances the provision will be adjusted in the future period the new information becomes available.
Provisions for liabilities and charges as at 31 March 2020 totalled £144.3 million (restated 2019: £119.2 million). There is an inherent risk that the final outcome of commercial and legal cases will be different to amounts provided.
Retirement benefit obligationsAccounting judgement – IFRIC 14 ‘IAS 19 ‘The Limit of a Defined Benefit Asset, Minimum Funding Requirements and their Interaction’The Trust Deed for the Thames Water Mirror Image Scheme (“TWMIPS”) provides the Company with an unconditional right to a refund of surplus assets assuming the full settlement of plan liabilities in the event of a plan wind-up. Furthermore, in the ordinary course of business the Trustee can only force a wind-up once all benefits have been distributed, at which point any surplus would be taken by the Company. Based on these rights, any net surplus in the scheme is recognised in full. Therefore, the Group considers that under IFRIC 14, it is appropriate to recognise the net surplus in TWMIPS.
Accounting estimate – actuarial assumptionsThe Group operates two defined benefit pension schemes for which full actuarial valuations are carried out as determined by the Trustees at intervals of not more than three years. In June 2017, the latest triennial valuations of these two defined benefit pension schemes as at 31 March 2019, were signed off by the actuary appointed by the scheme trustees, David Gardiner of Aon. The pension liability and net cost recognised under IAS 19 Employee Benefits are assessed using the advice of an actuary appointed by the Group, based on the latest actuarial valuation and assumptions determined by the scheme actuary. These assumptions are based on information supplied to the Group actuary, supplemented by discussions between the Group actuary and management and are used to estimate the present value of defined benefit obligations.
The actuarial assumptions used in determining the pension obligations and net costs recognised affect the profit before tax figure in the income statement and the net asset figure in the statement of financial position and are a source of estimation. These assumptions include:
• the discount rate;
• pay growth;
• mortality; and
• increases to pensions in payment.
Thames Water Combined Report 2019/20 155Strategic report Governance Financial statements Annual performance report

New accounting policies and financial reporting changes continued
The actual rates may materially differ from the assumptions due to changes in economic conditions and differences between the life expectancy of the members of the pension schemes and the wider UK population. These could have a positive or negative impact on the financial statements. The total net retirement benefit obligation for the two schemes as at 31 March 2020 was £114.6 million (2019: £293.0 million), which includes a pension deficit of £209.1 million (2019: £338.8 million) for the TWPS scheme, offset by a pension surplus of £94.5 million (2019: £45.8 million) for the TWMIPS scheme. Refer to Note 22 on pages 178-181 for more information on the key assumptions and sensitivities of the pension schemes.
Derivative financial assets and liabilitiesAccounting estimate – valuation of derivatives The Group holds derivative financial instruments that fall into the following categories:
• index-linked swaps;
• cross currency swaps; and
• interest rate swaps.
The fair value of financial assets and liabilities represents the price that would be received to sell an asset or paid to transfer a liability. The techniques for determining the fair value of financial instruments are classified under the hierarchy defined in IFRS 13 Fair Value Measurement which categorises inputs to valuation techniques into levels 1–3 based on the degree to which the fair value is observable. All of the Company’s inputs to valuation techniques are level 2 – the fair value is determined from inputs other than quoted prices that are observable for the asset or liability, either directly or indirectly. This technique uses discounted future cash flows to value the financial assets and liabilities. The future cash flows are estimated based on observable forward interest rates and inflation rates and are discounted at a rate that reflects the credit risk of the Group and counterparties. Currency cash flows are translated at spot rate. The net total of derivative financial assets and liabilities as at 31 March 2020 was a liability of £686.6 million (31 March 2019 a liability of: £1,101.1 million). Refer to Note 18 on pages 169-175 for more information on the key assumptions and sensitivities of the financial instruments.
The restructure of a derivative measured at fair value may result in a change to the observed fair value on the restructure date. Changes in the fair value may be attributable to both observable and unobservable factors. IFRS 9 does not permit the recognition of a restructure date fair value change on the income statement unless it relates to factors that are fully observable in the market. In cases where, due to unobservable factors, it is not possible to reliably identify the actual fair value movement, the whole of the observed fair value movement is capitalised and recognised in the income statement over the maturity period of the relevant restructured derivative.
During the year, three index-linked swaps were restructured. At the restructuring date the fair value of these instruments, as indicated by their fair value immediately prior to the restructuring, could not be supported by observable inputs alone. In management’s view the reduction in value of £38.0 million is supported by unobservable factors including the counterparty’s credit, capital, funding and trading charges. Therefore, such movement was deferred on the balance sheet in compliance with IFRS 9 and will be recognised in the income statement on a straight-line basis over the life of the underlying derivative instrument. See note 18 to the consolidated financial statements ”Financial Instruments” for more information.
Judgement that relates to Bazalgette Tunnel Limited (“BTL”)Accounting judgement – principal vs. agentBTL is the independent licenced utility company appointed to construct the Thames Tideway Tunnel. Under the terms of BTL’s licence, BTL will earn and collect revenues by charging the Group for its services. The Group will subsequently charge these amounts to its wastewater customers (based on modifications to the Company’s licence). Judgement has been exercised in assessing whether the Group is acting as principal or agent in its relationship with BTL.
Under IFRS 15 an entity must determine whether the nature of its promise is a performance obligation to deliver a good or service itself, or to arrange for them to be provided by another party. The Group is deemed to have primary responsibility for providing the ‘end to end’ services relating to the disposal of waste from its wastewater customers from collection, transportation (through the existing infrastructure and the Thames Tideway Tunnel) to the processing in the Group’s sewage treatment plants. The Group continues to charge its wastewater customers for the end-to-end waste management service and the BTL element will not be separately reflected in customer bills.
Additionally, the Group, as the sole future user of the Tunnel, will remain exposed to the risks and rewards associated with the service of the overall sewerage system (which includes the Tunnel). These risks include reputational risks. Management therefore consider the Group is operating as principal in the relationship with BTL.
Thames Water Combined Report 2019/20 156Strategic report Governance Financial statements Annual performance report

Notes to the consolidated financial statements
1. Segmental analysisSegmental information is reported internally on a monthly basis to the Executive Committee. The Executive Committee is responsible for the day-to-day running of the business and consequently the Executive Committee is considered to be the Chief Operating Decision Maker (“CODM”) of the Group.
In line with the Group’s structure ‘One Thames’, all operational and support functions providing a safe and reliable water and wastewater service to customers are included in a single business unit, enabling an end-to-end view of customer journeys and integrated resource management.
From 1 April 2017, our customer profile changed following the sale of our non-household retail business to Castle Water Limited. The household customer profile remains large and diverse and consequently there is no significant reliance on any single household customer. There is now a far smaller number of non-household customers, being retailers rather than the end user and we have one customer that accounts for more than 10% of our total revenue.
Revenue is further disaggregated into the different products and services, as detailed in note 2.
The Group is subject to economic regulation by Ofwat and operates under a licence to provide water and wastewater services within a defined geographical region, being London, the Thames Valley and the surrounding area, therefore Management considers the UK to be the geographical location of business.
Segmental performanceA segmental analysis of the management revenue and EBIT figures has been presented with a reconciliation to statutory revenue and profit before tax below:
Year ended 31 March2020
£m2019
£m
Management revenue 2,141.3 2,070.1Net operating expenses before depreciation and amortisation (1,099.8) (1,150.4)Depreciation of property, plant and equipment (545.9) (515.7)Amortisation of intangible assets (31.5) (21.8)Other operating (loss)/income (0.4) (2.5)Management Earnings before Interest and Tax (EBIT) 463.7 379.7
Revenue– Management to statutory reconciliationThe business segment’s revenue is reconciled to the Group’s statutory revenue below:
Year ended 31 March2020
£m2019
£m
Management revenue 2,141.3 2,070.1Statutory reclassification of bad debt from operational expenditure1 (32.8) (33.2)Household BTL revenue 52.2 38.7Non-household BTL revenue 12.1 8.8Total statutory revenue 2,172.8 2,084.41 This relates to amounts billed that are not probable of being recovered and therefore excluded from IFRS 15 revenue.
The business segment’s EBIT is reconciled to the Group’s statutory operating profit and Profit before tax below:
Restated1
Year ended 31 March2020
£m2019
£m
Management EBIT 463.7 379.7IFRS 16 adjustment1,2 3.5 3.2Statutory recognition of other operating income3 59.4 60.4Statutory reclassification of pension costs 18.7 11.5Statutory depreciation and write off adjustments4 (6.5) (7.0)Household BTL revenue5 52.2 38.7Non-household BTL revenue5 12.1 8.8Other statutory adjustments6 (25.6) 26.0Total statutory operating profit before finance income/expenses 577.5 521.3Finance income 90.1 42.1Finance expense (424.6) (410.7)Net gains/(losses) on financial instruments 190.8 (37.7)Total statutory profit before tax 433.8 115.01 The prior year results have been restated due to the impact of the transition to the new accounting standard IFRS 16 ‘Leases’ as
discussed on pages 150-152 as well as other restatements relating to the recording of a provision for property dilapidations and the capitalisation of leakage detection costs, which are discussed on page 152.
2 Management do not recognise any balances associated with IFRS 16.3 Requisitions and diversion charges, service connection charges, amortisation of deferred income recognised on adoption of assets
at nil cost and the release from deferred income of infrastructure charges are recognised in other operating income for statutory purposes (as disclosed in Note 2) but are offset against capital expenditure for management purposes. Elements of other income are also excluded for management purposes.
4 Depreciation of adopted fair value assets, borrowing costs and write-offs recognised for statutory purposes only.5 The portion of BTL revenue related to our household and non-household customers.6 These relate to insurance and other statutory only adjustments not included in management numbers.
2. Revenue2020 2019
Year ended 31 MarchUnderlying
£mBTL £m
Total £m
Underlying £m
BTL £m
Total £m
Gross revenue 2,141.3 64.6 2,205.9 2,070.1 47.7 2,117.8Charge for bad and doubtful debts (32.8) (0.3) (33.1) (33.2) (0.2) (33.4)Total 2,108.5 64.3 2,172.8 2,036.9 47.5 2,084.4
Bazalgette Tunnel Limited (“BTL”) is responsible for the construction of the Thames Tideway Tunnel. For the year ended 31 March 2020 the Group has included costs of the Thames Tideway Tunnel within its bills to wastewater customers. As cash is collected it is paid over to BTL under the ‘pay when paid’ principle. The revenue on this arrangement, which is excluded from our key performance indicators, has been disclosed separately to the Group’s underlying performance in the table above. The primary reason for the increase in revenue is driven by the phasing of construction works.
Thames Water Combined Report 2019/20 157Strategic report Governance Financial statements Annual performance report
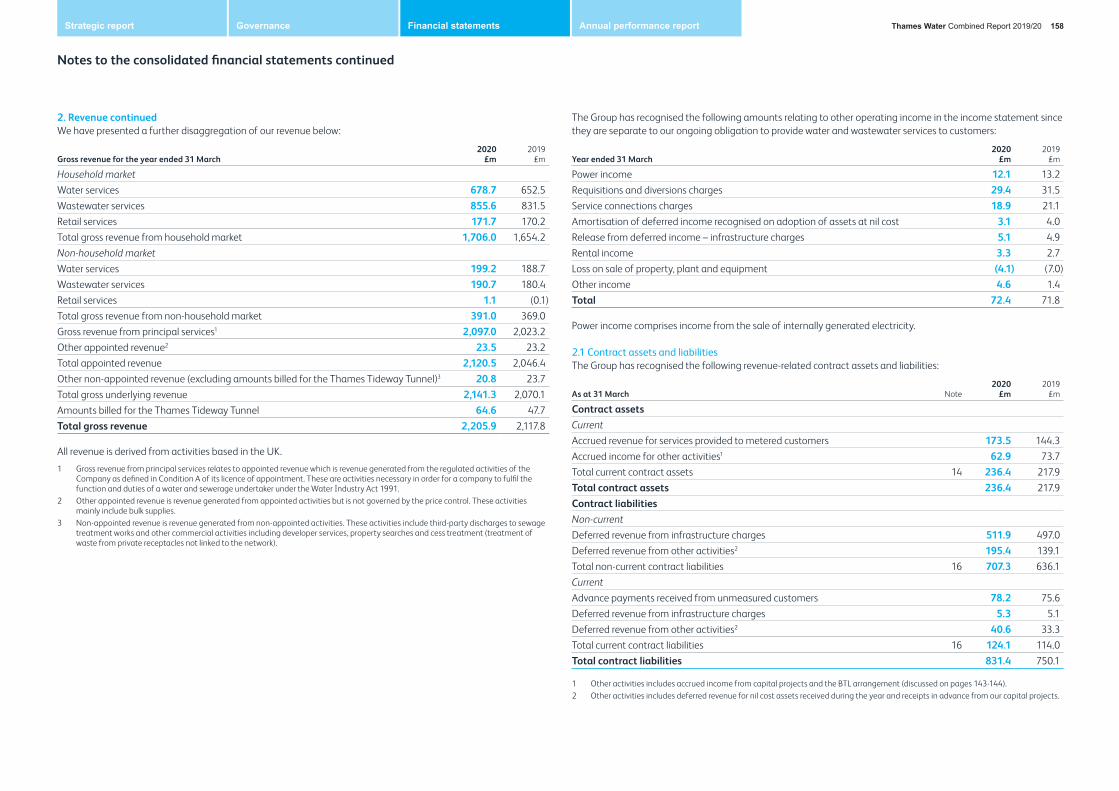
Notes to the consolidated financial statements continued
2. Revenue continuedWe have presented a further disaggregation of our revenue below:
Gross revenue for the year ended 31 March2020
£m2019
£m
Household market Water services 678.7 652.5Wastewater services 855.6 831.5Retail services 171.7 170.2Total gross revenue from household market 1,706.0 1,654.2Non-household marketWater services 199.2 188.7Wastewater services 190.7 180.4Retail services 1.1 (0.1)Total gross revenue from non-household market 391.0 369.0Gross revenue from principal services1 2,097.0 2,023.2Other appointed revenue2 23.5 23.2Total appointed revenue 2,120.5 2,046.4Other non-appointed revenue (excluding amounts billed for the Thames Tideway Tunnel)3 20.8 23.7Total gross underlying revenue 2,141.3 2,070.1Amounts billed for the Thames Tideway Tunnel 64.6 47.7Total gross revenue 2,205.9 2,117.8
All revenue is derived from activities based in the UK.
1 Gross revenue from principal services relates to appointed revenue which is revenue generated from the regulated activities of the Company as defined in Condition A of its licence of appointment. These are activities necessary in order for a company to fulfil the function and duties of a water and sewerage undertaker under the Water Industry Act 1991.
2 Other appointed revenue is revenue generated from appointed activities but is not governed by the price control. These activities mainly include bulk supplies.
3 Non-appointed revenue is revenue generated from non-appointed activities. These activities include third-party discharges to sewage treatment works and other commercial activities including developer services, property searches and cess treatment (treatment of waste from private receptacles not linked to the network).
The Group has recognised the following amounts relating to other operating income in the income statement since they are separate to our ongoing obligation to provide water and wastewater services to customers:
Year ended 31 March2020
£m2019
£m
Power income 12.1 13.2Requisitions and diversions charges 29.4 31.5Service connections charges 18.9 21.1Amortisation of deferred income recognised on adoption of assets at nil cost 3.1 4.0Release from deferred income – infrastructure charges 5.1 4.9Rental income 3.3 2.7Loss on sale of property, plant and equipment (4.1) (7.0)Other income 4.6 1.4Total 72.4 71.8
Power income comprises income from the sale of internally generated electricity.
2.1 Contract assets and liabilitiesThe Group has recognised the following revenue-related contract assets and liabilities:
As at 31 March Note2020
£m2019
£m
Contract assetsCurrentAccrued revenue for services provided to metered customers 173.5 144.3Accrued income for other activities1 62.9 73.7Total current contract assets 14 236.4 217.9Total contract assets 236.4 217.9Contract liabilitiesNon-currentDeferred revenue from infrastructure charges 511.9 497.0Deferred revenue from other activities2 195.4 139.1Total non-current contract liabilities 16 707.3 636.1CurrentAdvance payments received from unmeasured customers 78.2 75.6Deferred revenue from infrastructure charges 5.3 5.1Deferred revenue from other activities2 40.6 33.3Total current contract liabilities 16 124.1 114.0Total contract liabilities 831.4 750.1
1 Other activities includes accrued income from capital projects and the BTL arrangement (discussed on pages 143-144). 2 Other activities includes deferred revenue for nil cost assets received during the year and receipts in advance from our capital projects.
Thames Water Combined Report 2019/20 158Strategic report Governance Financial statements Annual performance report

Notes to the consolidated financial statements continued
2. Revenue continued2.2 Revenue recognised in relation to contract liabilitiesThe following table shows how much revenue recognised in the current reporting period relates to brought forward contract liabilities and how much relates to performance obligations that were satisfied in a prior period.
Year ended 31 March Note2020
£m2019
£m
Revenue recognised that was included in the contract liability balance at the beginning of the period:Advance payments received from unmeasured customers 16 75.6 75.6Deferred revenue from infrastructure charges 16 5.1 4.9Deferred revenue from other activities 16 33.3 48.9Total 114.0 129.4
2.3 Transaction price allocated to wholly or partly unsatisfied contractsThe following table shows how much revenue is expected to be recognised in future reporting periods in respect of ongoing contracts which are partially or fully unsatisfied as at the reporting date.
Year ended 31 March2020
£m2019
£m
Aggregate amount of the transaction price allocated to contracts that are partially or fully unsatisfied at the reporting date:Developer servicesService connections 7.4 8.0Requisitions and diversions 16.4 12.5Infrastructure charges 517.1 502.1Other 3.6 3.5Eight2oHigh Speed 2 7.7 21.1Total 552.2 547.2
The Company considers the performance commitment associated with Service Connections, Requisitions and Diversions to be the delivery of the associated asset and accordingly recognises this income over time. Thus, the amounts disclosed in the table above represent amounts received for schemes which have either not started on site or which are part way through construction at the balance sheet date. As such this income will be recognised on an individual basis in accordance with the delivery profile of each scheme. Typically amounts received in respect of service connections will be fully recognised within a year following receipt, however Requisitions & Diversions encompass a wide variety of schemes from those with short durations that would be fully recognised in the year following receipt to large multi-phase developments for which income could be recognised over the course of several years.
For infrastructure charges the Company considers its performance commitment to align with its obligation to incur the expense to which the income relates, being the depreciation charge of the associated network reinforcement assets. Accordingly, the total amounts disclosed in the table above represent the total un-amortised amount which will be recognised as income as the assets continue to depreciate.
Remaining performance obligations (unsatisfied or partially unsatisfied) at the year end all relate to customer contracts that have an original expected duration of not more than one year. Therefore, as permitted under IFRS 15, the transaction price allocated to these remaining performance obligations is not disclosed.
3. Operating expenses
Year ended 31 March
2020Restated1
2019
Underlying £m
BTL £m
Total £m
Underlying £m
BTL £m
Total £m
Wages and salaries 277.4 – 277.4 253.3 – 253.3Social security costs 30.7 – 30.7 28.2 – 28.2Pension costs – defined benefit schemes 26.8 – 26.8 34.7 – 34.7Pension costs – defined contribution schemes 13.1 – 13.1 11.0 – 11.0Apprenticeship levy 1.3 – 1.3 1.9 – 1.9Total employee costs 349.3 – 349.3 329.1 – 329.1Power 129.0 – 129.0 124.7 – 124.7Carbon reduction commitment (1.1) – (1.1) 4.5 – 4.5Raw materials and consumables 53.9 – 53.9 59.3 – 59.3Rates3 98.2 – 98.2 117.3 – 117.3Research and development expenditure 3.8 – 3.8 3.9 – 3.9Insurance 39.8 – 39.8 34.6 – 34.6Legal and professional fees 26.5 – 26.5 28.9 – 28.9Other operating costs 494.2 – 494.2 539.4 – 539.4Own work capitalised (183.0) – (183.0) (189.4) – (189.4)Net operating expenses before depreciation and amortisation
1,010.6 – 1,010.6 1,052.3 – 1,052.3
Depreciation of property, plant and equipment 547.6 – 547.6 523.6 – 523.6Depreciation of right-of-use assets 8.2 – 8.2 7.8 – 7.8Amortisation of intangible assets 32.8 – 32.8 22.0 – 22.0Net operating expenses excluding exceptional items 1,599.2 – 1,599.2 1,605.7 – 1,605.7Exceptional costs4:Company reorganisation – severance 12.2 – 12.2 – – –Associated programme management costs 15.5 – 15.5 – – –Operating expenses excluding impairment losses on financial and contract assets
1,626.9 – 1,626.9 1,605.7 – 1,605.7
Impairment loss on financial and contract assets2 40.6 0.2 40.8 28.9 0.3 29.2Total operating expenses 1,667.5 0.2 1,667.7 1,634.6 0.3 1,634.9
Other operating costs primarily relate to costs for contracted services and repairs and maintenance of assets, including associated labour costs, which do not qualify as capital expenditure under IAS 16: Property, plant and equipment.
1 The prior year results have been restated due to the impact of the transition to the new accounting standard IFRS 16 ‘Leases’ as discussed on pages 150-152 as well as other restatements relating to the recording of a provision for property dilapidations and the capitalisation of leakage detection costs, which are discussed on page 152.
2 Impairment loss for the year is net of £5.1 million relating to excess payments received from customers in the past and recognised during the year (2019: £11.8 million).
3 Rates expense includes a rebate of £23.0 million year (31 March 2019: £nil) relating to reassessment of the business rates expense in the period 2005-2015.
4 Exceptional costs relate to significant restructuring of the business these costs are considered to be exceptional in nature with significant expenditure incurred that is not in the ordinary course of business. The restructure of the business that has occurred in the year involved significant changes in the way that the Company operates and therefore this is deemed exceptional by nature.
Thames Water Combined Report 2019/20 159Strategic report Governance Financial statements Annual performance report
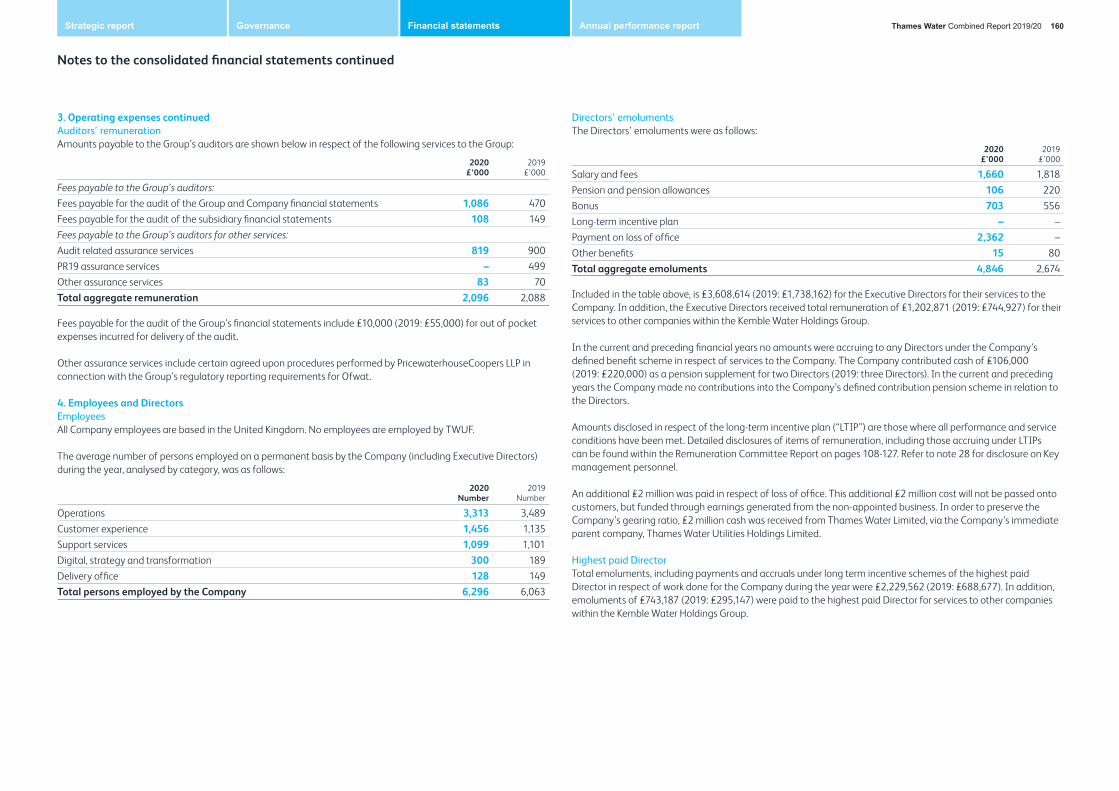
Notes to the consolidated financial statements continued
3. Operating expenses continuedAuditors’ remuneration Amounts payable to the Group’s auditors are shown below in respect of the following services to the Group:
2020 £’000
2019 £’000
Fees payable to the Group’s auditors:Fees payable for the audit of the Group and Company financial statements 1,086 470Fees payable for the audit of the subsidiary financial statements 108 149Fees payable to the Group’s auditors for other services:Audit related assurance services 819 900PR19 assurance services – 499Other assurance services 83 70Total aggregate remuneration 2,096 2,088
Fees payable for the audit of the Group’s financial statements include £10,000 (2019: £55,000) for out of pocket expenses incurred for delivery of the audit.
Other assurance services include certain agreed upon procedures performed by PricewaterhouseCoopers LLP in connection with the Group’s regulatory reporting requirements for Ofwat.
4. Employees and DirectorsEmployeesAll Company employees are based in the United Kingdom. No employees are employed by TWUF.
The average number of persons employed on a permanent basis by the Company (including Executive Directors) during the year, analysed by category, was as follows:
2020 Number
2019 Number
Operations 3,313 3,489Customer experience 1,456 1,135Support services 1,099 1,101Digital, strategy and transformation 300 189Delivery office 128 149Total persons employed by the Company 6,296 6,063
Directors’ emolumentsThe Directors’ emoluments were as follows:
2020 £’000
2019 £’000
Salary and fees 1,660 1,818Pension and pension allowances 106 220Bonus 703 556Long-term incentive plan – –Payment on loss of office 2,362 –Other benefits 15 80Total aggregate emoluments 4,846 2,674
Included in the table above, is £3,608,614 (2019: £1,738,162) for the Executive Directors for their services to the Company. In addition, the Executive Directors received total remuneration of £1,202,871 (2019: £744,927) for their services to other companies within the Kemble Water Holdings Group.
In the current and preceding financial years no amounts were accruing to any Directors under the Company’s defined benefit scheme in respect of services to the Company. The Company contributed cash of £106,000 (2019: £220,000) as a pension supplement for two Directors (2019: three Directors). In the current and preceding years the Company made no contributions into the Company’s defined contribution pension scheme in relation to the Directors.
Amounts disclosed in respect of the long-term incentive plan (“LTIP”) are those where all performance and service conditions have been met. Detailed disclosures of items of remuneration, including those accruing under LTIPs can be found within the Remuneration Committee Report on pages 108-127. Refer to note 28 for disclosure on Key management personnel.
An additional £2 million was paid in respect of loss of office. This additional £2 million cost will not be passed onto customers, but funded through earnings generated from the non-appointed business. In order to preserve the Company’s gearing ratio, £2 million cash was received from Thames Water Limited, via the Company’s immediate parent company, Thames Water Utilities Holdings Limited.
Highest paid DirectorTotal emoluments, including payments and accruals under long term incentive schemes of the highest paid Director in respect of work done for the Company during the year were £2,229,562 (2019: £688,677). In addition, emoluments of £743,187 (2019: £295,147) were paid to the highest paid Director for services to other companies within the Kemble Water Holdings Group.
Thames Water Combined Report 2019/20 160Strategic report Governance Financial statements Annual performance report

Notes to the consolidated financial statements continued
5. Finance income and expenseDuring the year ended 31 March 2020, the Group recognised finance income of £90.1 million (2019: £42.1 million) relating mainly to interest on intercompany loans, swap novation income and interest on bank deposits.
Finance income
Year ended 31 March2020
£m2019
£m
Interest income on bank deposits 2.0 0.7Interest income on intercompany loans receivable 22.0 24.1Interest income on swaps 65.2 8.9Other finance income on swaps 0.2 7.5Other interest income 0.7 0.9Total finance income 90.1 42.1
Finance expenseThe Group also recognised finance expenses of £424.6 million (restated – year ended 31 March 2019: £410.7 million) relating mainly to interest and accretion on loans, other borrowing, leases and defined benefit pension obligations.
Year ended 31 March Note2020
£m
Restated1 2019
£m
Interest in relation to bank and other loans:Interest expense (408.0) (393.5)RPI accretion on loans (105.1) (110.1)Interest in relation to defined benefit obligationNet interest expense on defined benefit obligation 22 (6.2) (6.6)Interest in relation to leasesLeases 11 (3.7) (3.9)FeesFee credit/(incurred) in relation to liquidation of the Cayman Islands entities2
0.8 (5.9)
Gross finance expense (522.2) (520.0)Capitalised borrowing costs 97.6 109.3Total finance expense (424.6) (410.7)1 The prior year results have been restated due to the impact of the transition to the new accounting standard IFRS 16 ‘Leases’ as
discussed on pages 150-152.2 Finance expense for the prior year ended 31 March 2019 included £5.9 million of fees incurred for the liquidation of the Cayman
Island entities. No fees in relation to the liquidation were incurred during the year ended 31 March 2020. A credit of £0.8 million was recognised for the year ended 31 March 2020 in respect of these fees.
6. Net gains/(losses) on financial instrumentsThe reconciliation to net gains/(losses) on financial instruments has been provided below:
Year ended 31 March2020
£m2019
£m
Exchange losses on foreign currency borrowings (52.1) (68.0)Gain arising on swaps where hedge accounting is not applied1 277.8 64.5Loss on cash flow hedge transferred from equity2 (34.9) (34.2)Total 190.8 (37.7)1 Gain arising on swaps where hedge accounting is not applied primarily reflects lower RPI and interest rate expectations. This excludes
interest which is disclosed in Note 5 Finance Income and expense.2 Refer to Note 18 Financial Instruments on page 175 for more information on the loss on cash flow hedge transferred from equity.
7. Tax charge on profit on ordinary activities
Year ended 31 March
2020 2019 Restated7
Underlying £m
BTL £m
Total £m
Underlying £m
BTL £m
Total £m
Current tax:Amounts payable in respect of group relief 2.9 6.1 9.0 1.0 2.8 3.8Adjustment in respect of prior periods – group relief
– – – 0.5 – 0.5
Current tax subtotal 2.9 6.1 9.0 1.5 2.8 4.3Deferred tax:Origination and reversal of timing differences 68.2 – 68.2 7.6 – 7.6Adjustment in respect of corporation tax rate change
111.2 – 111.2 – – –
Adjustment in respect of prior periods 0.8 – 0.8 (0.2) – (0.2)Deferred tax subtotal 180.2 – 180.2 7.4 – 7.4Tax charge on profit on ordinary activities 183.1 6.1 189.2 8.9 2.8 11.7
Thames Water Combined Report 2019/20 161Strategic report Governance Financial statements Annual performance report

Notes to the consolidated financial statements continued
7. Tax charge on profit on ordinary activities continued The tax charge for the year ended 31 March 2020 is higher (2019: lower) than the standard rate of corporation tax in the UK. The differences are explained below:
Year ended 31 March
2020 2019 Restated7
Underlying £m
BTL £m
Total £m
Effective tax rate
%Underlying
£mBTL £m
Total £m
Effective tax rate
%
Profit on ordinary activities before taxation
369.7 64.1 433.8 67.8 47.2 115.0
Tax at 19% (2019: 19%) 70.2 12.2 82.4 19.0% 12.9 9.0 21.9 19.0%Effects of:Recurring itemsDepreciation on assets that do not qualify for tax relief
4.3 – 4.3 4.2 – 4.2
Disallowable expenditure1 0.6 – 0.6 0.6 – 0.6Non-taxable income2 (4.4) – (4.4) (5.0) – (5.0)Property disposals3 0.1 – 0.1 – – –Group relief paid for at lower than statutory rate3
0.3 (6.1) (5.8) (2.7) (6.2) (8.9)
Tax as adjusted for recurring items 71.1 6.1 77.2 17.8% 10.0 2.8 12.8 11.1%Non-recurring itemsImpact of deferred tax rate change4 111.2 – 111.2 – – –Effect of tax rate differential – – – (1.4) – (1.4)Adjustments to tax charge in respect of prior periods – current tax
– – – 0.5 – 0.5
Adjustments to tax charge in respect of prior periods – deferred tax
0.8 – 0.8 (0.2) – (0.2)
Total tax charge 183.1 6.1 189.2 43.6% 8.9 2.8 11.7 10.2%1 Disallowable expenditure primarily relates to fines included in operating expenses. 2 Non-taxable income relates primarily to income from new service connections. This income is reflected in the accounts as non-taxable
income under IFRS principles, while the cost of the new service connections fixed assets is not eligible for capital allowances. 3 The Group intends to utilise tax losses available in its parent company for the year ended 31 March 2020. As a result, the Group intends
to reduce its claims for tax relief on its capital expenditure in this period. The Group will pay £9.0 million to its parent company for the tax losses relating to the year ended 31 March 2020. The Group is paying for some of the tax losses at a rate which is lower than the standard rate of corporation tax, which reflects the value of the tax losses to the Group. This results in a reduction of the current tax charge of £5.8 million. Utilising tax losses in this way should ultimately benefit customers through lower costs being recovered through bills in future regulatory settlements.
4 As explained in Note 19 (Deferred tax) the deferred tax rate changed during the year from 17% to 19%. A one-off charge of £111.2 million arises on the restatement of deferred tax balances to 19%.
The Group is not currently in a tax paying position with HMRC (although it does pay for group relief), primarily due to capital allowances on capital expenditure, tax deductions for borrowing costs and group relief which has arisen on interest expenses in holding companies. The differences between profit on ordinary activities before taxation at the standard tax rate and the current tax charge for the year are set out below.
Year ended 31 March
2020 2019 Restated7
Underlying £m
BTL £m
Total £m
Underlying £m
BTL £m
Total £m
Profit on ordinary activities before taxation 369.7 64.1 433.8 67.8 47.2 115.0Tax at 19% (2019: 19%) 70.2 12.2 82.4 12.9 9.0 21.9Effects of:Depreciation on assets that do not qualify for relief 4.3 – 4.3 4.2 – 4.2Disallowable expenditure 0.6 – 0.6 0.6 – 0.6Non-taxable income (4.4) – (4.4) (5.0) – (5.0)Property disposals 0.1 – 0.1 – – –Capital allowances for the year (higher than)/lower than depreciation
(3.3) – (3.3) 42.1 – 42.1
Capitalised borrowing costs allowable for tax5 (18.5) – (18.5) (20.8) – (20.8)Tax deduction available on restatement for IFRS 15 – – – (25.1) – (25.1)Taxable profit on IFRS 16 and other restatements6 5.5 – 5.5 – – –Profits on financial derivatives7 (48.8) – (48.8) (3.6) – (3.6)Pension cost charge in excess of (lower than) pension contributions
(1.9) – (1.9) 3.7 – 3.7
Other short term timing differences (1.2) – (1.2) (5.3) – (5.3)Group relief not paid at standard rate 0.3 (6.1) (5.8) (2.7) (6.2) (8.9)Adjustments to tax charge in respect of prior periods – – – 0.5 – 0.5Current tax charge for the year 2.9 6.1 9.0 1.5 2.8 4.35 Capitalised borrowing costs are eligible for a full tax deduction in the year.6 The restatement relates to the impact of the transition to new accounting standard IFRS 16 ‘Leases’ on 1 April 2019 and “Other”
restatements, which have been discussed on pages 150-152. Tax relief is available on the net charge to reserves for IFRS 16, but most is available in future years, rather than in this financial year. The credit to reserves arising on the Other restatement is taxable in full in this financial year.
7 Accounting fair value profits and losses arising on our derivatives are predominantly non-taxable and non-deductible respectively, as instead they are usually taxed as the cash flows arise. Deferred tax is provided on all temporary differences.
Uncertain tax positionsAt 31 March 2020 the total value of uncertain corporation tax positions was £nil (2019: £nil), reflecting the agreement of tax computations with HMRC up to and including 31 March 2017.
Effective tax rateThe effective tax rate, as adjusted for recurring tax items, of 17.8% is low primarily due to the effect of group relief paid for at below the statutory rate.
Thames Water Combined Report 2019/20 162Strategic report Governance Financial statements Annual performance report

Notes to the consolidated financial statements continued
7. Tax charge on profit on ordinary activities continuedThe deferred tax (charged)/credited directly to other comprehensive income during the year is as follows:
Year ended 31 March2020
£m2019
£m
Deferred tax:Tax (charge)/credit on net actuarial (gain)/loss in year (37.4) 4.3Impact of deferred tax rate change on net actuarial (gains)/losses 7.7 –
(29.7) 4.3Deferred tax:Tax (charge)/credit on cash flow hedges in year (5.2) (4.3)Impact of deferred tax rate change on cash flow hedges 2.2 –
(3.0) (4.3)Total (charged)/credited directly to other comprehensive income (32.7) –
8. DividendsDuring the year ended 31 March 2020, the Company paid total dividends of £56.5 million (2019: £60.0 million) to its immediate parent Thames Water Utilities Holdings Limited.
The dividend paid during the year ended 31 March 2020 was used to fund interest obligations and activities of other companies within the Kemble Water Holdings Group and was distributed as follows:
Year ended 31 March2020
£m2019
£m
Distribution to external shareholders:External dividend distributions – –Kemble Water Eurobond Plc debt service costs – –Distributions not distributed to external shareholders:Kemble Water Finance Limited debt service costs 54.0 58.0Distribution to Thames Water Limited 2.5 2.0
56.5 60.0Total 56.5 60.0
The aggregate amount of dividends proposed but not paid nor recognised as liabilities at the period end is £nil (2019: £nil).
Dividends paid to Kemble Water Finance Limited (“KWF”) were used to enable it to continue to meet its debt service obligations for external debt and external debt of a subsidiary of KWF, Thames Water (Kemble) Finance Plc, which have been on lent to KWF via intercompany loans debt. Dividends paid to Thames Water Limited were used to fund activities of the company.
External shareholders above is referring to shareholders of Kemble Water Holdings Limited (“Kemble”).
Further information on dividend payments can be found in Our Financial Review on page 60.
9. Intangible assets
Software £m
Assets in development
£mTotal
£m
Cost:At 1 April 2018 214.4 109.7 324.1Additions – 71.2 71.2Transfers 26.5 (26.5) –At 31 March 2019 240.9 154.4 395.3Additions – 86.7 86.7 Write-offs (4.1) – (4.1)Transfers 222.5 (214.3) 8.2 Disposals (0.6) – (0.6) At 31 March 2020 458.7 26.8 485.5Accumulated amortisation:At 1 April 2018 (155.5) – (155.5)Amortisation charge (22.0) – (22.0)At 31 March 2019 (177.5) – (177.5)Amortisation charge (32.8) – (32.8) Transfers (2.2) – (2.2) Disposals 0.4 – 0.4 At 31 March 2020 (212.1) – (212.1) Net book value:At 31 March 2020 246.6 26.8 273.4 At 31 March 2019 63.4 154.4 217.8
Additions relate to IT projects undertaken including the implementation of new customer relationship management and billing (“CRMB”) system and a new meter data management system. £3.4 million borrowing costs were capitalised during the year (2019: £6.6 million). The write offs are included under operating expenses in the income statement. The effective rate of borrowing costs for the year was 4.55% (2019: 4.91%).
During the year, assets previously categorised as property, plant and equipment were reclassified as Software assets and therefore were transferred from property, plant and equipment to intangibles. The amount transferred was £6.0 million net of depreciation (£8.2 million of asset cost and £2.2 million of accumulated depreciation).
The gross carrying amount of intangible assets that was fully depreciated at 31 March 2020 amounted to £141.4 million (31 March 2019: £127.4 million).
Thames Water Combined Report 2019/20 163Strategic report Governance Financial statements Annual performance report

Notes to the consolidated financial statements continued
10. Property, plant and equipment
Land & buildings
£m
Plant & equipment
£m
Network Assets
(restated1) £m
Assets under construction
£m
Total (restated1)
£m
Cost:At 1 April 2018 3,430.5 7,207.9 7,094.0 2,437.7 20,170.1Additions – 0.5 36.7 1,098.2 1,135.4Transfers between categories 170.7 504.2 233.1 (908.0) –Disposals (1.5) (22.6) – – (24.1)At 31 March 2019 3,599.7 7,690.0 7,363.8 2,627.9 21,281.4Additions – 0.4 30.9 1,105.0 1,136.3Transfers between categories 62.3 379.8 428.5 (878.8) (8.2)Write offs – (5.1) – (0.7) (5.8)Disposals (2.0) (8.1) (0.1) (10.2)At 31 March 2020 3,660.0 8,057.0 7,823.1 2,853.4 22,393.5Accumulated depreciation:At 1 April 2018 (937.4) (4,052.3) (493.3) – (5,483.0)Depreciation charge (53.2) (335.9) (134.4) – (523.5)Disposals 0.7 13.8 – – 14.5At 31 March 2019 (989.9) (4,374.4) (627.7) – (5,992.0)Depreciation charge (52.0) (357.2) (138.4) – (547.6)Transfers – 2.2 – – 2.2Disposals 0.5 6.2 – – 6.7At 31 March 2020 (1,041.4) (4,723.2) (766.1) – (6,530.7)Net book value:At 31 March 2020 2,618.6 3,333.8 7,057.0 2,853.4 15,862.8At 31 March 2019 2,609.8 3,315.6 6,736.1 2,627.9 15,289.41 The prior year results have been restated due to the capitalisation of leakage detection costs, which is discussed on page 152.
£94.2 million of borrowing costs were capitalised in the period (2019: £102.7 million). The effective annual capitalisation rate for borrowing costs was 4.55% (2019: 4.91%).
During the year, assets previously categorised as property, plant and equipment were reclassified as Software assets and therefore were transferred from property, plant and equipment to intangibles. The amount transferred was £6.0 million net of depreciation (£8.2 million of asset cost and £2.2 million of accumulated depreciation).
The gross carrying amount of property, plant and equipment that was fully depreciated at 31 March 2020 amounted to £2,485.1 million (31 March 2019: £2,359.6 million).
Assets under construction include amounts in respect of land and building purchases made in relation to the Thames Tideway Tunnel project; an element of which will not be capitalised when the asset is brought into use. These land and buildings were acquired to perform necessary works relating to the construction and integration of the tunnel into our network and will be disposed of in due course once required works have been completed.
11. Leases(i) Amounts recognised in the statement of financial positionRight-of-use assets
As at
31 March 2020
£m
Restated1
31 March 2019
£m
Land and buildings 52.3 54.2Total 52.3 54.2
Additions to right-of-use assets during the year ended 31 March 2020 were £6.3 million (31 March 2019: £4.2 million).
Lease liabilities
As at
31 March 2020
£m
Restated1
31 March 2019
£m
Current (7.9) (7.4)Non-current (62.4) (65.1)Total (70.3) (72.5)
(ii) Amounts recognised in the income statement
For the year ended
31 March 2020
£m
Restated1
31 March 2019
£m
Depreciation charge of right-of-use assets 8.2 7.8Interest expense included in finance costs 3.7 3.9Expense relating to short-term leases, low value assets and variable lease payments not included in lease liabilities 5.0 7.7Total 16.9 19.4
The total cash outflow for leases during the year ended 31 March 2020 was £11.0 million (31 March 2019: £10.1 million).
The Group’s leasing activities consist of rentals payable for office properties and other land and buildings.
1 The restatement relates solely to the impact of the transition to new accounting standard IFRS 16 ‘Leases’ on 1 April 2019 and has been discussed on pages 150-152
Thames Water Combined Report 2019/20 164Strategic report Governance Financial statements Annual performance report

Notes to the consolidated financial statements continued
12. Intercompany loans receivableThe carrying amounts of the Group’s intercompany loans receivable are considered to be approximate to their fair values. The fair values and carrying values of the Group’s intercompany loans receivable are set out in the tables below.
As at 31 March
2020 2019
Book value £m
Fair value £m
Book value £m
Fair value £m
Amounts owed by group undertakings:Thames Water Utilities Holdings Limited 1,752.2 1,752.2 1,974.7 1,974.7Interest receivable on amounts owed by group undertakings:Thames Water Utilities Holdings Limited 11.8 11.8 27.3 27.3Total 1,764.0 1,764.0 2,002.0 2,002.0Disclosed within non-current assets 1,752.2 1,752.2 1,974.7 1,974.7Disclosed within current assets 11.8 11.8 27.3 27.3
The above intercompany loan is unsecured. These balances have not been included within the Group’s net debt and covenant calculations.
There are no amounts past their due dates. If a receivable continues to have an investment grade rating, then IFRS 9 permits an assumption that there has been no significant increase in credit risk. As such given the investment grade credit rating, an assessment of the 12 month expected credit loss is permitted rather than a lifetime credit loss assessment as per ‘stage 1’ of the IFRS 9 impairment model. The Group has considered the recoverability of the intercompany receivables as part of the Kemble Group’s annual impairment assessment of all intercompany balances under IFRS 9, no impairment was identified. As such there is no concern over the recoverability of intercompany receivables, the Directors do not consider that there is any need to book an impairment provision and expect to materially recover the intercompany amount.
On 29 April 2019, the Kemble Water Holdings Group performed an exercise to reduce the intercompany loan that exists between the Company and its immediate holding company Thames Water Utilities Holdings Limited (“TWUHL”). The paydown has led to a reduction in the intercompany loan and interest receivable by £249.8 million with a corresponding increase in cash, of which £222.5 million is in respect of the principal loan receivable and £27.3 million in respect of interest loan receivable that was due. During 2020, the Company earned £22.0 million of interest income related to the intercompany loan, of which £8.2 million was net settled against payments for group relief owed to its parent (TWUHL), and £2.0 million of interest was cash paid by TWUHL.
Interest on the above loan is charged at six month LIBOR plus 0.35% margin (2019: six month LIBOR plus 0.35% margin).
13. Inventories and current intangible assets
Year ended 31 March2020
£m2019
£m
Raw materials and consumables 13.6 9.1Current intangible assets – emissions allowances – 4.4Total 13.6 13.5
Emission allowances represent purchased carbon emission allowances (relating to the emission of carbon dioxide in the UK). A provision (see note 20) is simultaneously recorded in respect of the obligation to deliver emission allowances in the period in which the emissions are made and the associated charge is recognised as an operating expense within the income statement. This scheme was discontinued by the government as at 31 March 2019. The emissions allowances as at 31 March 2019 settled during the year and therefore this balance is £nil as at 31 March 2020.
14. Trade and other receivables
As at 31 March
2020Restated1
2019
Underlying £m
BTL £m
Total £m
Underlying £m
BTL £m
Total £m
Non-current:Prepayments – 159.0 159.0 – 101.9 101.9Amounts owed by group undertakings 0.3 – 0.3 0.3 – 0.3Insurance claims receivable 64.4 – 64.4 33.8 – 33.8Other receivables 6.0 – 6.0 5.2 – 5.2
70.7 159.0 229.7 39.3 101.9 141.2Current:Gross trade receivables 475.5 13.5 489.0 454.9 9.5 464.4Less expected credit losses provision (185.1) (2.7) (187.8) (174.4) (2.2) (176.6)Net trade receivables 290.4 10.8 301.2 280.5 7.3 287.8Prepayments 31.8 – 31.8 31.5 – 31.5Other receivables 35.5 0.8 36.3 28.0 1.2 29.2
357.7 11.6 369.3 340.0 8.5 348.5Current:Contract assets 234.9 1.5 236.4 217.0 0.9 217.9
592.6 13.1 605.7 557.0 9.4 566.4Total 663.3 172.1 835.4 596.3 111.3 707.6
The Directors consider that the carrying amount of trade and other receivables is approximately equal to their fair value. The Directors believe that the Group is well placed to manage its business risks successfully, despite the current uncertainties in the economy as a result of COVID-19.
1 The prior year results have been restated due to the impact of the transition to the new accounting standard IFRS 16 ‘Leases’ as discussed on pages 150-152.
Non-current prepayments at 31 March 2020 includes £159.0 million (2019: £101.9 million) of prepayment relating to the Bazalgette Tunnel Limited (“BTL”) arrangement. The prepayment relates to use of the tunnel which will occur once construction is complete.
Contract assets at 31 March 2020 includes £173.5 million (2019: £144.3 million) of services provided to metered customers. The remaining amount is for accrued capital contributions and accrued income from the BTL arrangement.
Thames Water Combined Report 2019/20 165Strategic report Governance Financial statements Annual performance report

Notes to the consolidated financial statements continued
14. Trade and other receivables continuedExpected credit losses provisionMovements in the expected credit losses provision were as follows:
2020 £m
2019 £m
At 1 April (176.6) (174.3)Charge for bad and doubtful debts – charged against revenue (33.1) (33.4)Charge for bad and doubtful debts – included within operating expenses (40.8) (29.2)Excess credits recognised during the year (5.1) (11.8)Amounts directly charged to revenue and not included in bad debt expense – (3.9)Amounts written off 67.8 76.0Total at 31 March (187.8) (176.6)
Ageing of gross receivables is as follows:
As at 31 March2020
£m2019
£m
Up to 365 days 273.9 243.91 – 2 years 78.5 131.72 – 3 years 94.4 38.1More than 3 years 42.2 50.7Total 489.0 464.4
The ageing of gross BTL receivables1 is as follows:
As at 31 March2020
£m2019
£m
Up to 365 days 8.3 4.71 – 2 years 2.4 4.82 – 3 years 2.8 –Total 13.5 9.51 This relates to the amount of receivables collected from other parties and passed on to BTL.
The Group applies the IFRS 9 simplified approach to measuring expected credit losses which uses a lifetime expected loss allowance for all trade receivables and contract assets. This is calculated based on historical experience of levels of recovery and what might happen in the future. Expected credit loss split by ageing is as follows:
As at 31 March2020
£m2019
£m
Up to 365 days 82.1 66.21 – 2 years 32.4 40.62 – 3 years 44.4 34.9More than 3 years 28.9 34.9Total 187.8 176.6
Ageing of impaired BTL receivables1 is as follows:
As at 31 March2020
£m2019
£m
Up to 365 days 1.4 0.81 – 2 years 0.6 1.42 – 3 years 0.7 –Total 2.7 2.21 This relates to the amount of receivables collected from other parties and passed on to BTL.
15. Cash and cash equivalents
As at 31 March
2020 2019
Underlying £m
BTL £m
Total £m
Underlying £m
BTL £m
Total £m
Cash at bank and in hand 4.1 – 4.1 5.6 0.3 5.9Other short-term investments 751.7 2.6 754.3 148.8 7.3 156.1Total 755.8 2.6 758.4 154.4 7.6 162.0
BTL cash represents amounts collected from wastewater customers, for the construction costs of the Thames Tideway Tunnel, which has not yet been paid across to BTL at the reporting date.
Thames Water Combined Report 2019/20 166Strategic report Governance Financial statements Annual performance report

Notes to the consolidated financial statements continued
16. Trade and other payables
As at 31 March
2020Restated1
2019
Underlying £m
BTL £m
Total £m
Underlying £m
BTL £m
Total £m
Non-current:Contract liabilities 707.3 – 707.3 636.1 – 636.1Current:Trade payables – operating 262.7 – 262.7 258.2 – 258.2Other taxation and social security 7.2 – 7.2 7.5 – 7.5Amounts payable in respect of group relief 2.1 6.1 8.2 3.0 4.4 7.4Accruals 305.1 – 305.1 320.1 – 320.1Amounts owed to Bazalgette Tunnel Limited – 10.3 10.3 – 11.1 11.1Other payables 83.0 – 83.0 82.4 – 82.4
660.1 16.4 676.5 671.2 15.5 686.7Current:Contract liabilities 123.8 0.3 124.1 110.6 3.4 114.0
783.9 16.7 800.6 781.8 18.9 800.7Total 1,491.2 16.7 1,507.9 1,417.9 18.9 1,436.8
Current contract liabilities at 31 March 2020 includes £78.2 million (2019: £75.6 million) of receipts in advance from customers for water and wastewater charges. The remaining amount relates to payment in advance for compensation for operating costs and infrastructure charges.
Non-current contract liabilities at 31 March 2020 includes £511.9 million (2019: £497.0 million) of deferred infrastructure charges, £179.7 million of deferred income for nil cost “adopted” assets (2019: £121.4 million) with the remaining amount relating to payments received in advance for compensation for operating costs.
The Directors consider that the carrying amount of trade and other payables within the scope of IFRS 7 is approximately equal to their fair value.
1 The restatement relates solely to the impact of the transition to new accounting standard IFRS 16 ‘Leases’ on 1 April 2019 and has been discussed on pages 150-152.
17. Borrowings
As at 31 March2020
£m2019
£m
Secured bank loans and private placements 4,652.5 3,398.2Bonds 8,301.6 8,219.4Amounts owed to group undertakings 5.5 5.5
12,959.6 11,623.1Interest payable on borrowings 166.0 158.7Total 13,125.6 11,781.8Disclosed within non-current liabilities 11,327.9 10,657.7Disclosed within current liabilities 1,797.7 1,124.1Total 13,125.6 11,781.8
Secured bank loans refers to an arrangement whereby each Obligor (representing each of the companies within the whole business securitisation group) has entered into a Security Trust and Intercompany Deed (“STID”) with the Security Trustee. Pursuant to this arrangement, Thames Water Utilities Holdings Limited has guaranteed the obligations of each other Obligor under the finance agreement. Additionally, Thames Water Utilities Limited, and its wholly owned subsidiary, have guaranteed the obligations of each other under the finance agreement, in each case to the Security Trustee.
Breakdown of secured bank loans and private placements
As at 31 March2020
£m2019
£m
THAMES WATER UTILITIES LIMITED£60.0m 1.230% index-linked loan due 2019 (h) – 78.8£60.0m 1.415% index-linked loan due 2020 (h) – 78.5£60.0m 1.513% index-linked loan due 2020 (h) – 78.1£60.0m 1.380% index-linked loan due 2020 (h) – 77.9£60.0m 1.356% index-linked loan due 2020 (h) – 77.9£100.0m floating rate loan due 2020 (a), (c) – 99.9£75.0m 1.350% index-linked loan due 2021 (e), (h) 91.6 89.2£215.0m 0.460% index-linked loan due 2023 (a), (h) 254.8 248.2£215.0m 0.380% index-linked loan due 2032 (a), (b), (h) 209.5 218.9£100.0m 3.280% index-linked loan due 2043 (a), (d), (h) 133.1 129.6£100.0m 0.790% index-linked loan due 2025 (a), (e), (h) 112.8 109.9£125.0m 0.598% index-linked loan due 2026 (a), (e), (h) 140.4 136.7£70.0m Class B 3.867% fixed rate loan due 2026 (a) 70.0 70.0£50.0m Class B 3.875% fixed rate loan due 2026 (a) 50.0 50.0£20.0m Class B floating rate loan due 2026 (a) 20.0 20.0£39.0m Class B 3.918% fixed rate loan due 2026 (a) 38.5 38.4$55.0m 3.380% private placement due 2023 (a), (f) 44.2 42.3$285.0m 3.570% private placement due 2025 (a), (f) 229.0 218.9£216.0m 2.450% private placement due 2028 (a) 215.4 215.4
Thames Water Combined Report 2019/20 167Strategic report Governance Financial statements Annual performance report

Notes to the consolidated financial statements continued
Breakdown of secured bank loans and private placements
As at 31 March2020
£m2019
£m
£210.0m 2.550% private placement due 2030 (a) 209.3 209.3£40.0m 2.620% private placement due 2033 (a) 39.8 39.8£150.0m floating rate loan due 2024 (a) 149.7 149.5£125.0m floating rate loan due 2024 (a) 124.4 –£50.0m floating rate loan due 2022 (a) 49.9 –£63.1m floating rate loan due 2027 (a) 62.9 –£63.1m floating rate loan due 2029 (a) 62.9 –£63.1m floating rate loan due 2031 (a) 62.8 –THAMES WATER UTILITIES FINANCE PLC£245.0m 1.031% floating rate loan due 2019 (c), (g) – 245.0£214.3m 1.397% Class B floating rate loan due 2019 (c), (g) – 214.3£600.0m 1.029% floating rate loan due 2020 (c), (g) 600.0 –£300.0m 1.029% floating rate loan due 2020 (c), (g) 300.0 –£300.0m 1.001% floating rate loan due 2020 (c), (g) 300.0 –£214.3m 1.082% Class B floating rate loan due 2020 (c), (g) 214.3 –£150.0m 2.329% Class B floating rate loan due 2023 (c), (g) 150.0 –$106.0m 4.070% private placement due 2026 (f) 85.1 –$131.0m 4.270% private placement 2029 (f) 105.1 –€50.0m 2.100% private placement due 2030 (f) 44.1 –$150.0m 3.870% private placement due 2022 (f) 120.7 115.5$200.0m 4.020% private placement 2024 (f) 161.0 153.9$250.0m 4.220% private placement due 2027 (f) 201.2 192.3Total secured bank loans and private placements 4,652.5 3,398.2
All loans and private placements are Class A except where highlighted.
(a) These loans and private placements are shown net of issue costs.(b) This debt amortises in equal tranches from 2017 onwards.(c) The interest margins of these loans are based on a ratings grid and vary depending on the senior debt credit rating of the Company as
assigned by both Standard and Poor’s and Moody’s.(d) This debt amortises from 2023 to 2033 in tranches of £3.0 million, followed by tranches of £750,000 until maturity where there will be
a bullet payment of £25.0 million.(e) These loans contain a collar mechanism that limits total accretion repayment within a predetermined range.(f) The Group has entered into cross currency swap agreements which convert this debt into sterling debt.(g) In March 2020, £1,200.0 million out of the £1,432.1 million Class A revolving credit facility was drawn, £214.3 million out of the
£214.3 million Class B revolving credit facility was drawn and £150.0 million out of the £300.0 million Class B term loan facility was drawn. In April 2020, £350.0 million of the Class A drawdown and the £214.3 million Class B drawdown were repaid. In May 2020, a further £40.0 million of the Class A drawdown was repaid.
(h) The value of the capital and interest elements of the index-linked loans is linked to movements in the Retail Price Index (“RPI”).
Breakdown of bonds
As at 31 March2020
£m2019
£m
THAMES WATER UTILITIES FINANCE PLC£200.0m 5.050% fixed rate due 2020 (c) 200.0 200.0£225.0m 6.590% fixed rate due 2021 225.0 225.0£175.0m 3.375% index-linked due 2021 (b), (d) 290.4 282.4£330.0m 6.750% fixed rate due 2028 (b) 327.7 327.5£200.0m 6.500% fixed rate due 2032 (b), (c) 197.9 197.8£600.0m 5.125% fixed rate due 2037 (b), (c) 596.6 596.5£300.0m 1.680% index-linked due 2053 (b), (d) 447.4 435.3£300.0m 1.681% index-linked due 2055 (b), (d) 447.4 435.3€113.0m 2.300% CPI index linked bond due 2022 (a), (c) 108.0 104.1£300.0m 5.750% Class B Fixed rate bond due 2030 (b), (e) 298.5 298.1£300.0m 4.375% fixed rate bond due 2034 (b) 295.9 295.6¥20.0bn 3.280% fixed rate bond due 2038 (a), (b), (c) 149.4 139.0£50.0m 3.853% index-linked bond due 2040 (d) 66.6 64.9£500.0m 5.500% fixed rate bond due 2041 (b) 490.0 489.8£50.0m 1.980% index-linked bond due 2042 (d) 70.4 68.9£55.0m 2.091% index-linked bond due 2042 (b), (d) 74.7 72.8£40.0m 1.974% index-linked bond due 2045 (b), (d) 46.3 46.3£300.0m 4.625% fixed rate bond due 2046 (b) 293.4 293.3£100.0m 1.846% index-linked bond due 2047 (d) 140.9 137.8£200.0m 1.819% index-linked bond due 2049 (b), (d) 281.3 275.2£200.0m 1.771% index-linked bond due 2057 (b), (d) 281.3 275.2£350.0m 1.760% index-linked due 2062 (b), (d) 492.1 481.5£500.0m 4.000% fixed rate due 2025 (b) 496.5 495.9£40.0m 0.750% index-linked loan due 2034 (b), (d) 44.7 43.5£45.0m 0.721% index-linked loan due 2027 (b), (d) 50.2 48.9£300.0m 3.500% fixed rate loan due 2028 (b) 297.0 296.6£400.0m 7.738% fixed rate bond due 2058 (b) 419.3 419.9£250.0m 1.875% fixed rate bond due 2024 (b) 248.5 248.1£250.0m 2.625% fixed rate bond due 2032 (b) 247.6 247.4£300.0m 2.375% Class B fixed rate bond due 2023 (b) 299.1 298.8£250.0m 2.875% Class B fixed rate bond due 2027 (b) 247.3 246.9CAD 250.0m 2.875% fixed rate bond due 2024 (a), (b) 141.1 142.3Fees (f) (10.9) (11.2)Total bonds 8,301.6 8,219.4
All bonds are Class A except where highlighted.
(a) The Group has entered into cross currency swap agreements which convert this debt into sterling debt. (b) These bonds are shown net of issue costs.
17. Borrowings continued
Thames Water Combined Report 2019/20 168Strategic report Governance Financial statements Annual performance report

Notes to the consolidated financial statements continued
(c) The Group has entered into swap agreements that convert this debt into GBP (£) RPI-linked debt.(d) The value of the capital and interest elements of the index-linked debt is linked to movements in the Retail Price Index (“RPI”). (e) In September 2022 this Class B bond has a ‘Step Up and Call’ meaning the interest rate changes to 3 months LIBOR plus 7.97% at
which point the issuer can exercise a call option to redeem the nominal value of the debt at par value.(f) These fees have been shown within bonds to reflect that they relate to RPI-linked debt issued in 2007.
As at 31 March2020
£m2019
£m
Amounts Owed to Group UndertakingsTHAMES WATER LIMITED£0.3m floating rate loan due 2043 0.3 0.3THAMES WATER UTILITIES HOLDINGS LIMITED£5.2m floating rate loan due 2043 5.2 5.2Total owed to group undertakings 5.5 5.5
18. Financial instrumentsCategories of financial instruments The carrying values of the financial assets and liabilities of the Group are as follows:
Financial assets:
As at 31 March2020
£m2019
£m
Fair value through profit and lossCross currency swaps 177.2 73.1Interest rate swaps 87.7 10.7Index-linked swaps 109.4 78.5
374.3 162.3Amortised costIntercompany loans receivable 1,764.0 2,002.0Other receivables (excluding prepayments) 42.3 34.4Trade and other receivables (excluding prepayments) 365.6 321.9Short-term investments 300.0 –Cash and cash equivalents 758.4 162.0
3,230.3 2,520.3Total 3,604.6 2,682.6
Financial liabilities:
As at 31 March2020
£m
restated1
2019 £m
Fair value through profit and lossCross currency swaps (51.3) (60.0)Interest rate swaps (252.1) (180.7)Index-linked swaps (757.5) (995.5)Derivatives designated as hedging instrumentsForward starting interest rate swaps – cash flow hedges – (26.2)
(1,060.9) (1,262.4)Amortised costTrade and other payables (excluding other taxation and social security) (669.3) (686.9)Borrowings (13,125.6) (11,781.8)Lease liabilities (70.3) (72.5)
(13,865.2) (12,541.2)Total (14,926.1) (13,803.6)1 The prior year results have been restated due to the impact of the transition to the new accounting standard IFRS 16 ‘Leases’ as
discussed on pages 150-152.
17. Borrowings continued
Thames Water Combined Report 2019/20 169Strategic report Governance Financial statements Annual performance report

Notes to the consolidated financial statements continued
18. Financial instruments continuedFair value measurementsThe fair value of financial assets and liabilities represents the price that would be received to sell an asset or paid to transfer a liability between informed and willing parties, other than in a forced or liquidation sale at the measurement date. The techniques for determining the fair value of financial instruments are classified under the hierarchy defined in IFRS 13 Fair Value Measurement which categorises inputs to valuation techniques into levels one to three based on the degree to which the fair value is observable. Unless otherwise stated all of the Group’s inputs to valuation techniques are level two – the fair value is determined from inputs other than quoted prices that are observable for the asset or liability, either directly or indirectly. The fair values of interest rate and index-linked swaps are determined, in part, from unobservable inputs but the use of these unobservable inputs does not significantly impact the result. As a result, we have concluded that it is appropriate to continue to classify the derivative instruments as level two. The table below sets out the valuation basis of financial instruments held at fair value as at 31 March 2020:
As at 31 March
Level 21
2020 £m
2019 £m
Financial assets – derivative financial instrumentsCross currency swaps 177.2 73.1Interest rate swaps 87.7 10.7Index-linked swaps 109.4 78.5
374.3 162.3Financial liabilities – derivative financial instrumentsCross currency swaps (51.3) (60.0)Interest rate swaps (252.1) (180.7)Index-linked swaps (757.5) (995.5)Forward starting interest rate swaps – (26.2)
(1,060.9) (1,262.4)Net total (686.6) (1,100.1)1 The fair value of derivative financial instruments, including interest rate swaps, cross currency swaps and index-linked swaps are
measured using discounted cash flows. The future cash flows are estimated based on observable forward interest rates and inflation rates and discounted at a rate that reflects the credit risk of the Group and counterparties. Currency cash flows are translated at spot rate.
During November 2019, the maturity dates of three index-linked swaps, with a total notional of £400.0 million, was extended. These swaps are measured at fair value through the income statement. At the restructuring date the fair value of these instruments, as indicated by their fair value immediately prior to the restructuring, could not be supported by observable inputs alone. In management’s view the reduction in value of £38.0 million is supported by unobservable factors including the counterparty’s credit, capital, funding and trading charges. Therefore, such movement was deferred on the balance sheet in compliance with IFRS 9 and will be recognised in the income statement on a straight-line basis over the life of the underlying derivative instrument. As at 31 March
2020, £37.3 million (31 March 2019: £nil) remained capitalised and £0.7 million had been recognised in the income statement.
Comparison of fair value of financial instruments with their carrying amountsThe carrying amounts of the Group’s trade and other receivables, lease liabilities, cash and cash equivalents, short-term investments, trade and other payables are considered to be approximate to their fair values. The fair values and carrying values of the Group’s other financial assets and financial liabilities are set out in the tables below.
Financial assets:
As at 31 March
2020 2019
Book value £m
Fair value £m
Book value £m
Fair value £m
Non-currentIntercompany loans receivable 1,752.2 1,752.2 1,974.7 1,974.7Derivative financial instruments Cross currency swaps 177.2 177.2 73.1 73.1 Interest rate swaps 87.7 87.7 10.7 10.7 Index-linked swaps 109.4 109.4 78.5 78.5Trade and other receivables 229.7 229.7 141.2 141.2
2,356.2 2,356.2 2,278.2 2,278.2CurrentCash and cash equivalents 758.4 758.4 162.0 162.0Short-term investments 300.0 300.0 – –Amounts owed by group undertakings 11.8 11.8 27.3 27.3Trade and other receivables 369.3 369.3 348.5 348.5
1,439.5 1,439.5 537.8 537.8Total 3,795.7 3,795.7 2,816.0 2,816.0
Thames Water Combined Report 2019/20 170Strategic report Governance Financial statements Annual performance report

Notes to the consolidated financial statements continued
18. Financial instruments continuedFinancial liabilities:
As at 31 March
2020 2019 restated1
Book value £m
Fair value £m
Book value £m
Fair value £m
Non-currentBorrowings Secured bank loans and private placements (3,222.1) (3,462.7) (2,433.9) (2,670.4) Bonds (8,100.3) (10,226.8) (8,218.4) (10,562.5) Amounts owed to group undertakings (5.5) (5.5) (5.5) (5.5)Derivative financial instruments Cross currency swaps (51.3) (51.3) (60.0) (60.0) Interest rate swaps (252.1) (252.1) (180.7) (180.7) Index-linked swaps (742.5) (742.5) (956.9) (956.9) Forward starting interest rate swaps – – (26.2) (26.2)
(12,373.8) (14,740.9) (11,881.6) (14,462.2)CurrentBorrowings Secured bank loans and private placements (1,430.4) (1,436.5) (964.3) (977.7) Bonds (201.3) (200.4) (1.0) (1.0)Interest payable (166.0) (166.0) (158.7) (158.7)Derivative financial instruments Index-linked swaps (15.0) (15.0) (38.6) (38.6)
(1,812.7) (1,817.9) (1,162.6) (1,176.0)Total (14,186.5) (16,558.8) (13,044.2) (15,638.2)1 The prior year results have been restated due to the impact of the transition to the new accounting standard IFRS 16 ‘Leases’ as
discussed on pages 150-152.
The fair value of borrowings represents the market value of the publicly traded underlying liquid bonds and associated derivatives. For private placements and less liquid underlying bonds, the fair value is determined by discounting expected future cash flows using a risk-free rate plus the Group’s credit spread.
The fair value of index-linked debt instruments is based on the nominal value of the debt plus accretion already accrued and accretion expected to accrue to maturity. Amounts owed by group entities include floating rate loans, the fair value of these loans is assumed to be the nominal value of the primary loan.
Capital risk management Capital risk primarily relates to whether the Group is adequately capitalised and financially solvent. The Board reviews the Group’s exposure to these risks and actively overseas the treasury activities, reviewing the treasury policy and approving the treasury strategy and funding plan.
The Group’s key objectives in managing capital are:
• To maintain a broad portfolio of debt, diversified by source and maturity
• To retain the Company’s investment grade credit rating
• To provide liquidity sufficient to fund ongoing obligations for a minimum of a 15-month forward period on an ongoing basis
• To maintain customer bills at a level which is both affordable and sustainable
Derivative financial instruments are used, where appropriate to manage the risk of fluctuations in interest rates, inflation and foreign exchange rates. No open or speculative positions are taken.
The Group is part of a Whole Business Securitisation (“WBS”) Group of companies. The Group guarantees the funding activity of Thames Water Utilities Finance Plc which raises debt finance in external debt markets through the issuance of secured bonds and the issue of loans. The Securitisation Group is required to comply with certain covenants, which include, amongst others:
• Interest cover ratios
• Gearing ratios
• An obligation to manage the maturity profile of debt arrangements
• An obligation to manage the proportion of future interest cost which is fixed and/or index-linked
• Unsecured debt ratios
The Securitisation Group complied with these ratios throughout the financial year.
Thames Water Combined Report 2019/20 171Strategic report Governance Financial statements Annual performance report

Notes to the consolidated financial statements continued
18. Financial instruments continuedThe capital structure of the Group consists of net debt and equity as follows:
As at 31 March2020
£m
Restated1 2019
£m
Secured bank loans and private placements (4,652.5) (3,398.2)Bonds (8,301.6) (8,219.4)Lease liability1 (70.3) (67.3)Amounts owed to group undertakings (5.5) (5.5)Interest payable on borrowings (166.0) (158.7)
(13,195.9) (11,849.1)Short-term investments 300.0 –Cash and cash equivalents 758.4 162.0Net debt (statutory basis) (12,137.5) (11,687.1)
Reconciliation to net debt (covenant basis)Interest payable on borrowings 166.0 158.7Amounts owed to group undertakings 5.5 5.5Unamortised debt issuance costs and discount (72.5) (75.6)Derivative financial liabilities (110.6) (222.0)Unamortised IFRS 9 adjustment 25.1 25.8Net debt (covenant basis) (12,124.0) (11,794.7)Equity attributable to owners of the Group 3,147.5 2,792.91 The prior year results have been restated due to the impact of the transition to the new accounting standard IFRS 16 ‘Leases’ as
discussed on pages 150-152. The restatement has resulted in an adjustment of £5.8m to the equity disclosed.
Net debt (covenant basis) excludes accrued interest, amounts owed to group undertakings, unamortised debt issuance costs and discounts, unamortised IFRS 9 adjustment and includes derivative financial liabilities related solely to accretion on index-linked swaps and the effect of movement in foreign exchange rate to cross currency swap held in the Group. Amounts owed to group undertaking include loans from immediate parent Thames Water Utilities Holdings Limited £5.2 million (2019: £5.2 million) and from the parent of the immediate parent Thames Water Limited £0.3 million (2019: £0.3 million) as these are not related to external debt.
Reconciliation of liabilities arising from financing activitiesThe reconciliation below between the opening and closing balances for liabilities arising from financing activities evaluates changes in liabilities including changes arising from both cash flow and non-cash items.
As at 31 March
2020 2019
Borrowings £m
Net derivative
financial liabilities3
£m
Lease liabilities4
£m Borrowings
£m
Net derivative
financial liabilities3
£m
Lease liabilities4
£m
Opening balance (11,781.8) (1,100.1) (72.5) (11,088.5) (1,153.3) (75.3) Non-current (10,657.7) (1,061.5) (65.1) (10,822.2) (1,149.5) (72.5) Current (1,124.1) (38.6) (7.4) (266.3) (3.8) (2.8)Cash flowsNew loans raised (3,141.8) – – (1,148.8) – –Repayment of borrowings 1,967.1 – – 669.5 – –Repayment of lease principal – – 11.0 – – 10.1Derivative paydown1 – 123.2 – – (2.8) –Interest paid2 389.2 – – 382.7 – –Interest received – (48.7) – – (8.5)
(785.5) 74.5 11.0 (96.6) (11.3) 10.1Non-cash changesInterest accrued/Fees amortised (401.8) 65.2 – (387.3) 8.9 –Foreign exchange movement (52.1) – – (68.0) – –Indexation (105.1) – – (110.1) – –Unamortised IFRS 9 adjustment 0.7 – – (25.8) – –Lease additions – – (5.1) – – (3.4)Other interest accrued on IFRS 16 leases – – (3.7) – – (3.9)Fair value changes – 273.8 – – 55.6 –Amounts owed to group undertakings – – – (5.5) – –
(558.3) 339.0 (8.8) (596.7) 64.5 (7.3)Closing balance (13,125.6) (686.6) (70.3) (11,781.8) (1,100.1) (72.5) Non-current (11,327.9) (671.6) (62.4) (10,657.7) (1,061.5) (65.1) Current (1,797.7) (15.0) (7.9) (1,124.1) (38.6) (7.4)1 Derivative paydown of £123.2 million (2019: £13.4 million) relates to index-linked swaps where accretion is payable periodically.2 Interest paid of £389.2 million (2019: £382.7 million) includes £97.6 million of capitalised borrowing costs (2019: £109.3 million) and
excludes £0.2 million of bank charges (2019: £0.4 million). 3 The reconciliation of liabilities from financing activities in respect of derivative financial liabilities includes a net derivative financial
liability position, presentation of prior year numbers has been updated accordingly.4 The prior year results have been restated due to the impact of the transition to the new accounting standard IFRS 16 ‘Leases’ as
discussed on pages 150-152.
Thames Water Combined Report 2019/20 172Strategic report Governance Financial statements Annual performance report

Notes to the consolidated financial statements continued
18. Financial instruments continuedFinancial risk managementThe Group’s activities expose it to a number of financial risks: market risk (including interest rate risk, exchange rate risk and inflation risk), credit risk, and liquidity risk. Details of the nature of each of these risks along with the steps the Group has taken to manage them is described below and overleaf.
(a) Market risk Market risk relates to fluctuations in external market variables such as interest rates, inflation and foreign exchange rates that could affect the Group’s income or the value of the financial instruments it holds. Below is the effective interest rate and foreign currency risk profile of the debt held by the Group after taking into account the derivative financial instruments used to manage market risk.
As at 31 March 2020:
Total at fixed rates
£m
Total at floating rates
£m
Total at RPI linked rates
£mTotal
£m
Interest bearing loans and borrowingsNet of corresponding swap assets– £ Sterling 4,050.5 1,753.2 7,241.4 13,045.1
As at 31 March 2019:
Total at fixed rates
£m
Total at floating rates
£m
Total at RPI linked rates
£mTotal
£m
Interest bearing loans and borrowingsNet of corresponding swap assets– £ Sterling 5,660.8 635.1 5,524.7 11,820.6
The weighted average interest rates of the debt held by the Group, after taking into account the derivative financial instruments used to manage market risk, and the period until maturity for which the rate is fixed and index-linked, are given below.
Weighted average
interest rate Weighted average period
until maturity
As at 31 March2020
%2019
%2020 Years
2019 Years
Fixed 5.3 5.1 11.7 11.6Index-linked 3.6 4.5 18.1 21.1
(i) Interest rate risk sensitivity analysisThe Group holds both fixed and floating rate borrowings. Fixed rate borrowings are exposed to a risk of change in their fair value due to changes in interest rates. Floating rate borrowings are exposed to a risk of change in interest cash flows due to changes in interest rates. The Group uses interest rate swaps which economically hedge future cash flows to protect against interest rate movements. For details of the interest rate swaps please see the Cash flow hedges section of this note on page 175.
The table below summarises the impact, on pre-tax profits, of 1% increase or decrease in interest rate at 31 March 2020. This analysis considers the effect of variable interest rate instruments and assumes that all other variables, in particular exchange rates, remain constant.
As at 31 March
2020+1% £m
2020-1% £m
2019+1%
£m
2019-1% £m
Profit 298.7 (349.0) 277.7 (340.7)Equity 298.7 (349.0) 290.4 (353.6)
(ii) Exchange rate sensitivity analysisThe Group’s foreign currency risk exposure results from debt raised in currencies other than Sterling. The Group uses cross currency swaps to hedge the foreign currency exposure of bonds issued in a foreign currency. All hedges are undertaken for commercial reasons with the objective of minimising the impact of exchange rate fluctuations. The Group has no material unhedged monetary assets or liabilities denominated in a currency other than sterling.
The table below summarises the impact of changes in the year end valuations of financial assets and liabilities denominated in foreign currency on pre-tax profits of a 10% strengthening or weakening of GBP (£) against the respective currencies in which the financial assets and liabilities are denominated at 31 March 2020. This analysis assumes that all other variables in the valuation remain constant.
As at 31 March
2020 +10%
£m
2020 -10%
£m
2019 +10%
£m
2019 -10%
£m
Profit (28.4) 24.5 (20.9) 8.4Equity (28.4) 24.5 (20.9) 8.4
(iii) Inflation risk sensitivity analysisThe Group has entered into financial instruments that are directly linked to inflation including RPI linked bonds, loans and swaps. In addition, the Group as a regulated water and wastewater Group is subject to fluctuations in its revenues due to movements in inflation. Therefore the Group’s RPI linked borrowings and swaps form a partial economic hedge as the assets and liabilities partially offset.
The table below summarises the impact on pre-tax profits of a 1% increase or decrease in inflation rates at 31 March 2020. This analysis assumes that all other variables, in particular exchange rates, remain constant.
As at 31 March
2020 +1% £m
2020 -1% £m
2019 +1%
£m
2019 -1% £m
Profit (740.1) 699.1 (635.7) 511.4Equity (740.1) 699.1 (635.7) 511.4
Thames Water Combined Report 2019/20 173Strategic report Governance Financial statements Annual performance report

Notes to the consolidated financial statements continued
18. Financial instruments continued b) Credit risk Credit risk relates to the potential financial loss to the Group if a customer or counterparty to a financial instrument fails to meet its contractual obligations. This arises principally from the Group’s trade receivables, its loan with its immediate parent entity Thames Water Utilities Holdings Limited, insurance receivables, short-term investments and cash flows receivable from counterparties to the derivative financial instruments.
The Group has a statutory obligation to provide water and sewerage services to customers within its region. Due to the large area served by the Group and the significant number of households within this area, there is considered to be no concentration of trade receivables credit risk, however, the Group’s credit control policies and procedures are in place to minimise the risk of bad debt arising from its household trade receivables. Amounts provided against trade receivables and movements in the provision in the year are disclosed in note 14. For non-household customers, the credit risk lies with a small number of retailers rather than the end user and exposure to retailer default would be limited within the non-household market.
Under the terms of the WBS agreement, counterparties to the Group’s short-term investments and derivative transactions have to meet minimum credit rating criteria as assigned by both Moody’s and S&P. For derivative counterparties there is a mechanism for the counterparty to post collateral when amounts due to the Group under outstanding derivative contracts exceed a contractually agreed threshold amount or the counterparty fails to meet the necessary credit rating criteria.
The Group’s maximum exposure to credit risk is the carrying amount of financial assets recorded in the financial statements, which is net of impairment losses, less collateral cash held under the terms of the whole business securitisation agreement. No collateral was held as at 31 March 2020 (2019: nil).
The following table summarises amounts held on short-term investments by credit rating of counterparties.
As at 31 March2020
£m2019
£m
A+ 150.0 –A 150.0 –Total 300.0 –
The following table summarises fair value of derivatives assets by credit rating of counterparties.
As at 31 March2020
£m2019
£m
AA- 93.4 38.2A+ 228.2 88.1A 43.3 36.0A- 9.4 –Total 374.3 162.3
(c) Liquidity risk Liquidity risk is the risk that the Group will not be able to meet its financial obligations as they fall due. The Group manages long-term liquidity by maintaining continuity of funding through access to different market and debt instruments, raising funds in the capital markets and ensuring that manageable debt maturity profiles are maintained. The Group also maintains a level of committed liquidity facilities provided by a range of financial institutions. Details of the Group’s borrowings are disclosed in Note 17.
The maturity profile of interest-bearing loans and borrowings disclosed in the statement of financial position are given below.
As at 31 March2020
£m2019
£m
Within one year 1,631.7 965.4Between one and two years 745.1 214.9Between two and three years 219.6 727.0Between three and four years 1,130.4 161.3Between four and five years 774.8 1,113.4After more than five years 8,458.0 8,441.1Total 12,959.6 11,623.1
(i) Cash flows from non-derivative financial liabilitiesThe maturity profile of the anticipated future cash flows including interest in relation to the Group’s non-derivative financial liabilities on an undiscounted basis (excluding non-current trade payables), which, therefore, differs from both the carrying value disclosed in the statement of financial position and fair values, is as follows:
As at 31 March2020
£m2019
£m
Within one year 2,702.2 2,050.4Between one and two years 1,153.1 586.5Between two and three years 596.8 1,134.4Between three and four years 1,528.7 511.4Between four and five years 1,135.8 1,513.9After more than five years 17,801.9 20,172.7Total 24,918.5 25,969.3
Thames Water Combined Report 2019/20 174Strategic report Governance Financial statements Annual performance report

Notes to the consolidated financial statements continued
18. Financial instruments continued(ii) Cash flows from derivative financial instrumentsThe maturity profile of the Group’s financial derivatives (which include interest rate swaps, cross currency swaps and index-linked swaps), based on undiscounted cash flows, is as follows:
As at 31 March2020
£m2019
£m
Within one year 168.0 (46.9)Between one and two years 150.1 (19.5)Between two and three years 77.8 24.9Between three and four years (13.8) (68.6)Between four and five years (86.1) (137.4)After more than five years (1,238.3) (1,521.5)Total (942.3) (1,769.0)
Cash flow hedgesThe Group has designated a number of contracts which qualify, in accordance with IFRS 9: Financial Instruments, as cash flow hedges. The accounting policy on cash flow hedges is explained on page 149.
In mid-2014 the Group executed £2.25 billion of forward-starting floating to fixed interest rate swaps of a 5-7 year maturity with various financial institutions. At inception the swaps were designated as a cash flow hedge of the future interest cost of debt to be issued from 2017 to 2020. The effective portion of the fair value movements on these swaps was recognised in the cash flow hedge reserve, to be reclassified to the income statement over the life of the underlying hedged debt.
As of the start of this year £2.0 billion of these swaps had already commenced. The remaining £250.0 million, due to commence in September 2019, were restructured in July 2019. The cash flow hedge relationship was terminated at the restructuring date because changes in the expected cash flows would result in significant ineffectiveness. The fair value movements prior to termination were recognised in the cash flow hedge reserve and will be reclassified to the income statement over the life of the underlying hedged debt which, although delayed, was still expected to be issued. Fair value movements subsequent to termination were recognised in the income statement. In September 2019, on commencement, the £250 million swaps were reclassified from forward starting swaps to interest rate swaps.
During the year a £4.1 million loss (2019: loss of £8.9 million) was recognised in the cash flow hedge reserve and a £34.9 million loss (2019: £34.2 million loss) was reclassified from the cash flow hedge reserve to the income statement, see statement of changes in equity. The amount reclassified of £34.9 million consisted of a £31.6 million loss related to hedged exposure that crystallised during the year and a £3.3 million loss due to ineffectiveness relating to the swaps that were restructured during the year due to the delay in issuance of the related debt.
The Group’s cash flow hedge reserve disclosed on the Statement of changes in equity on page 141 relate to forward starting interest rate swaps.
Cash flow hedge reserve £m
At 1 April 2018 (138.9)Loss on cash flow hedge (8.9)Cash flow hedge transferred to income statement 34.2Deferred tax charge on cash flow hedge gains (4.3)At 31 March 2019 (117.9)Loss on cash flow hedge (4.1)Cash flow hedge transferred to income statement 34.9Deferred tax charge on cash flow hedge gains including impact of deferred tax rate change (3.0)At 31 March 2020 (90.1)
Following are the effects of forward starting interest rate swaps on the Group’s financial position and performance:
As at 31 March2020
£m2019
£m
QuantitativeCarrying amount – 26.2Notional amount – 250.0Change in fair value during the year 4.1 5.5Change in the value of hedged item used to determine hedge effectiveness 4.1 5.6
As at 31 March 2020 2019
QualitativeMaturity date – September
2024Hedge ratio – 1:1
The expected cash flows of the Group’s cash flow hedging instruments are as follows:
As at 31 March2020
£m2019
£m
Interest rate swapsWithin one year – (2.4)Between one and two years – (4.9)Between two and three years – (4.9)Between three and four years – (4.9)Between four and five years – (4.9)After more than five years – (2.4)Total – (24.4)
Thames Water Combined Report 2019/20 175Strategic report Governance Financial statements Annual performance report

Notes to the consolidated financial statements continued
19. Deferred taxAn analysis of movements in the deferred tax liabilities and assets recognised by the Group is set out below:
Accelerated depreciation
£m
Retirement benefits
£m
Cash flow hedge
£mOther
£mTotal
£m
At 31 March 2018 (1,050.2) 33.4 158.8 13.6 (844.4)Restatement for IFRS 16 – – – 1.6 1.6
Restated1 At 1 April 2018 (1,050.2) 33.4 158.8 15.2 (842.8)Charge to income (restated) (1.0) 3.8 (3.4) (6.8) (7.4)Charge to other comprehensive income
– 4.3 (4.3) – –
Restated1 At 31 March 2019 (1,051.2) 41.5 151.1 8.4 (850.2)Credit/(charge) to income (146.9) (5.1) (33.9) 5.7 (180.2)Credit/(charge) to other comprehensive income
– (29.7) (3.0) – (32.7)
At 31 March 2020 (1,198.1) 6.7 114.2 14.1 (1,063.1)
Deferred tax assets and liabilities have been offset in the balance sheet. The offset amounts, which are to be recovered/settled after more than 12 months are as follows:
As at 31 March2020
£m
Restated1
2019 £m
Deferred tax asset 135.0 201.0Deferred tax liability (1,198.1) (1,051.2)Total (1,063.1) (850.2)1 The prior year results have been restated due to the impact of the transition to the new accounting standard IFRS 16 ‘Leases’ and
other restatements on 1 April 2019, which have been discussed on pages 150-152.
A reduction in the UK corporation tax rate from 19% to 17% (effective from 1 April 2020) was substantively enacted on 6 September 2016. However, this reduction was reversed in the March 2020 Budget and substantively enacted on 17th March 2020. Therefore, with effect from 1 April 2020 the corporation tax rate remains at 19% and the deferred tax assets and liabilities shown above as at 31 March 2020 have been calculated based on this rate, except the deferred tax liability on the pension surplus which is provided at 35%.
A deferred tax liability arises in respect of accelerated tax depreciation, because the rate of tax relief specified in UK tax legislation on most of our capital expenditure is quicker than the rate of accounting depreciation on that expenditure. These temporary differences unwind and affect current tax over the life of the relevant assets, but the continued high levels of capital investment within the Group mean that the temporary differences currently tend to increase every year.
Deferred tax assets have arisen on the following temporary differences:
• Retirement benefit obligations: A net deferred tax asset is provided on the retirement benefit obligations booked in the accounts. The £6.7m deferred tax asset carried forward is the net of an asset of £39.7m (19% of the deficit on the TWPS pension scheme of £209.1m) less a liability of £33.0m (35% of the surplus on the MIPS pension scheme of £94.5m). Current tax relief will be available in the future for pension contributions paid to reduce these obligations. Deferred tax movements will also arise on any non-cash changes in the obligations, for example those arising from actuarial valuations.
• Cash flow hedge: A deferred tax asset is provided on certain fair values booked in respect of financial instruments in the accounts. Current tax relief will be available in the future as the cash flows arise over the lives of the derivatives. Deferred tax movements will also arise on any non-cash changes in the fair value of the derivatives.
• Other: A deferred tax asset is provided on the temporary differences arising on amounts for which a tax deduction is spread over a number of years in accordance with tax legislation, including certain pension contributions. Current tax relief will be available in future when tax relief is available in accordance with the legislation. The balance has been restated to include deferred tax on the net timing differences resulting from the adoption of IFRS 16 and other restatements.
Thames Water Combined Report 2019/20 176Strategic report Governance Financial statements Annual performance report

Notes to the consolidated financial statements continued
20. Provisions for liabilities and charges
Emissions provision
£m
Insured liabilities
£m
Capital infrastructure
provision £m
Dilapidations (restated1)
£m
Other provisions
£mTotal
£m
At 1 April 2019 (restated)1 4.6 59.3 20.5 10.2 24.6 119.2Utilised during the period (4.6) (25.9) (4.1) – (11.2) (45.8)Additional provisions recognised – 51.7 – 0.8 18.3 70.8Unused amounts reversed – – – – (1.0) (1.0)Charge to capital project – – 1.1 – – 1.1At 31 March 2020 – 85.1 17.5 11.0 30.7 144.31 The prior year results have been restated due to the impact of the recording of a provision for property dilapidations which is discussed
on page 152.
At 1 April 2019, emissions provisions related to the obligation to purchase carbon emissions allowances. This scheme was discontinued by the government as at 31 March 2019 and therefore this amount has been utilised during the period.
The insured liability provision arises from insurance claims from third parties received by the Group, and represents the estimated cost of settlement. Where we have insurance cover for these claims, we recognise the reimbursement value from third party insurance companies net of retentions. The increase in insured liabilities in current year to £85.1 million (2019: £59.3 million) relates to an incident in Finsbury Park that occurred in October 2019. The receivable is disclosed in Note 14. Timing of settlement for these claims is uncertain and therefore amounts provided have been classified as non-current.
The capital infrastructure provision is to cover various potential third party costs arising from the construction of infrastructure assets. Due to the uncertain timing of these costs the Group considers it appropriate to classify these as non-current.
Other provisions principally relate to a number of contractual and legal claims against the Group and potential fines for non-compliance with various regulations the Group is obliged to meet. The amount recorded represents management’s best estimate of the value of settlement (either before or following court proceedings) and associated costs. Timing of settlement/court judgement for these claims is uncertain and therefore amounts provided have been classified as non-current.
The Group needs to determine the merits/strength of any litigation against it and the chances of a claim being successful, the likelihood of an outflow of economic benefits occurring and whether there is a need to disclose a contingent liability or whether a provision is required based on this assessment.
There are claims against the Group arising in the normal course of business, which are subject to early stage correspondence between the parties and/or litigation. Judgement is required in measuring and recognising provisions related to pending litigation or other outstanding claims that are subject to negotiated settlement or Court assessment. This includes evaluating the likelihood that an outstanding claim will succeed and to quantify the possible range of any financial settlement and outflow of economic benefits. There is an inherent risk that the final outcome of legal claims will be different to amounts provided.
The Group has also taken the option under paragraph 92 of IAS 37 for non-disclosure of certain information relating to provisions and contingent liabilities in extremely rare cases where this can be expected to seriously prejudice the entity in a dispute.
21. Called up share capital and other reservesCalled up share capital
As at 31 March
2020 2019
Underlying £m
BTL £m
Total £m
Underlying £m
BTL £m
Total £m
Allotted, called up and fully paid:29,050,000 ordinary shares of £1 each (2019: 29,050,000 ordinary shares of £1 each) 29.0 – 29.0 29.0 – 29.0
The company has one class of ordinary share which carries no right to fixed income. The holders of ordinary shares are entitled to receive dividends as declared and are entitled to one vote per share at meetings of the Company.
Other reserves
As at 31 March
2020Restated1
2019
Underlying £m
BTL £m
Total £m
Underlying £m
BTL £m
Total £m
Share premium 100.0 – 100.0 100.0 – 100.0Cash flow hedge reserve (90.1) – (90.1) (117.9) – (117.9)Revaluation reserve 934.3 – 934.3 989.3 – 989.3Retained earnings 2,016.3 158.0 2,174.3 1,692.5 100.0 1,792.5Total 2,960.5 158.0 3,118.5 2,692.9 100.0 2,792.9
The revaluation reserve reflects the revaluation of infrastructure assets to fair value on transition to IFRS, net of deferred tax.
The cash flow hedge reserve comprises the effective portion of the cumulative net change in the fair value of cash flow hedging instruments related to hedged transactions that have not yet occurred.
1 The prior year results have been restated due to the impact of the transition to new accounting standard IFRS 16 ‘Leases’ on 1 April 2019 as discussed on pages 150-152 as well as other restatements, relating to leakage capitalisation and dilapidations which are discussed on page 152.
Thames Water Combined Report 2019/20 177Strategic report Governance Financial statements Annual performance report

Notes to the consolidated financial statements continued
22. Retirement benefit obligationsBackgroundThe Group operates two defined benefit pension schemes and one defined contribution pension scheme.
What are they? How do they impact the financial statements?
Defined Contribution Scheme This scheme was set up in April 2011, is managed through Standard Life, and is open to all new employees of the Company.
In a defined contribution pension scheme the benefits are linked to:
• contributions paid;
• the performance of the individual’s chosen investments; and
• the form of benefits
A charge of £13.1 million (2019: £11.0 million) was recognised in the income statement relating to the contributions payable by the Group based upon a fixed percentage of employees’ pay.
There were £1.6 million (2019: £1.5 million) of outstanding contributions at the year-end recognised in the statement of financial position. These were paid in the following financial year.
The Group has no exposure to investment or other experience risks.
What are they? How do they impact the financial statements?
Defined Benefit SchemesDefined benefit arrangements for the Company’s eligible employees are provided through two defined benefit pension schemes:
• Thames Water Pension Scheme (“TWPS”); and
• Thames Water Mirror Image Pension Scheme (“TWMIPS”).
Both now are career average pension schemes. Their assets are held separately from the rest of the Kemble Water Holdings Limited Group in funds in the United Kingdom which are independently administered by the pension trustees. TWMIPS has been closed to new entrants since 1989 and TWPS since April 2011. New entrants now join the defined contribution scheme.
In a defined benefit pension scheme the benefits:
• are defined by the scheme rules;
• depend on a number of factors including age, years of service and pensionable pay; and
• do not depend on contributions made by the members or the Company
A charge was recognised in the income statement of £33.0 million (2019: £41.3 million) relating to the following:
• service cost representing the increase in the defined benefit liability arising from pension benefits earned by active members in the current period;
• past service cost representing the increase in the defined benefit liability arising from GMP equalisation;
• administrative expenses for the pension schemes;
• the net interest expense on pension scheme assets and liabilities; and
An actuarial gain of £168.4 million (2019: loss of £23.4 million) on the value of the pension scheme was recognised in the statement of other comprehensive income. This reflects the impact of changes in financial assumptions and the demographic of the scheme members when compared with those at the start of the year, as well as the return on the schemes’ assets over and above the amount included in the net interest expense.
A pension asset of £94.5 million (2019: £45.8 million) is recognised in the statement of financial position for the TWMIPS scheme. A pension deficit of £209.1 million (2019: £338.8million) is recognised in the statement of financial position for the TWPS scheme. As at 31 March 2020, the net pension deficit is £114.6 million (2019: £293.0 million).
The Group is exposed to investment and other experience risks. Where it is estimated that the benefits will not be met by regular contributions, assets held or expected investment income, additional contributions are being made by the Group.
Thames Water Combined Report 2019/20 178Strategic report Governance Financial statements Annual performance report

Notes to the consolidated financial statements continued
22. Retirement benefit obligations continuedIn addition to the cost of the defined benefit pension arrangements, the Group operates arrangements under which it augments benefits on retirement in certain cases of redundancy. These augmentations are funded by way of additional employer contributions to the schemes. In the year to 31 March 2020 these related payments amounted to £0.3 million (2019: £0.1 million).
The defined benefit pension schemes are subject to a full actuarial valuation every three years using assumptions agreed between the trustees of the pension schemes and the Group. The purpose of this triennial valuation is to evaluate and if necessary modify the funding plans of the pension schemes to ensure the schemes have sufficient funds to meet future benefit payments. The most recent full actuarial valuation of the defined benefit pension scheme was carried out at 31 March 2019 on behalf of the trustees by David Gardiner of Aon, the actuary of the schemes. This resulted in a combined funding deficit across the two schemes of £148.9 million (2016: £364.9 million) with the market value of the assets being £2,313.3 million (2016: £1,905.5 million).
The triennial funding valuation is different from the accounting valuation presented in the financial statements due to the use of different assumptions and changes in market conditions from 31 March 2019 to 31 March 2020. The 2019 funding valuation has been updated to an accounting valuation as at 31 March 2020 by Hymans Robertson LLP, an independent and professionally qualified consulting actuary, using revised assumptions that are consistent with the requirements of IAS 19 Employee Benefits and shown in this note to the financial statements.
Amounts recognised in the financial statements in respect of the defined benefit pension schemesIncome StatementThe amounts recognised in the income statement with respect to the defined benefit pension schemes are detailed below:
Year ended
2020 2019
TWPS £m
TWMIPS £m
TWPS £m
TWMIPS £m
Current service cost 19.5 2.7 18.1 3.6Past service cost including curtailments1 – – 6.8 2.2Scheme administration expenses 3.1 1.5 2.7 1.3Net interest cost/(income) 7.4 (1.2) 7.9 (1.3)Total 30.0 3.0 35.5 5.81 Refer to the GMP equalisation section below for information on the past service costs including curtailments.
The net expense is recognised in the following captions within the income statement:
Year ended
2020 2019
TWPS £m
TWMIPS £m
TWPS £m
TWMIPS £m
Operating expenses 22.6 4.2 27.6 7.1Net finance expense/(income) 7.4 (1.2) 7.9 (1.3)Total 30.0 3.0 35.5 5.8
Statement of other comprehensive incomeActuarial gains and losses on the defined benefit schemes have been recognised within other comprehensive income. An analysis of the amount presented is set out below:
As at 31 March2020
£m2019
£m
Actual return less expected return on pension scheme assets 88.4 76.5Experience gain arising on scheme liabilities 19.0 1.3Gain/(loss) arising due to change in financial assumptions 145.0 (158.0)(Loss)/ Gain arising due to change in demographic assumptions (84.0) 56.8Total actuarial gain/(loss) 168.4 (23.4)Cumulative actuarial losses recognised (326.7) (495.1)
Statement of financial positionThe net pension liability recognised within the statement of financial position is as follows:
As at 31 March
2020 2019
TWPS £m
TWMIPS £m
Total £m
TWPS £m
TWMIPS £m
Total £m
Fair value of scheme assets 1,595.3 805.8 2,401.1 1,508.2 805.2 2,313.4Present value of defined benefit obligations (1,804.4) (711.3) (2,515.7) (1,847.0) (759.4) (2,606.4)(Deficit)/surplus (209.1) 94.5 (114.6) (338.8) 45.8 (293.0)Net pension deficit (114.6) (293.0)
Reconciliation of defined benefit plan assets and liabilitiesThe movement in the present value of the defined benefit obligations were as follows:
2020Restated
2019
TWPS £m
TWMIPS £m
TWPS £m
TWMIPS £m
At 1 April 1,847.0 759.4 1,743.7 755.0Current service cost 19.5 2.7 18.1 3.6Past service cost including curtailments – – 6.8 2.2Interest cost 43.9 17.4 45.7 19.1Contributions from scheme members 0.1 – 0.1 –Benefits paid (51.5) (44.5) (47.9) (40.0)Termination benefits 1.4 0.3 0.1 –Actuarial losses (56.0) (24.0) 80.4 19.5At 31 March 1,804.4 711.3 1,847.0 759.4
Thames Water Combined Report 2019/20 179Strategic report Governance Financial statements Annual performance report
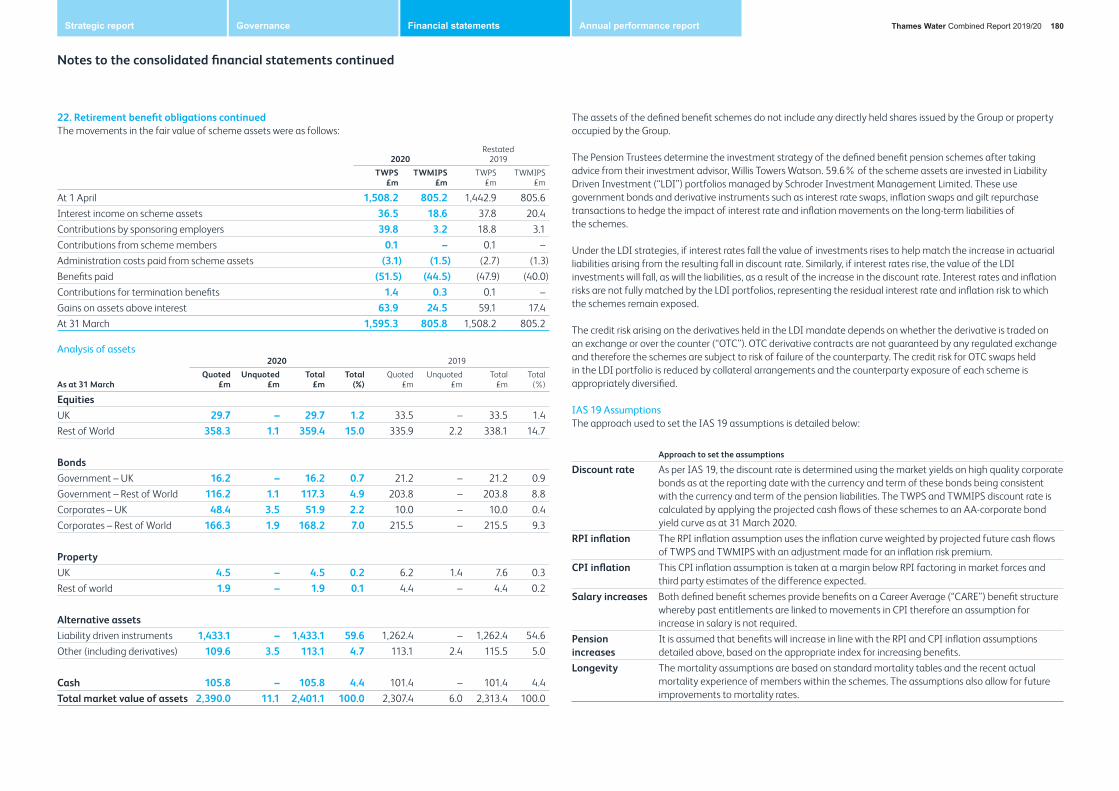
Notes to the consolidated financial statements continued
22. Retirement benefit obligations continuedThe movements in the fair value of scheme assets were as follows:
2020Restated
2019
TWPS £m
TWMIPS £m
TWPS £m
TWMIPS £m
At 1 April 1,508.2 805.2 1,442.9 805.6Interest income on scheme assets 36.5 18.6 37.8 20.4Contributions by sponsoring employers 39.8 3.2 18.8 3.1Contributions from scheme members 0.1 – 0.1 –Administration costs paid from scheme assets (3.1) (1.5) (2.7) (1.3)Benefits paid (51.5) (44.5) (47.9) (40.0)Contributions for termination benefits 1.4 0.3 0.1 –Gains on assets above interest 63.9 24.5 59.1 17.4At 31 March 1,595.3 805.8 1,508.2 805.2
Analysis of assets
As at 31 March
2020 2019
Quoted £m
Unquoted £m
Total £m
Total (%)
Quoted £m
Unquoted £m
Total £m
Total (%)
EquitiesUK 29.7 – 29.7 1.2 33.5 – 33.5 1.4Rest of World 358.3 1.1 359.4 15.0 335.9 2.2 338.1 14.7
BondsGovernment – UK 16.2 – 16.2 0.7 21.2 – 21.2 0.9Government – Rest of World 116.2 1.1 117.3 4.9 203.8 – 203.8 8.8Corporates – UK 48.4 3.5 51.9 2.2 10.0 – 10.0 0.4Corporates – Rest of World 166.3 1.9 168.2 7.0 215.5 – 215.5 9.3
PropertyUK 4.5 – 4.5 0.2 6.2 1.4 7.6 0.3Rest of world 1.9 – 1.9 0.1 4.4 – 4.4 0.2
Alternative assetsLiability driven instruments 1,433.1 – 1,433.1 59.6 1,262.4 – 1,262.4 54.6Other (including derivatives) 109.6 3.5 113.1 4.7 113.1 2.4 115.5 5.0
Cash 105.8 – 105.8 4.4 101.4 – 101.4 4.4Total market value of assets 2,390.0 11.1 2,401.1 100.0 2,307.4 6.0 2,313.4 100.0
The assets of the defined benefit schemes do not include any directly held shares issued by the Group or property occupied by the Group.
The Pension Trustees determine the investment strategy of the defined benefit pension schemes after taking advice from their investment advisor, Willis Towers Watson. 59.6% of the scheme assets are invested in Liability Driven Investment (“LDI”) portfolios managed by Schroder Investment Management Limited. These use government bonds and derivative instruments such as interest rate swaps, inflation swaps and gilt repurchase transactions to hedge the impact of interest rate and inflation movements on the long-term liabilities of the schemes.
Under the LDI strategies, if interest rates fall the value of investments rises to help match the increase in actuarial liabilities arising from the resulting fall in discount rate. Similarly, if interest rates rise, the value of the LDI investments will fall, as will the liabilities, as a result of the increase in the discount rate. Interest rates and inflation risks are not fully matched by the LDI portfolios, representing the residual interest rate and inflation risk to which the schemes remain exposed.
The credit risk arising on the derivatives held in the LDI mandate depends on whether the derivative is traded on an exchange or over the counter (“OTC”). OTC derivative contracts are not guaranteed by any regulated exchange and therefore the schemes are subject to risk of failure of the counterparty. The credit risk for OTC swaps held in the LDI portfolio is reduced by collateral arrangements and the counterparty exposure of each scheme is appropriately diversified.
IAS 19 AssumptionsThe approach used to set the IAS 19 assumptions is detailed below:
Approach to set the assumptions
Discount rate As per IAS 19, the discount rate is determined using the market yields on high quality corporate bonds as at the reporting date with the currency and term of these bonds being consistent with the currency and term of the pension liabilities. The TWPS and TWMIPS discount rate is calculated by applying the projected cash flows of these schemes to an AA-corporate bond yield curve as at 31 March 2020.
RPI inflation The RPI inflation assumption uses the inflation curve weighted by projected future cash flows of TWPS and TWMIPS with an adjustment made for an inflation risk premium.
CPI inflation This CPI inflation assumption is taken at a margin below RPI factoring in market forces and third party estimates of the difference expected.
Salary increases Both defined benefit schemes provide benefits on a Career Average (“CARE”) benefit structure whereby past entitlements are linked to movements in CPI therefore an assumption for increase in salary is not required.
Pension increases
It is assumed that benefits will increase in line with the RPI and CPI inflation assumptions detailed above, based on the appropriate index for increasing benefits.
Longevity The mortality assumptions are based on standard mortality tables and the recent actual mortality experience of members within the schemes. The assumptions also allow for future improvements to mortality rates.
Thames Water Combined Report 2019/20 180Strategic report Governance Financial statements Annual performance report

Notes to the consolidated financial statements continued
22. Retirement benefit obligations continuedThe main assumptions used in the valuation of these schemes are as follows:
As at 31 March2020 2019
TWPS TWMIPS TWPS TWMIPS
Price inflation – RPI 2.55% 2.65% 3.25% 3.30%Price inflation – CPI 1.75% 1.85% 2.25% 2.30%Rate of increase to pensions in payment – RPI 2.55% 2.65% 3.25% 3.30%Rate of increase to pensions in payment – CPI 1.75% 1.85% 2.25% 2.30%Discount rate 2.35% 2.35% 2.40% 2.35%
As at 31 March
2020 2019
TWPSYears
TWMIPSYears
TWPSYears
TWMIPSYears
Life expectancy from age 60:Male 27.6 26.8 26.9 26.0Female 29.7 28.9 28.9 28.5Life expectancy from age 60 currently age 40:Male 28.3 27.9 28.4 27.6Female 30.8 30.1 30.5 30.1
Actuarial risk factorsThe schemes are exposed to actuarial risks including investment risk, inflation risk and longevity risk.
Definition of risk
Investment risk Assumptions are made about the returns expected from the schemes’ investments. If the investments underperform these assumptions in the long-term then additional contributions will need to be made to the schemes in order to fund the payment of future benefits.
Discount rate risk A fall in AA-rated corporate bond yields, which are used to set the discount rate, will increase the value of the scheme’s liabilities. This may be partially offset by an increase in the value of the scheme’s bond holdings.
Inflation risk The benefits payable to the members of the schemes are linked to inflation and as such higher inflation will lead to higher liabilities. Additionally, the Company’s contributions to the schemes are based on assumptions about the future levels of inflation, therefore an increase in inflation above that assumed in the actuarial calculations will create a deficit.
Longevity risk An increase in the life expectancy of scheme members will result in benefits being paid out for longer, leading to an increase in the defined benefit schemes’ liabilities.
The sensitivity of the present value of scheme liabilities to changes in the principal assumptions used is set out below:
As at 31 March
2020 2019
TWPSYears
TWMIPSYears
TWPSYears
TWMIPSYears
Change in assumptions resulting in a decrease in liabilitiesChange in discount rate (+1% p.a.) 320.0 90.0 325.0 90.0Change in rate of inflation (-1% p.a.) 210.0 70.0 210.0 75.0Change in life expectancy (-1 year) 70.0 40.0 75.0 30.0
Future expected cash flowsThe Group made a pension deficit repair payment of £28.3 million on 1 April 2020 in relation to 2020/21 having made a similar payment of £22.7 million on 1 April 2019 in relation to 2019/20. The average duration of the benefit obligation at the end of the year is 19 years for TWPS and 12 years for TWMIPS (2019: 20 years for TWPS and 13 years for TWMIPS).
In December 2019, the funding valuation as at 31 March 2019 was finalised and agreed with the scheme Trustees and actuaries. In order to address the combined funding deficit the Group is scheduled to make future deficit repair payments in line with the table below:
Year to 31 March 2020 2021 2022 2023 2024 2025 2026 2027
Deficit contribution (£m) 24.1 24.1 24.7 10.7 10.2 17.9 17.9 17.9
The expected cash flows payable from the schemes are presented in the graph below:
Expected benefit payments (£m)
2020
2023
2026
2029
2032
2038
2035
2041
2044
2047
2050
2053
2056
2059
2062
2065
2068
2071
2074
2077
2080
2083
2086
2089
2092
2095
2098
2101
2104
2107
2110
2113
TWMIPS TWPS
0
20
40
60
80
100
£000
Year
The expected cash flows are undiscounted liability cash flows based on the funding valuation as at 31 March 2019. The future cash flows are sensitive to the assumptions used and therefore actual cash flows may differ from those expected.
Thames Water Combined Report 2019/20 181Strategic report Governance Financial statements Annual performance report

Notes to the consolidated financial statements continued
23. Capital commitments
As at 31 March2020
£m2019
£m
Property, plant and equipment 281.7 395.7Intangible assets 7.5 17.2Total contracted for but not provided 289.2 412.9
In addition to these commitments, the Group has long-term capital investment plans, under its business plan submitted to Ofwat, to provide for future growth and maintenance of the infrastructure network.
24. Contingent liabilitiesAs at 31 March 2020, there was an ongoing legal claim in respect of a non-appointed activity. At the time of reporting, the Group is unaware of the amount of claim against them, nor has certainty over the number of claimants and is yet to prepare their defence. As such no further information can be provided. At present the Directors consider an outflow of economic benefit is possible, however, cannot be reliably estimated. The outcome is contingent on future developments and will only become known on conclusion of this claim. The outcome could result in an economic outflow.
As at 31 March 2020, there were ongoing commercial negotiations arising in the ordinary course of business in respect of closing out AMP6 contracts. At present the Directors consider an outflow of economic benefit is possible, however, cannot be reliably estimated. The outcome is contingent on future discussions and will only become known on conclusion of the negotiation. The outcome could result in either an economic outflow, inflow or neither. In respect of these negotiations, The Group has also taken the option under paragraph 92 of IAS 37 for non-disclosure of certain information relating to provisions and contingent liabilities in extremely rare cases where this can be expected to seriously prejudice the entity in a dispute.
Financial guaranteesThe Group is part of a Whole Business Securitisation (“WBS”) group as described in note 18. Companies in the WBS group raise debt in external debt markets through the issuance of secured bonds and the issue of loans. All companies in the WBS group guarantee the principal and interest payments due under the terms of the bonds. Where the Group enters into financial guarantee contracts to guarantee the indebtedness of other companies within this group, the Group considers these to be insurance arrangements and accounts for them as such. In this respect, the Group treats the guarantee contract as a contingent liability until such a time as it becomes probable that the Group will be required to make a payment under the guarantee.
25. Off-balance sheet arrangementsThe Group is party to a number of contractual arrangements for the purposes of its principal activities that are not required to be included within the statement of financial position. These are:
• operating leases not in the scope of IFRS 16;
• outsourcing contracts; and
• guarantees.
In respect of outsourcing contracts, the Group has entered into various arrangements to outsource the provision of certain back-office and operational functions with third party providers. These outsourced arrangements include aspects of customer services, legal services, metering and capital delivery. These arrangements are on commercial terms and no associated penalty or termination clauses will have a material effect on the financial position of the Company.
The Group is part of a whole business securitisation group. Thames Water Utilities Holdings Limited, Thames Water Utilities Limited and its direct subsidiary, Thames Water Utilities Finance plc are Obligators under the whole business securitisation entered into in 2007. The Obligators have all entered into a Security Trust and Inter-creditor Deed. Under this document each Obligator will guarantee the obligations of each other Obligator with their future cash flows. The guaranteed debt as at 31 March 2020 was £13.1 billion (2019: £11.9 billion).
26. Post balance sheet eventsAs at the time of reporting, the developing and uncertain situation in respect of the COVID-19 pandemic continues to be closely monitored. The impact of COVID-19 on the Group’s ability to provide essential water and wastewater services and improve operational performance has been mitigated through Government’s recognition that these services are essential. The Group responded quickly to enable effective working practices in the challenging operational environment.
Management has assessed the likely impact of COVID-19 to the financial position of the Group, with particular focus on operating cashflows and the AMP7 capital programme, and currently predicts a short-term reduction in cash receipts and a deferral of a reasonable portion of the capital programme into future AMP7 years. To mitigate the impact of potential lower cash collections, Management are closely reviewing the operating cashflow, assessing and implementing changes to the collections process and the cost base in a considered manner to ensure optimal financial and operational performance. There remains a risk that the impact of COVID-19 is greater than that modelled by the Group.
FinancingIn April 2020, £350.0 million Class A sterling bonds were issued by Thames Water Utilities Finance Plc, with a maturity of 2040. In May 2020, £40.0 million Class A sterling bonds were issued by Thames Water Utilities Finance Plc, with a maturity of 2050. The proceeds from both bonds were used to repay drawdowns from the Class A revolving credit facility. In May 2020, Thames Water Utilities Finance Plc signed a new £110 million Class A term loan facility maturing in November 2023.
Thames Water Combined Report 2019/20 182Strategic report Governance Financial statements Annual performance report

Notes to the consolidated financial statements continued
27. Statement of cash flowsReconciliation of operating profit to operating cash flows
Year ended 31 March
2020Restated1
2019
Underlying £m
BTL £m
Total £m
Underlying £m
BTL £m
Total £m
Profit for the financial year 186.6 58.0 244.6 58.9 44.4 103.3Less finance income (90.1) – (90.1) (42.1) – (42.1)Add finance expense 420.9 – 420.9 406.8 – 406.8Add interest expense on lease liabilities 3.7 – 3.7 3.9 – 3.9Less net gains/losses on financial instruments (190.8) – (190.8) 37.7 – 37.7Add taxation on profit on ordinary activities 183.1 6.1 189.2 8.9 2.8 11.7Operating profit 513.4 64.1 577.5 474.1 47.2 521.3Depreciation on property, plant and equipment
547.6 – 547.6 523.5 – 523.5
Amortisation of intangible assets 32.8 – 32.8 22.0 – 22.0Depreciation of right of use asset 8.2 – 8.2 7.6 – 7.6Loss on sale of property, plant and equipment 4.1 – 4.1 7.0 – 7.0Write-off of property, plant and equipment and intangible assets
9.9 – 9.9 – – –
Difference between pension charge and cash contribution
(16.2) – (16.2) 12.8 – 12.8
(Increase)/decrease in inventory (0.1) – (0.1) 4.6 – 4.6(Increase)/decrease in trade and other receivables
(48.2) (60.2) (108.4) 15.4 (48.3) (32.9)
Increase in contract assets (17.9) (0.6) (18.5) (30.8) (0.9) (31.7)(Decrease)/increase in trade and other payables
(8.3) (0.8) (9.1) 72.7 7.6 80.3
(Decrease)/increase in contract liabilities 84.5 (3.1) 81.4 33.6 (0.6) 33.0Group relief paid (3.8) (4.4) (8.2) (5.2) – (5.2)Increase/(decrease) in provisions 25.1 – 25.1 (23.7) – (23.7)Net cash generated by operating activities 1,131.1 (5.0) 1,126.1 1,113.6 5.0 1,118.61 The prior year results have been restated due to the impact of the transition to the new accounting standard IFRS 16 ‘Leases’ as
discussed on pages 150-152 as well as other restatements relating to the recording of a provision for property dilapidations and the capitalisation of leakage detection costs, which are discussed on pages 152.
Movement in cash and cash equivalents
Year ended 31 March2020
£m2019
£m
Unrestricted cash movement (1.8) 1.6Movement in short-term deposits 598.2 53.4Total 596.4 55.0
28. Related party transactionsDetails of transactions with associated companies as required by Ofwat’s regulatory accounting guidelines can be also found under the ‘supply of trade’ disclosure in the Annual Performance Report section on pages 248-250.
Trading transactions
Year ended 31 March
2020 2019
Services provided by
the Group £’000
Services provided to
the Group £’000
Services provided by
the Group £’000
Services provided to
the Group £’000
Intermediaries between the immediate and ultimate parentThames Water Limited 2,385 156 2,011 34Immediate parentThames Water Utilities Holdings Limited 22,019 62,300 24,117 63,800Other entities within the Kemble Water Holdings groupKennet Properties Limited 32 – 278 84Thames Water Investments Limited – – 113 –Thames Water Commercial Services Limited 71 7 258 –Thames Water Property Services Limited 295 210 255 360Entities external to the Kemble Water Holdings groupDunelm Energy Limited – 31 – 14Total 24,802 62,704 27,025 64,292
The related party transactions were made on terms equivalent to those that prevail in arm’s length transactions.
Thames Water Combined Report 2019/20 183Strategic report Governance Financial statements Annual performance report

Notes to the consolidated financial statements continued
28. Related party transactions continuedOutstanding balancesThe following amounts were owed to the Group from related entities, and owed to related entities by the Group at the balance sheet date:
As at 31 March
2020 2019
Amounts owed to the
Group £’000)
Amountsowed by the
Group £’000
Amounts owed to the
Group £’000
Amounts owed by the
Group £’000
Ultimate parentKemble Water Holdings Limited 5 – 5 –Intermediaries between the immediate and ultimate parentKemble Water Finance Limited 1,014 – 1,014 –Thames Water Limited 12 – 12 –Immediate parentThames Water Utilities Holdings Limited 1,752,234 – 2,002,034 8,188Total 1,753,265 – 2,003,065 8,188
The amounts outstanding are unsecured and will be settled in cash. No guarantees have been given or received. No provisions have been made for doubtful debts in respect of the amounts owed by related parties.
Key management personnel Key management personnel comprise the members of the Board and of the Executive Team during the year.
The remuneration of the Directors is included within the amounts disclosed below. Further information about the remuneration of individual Directors is provided in the audited part of the Remuneration Committee Report on pages 108-127.
Year ended 31 March2020
£’0002019
£’000
Fees 1,236 936Salary 2,756 2,528Pension and pension allowance 471 448Bonus 4,435 2,056Long-term incentive plan – –Payment on loss of office 2,462 282Other benefits 119 169Total 11,479 6,419
Information regarding transactions with post-employment benefits plans is included in note 22.
An additional £2 million was paid in respect of loss of office. This additional £2 million cost will not be passed onto customers, but funded through earnings generated from the non-appointed business. In order to preserve the Company’s gearing ratio, £2 million cash was received from Thames Water Limited, via the Company’s immediate parent company, Thames Water Utilities Holdings Limited.
29. Intermediate and ultimate parent Company and controlling party Thames Water Utilities Holdings Limited, a company incorporated in the United Kingdom, is the immediate parent company. Kemble Water Finance Limited, a company incorporated in the United Kingdom, is an intermediate parent company and is the smallest group to consolidate these financial statements. The Directors consider that Kemble Water Holdings Limited, a company incorporated in the United Kingdom, is the ultimate and controlling party and the largest group to consolidate these financial statements.
Kemble Water Holdings Limited is owned by 10 shareholders, of which the largest is Ontario Municipal Employees Retirement System (OMERS) with 31.777% holding.
The address of the registered office of Thames Water Utilities Holdings Limited, Kemble Water Finance Limited and Kemble Water Holdings Limited is Clearwater Court, Vastern Road, Reading, Berkshire, RG1 8DB. Copies of the financial statements for all entities may be obtained from The Group Secretary’s Office at this address.
30. Restatements to the prior yearThis is the first reporting year that the Group has presented its financial statements under IFRS 16 ‘Leases’, with the date of transition being 1 April 2019. These accounting policies replace IAS 17 ‘Leases. The Group’s accounting policies under IFRS 16 have been applied retrospectively at the date of transition and therefore the Group’s “as previously stated” results have been restated. In addition, the Group has also restated the prior years as a result of provision for dilapidation and broadening of accounting policy regarding capitalisation of leakage detection costs. Refer to pages 150-152 for more information on adjustments that have impacted prior years.
Thames Water Combined Report 2019/20 184Strategic report Governance Financial statements Annual performance report
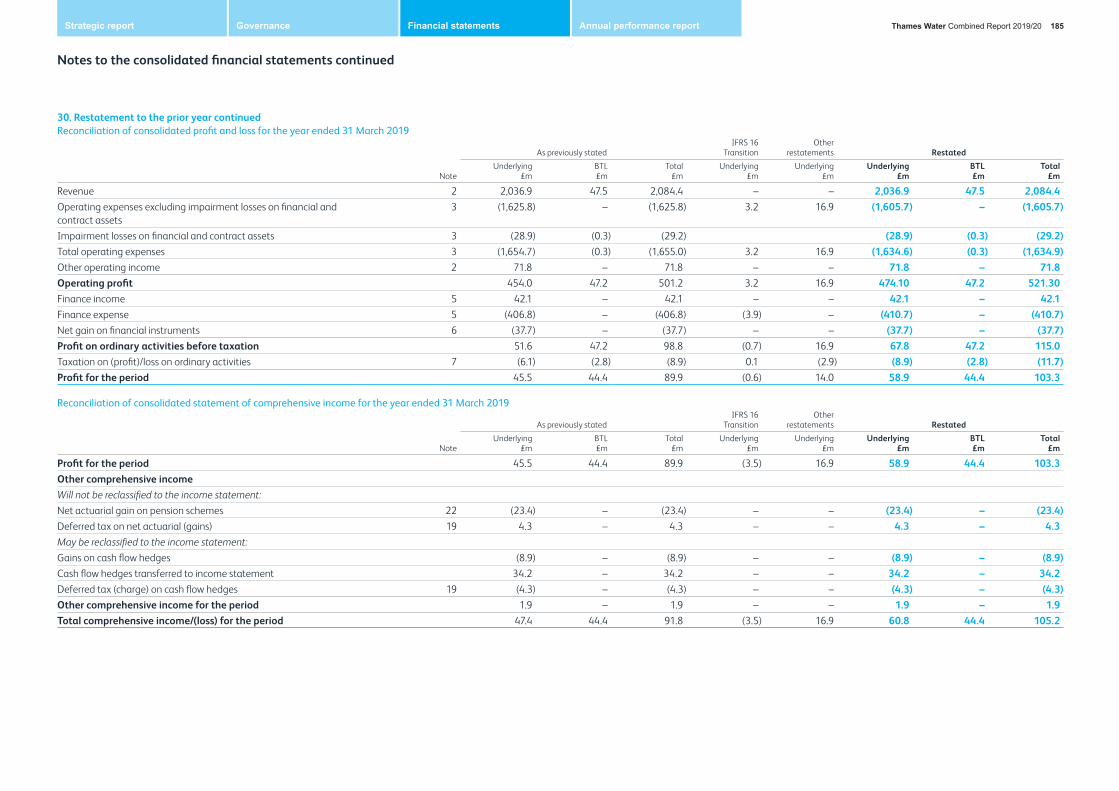
Notes to the consolidated financial statements continued
30. Restatement to the prior year continuedReconciliation of consolidated profit and loss for the year ended 31 March 2019
Note
As previously statedIFRS 16
Transition Other
restatements RestatedUnderlying
£mBTL £m
Total £m
Underlying £m
Underlying £m
Underlying £m
BTL £m
Total £m
Revenue 2 2,036.9 47.5 2,084.4 – – 2,036.9 47.5 2,084.4Operating expenses excluding impairment losses on financial and contract assets
3 (1,625.8) – (1,625.8) 3.2 16.9 (1,605.7) – (1,605.7)
Impairment losses on financial and contract assets 3 (28.9) (0.3) (29.2) (28.9) (0.3) (29.2)Total operating expenses 3 (1,654.7) (0.3) (1,655.0) 3.2 16.9 (1,634.6) (0.3) (1,634.9)Other operating income 2 71.8 – 71.8 – – 71.8 – 71.8Operating profit 454.0 47.2 501.2 3.2 16.9 474.10 47.2 521.30 Finance income 5 42.1 – 42.1 – – 42.1 – 42.1Finance expense 5 (406.8) – (406.8) (3.9) – (410.7) – (410.7)Net gain on financial instruments 6 (37.7) – (37.7) – – (37.7) – (37.7)Profit on ordinary activities before taxation 51.6 47.2 98.8 (0.7) 16.9 67.8 47.2 115.0Taxation on (profit)/loss on ordinary activities 7 (6.1) (2.8) (8.9) 0.1 (2.9) (8.9) (2.8) (11.7)Profit for the period 45.5 44.4 89.9 (0.6) 14.0 58.9 44.4 103.3
Reconciliation of consolidated statement of comprehensive income for the year ended 31 March 2019
Note
As previously statedIFRS 16
Transition Other
restatements RestatedUnderlying
£mBTL £m
Total £m
Underlying £m
Underlying £m
Underlying £m
BTL £m
Total £m
Profit for the period 45.5 44.4 89.9 (3.5) 16.9 58.9 44.4 103.3Other comprehensive incomeWill not be reclassified to the income statement:Net actuarial gain on pension schemes 22 (23.4) – (23.4) – – (23.4) – (23.4)Deferred tax on net actuarial (gains) 19 4.3 – 4.3 – – 4.3 – 4.3May be reclassified to the income statement:Gains on cash flow hedges (8.9) – (8.9) – – (8.9) – (8.9)Cash flow hedges transferred to income statement 34.2 – 34.2 – – 34.2 – 34.2Deferred tax (charge) on cash flow hedges 19 (4.3) – (4.3) – – (4.3) – (4.3)Other comprehensive income for the period 1.9 – 1.9 – – 1.9 – 1.9Total comprehensive income/(loss) for the period 47.4 44.4 91.8 (3.5) 16.9 60.8 44.4 105.2
Thames Water Combined Report 2019/20 185Strategic report Governance Financial statements Annual performance report

Notes to the consolidated financial statements continued
30. Restatement to the prior year continuedReconciliation of consolidated statement of financial position as at 1 April 2018
Note
Previously statedIFRS 16
Transition Other
restatements RestatedUnderlying
£mBTL £m
Total £m
Underlying £m
Underlying £m
Underlying £m
BTL £m
Total £m
Non-current assetsIntangible assets 9 168.8 – 168.8 – – 168.8 – 168.8Property, plant and equipment 10 14,675.3 – 14,675.3 – 11.9 14,687.2 – 14,687.2Right-of-use assets 11 – – – 54.9 2.9 57.8 – 57.8Derivative financial assets 18 76.4 – 76.4 – – 76.4 – 76.4Intercompany loans receivable 12 1,974.7 – 1,974.7 – – 1,974.7 – 1,974.7Trade and other receivables 14 39.4 56.7 96.1 – – 39.4 56.7 96.1Pension asset 22 50.6 – 50.6 – – 50.6 – 50.6
16,985.2 56.7 17,041.9 54.9 14.8 17,054.9 56.7 17,111.6Current assets Inventories and current intangible assets 13 18.1 – 18.1 – – 18.1 – 18.1Intercompany loans receivable 12 3.2 – 3.2 – – 3.2 – 3.2Contract assets 14 185.8 0.4 186.2 – – 185.8 0.4 186.2Derivative financial assets 18 8.5 – 8.5 – – 8.5 – 8.5Trade and other receivables 14 354.4 5.0 359.4 (1.8) – 352.6 5.0 357.6Cash and cash equivalents 15 104.4 2.6 107.0 – – 104.4 2.6 107.0
674.4 8.0 682.4 (1.8) – 672.6 8.0 680.6Current liabilities Contract liabilities 16 (125.3) (4.1) (129.4) – – (125.3) (4.1) (129.4)Trade and other payables 16 (613.1) (5.1) (618.2) 8.0 – (605.1) (5.1) (610.2)Borrowings 17 (266.3) – (266.3) – – (266.3) – (266.3)Lease liabilities 11 – – – (2.8) – (2.8) – (2.8)Derivative financial liabilities 18 (12.3) – (12.3) – – (12.3) – (12.3)
(1,017.0) (9.2) (1,026.2) 5.2 – (1,011.8) (9.2) (1,021.0)Net current (liabilities)/assets (342.6) (1.2) (343.8) 3.4 – (339.2) (1.2) (340.4)
Non-current liabilities Contract liabilities 16 (589.9) – (589.9) – – (589.9) – (589.9)Borrowings 17 (10,848.7) – (10,848.7) – – (10,848.7) – (10,848.7)Lease liabilities 11 – – – (72.5) – (72.5) – (72.5)Derivative financial liabilities 18 (1,225.9) – (1,225.9) – – (1,225.9) – (1,225.9)Deferred tax 19 (844.4) – (844.4) 2.4 (0.8) (842.8) – (842.8)Provisions for liabilities and charges 20 (133.1) – (133.1) – (9.8) (142.9) – (142.9)Pension deficit 22 (300.8) – (300.8) – – (300.8) – (300.8)
(13,942.8) – (13,942.8) (70.1) (10.6) (14,023.5) – (14,023.5)Net assets 2,699.8 55.5 2,755.3 (11.8) 4.2 2,692.2 55.5 2,747.7
Thames Water Combined Report 2019/20 186Strategic report Governance Financial statements Annual performance report

Notes to the consolidated financial statements continued
30. Restatement to the prior year continuedReconciliation of consolidated statement of financial position as at 1 April 2018
Note
Previously statedIFRS 16
Transition Other
restatements RestatedUnderlying
£mBTL £m
Total £m
Underlying £m
Underlying £m
Underlying £m
BTL £m
Total £m
Equity Called up share capital 29.0 – 29.0 – – 29.0 – 29.0Share premium 100.0 – 100.0 – – 100.0 – 100.0Cash flow hedge reserve (138.9) – (138.9) – – (138.9) – (138.9)Revaluation reserve 1,021.2 – 1,021.2 – – 1,021.2 – 1,021.2Retained earnings 1,688.5 55.5 1,744.0 (11.8) 4.2 1,680.9 55.5 1,736.4Total equity 2,699.8 55.5 2,755.3 (11.8) 4.2 2,692.2 55.5 2,747.7
Reconciliation of consolidated statement of financial position as at 31 March 2019
Note
Previously statedIFRS 16
Transition Other
restatements RestatedUnderlying
£mBTL £m
Total £m
Underlying £m
Underlying £m
Underlying £m
BTL £m
Total £m
Non-current assetsIntangible assets 9 217.8 – 217.8 – – 217.8 – 217.8Property, plant and equipment 10 15,259.9 – 15,259.9 – 29.5 15,289.4 – 15,289.4Right-of-use assets 11 – – – 51.6 2.6 54.2 – 54.2Derivative financial assets 18 162.3 – 162.3 – – 162.3 – 162.3Intercompany loans receivable 12 1,974.7 – 1,974.7 – – 1,974.7 – 1,974.7Trade and other receivables 14 39.3 101.9 141.2 – – 39.3 101.9 141.2Pension asset 22 45.8 – 45.8 – – 45.8 – 45.8
17,699.8 101.9 17,801.7 51.6 32.1 17,783.5 101.9 17,885.4Current assets Inventories and current intangible assets 13 13.5 – 13.5 – – 13.5 – 13.5Intercompany loans receivable 12 27.3 – 27.3 – – 27.3 – 27.3Contract assets 14 217.0 0.9 217.9 – – 217.0 0.9 217.9Trade and other receivables 14 341.7 8.5 350.2 (1.7) – 340.0 8.5 348.5Cash and cash equivalents 15 154.4 7.6 162.0 – – 154.4 7.6 162.0
753.9 17.0 770.9 (1.7) – 752.2 17.0 769.2Current liabilities Contract liabilities 16 (110.6) (3.4) (114.0) – – (110.6) (3.4) (114.0)Trade and other payables 16 (678.9) (15.5) (694.4) 7.7 – (671.2) (15.5) (686.7)Borrowings 17 (1,124.1) – (1,124.1) – – (1,124.1) – (1,124.1)Lease liabilities 11 – – – (7.4) – (7.4) – (7.4)Derivative financial liabilities 18 (38.6) – (38.6) – – (38.6) – (38.6)
Thames Water Combined Report 2019/20 187Strategic report Governance Financial statements Annual performance report

Notes to the consolidated financial statements continued
Reconciliation of consolidated statement of financial position as at 31 March 2019
Note
Previously statedIFRS 16
Transition Other
restatements RestatedUnderlying
£mBTL £m
Total £m
Underlying £m
Underlying £m
Underlying £m
BTL £m
Total £m
(1,952.2) (18.9) (1,971.1) 0.3 – (1,951.9) (18.9) (1,970.8)Net current (liabilities)/assets (1,198.3) (1.9) (1,200.2) (1.4) – (1,199.7) (1.9) (1,201.6)Non-current liabilities Contract liabilities 16 (636.1) – (636.1) – – (636.1) – (636.1)Borrowings 17 (10,657.7) – (10,657.7) – – (10,657.7) – (10,657.7)Lease liabilities 11 – – – (65.1) – (65.1) – (65.1)Derivative financial liabilities 18 (1,223.8) – (1,223.8) – – (1,223.8) – (1,223.8)Deferred tax 19 (849.0) – (849.0) 2.5 (3.7) (850.2) – (850.2)Provisions for liabilities and charges 20 (109.0) – (109.0) – (10.2) (119.2) – (119.2)Pension deficit 22 (338.8) – (338.8) – – (338.8) – (338.8)
(13,814.4) – (13,814.4) (62.6) (13.9) (13,890.9) – (13,890.9)
Net assets 2,687.1 100.0 2,787.1 (12.4) 18.2 2,692.9 100.0 2,792.9Equity Called up share capital 29.0 – 29.0 – – 29.0 – 29.0Share premium 100.0 – 100.0 – – 100.0 – 100.0Cash flow hedge reserve (117.9) – (117.9) – – (117.9) – (117.9)Revaluation reserve 989.3 – 989.3 – – 989.3 – 989.3Retained earnings 1,686.7 100.0 1,786.7 (12.4) 18.2 1,692.5 100.0 1,792.5Total equity 2,687.1 100.0 2,787.1 (12.4) 18.2 2,692.9 100.0 2,792.9
Reconciliation of consolidated statement of cash flows as at 31 March 2019
Previously statedIFRS 16
Transition Other
restatements RestatedUnderlying
£mBTL £m
Total £m
Underlying £m
Underlying £m
Underlying £m
BTL £m
Total £m
Operating activities:Profit/(loss) on ordinary activities before taxation 45.5 44.4 89.9 (0.6) 14.0 58.9 44.4 103.3Less finance income (42.1) – (42.1) – – (42.1) – (42.1)Add finance expense 406.8 – 406.8 – – 406.8 – 406.8Add interest expense on lease liabilities – – – 3.9 – 3.9 – 3.9Add loss on fair value of financial instruments 37.7 – 37.7 – – 37.7 – 37.7
30. Restatement to the prior year continued
Thames Water Combined Report 2019/20 188Strategic report Governance Financial statements Annual performance report

Notes to the consolidated financial statements continued
Reconciliation of consolidated statement of cash flows as at 31 March 2019
Previously statedIFRS 16
Transition Other
restatements RestatedUnderlying
£mBTL £m
Total £m
Underlying £m
Underlying £m
Underlying £m
BTL £m
Total £m
Add/(less) taxation on profit/(loss) on ordinary activities 6.1 2.8 8.9 (0.1) 2.9 8.9 2.8 11.7Operating profit 454.0 47.2 501.2 3.2 16.9 474.1 47.2 521.3Depreciation on property, plant and equipment 523.3 – 523.3 – 0.2 523.5 – 523.5Amortisation of intangible assets 22.0 – 22.0 – – 22.0 – 22.0Depreciation of right of use asset – – – 7.3 0.3 7.6 – 7.6Profit on sale of property, plant and equipment 7.0 – 7.0 – – 7.0 – 7.0Difference in pension charge and cash contribution 12.8 – 12.8 – – 12.8 – 12.8Decrease in inventory 4.6 – 4.6 – – 4.6 – 4.6Decrease in contract assets (30.8) (0.9) (31.7) – – (30.8) (0.9) (31.7)Decrease/(Increase) in trade and other receivables 15.5 (48.3) (32.8) (0.1) – 15.4 (48.3) (32.9)Increase in contract liabilities 33.6 (0.6) 33.0 – – 33.6 (0.6) 33.0Increase/(decrease) in trade and other payables 73.0 7.6 80.6 (0.3) – 72.7 7.6 80.3Decrease in group relief payable (5.2) – (5.2) – – (5.2) – (5.2)Decrease in provisions (24.1) – (24.1) – 0.4 (23.7) – (23.7)Net cash generated by operating activities 1,085.7 5.0 1,090.7 10.1 17.8 1,113.6 5.0 1,118.6
Investing activities:Increase in current asset investments – – – – – – – –Purchase of property, plant and equipment (1,117.8) – (1,117.8) – (17.8) (1,135.6) – (1,135.6)Purchase of intangible assets (71.2) – (71.2) – – (71.2) – (71.2)Proceeds from sale of property, plant and equipment 2.6 – 2.6 – – 2.6 – 2.6Interest received 10.1 – 10.1 – – 10.1 – 10.1Net cash used in investing activities (1,176.3) – (1,176.3) – (17.8) (1,194.1) – (1,194.1)
Financing activities: New loans raised 1,148.8 – 1,148.8 – – 1,148.8 – 1,148.8Repayment of borrowings (669.5) – (669.5) – – (669.5) – (669.5)Repayment of lease principal – – – (10.1) – (10.1) – (10.1)Derivative paydown 2.8 – 2.8 – – 2.8 – 2.8Interest paid (273.8) – (273.8) – – (273.8) – (273.8)Fees paid (7.7) – (7.7) – – (7.7) – (7.7)Dividends paid (60.0) – (60.0) – – (60.0) – (60.0)Net cash generated by/(used in) financing activities 140.6 – 140.6 (10.1) – 130.5 – 130.5
Net decrease in cash and cash equivalents 50.0 5.0 55.0 – – 50.0 5.0 55.0Net cash and cash equivalents at beginning of period 104.4 2.6 107.0 – – 104.4 2.6 107.0Net cash and cash equivalents at end of period 154.4 7.6 162.0 – – 154.4 7.6 162.0
30. Restatement to the prior year continued
Thames Water Combined Report 2019/20 189Strategic report Governance Financial statements Annual performance report

Company statement of other comprehensive incomeFor the year ended 31 March
Note
2020Restated1
2019
Underlying £m
BTL £m
Total £m
Underlying £m
BTL £m
Total £m
Profit for the year 88.8 58.0 146.8 172.4 44.4 216.8
Other comprehensive incomeWill not be reclassified to the income statement:Net actuarial gains/(losses) on pension schemes 22 168.4 – 168.4 (23.4) – (23.4)Deferred tax (charge)/credit on net actuarial gain/loss including impact of deferred tax rate change on pension schemes
38 (29.7) – (29.7) 4.3 – 4.3
May be reclassified to the income statement:Losses on cash flow hedges (4.1) – (4.1) (8.9) – (8.9)Cash flow hedge transferred to income statement 34.9 – 34.9 34.2 – 34.2Deferred tax charge on cash flow hedge gains including impact of deferred tax rate change (3.0) – (3.0) (4.3) (4.3)Other comprehensive income for the year 166.5 – 166.5 1.9 – 1.9Total comprehensive income for the year 255.3 58.0 313.3 174.3 44.4 218.7
The accounting policies on pages 143-156 and notes on pages 195-214 are an integral part of these financial statements.
Bazalgette Tunnel Limited (“BTL”) is an independent company which was appointed in 2015 to construct the Thames Tideway Tunnel. We have recognised revenue, cost and profit on the arrangement with BTL and have disclosed our underlying performance separately as required by some of our financial covenants.. Information on how the Group accounts for this arrangement is detailed in the accounting policies on pages 143-144.
1 The prior year results have been restated due to the impact of the transition to the new accounting standard IFRS 16 ‘Leases’ as discussed on pages 150-152 as well as other restatements relating to the recording of a provision for property dilapidations and the capitalisation of leakage detection costs, which are discussed on pages 152.
Thames Water Combined Report 2019/20 190Strategic report Governance Financial statements Annual performance report

Company statement of financial positionAs at
Note
31 March 2020Restated1
31 March 2019Restated1
1 April 2018
Underlying £m
BTL £m
Total £m
Underlying £m
BTL £m
Total £m
Underlying £m
BTL £m
Total £m
Non-current assetsIntangible assets 9 273.4 – 273.4 217.8 – 217.8 168.6 – 168.6Property, plant and equipment 10 15,862.8 – 15,862.8 15,289.4 – 15,289.4 14,687.2 – 14,687.2Investment in subsidiary undertakings 31 207.7 – 207.7 207.8 – 207.8 0.1 – 0.1Right of use asset 11 52.3 – 52.3 54.2 – 54.2 57.8 – 57.8Derivative financial assets 37 236.9 – 236.9 99.0 – 99.0 59.3 – 59.3Intercompany loans receivable 32 2,052.2 – 2,052.2 2,274.7 – 2,274.7 2,274.7 – 2,274.7Other receivables 33 72.4 159.0 231.4 41.0 101.9 142.9 40.0 56.7 96.7Pension asset 22 94.5 – 94.5 45.8 – 45.8 50.6 – 50.6
18,852.2 159.0 19,011.2 18,229.7 101.9 18,331.6 17,338.3 56.7 17,395.0Current assetsInventories and current intangible assets 13 13.6 – 13.6 13.5 – 13.5 18.1 – 18.1Intercompany loans receivable 32 38.0 – 38.0 47.6 – 47.6 17.9 – 17.9Contract assets 33 234.9 1.5 236.4 217.0 0.9 217.9 185.8 0.4 186.2Trade and other receivables 33 356.0 11.6 367.6 338.0 8.5 346.5 352.7 5.0 357.7Short-term investments 37 300.0 – 300.0 – – – – – –Cash and cash equivalents 34 753.2 2.6 755.8 152.0 7.6 159.6 104.4 2.6 107.0
1,695.7 15.7 1,711.4 768.1 17.0 785.1 678.90 8.0 686.90Current liabilitiesContract liabilities 35 (123.8) (0.3) (124.1) (110.6) (3.4) (114.0) (125.3) (4.1) (129.4)Trade and other payables 35 (666.1) (16.4) (682.5) (667.6) (15.5) (683.1) (597.8) (5.1) (602.9)Borrowings 36 (1,880.0) – (1,880.0) (1,222.6) – (1,222.6) (320.2) – (320.2)Lease Liability 11 (7.9) – (7.9) (7.4) – (7.4) (2.8) – (2.8)Derivative financial liabilities 37 – – – – – – (12.3) – (12.3)
(2,677.8) (16.7) (2,694.5) (2,008.2) (18.9) (2,027.1) (1,058.4) (9.2) (1,067.6)Net current liabilities (982.1) (1.0) (983.1) (1,240.1) (1.9) (1,242.0) (379.5) (1.2) (380.7)
Non-current liabilitiesContract liabilities 35 (707.3) – (707.3) (636.1) – (636.1) (589.9) – (589.9)Lease liabilities 11 (62.5) – (62.5) (65.1) – (65.1) (72.5) – (72.5)Borrowings 36 (11,626.6) – (11,626.6) (10,996.0) – (10,996.0) (11,149.2) – (11,149.2)Derivative financial liabilities 37 (702.6) – (702.6) (817.9) – (817.9) (809.1)) – (809.1)Deferred tax 38 (1,119.2) – (1,119.2) (916.8) – (916.8) (908.9) – (908.9)Provisions for liabilities and charges 20 (144.3) – (144.3) (119.2) – (119.2) (142.9) – (142.9)Pension deficit 22 (209.1) – (209.1) (338.8) – (338.8) (300.8) – (300.8)
(14,571.6) – (14,571.6) (13,889.9) – (13,889.9) (13,973.3) – (13,973.3)Net assets 3,298.5 158.0 3,456.5 3,099.7 100.0 3,199.7 2,985.5 55.5 3,041.0
Thames Water Combined Report 2019/20 191Strategic report Governance Financial statements Annual performance report

Company statement of financial position continued
Note
31 March 2020Restated1
31 March 2019Restated1
1 April 2018
Underlying £m
BTL £m
Total £m
Underlying £m
BTL £m
Total £m
Underlying £m
BTL £m
Total £m
EquityCalled up share capital 39 29.0 – 29.0 29.0 – 29.0 29.0 – 29.0Share premium 39 100.0 – 100.0 100.0 – 100.0 100.0 – 100.0Cash flow hedge reserve 39 (90.1) – (90.1) (117.9) – (117.9) (138.9) – (138.9)Revaluation reserve 39 934.3 – 934.3 989.3 – 989.3 1,021.2 – 1,021.2Retained earnings 39 2,325.3 158.0 2,483.3 2,099.3 100.0 2,199.3 1,974.2 55.5 2,029.7Total equity 3,298.5 158.0 3,456.5 3,099.7 100.0 3,199.7 2,985.5 55.5 3,041.0
1 The prior year results have been restated due to the impact of the transition to the new accounting standard IFRS 16 ‘Leases’ as discussed on pages 150-152 as well as other restatements relating to the recording of a provision for property dilapidations and the capitalisation of leakage detection costs, which are discussed on pages 152.
As permitted by section 408 of the Companies Act 2006, the Company has not presented its own income statement. The profit for the year is £146.8 million (restated 2019: £216.8 million).
Bazalgette Tunnel Limited (“BTL”) is an independent company, appointed in 2015 to construct the Thames Tideway Tunnel. Information on how the Group accounts for this arrangement is detailed in the accounting policies on pages 143-144. The accounting policies on pages 143-156 and notes on pages 195-214 are an integral part of these financial statement.
The company only financial statements for Thames Water Utilities Limited, registered in England & Wales company number 02366661, were approved by the Board of Directors on 29 June 2020 and signed on its behalf by:
Brandon RennetChief Financial Officer
Thames Water Combined Report 2019/20 192Strategic report Governance Financial statements Annual performance report

Company statement of changes in equityFor the year ended
Called up Share capital
£m
Share premium
£m
Cash flow hedge reserve
£m
Revaluation reserve
£m
Retained earnings
£m
Total equity
£m
1 April 2018 (as previously stated) 29.0 100.0 (138.9) 1,021.2 2,037.3 3,048.6IFRS 16 Restatement1 – – – – (14.2) (14.2)Other Restatements1 – – – – 5.0 5.0Deferred tax on IFRS 16 and other restatements – – – – 1.6 1.61 April 2018 (as restated) 29.0 100.0 (138.9) 1,021.2 2,029.7 3,041.0Profit for the period – – – – 216.8 216.8Loss on cash flow hedge – – (8.9) – – (8.9)Cash flow hedges transferred to income statement – – 34.2 – – 34.2Deferred tax charge on cash flow hedge gain – – (4.3) – – (4.3)Actuarial loss on pension scheme – – – – (23.4) (23.4)Deferred tax credit on actuarial loss – – – – 4.3 4.3Total comprehensive income – – 21.0 – 197.7 218.7Transfer of depreciation – – – (38.4) 38.4 –Deferred tax on depreciation transfer – – – 6.5 (6.5) –Dividends paid3 – – – – (60.0) (60.0)Restated 31 March 2019 29.0 100.0 (117.9) 989.3 2,199.3 3,199.71 April 2019 (as previously reported) 29.0 100.0 (117.9) 989.3 2,193.5 3,193.9IFRS 16 Restatement1 – – – – (12.3) (12.3)Other Restatements1 – – – – 15.3 15.3Deferred tax on IFRS 16 and other restatements – – – – 2.8 2.8At 1 April 2019 (as restated) 29.0 100.0 (117.9) 989.3 2,199.3 3,199.7Profit for the period – – – – 146.8 146.8Loss on cash flow hedge – – (4.1) – – (4.1)Cash flow hedge transfer to the income statement – – 34.9 – – 34.9Deferred tax charge on cash flow hedge including impact of deferred tax rate change on cash flow hedge – – (3.0) – – (3.0)Actuarial gain on pension scheme – – – – 168.4 168.4Deferred tax charge on net actuarial gain including impact of deferred tax rate change – – – – (29.7) (29.7)Total comprehensive income – – 27.8 – 285.5 313.3Transfer of depreciation2 – – – (38.4) 38.4 –Deferred tax on depreciation transfer2 – – – (16.6) 16.6 –Dividends paid3 – – – – (56.5) (56.5)31 March 2020 29.0 100.0 (90.1) 934.3 2,483.3 3,456.5
The accounting policies on pages 143-156 and notes on pages 195-214 are an integral part of these financial statements.
1 The prior year results have been restated due to the impact of the transition to the new accounting standard IFRS 16 ‘Leases’ as discussed on pages 150-152 as well as other restatements relating to the recording of a provision for property dilapidations and the capitalisation of leakage detection costs, which are discussed on pages 152.
2 The movement between the revaluation reserve and retained earnings arising from the depreciation and associated deferred tax (including the impact of the deferred tax rate change) on the fair value uplift on assets.3 Refer to Note 8 for information on dividends paid.
Thames Water Combined Report 2019/20 193Strategic report Governance Financial statements Annual performance report

Company statement of cash flowsFor the year ended 31 March
2020Restated1
2019
Underlying £m
BTL £m
Total £m
Underlying £m
BTL £m
Total £m
Net cash generated by operating activities2 1,141.1 (5.0) 1,136.1 1,120.1 5.0 1,125.1Investing activities:Increase in current asset investments (300.0) – (300.0) – – –Purchase of property, plant and equipment3 (1,137.9) – (1,137.9) (1,135.6) – (1,135.6)Purchase of intangible assets (86.1) – (86.1) (71.2) – (71.2)Proceeds from sale of property, plant and equipment – – – 2.6 – 2.6Interest received 72.1 – 72.1 2.6 – 2.6Investment in subsidiary – – – (7.5) – (7.5)Repayment of loans by parent company 222.5 – 222.5 – – –Net cash used in investing activities (1,229.4) – (1,229.4) (1,209.1) – (1,209.1)Financing activities:New loans raised 3,141.8 – 3,141.8 1,148.8 – 1,148.8Repayment of borrowings (2,014.6) – (2,014.6) (653.3) – (653.3)Repayment of lease principal (11.0) – (11.0) (10.1) – (10.1)Derivative paydown (76.0) – (76.0) (13.4) – (13.4)Interest paid3 (285.0) – (285.0) (272.7) – (272.7)Fees paid (9.2) – (9.2) (2.7) – (2.7)Dividends paid (56.5) – (56.5) (60.0) – (60.0)Net cash used in financing activities 689.5 – 689.5 136.6 – 136.6Net increase/(decrease) in cash and cash equivalents 601.2 (5.0) 596.2 47.6 5.0 52.6Net cash and cash equivalents at beginning of period 152.0 7.6 159.6 104.4 2.6 107.0Net cash and cash equivalents at end of period 753.2 2.6 755.8 152.0 7.6 159.6
Bazalgette Tunnel Limited (“BTL”) is an independent company, appointed in 2015 to construct the Thames Tideway Tunnel. Information on how the Company accounts for this arrangement is detailed in the accounting policies on pages 143-144.
The accounting policies on pages 143-156 and notes on pages 195-214 form an integral part of these financial statements.
1 The prior year results have been restated due to the impact of the transition to the new accounting standard IFRS 16 ‘Leases’ as discussed on pages 150-152 as well as other restatements relating to the recording of a provision for property dilapidations and the capitalisation of leakage detection costs, which are discussed on page 152.
2 Refer to Note 45 ‘Statement of Cash Flows’ on page 207 for a reconciliation of net cash generated by operating activities.3 Borrowing costs that have been capitalised are included within “Purchase of property, plant and equipment” under investing activities.
Thames Water Combined Report 2019/20 194Strategic report Governance Financial statements Annual performance report

Notes to the Company financial statements
31. Investment in subsidiary undertakingThe Company has no interest in joint ventures or associates. The Company had the following investment in asubsidiary undertaking as at 31 March 2020:
Entity HoldingPrincipal undertaking
Country of incorporation
Class of shares held
Proportion of voting rights
& shares held
Thames Water Utilities Finance plc Direct Finance Company United Kingdom £1 Ordinary 100%
Subsidiary undertaking is wholly owned by the Company.
The address of the registered office of Thames Water Utilities Finance plc is Clearwater Court, Vastern Road, Reading, Berkshire, RG1 8DB.
32. Intercompany loans receivable
As at 31 March
2020 2019
Book value £m
Fair value £m
Book value £m
Fair value £m
Amounts owed by group undertakings:Thames Water Utilities Holdings Limited 1,752.2 1,752.2 1,974.7 1,974.7Thames Water Utilities Finance plc 300.0 300.0 300.0 300.0Total principal owed 2,052.2 2,052.2 2,274.7 2,274.7Interest receivable on amounts owed by group undertakings:Thames Water Utilities Holdings Limited 11.8 11.8 27.3 27.3Thames Water Utilities Finance plc 26.2 26.2 20.3 20.3Total interest receivable 38.0 38.0 47.6 47.6Total 2,090.2 2,090.2 2,322.3 2,322.3Disclosed within non-current assets 2,052.2 2,052.2 2,274.7 2,274.7Disclosed within current assets 38.0 38.0 47.6 47.6
The above intercompany loans are unsecured. These balances have not been included within the Company’s net debt and covenant calculations.
There are no amounts past their due dates. If a receivable continues to have an investment grade rating, then IFRS 9 permits an assumption that there has been no significant increase in credit risk. As such given the investment grade credit rating, an assessment of the 12 month expected credit loss is permitted rather than a lifetime credit loss assessment as per ‘stage 1’ of the IFRS 9 impairment model. The Company has considered the recoverability of the intercompany receivables as part of the Kemble Group’s annual impairment assessment of all intercompany balances under IFRS 9, no impairment was identified. As such there is no concern over the recoverability of intercompany receivables, the Directors do not consider that there is any need to book an impairment provision and expect to materially recover the intercompany amount.
On 29 April 2019, the Kemble Water Holdings Group performed an exercise to reduce the intercompany loan that exists between the Company and its immediate holding company Thames Water Utilities Holdings Limited (“TWUHL”). The paydown has led to a reduction in the intercompany loan and interest receivable by £249.8 million with a corresponding increase in cash, of which £222.5 million is in respect of the principal loan receivable and £27.3 million in respect of interest loan receivable that was due. During 2020, the Company earned £22.0 million of
interest income related to the intercompany loan, of which £8.2 million was net settled against payments for group relief owed to its parent (TWUHL), and £2.0 million of interest was cash paid by TWUHL.
Interest on all of the above loans is charged at six month LIBOR plus 0.35% margin (2019: six month LIBOR plus 0.35% margin).
33. Trade and other receivables
As at 31 March
2020Restated1
2019
Underlying £m
BTL £m
Total £m
Underlying £m
BTL £m
Total £m
Non-current:Prepayments – 159.0 159.0 – 101.9 101.9Amounts owed by group undertakings 7.9 – 7.9 7.2 – 7.2Insurance claims receivable 64.5 – 64.5 33.8 – 33.8
72.4 159.0 231.4 41.0 101.9 142.9Current:Gross trade receivables 475.4 13.5 488.9 454.9 9.5 464.4Less doubtful debt provision (185.1) (2.7) (187.8) (174.4) (2.2) (176.6)Net trade receivables 290.3 10.8 301.1 280.5 7.3 287.8Prepayments 32.9 – 32.9 31.6 – 31.6Other receivables 32.8 0.8 33.6 25.9 1.2 27.1
356.0 11.6 367.6 338.0 8.5 346.5Current:Contract assets 234.9 1.5 236.4 217.0 0.9 217.9
590.9 13.1 604.0 555.0 9.4 564.4Total 663.3 172.1 835.4 596.0 111.3 707.31 The prior year results have been restated due to the impact of the transition to the new accounting standard IFRS 16 ‘Leases’ as
discussed on pages 150-152 as well as other restatements relating to the recording of a provision for property dilapidations and the capitalisation of leakage detection costs, which are discussed on page 152..
The Directors consider that the carrying amount of trade and other receivables is approximately equal to their fair value.
Non-current prepayments at 31 March 2020 includes £159.0 million (2019: £101.9 million) of prepayment relating to the Bazalgette Tunnel Limited (“BTL”) arrangement. This is created and recorded by the Group as BTL will transfer the use of the tunnel to Thames Water Utilities Limited once construction is complete.
Contract assets at 31 March 2020 includes £173.5 million (2019: £144.3 million) of services provided to metered customers. The remaining amount is for accrued capital contributions and accrued income from the BTL arrangement.
Thames Water Combined Report 2019/20 195Strategic report Governance Financial statements Annual performance report

Notes to the Company financial statements continued
33. Trade and other receivables continuedExpected credit losses provisionMovements in the expected credit losses provision were as follows:
2020 £m
2019 £m
At 1 April (176.6) (174.3)Charge for bad and doubtful debts – charged against revenue (33.1) (33.4)Charge for bad and doubtful debts – included within operating expenses (40.8) (29.2)Excess credits recognised during the year (5.1) (11.8)Amounts directly charged to revenue and not included in bad debt expense – (3.9)Amounts written off 67.8 76.0Total at 31 March (187.8) (176.6)
Ageing of gross receivables is as follows:
As at 31 March2020
£m2019
£m
Up to 365 days 273.9 243.91 – 2 years 78.5 131.72 – 3 years 94.4 38.1More than 3 years 42.2 50.7Total 489.0 464.4
The ageing of gross BTL receivables1 is as follows:
As at 31 March2020
£m2019
£m
Up to 365 days 8.3 4.71 – 2 years 2.4 4.82 – 3 years 2.8 –Total 13.5 9.51 This relates to the amount of receivables collected from other parties and passed on to BTL.
The Group applies the IFRS 9 simplified approach to measuring expected credit losses which uses a lifetime expected loss allowance for all trade receivables and contract assets. This is calculated based on historical experience of levels of recovery. Expected credit loss split by ageing category is as follows:
As at 31 March2020
£m2019
£m
Up to 365 days 82.1 66.21 – 2 years 32.4 40.62 – 3 years 44.4 34.9More than 3 years 28.9 34.9Total 187.8 176.6
Ageing of impaired BTL receivables1 is as follows:
As at 31 March2020
£m2019
£m
Up to 365 days 1.4 0.81 – 2 years 0.6 1.42 – 3 years 0.7 –Total 2.7 2.21 This relates to the amount of receivables collected from other parties and passed on to BTL.
34. Cash and cash equivalents
As at 31 March
2020 2019
Underlying £m
BTL £m
Total £m
Underlying £m
BTL £m
Total £m
Cash at bank and in hand 1.5 – 1.5 3.2 0.3 3.5Other short-term investments 751.7 2.6 754.3 148.8 7.3 156.1Total 753.2 2.6 755.8 152.0 7.6 159.6
BTL cash represents amounts collected from wastewater customers, for the construction costs of the Thames Tideway Tunnel, which has not yet been paid across to BTL at the reporting date.
35. Trade and other payables
As at 31 March
2020Restated1
2019
Underlying £m
BTL £m
Total £m
Underlying £m
BTL £m
Total £m
Non-current:Contract liabilities1 707.3 – 707.3 636.1 – 636.1Current:Trade payables – operating 273.5 – 273.5 258.2 – 258.2Other taxation and social security 7.2 – 7.2 7.5 – 7.5Amounts payable in respect of group relief
(1.0) 6.1 5.1 3.1 4.4 7.5
Accruals1 304.7 – 304.7 319.2 – 319.2Amounts owed to Bazalgette Tunnel Limited
– 10.3 10.3 – 11.1 11.1
Other payables 81.7 – 81.7 79.6 – 79.6666.1 16.4 682.5 667.6 15.5 683.1
Current:Contract liabilities1 123.8 0.3 124.1 110.6 3.4 114.0
789.9 16.7 806.6 778.2 18.9 797.1Total 1,497.2 16.7 1,513.9 1,414.3 18.9 1,433.2
Thames Water Combined Report 2019/20 196Strategic report Governance Financial statements Annual performance report

Notes to the Company financial statements continued
35. Trade and other payables continuedCurrent contract liabilities at 31 March 2020 includes £78.2 million (2019: £75.6 million) of receipts in advance from customers for water and wastewater charges. The remaining amount relates to payment in advance for compensation for operating costs and infrastructure charges.
Non-current contract liabilities at 31 March 2020 includes £511.9 million (2019: £497.0 million) of deferred infrastructure charges, £179.7 million of deferred income for nil cost “adopted” assets (2019: £121.4 million) with the remaining amount relating to payments received in advance for compensation for operating costs.
The Directors consider that the carrying amount of trade and other payables within the scope of IFRS 7 is approximately equal to their fair value.
1 The prior year results have been restated due to the impact of the transition to the new accounting standard IFRS 16 ‘Leases’ as discussed on pages 150-152 as well as other restatements relating to the recording of a provision for property dilapidations and the capitalisation of leakage detection costs, which are discussed on page 152.
36. Borrowings
As at 31 March2020
£m2019
£m
Secured bank loans and private placements 2,371.1 2,477.2Amounts owed to group undertakings 10,902.2 9,522.7
13,273.3 11,999.9Interest payable on secured bank loans and private placements 7.2 4.9Interest payable on amounts owed to group undertakings 226.1 213.8
233.3 218.7Total 13,506.6 12,218.6Disclosed within non-current liabilities 11,626.6 10,996.0Disclosed within current liabilities 1,880.0 1,222.6Total 13,506.6 12,218.6
Secured bank loans refers to an arrangement whereby each Obligor (representing each of the companies within the whole business securitisation group) has entered into a Security Trust and Intercompany Deed (“STID”) with the Security Trustee. Pursuant to this arrangement, Thames Water Utilities Holdings Limited has guaranteed the obligations of each other Obligor under the finance agreement. Additionally, Thames Water Utilities Limited, and its wholly owned subsidiary, has guaranteed the obligations of each other under the finance agreement, in each case to the Security Trustee.
As at 31 March 2020, amounts owed to group undertakings, including interest, are unsecured and include the following:
• £11,122.8 million (2019: £9,730.7 million) owed to TWUF. Financing costs arising in Thames Water Utilities Finance plc are directly recharged under mirrored interest terms for all loans except for
• a £225.0 million 6.59% secured bond due in 2021, which was loaned on with a margin of one basis point, and
• financing costs relating to TWUCF’s instruments transferred on 31 August 2018, where all costs are recharged under mirrored interest terms, with an additional margin of ten basis points.
• £5.2 million (2019: £5.2 million) owed to Thames Water Utilities Holdings Limited.
• £0.3 million (2019: £0.3 million) owed to Thames Water Limited.
Maturity analysis with respect to borrowings is presented in note 37.
Breakdown of secured bank loans and private placements
As at 31 March2020
£m2019
£m
£60.0m 1.230% index-linked loan due 2019 (g) – 78.8 £60.0m 1.415% index-linked loan due 2020 (g) – 78.5£60.0m 1.513% index-linked loan due 2020 (g) – 78.1 £60.0m 1.380% index-linked loan due 2020 (g) – 77.9 £60.0m 1.356% index-linked loan due 2020 (g) – 77.9 £100.0m floating rate loan due 2020 (a), (c) – 99.9 £75.0m 1.350% index-linked loan due 2021 (e), (g) 91.6 89.2 £215.0m 0.460% index-linked loan due 2023 (a), (g) 254.8 248.2 £215.0m 0.380% index-linked loan due 2032 (a), (b), (g) 209.5 218.9 £100.0m 3.280% index-linked loan due 2043 (a), (d), (g) 133.1 129.6 £100.0m 0.790% index-linked loan due 2025 (a), (e), (g) 112.8 109.9 £125.0m 0.598% index-linked loan due 2026 (a), (e), (g) 140.4 136.7 £70.0m Class B 3.867% fixed rate loan due 2026 (a) 70.0 70.0 £50.0m Class B 3.875% fixed rate loan due 2026 (a) 50.0 50.0 £20.0m Class B floating rate loan due 2026 (a) 20.0 20.0 £39.0m Class B 3.918% fixed rate loan due 2026 (a) 38.5 38.4 $55.0m 3.380% private placement due 2023 (a), (f) 44.2 42.3 $285.0m 3.570% private placement due 2025 (a), (f) 229.1 218.9 £216.0m 2.450% private placement due 2028 (a) 215.4 215.4 £210.0m 2.550% private placement due 2030 (a) 209.3 209.3 £40.0m 2.620% private placement due 2033 (a) 39.8 39.8 £150.0m floating rate loan due 2024 (a) 149.7 149.5£125.0m floating rate loan due 2024 (a) 124.4 –£50.0m floating rate loan due 2022 (a) 49.9 –£63.1m floating rate loan due 2027 (a) 62.9 –£63.1m floating rate loan due 2029 (a) 62.9 –£63.1m floating rate loan due 2031 (a) 62.8 –Total secured bank loans and private placements 2,371.1 2,477.2
All loans and private placements are Class A except where highlighted.
(a) These loans and private placements are shown net of issue costs.(b) This debt amortises in equal tranches from 2017 onwards.(c) The interest margins of this loan is based on a ratings grid and varies depending upon the Company’s senior debt credit rating
assigned by both Standard and Poor’s and Moody’s.
Thames Water Combined Report 2019/20 197Strategic report Governance Financial statements Annual performance report

Notes to the Company financial statements continued
(d) This debt amortises from 2023 to 2033 in tranches of £3.0 million, followed by tranches of £750,000 until maturity where there will be a bullet repayment of £25.0 million.
(e) These loans contain a collar mechanism that limits total accretion repayment within a predetermined range.(f) The Company has entered into cross currency swap agreements which convert this debt into sterling debt.(g) The value of the capital and interest elements of the index-linked loans is linked to movements in the Retail Price Index (“RPI”).
Breakdown of amounts owed to group undertakingsThese amounts are intercompany loans.
As at 31 March2020
£m2019
£m
THAMES WATER UTILITIES FINANCE PLC£100.0m 5.050% fixed rate due 2020 100.0 100.0£225.0m 6.590% fixed rate due 2021 (c) 225.0 225.0£175.0m 3.375% index-linked due 2021 (b), (k) 290.4 282.4£330.0m 6.750% fixed rate due 2028 (a), (b) 327.7 327.5£200.0m 6.500% fixed rate due 2032 (b) 197.9 197.8£600.0m 5.125% fixed rate due 2037 (b) 596.6 596.5£300.0m 1.680% index-linked due 2053 (b), (k) 447.4 435.3£300.0m 1.681% index-linked due 2055 (b), (k) 447.4 435.3£245.0m 1.031% floating rate loan due 2019 (h), (j) – 245.0£214.3m 1.397% Class B floating rate loan due 2019 (h), (j) – 214.3£600.0m 1.029% floating rate loan due 2020 (h), (g) 600.0 –£300.0m 1.029% floating rate loan due 2020 (h), (g) 300.0 –£300.0m 1.001% floating rate loan due 2020 (h), (g) 300.0 –£214.3m 1.082% Class B floating rate loan due 2020 (h), (g) 214.3 –£150.0m 2.329% Class B floating rate loan due 2023 (h), (g) 150.0 –£82.0m 2.9720% fixed rate due 2026 (a) 81.8 –£101.3m 3.2300% fixed rate due 2029 (a) 101.0 –£44.1m 3.1468% fixed rate due 2030 (a) 43.9 –£100.0m 1.985% index-linked due 2022 (a), (e), (k) 123.5 120.3£96.6m 4.146% fixed rate due 2022 (a) 96.6 96.6£128.7m 4.300% fixed rate due 2024 (a) 128.7 128.8£161.1m 4.534% fixed rate due 2027 (a) 161.1 161.0£100.0m 1.790% index-linked due 2029 (e), (k) 115.0 112.1£300.0m 5.750% Class B Fixed rate due 2030 (a), (b), (f) 298.5 298.1£300.0m 4.375% fixed rate due 2034 (a), (b) 295.9 295.6¥20.0bn 3.280% fixed rate due 2038 (a), (i) 149.4 139.0£200.0m 0.205% index-linked due 2039 (a), (e), (k) 200.9 226.5£50.0m 3.853% index-linked due 2040 (a), (d) 66.6 64.9£500.0m 5.500% fixed rate due 2041 (a), (b) 490.1 489.8£50.0m 1.980% index-linked due 2042 (a), (k) 70.4 68.9£55.0m 2.091% index-linked due 2042 (a), (b), (k) 74.7 72.8
As at 31 March2020
£m2019
£m
£40.0m 1.974% index-linked due 2045 (a), (b), (k) 46.2 46.3£300.0m 4.625% fixed rate due 2046 (a), (b) 293.4 293.2£100.0m 1.846% index-linked due 2047 (a), (k) 140.9 137.8£200.0m 1.819% index-linked due 2049 (a), (b), (k) 281.3 275.2£200.0m 1.771% index-linked due 2057 (a), (b), (k) 281.2 275.1£100.0m index-linked due 2060 (a), (k) 99.4 111.7£350.0m 1.760% index-linked due 2062 (a), (b), (k) 492.1 481.5£500.0m 4.000% fixed rate due 2025 (a), (b) 496.5 495.9£40.0m 0.750% index-linked loan due 2034 (a), (b), (k) 44.7 43.5£45.0m 0.721% index-linked loan due 2027 (a), (b), (k) 50.2 48.9£300.0m 3.500% fixed rate loan due 2028 (a), (b) 297.0 296.6£400.0m 7.738% fixed rate bond due 2058 (a), (b) 419.1 419.6£250.0m 1.875% fixed rate bond due 2024 (a), (b) 248.5 248.1£250.0m 2.625% fixed rate bond due 2032 (a), (b) 247.6 247.4£300.0m 2.375% Class B fixed rate bond due 2023 (a), (b) 299.1 298.8£250.0m 2.875% Class B fixed rate bond due 2027 (a), (b) 247.3 246.9£143.6m 2.296% fixed rate bond due 2024 (a), (b) 143.1 143.2Fees (g) (10.9) (11.2)£85.2m floating rate loan due 2043 85.2 85.2
THAMES WATER LIMITED£0.3m floating rate loan due 2043 0.3 0.3
THAMES WATER UTILITIES HOLDINGS LIMITED£5.2m floating rate loan due 2043 5.2 5.2Total amounts owed to group undertakings 10,902.2 9,522.7
All debt is Class A except where highlighted.
(a) Thames Water Utilities Finance Plc charges the Company a margin of ten basis points in respect of the loans.(b) These loans are shown net of issue costs.(c) Thames Water Utilities Finance Plc charges the Company a margin of one basis point in respect of this loan.(d) This is a Limited Price Index (“LPI”) loan. Accretion charged is calculated using an adjusted UK Retail Price Index. (e) These amounts have been swapped into RPI-linked debt within the financing subsidiary and the net proceeds lent to TWUL.(f) In September 2022 this Bond has a ‘Step Up and Call’ meaning the interest rate changes to 3 months LIBOR plus 7.97% at which point
the issuer can exercise a call option to redeem the nominal value of the debt at par value.(g) These fees have been shown within the bonds section as they relate to RPI-linked debt issued in 2007.(h) In March 2020 £1,200.0 million out of the £1,432.1 million Class A revolving credit facility was drawn, £214.3 million out of the
£214.3 million Class B revolving credit facility was drawn and £150.0 million out of the £300.0 million Class B term loan facility was drawn. In April 2020, £350.0 million of the Class A drawdown and the £214.3 million Class B drawdown were repaid. In May 2020, a further £40.0 million of the Class A drawdown was repaid.
(i) The Company has entered into cross currency swap agreements which convert this debt into sterling debt.(j) The interest margin of these loans is based on a ratings grid and varies depending on the senior debt credit rating of the Company
assigned by both Standard and Poor’s and Moody’s.(k) The value of the capital and interest elements of the index-linked loans is linked to movements in the Retail Price Index (“RPI”).
36. Borrowings continued
Thames Water Combined Report 2019/20 198Strategic report Governance Financial statements Annual performance report

Notes to the Company financial statements continued
37. Financial instrumentsCategories of financial instruments The carrying values of the financial assets and liabilities of the Company are as follows:
Financial assets:
As at 31 March2020
£m2019
£m
Fair value through profit and lossCross currency swaps 51.6 24.4Interest rate swaps 87.7 10.7Index-linked swaps 97.6 63.9
236.9 99.0Amortised costIntercompany loans receivable 2,090.1 2,322.3Other receivables (excluding prepayments) 33.6 27.1Trade and other receivables (excluding prepayments) 365.6 328.8Short-term investments 300.0 –Cash and cash equivalents 755.8 159.6
3,545.1 2,837.8Total 3,782.0 2,936.8
Financial liabilities:
As at 31 March2020
£m2019
£m
Fair value through profit and lossCross currency swaps (49.7) (54.3)Interest rate swaps (252.1) (180.7)Index-linked swaps (400.8) (556.7)Derivatives designated as hedging instrumentsForward starting interest rate swaps – cash flow hedges – (26.2)
(702.6) (817.9)Amortised costTrade and other payables (excluding other taxation and social security) (675.3) (683.3)Borrowings (13,506.6) (12,218.3)Lease liabilities (70.3) (72.5)
(14,252.2) (12,974.1)Total (14,954.8) (13,792.0)
Fair value measurementsThe fair value of financial assets and liabilities represents the price that would be received to sell an asset or paid to transfer a liability between informed and willing parties, other than in a forced or liquidation sale at the measurement date. The techniques for determining the fair value of financial instruments are classified under the hierarchy defined in IFRS 13 Fair Value Measurement which categorises inputs to valuation techniques into levels 1-3 based on the degree to which the fair value is observable. Unless otherwise stated all of the Company’s inputs to valuation techniques are level 2 – the fair value is determined from inputs other than quoted prices that are observable for the asset or liability, either directly or indirectly. The fair values of interest rate and index-linked swaps are determined, in part, from unobservable inputs but the use of these unobservable inputs does not significantly impact the result. As a result, we have concluded that it is appropriate to continue to classify the derivative instruments as level 2. The table below sets out the valuation basis of financial instruments held at fair value as at 31 March 2020:
Level 21
As at 31 March2020
£m2019
£m
Financial assets – derivative financial instrumentsCross currency swaps 51.6 24.4Interest rate swaps 87.7 10.7Index-linked swaps 97.6 63.9
236.9 99.0Financial liabilities – derivative financial instrumentsCross currency swaps (49.7) (54.3)Interest rate swaps (252.1) (180.7)Index-linked swaps (400.8) (556.7)Forward starting interest rate swaps – (26.2)
(702.6) (817.9)Net total (465.7) (718.9)1 The fair value of derivative financial instruments, including interest rate swaps, cross currency swaps, index-linked swaps and options,
are measured using discounted cash flows. The future cash flows are estimated based on observable forward interest rates and inflation rates and discounted at a rate that reflects the credit risk of the Company and counterparties. Currency cash flows are translated at spot rate.
During November 2019, the maturity date of an index-linked swap, with £200.0 million notional, was extended to 2038. The swap is measured at fair value through the income statement. At the restructuring date the fair value of the instrument, as indicated by the fair value immediately prior to the restructuring, could not be supported by observable inputs alone. In management’s view the reduction in value of £15.8 million is supported by unobservable factors including the counterparty’s credit, capital, funding and trading charges. Therefore, such movement was deferred on the balance sheet in compliance with IFRS 9 and will be recognised in the income statement on a straight-line basis over the life of the underlying derivative instrument. As at 31 March 2020, £15.5 million (31 March 2019: £nil) remained capitalised and £0.3 million had been recognised in the income statement.
Thames Water Combined Report 2019/20 199Strategic report Governance Financial statements Annual performance report

Notes to the Company financial statements continued
37. Financial instruments continuedComparison of fair value of financial instruments with their carrying amountsThe carrying amounts of the Company’s cash and cash equivalents, lease liabilities, trade and other receivables, contract assets, trade and other payables and contract liabilities are considered to be approximate to their fair values. The fair values and carrying values of the Company’s other financial assets and financial liabilities are set out in the tables below.
Financial assets:
As at 31 March
2020 2019
Book value £m
Fair value £m
Book value £m
Fair value £m
Non-currentIntercompany loans receivable 2,052.2 2,052.2 2,274.7 2,274.7Derivative financial instruments Cross currency swaps 51.6 51.6 24.4 24.4 Interest rate swaps 87.7 87.7 10.7 10.7 Index-linked swaps 97.6 97.6 63.9 63.9Trade and other receivables 231.4 231.4 142.9 142.9
2,520.5 2,520.5 2,516.6 2,516.6CurrentShort-term investments 300.0 300.0 – –Cash and cash equivalents 755.8 755.8 159.6 159.6Intercompany loans receivable 38.0 38.0 47.6 47.6Trade and other receivables 367.6 367.6 346.5 346.5
1,461.4 1,461.4 553.7 553.7Total 3,981.9 3,981.9 3,070.3 3,070.3
Financial liabilities:
As at 31 March
2020restated1
2019
Book value £m
Fair value £m
Book value £m
Fair value £m
Non-currentBorrowings Secured bank loans and private placements (2,355.0) (2,538.5) (1,972.2) (2,199.4) Amounts owed to group undertakings (9,271.6) (11,690.5) (9,023.9) (11,750.0)Derivative financial instruments Cross currency swaps (49.7) (49.7) (54.3) (54.3) Interest rate swaps (252.1) (252.1) (180.7) (180.7) Index-linked swaps (400.8) (400.8) (556.7) (556.7) Forward starting interest rate swaps – – (26.2) (26.2)
(12,329.2) (14,931.6) (11,814.0) (14,767.3)CurrentBorrowings Secured bank loans and private placements (16.1) (16.1) (505.0) (517.1) Amounts owed to group undertakings (1,630.6) (1,635.9) (498.9) (499.1) Interest payable (233.3) (233.3) (218.7) (218.7)
(1,880.0) (1,885.3) (1,222.6) (1,234.9)Total (14,209.2) (16,816.9) (13,036.6) (16,002.2)
Amounts owed to group entities include bonds and private placements issued by subsidiary entities, which are publicly traded and the proceeds from these transactions are loaned to the Company through intercompany agreements. The Company does not issue any bonds directly to the public markets.
The fair value of secured bank loans and private placements is determined by discounting expected future cash flows using a risk-free rate plus the Company’s credit spread. The fair value of amounts owed to group undertakings represents the market value of the underlying debt instrument, associated derivative instrument and relevant margin on the intercompany loan.
The fair value of index linked debt instruments is based on the nominal value of the debt plus accretion already accrued and accretion expected to accrue to maturity.
Thames Water Combined Report 2019/20 200Strategic report Governance Financial statements Annual performance report

Notes to the Company financial statements continued
37. Financial instruments continuedCapital risk management Capital risk primarily relates to whether the Company is adequately capitalised and financially solvent. The Board reviews the Company’s exposure to these risks and actively overseas the treasury activities, reviewing the treasury policy and approving the treasury strategy and funding plan.
The Company’s key objectives in managing capital are:
• To maintain a broad portfolio of debt, diversified by source and maturity
• To retain the Company’s investment grade credit rating
• To provide liquidity sufficient to fund ongoing obligations for a minimum of a 15-month forward period on an ongoing basis
• To maintain customer bills at a level which is both affordable and sustainable
Derivative financial instruments are used, where appropriate to manage the risk of fluctuations in interest rates, inflation and foreign exchange rates. No open or speculative positions are taken.
The Company is part of a Whole Business Securitisation (“WBS”) Group of companies. The Company guarantees the funding activity of TWUF which raises debt finance in external debt markets through the issuance of secured bonds and the issue of loans. The Securitisation Group is required to comply with certain covenants, which include, amongst others:
• Interest cover ratios
• Gearing ratios
• An obligation to manage the maturity profile of debt arrangements
• An obligation to manage the proportion of future interest cost which is fixed and/or index-linked
• Unsecured debt ratios
The Securitisation Group complied with these ratios throughout the financial year.
The capital structure of the Company consists of net debt and equity as follows:
As at 31 March2020
£m2019
£m
Secured bank loans and private placements (2,371.1) (2,477.2)Amounts owed to group undertakings (10,902.2) (9,522.7)Lease liability1 (70.3) (72.5)Interest payable on secured bank loans and private placements (7.2) (4.9)Interest payable on amounts owed to group undertaking (226.1) (213.8)
(13,576.9) (12,291.1)Cash and cash equivalents 755.8 159.6Short-term investments 300.0 –Net debt (statutory basis) (12,521.1) (12,131.5)Amounts owed to group undertakings 390.7 390.7Interest payable on secured bank loans and private placements 7.2 4.9Interest payable on amounts owed to group undertakings 226.1 213.8Unamortised debt issuance costs and discount (71.4) (74.3)Derivative financial liabilities (183.0) (231.4)Unamortised IFRS 9 adjustment 24.9 25.5Net debt (covenant basis) (12,126.6) (11,802.3)Equity attributable to owners of the Company 3,456.4 3,199.71 The impact of the transition to new accounting standard IFRS 16 ‘Leases’ on 1 April 2019 and other restatements are discussed on
pages 150-152
Net debt (covenant basis) excludes amounts owed to group undertakings for which there is no related external debt, accrued interest, unamortised debt issuance costs and discounts, unamortised IFRS 9 adjustment and includes derivative financial liabilities related solely to accretion on index-linked swaps and the effect of movement in foreign exchange rate to cross currency swap held in TWUL. Amounts owed to group undertaking include loans from immediate subsidiary Thames Water Utilities Finance Plc of £385.2 million (2019: £385.2 million), from immediate parent Thames Water Utilities Holdings Limited £5.2 million (2019: £5.2 million) and from the parent of the immediate parent Thames Water Limited £0.3 million (2019: £0.3 million) as these are not related to external debt.
Net debt (covenant basis) for the Group on page 172 is lower by £2.6 million than the Company due to cash held by TWUF.
Thames Water Combined Report 2019/20 201Strategic report Governance Financial statements Annual performance report

Notes to the Company financial statements continued
37. Financial instruments continuedReconciliation of liabilities arising from financing activitiesThe reconciliation below between the opening and closing balances for liabilities arising from financing activities evaluates changes in liabilities including changes arising from both cash flow and non-cash items.
As at 31 March
2020 2019
Borrowings £m
Net derivative
financial liabilities3
£m
Lease liabilities4
£mBorrowings
£m
Net derivative
financial liabilities3
£m
Lease liabilities4
£m
Opening balance (12,218.6) (718.9) (72.5) (11,443.2) (762.1) (75.3)Non-current (10,996.0) (718.9) (65.1) (11,123.0) (749.8) (72.5)Current (1,222.6) – (7.4) (320.2) (12.3) (2.8)Cash flowsNew loans raised (3,141.8) – – (1,148.8) – –Repayment of borrowings 2,014.6 – – 653.4 – –Repayment of lease principal – – 11.0 – – 10.1Derivative paydown1 – 76.0 – – 13.4 –Interest paid2 382.4 – – 381.6 – –Interest received – (29.5) – – (0.9) –
(744.8) 46.5 11.0 (113.8) 12.5 10.1Non-cash changesInterest accrued/Fees amortised (402.3) 45.3 – (395.7) 0.9 –Foreign exchange movement (22.4) – – (24.0) – –Indexation (119.1) – – (125.7) – –Fair value changes – 161.4 – – 29.8 –Lease additions – – (5.1) – – (3.4)Interest accrued for IFRS 16 leases
– – (3.7) – – (3.9)
Unamortised IFRS 9 adjustment 0.6 – – (25.5) – –Amounts owed to group undertakings
– – – (90.7) – –
(543.2) 206.7 (8.8) (661.6) 30.7 (7.3)Closing balance (13,506.6) (465.7) (70.3) (12,218.6) (718.9) (72.5) Non-current (11,626.6) (465.7) (62.4) (10,996.0) (718.9) (65.1) Current (1,880.0) – (7.9) (1,222.6) – (7.4)1 Derivative paydown of £76.0 million (2019: £13.4 million) relates to an index-linked swap where accretion is payable periodically.2 Interest paid of £382.4 million (2019: £381.6 million) includes £97.6 million of capitalised borrowing costs (2019: £109.3 million) and
excludes £0.2 million of bank charges (2019: £0.4 million). 3 The reconciliation of liabilities from financing activities in respect of derivative financial liabilities includes a net derivative financial
liability position, presentation of prior year numbers has been updated accordingly.4 The prior year results have been restated due to the impact of the transition to the new accounting standard IFRS 16 ‘Leases’ as
discussed on pages 150-152.
Financial risk managementThe Company’s activities expose it to a number of financial risks: market risk (including interest rate risk, exchange rate risk and inflation risk), credit risk, and liquidity risk. Details of the nature of each of these risks along with the steps the Company has taken to manage them is described below and overleaf.
Market risk Market risk relates to fluctuations in external market variables such as interest rates, inflation and foreign exchange rates that could affect the Company’s income or the value of the financial instruments it holds. Below is the effective interest rate and foreign currency risk profile of the debt held by the Company after taking into account the derivative financial instruments used to manage market risk.
As at 31 March 2020:
Total at fixed rates
£m
Total at floating rates
£m
Total at RPI linked rates
£mTotal
£m
Interest bearing loans and borrowingsNet of corresponding swap assets– £ Sterling 4,051.5 1,838.4 7,541.5 13,431.4
As at 31 March 2019:
Total at fixed rates
£m
Total at floating rates
£m
Total at RPI linked rates
£mTotal
£m
Interest bearing loans and borrowingsNet of corresponding swap assets– £ Sterling 5,660.8 720.2 5,824.7 12,205.7
The weighted average interest rates of the debt held by the Company, after taking into account the derivative financial instruments used to manage market risk, and the period until maturity for which the rate is fixed and index-linked, are given below.
Weighted average interest rate
Weighted average period until maturity
As at 31 March2020
%2019
%2020 Years
2019 Years
Fixed 5.4 5.1 11.8 11.6Index-Linked 3.5 4.3 18.1 21.4
(i) Interest rate risk sensitivity analysisThe Company holds both fixed and floating rate borrowings. Fixed rate borrowings are exposed to a risk of change in their fair value due to changes in interest rates. Floating rate borrowings are exposed to a risk of change in interest cash flows due to changes in interest rates. The Company uses interest rate swaps which economically hedge future cash flows to protect against interest rate movements. For details of the interest rate swaps please see the Cash flow hedges section of this note on page 204.
Thames Water Combined Report 2019/20 202Strategic report Governance Financial statements Annual performance report

Notes to the Company financial statements continued
37. Financial instruments continuedThe table below summarises the impact, on pre-tax profits, of 1% increase or decrease in interest rate at 31 March 2020. This analysis considers the effect of variable interest rate instruments and assumes that all other variables, in particular exchange rates, remain constant.
As at 31 March
2020 +1% £m
2020 -1% £m
2019 +1%
£m
2019 -1%£m
Profit 127.5 (148.8) 143.0 (177.1)Equity 127.5 (148.8) 155.6 (190.0)
(ii) Exchange rate sensitivity analysisThe Company’s foreign currency risk exposure results from debt raised in currencies other than Sterling. The Company uses cross currency swaps to hedge the foreign currency exposure of bonds issued in a foreign currency. All hedges are undertaken for commercial reasons with the objective of minimising the impact of exchange rate fluctuations. The Company has no material unhedged monetary assets or liabilities denominated in a currency other than sterling.
The table below summarises the impact of changes in the year end valuations of financial assets and liabilities denominated in foreign currency on pre-tax profits of a 10% strengthening or weakening of GBP (£) against the respective currencies in which the financial assets and liabilities are denominated at 31 March 2020. This analysis assumes that all other variables in the valuation remain constant.
As at 31 March
2020 +10%
£m
2020 -10%
£m
2019 +10%
£m
2019 -10%
£m
Profit (7.2) 6.2 (10.1) 6.2Equity (7.2) 6.2 (10.1) 6.2
(iii) Inflation risk sensitivity analysisThe Company has entered into financial instruments that are directly linked to inflation including RPI linked bonds, loans and swaps. In addition, the Company as a regulated water and wastewater company is subject to fluctuations in its revenues due to movements in inflation. Therefore the Company’s RPI linked borrowings and swaps form a partial economic hedge as the assets and liabilities partially offset.
The table below summarises the impact on pre-tax profits of a 1% increase or decrease in inflation rates at 31 March 2020. This analysis assumes that all other variables, in particular exchange rates, remain constant.
As at 31 March
2020 +1% £m
2020 -1% £m
2019 +1%
£m
2019 -1% £m
Profit (529.5) 534.7 (421.2) 354.1Equity (529.5) 534.7 (421.2) 354.1
Credit risk Credit risk relates to the potential financial loss to the Company if a customer or counterparty to a financial instrument fails to meet its contractual obligations. This arises principally from the Company’s trade receivables, its loan with its immediate parent entity Thames Water Utilities Holdings Limited, short-term investments and cash flows receivable from counterparties to the derivative financial instruments.
The Company has a statutory obligation to provide water and sewerage services to customers within its region. Due to the large area served by the Company and the significant number of households within this area, there is considered to be no concentration of trade receivables credit risk, however, the Company’s credit control policies and procedures are in place to minimise the risk of bad debt arising from its household trade receivables. Amounts provided against trade receivables and movements in the provision in the year are disclosed in note 16. For non-household customers, the credit risk lies with a small number of retailers rather than the end user and exposure to retailer default would be limited due to conditions that exist within the non-household market.
Under the terms of the WBS agreement, counterparties to the Company’s short-term investments and derivative transactions have to meet minimum credit rating criteria as assigned by both Moody’s and S&P. For derivative counterparties there is a mechanism for the counterparty to post collateral when amounts due to the Company under outstanding derivative contracts exceed a contractually agreed threshold amount or the counterparty fails to meet the necessary credit rating criteria.
The Company’s maximum exposure to credit risk is the carrying amount of financial assets recorded in the financial statements, which is net of impairment losses, less collateral cash held under the terms of the whole business securitisation agreement. No collateral was held as at 31 March 2020 (2019: nil).
The following table summarises amounts held on short-term investments by credit rating of counterparties.
As at 31 March2020
£m2019
£m
A+ 150.0 –A 150.0 –Total 300.0 –
The following table summarises fair value of derivatives assets by credit rating of counterparties.
As at 31 March2020
£m2019
£m
AA- 25.0 5.4A+ 168.8 72.2A 33.8 21.4A- 9.3 –Total 236.9 99.0
Liquidity risk Liquidity risk is the risk that the Company will not be able to meet its financial obligations as they fall due. The Company manages long-term liquidity by maintaining continuity of funding through access to different market and debt instruments, raising funds in the capital markets and ensuring that manageable debt maturity profiles are maintained. The Company also maintains a level of committed liquidity facilities provided by a range of financial institutions. Details of the Company’s borrowings are disclosed in Note 37.
Thames Water Combined Report 2019/20 203Strategic report Governance Financial statements Annual performance report

Notes to the Company financial statements continued
37. Financial instruments continuedThe maturity profile of interest-bearing loans and borrowings disclosed in the statement of financial position are given below.
As at 31 March2020
£m2019
£m
Within one year 1,655.3 965.4Between one and two years 721.0 214.9Between two and three years 211.5 708.2Between three and four years 1,098.3 177.6Between four and five years 800.7 1,113.8After more than five years 8,786.5 8,820.0Total 13,273.3 11,999.9
(i) Cash flows from non-derivative financial liabilitiesThe maturity profile of the anticipated future cash flows including interest in relation to the Company’s non-derivative financial liabilities on an undiscounted basis (excluding non-current trade payables), which, therefore, differs from both the carrying value disclosed in the statement of financial position and fair values, is as follows:
As at 31 March2020
£m2019
£m
Undiscounted amounts receivable/(payable)Within one year 2,665.4 2,089.3Between one and two years 1,108.2 602.0Between two and three years 601.8 1,109.8Between three and four years 1,485.1 543.2Between four and five years 1,186.5 1,483.4After more than five years 18,252.7 20,731.0Total 25,299.7 26,558.7
(ii) Cash flows from derivative financial instrumentsThe maturity profile of the Company’s financial derivatives (which include interest rate swaps, cross currency swaps and index-linked swaps), based on undiscounted cash flows, is as follows:
As at 31 March2020
£m2019
£m
Undiscounted amounts receivable/ (payable)Within one year 125.1 (4.4)Between one and two years 105.1 (4.1)Between two and three years 82.7 0.4Between three and four years (57.4) (36.8)Between four and five years (35.3) (168.0)After more than five years (787.6) (963.3)Total (567.4) (1,176.2)
Cash flow hedgesThe Company has designated a number of contracts which qualify, in accordance with IFRS 9 Financial Instruments, as cash flow hedges. The accounting policy on cash flow hedges is explained on page 149.
In mid-2014 the Company executed £2.25 billion of forward-starting floating to fixed interest rate swaps of a 5-7 year maturity with various financial institutions. At inception the swaps were designated as a cash flow hedge of the future interest cost of debt to be issued from 2017 to 2020. The effective portion of the fair value movements on these swaps was recognised in the cash flow hedge reserve, to be reclassified to the income statement over the life of the underlying hedged debt.
As of the start of this year £2.0 billion of these swaps had already commenced. The remaining £250.0 million, due to commence in September 2019, were restructured in July 2019. The cash flow hedge relationship was terminated at the restructuring date because changes in the expected cash flows would result in significant ineffectiveness. The fair value movements prior to termination were recognised in the cash flow hedge reserve and will be reclassified to the income statement over the life of the underlying hedged debt which, although delayed, was still expected to be issued. Fair value movements subsequent to termination were recognised in the income statement. In September 2019, on commencement, the £250 million swaps were reclassified from forward starting swaps to interest rate swaps.
During the year a £4.1 million loss (2019: loss of £8.9 million) was recognised in the cash flow hedge reserve and a £34.9 million loss (2019: £34.2 million loss) was reclassified from the cash flow hedge reserve to the income statement, see statement of changes in equity. The amount reclassified of £34.9 million consisted of a £31.6 million loss related to hedged exposure that crystallised during the year and a £3.3 million loss due to ineffectiveness relating to the swaps that were restructured during the year due to the delay in issuance of the related debt.
The Company’s cash flow hedge reserve disclosed on the statement of changes in equity on page 193 relate to forward starting interest rate swaps.
Cash flow hedge reserve £m
At 1 April 2018 (138.9)Loss on cash flow hedge (8.9)Cash flow hedge transferred to income statement 34.2Deferred tax (4.3)At 31 March 2019 (117.9)Loss on cash flow hedge (4.1)Cash flow hedge transferred to income statement 34.9Deferred tax charge on cash flow hedge gain including impact of deferred tax rate change (3.0)At 31 March 2020 (90.1)
Thames Water Combined Report 2019/20 204Strategic report Governance Financial statements Annual performance report

Notes to the Company financial statements continued
37. Financial instruments continuedFollowing are the effects of forward starting interest rate swaps on the Company’s financial position and performance:
As at 31 March2020
£m2019
£m
QuantitativeCarrying amount – 26.2Notional amount – 250.0Change in fair value during the year 4.1 5.5Change in the value of hedged item used to determine hedge effectiveness 4.1 5.6
As at 31 March 2020 2019
QualitativeMaturity date – September
2024Hedge ratio – 1:1
The expected cash flows of the Company’s cash flow hedging instruments are as follows:
As at 31 March2020
£m2019
£m
Undiscounted amounts receivable/ (payable)Interest rate swapsWithin one year – (2.4)Between one and two years – (4.9)Between two and three years – (4.9)Between three and four years – (4.9)Between four and five years – (4.9)After more than five years – (2.4)Total – (24.4)
38. Deferred taxAn analysis of movements in the major deferred tax liabilities and assets recognised by the Company is set out below:
Accelerated depreciation
£m
Retirement benefits
£m
Cash flow hedge
£mOther
£mTotal
£m
At 31 March 2018 (1,050.2) 33.4 92.7 13.6 (910.5)Restatement for IFRS 16 – – – 1.6 1.6
Restated1 At 1 April 2018 (1,050.2) 33.4 92.7 15.2 (908.9)Charge to income (restated) (1.1) 3.8 (3.8) (6.8) (7.9)Credit to other comprehensive income
– 4.3 (4.3) – –
Restated1 At 31 March 2019 (1,051.3) 41.5 84.6 8.4 (916.8)Credit/(charge) to income (146.9) (5.1) (23.4) 5.7 (169.7)Credit/(charge) to other comprehensive income
– (29.7) (3.0) – (32.7)
At 31 March 2020 (1,198.2) 6.7 58.2 14.1 (1,119.2)
Deferred tax assets and liabilities have been offset in the balance sheet. The offset amounts, which are to be recovered/settled after more than 12 months are as follows:
As at 31 March2020
£m
Restated1 2019
£m
Deferred tax asset 79.0 134.5Deferred tax liability (1,198.2) (1,051.3)Total (1,119.2) (916.8)1 The restatement relates to the impact of the transition to new accounting standard IFRS 16 ‘Leases’ on 1 April 2019 and other
restatements have been discussed on pages 150-152.
A deferred tax liability arises in respect of accelerated tax depreciation, because the rate of tax relief specified in UK tax legislation on most of our capital expenditure is quicker than the rate of accounting depreciation on that expenditure. These temporary differences unwind and affect current tax over the life of the relevant assets, but the continued high levels of capital investment within the Company mean that the temporary differences currently tend to increase every year.
Deferred tax assets have arisen on the following temporary differences:
• Retirement benefit obligations: A net deferred tax asset is provided on the retirement benefit obligations booked in the accounts. The £41.6m deferred tax asset carried forward is the net of an asset of £57.6m (19% of the deficit on the TWPS pension scheme of £338.8m) less a liability of £16.0m (35% of the surplus on the MIPS pension scheme of £45.8m). Current tax relief will be available in the future for pension contributions paid to reduce these obligations. Deferred tax movements will also arise on any non-cash changes in the obligations, for example those arising from actuarial valuations.
Thames Water Combined Report 2019/20 205Strategic report Governance Financial statements Annual performance report

Notes to the Company financial statements continued
38. Deferred tax continued • Cash flow hedge: A deferred tax asset is provided on certain fair values booked in respect of financial
instruments in the accounts. Current tax relief will be available in the future as the cash flows arise over the lives of the derivatives. Deferred tax movements will also arise on any non-cash changes in the fair value of the derivatives.
• Other: A deferred tax asset is provided on the temporary differences arising on amounts for which a tax deduction is spread over a number of years in accordance with tax legislation, including certain pension contributions. Current tax relief will be available in future when tax relief is available in accordance with the legislation. The balance has been restated to include deferred tax on the net timing differences resulting from the adoption of IFRS 16 and other restatements.
39. Share capital and other reservesShare capital
As at 31 March
2020 2019
Underlying £m
BTL £m
Total £m
Underlying £m
BTL £m
Total £m
Allotted, called up and fully paid:29,050,000 ordinary shares of £1 each (2019: 29,050,000 ordinary shares of £1 each)
29.0 – 29.0 29.0 – 29.0
The company has one class of ordinary share which carries no right to fixed income. The holders of ordinary shares are entitled to receive dividends as declared and are entitled to one vote per share at meetings of the Company.
Other reserves
As at 31 March
2020Restated1
2019
Underlying £m
BTL £m
Total £m
Underlying £m
BTL £m
Total £m
Share premium 100.0 – 100.0 100.0 – 100.0Cash flow hedge reserve (90.1) – (90.1) (117.9) – (117.9)Revaluation reserve 934.3 – 934.3 989.3 – 989.3Retained earnings 2,325.3 158.0 2,483.3 2,099.3 100.0 2,199.3Total 3,269.5 158.0 3,427.5 3,099.7 100.0 3,199.7
The revaluation reserve reflects the revaluation of infrastructure assets to fair value on transition to IFRS, net of deferred tax.
The cash flow hedge reserve comprises the effective portion of the cumulative net change in the fair value of cash flow hedging instruments related to hedged transactions that have not yet occurred.
Refer to Note 8 for information on the dividends paid by the Company.
1 The prior year results have been restated due to the impact of the transition to the new accounting standard IFRS 16 ‘Leases’ as discussed on pages 150-152 as well as other restatements relating to the recording of a provision for property dilapidations and the capitalisation of leakage detection costs, which are discussed on page 152.
40. Contingent liabilitiesAs at 31 March 2020, there were ongoing legal claims arising in the ordinary course of business. At present the Directors consider an outflow of economic benefit is possible, however, cannot be reliably estimated. The outcome is contingent on future developments and will only become known on conclusion of these claims. The outcome could result in an economic outflow.
As at 31 March 2020, there were ongoing commercial negotiations arising in the ordinary course of business in respect of closing out AMP6 contracts. At present the Directors consider an outflow of economic benefit is possible, however, cannot be reliably estimated. The outcome is contingent on future discussions and will only become known on conclusion of the negotiation. The outcome could result in either an economic outflow, inflow or neither.
The Company has also taken the option under paragraph 92 of IAS 37 for non-disclosure of certain information relating to provisions and contingent liabilities in extremely rare cases where this can be expected to seriously prejudice the entity in a dispute.
Financial guaranteesThe Company is part of a Whole Business Securitisation (“WBS”) group as described in note 37. Companies in the WBS group raise debt in external debt markets through the issuance of secured bonds and the issue of loans. All companies in the WBS group guarantee the principal and interest payments due under the terms of the bonds. Where the Company enters into financial guarantee contracts to guarantee the indebtedness of other companies within this group, the Company considers these to be insurance arrangements and accounts for them as such. In this respect, the Company treats the guarantee contract as a contingent liability until such a time as it becomes probable that the Company will be required to make a payment under the guarantee.
41. Off-balance sheet arrangementsThe Company is party to a number of contractual arrangements for the purposes of its principal activities that are not required to be included within the statement of financial position. These are:
• operating leases that do not fall under IFRS 16;
• outsourcing contracts; and
• guarantees.
In respect of outsourcing contracts, the Company has entered into various arrangements to outsource the provision of certain back-office and operational functions with third party providers. These outsourced arrangements include aspects of legal services, metering and capital delivery. These arrangements are on commercial terms and no associated penalty or termination clauses will have a material effect on the financial position of the Company.
The Company is part of a whole business securitisation group. Thames Water Utilities Holdings Limited, Thames Water Utilities Limited and its direct subsidiary are Obligators under the whole business securitisation entered into in 2007. The Obligators have all entered into a Security Trust and Inter-creditor Deed. Under this document each Obligator will guarantee the obligations of each other Obligator with their future cash flows. The guaranteed debt as at 31 March 2020 was £13.1 billion (2019: £11.9 billion).
Thames Water Combined Report 2019/20 206Strategic report Governance Financial statements Annual performance report

Notes to the Company financial statements continued
42. Statement of cash flowsReconciliation of operating profit to operating cash flows
Year ended 31 March
2020Restated1
2019
Underlying £m
BTL £m
Total £m
Underlying £m
BTL £m
Total £m
Profit for the financial year 88.8 58.0 146.8 172.4 44.4 216.8Less investment income – – – (108.9) – (108.9)Less finance income (78.1) – (78.1) (42.0) – (42.0)Add finance expense 438.4 – 438.4 420.2 – 420.2Add interest expense on lease liabilities 3.7 – 3.7 3.9 – 3.9Less gains on financial instruments (108.1) – (108.1) 19.5 – 19.5Add taxation on profit on ordinary activities 169.4 6.1 175.5 6.2 2.8 9.0Operating profit 514.1 64.1 578.2 474.1 47.2 521.3Depreciation on property, plant and equipment
547.6 – 547.6 523.5 – 523.5
Amortisation of intangible assets 32.8 – 32.8 20.3 – 20.3Depreciation of right of use asset 8.2 – 8.2 7.6 – 7.6Loss on sale of property, plant and equipment 4.1 – 4.1 7.0 – 7.0Write off of property, plant and equipment and intangible assets
9.9 – 9.9 – – –
Difference in pension charge and cash contribution
(16.2) – (16.2) 12.8 – 12.8
Decrease in inventory (0.1) – (0.1) 4.6 – 4.6Increase in trade and other receivables (48.6) (60.2) (108.8) 16.5 (48.3) (31.8)Increase in contract assets (17.9) (0.6) (18.5) (30.8) (0.9) (31.7)Increase/(decrease) in trade and other payables
1.4 (0.8) 0.6 72.9 7.6 80.5
Group relief paid (3.8) (4.4) (8.2) – – –Increase in contract liabilities 84.5 (3.1) 81.4 33.6 (0.6) 33.0Decrease in provisions 25.1 – 25.1 (23.7) – (23.7)Net cash generated by operating activities 1,141.1 (5.0) 1,136.1 1,120.1 5.0 1,125.1
Assets transferred from developers and customers for nil consideration were recognised at their fair value.
1 The prior year results have been restated due to the impact of the transition to new accounting standard IFRS 16 ‘Leases’ on 1 April 2019 as discussed on pages150-152 as well as other restatements which are discussed on page 152.
Movement in cash and cash equivalents
Year ended 31 March2020
£m2019
£m
Unrestricted cash movement 296.2 (0.8)Movement in short-term deposits 300.0 53.4Total 596.2 52.6
43. Related party transactionsDetails of transactions with associated companies as required by Ofwat’s regulatory accounting guidelines can be also found under the ‘supply of trade’ disclosure in the Annual Performance Report section on pages 248-250.
Trading transactions
Year ended 31 March
2020 2019
Services provided by
the Group £’000
Services provided to
the Group £’000
Services provided by
the Group £’000
Services provided to
the Group £’000
Intermediaries between the immediate and ultimate parentThames Water Limited 2,385 156 2,011 34Immediate parentThames Water Utilities Holdings Limited 22,019 62,300 24,117 63,800Former subsidiaries1
Thames Water Utilities Cayman Finance Limited – – 924 119,554SubsidiaryThames Water Utilities Finance Plc 8,256 348,009 7,038 324,501Other entities within the Kemble Water Holdings groupKennet Properties Limited 32 – 278 84Thames Water Investments Limited – – 113 –Thames Water Commercial Services Limited 71 7 258 –Thames Water Property Services Limited 295 210 255 360Entities external to the Kemble Water Holdings groupDunelm Energy Limited – 31 – 14Total 33,058 410,713 34,987 508,3471 The Cayman Island entities were liquidated in the year ended 31 March 2019 and are therefore no longer subsidiaries of the Company.
The related party transactions were made on terms equivalent to those that prevail in arm’s length transactions.
Thames Water Combined Report 2019/20 207Strategic report Governance Financial statements Annual performance report

Notes to the Company financial statements continued
43. Related party transactions continuedOutstanding balancesThe following amounts were owed to the Company from related entities, and owed to related entities by the Company at the balance sheet date:
As at 31 March
2020 2019
Amounts owed to the
Company £’000
Amounts)owed by the
Company £’000
Amounts owed to the
Company £’000
Amounts owed by the
Company £’000
Ultimate parentKemble Water Holdings Limited 5 – 5 –Intermediaries between the immediate and ultimate parentKemble Water Finance Limited 1,014 – 1,014 –Thames Water Limited 12 – 12 –Immediate parentThames Water Utilities Holdings Limited 1,752,234 5,800 2,002,034 8,100SubsidiaryThames Water Utilities Finance Plc 290,000 12,685,500 320,326 9,730,700Total 2,043,265 12,691,300 2,323,391 9,738,800
The amounts outstanding are unsecured and will be settled in cash. No guarantees have been given or received. No provisions have been made for doubtful debts in respect of the amounts owed by related parties.
44. Intermediate and ultimate parent Company and controlling party Thames Water Utilities Holdings Limited, a company incorporated in the United Kingdom, is the immediate parent company. Kemble Water Finance Limited, a company incorporated in the United Kingdom, is an intermediate parent company and consolidates these financial statements. The Directors consider that Kemble Water Holdings Limited, a company incorporated in the United Kingdom, is the ultimate and controlling party and the largest group to consolidate these financial statements.
Kemble Water Holdings Limited is owned by 10 shareholders, of which the largest is Ontario Municipal Employees Retirement System (OMERS) with 31.777% holding.
The address of the registered office of Thames Water Utilities Holdings Limited, Kemble Water Finance Limited and Kemble Water Holdings Limited is Clearwater Court, Vastern Road, Reading, Berkshire, RG1 8DB. Copies of the financial statements for all entities may be obtained from the Company Secretary’s Office at this address.
45. Restatements to the prior yearThis is the first reporting year that the Group has presented its financial statements under IFRS 16 ‘Leases’, with the date of transition being 1 April 2019. These accounting policies replace IAS 17 ‘Leases.
The Group’s accounting policies under IFRS 16 have been applied retrospectively at the date of transition and therefore the Group’s “as previously stated” results have been restated. In addition, the Group has also restated the prior years as a result of provision for dilapidation and broadening of accounting policy regarding capitalisation of leakage detection costs. Refer to pages 150-152 for more information on adjustments that have impacted prior years.
Thames Water Combined Report 2019/20 208Strategic report Governance Financial statements Annual performance report

Notes to the Company financial statements continued
45. Restatement to the prior year continuedReconciliation of profit and loss for the year ended 31 March 2019
Note
As previously statedIFRS 16
Transition Other restatements RestatedUnderlying
£mBTL £m
Total £m
Underlying £m
Underlying £m
Underlying £m
BTL £m
Total £m
Revenue 2 2,036.9 47.5 2,084.4 – – 2,036.9 47.5 2,084.4Operating expenses excluding impairment losses on financial and contract assets (1,625.8) – (1,625.8) 3.2 16.9 (1,605.7) – (1,605.7)Impairment losses on financial and contract assets (28.9) (0.3) (29.2) – – (28.9) (0.3) (29.2)Total operating expenses 3 (1,654.7) (0.3) (1,655.0) 3.2 16.9 (1,634.6) (0.3) (1,634.9)Other operating income 2 71.8 – 71.8 – – 71.8 – 71.8Operating profit 454.0 47.2 501.2 3.2 16.9 474.10 47.2 521.30
Investment income 108.9 – 108.9 – – 108.9 – 108.9Finance income 5 42.0 – 42.0 – – 42.0 – 42.0Finance expense 5 (420.2) – (420.2) (3.9) – (424.1) – (424.1)Net gain on financial instruments 6 (19.5) – (19.5) – – (19.5) – (19.5)Profit on ordinary activities before taxation 165.2 47.2 212.4 (0.7) 16.9 181.4 47.2 228.6Taxation on (profit)/loss on ordinary activities 7 (6.2) (2.8) (9.0) 0.1 (2.9) (9.0) (2.8) (11.8)Profit for the period 159.0 44.4 203.4 (0.6) 14.0 172.4 44.4 216.8
Reconciliation of statement of comprehensive income for the year ended 31 March 2019
Note
As previously statedIFRS 16
Transition Other restatements RestatedUnderlying
£mBTL £m
Total £m
Underlying £m
Underlying £m
Underlying £m
BTL £m
Total £m
Profit for the period 159.0 44.4 203.4 (3.5) 16.9 172.4 44.4 216.8
Other comprehensive incomeWill not be reclassified to the income statement:Net actuarial gain on pension schemes 22 (23.4) – (23.4) – – (23.4) – (23.4)Deferred tax on net actuarial (gains) 19 4.3 – 4.3 – – 4.3 – 4.3
May be reclassified to the income statement:Gains on cash flow hedges (8.9) – (8.9) – – (8.9) – (8.9)Cash flow hedges transferred to income statement 34.2 – 34.2 – – 34.2 – 34.2Deferred tax (charge) on cash flow hedges 19 (4.3) – (4.3) – – (4.3) – (4.3)Other comprehensive income for the period 1.9 – 1.9 – – 1.9 – 1.9Total comprehensive income/(loss) for the period 160.9 44.4 205.3 (3.5) 16.9 174.3 44.4 218.7
Thames Water Combined Report 2019/20 209Strategic report Governance Financial statements Annual performance report

Notes to the Company financial statements continued
45. Restatement to the prior year continuedReconciliation of company statement of financial position as at 1 April 2018
Note
IAS 17IFRS 16
Transition Other restatements RestatedUnderlying
£mBTL £m
Total £m
Underlying £m
Underlying £m
Underlying £m
BTL £m
Total £m
Non-current assetsInvestment in subsidiaries 0.1 – 0.1 – – 0.1 – 0.1
Intangible assets 9 168.6 – 168.6 – – 168.6 – 168.6
Property, plant and equipment 10 14,675.3 – 14,675.3 – 11.9 14,687.2 – 14,687.2
Right-of-use assets 11 – – – 54.9 2.9 57.8 – 57.8
Derivative financial assets 18 59.3 – 59.3 – – 59.3 – 59.3
Intercompany loans receivable 12 2,274.7 – 2,274.7 – – 2,274.7 – 2,274.7
Trade and other receivables 14 40.0 56.7 96.7 – – 40.0 56.7 96.7
Pension asset 22 50.6 – 50.6 – – 50.6 – 50.617,268.6 56.7 17,325.3 54.9 14.8 17,338.3 56.7 17,395.0
Current assets
Inventories and current intangible assets 13 18.1 – 18.1 – – 18.1 – 18.1
Intercompany loans receivable 12 17.9 – 17.9 – – 17.9 – 17.9
Contract assets 14 185.8 0.4 186.2 – – 185.8 0.4 186.2
Derivative financial assets 18 – – – – – – – –
Trade and other receivables 14 354.5 5.0 359.5 (1.8) – 352.7 5.0 357.7
Cash and cash equivalents 15 104.4 2.6 107.0 – – 104.4 2.6 107.0680.7 8.0 688.7 (1.8) – 678.9 8.0 686.9
Current liabilities
Contract liabilities 16 (125.3) (4.1) (129.4) – – (125.3) (4.1) (129.4)
Trade and other payables 16 (605.8) (5.1) (610.9) 8.0 – (597.8) (5.1) (602.9)
Borrowings 17 (320.2) – (320.2) – – (320.2) – (320.2)
Lease liabilities 11 – – – (2.8) – (2.8) – (2.8)
Derivative financial liabilities 18 (12.3) – (12.3) – – (12.3) – (12.3)(1,063.6) (9.2) (1,072.8) 5.2 – (1,058.4) (9.2) (1,067.6)
Net current (liabilities)/assets (382.9) (1.2) (384.1) 3.4 – (379.5) (1.2) (380.7)Non-current liabilities
Contract liabilities 16 (589.9) – (589.9) – – (589.9) – (589.9)
Borrowings 17 (11,149.2) – (11,149.2) – – (11,149.2) – (11,149.2)
Lease liabilities 11 – – – (72.5) – (72.5) – (72.5)
Derivative financial liabilities 18 (809.1) – (809.1) – – (809.1)) – (809.1)
Deferred tax 19 (910.5) – (910.5) 2.4 (0.8) (908.9) – (908.9)
Provisions for liabilities and charges 20 (133.1) – (133.1) – (9.8) (142.9) – (142.9)
Pension deficit 22 (300.8) – (300.8) – – (300.8) – (300.8)
Thames Water Combined Report 2019/20 210Strategic report Governance Financial statements Annual performance report

Notes to the Company financial statements continued
45. Restatement to the prior year continuedReconciliation of company statement of financial position as at 1 April 2018
Note
IAS 17IFRS 16
Transition Other restatements RestatedUnderlying
£mBTL £m
Total £m
Underlying £m
Underlying £m
Underlying £m
BTL £m
Total £m
(13,892.6) – (13,892.6) (70.1) (10.6) (13,973.3) – (13,973.3)Net assets 2,993.1 55.5 3,048.6 (11.8) 4.2 2,985.5 55.5 3,041.0
Equity
Called up share capital 29.0 – 29.0 – – 29.0 – 29.0
Share premium 100.0 – 100.0 – – 100.0 – 100.0
Cash flow hedge reserve (138.9) – (138.9) – – (138.9) – (138.9)
Revaluation reserve 1,021.2 – 1,021.2 – – 1,021.2 – 1,021.2
Retained earnings 1,981.8 55.5 2,037.3 (11.8) 4.2 1,974.2 55.5 2,029.7Total equity 2,993.1 55.5 3,048.6 (11.8) 4.2 2,985.5 55.5 3,041.0
Reconciliation of company statement of financial position as at 31 March 2019
Note
IAS 17IFRS 16
Transition Other restatements RestatedUnderlying
£mBTL £m
Total £m
Underlying £m
Underlying £m
Underlying £m
BTL £m
Total £m
Non-current assetsInvestment in subsidiaries 207.8 – 207.8 – – 207.8 – 207.8Intangible assets 9 217.8 – 217.8 – – 217.8 – 217.8Property, plant and equipment 10 15,259.9 – 15,259.9 – 29.5 15,289.4 – 15,289.4Right-of-use assets 11 – – – 51.6 2.6 54.2 – 54.2Derivative financial assets 18 99.0 – 99.0 – – 99.0 – 99.0Intercompany loans receivable 12 2,274.7 – 2,274.7 – – 2,274.7 – 2,274.7Trade and other receivables 14 41.0 101.9 142.9 – – 41.0 101.9 142.9Pension asset 22 45.8 – 45.8 – – 45.8 – 45.8
18,146.0 101.9 18,247.9 51.6 32.1 18,229.7 101.9 18,331.6Current assets Inventories and current intangible assets 13 13.5 – 13.5 – – 13.5 – 13.5Intercompany loans receivable 12 47.6 – 47.6 – – 47.6 – 47.6Contract assets 14 217.0 0.9 217.9 – – 217.0 0.9 217.9Trade and other receivables 14 339.7 8.5 348.2 (1.7) – 338.0 8.5 346.5Cash and cash equivalents 15 152.0 7.6 159.6 – – 152.0 7.6 159.6
769.8 17.0 786.8 (1.7) – 768.1 17.0 785.1Current liabilities
Thames Water Combined Report 2019/20 211Strategic report Governance Financial statements Annual performance report

Notes to the Company financial statements continued
Reconciliation of company statement of financial position as at 31 March 2019
Note
IAS 17IFRS 16
Transition Other restatements RestatedUnderlying
£mBTL £m
Total £m
Underlying £m
Underlying £m
Underlying £m
BTL £m
Total £m
Contract liabilities 16 (110.6) (3.4) (114.0) – – (110.6) (3.4) (114.0)Trade and other payables 16 (675.3) (15.5) (690.8) 7.7 – (667.6) (15.5) (683.1)Borrowings 17 (1,222.6) – (1,222.6) – – (1,222.6) – (1,222.6)Lease liabilities 11 – – – (7.4) – (7.4) – (7.4)Derivative financial liabilities 18 – – – – – – – –
(2,008.5) (18.9) (2,027.4) 0.3 – (2,008.2) (18.9) (2,027.1)Net current (liabilities)/assets (1,238.7) (1.9) (1,240.6) (1.4) – (1,240.1) (1.9) (1,242.0)
Non-current liabilities Contract liabilities 16 (636.1) – (636.1) – – (636.1) – (636.1)Borrowings 17 (10,996.0) – (10,996.0) – – (10,996.0) – (10,996.0)Lease liabilities 11 – – – (65.1) – (65.1) – (65.1)Derivative financial liabilities 18 (817.9) – (817.9) – – (817.9) – (817.9)Deferred tax 19 (915.6) – (915.6) 2.5 (3.7) (916.8) – (916.8)Provisions for liabilities and charges 20 (109.0) – (109.0) – (10.2) (119.2) – (119.2)Pension deficit 22 (338.8) – (338.8) – – (338.8) – (338.8)
(13,813.4) – (13,813.4) (62.6) (13.9) (13,889.9) – (13,889.9)Net assets 3,093.9 100.0 3,193.9 (12.4) 18.2 3,099.7 100.0 3,199.7Equity Called up share capital 29.0 – 29.0 – – 29.0 – 29.0Share premium 100.0 – 100.0 – – 100.0 – 100.0Cash flow hedge reserve (117.9) – (117.9) – – (117.9) – (117.9)Revaluation reserve 989.3 – 989.3 – – 989.3 – 989.3Retained earnings 2,093.5 100.0 2,193.5 (12.4) 18.2 2,099.3 100.0 2,199.3Total equity 3,093.9 100.0 3,193.9 (12.4) 18.2 3,099.7 100.0 3,199.7
45. Restatement to the prior year continued
Thames Water Combined Report 2019/20 212Strategic report Governance Financial statements Annual performance report
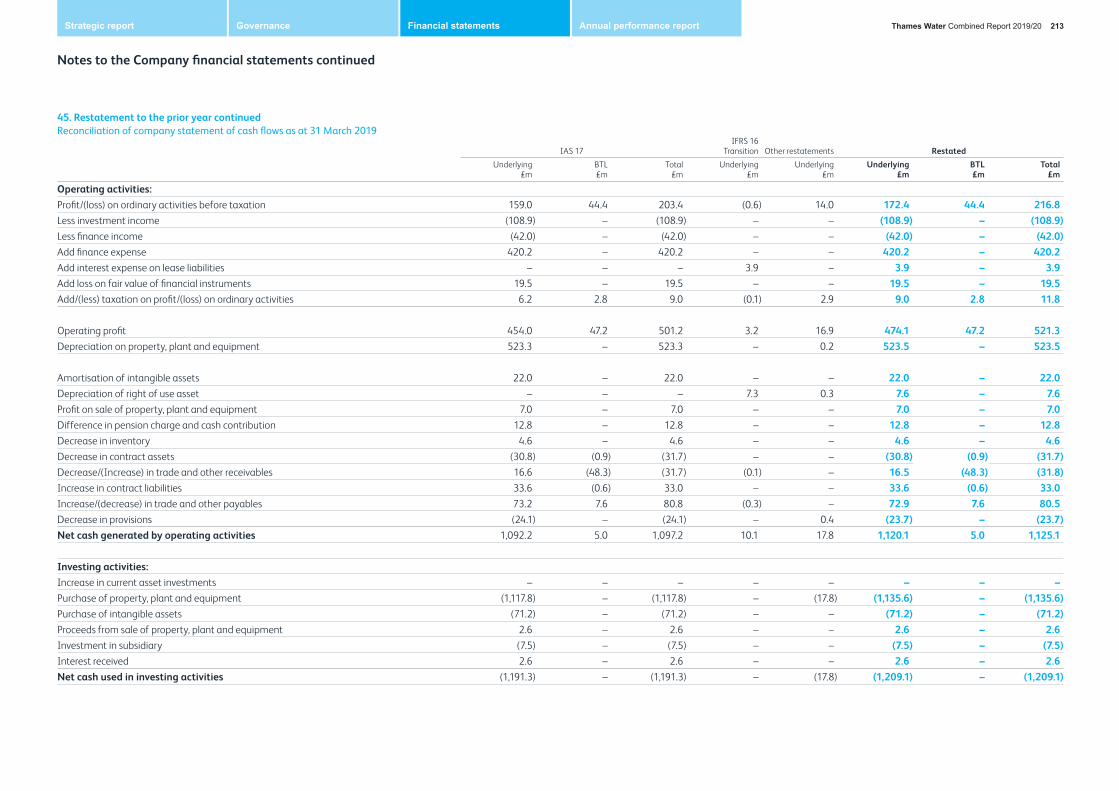
Notes to the Company financial statements continued
45. Restatement to the prior year continuedReconciliation of company statement of cash flows as at 31 March 2019
IAS 17IFRS 16
Transition Other restatements RestatedUnderlying
£mBTL £m
Total £m
Underlying £m
Underlying £m
Underlying £m
BTL £m
Total £m
Operating activities:Profit/(loss) on ordinary activities before taxation 159.0 44.4 203.4 (0.6) 14.0 172.4 44.4 216.8Less investment income (108.9) – (108.9) – – (108.9) – (108.9)Less finance income (42.0) – (42.0) – – (42.0) – (42.0)Add finance expense 420.2 – 420.2 – – 420.2 – 420.2Add interest expense on lease liabilities – – – 3.9 – 3.9 – 3.9Add loss on fair value of financial instruments 19.5 – 19.5 – – 19.5 – 19.5Add/(less) taxation on profit/(loss) on ordinary activities 6.2 2.8 9.0 (0.1) 2.9 9.0 2.8 11.8
Operating profit 454.0 47.2 501.2 3.2 16.9 474.1 47.2 521.3Depreciation on property, plant and equipment 523.3 – 523.3 – 0.2 523.5 – 523.5
Amortisation of intangible assets 22.0 – 22.0 – – 22.0 – 22.0Depreciation of right of use asset – – – 7.3 0.3 7.6 – 7.6Profit on sale of property, plant and equipment 7.0 – 7.0 – – 7.0 – 7.0Difference in pension charge and cash contribution 12.8 – 12.8 – – 12.8 – 12.8Decrease in inventory 4.6 – 4.6 – – 4.6 – 4.6Decrease in contract assets (30.8) (0.9) (31.7) – – (30.8) (0.9) (31.7)Decrease/(Increase) in trade and other receivables 16.6 (48.3) (31.7) (0.1) – 16.5 (48.3) (31.8)Increase in contract liabilities 33.6 (0.6) 33.0 – – 33.6 (0.6) 33.0Increase/(decrease) in trade and other payables 73.2 7.6 80.8 (0.3) – 72.9 7.6 80.5Decrease in provisions (24.1) – (24.1) – 0.4 (23.7) – (23.7)Net cash generated by operating activities 1,092.2 5.0 1,097.2 10.1 17.8 1,120.1 5.0 1,125.1
Investing activities:Increase in current asset investments – – – – – – – –Purchase of property, plant and equipment (1,117.8) – (1,117.8) – (17.8) (1,135.6) – (1,135.6)Purchase of intangible assets (71.2) – (71.2) – – (71.2) – (71.2)Proceeds from sale of property, plant and equipment 2.6 – 2.6 – – 2.6 – 2.6Investment in subsidiary (7.5) – (7.5) – – (7.5) – (7.5)Interest received 2.6 – 2.6 – – 2.6 – 2.6Net cash used in investing activities (1,191.3) – (1,191.3) – (17.8) (1,209.1) – (1,209.1)
Thames Water Combined Report 2019/20 213Strategic report Governance Financial statements Annual performance report

Notes to the Company financial statements continued
45. Restatement to the prior year continuedReconciliation of company statement of cash flows as at 31 March 2019
IAS 17IFRS 16
Transition Other restatements RestatedUnderlying
£mBTL £m
Total £m
Underlying £m
Underlying £m
Underlying £m
BTL £m
Total £m
Financing activities: New loans raised 1,148.8 – 1,148.8 – – 1,148.8 – 1,148.8Repayment of borrowings (653.3) – (653.3) – – (653.3) – (653.3)Repayment of lease principal – – – (10.1) – (10.1) – (10.1)Derivative paydown (13.4) – (13.4) – – (13.4) – (13.4)Interest paid (272.7) – (272.7) – – (272.7) – (272.7)Fees paid (2.7) – (2.7) – – (2.7) – (2.7)Dividends paid (60.0) – (60.0) – – (60.0) – (60.0)Net cash generated by/(used in) financing activities 146.7 – 146.7 (10.1) – 136.6 – 136.6
Net decrease in cash and cash equivalents 47.6 5.0 52.6 – – 47.6 5.0 52.6Net cash and cash equivalents at beginning of period 104.4 2.6 107.0 – – 104.4 2.6 107.0Net cash and cash equivalents at end of period 152.0 7.6 159.6 – – 152.0 7.6 159.6
Thames Water Combined Report 2019/20 214Strategic report Governance Financial statements Annual performance report

The regulatory accounts and additional information which form part of this Annual Performance Report (“APR”) are disclosed on pages 215-259 and are provided to comply with Condition F of the Instrument of Appointment (“licence”) of Thames Water Utilities Limited (the “Company”) as a water and sewerage undertaker under the Water Industry Act 1991. Our licence can be found on the Ofwat website at: https://www.ofwat.gov.uk/wp-content/uploads/2019/01/Thames-Water-Consolidated-Appointment-amended-Jan-2019.pdf.
The regulatory accounts are prepared in accordance with the Regulatory Accounting Guidelines (“RAGs”) issued by Ofwat, which are based on International Financial Reporting Standards (“IFRS”) and International Financial Reporting Interpretations Committee (“IFRIC”) interpretations issued, as ratified by the European Union.
Where different treatments are specified by Ofwat, the Regulatory Accounting Guidelines take precedence.
A glossary of regulatory terms is shown on pages 262-264.
The APR, including the regulatory accounts and additional information, should be read in conjunction with the statutory Annual Report and Financial Statements (“AR&FS”) for the year ended 31 March 2020, which can be found on pages 1 – 214. The AR&FS include disclosures which are relevant to the regulatory accounts including, but not limited to, those made in the:
• Strategic Report for the year ended 31 March 2020 (pages 1-80) which contains information in respect of the Company’s strategy, operational and financial performance and principal risks and uncertainties to which the business is exposed;
• Directors’ Report (pages 127-131), which contains a statement as to the disclosure of information to the independent auditors (page 131);
• Remuneration Committee Report (pages 108-127) which provides a description of the link between Directors’ pay and standards of performance (as required by section 35A of the Water Industry Act 1991 (inserted into that Act by section 50 of the Water Act 2003)). The Remuneration Committee Report also includes reference to rewards and incentives for senior management, including the Executive Team; and
• Corporate Governance report (pages 81-131).
Definitions of appointed and non-appointed businessThe appointed business comprises the regulated activities of the Company as defined in Condition A of its licence of appointment. These are activities necessary in order for a company to fulfil the function and duties of a water and sewerage undertaker under the Water Industry Act 1991.
In addition to its duties as an appointed business, the Company also undertakes certain non-appointed activities. All of these activities are conducted on an arm’s length basis from the appointed business. These activities include third-party discharges to sewage treatment works and other commercial activities, including property searches and cess treatment (treatment of waste from private receptacles not linked to our network). The results of the non-appointed business include payment of charitable donations. These donations are considered to be made out of external shareholder interests and are not funded by customers.
Statement of Directors’ responsibilities for regulatory informationFurther to the requirements of Company law, the Directors are required to prepare accounting statements which comply with the requirements of Condition F of the Instrument of Appointment of the Company as a water and sewerage undertaker under the Water Industry Act 1991 and Regulatory Accounting Guidelines issued by Ofwat.
In addition, the Directors are required to comply with Condition P of the Instrument of Appointment of the Company as a water and sewerage undertaker under the Water Industry Act 1991. The purpose of this condition is to ensure that:
• The Appointed Business is conducted as if it is substantially the Appointee’s sole business and it is a public limited company separate from any other business carried out by the Appointee;
• The Appointee retains sufficient rights and assets and has in place adequate financial resources and facilities, management resources and systems of planning and internal controls;
• Any transfers or transactions entered into by the Appointee do not adversely affect the Appointee’s abiltity to carry out the Regulated Activites; and,
• The Appointee demonstrates that it is complying with the requirements of this Condition.
These responsibilities are additional to those already set out in the statutory accounts. For further details of the additional responsibilities refer to the Ringfencing Certificate on pages 250-252 and the Risk and Compliance Statement on pages 253-259
Condition P: Regulatory ring-fence Paragraph 4.2 of Condition P of the Instrument of Appointment requires that the Company shall at all times ensure, so far as reasonably practicable, that if a special administration order were made in respect of the Company, the Company would have available to it sufficient rights and resources (other than financial resources) to enable the special administrator to manage the affairs, business and property of the Company that the purposes of such an order could be achieved.
In the opinion of the Directors, the Company was in compliance with paragraph 4.2 of Condition P of the Instrument of Appointment throughout the year and to the date of signing of this APR.
Additional information required by the LicenceThe regulatory accounts are separate from the statutory accounts of the Company and have also been prepared on a going concern basis. The regulatory accounts have been prepared in compliance with the followings RAGs:
• RAG 2.07 – Guideline for classification of costs across the price controls;
• RAG 3.11 – Guideline for the format and disclosures for the APR;
• RAG 4.08 – Guideline for the table definitions in the APR; and
• RAG 5.07 – Guideline for transfer pricing in the water and sewerage sectors.
Regulatory accounts and additional information
Thames Water Combined Report 2019/20 215Strategic report Governance Financial statements Annual performance report

Regulatory accounts and additional information continued
Disclosure of information to the auditorThe Directors who held office at the date of approval of this report confirm that:
• so far as they are each aware, there is no relevant audit information of which the Company’s auditor is unaware; and
• each Director has taken all the steps that they ought to have taken as a Director to make themselves aware of any relevant audit information and to establish that the Company’s auditors are aware of the information.
Viability statementThe viability statement can be found on pages 75-78.
Tax strategyThe Company’s aim is to be clear and transparent about its approach to tax and its tax profile. The Company’s tax strategy has five key principles, which are unchanged from the previous year:
• to comply with all tax legislation requirements at all times, both within the letter and spirit of the law;
• to not use tax avoidance schemes or aggressive tax planning;
• to engage fully and transparently with HMRC and other Governmental bodies, and seek to resolve disputes in a co-operative manner;
• to adopt a conservative approach to tax risk management and apply a strong tax governance framework; and
• to accept only a low level of risk in relation to taxation.
You can find more detail on our tax strategy on our website at: https://corporate.thameswater.co.uk/-/media/Site-Content/Thames-Water/Corporate/AboutUs/Investors/Thames-Water-Tax-Strategy.pdf
Cost AssessmentThe Company has chosen to publish the 2019/20 cost assessment tables 4J – 4W, as a separate document to the APR as per RAG 3.11. These tables have been prepared in accordance with the RAGs and are to be read in conjunction with the APR. You can view these tables on our website at: https://corporate.thameswater.co.uk/about-us/our-investors/annual-results
1A. Income statementFor the year ended 31 March 2020This table takes the information from the statutory income statement and shows the adjustments made in order to arrive at the regulatory income statement for the appointed business. The adjustments include both differences between the International Financial Reporting Standards and the Regulatory Accounting Guidelines and the removal of non-appointed income and costs.
Adjustments
Statutory£m
Differences between
statutory and RAG definitions
£mNon-appointed
£m
Total adjustments
£m
Total appointed
activities£m
Revenue 2,172.8 33.0 85.3 (52.3) 2,120.5Operating costs (1,667.0) (15.0) (15.8) 0.8 (1,666.2)Other operating income 72.4 (74.8) 1.5 (76.3) (3.9)Operating profit 578.2 (56.8) 71.0 (127.8) 450.4Other income – 65.2 0.4 64.8 64.8Interest income 78.1 123.1 – 123.1 201.2Interest expense (442.1) (214.4) – (214.4) (656.5)Other interest expense – (6.2) – (6.2) (6.2)Profit before tax and fair value movements 214.2 (89.1) 71.4 (160.5) 53.7Fair value gains on financial instruments 108.1 – – – 108.1Profit before tax 322.3 (89.1) 71.4 (160.5) 161.8UK Corporation tax (5.8) – (5.8) 5.8 –Deferred tax (169.7) – – – (169.7)Profit/(loss) for the year 146.8 (89.1) 65.6 (154.7) (7.9)Dividends (56.5) – (8.6) 8.6 (47.9) Tax Analysis Current year (5.8) – (5.8) 5.8 –Adjustments in respect of prior years – – – – –UK Corporation tax (5.8) – (5.8) 5.8 –
Analysis of non-appointed revenue Non-appointed
Imported sludge –Tankered waste 6.0Other non-appointed revenue 79.3Revenue 85.3Note: signage convention for non-appointed activities follows Ofwat guidance. Total adjustments comprise of the difference between statutory and RAG definitions and exclusion of non-appointed activities.
Regulatory financial reporting
Thames Water Combined Report 2019/20 216Strategic report Governance Financial statements Annual performance report

1A. Income statement continuedExplanation of reconciling items: Adjustments are made to the statutory numbers to ensure compliance with the Ofwat guidance detailed in RAG 3.11 and 4.08. The most significant include:
• Reclassification of current year bad debt from revenue to operating costs (£33.1 million);
• Borrowing costs capitalised within fixed assets in the statutory accounts are recognised as interest expense for regulatory purposes. The associated depreciation of borrowing costs is recognised in operating costs (£97.6 million); and,
• Reclassification of certain costs to align with regulatory presentation requirements.
Full reconciliations of the differences between statutory and regulatory figures are provided on the following pages:
Revenue – page 223
Operating profit, other income, and profit before tax – page 225.
Non-appointed activities include revenue of £64.3 million and operating costs of £0.2 million relating to Bazalgette Tunnel Limited (“BTL”). BTL is an independent company unrelated to Thames Water Utilities Limited, and was appointed in 2015 to construct the Thames Tideway Tunnel.
The arrangement with BTL means that the Company has included construction costs of the Thames Tideway Tunnel within its bills to wastewater customers during the year ended 31 March 2020. As cash is collected, these amounts are subsequently paid to BTL within a maximum of 50 business days under ‘pay when paid’ principle. Accounting standards require the Group to present the amounts billed as revenue in our financial statements, and with an associated cost representing bad debt on amounts billed, this also gives rise to reporting profit which is taxable.
The dividend presented in the non-appointed column is a notional dividend moving the non-appointed profit, excluding profit related to BTL, to the appointed business. This is not an equity dividend and therefore has not been included in the ‘equity dividend’ line in table 1D.
We have adopted IFRS16 Leases during the year which has impacted Operating expenditure (including depreciation), interest expense and profit/(loss). Had we not adopted IFRS16, then these lines of the Income Statement would be as follows:
Appointed total
as above £m
Adjustments to remove effects of
IFRS 16 £m
Adjusted appointed
total£m
Operating costs (1,666.2) (3.5) (1,669.7)Interest expense (656.5) 3.7 (652.8)
Loss for the year (7.9) 0.2 (7.7)Please note, the effects of IFRS16 have been excluded from the tables containing totex numbers in Sections 2 and 4 so that the information contained in these tables provides a consistent measure of totex performance, to allow comparison to the Final Determination for AMP6.
1B. Statement of comprehensive incomeFor the year ended 31 March 2020The statement of comprehensive income shows all of the changes to our statement of financial position reserves from the statutory accounts on page 190, adjusting for the differences between IFRS and the RAGs as well as excluding the results of the non-appointed business.
Statement of comprehensive income
Adjustments
Statutory£m
Differences between
statutory and RAG definitions
£mNon-appointed
£m
Total adjustments
£m
Totalappointed
activities£m
Profit for the year 146.8 (89.1) 65.6 (154.7) (7.9)Actuarial gains/(losses) on post-employment plans 168.4 – – – 168.4Other comprehensive income (1.8) – – – (1.8)Total comprehensive income for the year 313.4 (89.1) 65.6 (154.7) 158.7Note: Signage convention for non-appointed activities follows Ofwat guidance. Total adjustments comprise of the difference between statutory and RAG definitions.
Regulatory financial reporting continued
Thames Water Combined Report 2019/20 217Strategic report Governance Financial statements Annual performance report

1C. Statement of financial positionAs at 31 March 2020Table 1C takes the statement of financial position from the statutory accounts on pages 191-192 and adjusts for the differences between IFRS and RAGs as well as removing the non-appointed business.
Statement of financial position
Adjustments
Statutory£m
Differences between
statutory and RAG definitions
£mNon-appointed
£m
Total adjustments
£m
Totalappointed
activities£m
Non-current assets
Fixed assets 15,915.1 (550.8) 0.7 (551.5) 15,363.6
Intangible assets 273.4 (15.1) 0.0 (15.1) 258.3
Investments – loans to Group companies 2,052.2 0.0 0.0 0.0 2,052.2
Investments – other 432.9 0.0 157.6 (157.6) 275.3
Financial instruments 236.9 (49.0) 0.0 (49.0) 187.9
Retirement benefit assets 94.5 0.0 0.0 0.0 94.5
Total 19,005.0 (614.9) 158.3 (773.2) 18,231.8
Current assets
Inventories 13.6 0.0 0.0 0.0 13.6
Trade & other receivables 648.7 0.0 12.4 (12.4) 636.3
Financial instruments 0.0 0.0 0.0 0.0 0.0
Cash & cash equivalents 1,055.8 0.0 2.6 (2.6) 1,053.2
1,718.1 0.0 15.0 (15.0) 1,703.1
Current liabilities
Trade & other payables (811.7) (69.6) (7.7) (61.9) (873.6)
Capex creditor 0.0 (155.5) 0.0 (155.5) (155.5)
Borrowings (1,887.9) 233.3 0.0 233.3 (1,654.6)
Financial instruments 0.0 0.0 0.0 0.0 0.0
Current tax liabilities 0.0 0.0 0.0 0.0 0.0
Provisions 0.0 (5.3) 0.0 (5.3) (5.3)
(2,699.6) 2.9 (7.7) 10.6 (2,689.0)
Net current assets/(liabilities) (981.5) 2.9 7.3 (4.4) (985.9)
Non-current liabilities
Trade & other payables (702.5) 724.6 0.0 724.6 22.1
Borrowings (11,689.0) (183.0) 0.0 (183.0) (11,872.0)
Financial instruments (702.9) 198.9 0.0 198.9 (504.0)
Retirement benefit obligations (209.1) 0.0 0.0 0.0 (209.1)
Provisions (144.3) 0.0 0.0 0.0 (144.3)
Deferred income – G & C’s 0.0 (511.8) 0.0 (511.8) (511.8)
Regulatory financial reporting continued
Statement of financial position
Adjustments
Statutory£m
Differences between
statutory and RAG definitions
£mNon-appointed
£m
Total adjustments
£m
Totalappointed
activities£m
Deferred income – adopted assets 0.0 (179.7) 0.0 (179.7) (179.7)
Preference share capital 0.0 0.0 0.0 0.0 0.0
Deferred tax (1,119.2) 0.0 0.0 0.0 (1,119.2)
Total non-current liabilities (14,567.0) 49.0 0.0 49.0 (14,518.1)
Net assets/(liabilities) 3,456.5 (563.0) 165.6 (728.6) 2,727.9
Equity
Called up share capital 29.0 0.0 0.0 0.0 29.0
Retained earnings & other reserves 3,427.5 (563.0) 165.6 (728.6) 2,698.9
Total equity 3,456.5 (563.0) 165.6 (728.6) 2,727.9
Note: Signage convention for non-appointed activities follows Ofwat guidance. Total adjustments comprise of the difference between statutory and RAG definitions.
Note: Borrowings include IFRS16 lease liabilities
Explanation of reconciling items: Adjustments are made to the statutory numbers to ensure compliance with the Ofwat guidance detailed in RAG 3.11 and 4.08. The most significant include:
• Capitalised interest for borrowing costs is removed from fixed assets;
• Capital creditors are disclosed separately;
• A reclassification is made from current borrowings to trade and other payables in respect of accrued interest (see below);
• A reclassification is made from financial instruments to non-current borrowings due to derivative financial liabilities (see below); and,
• The non appointed business shows retained earnings of £158.0 million relating to BTL.
We have adopted IFRS16 Leases in the year which has impacted fixed assets, receivables, payables, borrowings and retained earnings. Had we not adopted IFRS16, the these lines in the Statement of Financial Position would be as follows:
Appointed total as
above£m
Adjustments to remove effects
of IFRS 16 £m
Adjusted appointed total
£m
Fixed assets 15,363.6 (52.3) 15,311.3Current trade and other receivables 636.3 1.9 638.2Current trade and other payables (873.6) 7.9 (865.7)Current borrowings (1,654.6) 7.9 (1,646.7)Non-current borrowings (11,872.0) 62.4 (11,809.6)Retained earnings (2,698.9) 14.8 (2,684.1)Please note, the effects of IFRS16 have been excluded from the tables containing totex numbers in Sections 2 and 4 so that the information contained in these tables provides a consistent measure of totex performance, to allow comparison to the Final Determination for AMP6.
Thames Water Combined Report 2019/20 218Strategic report Governance Financial statements Annual performance report

1C. Statement of financial position continuedBorrowings reconciliationPlease see the reconciliation below which outlines the differences between statutory and regulatory definitions of current and non-current borrowings.
Appointed activities
£m
Current liabilities
Current borrowings included in statutory accounts 1,880.0
Difference between statutory and regulatory definitions:.Accrued interest taken to trade and other payables (233.3)
Accretion moved to borrowings from financial instruments –
Current borrowings included in regulatory accounts (per Table 1C) 1,646.7
Non-current liabilities
Non-current borrowings included in statutory accounts: 11,626.6
Difference between statutory and regulatory definitions 213.4
Accretion moved to borrowings from financial instrumentsForeign exchange gains moved to borrowings from financial instruments (30.4)
Non-current borrowings included in regulatory accounts (per Table 1C) 11,809.6
Total borrowings included in statutory accounts 13,506.6
Total borrowings included in regulatory accounts (per Table 1C) 13,456.3
Intercompany loans1 (385.2)
IFRS 16 lease liability 70.3
Total borrowings included in regulatory accounts (per Tables 1C and 1E) 13,141.4
1 Table 1E has been completed under revised Ofwat guidance in 2018/19 and as a result intercompany loans payable to TWUF Plc which do not correspond to external borrowings are excluded. Table 1C continues to be reported on a company only basis.
Please note, the effects of IFRS 16 are classifed separately in the statutory accounts and therefore the statotory amounts disclosed above will not direclty tie to the opening statutory numbers in Table 1C.
Regulatory financial reporting continued
Financial derivatives reconciliationPlease see the reconciliation of financial derivatives below which outlines the differences between regulatory tables 1C Statement of financial position and 4I Financial derivatives.
£m
Per Table 1C:
Non-current assets – financial instruments (187.9)
Current liabilities – financial instruments –
Non-current liabilities – financial instruments 504.0
316.1
Per Table 4I:
Total financial derivatives – mark-to-market 282.7
Accrued interest 33.4
316.1
Thames Water Combined Report 2019/20 219Strategic report Governance Financial statements Annual performance report

1D. Statement of cashflowsFor the year ended 31 March 2020This table takes the information from the statement of cashflows from the statutory accounts on page 194 and adjusts for the differences between IFRS and the RAGs as well as removing the cash flows of the non-appointed business to show the cash flows of our regulated business.
Statement of cash flows
Adjustments
Statutory£m
Differences between statutory and RAG
definitions £m
Non-appointed £m
Total adjustments
£m
Totalappointed
activities£m
Operating profit 578.2 (56.8) 71.0 (127.8) 450.4
Other income – 65.2 0.4 64.8 64.8
Depreciation 588.6 (5.5) 0.2 (5.7) 582.9
Amortisation – G&C’s – – – – –
Changes in working capital (45.5) (2.9) (66.5) 63.6 18.1
Pension contributions (16.2) 6.2 – 6.2 (10.0)
Movement in provisions 25.1 – – – 25.1
Loss on sale of/write off of fixed assets 14.0 – (1.5) 1.5 15.5
Cash generated from operations 1,144.2 6.2 3.6 2.6 1,146.7
Net interest paid (222.1) (103.8) – (103.8) (325.9)
Tax paid (group relief) 1 (8.2) – – – (8.2)
Net cash generated from operating activities 913.9 (97.6) 3.6 (101.2) 812.7
Investing activities
Capital expenditure (1,224.0) 97.6 – 97.6 (1,126.4)
Grants & Contributions – – – – –
Disposal of fixed assets – – – – –
Other (300.0) – – – (300.0)
Net cash used in investing activities (1,524.0) 97.6 – 97.6 (1,426.4)
Net cash generated before financing activities (610.1) – 3.6 (3.6) (613.7)
Cash flows from financing activities
Equity dividends paid (56.5) – (8.6) 8.6 (47.9)
Net loans received 1,262.8 – – – 1,262.8
Regulatory financial reporting continued
Statement of cash flows
Adjustments
Statutory£m
Differences between statutory and RAG
definitions £m
Non-appointed £m
Total adjustments
£m
Totalappointed
activities£m
Cash inflow from equity financing – – – – –
Net cash generated from financing activities 1,206.3 – (8.6) 8.6 1,214.9
Increase/(decrease) in net cash 596.2 – (5.0) 5.0 601.2
1 The tax paid during the year represents a payment for group relief
Explanation of reconciling items: • the cash flow has been prepared to align with the regulatory reporting format. As a result the net cash
position by activity (operating, investing and financing) does not agree to what has been presented in the statutory statement of cash flows.
• the difference is primarily due to the classification of all interest related balances including amounts capitalised in the statutory statement of financial position to the ‘Net interest paid’ category and interest costs relating to pensions.
• the movement in non-appointed working capital relates to cash paid over to BTL.
Thames Water Combined Report 2019/20 220Strategic report Governance Financial statements Annual performance report

1E. Net debt analysisAs at 31 March 2020Table 1E provides further breakdown of our borrowings and net debt (total borrowings less cash and cash equivalents) position at year end. For further information on how our gearing (debt to RCV) impacts our business, please see our financial flows metrics opposite.
Interest rate risk profile
Fixed rate** £m
Floating rate £m
Index linked £m
Total £m
Borrowings (excluding preference shares)* 4,113.1 1,483.2 7,545.1 13,141.4Preference share capital – – – –Total borrowings – – – 13,141.4Cash – – – (5.9)Short term deposits – – – (1,047.3)Net debt – – – 12,088.2
Gearing – – – 82.07%Adjusted Gearing – – – 82.30%
Full year equivalent nominal interest cost 220.6 25.7 290.2 536.5Full year equivalent cash interest payment 220.6 25.7 91.4 337.7Indicative interest ratesIndicative weighted average nominal interest rate 5.32% 1.73% 3.84% 4.07%Indicative weighted average cash interest rate 5.32% 1.73% 1.21% 2.56%Weighted average years to maturity*** 11.8 (3.9) 18.1 13.6
Please note the above table includes amounts relating to leases which are now being reported in the statement of financial position following the adoption of IFRS16 Leases during the year.
(*) Borrowings include all debt relevant to TWUL as the regulated company, even where this has been borrowed externally by its financing subsidiary, Thames Water Utilities Finance plc, and on lent to TWUL. TWUL has a total intercompany payable of £385.2m which does not correspond to an external borrowing and is therefore excluded from the table.
(**) Instruments which change from fixed to floating during their life have been classified according to their interest rate characteristics as at 31 March 2020.
(***) The standard methodology used to calculate weighted average maturities and interest rates results in outputs that are not meaningful when including negative principal figures. This is the case for TWUL given that it has both fixed and floating payments and receipts and is particularly evident for the average weighted maturity of floating rate debt, which produces a negative result. No adjustments have been made to modify this calculation basis.
1F. Financial Flows MetricsThe tables opposite and below show the various components of actual returns achieved for each financial year and the average for the past five years. The actual return has been benchmarked against the allowed return permitted under the regulatory regime. Commentary on the actual returns is contained in the Chief Financial Officer’s statement on pages 63 to 64.
For the year ended 31 March 20202019/20
% £m 2012/13 real
Notional returns and
notional regulatory
equity
Actual returns and
notional regulatory
activity
Actual returns
and actual regulatory
activity
Notional returns and
notional regulatory
equity
Actual returns and
notional regulatory
activity
Actual returns
and actual regulatory
activity
Return on regulatory equity 5.60% 2.69% 5.60% 257.98 123.96 123.96Actual performance adjust-ment 2010-15 (0.01)% 0.00% (0.01)% (0.46) (0.22) (0.22)Adjusted Return on regulatory equity 5.59% 2.69% 5.59% 257.52 123.74 123.74Regulatory equity (£m, 2012/13 real) 4,606.79 4,606.79 2,213.61 – – –
Financing Gearing 0.00% 3.25% 3.25% 0.00 72.02 72.02Variance in corporation tax1 0.00% 0.04% 0.09% 0.00 2.00 2.00Group relief 0.00% (0.04)% (0.09)% 0.00 (2.00) (2.00)Cost of debt 0.00% 2.06% 5.63% 0.00 95.04 124.66Hedging instruments 0.00% (0.49)% (1.35)% 0.00 (22.70) (29.77)Financing total 5.59% 7.51% 13.13% 257.52 268.10 290.65
Operational performance Totex out/(under) perfor-mance 0.00% (3.07)% (6.38)% 0.00 (141.29) (141.29)ODI out/(under) performance2 0.00% (0.47)% (0.98)% 0.00 (21.74) (21.74)Retail out/(under) perfor-mance 0.00% (1.08)% (2.24)% 0.00 (49.53) (49.53)Other exceptional items3 0.00% (0.22)% (0.45)% 0.00 (9.94) (9.94)Operational performance total 0.00% (4.83)% (10.05)% 0.00 (222.50) (222.50)
Total earnings 5.59% 2.68% 3.08% 257.52 45.60 68.15RCV growth from RPI inflation 2.59% 2.59% 2.59% 119.26 119.26 57.30Total shareholder return 8.18% 5.27% 5.67% 376.78 164.86 125.45Net dividend 4.00% 0.47% 0.98% 184.27 21.75 21.75Retained value 4.18% 4.80% 4.68% 192.51 143.11 103.70
Dividends reconciliationGross dividend 4.00% 0.87% 1.82% 184.27 40.29 40.29Interest received on inter-company loans4 0.00% 0.40% 0.84% 0.00 18.54 18.54Net dividend 4.00% 0.47% 0.98% 184.27 21.75 21.751 As disclosed in the regulatory accounts, the appointed business is sharing tax losses worth £2.0m (£10.2m at 19%) with the non-
appointed business, for which no payment is made as both are within the same company.2 ODIs that reflect performance for the AMP as a whole (in particular, for Counters Creek) have been treated similar to the SIM
incentive and adjusted to reflect the nature of the penalty by spreading the cost over 5 years.3 Other exceptional items for 2018/19 reflects the impact of having previously sold our non household retail business. As such the
business no longer recovers the corresponding retail margin that was awarded in the final determination.4 Interest received on intercompany loans relates to the interest on the loan due from its parent company, Thames Water Utilities
Holdings Limited.
Regulatory financial reporting continued
Thames Water Combined Report 2019/20 221Strategic report Governance Financial statements Annual performance report

1F. Financial Flows Metrics continuedAverage for AMP 6
Average 2015-2020
% £m 2012/13 real
Notional returns and
notional regulatory
equity
Actual returns and
notional regulatory
activity
Actual returns
and actual regulatory
activity
Notional returns and
notional regulatory
equity
Actual returns and
notional regulatory
activity
Actual returns
and actual regulatory
activity
Return on regulatory equity 5.61% 2.63% 5.61% 249.35 116.75 116.75Actual performance adjust-ment 2010-15 0.00% 0.00% 0.00% 0.14 0.06 0.06Adjusted Return on regulatory equity 5.61% 2.63% 5.61% 249.49 116.81 116.81Regulatory equity (£m, 2012/13 real) 4,444.55 4,444.55 2,080.93
FinancingGearing 0.00% 3.45% 3.45% 0.00 71.80 71.80Variance in corporation tax 0.00% (0.37)% (0.80)% 0.00 (16.66) (16.66)Group relief 0.00% 0.25% 0.53% 0.00 10.96 10.96Cost of debt 0.00% 1.41% 3.99% 0.00 62.82 83.00Hedging instruments 0.00% (0.30)% (0.84)% 0.00 (13.29) (17.55)Financing total 5.61% 7.06% 11.94% 249.49 232.44 248.36
Operational performanceTotex out / (under) perfor-mance 0.00% (1.88)% (4.01)% 0.00 (83.52) (83.52)ODI out / (under) performance 0.00% (1.50)% (3.20% 0.00 (66.57) (66.57)Retail out / (under) perfor-mance 0.00% (0.68)% (1.45)% 0.00 (30.19) (30.19)Other exceptional items1 0.00% 0.23% 0.48% 0.00 10.07 10.07Operational performance total 0.00% (3.83)% (8.18)% 0.00 (170.21) (170.21)Total earnings 5.61% 3.24% 3.76% 249.49 62.23 78.15RCV growth from RPI inflation 2.52% 2.52% 2.52% 112.06 112.06 52.47Total shareholder return 8.13% 5.76% 6.28% 361.55 174.29 130.62Net dividend 4.00% 0.87% 1.86% 177.78 38.64 38.64Retained value 4.13% 4.89% 4.42% 183.77 135.65 91.98
Dividends reconciliationGross dividend 4.00% 1.29% 2.75% 177.78 57.18 57.18Interest received on inter-company loans2 0.00% 0.42% 0.89% 0.00 18.54 18.54Net dividend 4.00% 0.87% 1.86% 177.78 38.64 38.641 Other exceptional items for 2018/19 reflects the impact of having previously sold our non household retail business. As such the
business no longer recovers the corresponding retail margin that was awarded in the final determination.2 Interest received on intercompany loans relates to the interest on the loan due from its parent company, Thames Water Utilities
Holdings Limited.
Accounting policies for historical cost and current cost accountsThe regulatory accounts have been prepared in accordance with IFRS and the accounting policies detailed on pages 215 – 264, except for the areas required to differ by Ofwat as detailed in the RAGs. These areas with differing regulatory treatment, such as revenue recognition, capitalisation of interest and grants and contributons, are discussed further below. In addition, the effects of IFRS 16 have been excluded from the tables containing totex numbers in Sections 2 and 4 so that the information contained in these tables provides a consistent measure of totex performance, to allow comparison to the Final Determination for AMP6.
The policies applied in these regulatory accounts are based on IFRS and IFRIC interpretations issued and effective and ratified by the European Union as at 29 June 2020, the date that the Board of Directors approved the statements, except for:
• revenue recognition (IFRS 15) (in relation to bad debts) see revenue recognition policy; and,
• capitalisation of borrowing costs (IAS 23).
These exceptions result from compliance with RAGs 3.11 and 4.08 and any subsequent information notices published by Ofwat relating to the year ended 31 March 2020.
Note: IFRS 16 leases was adopted during the year. As a result, our financial performace includes the effects of this new standard. In order to ensure that the totex view for 2019/20 is presented in a manner consistent with previous year, as set out in IN20/03 published in April 2019, we have presented a reconciliation of 2019/20 financial performance in Section 1 to provide a view of performance, had IFRS16 not been adopted. All totex related tables in Sections 2 and 4 therefore exclude the effects of IFRS 16.
Basis of preparationIn accordance with Condition F of the Instrument of Appointment, these regulatory accounts set out on pages 215-264 have been prepared in order to show separately, in respect of the appointed business, non-appointed business and total business, an income statement, a statement of comprehensive income, a statement of financial position, a statement of cash flows, net debt analysis and financial flows on the going concern basis, under the historical cost convention, as modified by the revaluation of certain financial assets and liabilities at fair value.
Price control segmentsThe regulatory accounts have been prepared in accordance with RAG 2.07 for classification of costs across the price controls. Price control segments for 2019/20 are:
Retail Household: provides certain customer-facing activities including billing and revenue collection for household customers;
Retail Non-Household: provides a small number of customer-facing activities for non-household customers (see overleaf);
Water:
responsible for all aspects of raw water abstraction and treatment as well as the distribution of high quality drinking water to household and non-household customers;
Wastewater: responsible for all aspects of wastewater collection, treatment and safe disposal; and
Thames Tideway Tunnel: responsible for the construction of interface works to the Thames Tideway Tunnel.
Accounting policiesRegulatory financial reporting continued
Thames Water Combined Report 2019/20 222Strategic report Governance Financial statements Annual performance report

Transfer of non-household retail customers to Castle WaterOn 1 April 2017, the Company transferred its non-household customers to Castle Water Limited, and ceased to act as a retailer for non-household customers, however the Company continues to recognise wholesale revenue from these customers via third-party non-household retailers. The responsibility of billing and revenue collection from retailers lies with our Customer Experience team.
The Company no longer has a licence to operate in the retail non-household market, however, there are a small number of non-household activities which continue to be allocated to the retail non-household price control in accordance with RAG 2.07. These amounts relate to activities which are performed by developer services.
Basis of attribution and allocation to price controlFinancial information within the Company’s finance system (SAP) is recorded by expenditure type within specific cost centres. Where possible, operating costs are attributed at the lowest level within the cost centre hierarchy i.e. the relevant process level appropriate to the type of cost and accounting separation unit. However, certain costs are recorded at a higher level in the cost centre hierarchy where they do not specifically relate to a process or if the cost is a support related cost.
In 2015 Thames Water implemented Anaplan, a cloud based business modelling and planning application, as a tool with which to produce the operating expenditure component of our APR. SAP remains the primary financial accounting and management tool used by the business and is the source of the data used in Anaplan.
Where possible, capital expenditure and associated depreciation are directly attributed to one of the price controls. Where this is not possible, as an asset is used by more than one of the price controls, the capital expenditure and depreciation are reported in the price control where the service of principal use occurs with a recharge for use, equivalent to depreciation, being made to the other price controls reflecting the proportion of the asset used by them.
MethodologyThe Company has produced an Accounting Methodology Statement in respect of total expenditure. This separate statement has been published and is available on our website at https://corporate.thameswater.co.uk/about-us/our-investors/annual-results.
This methodology statement details the assumptions used in the allocation of costs into the relevant price control and upstream service units in accordance with RAG 4.08, and also includes a summary of the fixed asset allocation to price control.
Revenue recognitionRevenue represents income receivable from regulated water and wastewater activities. For regulatory reporting purposes, Ofwat require a deviation from IFRS 15 whereby revenue for amounts billed and deemed uncollectable in the current year are recognised within operating costs in the APR (instead of a direct reduction to revenue as required by IFRS15). The difference between the amount recorded as revenue in the statutory accounts and the amount recorded as revenue in the regulatory accounts was £33.1 million for the year ended 31 March 2020, as shown on the right.
The differences between the statutory accounts and the regulatory accounts can be summarised as follows (Table 1A):
Appointed Revenue £m
Statutory Revenue 2,172.8Bad debt reclassified to Opex 33.1Reclassification of sludge cake sales to Opex (0.9)Reclassification of Grants & Contributions to other income (1.6)Reclassification of third party revenue 2.5Non appointed income (85.3)Other (0.1)Appointed revenue 2,120.5
Revenue includes an estimate of the amount of water and wastewater charges unbilled at the year end. This accrual is estimated using a defined methodology based on a measure of unbilled water consumed by tariff, calculated from historical billing information. This methodology has been updated to accommodate the introduction of our new billing system during the year.
Occupied Household properties policyAn occupier is any person who owns a premises or who has agreed with the Company to pay water and sewerage services in respect of the premises. No bills are raised in the name of “the occupier”, other than in the circumstances outlined in the ‘Unoccupied properties policy’ section below. The property management process is followed to identify whether the property is occupied or not.
The property management process consists of the following:
• mailings;
• customer contacts;
• meter reading for metered properties;
• land registry checks; and,
• credit reference agency data.
Unoccupied household properties policyRevenue is not recognised in respect of unoccupied properties. Properties are classified as unoccupied when:
• a new property has been connected but is empty and unfurnished;
• the Company has been informed that the customer has left the property;
• it is unfurnished and not expected to be reoccupied immediately;
• it has been disconnected following a customer request;
• the identity of the customer is unknown; or
• the Company has been informed that the customer is in a care home, in long term hospitalisation, in prison or overseas long-term.
Accounting policies continued
Thames Water Combined Report 2019/20 223Strategic report Governance Financial statements Annual performance report

The Company only raises bills in the name of the “occupier” when it has evidence that a property is occupied but cannot confirm the name of the occupier. When the Company identifies the occupant, the bill is cancelled and re-billed in the customer’s name. If the Company has not identified an occupant within six months the bill is cancelled and the property is classified as empty.
When a property is classified as empty, a defined process is followed to verify when the property becomes occupied and/or obtain the name of the customer in order to initiate billing. The residency confirmation process comprises a number of steps which include using external and internal information for desk-top research to confirm the property status (occupied/empty) and, where possible, to identify the occupier name.
The property will only cease to be classified as empty when a named customer is identified and billed. The Company does not recognise income in respect of empty properties. If the Company has turned off the supply of water at the mains to a property at a customer’s request then water supply charges are not payable.
A customer may request the supply to be turned off in instances such as the property is to be demolished or where a house previously converted into flats (and additional supplies made) is to be converted back into a house.
If the occupier name is not obtained at this point, the property will remain classified as empty and the residency confirmation process will be re-started after one to six months. If these steps confirm that a property appears to be empty then the supply may be turned off.
The following activities are undertaken to ensure properties classified as empty are in fact not occupied:
• where the customer has left a property and it is expected to be occupied by someone else, a welcome letter is sent to the property explaining to the occupier how to register as the new account holder;
• where there is no response to the welcome letter within two months a further letter is sent to the property explaining that the property has been classified as void and may be scheduled for disconnection as a result;
• meter readings are taken for metered unoccupied properties and where consumption is recorded a letter is sent to the property; and
• inspections are organised throughout the year to check for occupancy status.
New household propertiesAll new properties are metered. Charges accrue from the date at which the meter is installed. The developer is billed between the date of connection and first occupancy and this is recognised as revenue. If the developer is no longer responsible for the property and no new occupier has been identified, the property management process referred to above is followed to identify the new occupier. Until the new occupier has been identified the property is treated as unoccupied and is not billed.
Household Disconnections policyPremises listed in Schedule 4A of the Water Industry Act 1991 (e.g. any dwelling occupied by a person as his or her only or principal home) cannot be disconnected for non-payment of charges. However, the following provisions do apply in respect of any disconnections:
• if the water supply to any premises is disconnected for any reason, but we continue to provide sewerage services to those premises, the customer will be charged the appropriate Sewerage Unmeasured Tariff unless it can be demonstrated that the premises will be unoccupied for the period that the premises are disconnected, in which case there is no charge. Revenue is recognised for sewerage services up to the point we are aware the property becomes unoccupied;
• if it is found subsequently that the premises were occupied for any period when we were advised that the premises would be unoccupied, the appropriate Sewerage Unmeasured Tariff will then apply to that period, appropriate retrospective bills are raised and revenue recognised at that point.; and
• in the event that we suspect that a property is occupied but we have no record of the occupier, we take steps to establish the identity of the occupier in order that billing can commence and revenue be recognised. Occupier is defined to include any person who owns premises as set out in the ‘Occupied properties policy’ above and also any person who has agreed with us to pay water supply and/or sewerage charges in respect of any premises (e.g. a Bulk Meter Agreement).
Retrospective review of household measured income accrualAppointed income for the year ended 31 March 2019 included a measured income accrual of £146.8m. The value of billing subsequently recognised in the year ended 31 March 2020, for consumption in the prior year was £144.0m. This has resulted in a reduction in the current year’s revenue due to the over-estimation of the prior year’s measured income accrual as detailed below:
Metered accrual at 31 March 2019March 2019
£m
Base accrual 146.2Less billing estimate –
146.2Additional accruals
– Sales max accrual –– New accounts accrual 0.6– Additional new accounts accrual re. internal metering –– Accrual for PWQ150 cancellations currently under investigation
Total metered accrual at 31 March 2019 146.8
Subsequent “unwind” of accrual Subsequent billing: matched & unwound 137.0Still in base accrual and not unwound 7.7Billing for prior years where accrual was in legacy system (8.0)Additional subsequent billing, including property movements 7.3 Comparative subsequent billing and accrual still carried forward 144.0 Net unwind 2.7Note: Numbers may not add due to rounding
Accounting policies continued
Thames Water Combined Report 2019/20 224Strategic report Governance Financial statements Annual performance report

Operating profit, Other income and Profit before taxOperating Profit: £m
Statutory operating profit 578.2Reclassification of Grant & Contributions to other income (61.0)Reclassification of third party revenue (0.8)Capitalised borrowings depreciation 5.5Reclassification of rental income to other income (3.3)Non-appointed (71.0)Other 2.8Regulatory operating profit 450.4
Other income: £m
Statutory other income –Reclassification of Grants & Contributions to other income 61.0Reclassification of third party revenue 0.8Reclassification of rental income to other income 3.3Non appointed income (0.4)Other 0.1Appointed other income 64.8 Profit before tax: £m
Statutory profit before tax 322.3Non-appointed (71.4)Capitalised borrowings (92.1)Other 3.0Regulatory profit before tax 161.8
Capitalisation policyProperty, plant and equipmentThe regulatory accounts policy on Property, Plant and Equipment (“PP&E”) follows the statutory accounting policies with the exception of borrowing costs. In the statutory accounts, borrowing costs directly attributable to the acquisition, construction or production of a qualifying asset that necessarily takes a substantial period of time to get ready for its intended use or sale are capitalised as part of the cost of the associated asset. All other borrowing costs are included as finance expenses within the income statement. For regulatory reporting purposes borrowing costs may not be capitalised. The regulatory approach, which differs from IAS 23, results in an additional £97.6 million being recognised in interest expense in the regulatory accounts for 2019/20. This amount has been capitalised in the statutory accounts.
Financial instruments and hedgingRegulatory fair value measurementFor statutory reporting the Company measures financial instruments, such as derivatives, at fair value at each financial reporting date. Fair value is the price that would be received in selling an asset or paid to transfer a liability in an orderly transaction between market participants at the measurement date. The fair value reflects the non-performance risk. There are certain reclassifications for financial instruments, between the statutory accounts and the regulatory accounts per Ofwat guidance; these are shown in the borrowings and financial instruments reconciliations shown on page 219.
TaxationTax on the profit or loss for the period comprises current and deferred tax. Tax is recognised in the income statement except to the extent that it relates to items recognised directly within equity, in which case it is recognised within the statement of other comprehensive income.
Current taxCurrent tax is the expected tax payable or receivable on the taxable income or loss for the period, using tax rates enacted or substantively enacted at the balance sheet date, and any adjustments to tax payable in respect of previous periods.
Taxable profit differs from the profit on ordinary activities before tax as reported in the income statement because it excludes items of income or expense that are taxable or deductible in other periods. This includes the effect of tax allowances and further excludes items that are never taxable or deductible.
Deferred taxDeferred tax is the tax expected to be payable or recoverable on differences between the carrying amounts of assets and liabilities in the financial statements and the corresponding tax bases used in the computation of taxable profit, and is accounted for using the balance sheet liability method. Deferred tax is measured on a non-discounted basis using tax rates enacted or substantively enacted at the balance sheet date and that are expected to apply in the period when the deferred tax asset is realised or the deferred tax liability is settled.
Deferred tax liabilities are generally recognised for all taxable temporary differences and deferred tax assets are recognised only to the extent that it is probable that sufficient future taxable profits will be available against which deductible temporary differences can be utilised.
Deferred tax assets and deferred tax liabilities are offset when there is a legally enforceable right to set off tax assets against tax liabilities and when they relate to income taxes levied by the same taxation authority and the Group intends to settle its current tax assets and liabilities on a net basis.
Current tax reconciliationTax charged in the income statement
Statutory £m
Non-appointed
£m
Appointed activities
£m
UK Corporation tax charge 5.8 5.8 –Deferred tax charge 169.7 – 169.7Tax charge on profit on ordinary activities 175.5 5.8 169.7
Accounting policies continued
Thames Water Combined Report 2019/20 225Strategic report Governance Financial statements Annual performance report
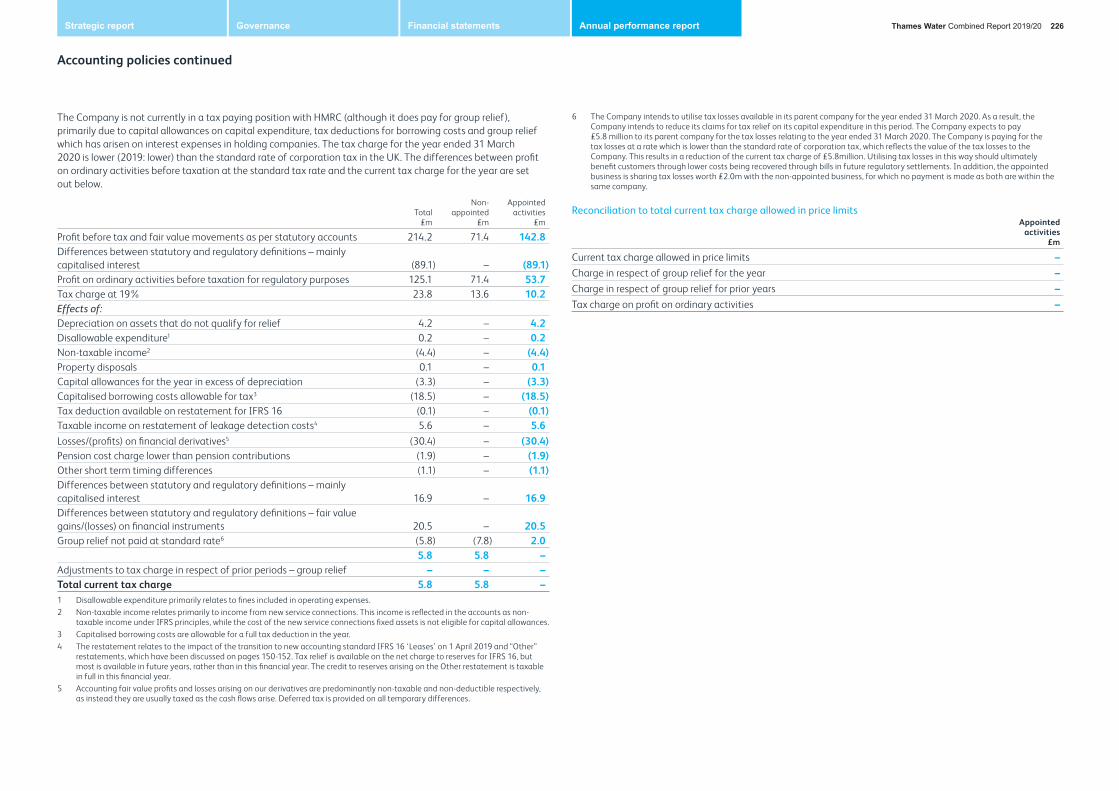
The Company is not currently in a tax paying position with HMRC (although it does pay for group relief), primarily due to capital allowances on capital expenditure, tax deductions for borrowing costs and group relief which has arisen on interest expenses in holding companies. The tax charge for the year ended 31 March 2020 is lower (2019: lower) than the standard rate of corporation tax in the UK. The differences between profit on ordinary activities before taxation at the standard tax rate and the current tax charge for the year are set out below.
Total £m
Non-appointed
£m
Appointed activities
£m
Profit before tax and fair value movements as per statutory accounts 214.2 71.4 142.8Differences between statutory and regulatory definitions – mainly capitalised interest (89.1) – (89.1)Profit on ordinary activities before taxation for regulatory purposes 125.1 71.4 53.7Tax charge at 19% 23.8 13.6 10.2Effects of:Depreciation on assets that do not qualify for relief 4.2 – 4.2Disallowable expenditure1 0.2 – 0.2Non-taxable income2 (4.4) – (4.4)Property disposals 0.1 – 0.1Capital allowances for the year in excess of depreciation (3.3) – (3.3)Capitalised borrowing costs allowable for tax3 (18.5) – (18.5)Tax deduction available on restatement for IFRS 16 (0.1) – (0.1)Taxable income on restatement of leakage detection costs4 5.6 – 5.6Losses/(profits) on financial derivatives5 (30.4) – (30.4)Pension cost charge lower than pension contributions (1.9) – (1.9)Other short term timing differences (1.1) – (1.1)Differences between statutory and regulatory definitions – mainly capitalised interest 16.9 – 16.9Differences between statutory and regulatory definitions – fair value gains/(losses) on financial instruments 20.5 – 20.5 Group relief not paid at standard rate6 (5.8) (7.8) 2.0
5.8 5.8 –Adjustments to tax charge in respect of prior periods – group relief – – –Total current tax charge 5.8 5.8 –1 Disallowable expenditure primarily relates to fines included in operating expenses.2 Non-taxable income relates primarily to income from new service connections. This income is reflected in the accounts as non-
taxable income under IFRS principles, while the cost of the new service connections fixed assets is not eligible for capital allowances.3 Capitalised borrowing costs are allowable for a full tax deduction in the year.4 The restatement relates to the impact of the transition to new accounting standard IFRS 16 ‘Leases’ on 1 April 2019 and “Other”
restatements, which have been discussed on pages 150-152. Tax relief is available on the net charge to reserves for IFRS 16, but most is available in future years, rather than in this financial year. The credit to reserves arising on the Other restatement is taxable in full in this financial year.
5 Accounting fair value profits and losses arising on our derivatives are predominantly non-taxable and non-deductible respectively, as instead they are usually taxed as the cash flows arise. Deferred tax is provided on all temporary differences.
6 The Company intends to utilise tax losses available in its parent company for the year ended 31 March 2020. As a result, the Company intends to reduce its claims for tax relief on its capital expenditure in this period. The Company expects to pay £5.8 million to its parent company for the tax losses relating to the year ended 31 March 2020. The Company is paying for the tax losses at a rate which is lower than the standard rate of corporation tax, which reflects the value of the tax losses to the Company. This results in a reduction of the current tax charge of £5.8million. Utilising tax losses in this way should ultimately benefit customers through lower costs being recovered through bills in future regulatory settlements. In addition, the appointed business is sharing tax losses worth £2.0m with the non-appointed business, for which no payment is made as both are within the same company.
Reconciliation to total current tax charge allowed in price limitsAppointed
activities £m
Current tax charge allowed in price limits –Charge in respect of group relief for the year –Charge in respect of group relief for prior years –Tax charge on profit on ordinary activities –
Accounting policies continued
Thames Water Combined Report 2019/20 226Strategic report Governance Financial statements Annual performance report

2A. Segmental income statementFor the year ended 31 March 2020Please note, the effects of IFRS16 have been excluded from the tables containing totex numbers in Sections 2 and 4 so that the information contained in these tables provides a consistent measure of totex performance, to allow comparison to the Final Determination for AMP6.
The following table provides further information of our appointed business split by the price control units defined by Ofwat.
Retail Wholesale
Household £m
Non-household £m
Water resources
£m
Water network+
£m
Water total
£m
Waste water network+
£mSludge
£m
Waste water total
£mTTT£m
Total £m
Revenue – price control 171.7 1.0 877.9 877.9 985.5 985.5 60.9 2,097.0Revenue – non price control – – 14.7 14.7 8.8 8.8 – 23.5Operating expenditure (204.2) (2.7) (65.2) (408.1) (473.3) (356.6) (57.5) (414.1) – (1,094.3)Depreciation – tangible fixed assets (3.4) – (4.3) (289.5) (293.8) (200.5) (49.3) (249.8) 3.3 (543.7)Depreciation – intangible fixed assets (8.6) – (0.4) (3.9) (4.3) (12.2) (6.5) (18.7) – (31.6)Other operating income (0.2) – (0.1) 0.1 – (0.9) (2.8) (3.7) – (3.9)Operating profit before recharges (44.7) (1.7) 121.2 308.0 64.2 447.0Recharges in respect of 'principal use' assets – – – – – – – – – –Recharges from other segments (2.0) – (0.9) (8.9) (9.8) – – – – (11.8)Recharges to other segments – – – – – 9.1 2.8 11.8 – 11.8Operating profit (46.7) (1.7) 111.4 319.8 64.2 447.0Surface water drainage rebates 1.4
Further information regarding performance by Price Control can be found in table 2C (retail), 4B (wholesale totex) and the Accounting Methodology Statement https://corporate.thameswater.co.uk/about-us/our-investors/annual-results.
Price review and other segmental reporting
Thames Water Combined Report 2019/20 227Strategic report Governance Financial statements Annual performance report

2B. Totex analysis – wholesale water & wastewaterFor the year ended 31 March 2020Please note, the effects of IFRS16 have been excluded from the tables containing totex numbers in Sections 2 and 4 so that the information contained in these tables provides a consistent measure of totex performance, to allow comparison to the Final Determination for AMP6.
This table shows the breakdown of the wholesale Totex expenditure from table 2A into the price control units required to be reported on by Ofwat.
Water resources
£m
Water network+
£m
Waste water
network+ £m
Sludge £m
TTT £m
Total £m
Operating expenditurePower 16.3 49.2 90.4 (27.9) – 128.0Income treated as negative expenditure (0.1) – (3.4) (9.3) – (12.8)Service charges/discharge consents 13.3 (0.1) 5.9 – – 19.1Bulk supply/Bulk discharge 4.8 – 3.0 – – 7.8Other operating expenditure – Renewals expensed in year (Infrastructure) – 73.9 58.1 – – 132.0– Renewals expensed in year (non-infrastructure) – – – – – –– Other operating expenditure excluding renewals 23.6 227.5 174.5 80.6 – 506.2Local authority and Cumulo rates 5.0 53.0 25.7 14.1 – 97.8Total operating expenditure excluding third party services 62.9 403.5 354.2 57.5 – 878.1Third party services 2.3 4.6 2.4 – – 9.3Total operating expenditure 65.2 408.1 356.6 57.5 – 887.4Capital expenditure Maintaining the long-term capability of the assets – infra 4.0 170.8 101.1 0.4 – 276.3Maintaining the long-term capability of the assets – non-infra 4.7 201.5 119.8 48.5 – 374.5Other capital expenditure – infra (0.1) 137.3 61.6 – 15.4 214.2Other capital expenditure – non-infra 18.0 66.2 76.9 2.4 1.2 164.7Infrastructure network reinforcement – 6.1 6.7 – – 12.8Total gross capital expenditure (excluding third party) 26.6 581.9 366.1 51.3 16.6 1,042.5Third party services – 0.7 – – – 0.7Total gross capital expenditure 26.6 582.6 366.1 51.3 16.6 1,043.2Grants and contributions –Grants and contributions – 42.4 30.8 – – 73.2Totex 91.8 948.3 691.9 108.8 16.6 1,857.4Cash expenditure –Pension deficit recovery payments* 1.0 10.7 8.3 2.6 – 22.6Other cash items – – – – – –Totex including cash items 92.8 959.0 700.2 111.4 16.6 1,880.0
Further information regarding performance by Price Control can be found in table 2C (retail), 4B (wholesale totex) and the Accounting Methodology Statement https://corporate.thameswater.co.uk/about-us/our-investors/annual-results
2C. Operating cost analysis – retailFor the year ended 31 March 2020Please note, the effects of IFRS16 have been excluded from the tables containing totex numbers in Sections 2 and 4 so that the information contained in these tables provides a consistent measure of totex performance, to allow comparison to the Final Determination for AMP6.
Table 2C breaks down the the retail operating costs included in table 2A into the cost catagories set out in the RAGs.
Household £m
Non-household
£mTotal
£m
Operating expenditureCustomer services 67.1 – 67.1Debt management 10.4 – 10.4Doubtful debts 72.9 (1.4) 71.5Meter reading 9.1 – 9.1Services to developers – 1.2 1.2Other operating expenditure 44.7 2.9 47.6Total operating expenditure excluding third party services 204.2 2.7 206.9Third party services operating expenditure – – –Total operating expenditure 204.2 2.7 206.9Depreciation – tangible fixed assets 3.4 – 3.4Amortisation – intangible fixed assets 8.6 – 8.6Total operating costs 216.2 2.7 218.9Debt written off 67.2 0.6 67.8
Total operating costs for retail household are £216.2 million in 2019/20. This is £56.2 million higher than the cost to serve as planned in the FD of £160.0 million. During 2019/20 the household retail price control has seen the following variations in costs:
• higher provisions for doubtful debts – an additional £15.3 million booked in respect of Covid-19;
• increase in other operating costs following commissioning of the new customer billing system, including write-off of assets no longer expected to generate future economic benefit following commissioning;
• increased group costs during the year as we invest in our digital capabilities; and
• increase in depreciation and amortisation arising from commissioning of the new billing system.
Following our decision in July 2016 to exit from the competitive non-household retail market from the date of market opening (1 April 2017), the company entered an agreement to transfer ownership of its non-household customers to Castle Water from the date of market opening. The Company continues to incur certain operational costs related to the non-household market as disclosed in table 2C above. These costs have been disclosed within the non-household price control in accordance with Ofwat guidance and relate to the following:
• developer services for the provision of information and administration for new connections;
• increase in doubtful debt provisions for non-household (NHH) legacy debt; and
• general and support expenditure in relation to the above activities.
Price review and other segmental reporting continued
Thames Water Combined Report 2019/20 228Strategic report Governance Financial statements Annual performance report

2D. Historic cost analysis of tangible fixed assets – wholesale water, wholesale waste & retailAs at 31 March 2020Please note, the effects of IFRS16 have been excluded from the tables containing totex numbers in Sections 2 and 4 so that the information contained in these tables provides a consistent measure of totex performance, to allow comparison to the Final Determination for AMP6.
This table shows the changes in the fixed assets of the wholesale and retail activites. Our accounting policies with relation to fixed assets and depreciation are set out in full on page 145
Wholesale
TTT £m
Retail
Water resources
£m
Water network+
£m
Wastewater network+
£mSludge
£mHousehold
£m
Non-household
£mTotal
£m
CostAt 1 April 2019 290.9 9,627.9 7,968.8 1,642.8 1,146.7 94.1 – 20,771.2Disposals (0.2) (0.2) (1.2) (8.6) – – – (10.2)Additions 25.7 602.9 326.6 39.3 16.6 (3.4) – 1,007.7Adjustments 4.6 (46.1) 113.9 (63.3) – (19.9) – (10.8)Assets adopted at nil cost – 16.3 45.1 – – – – 61.4At 31 March 2020 321.0 10,200.8 8,453.2 1,610.2 1,163.3 70.8 – 21,819.3Depreciation At 1 April 2019 (66.7) (2,815.8) (2,343.2) (677.2) (3.3) (66.6) – (5,972.8)Disposals – 0.2 0.8 5.5 – – – 6.5Adjustments 0.4 15.2 (44.9) 26.1 – 5.4 – 2.2Charge for year (4.3) (289.5) (200.5) (49.3) 3.3 (3.4) – (543.7)At 31 March 2020 (70.6) (3,089.9) (2,587.8) (694.9) – (64.6) – (6,507.8)
Net book value at 31 March 2020 250.4 7,110.9 5,865.4 915.3 1,163.3 6.2 – 15,311.5
Net book value at 1 April 2019 224.2 6,812.1 5,625.6 965.6 1,143.4 27.5 – 14,798.4Depreciation charge for year Principal Services (4.3) (289.5) (200.4) (49.3) 3.3 (3.4) (543.6)Third party services – – (0.1) – – – – (0.1)Total (4.3) (289.5) (200.5) (49.3) 3.3 (3.4) – (543.7)* During the year, a review of our expenditure identified that certain leak detection costs in the Water Network+ price control eligible
for capitalisation in prior years had been expensed. As a result, the costs expensed in prior years have been corrected for in the current year. The correction of costs of £30.1 million and associated deprecation of £0.6 million have been processed through the adjustment line.
Price review and other segmental reporting continued
2E. Analysis of capital contributions and land sales – wholesaleFor the year ended 31 March 2020Table 2E shows information about capital contributions made by customers to the cost of assets we construct along with any income received by the sale of land.
Fully recognised
in income statement
£m
Capitalised and amortised
(in income statement)
£m
Fully netted off capex
£mTotal
£m
Grants and contributions – water Connection charges (s45) 18.8 – – 18.8Infrastructure charge receipts (s146) – 5.2 – 5.2Requisitioned mains (s43, s55 & s56) 1.5 – – 1.5Other Contributions (price control) 0.7 0.5 – 1.2Diversions (s185) 3.4 – – 3.4Other Contributions (non-price control) 12.1 0.3 – 12.4Total 36.5 6.0 – 42.4Value of adopted assets 16.0 16.0Grants and contributions – wastewater Infrastructure charge receipts (s146) – 12.9 – 12.9Requisitioned sewers (s100) 1.1 – – 1.1Other Contributions (price control) 1.9 0.8 – 2.7Diversions (s185) 2.7 – – 2.7Other Contributions (non-price control) 11.0 0.4 – 11.4Total 16.7 14.1 – 30.8Value of adopted assets 45.1 45.1Grants and contributions – TTT Infrastructure charge receipts (s146) – – – –Requisitioned sewers (s100) – – – –Other Contributions (price control) – – – –Diversions (s185) – – – –Other Contributions (non-price control) – – – –Total – – – –Value of adopted assets – –
Thames Water Combined Report 2019/20 229Strategic report Governance Financial statements Annual performance report

2E. Analysis of capital contributions and land sales – wholesale continuedWater
£mWastewater
£mTTT £m
Total £m
Movements in capitalised grants and contributions b/f 203.3 298.6 – 502.0Capitalised in year 6.0 14.1 – 20.1Amortisation (in income statement) (2.9) (2.1) – (5.0)c/f 206.4 310.6 – 517.1
Land salesWater
£mWastewater
£mTTT £m
Total £m
Proceeds from disposals of protected land – (0.4) – (0.4)Other Contributions – Non Price Control includes income of £0.4m which was classified for the 2018/19 regulatory accounts within Requisitions Income. The Requisitions Income figure for the 2020/21 Regulatory Accounts has been reduced by this amount. This income was received for odour control works and is thus considered to represent a contribution outside of the relevant price controls.
2F. Household – revenue by customer typeFor the year ended 31 March 2020This table shows an analysis of household retail revenues and customer numbers by customer type.
Wholesale chargesrevenue
£m
Retailrevenue
£m
Total revenue
£m
Number of customers
000s
Average household
retail revenue per customer
£
Unmeasured water only customer 6.3 0.5 6.8 26.9 17.0Unmeasured wastewater customer only 133.6 13.8 147.4 769.2 17.9Unmeasured water & wastewater customer 707.0 59.3 766.3 1,929.2 30.7Measured water only customer 4.5 0.5 5.0 25.9 19.2Measured wastewater only customer 177.3 28.0 205.3 1,208.7 23.1Measured water & wastewater customer 505.6 69.6 575.2 1,562.9 44.6Total 1,534.3 171.7 1,706.0 5,522.8 31.1Note: Number of customers relates specifically to the number of properties that are charged at a specific tariff band rate. Average household retail revenue per customer (column E) is calculated by dividing retail revenue from column B by the number of customers in column D.
Number of customers has been calculated as average number of customers at the start and end of the year.
Price review and other segmental reporting continued
2G. Non-household water – revenue by tariff typeFor the year ended 31 March 2020Table 2G shows an analysis of non-household water revenues and customer numbers by customer type.
Wholesale charges revenue
£m
Retail revenue
£m
Total revenue
£m
Number of connections
000s
Average non-household
retail revenue per connection
£
Default tariffsTB 1: Water – metered – 0-500m3 31.6 – 31.6 66.1 –TB 2: Water – metered – 500-1,000m3 12.8 – 12.8 8.9 –TB 3: Water – metered – 1,000-5,000m3 49.6 – 49.6 12.9 –TB 4: Water – metered – 5,000-20,000m3 40.7 – 40.7 2.8 –TB 5: Water – metered – 20,000-50,000m3 21.1 – 21.1 0.4 –TB 6: Water – metered – 50,000-250,000m3 27.5 – 27.5 0.3 –TB 7: Water – metered – over 250,000m3 8.8 – 8.8 – –TB 22: Water – business assessed – 0-500m3 3.3 – 3.3 13.8 –TB 23: Water – business assessed – 500-1,000m3 1.4 – 1.4 1.1 –TB 24: Water – business assessed – 1,000-5,000m3 1.3 – 1.3 0.3 –TB 25: Water – business assessed – 5,000-20,000m3 0.3 – 0.3 – –TB 30: Water – unmetered 0.8 – 0.8 6.3 –Total default tariffs 199.2 – 199.2 112.9 –
Non-default tariffsTotal non-default tariffs – – – – –Total 199.2 – 199.2 112.9 –
Thames Water Combined Report 2019/20 230Strategic report Governance Financial statements Annual performance report

2G. Non-household water – revenue by tariff type continued
Number of customers
000s
Average non-household
retail revenue per
customer £
Revenue per customer – –Total 112.9 –Note: Number of connections relates specifically to the number of properties that are charged at a specific tariff band rate. Average NHH (non-household) retail revenue per connection (column E) is calculated by dividing retail revenue (column B) by the number of connections (column D) (both before rounding).
Following our decision in July 2016 to exit from the competitive non-household retail market from the date of market opening (1 April 2017), the company entered an agreement to transfer ownership of its non-household customers to Castle Water from the date of market opening. The Company continues to recognise wholesale revenue from these customers.
Please note: we have not completed the average retail revenue per connection columns of tables 2G and 2H, as the retail revenue columns only reflect the movement of the measured income accrual. No retail revenue for non-household customers has been earned for the year ended 31 March 2020, following the Company’s exit from that market in 2017/18.
2H. Non-household wastewater – revenue by tariff typeFor the year ended 31 March 2020Table 2H shows an analysis of non-household wastewater revenues and customer numbers by customer type.
Wholesale chargesrevenue
£m
Retailrevenue
£m
Total revenue
£m
Number of connections
000s
Average non-household
retail revenue per connection
£
Default tariffsTB 8: Meter volume band 0-500m3 39.1 – 39.1 104.1 –TB 9 : Meter volume band 500-1,000m3 12.7 – 12.7 12.8 –TB 10: Meter volume band 1,000-5,000m3 43.4 (0.1) 43.3 17.1 –TB 11: Meter volume band 5,000-20,000m3 32.1 – 32.1 3.5 –TB 12: Meter volume band 20,000-50,000m3 13.8 – 13.8 0.5 –TB 13: Meter volume band 50,000-250,000m2 18.5 – 18.5 0.3 –TB 14: Meter volume band above 250,000m3 4.0 – 4.0 0.1 –TB 15: Trade effluent – metered – 0-500m3 0.3 – 0.3 0.8 –TB 16: Trade effluent – metered – 500m3-1,000m3 0.4 – 0.4 0.4 –TB 17: Trade effluent – metered – 1,000m3-5,000m3 1.7 – 1.7 0.9 –TB 18: Trade effluent – metered – 5,000m3-20,000m3 3.2 – 3.2 0.3 –TB 19: Trade effluent – metered – 20,000m3-50,000m3 3.1 – 3.1 0.1 –TB 20: Trade effluent – metered – 50,000m3-250,000m3 9.0 – 9.0 – –
Price review and other segmental reporting continued
Wholesale chargesrevenue
£m
Retailrevenue
£m
Total revenue
£m
Number of connections
000s
Average non-household
retail revenue per connection
£
TB 21: Trade effluent – metered – over 250,000m3 0.7 – 0.7 – –TB 26: Wastewater – business assessed – 0-500m3 3.7 – 3.7 16.6 –TB 27: Wastewater – business assessed – 500-1,000m3 1.1 – 1.1 1.3 –TB 28: Wastewater – business assessed – 1,000-5,000m3 0.9 – 0.9 0.3 –TB 29: Wastewater – business assessed – 5,000-20,000m3 0.2 – 0.2 – –TB 31: Wastewater – unmetered 2.9 – 2.9 17.2 –Total default tariffs 190.8 (0.1) 190.7 176.3 –Non-default tariffs –Total non-default tariffs – – – – –Total 190.8 (0.1) 190.7 176.3 –
Number of customers
Average non-household
retail revenue per
customer
Revenue by customerTotal 176.3 –Note: Number of connections relates specifically to the number of properties that are charged at a specific tariff band rate. Average NHH (non-household) retail revenue per connection (column E) is calculated by dividing retail revenue (column B) by the number of connections (column D) (both before rounding).
Following our decision in July 2016 to exit from the competitive non-household retail market from the date of market opening (1 April 2017), the company entered an agreement to transfer ownership of its non-household customers to Castle Water from the date of market opening. The Company continues to recognise wholesale revenue from these customers.
Please note: we have not completed the average retail revenue per connection columns of tables 2G and 2H, as the retail revenue columns only reflect the movement of the measured income accrual. No retail revenue for non-household customers has been earned for the year ended 31 March 2020, following the Company’s exit from that market in 2017/18.
Thames Water Combined Report 2019/20 231Strategic report Governance Financial statements Annual performance report

2I. Revenue analysis and wholesale control reconciliationFor the year ended 31 March 2020This table shows the retail price control difference between the actual revenue recovered and the revenue assumed at the final determination.
Household£m
Non-household
£mTotal
£m
Wholesale charge – waterUnmeasured 402.8 7.0 409.8Measured 275.9 192.2 468.1Third party revenue – – – 678.7 199.2 877.9Wholesale charge – wastewaterUnmeasured 418.0 8.1 426.1Measured 387.3 172.0 559.3Third party revenue – – – 805.3 180.1 985.4
Wholesale total (exc. TTT) 1,484.0 379.3 1,863.3 Wholesale charge – TTTUnmeasured 26.1 0.5 26.6Measured 24.2 10.1 34.3Third party revenue – – – 50.3 10.6 60.9
Wholesale total (inc. TTT) 1,534.3 390.0 1,924.2 Retail revenue
Unmeasured 73.5 1.21 74.7Measured 98.2 (0.1) 98.1Other third party revenue – – –Retail total 171.7 1.1 172.8 Third party revenue – non-price controlBulk supplies – water – – 4.6Bulk supplies – wastewater – – 2.1Other third party revenue – – 16.6 Principal services – non-price controlOther appointed revenue – – 0.2Total appointee revenue – – 2,120.5
Price review and other segmental reporting continued
Water£m
Wastewater £m
TTT £m
Total £m
Wholesale revenue governed by price control 877.9 985.4 60.9 1,924.2Grants and contributions2 26.7 16.7 – 43.4Total revenue governed by wholesale price control 904.6 1,002.1 60.9 1,967.6Amount assumed in wholesale determination 954.7 1,031.7 62.3 2,048.7Adjustment for in-period ODI revenue – – – –Adjustment for WRFIM (10.5) (2.1) 0.1 (12.5)Total assumed revenue 944.2 1,029.6 62.4 2,036.2Difference (39.6) (27.5) (1.5) (68.6)1 Represents new income stream, with new application/design fees going live in April 2019. Previously this income stream was
embedded within the overall tariff & thus included within capital income2 Relevant capital contributions as defined in FD.
Comparison of allowed and actual revenue – Wholesale controlWholesale revenue for 2019/20 of £1,967.6m is £68.6m (3.4%) lower than the amount allowed in Ofwat’s PR14 Final Determination (FD).
Removing from our revenue the Outcome Delivery Incentive (ODI) penalties returned to customers early via the leakage rebate and the revenue voluntarily deferred, our wholesale revenue for 2019/20 is £22.7m (1.1%) lower than the amended allowed revenue.
Wholesale WaterWholesale water revenue is £39.6m (4.2%) lower than the FD, driven by:
• core tariff revenue lower than forecast due to lower property numbers, due in part to de-registrations from the non-household retail market;
• prices being set at a level £30.7m lower than the FD to reflect ODI penalties being passed back to customers early during AMP6 as a result of the Section 19 investigation into our leakage performance, resulting in lower bills; and
• lower than forecast capital contributions from connection and infrastructure charge revenue due to growth being slower than expected.
Removing from our allowed revenue the ODI penalties that the Company chose to return to customers early via the leakage rebate, our wholesale water revenue is £8.9m (1.0%) lower than the amended allowed revenue.
Wholesale WastewaterWholesale wastewater revenue (including the Company’s delivered element of the Thames Tideway Tunnel) is £29.0m (2.7%) lower than the FD, driven by:
• core tariff revenue lower than forecast due to lower property numbers, due in part to de-registrations from the non-household retail market and lower consumption by metered customers; and
• prices being set at a level £15.3m lower than the FD to reflect the revenue voluntarily deferred to reduce the impact of price increases, resulting in lower bills.
Removing from our allowed revenue the aforementioned voluntary deferral, our wholesale wastewater revenue is £13.7m (1.3%) lower than the amended allowed revenue.
Thames Water Combined Report 2019/20 232Strategic report Governance Financial statements Annual performance report

2I. Revenue analysis and wholesale control reconciliation continuedThe variance between actual revenue and allowed revenue in the wholesale water and wastewater price controls has been adjusted by Ofwat through the PR19 process for setting revenue allowances for the period 2020 – 2025 (known as AMP7). This will be supplemented by the ‘blind year adjustment’ that corrects for the difference between the estimated 2019/20 revenue used in the PR19 Final Determination and the levels of actual 2019/20 wholesale revenue seen above.
The unrecovered revenue in 2019/20 attributable to variances in our customer base between outturn and the forecasts used when tariffs were set will be recovered from customers across the five years of AMP7 along with the wholesale wastewater revenue that was voluntarily deferred. The unrecovered revenue in 2019/20 attributable to ODI penalties that have been returned to customers early as a result of the Section 19 investigation into our leakage performance will not be added to our revenue allowances in AMP7.
2J. Infrastructure network reinforcement costFor the year ended 31 March 2020Table 2J presents the infrastructure reinforcement costs, as included in Totex in tables 4D and 4E (pages 244 and 245 respectively), by type of system or facility.
Network reinforcement
capex£m
On site / site specific capex
(memo only)£m
Wholesale water network + (treated water distribution) Distribution and trunk mains 7.1 –Pumping and Storage facilities 0.1 –Other – –Total 7.2 – Wholesale wastewater + (sewage collection) Foul and combined systems 6.3 –Surface water only systems – –Pumping and Storage facilities 0.4 –Other – –Total 6.7 –
There is a difference on table 2J compared to Table 4D as follows:
4D £6.1m : 2J £7.2m
This has arisen due to ongoing assessment of schemes which qualify as network reinforcement under the new charging rules as set out by Ofwat. Some schemes have an element of growth and network reinforcement and the mix may be estimated until the scheme is complete, or as information becomes available to support the classification as network reinforcement. Table 2J reflects a true-up in the current reporting year to adjust for the cumulative network reinforcement spend which is required to be matched to infrastructure charges over a rolling five year period. Table 4D reflects just the current year additions and excludes any true up for assessment changes which impact prior year spend.
Price review and other segmental reporting continued
2K. New connections – Infrastructure charges reconciliationFor the year ended 31 March 2020
Table 2K compares the revenue and costs of infrastructure charges for new connections.
Water £m
Waste £m
Total £m
Impact of infrastructure charges discount Infrastructure charges 6.0 14.1 20.1Discounts applied to infrastructure charges – – –Gross infrastructure charges 6.0 14.1 20.1 Comparison of revenue and costs Variance bought forward 6.3 8.2 14.5Revenue 6.0 14.1 20.1Costs (7.2) (6.7) (13.9)Variance carried forward 5.1 15.6 20.7
Disclosed as infrastructure charges within the above table are contributions from other sources that are considered to be their equivalent, though are disclosed on separate lines within Table 2E. This includes infrastructure charges received from NAV providers, and the non-domestic Network Charges.
A reconciliation of these charges to table 2E has been included below:
Table 2E Line Description Water Wastewater Total
Infrastructure Charges Infrastructure Charges 5.2 12.9 18.1Other Contributions (Price Control) NAV Infrastructure Equivalent Charges 0.5 0.8 1.3Other Contributions (Non Price Control) Network Charges 0.3 0.4 0.7
Total 6.0 14.1 20.1
Thames Water Combined Report 2019/20 233Strategic report Governance Financial statements Annual performance report

Independent Limited Assurance Report to the Directors of Thames Water Utilities Limited
Disclaimer
• PwC’s report was prepared with Thames Water Utilities Limited’s (“Thames Water”) interests in mind. It was not prepared with any other recipient’s interests in mind or for its use. PwC’s report is not a substitute for any enquiries that a recipient should make. PwC’s report is based on historical information. Any projection of such information or PwC’s opinion or views thereon to future periods is subject to the risk that changes may occur after the report is issued. For these reasons, such projection of information to future periods would be inappropriate;
• PwC accepts no liability (including liability for negligence) to each recipient in relation to PwC’s report. The report is provided to each recipient for information purposes only. If a recipient relies on PwC’s report, it does so entirely at its own risk;
• No recipient will bring a claim against PwC which relates to the access to the report by a recipient;
• Neither PwC’s report, nor information obtained from it, may be made available to anyone else without PwC’s prior written consent, except where required by law or regulation;
• PwC will be entitled to the benefit of and to enforce these terms; and
• These terms and any dispute arising from them, whether contractual or non-contractual, are subject to English law and the exclusive jurisdiction of English courts.
Our Conclusion
Based on the procedures we have performed and the evidence we have obtained, nothing has come to our attention that causes us to believe that the Selected Information for the year ended 31 March 2020 has not been prepared, in all material respects, in accordance with the Reporting Criteria.
This conclusion is to be read in the context of what we say in the remainder of our report.
Scope of our work
The scope of our work was limited to assurance over the following information in Thames Water’s Annual Performance Report 2019-20 (the “Selected Information”).
• 3A: Outcome performance table;
• 3B: Sub-performance measure table;
• 3C: Abstraction incentive mechanism; and
• 3D: Service Incentive Mechanism.
The Selected Information and the Reporting Criteria against which it was assessed are summarised in https://corporate.thameswater.co.uk/About-us/Our-investors/annual-results. Our assurance does not extend to information in respect of earlier periods or to any other information included in the Thames Water Annual Performance Report 2019-20.
Professional standards applied and level of assurance
We performed a limited assurance engagement in accordance with International Standard on Assurance Engagements 3000 (Revised) ‘Assurance Engagements other than Audits or Reviews of Historical Financial Information’ issued by the International Auditing and Assurance Standards Board.
The procedures performed in a limited assurance engagement vary in nature and timing from, and are less in extent than for, a reasonable assurance engagement. Consequently, the level of assurance obtained in a limited assurance engagement is substantially lower than the assurance that would have been obtained had a reasonable assurance engagement been performed.
Our Independence and Quality Control
We have complied with the Institute of Chartered Accountants in England and Wales (ICAEW) Code of Ethics, which includes independence and other requirements founded on fundamental principles of integrity, objectivity, professional competence and due care, confidentiality and professional behaviour.
We also apply International Standard on Quality Control (UK) 1 and accordingly maintain a comprehensive system of quality control including documented policies and procedures regarding compliance with ethical requirements, professional standards and applicable legal and regulatory requirements.
Understanding reporting and measurement criteria
The Selected Information needs to be read and understood together with the Reporting Criteria, which Thames Water is solely responsible for selecting and applying. The absence of a significant body of established practice on which to draw to evaluate and measure non-financial information allows for different, but acceptable, measurement techniques and can affect comparability between entities and over time. The Reporting Criteria used for the reporting of the Selected Information for the 2020 reporting year.
Work done
We are required to plan and perform our work in order to consider the risk of material misstatement of the Selected Information. In doing so, we:
• Re-performed the calculation of the performance level arising from Thames Water’s PCs in the year against Thames Water’s reporting criteria;
• Verified, through limited testing on a selective basis, the underlying data or supporting information used to calculate each PC in the ‘selected information’;
• Made enquiries of relevant company management, personnel and third parties; and
• Considered significant estimates and judgements made by management in the preparation of the selected information.
Thames Water Combined Report 2019/20 234Strategic report Governance Financial statements Annual performance report

Directors’ responsibilities
The Directors of Thames Water are responsible for:
• Designing, implementing and maintaining internal controls over information relevant to the preparation of the Selected Information that is free from material misstatement, whether due to fraud or error;
• Establishing objective Reporting Criteria for preparing the Selected Information;
• Measuring and reporting the Selected Information based on the Reporting Criteria; and
• The content of the Thames Water Annual Performance Report 2019-20.
Our responsibilities
We are responsible for:
• Planning and performing the engagement to obtain limited assurance about whether the Selected Information is free from material misstatement, whether due to fraud or error;
• Forming an independent conclusion, based on the procedures we have performed and the evidence we have obtained; and
• Reporting our conclusion to the Directors of Thames Water.
While the Selected Information may be informed by the need to satisfy legal or regulatory requirements, our scope of work and our conclusions do not constitute assurance over your compliance with those laws and regulations.
Intended users and purpose
This report, including our conclusions, has been prepared solely for the Board of Directors of Thames Water in accordance with the agreement between us dated 4 December 2019, to assist the Directors in reporting Thames Water’s performance and activities. We permit this report to be disclosed in the Thames Water Annual Performance Report 2019-20 for the year ended 31 March 2020, to assist the Directors in responding to their regulatory responsibilities by obtaining an independent assurance report in connection with the Selected Information. To the fullest extent permitted by law, we do not accept or assume responsibility to anyone other than the Board of Directors and Thames Water for our work or this report except where terms are expressly agreed in writing.
PricewaterhouseCoopers LLP Chartered Accountants Reading 29 June 2020
Thames Water Combined Report 2019/20 235Strategic report Governance Financial statements Annual performance report

Performance summary
3A. Outcome performance tableFor the year ended 31 March 2020
Performance commitment Units description
Decimal places
2015-16 performance level – actual
2016-17 performance level – actual
2017-18 performance level – actual
2018-19 performance level – actual
2019-20 performance level – actual
2019/20 CPL (for PCs with annual targets)
AMP CPL (for PCs with AMP end targets)
2019/20 CPL met?
2019/20 notional reward or penalty accrued
2019/20 notional reward or penalty accrued £m (4 DPs)
Total AMP6 reward or penalty 31 March 2020
Total AMP6 reward or penalty 31 March 2020 £m (4 DPs)
WA1: Improve handling of written complaints by increasing 1st time resolution – water
% written complaints resolved 1st time
0 91 96 96 88 88 95 N/A No
WA2: Number of written complaints per 10,000 connected properties – water
No. written complaints / 10,000 properties
2 8.84 9.12 12.39 18.61 14.01 6.53 N/A No
WA3: Customer satisfaction surveys (internal CSAT monitor) – water
TW internal Customer satisfaction score (mean score out of 5)
2 4.44 4.50 4.42 4.39 4.40 4.60 N/A No
WA4: Reduced water consumption from issuing water efficiency devices to customers
Ml/d reduced water consumption (cumulative)
2 – – 20.22 28.25 34.42 N/A 15.45 Yes – – – 0.0000
WA5: Provide a free repair service for customers with a customer side leak outside of the property
Number against target above annual baseline no.
0 1,404 2,089 4,834 7,957 6,841 890 N/A Yes
WB1: Asset health water infrastructure
Asset health indicator
na Marginal Marginal Marginal Marginal Stable Stable N/A Yes – – Underperformance payment
-18.7000
WB2: Asset health water non-infrastructure
Asset health indicator
na Stable Stable Stable Stable Stable Stable N/A Yes – – – 0.0000
WB3: Compliance with drinking water quality standards (MZC) – Ofwat/ DWI KPI
Mean zonal compliance (%)
2 99.96 99.96 99.96 99.96 99.97 100 N/A No Underperformance payment deadband
– Underperformance payment deadband
0.0000
WB4: Properties experiencing chronic low pressure (DG2)
No. of properties with low pressure (DG2) at the end of the reporting year
0 0 5 6 7 10 34 N/A Yes
WB5: Average hours lost supply per property served, due to interruptions > 4 hours
Hours lost supply per property served
2 0.12 0.12 0.21 0.26 0.12 0.13 N/A Yes Outperformance payment
3.1250 Underperformance payment
-11.9650
WB6: Security of Supply Index – Ofwat KPI
Security of Supply Index (SOSI)
0 100 99 97 98 100 100 N/A Yes – – Underperformance payment
-13.5900
WB7: Compliance with SEMD advice notes (with or without derogation)
% compliance with SEMD advice notes
0 0 N/A 21 23 59 N/A 100 No Underperformance payment
-3.5924 Underperformance payment
-3.5924
Thames Water Combined Report 2019/20 236Strategic report Governance Financial statements Annual performance report

Performance commitment Units description
Decimal places
2015-16 performance level – actual
2016-17 performance level – actual
2017-18 performance level – actual
2018-19 performance level – actual
2019-20 performance level – actual
2019/20 CPL (for PCs with annual targets)
AMP CPL (for PCs with AMP end targets)
2019/20 CPL met?
2019/20 notional reward or penalty accrued
2019/20 notional reward or penalty accrued £m (4 DPs)
Total AMP6 reward or penalty 31 March 2020
Total AMP6 reward or penalty 31 March 2020 £m (4 DPs)
WB8: Ml/d of sites made resilient to future extreme rainfall events
Ml/d of WTWs made resilient
0 – – 4 747 755 N/A 1015 No Underperformance payment
-1.0150 Underperformance payment
-1.0150
WC1: Greenhouse gas emissions from water operations
ktCO2e 1 284.8 160.7 46.2 45.7 40.5 151.2 N/A Yes
WC2: Leakage Megalitres per day (Ml/d) (annual average)
0 642 677 695 690 595 606 N/A Yes Outperformance payment deadband
– Underperformance payment
-56.7000
WC3: Abstraction Incentive Mechanism (AIM)
– 0 (Refer to Table 3C)
-1,676.29 -170.69 -1,017.08 0 N/A Yes
WC4: We will educate our existing and future customers
No. of children directly engaged
0 17,491 20,898 21,341 24,897 35,051 20,000 N/A Yes
WC5: Deliver 100% of agreed measures to meet new environmental regulations
% of agreed schemes completed
0 0 0 Not available Not available 99 N/A 100 No Underperformance payment
-0.0180 Underperformance payment
-0.0180
WD1: Energy imported less energy exported
GWh (gigawatt-hours)
0 496 491 510 520 506 476 N/A No
SA1: Improve handling of written complaints by increasing first time resolution – wastewater
% written complaints resolved 1st time
0 87 93 94 84 86 95 N/A No
SA2: Number of written complaints per 10,000 connected properties – wastewater
No. written complaints / 10,000 properties
2 6.46 6.21 4.39 5.34 5.56 5.80 N/A Yes
SA3: Customer satisfaction surveys (internal CSAT monitor) -wastewater
TW internal Customer satisfaction score (mean score out of 5)
2 4.50 4.57 4.55 4.58 4.49 4.70 N/A No
SB1: Asset health wastewater non-infrastructure
Asset health indicator
na Stable Stable Stable Stable Stable Stable N/A Yes – – – 0.0000
SB2: Asset health wastewater infrastructure
Asset health indicator
na Stable Stable Stable Stable Stable Stable N/A Yes – – – 0.0000
SB3: Properties protected from flooding due to rainfall (including Counters Creek project)*
No. properties protected from flooding due to rainfall
0 379 60 40 86 394 N/A 668 excluding Counters Creek (including CC 2127)
No Underperformance payment
-130.0560 Underperformance payment
-130.0560
Performance summary continued
3A. Outcome performance table continued
* Information for previous years have been restated for Counters Creek
Thames Water Combined Report 2019/20 237Strategic report Governance Financial statements Annual performance report

Performance commitment Units description
Decimal places
2015-16 performance level – actual
2016-17 performance level – actual
2017-18 performance level – actual
2018-19 performance level – actual
2019-20 performance level – actual
2019/20 CPL (for PCs with annual targets)
AMP CPL (for PCs with AMP end targets)
2019/20 CPL met?
2019/20 notional reward or penalty accrued
2019/20 notional reward or penalty accrued £m (4 DPs)
Total AMP6 reward or penalty 31 March 2020
Total AMP6 reward or penalty 31 March 2020 £m (4 DPs)
SB4: Number of internal flooding incidents, excluding those due to overloaded sewers (SFOC)
No. of internal sewer flooding (other causes) incidents
0 1,410 1,214 1,062 1,032 1,058 1,085 N/A Yes Outperformance payment
1.4850 Underperformance payment
-6.4850
SB5: Contributing area disconnected from combined sewers by retrofitting sustainable drainage
No. of hectares (cumulative)
0 – – 0 0 21 N/A 20 Yes Outperformance payment
0.4750 Outperformance payment
0.4750
SB6: Compliance with SEMD advice notes (with or without derogation)
% compliance with SEMD advice notes
0 0 N/A 26 28 100 N/A 100 Yes – – 0.0000
SB7: Population equivalent of sites made resilient to future extreme rainfall events
Population equivalent (cumulative)
0 – – 495,160 962,842 1,569,343 N/A 1,700,000 No Underperformance payment
-0.0941 Underperformance payment
-0.0941
SB8: Lee Tunnel including Shaft G
Scheme delivery na Scheme delivered
Scheme delivered 2015/16
Scheme delivered 2015/16
Scheme delivered 2015/16
Scheme delivered 2015/16
N/A N/A – – – – 0.0000
SB9: Deephams Wastewater Treatment Works
Scheme delivery na – Scheme delivered
Scheme delivered 2016/17
Scheme delivered 2016/17
Scheme delivered 2016/17
N/A N/A – – – – 0.0000
SC1: Greenhouse gas emissions from wastewater operations
ktCO2e 1 468.5 346.7 231.7 230.0 217.4 269.9 N/A Yes
SC2: Total category 1-3 pollution incidents from sewage related premises
No. of pollution incidents (cats 1, 2 and 3)
0 232 315 292 295 321 340 N/A Yes – – – 0.0000
SC3: Sewage treatment works discharge compliance
% WwTW discharge compliance
2 99.13 98.28 99.43 98.85 99.71 100 N/A No Underperformance payment deadband
– Underperformance payment
-2.4223
SC4: Water bodies improved or protected from deterioration as a result of Thames Water's activities
No. of water bodies improved or protected by catchment management
0 – – 0 0 10 N/A 13 No
SC5: Satisfactory sludge disposal compliance
% satisfactory sludge disposal compliance
0 100 100 100 100 100 100 N/A Yes
SC6: We will educate our existing and future customers
No. of children directly engaged
0 17,491 20,898 21,341 24,897 35,051 20000 N/A Yes
SC7: Modelled reduction in properties affected by odour
No. of properties (modelled cumulative reduction)
0 – 1,298 1,980 8,931 8,931 N/A 6593 Yes Outperformance payment
0.5144 Outperformance payment
1.1858
Performance summary continued
3A. Outcome performance table continued
Thames Water Combined Report 2019/20 238Strategic report Governance Financial statements Annual performance report

Performance summary continued
Performance commitment Units description
Decimal places
2015-16 performance level – actual
2016-17 performance level – actual
2017-18 performance level – actual
2018-19 performance level – actual
2019-20 performance level – actual
2019/20 CPL (for PCs with annual targets)
AMP CPL (for PCs with AMP end targets)
2019/20 CPL met?
2019/20 notional reward or penalty accrued
2019/20 notional reward or penalty accrued £m (4 DPs)
Total AMP6 reward or penalty 31 March 2020
Total AMP6 reward or penalty 31 March 2020 £m (4 DPs)
SC8: Deliver 100% of agreed measures to meet new environmental regulations
% of agreed schemes completed
0 0 0 Not available Not available 100 N/A 100 Yes – – – 0.0000
SC9: Reduce the amount of phosphorus entering rivers to help improve aquatic plant and wildlife
Kilograms of phosphorus removed per day
1 – – 0 0 59.3 N/A 59.3 Yes – – – 0.0000
SD1: Energy imported less energy exported
GWh (gigawatt-hours)
0 533 477 431 396 383 295 N/A No
T1A: Successful procurement of the Infrastructure Provider (IP)
Infrastructure Provider (IP) procurement
na Complete Scheme delivered 2015/16
Scheme delivered 2015/16
Scheme delivered 2015/16
Scheme delivered 2015/16
N/A N/A –
T1B: Thames Water will fulfil its land related commitments in line with the TTT programme requirements
Land related commitments
na 13 Additional 13 sites access granted in year. In line with Tideway requirements
13 3 1 Acquire land access rights in line with programme in the development consent order and programme timetable to be agreed with Ofwat
N/A Yes
T1C: Completion of category 2 and 3 construction works and timely availability of sites to the IP
No. of sites (cumulative)
0 9 19 21 21 23 23 23 Yes – – – 0.0000
T2: Thames Water will engage effectively with the IP, and other stakeholders, both in terms of integration and assurance
Effective engagement with IP and stakeholders
na – Effective engagement
Effective engagement
Effective engagement
Effective engagement
Effective engagement
N/A Yes
T3: Thames Water will engage with its customers to build understanding of the TTT project. Thames Water will liaise with the IP on its surveys of local communities impacted by construction*
Engagement to build TTT understanding
na Yes No No Yes Yes Improving trend
N/A Yes
3A. Outcome performance table continued
Thames Water Combined Report 2019/20 239Strategic report Governance Financial statements Annual performance report

Performance commitment Units description
Decimal places
2015-16 performance level – actual
2016-17 performance level – actual
2017-18 performance level – actual
2018-19 performance level – actual
2019-20 performance level – actual
2019/20 CPL (for PCs with annual targets)
AMP CPL (for PCs with AMP end targets)
2019/20 CPL met?
2019/20 notional reward or penalty accrued
2019/20 notional reward or penalty accrued £m (4 DPs)
Total AMP6 reward or penalty 31 March 2020
Total AMP6 reward or penalty 31 March 2020 £m (4 DPs)
RA1: Minimise the number of written complaints received from customers (relating to charging and billing)
No. written complaints / 10,000 properties
0 14 19 17 18 41 15 N/A No
RA2: Improve handling of written complaints by increasing first time resolution – charging and billing
% written complaints resolved 1st time
0 92 94 95 88 92 95 N/A No
RA3: Improve customer satisfaction of retail customers – charging and billing service
TW internal Customer satisfaction score (mean score out of 5)
2 4.61 4.63 4.66 4.58 4.42 4.65 N/A No
RA4: Improve customer satisfaction of retail customers – operations contact centre
TW internal Customer satisfaction score (mean score out of 5)
2 4.27 4.46 4.43 4.44 4.46 4.65 N/A No
RA5: Increase the number of bills based on actual meter reads (in cycle)
% bills based on actual meter reads
0 91 97 97 99 98 96 N/A Yes
RA6: Service incentive mechanism (SIM)
Service incentive mechanism (SIM) score
1 76.7 77.3 78.4 75.0 N/A N/A N/A –
RB1: Implement new online account management for customers supported by web-chat
Delivery status na Limited online
Limited online
New online self serve channel
Online self serve channel
Online self serve channel
New online self serve channel
N/A – – – – 0.0000
RC1: Increase the number of customers on payment plans (excluding Thames Tideway Tunnel)
% of customers on DD payment plans
0 54 55 58 58 57 60 N/A No – – – 0.0000
RC2: Increase cash collection rates (excluding Thames Tideway Tunnel)
% of cash collected from billing in the year
1 88.2 87.9 89.20 87.9 87.1 90.4 N/A No
Performance summary continued
3A. Outcome performance table continued
Thames Water Combined Report 2019/20 240Strategic report Governance Financial statements Annual performance report

3B. Sub-measure performance tableFor the year ended 31 March 2020PC/sub-measureID PC/sub-measure Unit
2018-19 performance level – actual
2019-20 performance level – actual
2019-20 PCL met?
00 WB1: Asset health water infrastructure category Marginal Stable Yes01 Total bursts nr 10,388 7,798 Yes02 Unplanned interruptions to customer
>12 hours (DG3)nr 16,418 4,723 No
03 Iron mean zonal non-compliance % 0.16 0.06 Yes04 Inadequate pressure (DG2) nr 7 10 Yes05 Planned network rehabilitation (kilometres) nr 172.34 166.08 Yes06 Customer complaints discolouration
white water (nr per 1,000 population)nr 0.16 0.15 Yes
00 WB2: Asset health water non-infrastructure category Stable Stable Yes01 Disinfection index (DWI) % 99.99 99.99 Yes02 Reservoir integrity index % 0 0 Yes03 DWQ compliance measures –
turbidity (number of sites)nr 0 1 Yes
04 Process control index % 100 100 Yes05 DWQ compliance measures –
enforcement actionsnr 0 1 No
06 Water quality complaints for chlorine (nr per 1,000 population)
nr 0.05 0.05 Yes
07 Water quality complaints for hardness (nr per 1,000 population)
nr 0.006 0.004 –
00 SB1: Asset health wastewater non-infrastructure
category Stable Stable Yes
01 Unconsented pollution incidents (cat 1, 2 and 3) STWs, storm tanks, pumping stations and other
nr 45 50 No
02 Sewage treatment works discharges failing numeric consents %
% 1.15 0.29 No
03 Total population equivalent served by sewage treatment works failing look-up table consents
% 0.0 0.0 Yes
00 SB2: Asset health wastewater infrastructure category Stable Stable Yes01 Number of sewer collapses nr 365 480 Yes02 Number of sewer blockages nr 79,702 77,220 Yes03 Pollution incidents (cat 1–3) nr 204 232 No04 Properties internally flooded nr 968 999 Yes
Performance summary continued
3C. AIM tableFor the year ended 31 March 2020
Abstraction site
2019-20 AIM
performance
2019-20 normalised AIM
performancenr
Cumulative AIM performance
2016-17 onwards
Ml
Cumulative normalised
AIM performance
2016-17 onwards
nr
Contextual information
relating to AIM
performance
RIVER LEE AT NEW GAUGE PUMPING STATION (London WRZ)
(538.5) (0.21) (1,409.8) (0.42) –
PANGBOURNE (Kennet Valley WRZ)
(215.6) (0.09) (724.2) (0.31) –
AXFORD PUMPING STATION (SWOX WRZ)
(181.1) (0.16) (502.4) (0.34) –
PANN MILL PUMPING STATION (SWA WRZ)
(81.9) (0.12) (177.9) (0.20) –
NORTH ORPINGTON PS (London WRZ)
– – (49.8) (0.54) –
Total (1,017.1) (0.58) (2,864.1) (1.81) –
3D. SIM tableFor the year ended 31 March 2020Qualitative performance Units Score
1st survey score nr 4.112nd survey score nr 3.753rd survey score nr 3.744th survey score nr 3.67Qualitative SIM score (out of 75) nr 52.81Total contact score nr 85.37Quantitative SIM score (out of 25) nr 0.00Total annual SIM score (out of 100) nr 52.81
Thames Water Combined Report 2019/20 241Strategic report Governance Financial statements Annual performance report

4A. Non-financial informationFor the year ended 31 March 2020This table shows information with regards to the water consumption, vacant households and wholesale water and wastewater volumes.
Unmeasured Measured
Retail – householdNumber of void households (‘000s) 111.7 101.7Per capita consumption (excluding supply pipe leakage) l/h/d 155.7 129.9
Water Wastewater
WholesaleVolume (Ml/d)Bulk supply export 104.5 10.1Bulk supply import 0.4 4.9Distribution input 2,602.4
4B. Wholesale Totex analysisFor the year ended 31 March 2020Please note, the effects of IFRS16 have been excluded from the tables containing totex numbers in Sections 2 and 4 so that the information contained in these tables provides a consistent measure of totex performance, to allow comparison to the Final Determination for AMP6.
Table 4B shows the Totex expenditure in out-turn prices for wholesale operations, split by the price controls as required by Ofwat. The information shows the Totex expenditure for 2019/20 as well as cumulatively for the AMP.
Current year Cumulative
Water £m
Wastewater £m
TTT £m
Water £m
Wastewater £m
TTT £m
Actual totex 1,051.7 811.6 16.6 4,481.2 4,382.5 298.7Less: Items excluded from the menu
Third party costs 7.6 2.4 – 33.7 18.3 –Pension deficit recovery costs 11.7 10.9 – 41.5 38.1 –Other 'rule book' adjustments 1.0 1.0 (5.2) 1.0 25.5 39.5Total items excluded from the menu 20.3 14.3 (5.2) 76.2 81.9 39.5
Add: Transition expenditure Transition Expenditure – – – 26.1 54.6 –Adjusted actual totex 1,031.4 797.3 21.8 4,431.1 4,355.2 259.2Adjusted actual totex – base year prices 868.3 671.1 18.3 3,934.0 3,895.3 235.4 Allowed totex based on final menu choice – base year prices 655.2 611.2 23.4 3,316.5 3,743.1 348.7
Cumulative totex over/(under) spend 213.1 59.9 (5.1) 617.5 152.2 (113.3)
As part of the price review process for AMP6, Ofwat proposed a ‘Totex sharing mechanism’ for water companies, under which approximately half of any cumulative Totex under or overspend compared to the Ofwat allowance, would be shared with customers, through adjustments to their bills after 2020.
Table 4B shows our actual Totex for 2019/20 alongside our cumulative Totex for the AMP to date; a number of adjustments are made to these figures to allow us to compare our spend against the allowance in each year per the Final Determination (“FD”) for the 5 year period 2015 – 2020.
Additional regulatory information
Thames Water Combined Report 2019/20 242Strategic report Governance Financial statements Annual performance report

4B. Wholesale Totex analysis continuedThe adjustments to Totex include:
• ‘Items excluded from the menu’ – these are expenses that we have incurred that were not included in the FD. Examples of these items include third party costs (such as the cost of providing bulk supplies), pension deficit recovery costs and other ‘rule book’ adjustments such as fines. In the Thames Tideway Tunnel (TTT) price control, we also adjust for purchases of land required to develop the TTT, that are subject to a ‘100:0’ sharing rate with customers; these costs are excluded from Totex in table 4B above, in line with Ofwat guidance because customers receive the full benefit of any increase in land values when they are sold at a future date.
• Transition expenditure – these are any costs incurred in the period 2010 – 2015 that deliver performance in 2015 – 2020 (no adjustment in 2019/20).
• Adjustment to base year prices – the FD defines Totex in 2012/13 prices, so to compare against the FD, we adjust for inflation to a consistent price base.
In 2019/20, other rule book adjustments include additional amounts paid to Steve Robertson following his departure as CEO in May 2019. Removal of these costs means that customers will not bear any of the cost of this additional expense.
Our performance against the FD has been analysed for each price control below:
Water:In 2019/20, our Totex for water of £868.3 million in base year prices (2012/13) was £213.1 million higher than the FD allowance of £655.2 million. This additional spend particularly reflects increased expenditure to improve our leakage and resilience. The main items that make up the overspend include the following:
• Increased costs for leakage detection and reduction work in order to meet our leakage targets;
• Increased costs for replacing our distribution mains within the London and Thames Valley;
• Increased power costs as a result of price increases;
• Increased investment to cope with higher than expected population growth; and
• Increased investment in digitisation to fix the basics and build a platform for digitally enabled performance improvements in AMP7
Cumulatively, our totex for water of £3,934.0 million is £617.5 million over what we were allowed in the FD. Of this overspend, we acknowledged in 2017/18 that c. £90million incurred to date was related to inefficient leakage costs. Under the Totex sharing mechanism, approximately £46million of these costs would have been shared with customers through adjustments to their bills in AMP7; however we do not think this is fair, and our shareholders committed in 2017/18 to fully bear this cost.
Additional regulatory information continued
Waste:In 2019/20, our Totex for waste of £671.1 million in base year prices (2012/13) was £59.9 million higher than our FD allowance (£611.2 million). This additional spend reflects increased expenditure for the following:
• Increased maintenance spend to strengthen operational resilience;
• Increased spend address risk of failure of sewers crossing railway lines;
• Increased proactive spend in reducing the risk of sewer flooding through increased cleaning, greater customer education;
• Increased power and materials costs as a result of price increases;
• Increased investment to cope with higher than expected population growth;
• Increased investment in digitisation to fix the basics and build a platform for digitally enabled performance improvements in AMP7; and
• Increased reactive spend for infiltration tankering and compliance following high rainfall in the latter part of the year.
Cumulatively, our totex for waste of £3,895.3 million is £152.2 million over what we were allowed in the FD.
TTT: In 2019/20, our totex for TTT of £18.3 million in base year prices (2012/13) was £5.1 million lower than the FD allowance of £23.4 million and cumulatively, our Totex for TTT of £235.4 million is £113.3 million under the Totex allowance. This is primarily due to savings to date in the Development and Delivery phases of the project.
4C. Impact of AMP performance to date on RCVFor the year ended 31 March 2020Table 4C shows the projected adjustments to the Regulatory Capital Value that are expected at the next price review.
Water Wastewater TTT
Cumulative totex over/under spend so far in the price control period 617.5 152.2 (113.3)Customer share of cumulative totex over/under spend 362.3 90.2 (66.8)RCV element of cumulative totex over/under spend 362.3 97.3 (172.7)Adjustment for ODI outperformance payment or Under-performance payment – (155.5) –RCV determined at FD at 31 March 6,182.6 7,021.1 1,525.6Projected ‘shadow’ RCV 6,508.9 6,962.9 1,352.9
The RCV element of the Totex over/(underspend) is a calculated value which reflects the difference between allowed and actual Totex, multiplied by the average AMP6 slow money percentage. For the TTT price control, this includes any over/(underspend) on land, which passes 100% to customers, through an RCV adjustment.
Thames Water Combined Report 2019/20 243Strategic report Governance Financial statements Annual performance report

4D. Totex analysis – wholesale waterFor the year ended 31 March 2020Please note, the effects of IFRS16 have been excluded from the tables containing totex numbers in Sections 2 and 4 so that the information contained in these tables provides a consistent measure of totex performance, to allow comparison to the Final Determination for AMP6.
Table 4D provides information about the different activities undertaken as part of delivering upstream services with a breakdown of the total expenditure for carrying out the supply of water services.
Water resources Network +
Abstraction licences
£m
Raw water abstraction
£m
Raw water transport
£m
Raw water storage
£m
Water treatment
£m
Treated water
distribution £m
Total£m
Operating expenditure
Power – 16.3 0.7 – 17.6 30.9 65.5Income treated as negative expenditure – (0.1) – – – – (0.1)Abstraction charges/ discharge consents 13.3 – – – – (0.1) 13.2
Bulk supply – 4.8 – – – – 4.8Other operating expenditure Renewals expensed in year (infrastructure) – – – – – 73.9 73.9Renewals expensed in year (non-infrastructure) – – – – – – –Other operating expenditure excluding renewals 6.1 17.5 2.8 – 61.5 163.2 251.1
Local authority and cumulo rates – 5.0 0.7 – 14.4 37.9 58.0Total operating expenditure excluding third party services 19.4 43.5 4.2 – 93.5 305.8 466.4
Third party services – 2.3 – – 0.8 3.8 6.9
Total operating expenditure 19.4 45.8 4.2 – 94.3 309.6 473.3Capital expenditure Maintaining the long term capability of the assets – infra – 4.0 5.6 – 2.0 163.2 174.8Maintaining the long term capability of the assets – non-infra – 4.7 1.4 – 81.3 118.8 206.2
Other capital expenditure – infra – (0.1) (0.2) – 0.2 137.3 137.2
Other capital expenditure – non-infra – 18.0 (0.1) – 23.2 43.1 84.2
Infrastructure network reinforcement – – – – – 6.1 6.1Total gross capital expenditure (excluding third party) – 26.6 6.7 – 106.7 468.5 608.5
Third party services – – – – – 0.7 0.7
Total gross capital expenditure – 26.6 6.7 – 106.7 469.2 609.2
Additional regulatory information continued
Water resources Network +
Abstraction licences
£m
Raw water abstraction
£m
Raw water transport
£m
Raw water storage
£m
Water treatment
£m
Treated water
distribution £m
Total£m
Grants and contributions – – – – – 42.5 42.5
Totex 19.4 72.4 10.9 – 201.0 736.3 1,040.0Cash expenditure
Pension deficit recovery payment – 1.0 0.1 – 2.9 7.7 11.7
Other cash items – – – – – – 0.0
Totex including cash items 19.4 73.4 11.0 0.0 203.9 744.0 1,051.7
Licenced volume
availableVolume
abstractedVolume
transportedAverage
volume stored
Water Treatment
Distribution input volume
Treated Water Distribution
Distribution input volume
Volume (Ml) 1,547,572.0 1,015,689.6 92,883.5 0.0 966,939.9 955,223.2Unit cost (£/Ml) 12.5 45.1 45.0 0.0 97.5 324.0Population 10,112.3 10,112.3 10,112.3 10,112.3 10,112.3 10,112.3Unit cost (£/pop) 1.9 4.5 0.4 0.0 9.3 30.6
Thames Water Combined Report 2019/20 244Strategic report Governance Financial statements Annual performance report

4E. Totex analysis – wholesale wastewaterFor the year ended 31 March 2020Please note, the effects of IFRS16 have been excluded from the tables containing totex numbers in Sections 2 and 4 so that the information contained in these tables provides a consistent measure of totex performance, to allow comparison to the Final Determination for AMP6.
Table 4E provides information about the different activities undertaken as part of delivering upstream services with a breakdown of the total expenditure for carrying out the supply of sewerage services.
Network+ sewage collection Network+ sewage treatment Sludge
Foul £m
Surface water drainage
£m
Highway drainage
£m
Sewage treatment and
disposal £m
Imported sludge liquor treatment
£m
Sludge transport
£m
Sludge treatment
£m
Sludge disposal
£mTotal
£mOperating expenditurePower 9.3 3.0 1.7 76.4 – 0.1 (28.0) – 62.5Income treated as negative expenditure – – – (3.4) – (0.2) (8.2) (0.9) (12.7)Discharge consents 1.6 0.2 0.1 4.0 – – – – 5.9Bulk discharge – – – 3.0 – – – – 3.0Other operating expenditure Renewals expensed in year (infrastructure) 38.7 12.3 7.1 – – – – – 58.1Renewals expensed in year (non-infrastructure) – – – – – – – – –Other operating expenditure excluding renewals 50.3 15.0 8.9 99.1 1.2 10.5 50.5 19.6 255.1Local authority rates and cumulo rates – – – 25.6 0.1 – 13.0 1.1 39.8Total operating expenditure excluding third party services 99.9 30.5 17.8 204.7 1.3 10.4 27.3 19.8 411.7Third party services 2.2 – – 0.2 – – – – 2.4Total operating expenditure 102.1 30.5 17.8 204.9 1.3 10.4 27.3 19.8 414.1Capital expenditureMaintaining the long-term capability of the assets 101.0 0.1 – – – 0.4 – – 101.5Maintaining the long-term capability of the assets – non-infra 36.5 3.6 1.7 78.0 – 0.9 42.8 4.8 168.3Other capital expenditure – infra 50.1 6.8 – 4.7 – – – – 61.6Other capital expenditure – non-infra 9.5 – – 67.4 – – 2.4 – 79.3Infrastructure network reinforcement 6.7 – – – – – – – 6.7Total gross capital expenditure (excluding third party) 203.8 10.5 1.7 150.1 – 1.3 45.2 4.8 417.4Third party services – – – – – – – – –Total gross capital expenditure 203.8 10.5 1.7 150.1 – 1.3 45.2 4.8 417.4Grants and contributions 27.7 0.1 – 3.0 – – – – 30.8Totex 278.2 40.9 19.5 352.0 1.3 11.7 72.5 24.6 800.7Cash expenditure Pension deficit recovery payments 2.8 0.8 0.4 4.3 – 0.2 2.2 0.2 10.9Other cash items – – – – – – – – –Totex including cash items 281.0 41.7 19.9 356.3 1.3 11.9 734.7 24.8 811.6
Unit cost information (operating expenditure)
Volume collected MI
Volume collected MI
Volume collected MI
Biochemical Oxygen Demand (BOD)
Tonnes
Biochemical Oxygen Demand (BOD)
TonnesVolume transported
m³
Dried solid mass treated
ttds
Dried solid mass disposed
ttds
Units 717,128.3 437,335.1 228,635.4 358,650.8 8,840.1 1,489,369.4 371.6 368.4Unit cost (£/unit) 142.3 69.7 78.1 571.2 147.1 6.9 73,299.7 53,795.5Population 15,771.0 15,771.0 15,771.0 15,771.0 15,771.0 15,771.0 15,771.0 15,771.0Unit cost (£/pop) 6.5 1.9 1.1 13.0 0.1 0.7 1.7 1.3
Additional regulatory information continued
Thames Water Combined Report 2019/20 245Strategic report Governance Financial statements Annual performance report

4F. Operating cost analysis – household retailFor the year ended 31 March 2020Please note, the effects of IFRS16 have been excluded from the tables containing totex numbers in Sections 2 and 4 so that the information contained in these tables provides a consistent measure of totex performance, to allow comparison to the Final Determination for AMP6.
This table sets out the operating costs for the household retail business as defined by the Ofwat price control.
Household unmeasured Household measured
Water only £m
Waste-water
only £m
Water and sewerage
£mTotal
£m
Wateronly £m
Waste-water
only £m
Water and sewerage
£mTotal
£mTotal
£m
Operating expenditureCustomer services 0.3 5.0 24.5 29.8 0.4 8.1 28.8 37.3 67.1Debt management 0.1 0.7 4.7 5.5 0.1 1.2 3.7 5.0 10.5Doubtful debts 0.5 3.7 34.3 38.5 0.5 6.1 27.8 34.4 72.9Meter reading – – – 0.0 0.1 1.4 7.6 9.1 9.1Other operating expenditure 0.2 6.2 15.6 22.0 0.2 9.8 12.7 22.7 44.7Total operating expenditure excluding third party services 1.1 15.6 79.1 95.8 1.3 26.6 80.6 108.5 204.3Third party services operating expenditure – – – – – – – – –Total operating expenditure 1.1 15.6 79.1 95.8 1.3 26.6 80.6 108.5 204.3Depreciation – tangible fixed assets On assets existing at 31 March 2015 – – 0.1 0.1 – – 0.1 0.1 0.2On assets acquired since 1 April 2015 – – 1.8 1.8 – – 1.5 1.5 3.3Amortisation – intangible fixed assets On assets existing at 31 March 2015 – – 0.2 0.2 – – 0.2 0.2 0.4On assets acquired since 1 April 2015 0.1 – 4.4 4.5 0.1 0.1 3.6 3.8 8.2Total operating costs 1.2 15.6 85.5 102.3 1.4 26.7 85.9 114.0 216.3Capital Expenditure 0.1 – 5.8 5.9 0.1 0.1 4.7 4.9 10.8
Other operating expenditure includes the net retail expenditure for the following retail activities which are part funded by wholesale.
Household
Demand-side water efficiency – gross expenditure 7.0Demand-side water efficiency – expenditure funded by wholesale 7.0Demand-side water efficiency – net retail expenditure –Customer-side leak repairs – gross expenditure 8.8Customer-side leak repairs – expenditure funded by wholesale 8.8Customer-side leak repairs – net retail expenditure –
4G. Wholesale current cost financial performance For the year ended 31 March 2020Table 4G shows our financial performance in current cost terms.
Water £m
Wastewater £m
TTT £m
Total £m
Revenue 892.6 994.3 60.9 1,947.8Operating expenditure (473.3) (414.1) – (887.4)Capital maintenance charges (394.1) (444.5) (0.7) (839.3)Other operating income – (3.7) – (3.7)Current cost operating profit 25.2 132.0 60.2 217.4Other income 27.2 30.9 6.7 64.8Interest income 84.5 95.9 20.8 201.2Interest expense (275.6) (312.9) (68.0) (656.5)Other interest expense (2.6) (3.0) (0.6) (6.2)Current cost profit/(loss) before tax and fair value movements (141.3) (57.1) 19.1 (179.3)Fair value gains on financial instruments 45.4 51.5 11.2 108.1
Current cost profit/(profit) before tax (95.9) (5.6) 30.3 (71.2)
Additional regulatory information continued
Thames Water Combined Report 2019/20 246Strategic report Governance Financial statements Annual performance report

4H. Financial metricsFor the year ended 31 March 2020This table shows our key financial metrics: measures of financial performance and financial position, revenue earned, earnings before interest, tax, depreciation and amortisation and an analysis of our borrowings in terms of interest payable and the maturity profile of those borrowings.
Units Current year AMP to Date
Financial indicators
Net debt £m 12,088.147 –
Regulated equity £m 2,641.156 –
Regulated gearing % 82.07% –
Post tax return on regulated equity % 2.06% –
RORE (return on regulated equity) % 3.30% 3.80%
Dividend yield % 1.81% –
Retail profit margin – Household % (2.61)% –
Retail profit margin – Non household % (0.73)% –
Credit rating n/a Baa2 –
Return on RCV % 3.53% –
Dividend cover dec (0.16) –
Funds from operations (FFO) £m 794.758 –
Interest cover (cash) dec 3.18 –
Adjusted interest cover (cash) dec 1.57 –
FFO/Debt dec 0.07 –
Effective tax rate % 0.00% –
Free cash flow (RCF) £m 746.897 –
RCF/capex dec 0.66 –
Revenue and earnings
Revenue (actual) £m 2,097.051 –
EBITDA (actual) £m 1,003.121 –
Movement in RORE
Base return % 5.60% 5.61%
Totex out/(under) performance % (2.49)% (1.38)%
Retail cost out/(under) performance % (0.83)% (0.48)%
ODI out/(under) performance % (0.38)% (1.21)%
Financing out/(under) performance % 1.62% 1.14%
Other factors % (0.22)% 0.12%
Regulatory return for the year % 3.30% 3.80%
Borrowings
Proportion of borrowings which are fixed rate % 31.30%
Proportion of borrowings which are floating rate % 11.29%
Proportion of borrowings which are index linked % 57.42%
Proportion of borrowings due within 1 year or less % 12.53%
Units Current year AMP to Date
Proportion of borrowings due in more than 1 year but no more than 2 years % 5.49% –
Proportion of borrowings due in more than 2 years but no more than 5 years % 15.95% –
Proportion of borrowings due in more than 5 years but no more than 20 years % 38.26% –
Proportion of borrowings due in more than 20 years % 27.77% –
1 Revenue (actual) and EBITDA (actual) relates to price control only and is calculated in line with Ofwat guidance. As the numbers are presented to 3 decimal places, there may be small rounding differences between the numbers stated above and the regulatory accounting tables.
Additional information on RORE
• Totex out/(under) performance recognises that we bear 100% of the costs associated with inefficient expenditure on leakage reduction2. Current year: 0.00% (cumulative: -0.16%).
• ODI out / (under) performance includes the impact of the SIM penalty, recognised equally over the first four years of the AMP. Current year: 0.00% (cumulative: -0.33%).
• ODI out / (under) performance includes performance commitments that reflect performance for the AMP as a whole (in particular, for Counters Creek). These are recognised equally over each year of the AMP. Current year: -0.47% (cumulative: -0.49%)
• Other factors correspond to the sale of the non-household retail business on 1 April 2017. This recognises i) the net proceeds of the sale; ii) removing the margin on non-household retail included in the base allowed return; and iii) remaining costs incurred within this price control until the end of AMP6.
In March 2020, Moody’s downgraded TWUL’s Corporate Family Rating (“CFR”) to Baa2 with stable outlook (2019: Baa1 with negative outlook). Moody’s also downgraded the Company’s senior secured (Class A) debt rating to Baa1 with stable outlook (2019: A3 with negative outlook) and subordinated (Class B) debt rating to Ba1 with stable outlook (2019: Baa3 with negative outlook). In February 2020, S&P affirmed the Company’s credit rating of BBB+ and BBB- (2019: BBB+ & BBB-) in respect of our senior secured (Class A) debt and our subordinated (Class B) debt respectively, with negative outlook (2019: negative outlook). We retain credit ratings that allow us to access efficiently priced debt to fund our investment programme, whilst keeping bills affordable for our customers.
2 As identified in “Notice of Ofwat’s proposal to impose a penalty on Thames Water Utilities Limited”, Ofwat, June 2018
Additional regulatory information continued
Thames Water Combined Report 2019/20 247Strategic report Governance Financial statements Annual performance report

4I. Financial derivativesAs at 31 March 2020This table provides an analysis of our portfolio of financial derivatives.
Financial Derivatives
Nominal value by maturity (net)
at 31 MarchTotal value at
31 March
Total accretion
at 31 March
Interest rate (weighted average
for 12 months to 31 March 2020)
1 to 2 years
£m
2 to 5 years
£m
Over 5 years
£m
Nominal value
£m
Mark to Market
£m £mPayable*
%Receivable*
%
Interest rate swap (sterling)Floating to fixed rate – 150.0 2,100.0 2,250.0 252.0 – 1.9 0.7Floating from fixed rate – – 1,920.9 1,920.9 (87.7) – 0.7 1.1Floating to index linked – – 20.0 20.0 1.8 2.5 3.9 3.1Floating from index linked – – – – – – – –Fixed to index-linked** – 940.0 2,273.8 3,213.8 88.0 210.9 2.4 4.5Fixed from index-linked – – – – – – – –Total – 1,090.0 6,314.7 7,404.7 254.2 213.4Foreign ExchangeCross currency swap USD – – – – – – – –
Cross currency swap EUR – 239.1 – 239.1 (17.1) – 2.3 3.5Cross currency swap YEN – – – – – – – –Cross currency swap Other – – 153.6 153.6 45.6 – 6.6 3.3Total – 239.1 153.6 392.7 28.5 –Currency interest rate Currency interest rate swaps USD – – – – – – – –Currency interest rate swaps EUR – – – – – – – –Currency interest rate swaps YEN – – – – – – – –Currency interest rate swaps Other – – – – – – – –Total – – – – – –Forward currency contractsForward currency contracts USD – – – – – – – –Forward currency contracts EUR – – – – – – – –Forward currency contracts YEN – – – – – – – –Forward currency contracts CAD – – – – – – – –Forward currency contracts AUD – – – – – – – –Forward currency contracts HKD – – – – – – – –Forward currency contracts Other – – – – – – – –Total – – – – – –Other financial derivatives – – – – – –Total financial derivatives – 1,329.1 6,468.3 7,797.4 282.7 213.4* Interest rate payable and receivable has been determined using 31 March 2020 6 month Libor and 3 month Libor** Instruments which change from “fixed to index linked” to “floating to index linked” during their life have been classified according to
their interest rate characteristics as at 31 March 2020
IntroductionRAG 3.11 requires the Company to disclose transactions with both associated companies and the non-appointed business in accordance with the guidance provided in RAG 5.07. Although the appointed business applies IFRS an associated company for the purposes of supply of trade is any company within the Group 1 or a related company as defined by Financial Reporting Standard 102 as required by RAG 5.07. The following disclosures comply with RAG 3.11.
During the year there were no single contracts in excess of 0.5% (£10.6 million) of the Company’s appointed income with any subsidiary of the Kemble Group1 of companies or related companies.
The Company has also chosen to voluntarily disclose all transactions with companies for which there is a common Director. The Directors of the Company and their connection to other Group2 companies is shown on the Directors’ interest table on page 249.
Services provided by the Company and recharged to associated companies
Associate companyCompany principal activity Service provided
Income of associate during 2019/20 (£’000) Terms of supply Value (£’000)
Thames Water Limited
Holding Company
Director costs, Treasury, Insurance, Tax and Financial Control support services
– No market – costs allocated
by time
1,430.0
Thames Water Property Services Limited
Property Company
Director costs, Treasury, Insurance, Tax and Financial Control support services
161.0 No market – costs allocated
by time
140.2
Kennet Properties Limited
Property Company
Director costs, Treasury, Insurance, Tax and Financial Control support services
500.0 No market – costs allocated
by time
6.1
Kennet Properties Limited
Property Company
Payroll Costs 500.0 No market – costs allocated
by time
24.0
Thames Water Commercial Services Limited
Commercial Company
Support Services – No market – costs allocated
by time
70.8
1,671.11 The Group means the group of companies headed by Kemble Water Holdings Limited, the ultimate parent company.2 The Kemble Group of companies refers to all those companies included within the Kemble Holdings Limited Group consolidation, of
which Thames Water Utilities Limited is a member (see Group Structure on page 90).
Supply of tradeAdditional regulatory information continued
Thames Water Combined Report 2019/20 248Strategic report Governance Financial statements Annual performance report

Services provided to the Company by associated companies
Associate companyCompany principal activity Service provided
Income of associate during 2019/20 (£’000) Terms of supply Value (£’000)
Thames Water Property Services Limited
Property Company
Payroll Costs 161.0 No market – actual costs
recharged
188.6
Thames Water Property Services Limited
Property Company
Facilities Services
161.0 Negotiated price
6.2
Thames Water Utilities Holdings Limited
Holding Company
Tax paid (group relief)
– No market – actual cost
5,800.0 *
Dunelm Energy Limited
Management Consultancy Company
Administrative Services
Not available – small company
exemption
Negotiated 30.8
6,025.6
Payments to companies with common DirectorsCompany Common Director Service Terms of supply Value (£'000)
Water UK Stephen Robertson Memberships & Subscriptions
Mandatory Fee 567.1
Omers Infrastructure Europe Limited
Michael McNicholas Directors Fees Negotiated 120.0
Energy Networks Associated Limited
John Morea Memberships & Subscriptions
Mandatory Fee 4.7
Arqiva Limited Paul Donovan Smart Metering Negotiated 17,669.918,361.7
* The tax paid relates to the purchase of tax losses from the Company’s immediate parent company, Thames Water Utilities Holdings
Limited. 100% of the tax losses have been purchased by the non-appointed business. In addition, the appointed business is sharing tax
losses worth £2.0 million with the non-appointed business for which not payment is made as both are within the same company.
Directorships held in Group CompaniesThe Company discloses the following information as part of its compliance with RAG 5.07, listing those Directors of the Company who are also directors of the following Group companies during the year ended 31 March 2020 and up to the date of signing this report:
DirectorThames Water
Utilities Limited
Thames Water
Utilities Holdings
Limited
Thames Water
Limited
Kemble Water
Finance Limited
Kemble Water
Eurobond PLC
Kemble Water
Holdings Limited
Thames Water
Commercial Ventures Holdings
Limited
Thames Water
Commercial Ventures Finance Limited
Thames Water
Procure-ment
Limited
Executive Directors
Stephen Robertson R – 24/05/2019
Brandon Rennet
Non-Executive Directors
Kenton Bradbury R – 01/07/2019
Michael McNicholas A – 01/07/2019
John Morea
Christopher Deacon R – 01/07/2019
Gregory Pestrak
Paul Donovan A – 01/07/2019
Independent Non-Executive Directors
Alistair Buchanan
Catherine Lynn
David Waboso
Ian Marchant
Ian Pearson
Jill Shedden
Nick Land
Key: R – resigned A – appointed
Thames Water Utilities Limited conducts its appointed business so as to ensure arm’s length trading and avoidance of cross-subsidy in the spirit of Condition F of the Instrument of Appointment.
Supply of trade continued
Thames Water Combined Report 2019/20 249Strategic report Governance Financial statements Annual performance report

Borrowings and LoansAll borrowings from the Company’s wholly owned subsidiaries are disclosed in note 36 of the AR&FS on page 197.
All loans to the Company’s wholly owned subsidiaries are disclosed in note 32 of the AR&FS on page 195.
Transfer of assets by or to the appointeeThere were no transfers of assets or liabilities by or to the Company in excess of the materiality limit (2019: £nil).
Guarantees or other forms of security by the appointeeThe Company, as part of the Whole Business Securitisation (‘WBS’) capital structure, guarantees unconditionally and irrevocably all the borrowings and derivatives of Thames Water Utilities Finance plc as listed on page 149 for the year ended 31 March 2020.
Omissions of rightsThere were no omissions of rights during the year (2019: none).
Waiver of any consideration, remuneration or other payment by the appointeeThere were no waivers of any consideration, remuneration or other payments by the appointee during the year (2019: none).
Dividends paid to associated undertakingsThe Company’s dividend policy, which was in place during the year, is to pay a progressive dividend commensurate with long-term returns and business performance, after considering the business’ current and expected regulatory and financial performance, regulatory restrictions, management of economic risks and debt covenants. For further information on the dividend policy please see page 128.
During the year, the Company paid interim dividends of £56.5 million (2019: £60.0 million) to its immediate parent company, Thames Water Utilities Holdings Limited. Of these dividend payments, none were made to external shareholders of the Group (2019: none). The chart on page 62 of the AR&FS shows how the dividends were utilised within the Group.
Our Group structureStrategic and operational oversight of the Company is led by the Company’s Board. The Board’s primary responsibility is to promote the long-term success of the Company for the benefit of its customers, employees, shareholders and other stakeholders.
Kemble Water Holdings (“KWH”) Limited is considered to be the ultimate parent company. The primary activity of KWH is to act as a holding company in the Group. Approval of certain matters are specifically reserved for the Board of KWH, including approval of the annual budget, significant investment, material transactions such as major acquisitions and divestment and certain strategic decisions.
The Group structure chart shown on page 90 of the AR&FS sets out the ownership of Thames Water Utilities Limited and its subsidiary.
Supply of trade continued Directors’ Ring-fencing Certificate under Condition P of the Company’s Instrument of Appointment
This is to certify that at their meeting on 24 June 2020, the Directors of Thames Water Utilities Limited (“the Appointee”) resolved that, in their opinion, for at least the next 12 months:
• the Appointee will have available to it sufficient:
• financial resources and facilities;
• management resources;
• systems of planning and internal control; and
• rights and resources other than financial resources.
enabling it to carry out the Regulated Activities necessary to fulfil the Appointee’s obligations under the Licence of Appointment without being dependent upon the discharge of another person of any obligation under, or arising from, any agreement or arrangement under which that other person has agreed to provide any services to the Appointee in its capacity as a Relevant Undertaker.
• all contracts entered into between the Appointee and any Associated Company include the necessary provisions and requirements in respect of the standard of service to be supplied to the Appointee, to ensure that it is able to carry out the Regulated Activities; and
• any issues or circumstances that may materially affect the Appointee’s ability to carry out its Regulated Duties are noted below and/or within the Risk and Compliance Statement on pages 253-259.
This Ring-fencing Certificate is an annual requirement under Condition P of the Instrument of Appointment (also known as the ‘Licence’). The equivalent statement provided in our 2018/19 Annual Performance Report was titled as the Directors’ Certificate of Sufficiency of Resources under Condition P – which we have now renamed following further guidance from Ofwat issued in February 2020 (IN20/01).
The Board notes that the latest Ofwat guidance set out in IN20/01 for completion of the Ring-fencing Certificate requires the Board to state its opinion on whether the Appointee has ‘sufficient’ resources to deliver its regulated activities for the next 12 months. Condition P of our Licence requires that we have ‘adequate’ resources in place. The Board is satisfied that its stated opinion set out above regarding the sufficiency of the Appointee’s resources also addresses its Licence obligation to maintain ‘adequate’ resources.
The Licence also requires a statement of the main factors which the Board has taken into account in giving its opinion for the Ring-fencing Certificate.
Thames Water Combined Report 2019/20 250Strategic report Governance Financial statements Annual performance report

In providing this opinion, the Directors have considered many factors as part of their enquiries prior to signing this certificate, including but not limited to:
Financial resources and facilities
• the Appointee’s Final Determination for the 2015-2020 regulatory period; • the Appointee’s Final Determination for the 2020-2025 regulatory period, accepted by the Company in
February 2020. See section on ‘material issues and circumstances’ below for further discussion; • the Appointee’s available cash resources and borrowing facilities of £1.7 billion, which include significant,
undrawn bank facilities, and take into account: • the Appointee’s investment requirements to deliver stretching performance commitments in AMP7; and • the Appointee’s projected net cash flow for the next 12 months.
• the Appointee’s investment grade ratings, as shown on page 64 of this report which retain at least one full notch headroom over minimum investment grade;
• the Appointee’s compliance with its financial covenants as disclosed on page 65 of this report; • the Appointee’s compliance with its dividend principles; and • the preparation of the Appointee’s statutory accounts on a going concern basis and long-term viability
which also takes into account an assessment of the Covid-19 impact – this is disclosed on pages 129 and 75 and 78 of this report respectively.
Management resources
• the tone from the top established by the Appointee’s Executive Committee articulated through the Appointee’s code of conduct and values;
• the Appointee’s People Strategy and People Plans which ensure that the Appointee has access to personnel which will enable it to deliver its regulatory obligations. In particular:
• the Appointee’s leadership and organisational structure, operating model and human resources (succession) planning strategy;
• the Appointee’s training and development programme for all employees enabling its people to gain skills appropriate to their roles;
• the Appointee’s recruitment, reward and recognition strategy to attract high calibre candidates and retain employees with appropriate skills and experience; and
• the Appointee’s ongoing commitment to diversity and inclusion enables attraction and retention of diverse talent and allows us to harness the unique skills, experiences and backgrounds that each individual brings. This has been externally recognised by the Appointee being awarded Disability Confident Leader status and by a significant improvement in its Stonewall Workplace Equality Index, for more detail see page 27 of this report.
• the Appointee’s confirmation, as shown on page 82 of this report, on how it meets the board leadership, transparency and governance objectives set out in its Instrument of Appointment. This includes:
• the independence of the Appointee’s Board from management; • the implementation of recommendations following the governance review of the Appointee’s Board
and the committees that report into them; and • the Appointee’s dividend policy and that it does not impair the Appointee’s ability to finance the
Appointed Business and that it rewards efficiency and management of economic risk. • the Appointee’s comprehensive programme of Board and Executive meetings, including specific ‘deep
dives’ on key risks and processes, supported by appropriate reports and information to enable high quality decision making.
Directors’ Ring-fencing Certificate under Condition P of the Company’s Instrument of Appointment continued
Systems of planning and internal control
• the Appointee’s formal risk management process, which reviews, monitors and reports on the principal risks & uncertainties and mitigating controls as disclosed on pages 66 to 74 of this report;
• the Appointee’s performance in respect of its Performance Commitments as disclosed in table 3A on pages 236 to 240 of this report and made reference to in the Risk & Compliance Statement on pages 253-259;
• the Appointee’s generation and use of relevant, quality information in support of the functioning of internal control;
• the Appointee’s risk and assurance strategy using a mix of management control, oversight functions and independent assurance;
• the Appointee’s business continuity planning process, including plans for corporate sites covering a range of scenarios such as potential loss of resources (e.g. through a pandemic, loss of a building or loss of systems). Plans continue to be developed as the Appointee responds to and learns from the Covid-19 pandemic, which includes identification of critical roles, trigger levels and actions required as a result of a reduction in resources to continue to provide service to its customers. Further information on the Appointee’s response to Covid-19, and how it works across the sector and with its regulator is provided under material issues and circumstances below;
• the Appointee’s incident management processes which have been redeveloped in 2019/20 to align to industry best practice and to adopt learning taken from recent incidents including the freeze-thaw of 2018, the Hampton burst main in June 2019 and the incident at Finsbury Park in October 2019. The new processes went live in April 2020 amidst the Covid-19 pandemic, following months of preparations, planning, training and practical exercises. The success of the new approach can be seen in the clear and effective management by the Appointee of the Coronavirus situation.
• the Appointee’s commitment to integrity and ethical values. Its policies to prevent fraud and other unethical behaviour, mandatory training for staff on ethical matters and an anonymous whistleblowing hotline which has been supported by a proactive campaign to raise awareness; and
• the Appointee’s ability to meet its legal obligations.
Rights and resources other than financial resources
• The Appointee’s purpose, strategy, values and behaviours which set a clear direction for everyone across the business for the 2020 to 2025 regulatory period. The Appointee’s Board engaged on the development of each component and how they align as Thames Water’s ‘big picture’ to inspire employees and drive the right outcomes. Launched in April 2020, a series of both short-term and long-term employee engagement initiatives are in progress and planned to embed the ‘big picture’ and evolve the Appointee into a purpose-led organisation;
• The Appointee’s digital strategy and design principles have supported transformation of IT performance and resilience – including replacement of the Appointee’s billing system and significant investment in modernisation of underlying infrastructure. This is underpinned by IT policies which ensure the operation and security of the technology assets essential to service provision;
• The Appointee’s ability to be resilient by anticipating, coping with, recovering from and learning from disruptive events in order to maintain and improve quality of services for our customers and protecting the natural environment both now and in the future;
• The Appointee’s integrated planning systems and development of a systems thinking approach; • The Appointee’s asset maintenance policies and systems to monitor asset health which are designed to
ensure that it acts with intelligence using data from customers, operations and the environment, to make accurate and proactive business decisions that maximise productivity, prevent asset deterioration and to improve the service which it provides to its customers; and
• The Appointee’s insurance programmes, including terms, counterparties and cover limits which have been reviewed by an independent insurance adviser and approved by the Board.
Thames Water Combined Report 2019/20 251Strategic report Governance Financial statements Annual performance report
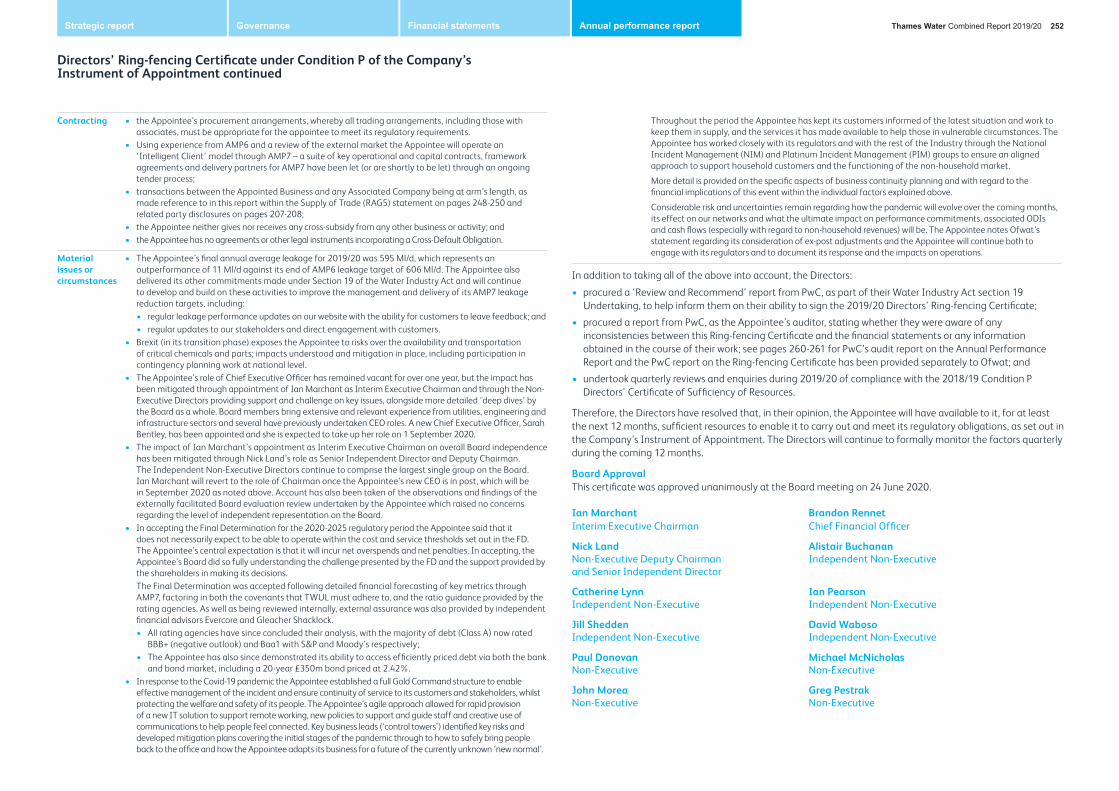
Contracting • the Appointee’s procurement arrangements, whereby all trading arrangements, including those with associates, must be appropriate for the appointee to meet its regulatory requirements.
• Using experience from AMP6 and a review of the external market the Appointee will operate an ‘Intelligent Client’ model through AMP7 – a suite of key operational and capital contracts, framework agreements and delivery partners for AMP7 have been let (or are shortly to be let) through an ongoing tender process;
• transactions between the Appointed Business and any Associated Company being at arm’s length, as made reference to in this report within the Supply of Trade (RAG5) statement on pages 248-250 and related party disclosures on pages 207-208;
• the Appointee neither gives nor receives any cross-subsidy from any other business or activity; and • the Appointee has no agreements or other legal instruments incorporating a Cross-Default Obligation.
Material issues or circumstances
• The Appointee’s final annual average leakage for 2019/20 was 595 Ml/d, which represents an outperformance of 11 Ml/d against its end of AMP6 leakage target of 606 Ml/d. The Appointee also delivered its other commitments made under Section 19 of the Water Industry Act and will continue to develop and build on these activities to improve the management and delivery of its AMP7 leakage reduction targets, including:
• regular leakage performance updates on our website with the ability for customers to leave feedback; and • regular updates to our stakeholders and direct engagement with customers.
• Brexit (in its transition phase) exposes the Appointee to risks over the availability and transportation of critical chemicals and parts; impacts understood and mitigation in place, including participation in contingency planning work at national level.
• The Appointee’s role of Chief Executive Officer has remained vacant for over one year, but the impact has been mitigated through appointment of Ian Marchant as Interim Executive Chairman and through the Non-Executive Directors providing support and challenge on key issues, alongside more detailed ‘deep dives’ by the Board as a whole. Board members bring extensive and relevant experience from utilities, engineering and infrastructure sectors and several have previously undertaken CEO roles. A new Chief Executive Officer, Sarah Bentley, has been appointed and she is expected to take up her role on 1 September 2020.
• The impact of Ian Marchant’s appointment as Interim Executive Chairman on overall Board independence has been mitigated through Nick Land’s role as Senior Independent Director and Deputy Chairman. The Independent Non-Executive Directors continue to comprise the largest single group on the Board. Ian Marchant will revert to the role of Chairman once the Appointee’s new CEO is in post, which will be in September 2020 as noted above. Account has also been taken of the observations and findings of the externally facilitated Board evaluation review undertaken by the Appointee which raised no concerns regarding the level of independent representation on the Board.
• In accepting the Final Determination for the 2020-2025 regulatory period the Appointee said that it does not necessarily expect to be able to operate within the cost and service thresholds set out in the FD. The Appointee’s central expectation is that it will incur net overspends and net penalties. In accepting, the Appointee’s Board did so fully understanding the challenge presented by the FD and the support provided by the shareholders in making its decisions.
The Final Determination was accepted following detailed financial forecasting of key metrics through AMP7, factoring in both the covenants that TWUL must adhere to, and the ratio guidance provided by the rating agencies. As well as being reviewed internally, external assurance was also provided by independent financial advisors Evercore and Gleacher Shacklock.
• All rating agencies have since concluded their analysis, with the majority of debt (Class A) now rated BBB+ (negative outlook) and Baa1 with S&P and Moody’s respectively;
• The Appointee has also since demonstrated its ability to access efficiently priced debt via both the bank and bond market, including a 20-year £350m bond priced at 2.42%.
• In response to the Covid-19 pandemic the Appointee established a full Gold Command structure to enable effective management of the incident and ensure continuity of service to its customers and stakeholders, whilst protecting the welfare and safety of its people. The Appointee’s agile approach allowed for rapid provision of a new IT solution to support remote working, new policies to support and guide staff and creative use of communications to help people feel connected. Key business leads (‘control towers’) identified key risks and developed mitigation plans covering the initial stages of the pandemic through to how to safely bring people back to the office and how the Appointee adapts its business for a future of the currently unknown ‘new normal’.
Directors’ Ring-fencing Certificate under Condition P of the Company’s Instrument of Appointment continued
Throughout the period the Appointee has kept its customers informed of the latest situation and work to keep them in supply, and the services it has made available to help those in vulnerable circumstances. The Appointee has worked closely with its regulators and with the rest of the Industry through the National Incident Management (NIM) and Platinum Incident Management (PIM) groups to ensure an aligned approach to support household customers and the functioning of the non-household market.
More detail is provided on the specific aspects of business continuity planning and with regard to the financial implications of this event within the individual factors explained above.
Considerable risk and uncertainties remain regarding how the pandemic will evolve over the coming months, its effect on our networks and what the ultimate impact on performance commitments, associated ODIs and cash flows (especially with regard to non-household revenues) will be. The Appointee notes Ofwat’s statement regarding its consideration of ex-post adjustments and the Appointee will continue both to engage with its regulators and to document its response and the impacts on operations.
In addition to taking all of the above into account, the Directors:
• procured a ‘Review and Recommend’ report from PwC, as part of their Water Industry Act section 19 Undertaking, to help inform them on their ability to sign the 2019/20 Directors’ Ring-fencing Certificate;
• procured a report from PwC, as the Appointee’s auditor, stating whether they were aware of any inconsistencies between this Ring-fencing Certificate and the financial statements or any information obtained in the course of their work; see pages 260-261 for PwC’s audit report on the Annual Performance Report and the PwC report on the Ring-fencing Certificate has been provided separately to Ofwat; and
• undertook quarterly reviews and enquiries during 2019/20 of compliance with the 2018/19 Condition P Directors’ Certificate of Sufficiency of Resources.
Therefore, the Directors have resolved that, in their opinion, the Appointee will have available to it, for at least the next 12 months, sufficient resources to enable it to carry out and meet its regulatory obligations, as set out in the Company’s Instrument of Appointment. The Directors will continue to formally monitor the factors quarterly during the coming 12 months.
Board Approval This certificate was approved unanimously at the Board meeting on 24 June 2020.
Ian Marchant Brandon RennetInterim Executive Chairman Chief Financial Officer
Nick Land Alistair BuchananNon-Executive Deputy Chairman Independent Non-Executive and Senior Independent Director
Catherine Lynn Ian PearsonIndependent Non-Executive Independent Non-Executive
Jill Shedden David WabosoIndependent Non-Executive Independent Non-Executive
Paul Donovan Michael McNicholasNon-Executive Non-Executive
John Morea Greg PestrakNon-Executive Non-Executive
Thames Water Combined Report 2019/20 252Strategic report Governance Financial statements Annual performance report

Maintaining the supply of clean drinking water as well as the removal and treatment of wastewater are essential services we provide to our customers. We take this responsibility very seriously alongside our wider commitments to protecting and enhancing the environment, making our services affordable for all and ensuring compliance with a range of statutory, licence and regulatory obligations.
We recognise the importance of open and honest reporting on our level of compliance with these commitments and obligations in order to build trust and confidence with our customers, stakeholders and society as a whole.
This statement sets out the processes we have in place to demonstrate to our customers, to Ofwat and to our other stakeholders, our compliance with relevant statutory, licence and regulatory obligations, where Ofwat is the relevant enforcement authority. The obligations pertinent to our functions as a statutory Water and Sewerage Undertaker are primarily set down in the Water Industry Act 1991 and our Instrument of Appointment – our “Licence”2. The Licence also requires us to perform duties imposed under any other statutory and regulatory guidelines as necessary to fully discharge our obligations.
Our approach to achieving compliance with our statutory, licence and regulatory obligations is based on establishing sound governance, risk management and having a system of internal controls. Towards the end of the financial year, the effects of Covid-19 on the United Kingdom and on Thames Water were escalating. The full impact of Covid-19 on compliance with our statutory, licence and regulatory obligations is expected to become clearer during the 2020/21 financial year.
This statement covers the reporting year 1 April 2019 to 31 March 2020, and is set out in four sections:
Section 1: Our Board Assurance Statement which confirms the extent of our compliance with our obligations;
Section 2: The steps we have taken to understand and meet our customers’ expectations;
Section 3: The processes and assurances we have in place to achieve compliance with our obligations; and
Section 4: Sets out compliance exceptions.
2 https://www.ofwat.gov.uk/publication/thames-water-utilities-limited-appointment/
1. Board Assurance StatementThe Board of Thames Water Utilities Limited is satisfied that we have, except where otherwise detailed:
• A full understanding of, and have complied, in all material respects, with our statutory, licence and regulatory obligations;
• Taken appropriate steps to understand and meet the expectations of our customers;
• Appropriate systems and processes in place to identify, manage and review our material risks; and
• Sufficient processes and systems of internal control to deliver our services to customers and meet our obligations.
We also confirm that we have:
• Provided Ofwat with assurance that we have sufficient financial and management resources to enable us to carry out our regulated activities for at least the next 12 months (as detailed within our Ring Fencing Certificate on pages 250-252);
• Sufficient rights and resources to enable a special administrator to run our Company if such an order were to be made (as detailed within our Ring Fencing Certificate);
• Made sure that all trade with associated companies in the year has been at arm’s length, as set out in Regulatory Accounting Guidance (RAG 5.07 – Guideline for transfer pricing and RAG3.11 – Transactions with associates and the non-appointed business as found within the Supply of Trade disclosure on pages 248-250);
• Maintained an investment grade credit rating of at least Baa2 (as detailed in page 64;
• A principles based dividend policy in place (details of which can be found in the Directors’ Report on page 128);
• Considered the financial impact of a range of severe, but plausible risk scenarios materialising to enable us to provide reasonable assurance that we will be able to continue in operation and meet our liabilities as they fall due over the next ten years, to 2030, as set out in our Long-Term Viability Statement (which can be found on pages 75 to 78);
• Explained how we link Directors’ pay to standards of performance as set out in section 35A of the Water Industry Act 1991 (further details can be found in the Directors’ Remuneration Report on pages 108 to 127);
• Made our auditors aware of all relevant information (as required under the Companies Act 2006); and
• Reported in Section 4 where we have not achieved the level of performance agreed in our 2015-20 Final Determination. Further information is available within our Performance Dashboard (pages 31 to 47) and Performance Summary (pages 236 – 241).
Risk and Compliance Statement 2019/20
Thames Water Combined Report 2019/20 253Strategic report Governance Financial statements Annual performance report

1. Board Assurance Statement continuedDuring the course of its work, our independent assurer, PwC is required to report if there are any material inconsistencies between the Regulatory Accounting Statements and other information contained with the Annual Performance Report; this includes the information contained within this Risk and Compliance statement. PwC has not identified anything to report in respect of this responsibility. A copy of the Independent Auditors’ Report is provided on pages 260-261.
Signed by the Board of Thames Water Utilities Limited:
Ian Marchant Brandon RennetInterim Executive Chair Chief Financial Officer
Nick Land Alistair BuchananNon-Executive Deputy Chairman Independent Non-Executive and Senior Independent Director
Catherine Lynn Ian PearsonIndependent Non-Executive Independent Non-Executive
Jill Shedden David WabosoIndependent Non-Executive Independent Non-Executive
Paul Donovan Michael McNicholasNon-Executive Non-Executive
John Morea Greg PestrakNon-Executive Non-Executive
2. Understanding and meeting our customers’ expectations2.1 Internal governance and external challengeWe are committed to understanding our customers’ needs & expectations and responding to them in our ongoing operations and future plans. Our programme of customer engagement is led by our Customer Experience Director and overseen by the Customer Service Committee (a sub-Committee of our Board).
Our proposals and plans in response to customers’ views are presented for robust external challenge from groups such as our Customer Challenge Group (CCG), CCW (the Consumer Council for Water)3 and other customer representatives. Members of Thames Water’s Board and Executive team have participated personally in meetings of our CCG and CCW to help ensure effective oversight of our customer engagement activities.
The CCG’s role is to challenge us and provide assurance to customers and Ofwat on the quality of our customer engagement and how much of this engagement is driving decision making and the degree to which this is reflected in our business plan. Our CCG also monitors and challenges on our performance against our customer commitments, and how this is reported to our customers.
We continue to share our operational performance with CCW each quarter and our Customer Experience and Operations Directors meet with them to facilitate scrutiny of our activities.
2.2 Our customers’ expectationsIn order to understand what customers want, we have a customer engagement programme that continuously gathers insights into customers’ needs and behaviours. Our insights are gained from working with diverse customer groups as well as using a wide variety of information gathering techniques. This ranges from bespoke research into specific topics, regular insight gathering on brand perception and service surveys and listening to social media. We also consistently check external sources.
Our key customer expectations have not changed significantly over the last year and are as follows:
a. Deliver an effortless customer experience;
b. Deliver a safe and dependable water service and wastewater service;
c. Plan for the future; and
d. Be a responsible company.
3 CCW is a statutory consumer body for the water industry who provide guidance and information and who’s mission it is for securing a safe, reliable service, and a fair deal for water consumers.
Risk and Compliance Statement 2019/20 continued
Thames Water Combined Report 2019/20 254Strategic report Governance Financial statements Annual performance report

2. Understanding our customers’ expectations continued2.3 Meeting our customers’ expectationsOur performance commitments are a response to customer expectations and provide a transparent way of demonstrating the extent to which we are delivering for customers (provided in table 3A on pages 236-240). The Service Incentive Mechanism (SIM) and the new customer measure of experience (C-MeX) also enable customers and other stakeholders to assess our progress in meeting expectations.
In the 2015-2019 reporting periods, SIM was used by Ofwat as a measure of customer satisfaction. During this period they applied financial penalties based on our performance relative to other companies. In 2019/20 we are reporting a SIM Proxy and shadow reporting on C-MeX which will be used from 2020/21. Written complaints relating to water services were 24% lower than last year however, we had a challenging year in relation to revenue complaints. This resulted in our overall performance remaining 9% higher than 2018/19 with our SIM Proxy showing continued poor performance.
Given the size and mechanic of the C-MeX survey, we are evaluating our performance through a mix of customer satisfaction (CSAT measured through service surveys), brand perception (relationship net promoter score measured through a survey conducted by an external company on our behalf) and complaints.
Our target for CSAT for the year was 4.62 and our actual score was 4.41. The key reasons for the performance include the time taken to get through to revenue agents and their knowledge to provide support as we have been training them on our new billing system. Now that we have migrated the majority of customers to this upgraded system, we expect to start seeing satisfaction improvements going forward. In Operations (both water and waste), dissatisfaction has been driven through time taken to resolve problems. Brand perception net promoter score (NPS) target for the year was -194. While we have achieved -18 across the full year, our NPS score for Q4 has been poor (-24), driven by a mix of bad weather and our billing system migration. While this is disappointing, it is worth noting that a similar decline has been seen across the industry and we are using the learning from this survey to inform our service improvement and marketing plans for the coming year.
4 We ask customers to give us a score from 1 to 10 on ‘how likely is it that they would recommend Thames’. A customer giving a 9 or 10 is called a promoter and a customer giving a score between 1 to 6 is a detractor. NPS uses these scores to calculate the relative number of promoters compared to detractors between the range of -100 (all detractors) to +100 (all promoters).
2.4 Our areas of focus and achievementsKey areas of focus in the last year to meet our customer expectations and drive improvements in customer satisfaction, brand perceptions and complaints include:
Customer expectation Area of focus and achievements
Deliver an effortless customer experience
We have invested in a new web platform, which has focused on ensuring we build content editable functionality and improved accessible design. The web team is set up to deliver in an agile methodology so that we can make changes, optimise and deliver improvements for the customer very quickly. We have introduced several new features in the year including “report a leak” and “view problem” functionality which has seen significant traffic (74k in February 2020). Going forward, we will be continuing to enhance the new website, decommission the old platforms and build new features to enable more of our customers to self-serve.
Customer expectation Area of focus and achievements
Safe and dependable water/wastewater service provider
Feedback from our ongoing transactional customer satisfaction surveys continues to provide us with customer experience performance data. This is used to better manage our operations and identify focus areas for improvements. We know that customers see leakage from pipework as an important issue. We have continued to work with customer groups taking on board their views and to show them the work that we are doing to reduce this and how we respond to major events. We have aligned our incident management structure with those who operate best practice within the emergency services. Feedback from customers that have contacted us about a visible leak or a customer-side leak shows our performance in these areas has steadily improved throughout 2019/20.Our leakage performance has significantly improved this year (595 Ml/d) and has been one of the biggest reductions in the industry in this century. However, we know we have more to do with perception on both water and wastewater and to support this we are investing in improving how we act on the feedback customers provide through our service survey. We are improving our survey coverage and response processes with a view to improving customer satisfaction performance and also pre-emptive reduction of complaints as a result.
Plans for the future
We listened to what customers have previously told us and completed the re-platforming of our billing system. This has been a significant piece of work where we have completely changed our solution and migrated millions of customers to the new system while continuing our revenue operations. Most customers are now seeing the benefits of quicker and improved interactions with us. As expected with any big system change, there have been some teething problems, coupled with recruitment and training of new staff. But we are now settling in and seeing a steady improvement in CSAT and expect the customer and operational benefits to continue into 2020/21. The migration of the remaining circa 400k customers on the old platform is expected to be completed in the first part of 2020/21. We are also investing in our telephone system and other digital channels (like webchat and asynchronous messaging) and will start seeing benefits of these upgrades to the customer experience later in the year.
Be a responsible company
Many of our customers need extra support from us and this has continued to be a point of focus. The number of customers who are benefiting from being on our priority services register now stands at 82k while a further 150k who may struggle to pay their bill are being charged on our reduced social tariff which makes it more affordable for them. There is a lot more that we can do, and we are working with other organisations such as the NHS and companies within the energy sector to see if we provide support across sectors. We have more to do on the priority services register and recruiting more people into this. We trained a number of our staff on “spotter training” where they are able to spot and recruit customers to the priority services register. We have also improved the automation of our processes.On affordability, we are well above target – we have one of the largest number of customers on discounted tariffs and nearly 80% of our customers are aware of the help we offer. We have also introduced flexible payment breaks for customers facing short-term affordability issues (e.g. during the coronavirus pandemic). We are investing a significant amount of money in our customer assistance fund (£4m for 2020/21) to support customers in debt and working closely with our Trust Fund, which is an independent, registered charity, to fund organisations providing debt advice and support in our region.
Risk and Compliance Statement 2019/20 continued
Thames Water Combined Report 2019/20 255Strategic report Governance Financial statements Annual performance report

2. Understanding our customers’ expectations continued2.5 Building the Thames customer focussed cultureOne of the most significant changes we have made over the past year is to address culture within our company to support our people to treat customers like family. Our HEART campaign programme is designed to embed behaviours that are truly focussed on placing the customer at the centre of everything we do. Each letter represents a different behaviour designed to concentrate our teams on customer led solutions and encourages them to treat customers like family.
When customers feel the need to complain we have significantly improved our response times and aim to contact all customers within the first 48 hours of us receiving their written complaint. Our relationship with CCWater has much improved over the last 12 months, with regular fortnightly case review calls underway. We have initiated a project supported by CCWater to improve the quality, tone and voice of our written complaint letters and are restructuring the Retail and Operational complaint teams to align complaints as core functions under each Head of Business.
We have made significant progress this year to improve the service we offer our customers, however, there is more to do. We are continually looking at feedback from our customers by regularly reviewing service and brand surveys. Not only do we use this information to coach our teams, but also to respond to customers who are dissatisfied, to put things right.
Risk and Compliance Statement 2019/20 continued
3. Processes and the assurances we have in place to meet our obligations3.1 Managing our risks The Board is responsible for maintaining a sound system of risk management. This includes the determination of the nature and extent of risk it is willing to take to achieve its strategic objectives, and for ensuring that an appropriate risk culture has been embedded throughout the organisation.
We align our risk management approach to industry best practice (ISO 31000) and seek regular engagement with stakeholders, external support partners and peer companies to challenge our process against best practice. Our risk management process allows Directors to demonstrate compliance with their duties as required under the UK Companies Act 2006 and supports compliance with the UK Corporate Governance Code.
To support the above requirements, we monitor and challenge our risk management through processes including:
• Monthly performance reporting of risks and mitigations, including against regulatory measures;
• Quarterly oversight of risk and the risk management process by the Executive Committee, and Audit, Risk and Reporting Committee (ARRC);
• An annual internal audit plan that provides independent assurance over company objectives and exposure to risk through consideration of the Company’s risk profile as well as stakeholder priorities; and
• An annual Risk report to the ARRC and Board which summarises the activities undertaken in the year by the Risk, Audit and Assurance team. This report also supports the ARRC and the Board in making their annual statement on the effectiveness of our system of internal controls. The statement can be found in the Audit, Risk and Reporting Committee report (pages 100 to 104).
The Company reports to its stakeholders primarily through the Annual Report and Financial Statements (pages 132– 214). This is where we publish our approach to risk management, principal risks and uncertainties and our Long-Term Viability Statement. Together these set out the material risks the Company is currently facing, together with mitigation steps it is taking.
3.2. Our internal control environmentOur internal control environment (or “system of internal control”) has been designed to align and be integrated with our risk management approach, as well as fully considering industry best practices as set out by (the):
• Committee of Sponsoring Organisations of the Treadway Commission (COSO) Internal Control – Integrated Framework (2013);
• Financial Reporting Council Guidance on Risk Management, Internal Control and Related Financial and Business Reporting; and
• professional bodies such as the Institute of Risk Management and Chartered Institute of Internal Audit.
The Board is ultimately responsible for ensuring we have an appropriate system of internal control. They are assisted by the ARRC who receive reports on the design and effectiveness of internal controls and risk mitigation strategies. This is primarily through our risk management reporting arrangements, compliance and internal audit activities, as well as from external assurance providers.
Thames Water Combined Report 2019/20 256Strategic report Governance Financial statements Annual performance report

3. Processes and the assurances we have in place to meet our obligations continuedIn addition, we employ relevant expertise to ensure that we understand our statutory, regulatory and licence obligations and can translate them into policies and procedures for colleagues to apply. This expertise includes, but is not limited to, legal, financial, regulatory, health and safety, asset and process engineers and environmental professionals. We also draw upon additional external expertise, where necessary, to ensure that any new, or changes to our existing, obligations are appropriately interpreted and applied. Management and oversight teams monitor compliance with approved policies and procedures on a regular basis.
We are continuing to deepen our formally documented system of internal control to increase visibility and further embed a risk-based “three lines of defence” assurance model throughout our business. This distinguishes between first line processes and controls, second line oversight and third line independent assurance. The diagram below demonstrates how this structure is applied to our business.
Three lines of defence assurance model
Corporate governance framework
Risk governance framework
1st line of defenceBusiness functions that OWN and MANAGE risks and controls
• Water production
• Water distribution
• Waste transport
• Waste treatment
• Customer services
2nd line of defenceBusiness functions that OVERSEE risks and controls
• Water quality compliance
• Health, safety & wellbeing
• Enterpise risk management
• Ofwat regulatory compliance
• Environmental regulatory compliance
• Internal controls testing
3rd line of defenceBusiness functions that provide independent assurance
• Internal audit
• External audit
• Other third party assurance providers
Source: Thames Water
Risk and Compliance Statement 2019/20 continued
3.3 Providing assurance over our risksEach line of defence has performance monitoring and reporting in place on their activities. Our management and organisational structure collects, collates and consolidates all this information for Senior Management, Executive, and ultimately our Board. Our leadership uses this information to manage our risks and obligations. The following diagram gives examples of this approach:
Example assurance activities over our risks
1st line of defence – Business functions that OWN and MANAGE risks and controls • Annual control self-assessment where senior leaders provide assurance over their team’s
awareness and compliance with relevant legislation, regulation, policies and procedures. Areas for improvement are identified, with action plans put in place
• Management reporting on business operations and performance (e.g. drinking water quality, pollution events, and health & safety incidents)
Corp
orat
e go
vern
ance
fram
ewor
k (i.
e. E
xecu
tive
and
Boa
rd)
2nd line of defence – Business functions that OVERS EE risks and controls • Individual senior leaders have responsibility for compliance with specific licence conditions,
as well as legal and regulatory obligations, for example our Data Protection Officer, Head of S cience & Engineering, Head of Health, S afety & Wellbeing
• Our Regulation function are accountable for establishing and monitoring the compliance framework over our licence and Ofwat obligations, this means setting policies and standards for our business to follow (e.g. when there are changes to our licence conditions)
• Specialist teams within our Operations function are accountable for establishing the compliance framework over the safe and dependable delivery of drinking water (e.g. Drinking Water Quality) and the environmental responsible removal of wastewater (e.g. Environmental Regulation)
3rd line of defence – Business functions that provide INDEPENDENT ASSURANCE • Internal audit complete an annual cycle of independent reviews agreed by the ARRC .
These are driven by material business risks and key process and will include compliance with relevant statutory, licence and regulatory obligations
• External audit and other third party independent assurance providers are used where there is an obligation (e.g. statutory external audit), or for specialist topics where we do not have the capacity or capability retained in-house
C
Source: Thames Water
In addition, to identify any gaps and ensure effective coverage over our risks and obligations, we reported in our last Annual Report and Annual Performance Report that we had begun an assurance mapping exercise. This specific project has been further defined with our current priorities being the refinement of our enterprise risk management processes and documenting our system of internal control. All these activities are critical components of an effective aligned assurance framework and support our efforts to continue increasing the maturity of our assurance reporting processes.
Thames Water Combined Report 2019/20 257Strategic report Governance Financial statements Annual performance report
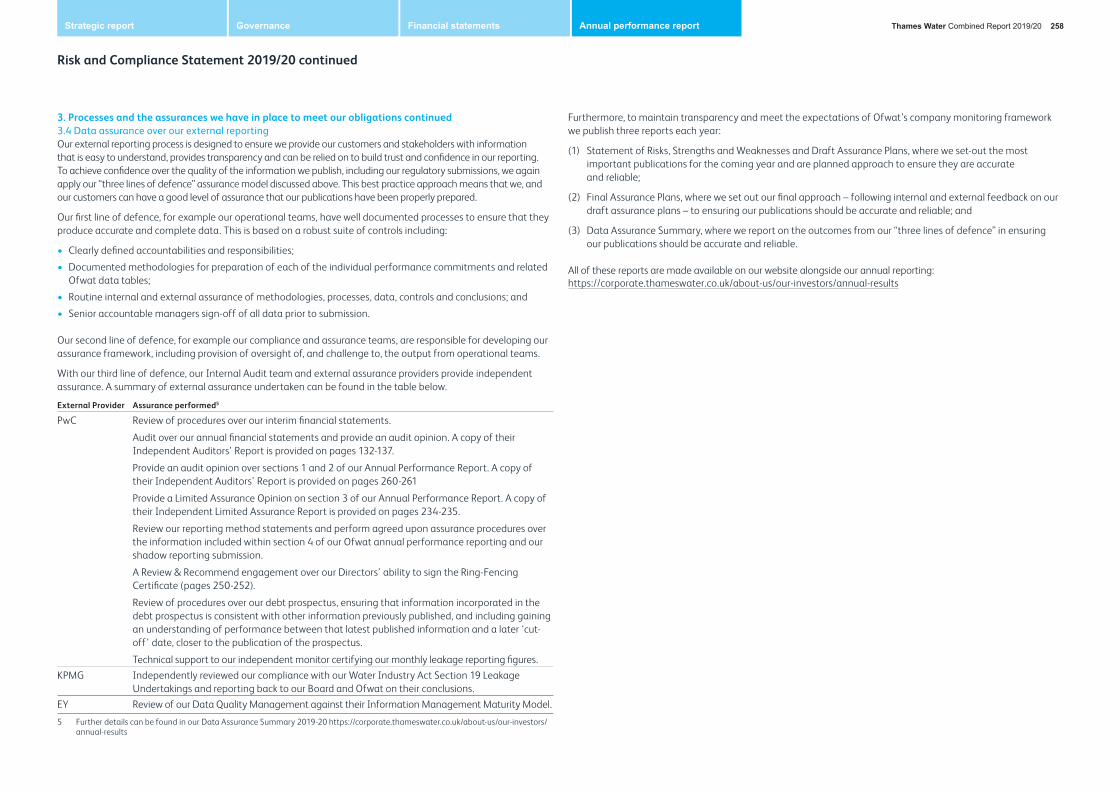
3. Processes and the assurances we have in place to meet our obligations continued3.4 Data assurance over our external reportingOur external reporting process is designed to ensure we provide our customers and stakeholders with information that is easy to understand, provides transparency and can be relied on to build trust and confidence in our reporting. To achieve confidence over the quality of the information we publish, including our regulatory submissions, we again apply our “three lines of defence” assurance model discussed above. This best practice approach means that we, and our customers can have a good level of assurance that our publications have been properly prepared.
Our first line of defence, for example our operational teams, have well documented processes to ensure that they produce accurate and complete data. This is based on a robust suite of controls including:
• Clearly defined accountabilities and responsibilities;
• Documented methodologies for preparation of each of the individual performance commitments and related Ofwat data tables;
• Routine internal and external assurance of methodologies, processes, data, controls and conclusions; and
• Senior accountable managers sign-off of all data prior to submission.
Our second line of defence, for example our compliance and assurance teams, are responsible for developing our assurance framework, including provision of oversight of, and challenge to, the output from operational teams.
With our third line of defence, our Internal Audit team and external assurance providers provide independent assurance. A summary of external assurance undertaken can be found in the table below.
External Provider Assurance performed5
PwC Review of procedures over our interim financial statements.
Audit over our annual financial statements and provide an audit opinion. A copy of their Independent Auditors’ Report is provided on pages 132-137.
Provide an audit opinion over sections 1 and 2 of our Annual Performance Report. A copy of their Independent Auditors’ Report is provided on pages 260-261
Provide a Limited Assurance Opinion on section 3 of our Annual Performance Report. A copy of their Independent Limited Assurance Report is provided on pages 234-235.
Review our reporting method statements and perform agreed upon assurance procedures over the information included within section 4 of our Ofwat annual performance reporting and our shadow reporting submission.
A Review & Recommend engagement over our Directors’ ability to sign the Ring-Fencing Certificate (pages 250-252).
Review of procedures over our debt prospectus, ensuring that information incorporated in the debt prospectus is consistent with other information previously published, and including gaining an understanding of performance between that latest published information and a later ‘cut-off’ date, closer to the publication of the prospectus.
Technical support to our independent monitor certifying our monthly leakage reporting figures.KPMG Independently reviewed our compliance with our Water Industry Act Section 19 Leakage
Undertakings and reporting back to our Board and Ofwat on their conclusions. EY Review of our Data Quality Management against their Information Management Maturity Model.
5 Further details can be found in our Data Assurance Summary 2019-20 https://corporate.thameswater.co.uk/about-us/our-investors/annual-results
Risk and Compliance Statement 2019/20 continued
Furthermore, to maintain transparency and meet the expectations of Ofwat’s company monitoring framework we publish three reports each year:
(1) Statement of Risks, Strengths and Weaknesses and Draft Assurance Plans, where we set-out the most important publications for the coming year and are planned approach to ensure they are accurate and reliable;
(2) Final Assurance Plans, where we set out our final approach – following internal and external feedback on our draft assurance plans – to ensuring our publications should be accurate and reliable; and
(3) Data Assurance Summary, where we report on the outcomes from our “three lines of defence” in ensuring our publications should be accurate and reliable.
All of these reports are made available on our website alongside our annual reporting: https://corporate.thameswater.co.uk/about-us/our-investors/annual-results
Thames Water Combined Report 2019/20 258Strategic report Governance Financial statements Annual performance report

4. Compliance exceptionsWithin this section we set out material exceptions to our compliance with our statutory, licence and regulatory obligations:
Disclosure Actions being taken to improve
Environmental permitting regulations
Note: even though fine was in December 2018, we have mentioned as the appeal was in this financial year.
In December 2018, we were fined £2 million (with a reduction of £200,000 in recognition of donations made by TWUL to environmental projects) for a single offence under the Environmental Permitting Regulations 2016 (EPR) in relation to the discharge of sewage from Bruern Road Sewage Pumping Station in August 2015. This was caused as a result of a pump failure and alarm communication failure and was found to have had minor and localised environmental impact. In July 2019, we appealed unsuccessfully against the sentence imposed.
In July 2019, we were fined £607,000 for two offences under the EPR in relation to discharges of sewage from Maidenhead STW in June and August 2014.
As reported last year, our Environmental Regulation team have designed and implemented a new governance, oversight, support and performance model. Accountability for performance rests with our operations teams and together ensure that incidents are identified, responded to, mitigated and implement lessons learnt to continually improve performance.
Both incidents were discharges of sewage in breach of the EPR caused by a build-up of rag in the works, which has since been addressed via plant upgrades.
Water supply regulations
In June 2019, we were fined £160,000 for three offences under the Water Supply (Water Quality) Regulations 2016 in relation to incidents at Coppermills Water Treatment Works in February and July 2017. These incidents were caused by failures in the disinfection process, with no impact on public drinking water supplies.
The failures in the disinfection process were fully resolved.
Duty to maintain efficient and economical system of water supply (leakage)
Note: even though this event was in 2018/19 our resolution actions remain ongoing.
In 2018/19 Ofwat found us in contravention of section 37 of Water Industry Act and Licence condition F6A (now under condition P) of our obligations to meet our leakage reduction target and management of our leakage reduction operations. In August 2018 we agreed to a formal undertaking to reduce leakage and put in place a number of other measures.
Our Leakage Task Force to drive and oversee improvements remain in place. We continue to publish our leakage performance on our website each month.
KPMG have continued as our independent assurance provider over our compliance with the undertakings with Victoria Borwick as our Independent Certifier of our monthly reporting.
Confined spaces regulations
In December 2019, following the earlier entry of a guilty plea to a single charge of a breach of Regulation 4(2) of the Confined Spaces Regulations 1997, TWUL was fined £300,000. The incident giving rise to the fine occurred in August 2017 when three sewer operatives were engulfed in sewage following a penstock failure in a sewer in East Greenwich, London.
Enhanced procedures and standards were immediately put in place, supported by training and awareness.
Risk and Compliance Statement 2019/20 continued
Disclosure Actions being taken to improve
Performance commitments
For 2019/2020, with the exception of those detailed below, we have met or exceeded our Performance Commitments. Full details on our performance can be found on pages 236 – 240. The performance commitments with a red status this year are stated below:
• WA1: Improve handling of written complaints by increasing 1st time resolution – water
• WA2: Number of written complaints per 10,000 connected properties – water
• WA3: Customer satisfaction surveys (internal CSAT monitor) – water
• WB7: Compliance with SEMD advice notes (with or without derogation)
• WB8: Ml/d of sites made resilient to future extreme rainfall events
• WC5: Deliver 100% of agreed measures to meet new environmental regulations
• WD1: Energy imported less energy exported • SA1: Improve handling of written complaints by
increasing 1st time resolution – wastewater • SA3: Customer satisfaction surveys (internal CSAT
monitor) – wastewater • SB3: Properties protected from flooding due to rainfall
(including Counters Creek project) • SB7: Population equivalent of sites made resilient to
future extreme rainfall events • SC3: Sewage treatment works discharge compliance • SC4: Water bodies improved or protected from
deterioration as a result of Thames Water’s activities • SD1: Energy imported less energy exported • RA1: Minimise the number of written complaints
received from customers (relating to charging and billing)
• RA2: Improve handling of written complaints be increasing first time resolution – charging and billing
• RA3: Improve customer satisfaction of retail customers – charging and billing service
• RA4: Improve customer satisfaction of retail customers – operations contact centre
All our performance commitments are tracked by management, supported by monthly reporting to our Board and Shareholders, enabling prompt and timely corrective action.
Our annual Control Self-Assessment process, by which all senior leaders across the business confirm their awareness and compliance with our obligations, has not identified any other incidences of non-compliance for reporting here. However, the full impact of Covid-19 on our compliance with our statutory, licence and regulatory obligations is expected to become clearer during the 2020/21 financial year.
Thames Water Combined Report 2019/20 259Strategic report Governance Financial statements Annual performance report

Independent Auditors’ report to the Water Services Regulation Authority (the WSRA) and the Directors of Thames Water Utilities Limited
Report on the Regulatory Accounting Statements contained within the Annual Performance Report
Opinion on Annual Performance ReportIn our opinion, Thames Water Utilities Limited’s (the Company’s) Regulatory Accounting Statements within the Annual Performance Report have been prepared, in all material respects, in accordance with Condition F, the Regulatory Accounting Guidelines issued by the WSRA (RAG1.08, RAG2.07, RAG3.11, RAG4.08 and RAG5.07) and the accounting policies (including the Company’s published accounting methodology statement, as defined in RAG 3.11, appendix 2) set out on page 222.
The tables within the Company’s Annual Performance Report that we have audited (the “Regulatory Accounting Statements”) comprise:
• the regulatory financial reporting tables comprising the income statement (table 1A), the statement of comprehensive income (table 1B), the statement of financial position (table 1C), the statement of cash flows (table 1D), the net debt analysis (table 1E), the financial flows (table 1F) and the related notes; and
• the regulatory price review and other segmental reporting tables comprising the segmental income statement (table 2A), the totex analysis for wholesale water and wastewater (table 2B), the operating cost analysis for retail (table 2C), the historical cost analysis of fixed assets for wholesale and retail (table 2D), the analysis of capital contributions and land sales for wholesale (table 2E), the household water revenues by customer type (table 2F), the non-household water revenues by customer type (table 2G), the non-household wastewater revenues by customer type (table 2H), the revenue analysis and wholesale control reconciliation (table 2I), the infrastructure network reinforcement costs (table 2J), the infrastructure charges reconciliation (table 2K) and the related notes.
We have not audited the Outcome performance tables (tables 3A to 3S) and the additional regulatory information in tables 4A to 4W.
Basis for opinionWe conducted our audit in accordance with International Standards on Auditing (UK) (“ISAs (UK)”), including ISA (UK) 800, and applicable law, except as stated in the section on Auditors’ responsibilities for the audit of the Annual Performance Report below, and having regard to the guidance contained in ICAEW Technical Release Tech 02/16 AAF ‘Reporting to Regulators on Regulatory Accounts’ issued by the Institute of Chartered Accountants in England & Wales.
Our responsibilities under ISAs (UK) are further described in the Auditors’ responsibilities for the audit of the Regulatory Accounting Statements within the Annual Performance Report section of our report. We believe that the audit evidence we have obtained is sufficient and appropriate to provide a basis for our opinion.
We remained independent of the Company in accordance with the ethical requirements that are relevant to our audit, including the Financial Reporting Council’s (“FRC’s”) Ethical Standard, and we have fulfilled our other ethical responsibilities in accordance with these requirements.
Emphasis of matter – special purpose basis of preparationIn forming our opinion on the Regulatory Accounting Statements, which is not modified, we draw attention to the fact that the Regulatory Accounting Statements have been prepared in accordance with a special purpose framework, Condition F, the Regulatory Accounting Guidelines, the accounting policies (including the Company’s published accounting methodology statement, as defined in RAG 3.11, appendix 2) set out in the statement of accounting policies and under the historical cost convention. The nature, form and content of the Regulatory Accounting Statements are determined by the WSRA. It is not appropriate for us to assess whether the nature of the information being reported upon is suitable or appropriate for the WSRA’s purpose. Accordingly we make no such assessment. In addition, we are not required to assess whether the methods of cost allocation set out in the accounting methodology statement are appropriate to the circumstances of the Company or whether they meet the requirements of the WSRA.
The Regulatory Accounting Statements are separate from the statutory financial statements of the Company and have not been prepared under the basis of International Financial Reporting Standards as adopted by the European Union (“IFRSs”). Financial information other than that prepared on the basis of IFRSs does not necessarily represent a true and fair view of the financial performance or financial position of a company as shown in statutory financial statements prepared in accordance with the Companies Act 2006.
The Regulatory Accounting Statements on pages 215-259 have been drawn up in accordance with Regulatory Accounting Guidelines with a number of departures from IFRSs. A summary of the effect of these departures from Generally Accepted Accounting Practice in the Company’s statutory financial statements is included in the tables within section 1.
The Regulatory Accounting Statements are prepared in accordance with a special purpose framework for the specific purpose as described in the Responsibilities for the Annual Performance Statement and the audit and Use of this report sections below. As a result, the Regulatory Accounting Statements may not be suitable for another purpose.
Conclusions relating to going concernWe have nothing to report in respect of the following matters in relation to which ISAs (UK) require us to report to you when:
• the Directors’ use of the going concern basis of accounting in the preparation of the Regulatory Accounting Statements is not appropriate; or
• the Directors have not disclosed in the Regulatory Accounting Statements any identified material uncertainties that may cast significant doubt about the company’s ability to continue to adopt the going concern basis of accounting for a period of at least twelve months from the date when the Regulatory Accounting Statements are authorised for issue.
However, because not all future events or conditions can be predicted, this statement is not a guarantee as to the company’s ability to continue as a going concern.
Reporting on other informationThe other information comprises all of the information in the Annual Performance Report other than the Regulatory Accounting Statements and our auditors’ report thereon. The directors are responsible for the other information. Our opinion on the Regulatory Accounting Statements does not cover the other information and, except to the extent otherwise explicitly stated in our report, we do not express any form of assurance conclusion thereon.
Thames Water Combined Report 2019/20 260Strategic report Governance Financial statements Annual performance report

In connection with our audit of the Regulatory Accounting Statements, our responsibility is to read the other information and, in doing so, consider whether the other information is materially inconsistent with the Regulatory Accounting Statements or our knowledge obtained in the audit, or otherwise appears to be materially misstated. If we identify an apparent material inconsistency or material misstatement, we are required to perform procedures to conclude whether there is a material misstatement of the Regulatory Accounting Statements or a material misstatement of the other information. If, based on the work we have performed, we conclude that there is a material misstatement of this other information, we are required to report that fact.
We have nothing to report based on these responsibilities.
Responsibilities for the Annual Performance Report and the auditResponsibilities of the Directors for the Annual Performance ReportAs explained more fully in the Statement of Directors’ Responsibilities set out on page 215, the Directors are responsible for the preparation of the Annual Performance Report in accordance with Condition F, the Regulatory Accounting Guidelines issued by the WSRA and the Company’s accounting policies (including the Company’s published accounting methodology statement(s), as defined in RAG 3.11, appendix 2).
The directors are also responsible for such internal control as they determine is necessary to enable the preparation of the Annual Performance Report that is free from material misstatement, whether due to fraud or error.
In preparing the Annual Performance Report, the directors are responsible for assessing the Company’s ability to continue as a going concern, disclosing as applicable, matters related to going concern and using the going concern basis of accounting unless the directors either intend to liquidate the Company or to cease operations, or have no realistic alternative but to do so.
Auditors’ responsibilities for the Audit of the Regulatory Accounting Statements within the Annual Performance ReportOur objectives are to obtain reasonable assurance about whether the Regulatory Accounting Statements are free from material misstatement, whether due to fraud or error, and to issue an auditors’ report that includes our opinion. Reasonable assurance is a high level of assurance, but is not a guarantee that an audit conducted in accordance with ISAs (UK) will always detect a material misstatement when it exists. Misstatements can arise from fraud or error and are considered material if, individually or in the aggregate, they could reasonably be expected to influence the economic decisions of users taken on the basis of these Regulatory Accounting Statements.
A further description of our responsibilities for the audit of the Regulatory Accounting Statements within the Annual Performance Report is located on the FRC’s website at: www.frc.org.uk/auditorsresponsibilities. This description forms part of our auditors’ report.
Use of this reportThis report, including the opinions, is made, on terms that have been agreed, solely to the Company and the WSRA in order to meet the requirements of Condition F of the Instrument of Appointment granted by the Secretary of State for the Environment to the Company as a water and sewage undertaker under the Water Industry Act 1991 (“Condition F”). Our audit work has been undertaken so that we might state to the Company and the WSRA those matters that we have agreed to state to them in our report, in order (a) to assist the Company to meet its obligation under Condition F to procure such a report and (b) to facilitate the carrying out by the WSRA of its regulatory functions, and for no other purpose. In giving these opinions, to the fullest extent permitted by law, we do not accept or assume responsibility to anyone other than the Company and the WRSA, for our audit work, for this report or for the opinions we have formed.
Our opinion on the Regulatory Accounting Statements is separate from our opinion on the statutory financial statements of the Company for the year ended 31 March 2020 on which we reported on June 2020, which are prepared for a different purpose. Our audit report in relation to the statutory financial statements of the Company (our “Statutory audit”) was made solely to the Company’s members, as a body, in accordance with Chapter 3 of Part 16 of the Companies Act 2006. Our Statutory audit work was undertaken so that we might state to the Company’s members those matters we are required to state to them in a statutory audit report and for no other purpose. In these circumstances, to the fullest extent permitted by law, we do not accept or assume responsibility for any other purpose or to any other person to whom our Statutory audit report is shown or into whose hands it may come save where expressly agreed by our prior consent in writing.
Other required reporting
Opinion on other matters prescribed by Condition FUnder the terms of our contract we have assumed responsibility to provide those additional opinions required by Condition F in relation to the accounting records. In our opinion:
• proper accounting records have been kept by the appointee as required by paragraph 3 of Condition F; and
• the Regulatory Accounting Statements are in agreement with the accounting records and returns retained for the purpose of preparing the Annual Performance Report.
PricewaterhouseCoopers LLP Chartered Accountants and Statutory Auditors 3 Forbury Place Forbury Road Reading RG1 3JH29 June 2020
Thames Water Combined Report 2019/20 261Strategic report Governance Financial statements Annual performance report

AMP 6 slow money % – the proportion of allowed total expenditure (Totex) that is added to the RCV for each year of the AMP period.
Appointed Business – The appointed business comprises the regulated activities of the Company which are activities necessary in order for the Company to fulfil the function and duties of a water and sewerage undertaker under the Water Industry Act 1991.
Arm’s-length trading – Trading in which the Company treats the other party, usually an associate company, on the same basis as an external party.
Asset Management Plan (“AMP”) – An ‘Asset Management Period’ is the five-year period covered by a water company’s business plan. These are numbered; with AMP1 referring to the first such planning period after the water industry was privatized – i.e. the period from 1990 to 1995. The current period (2015 – 2020) is known as AMP6, and the period which we are now starting (2020 – 2025) will be AMP7.
Associate company – Condition A of the Licence defines an associate company to be any group or related company. Condition F of the Licence requires all transactions between the Company and its associated companies to be disclosed subject to specified materiality considerations.
Bazelgette Tunnel Limited (‘BTL’) is an independent company unrelated to Thames Water Utilities Limited that was appointed in 2015 to construct the Thames Tideway Tunnel. For the year ending 31 March 2020, the Company has included construction costs of the Thames Tideway Tunnel in its bills to wastewater customers. These amounts are subsequently paid to BTL. The revenue and profit on this arrangement, which is excluded from our key performance indicators, has been disclosed as non- appointed in the regulatory tables. The cash balance included (also shown as non-appointed) reflects amounts collected and not paid over at the balance sheet date.
Capital Expenditure (“Capex”) – Expenditure to acquire or upgrade physical assets such as property, pipes and treatment works.
C17 – The Water Act 2014 allowed 1.2 million businesses and other non-household customers of providers based mainly or wholly in England to choose their supplier of water and wastewater retail services from April 2017. Retail services include functions like billing and customer services. The new market is open to all non-household customers. Thames Water has chosen to exit this market and has sold its non-household retail business to Castle Water. Thames Water will remain the wholesaler to these customers, who were transferred to Castle water before the market opening on 1 April 2017.
Committed Performance Level (“CPL”) – in order to measure our progress against our performance commitments, we agreed committed performance levels with Ofwat for each year of AMP 6. Our committed performance levels are published in our Final Determination.
Cost – The actual cost to the supplier, of the goods, works or services, including a reasonable rate of return on capital employed. Unless the circumstances of the transaction provide a convincing case for the use of an alternative measure, the return on capital should be consistent with the cost of capital/net retail margin as set out in Ofwat’s final determination of 12 December 2014 (or any other determination applicable in the 2015-20 period).
Glossary of regulatory terms
Cost allocation – Cost allocation is the means by which all costs are allocated to appointed and non-appointed businesses, price control units, or specific supplies, works and services, ensuring a fair share of overheads, even where costs cannot be directly attributed to specific activities and associated services.
Cost driver – A cost driver is the factor or factors which cause cost to occur. This can be further divided between the driver that causes an activity to occur, and a driver that determines how often it occurs. Costs may vary in relation to the cost driver over the short or longer term, depending on the nature of cost concerned.
Consumer Price Index (“CPI”) – The Consumer Prices Index is a measure of economic inflation based on a set series of goods and services set by the Office for National Statistics. This is the headline measure of inflation used in the Government’s target for inflation.
Cross-subsidy – Cross-subsidy in this context is monetary aid or contributions from the appointee to the associate, or between price control units, which does not reflect the value of the services received. It also relates to services provided by the appointee to associate companies where there has been an under-recovery of costs incurred by the appointee.
CSAT – Short for ‘customer satisfaction’, this refers to the qualitative component of the SIM measure.
Customer side leakage (“CSL”) – leakage from customer side pipes.
Customer numbers – To ensure consistency with the way in which price controls have been set for 2015-20, customer numbers when used as a cost allocation metric is equal to 1.0 for single-service (water or wastewater only) customers and 1.3 for dual-service (water and wastewater) customers.
External shareholders – this is the term used to describe the ultimate owners of the company. Most of our external shareholders are pension funds. They own the shares in our ultimate parent company, Kemble Water Holdings Limited. Dividends paid to External shareholders are paid by Kemble Water Holdings Limited and not by Thames Water Utilities Limited. During the year, Kemble Water Holdings Limited did not pay any dividends.
Final Determination (“FD”) – The conclusion of discussions on the scale and content of the asset management plan for the forthcoming five-year AMP period. It is accompanied by a determination of the allowable adjustment to wholesale price limits for the forthcoming AMP.
Full-time equivalents (“FTEs”) – For the purposes of cost allocation, FTEs should include all full-time staff, and contractors/temporary staff directly employed. Where there is an existing contractual arrangement in place with an associate or third party for example a third party billing arrangement, FTEs will include all full-time staff, and contractors/temporary staff directly employed by the associate or third party involved in providing that service to the appointee.
Household – These are properties used as single domestic dwellings (normally occupied), receiving water for domestic purposes which are not factories, offices or commercial premises. These include cases where a single aggregate bill is issued to cover separate dwellings having individual standing charges. (In some instances, the standing charge may be zero.) The number of dwellings attracting an individual standing charge and not the number of bills should be counted. Mixed/commercial properties and multiple household properties – for example, blocks of flats having only one standing charge – should be excluded.
Thames Water Combined Report 2019/20 262Strategic report Governance Financial statements Annual performance report

Infrastructure and non-infrastructure assets – Infrastructure assets are mainly our below-ground assets, such as pipes, water mains, sewers, dams and reservoirs. Non-infrastructure assets are those mainly found above ground, such as water and sewage treatment works, pumping stations, laboratories and workshops.
Instrument of Appointment – Water companies operating the public water networks hold appointments as water undertakers, and those operating the public wastewater networks hold appointments as sewerage undertakers, for the purposes of the Water Industry Act 1991. They also supply water and wastewater services direct to household and non-household customers who are connected to their networks.
Kemble Water Holdings Limited – this is the ultimate parent company of Thames Water Utilities Limited. The shares of Kemble Water Holdings Limited are owned by External shareholders.
Licence – The Instrument of Appointment dated August 1989 under Section 11 and 14 of the Water Act 1989 (as in effect on 1 August 1989) under which the Secretary of State for the Environment appointed Thames Water Utilities Limited as a water and sewerage undertaker under the Act for the areas described in the Instrument of Appointment, as modified or amended from time to time.
Measured – These are properties where some or all of the charges for supplies are based on measured quantities of volumes.
Ml/d (mega litres per day) – this is the unit used to measure our leakage. For more information on our leakage performance, please see page 33.
Modern Equivalent Asset Value (“MEAV”) – The cost of an asset of equivalent productive capability to satisfy the remaining service potential of the asset being valued if the asset would be worth replacing or the recoverable amount if it would not. The gross MEA value is what it would cost to replace an old asset with a technically up to date new asset with the same service capability allowing for any difference both in the quality of output and in operating costs. The net MEA value is the depreciated value taking into account the remaining service potential of an old asset compared with a new asset, and is stated gross of third-party contributions.
Non-appointed business – The non-appointed business activities of the Company are activities for which the Company as a water and sewerage undertaker is not a monopoly supplier (for example, the sale of laboratory services to an external organisation) or involves the optional use of an asset owned by the Company (for example, the use of underground assets for cable television).
Non-household – These are properties receiving water for domestic purposes but which are not occupied as domestic premises, or where domestic dwellings are combined with other properties, or where properties are in multiple occupation but only have one standing charge. In this case, it is the number of bills that should be counted.
Outcome Delivery Incentive (“ODI”) – ODIs is a collective term for the financial incentives – positive and negative – that Ofwat has applied to the delivery of our five-year plan. ‘Rewards’ allow us to charge more over the next five years (in this case, 2020-2025), while ‘penalties’ require us to charge less. Some of these ODIs measure performance in each of the five years of our current plan, while others apply only to the whole five years.
Glossary of regulatory terms continued
Ofwat – The name used to refer to the Water Services Regulation Authority (WSRA). The WSRA acts as the economic regulator of the water industry.
Operating Expenditure (“Opex”) – Payments for the day-to-day operations of our business, such as operating and maintaining our network and treatment works, paying our staff and our energy bills. This is known as operational expenditure or Opex.
Performance Commitment (“PC”) – Outcome performance commitments agreed with Ofwat that reflect customers’ views and priorities of service.
Periodic Review (“PR”) – The price determination process undertaken by Ofwat every five years. Each water and sewerage undertaker submits a Business Plan covering the five-year period for which Ofwat will determine cost and revenue allowances.
Price control units – At the 2014 price review Ofwat introduced separate binding price controls. These include wholesale water, wholesale wastewater, retail household, retail non-household and Thames Tideway Tunnel (“TTT”).
Regulatory Accounting Guidelines (“RAG”) – The accounting guidelines for regulatory accounts issued, and amended from time to time, by Ofwat.
Regulatory Capital Value (“RCV”) – The capital base used in setting price limits. The value of the appointed business that earns a return on investment. It represents the initial market value (200-day average), including debt at privatisation, plus subsequent net new capital expenditure including new obligations imposed since 1989. The capital value is calculated using the Ofwat methodology.
Retail – This term refers to any water company activities that take place once water has passed to the customer’s side of a property boundary. These include billing, payment handling, debt management, meter reading and handling billing related calls.
Retail Price Index (“RPI”) – The RPI is compiled and published monthly by the Office for National Statistics. RPI is an average measure of change in the prices of goods and services bought for the purpose of consumption by the vast majority of households in the United Kingdom.
Service Incentive Mechanism (“SIM”) – The Service Incentive Mechanism was introduced by Ofwat to replace the OPA as a measure of the service customers experience from their water company.
There are two elements to the SIM:
• A quantitative measure awards penalty points for issues ranging from callers to our customer centre receiving an engaged tone, through to complaints.
• A qualitative measure is calculated via telephone interviews to assess the satisfaction of customers who have contacted us to resolve queries.
Thames Water Combined Report 2019/20 263Strategic report Governance Financial statements Annual performance report

Thames Tideway Tunnel (“TTT”) – The Thames Tideway Tunnel is a landmark construction project which will protect the River Thames from pollution. London’s sewer system is regularly overwhelmed and spills millions of tonnes of sewage into the tidal section of the river every year. The tunnel will tackle the problem of overflows from the capital’s Victorian sewers for at least the next 100 years, and enable the UK to meet European environmental standards. The Company is responsible for planning, enabling and interface works for the project; the revenue and costs associated with this part of the project are shown in the TTT price control unit in the regulatory accounting tables.
Thames Water Utilities Holdings Limited – this is the immediate parent company of Thames Water Utilities Limited. Thames Water Utilities Holdings Limited is the recipient of any dividends paid by Thames Water Utilities Limited.
Third-party contributions – Grants and third-party contributions received in respect of infrastructure assets and any deferred income relating to grants and third-party contributions for non-infrastructure assets.
Total expenditure (“Totex”) – The mechanism, introduced in PR14 (price review 2014) for planning and reporting capital (for example, buying a new car) and operational (repairing your old car) spend. The object is to achieve the optimum combination to deliver the required business plan outcomes. It applies to both water and waste (i.e. our wholesale business) but not to retail.
Unmeasured – These are properties where none of the charges for supplies are based on measured quantities of volumes. These include properties which receive an assessed charge because metering is not possible or economic.
Wholesale – This term covers all water company activities that take place before water passes the customer’s property boundary – resources management, abstraction, treatment, distribution (water and sewer networks), sewage collection, transportation, sewage treatment, sludge disposal and energy from waste.
Working capital – The aggregate of stocks, trade debtors and trade creditors, if material.
Regulatory environmentThe water and sewerage industry in England and Wales is comprised of over 50 million household and non-household consumers. Thames Water is the largest provider of water and sewerage services.
The industry was privatised in 1989 with companies awarded licences to serve specified geographical areas. This created regional monopolies and in order to inject competition, government regulatory authorities were established. The water industry has evolved making significant improvements in areas including customer service, promoting value for customers, drinking water quality, and environmental conservation.
Whilst considerable progress has been made, there are still a number of key challenges facing the industry including:
• service affordability; • rising environmental standards; • increasing customer expectations; • population growth and lifestyle changes; and • climate change.
We recognise these challenges and have incorporated them into forming the Company’s strategy which is designed to balance the needs of the overall industry against customers’ and stakeholders’ requirements to generate value from the business.
The water industry has in place a robust regulatory framework created to safeguard consumers’ interests and ensure compliance with national and European legislation. Our key regulators are outlined below:
OFWATOfwat (The Water Services Regulatory Authority) is the economic regulator of water and sewerage sector in England and Wales, responsible for protecting customers’ interest whilst ensuring water companies finance and conduct their functions effectively.
Consumer Council for Water (CCW)The CCW is an independent body that represents customers’ interests relating to price, service and value for money as well as conducting independent research and investigating customers’ complaints relating to water quality.
Department for Environment Food & Rural Affairs (DEFRA)DEFRA is a UK government department supported by 35 agencies and public bodies responsible for setting policies and regulations on environmental, food and rural issues. DEFRA sets the overall water and sewerage policy framework in England including setting standards and drafting legislation.
Drinking Water Inspectorate (DWI)The DWI regulates the quality of drinking water quality that we supply and ensures its safety and compliance with Water Quality Regulations. They do this via reviewing the tests that we conduct on our drinking water as well as carrying out inspections on water companies as and when required.
Environmental Agency (EA)The EA is the principal adviser to the government and main body set up to protect and improve the environment in England and Wales. They work in collaboration with other organisations to reduce flood risk, promote sustainable development and secure environmental and social benefits.
Customer Challenge Group
Customer Challenge Group (CCG)Our independent CCG, made up of customer representatives and stakeholders, has continued to challenge and advise us on the development of our business plan and how it can better reflect the needs of our customers. They publish an independent report about how we report our performance.
Glossary of regulatory terms continued
Thames Water Combined Report 2019/20 264Strategic report Governance Financial statements Annual performance report