delivering a competitive australian power system · delivering a competitive australian power...
TRANSCRIPT
Meeting the challenge of change
Delivering a competitive australian power system
Part 1: Australia’s global position November 2011

1 Part 1: Australia’s global position
Authors: Barry Ball
Bertram Ehmann
John Foster
Craig Froome
Ove Hoegh-Guldberg
Paul Meredith
Lynette Molyneaux
Tapan Saha
Liam Wagner
Advisory PANel: Paul Greenfield (UQ-Chair)
Simon Bartlett (PowerLink Queensland)
Tim George (AEMO)
Ian McLeod (Ergon Energy)
Keith Orchison
Cameron O’Reilly (Electricity Retailers Association)
Charlie Sartain (Xstrata Copper)
Paul Simshauser (AGL)
The authors would also like to acknowledge the support from Nicola De Silva, Gordon Dunlop, Rob Mackay-Wood, Krystle Henry and Paul Schwenn in the management and preparation of this report.
CRICOS code 00025B
Typesetting and graphic design by Naomi White Feature image: ©Patrick Moore Printed by Blue Star GO © The University of Queensland 2011
Image: UQ OMC

November 2011 1
Introducing resilience 2
Key questions to be addressed 3
Why do these questions need to be addressed? 4
The Australian power economy today 5
Non-renewable fuel used in generation 6
Efficiency 7
Diversity of generation 9
Reliance on imports 10
Redundant power for use in GDP 11
Competitiveness of the power economies 12
Key drivers of the past and the future 13
Power economy risk profile – a look to the future 32
The resilience of a country’s power economy refers to its ability to meet power requirements while withstanding supply shocks and environmental constraints. Analysis of power economy is traditionally conducted from the bottom up and based on complex, regional, supply and demand projections. This report seeks to take a more strategic, top down approach, providing a nation-wide analysis over much longer time frames.
Historically, Australia’s abundant supply of coal gave its power economy a competitive advantage, attracting substantial investment in power-hungry metals processing industries like aluminum, which, in turn, part-funded power infrastructure for future decades.
Since 1990, however, Australia has shed 53,000 jobs from the metals processing and fabrication sector and lost global market share in metals processing to other countries.
With increased global demand for energy and concerns over carbon emissions, Australia’s fossil-fuel based power system now presents a risk for consumers and investors. Now one of the least resilient power economies of its global competitors, Australia needs a strategy which will turn this around.
As a result, Australian electricity users will continue to experience large electricity price hikes in coming years. At particular risk is the metals processing and fabrication industry, which consumes a high proportion of Australia’s electricity, employs a large number of workers, and is competing on global metal markets against countries with more resilient power economies.
We need to focus on the whole power system rather than on its components. A national policy framework taking into account the whole power economy will ensure that the optimum level of investment is made for the best result.
Also, with an ageing fleet of base-load generators, Australia has a golden opportunity now to make the leap to a resilient power economy instead of shuffling forward based on business as usual. However, it will require a fundamental change in policy and very substantial investments by the key stakeholders to identify and shift to this new paradigm.
overviewcontents
A more detailed Foundation Paper has been prepared and is available on the Global Change Institute website (www uq.edu.au/gci) which includes a detailed listing of all references.
due to its reliance on fossil fuels, Australia’s power system is now among the least resilient of its global competitors. the three part series, “delivering a competitive Australian power system” seeks to address this issue. In this, the first installment, we compare the strategic direction of Australia’s power system to other resource rich countries.

2 Part 1: Australia’s global position
A power economy is an integrated network of keystone processes that interact with each other to provide a service to consumers. Because the economy is reliant on the power network, economic success is dependent on, amongst other things, the performance of the power network.
It is important to ensure that the power economy can adjust to shocks and adapt to change.
Key attributes of resilience are:-
• The ability of a system to absorb variation; • That keystone processes of the system interact, and even overlap, in an apparently redundant way; • That the system is able to generate major changes and renewal at small scales; and • That the system is composed of functional group variety.
Why resilieNCe, Why Not Just eFFiCieNCy?Efficiency reduces waste and conserves resources, but it does not address the need for adaptation. Ultimately, a diversity of power supplies and redundancy - surplus supply - are required for the orderly management of change.
We have measured resilience, then, to understand the adaptive capability of the power economies.
introDucing resilience
Efficiency
redundancy
Powerresilience
diversity
Image: ©Patrick Moore

November 2011 3
WhAt Will eNergy ANd CAPitAl iNteNsive iNdustries be exPeCtiNg FroM PoWer eCoNoMies iN the Next tWo deCAdes?We need to consider how to balance cost concerns with resilience requirements, to attract firms that adopt a long-term view in making investment decisions.
In 1990, Australian electricity was relatively more expensive than today but still attracted energy intensive industry investment. Was it preferential tariffs negotiated by state governments to boost employment, or proximity to ore, low coal costs and a secure power supply that brought them here? Either way, Australia has lost market share in metals processing to China and India, despite electricity prices falling in real terms.
hoW Might AustrAliA FuNd substANtiAl iNvestMeNt to shiFt to A resilieNt PoWer eCoNoMy?In an environment where global investment is focused on the developing world, funding the shift to resilient power could become a real challenge for Australia. Consideration needs to be given to government implementing key policy changes and facilitating new initiatives.
Key Questions to Be aDDresseD
This series seeks to address five key questions which will optimise our investment in power generation technologies and improve the resilience and competitiveness of our power economy.
WhAt is the oPtiMAl Mix oF geNerAtioN teChNologies to MAxiMise resilieNCe?We need to consider the best mix of technologies to maximise the nation’s power economy resilience.
Australia’s current mix of largely fossil-fuel based technologies makes it vulnerable to non-renewable fuel shocks and carbon emission constraints. Power economies with substantial generation from renewables like Canada are better placed to meet the energy challenges of the next few decades.
WhAt is the best trANsMissioN iNFrAstruCture to oPtiMise iNvestMeNt?We need to consider the overarching strategy for the power economy as a whole, rather than simply meet the requirements of each of the institutional entities.
How might Australia design its network infrastructure to meet peak load demand and optimise the amount of investment required? How can the use of renewable and non-renewable sources, demand shifting and energy storage be managed?
WhiCh PoliCies Will be Most eFFeCtive iN FACilitAtiNg the trANsForMAtioN to iMProved resilieNCe ANd CoMPetitiveNess?A full range of policies that lead to optimal infrastructure investments should be introduced rather than single measures like the Renewable Energy Target (RET) and a carbon price.
The RET and a carbon price are the only measures currently being considered to transition the power economy to greater resilience. These policies will not influence the quality and efficiency of the transmission and distribution systems nor take into account the optimal mix for balancing loads and managing demand.

4 Part 1: Australia’s global position
We need to answer these questions to reassure our investors and to secure industry driven by our resources boom.
AustrAliA’s PoWer eCoNoMy shoWs iNCreAsiNg risK For iNvestorsIn 2008, metals processing and fabrication in Australia consumed 27% of Australian power, employed 151,000 people, and contributed 2% to GDP.
Metals processing and fabrication, then, represents the biggest sector for the power economy and is an important contributor to the economy as a whole. It can also be used as an indicator of power economy performance.
seCuriNg eNergy iNteNsive iNdustry reQuires A reliAble, AFFordAble eleCtriCity bACKboNe
Australia’s electricity backbone has benefitted from the metals processing industry. The same is now happening in China, where electricity consumption for metal processing grew 607TWh between 1990 and 2008. Basically, China is providing affordable labour resources for manufacturing and is building an electricity backbone for capital intensive industry.
If the 1970s oil shock was the catalyst for investment in the Australian power economy, the carbon shock could be the catalyst for investment in the resilient power economy. Australia needs to make sure it does not miss out on this opportunity.
wHy Do tHese Questions neeD to Be aDDresseD?
Figure 1: groWth iN eleCtriCity CoNsuMed For MetAls ProCessiNg (1990 – 2008)
Source: (IEA 2010)
November 2011 5
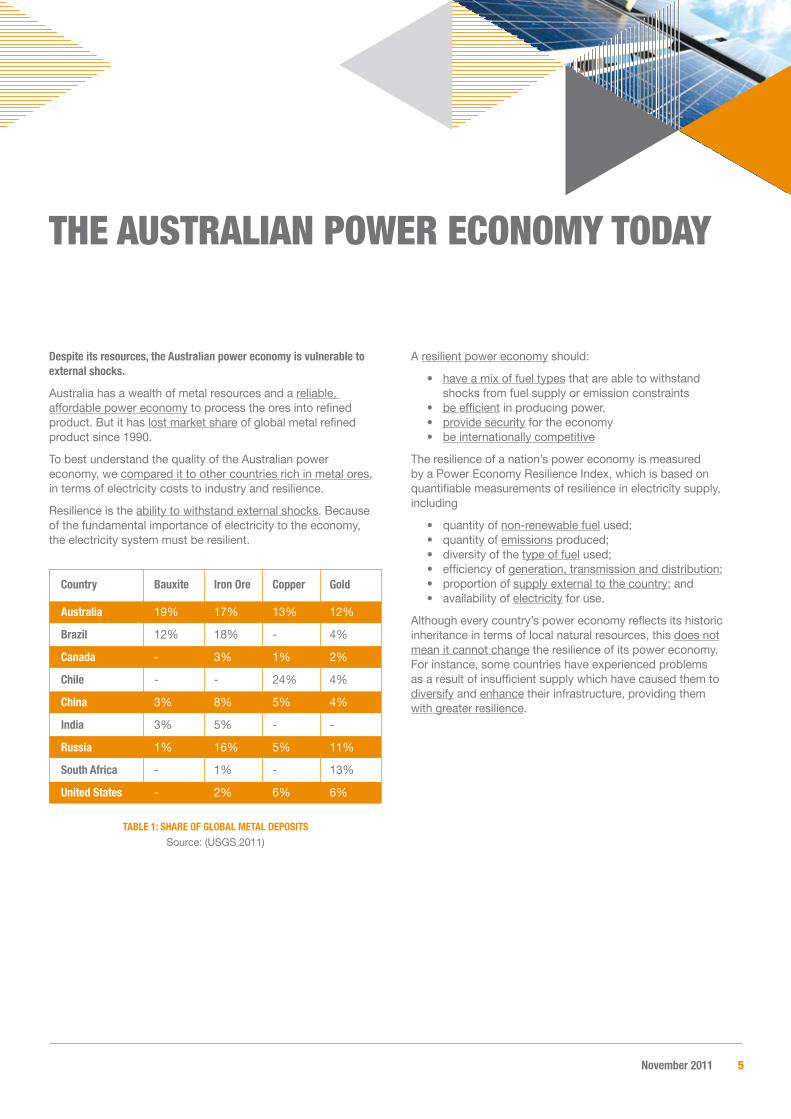
despite its resources, the Australian power economy is vulnerable to external shocks.
Australia has a wealth of metal resources and a reliable, affordable power economy to process the ores into refined product. But it has lost market share of global metal refined product since 1990.
To best understand the quality of the Australian power economy, we compared it to other countries rich in metal ores, in terms of electricity costs to industry and resilience.
Resilience is the ability to withstand external shocks. Because of the fundamental importance of electricity to the economy, the electricity system must be resilient.
A resilient power economy should:
• have a mix of fuel types that are able to withstand shocks from fuel supply or emission constraints • be efficient in producing power, • provide security for the economy • be internationally competitive
The resilience of a nation’s power economy is measured by a Power Economy Resilience Index, which is based on quantifiable measurements of resilience in electricity supply, including
• quantity of non-renewable fuel used; • quantity of emissions produced; • diversity of the type of fuel used; • efficiency of generation, transmission and distribution; • proportion of supply external to the country; and • availability of electricity for use.
Although every country’s power economy reflects its historic inheritance in terms of local natural resources, this does not mean it cannot change the resilience of its power economy. For instance, some countries have experienced problems as a result of insufficient supply which have caused them to diversify and enhance their infrastructure, providing them with greater resilience.
tHe australian power economy toDay
Australia 19% 17% 13% 12%
brazil 12% 18% - 4%
Canada - 3% 1% 2%
Chile - - 24% 4%
China 3% 8% 5% 4%
india 3% 5% - -
russia 1% 16% 5% 11%
south Africa - 1% - 13%
united states - 2% 6% 6%
Country bauxite iron ore Copper gold
tAble 1: shAre oF globAl MetAl dePositsSource: (USGS 2011)
6 Part 1: Australia’s global position
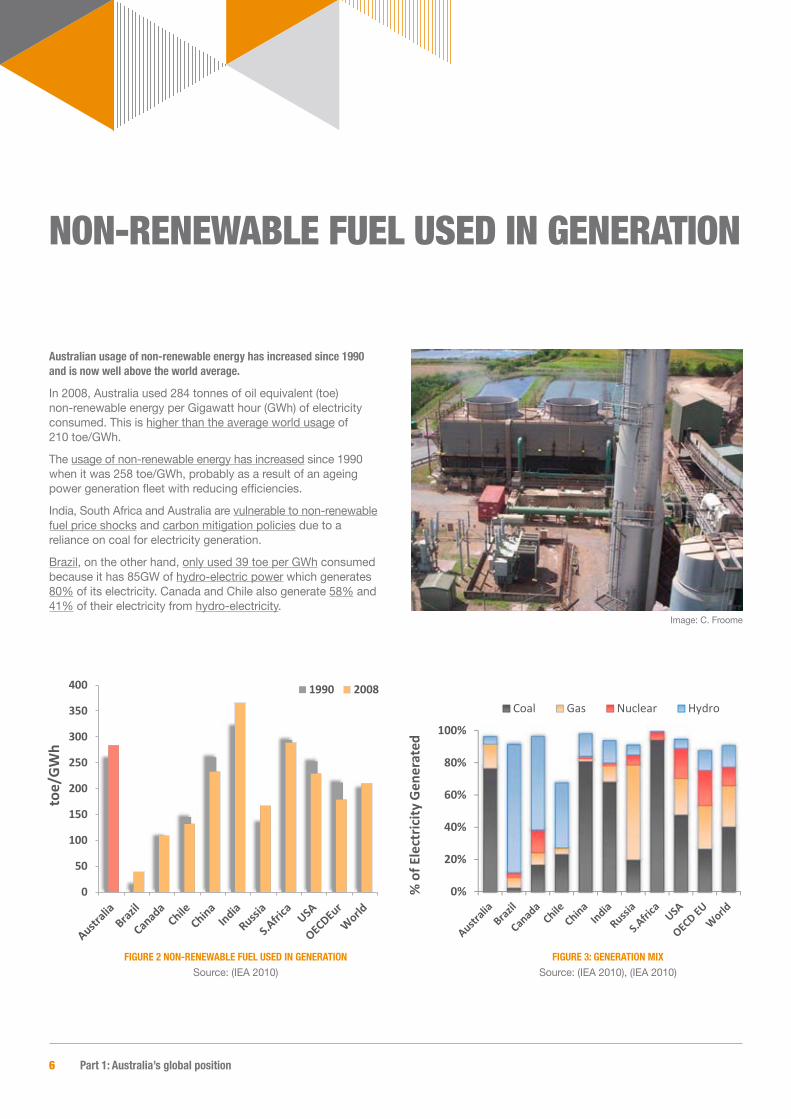
Australian usage of non-renewable energy has increased since 1990 and is now well above the world average.
In 2008, Australia used 284 tonnes of oil equivalent (toe) non-renewable energy per Gigawatt hour (GWh) of electricity consumed. This is higher than the average world usage of 210 toe/GWh.
The usage of non-renewable energy has increased since 1990 when it was 258 toe/GWh, probably as a result of an ageing power generation fleet with reducing efficiencies.
India, South Africa and Australia are vulnerable to non-renewable fuel price shocks and carbon mitigation policies due to a reliance on coal for electricity generation.
Brazil, on the other hand, only used 39 toe per GWh consumed because it has 85GW of hydro-electric power which generates 80% of its electricity. Canada and Chile also generate 58% and 41% of their electricity from hydro-electricity.
non-renewaBle Fuel useD in generation
0%
20%
40%
60%
80%
100%
% o
f Ele
ctric
ity G
ener
ated
Coal Gas Nuclear Hydro
Figure 3: geNerAtioN MixSource: (IEA 2010), (IEA 2010)
0
50
100
150
200
250
300
350
400
toe/GWh
1990 2008
Figure 2 NoN-reNeWAble Fuel used iN geNerAtioNSource: (IEA 2010)
Image: C. Froome
November 2011 7
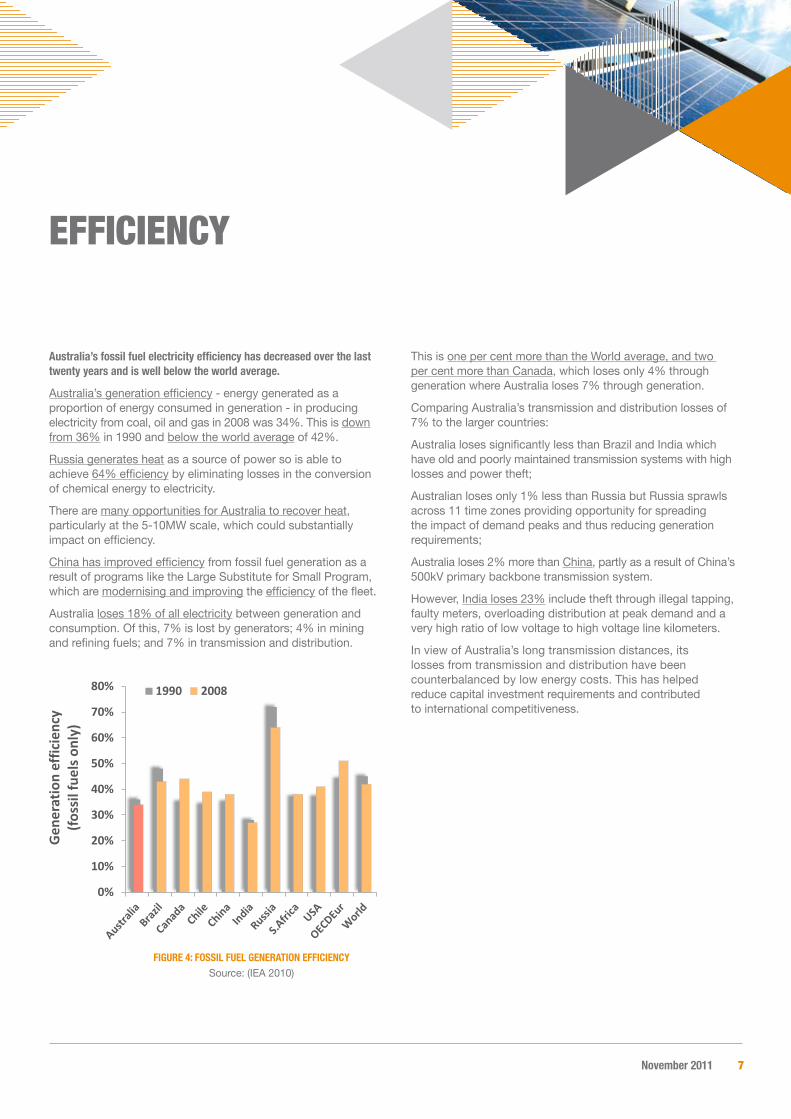
Australia’s fossil fuel electricity efficiency has decreased over the last twenty years and is well below the world average.
Australia’s generation efficiency - energy generated as a proportion of energy consumed in generation - in producing electricity from coal, oil and gas in 2008 was 34%. This is down from 36% in 1990 and below the world average of 42%.
Russia generates heat as a source of power so is able to achieve 64% efficiency by eliminating losses in the conversion of chemical energy to electricity.
There are many opportunities for Australia to recover heat, particularly at the 5-10MW scale, which could substantially impact on efficiency.
China has improved efficiency from fossil fuel generation as a result of programs like the Large Substitute for Small Program, which are modernising and improving the efficiency of the fleet.
Australia loses 18% of all electricity between generation and consumption. Of this, 7% is lost by generators; 4% in mining and refining fuels; and 7% in transmission and distribution.
This is one per cent more than the World average, and two per cent more than Canada, which loses only 4% through generation where Australia loses 7% through generation.
Comparing Australia’s transmission and distribution losses of 7% to the larger countries:
Australia loses significantly less than Brazil and India which have old and poorly maintained transmission systems with high losses and power theft;
Australian loses only 1% less than Russia but Russia sprawls across 11 time zones providing opportunity for spreading the impact of demand peaks and thus reducing generation requirements;
Australia loses 2% more than China, partly as a result of China’s 500kV primary backbone transmission system.
However, India loses 23% include theft through illegal tapping, faulty meters, overloading distribution at peak demand and a very high ratio of low voltage to high voltage line kilometers.
In view of Australia’s long transmission distances, its losses from transmission and distribution have been counterbalanced by low energy costs. This has helped reduce capital investment requirements and contributed to international competitiveness.
non-renewaBle Fuel useD in generation eFFiciency
0%
10%
20%
30%
40%
50%
60%
70%
80%
Gen
erat
ion
effic
ienc
y(fo
ssil
fuel
s onl
y)
1990 2008
Figure 4: Fossil Fuel geNerAtioN eFFiCieNCySource: (IEA 2010)

8 Part 1: Australia’s global position
7%
15%
8% 8%
5%
23%
8%9%
6% 6%8%
0
2
4
6
8
10
12
14
16
18
0%
5%
10%
15%
20%
25%
30%
km2
(mill
ion)
Loss
from
supp
ly to
end
use
r
1990 2008 T&D only Landmass
Figure 5: eleCtriCity lost or used by eNergy iNdustrySource: (IEA 2010)
0%
5%
10%
15%
20%
25%
Tran
smis
sion
and
dist
ribut
ion
loss
es
Figure 6: trANsMissioN ANd distributioN losses 2008Source: (IEA 2010), (IEA 2010)
the iMPliCAtioNs oF A lACK oF iNvestMeNt iN trANsMissioN • The blackout in the USA in 2003 was blamed on inadequate adherence to reliability standards possibly as a result of reduced investment in the networks. • The electricity crisis in Brazil in 2001 as a result of extended drought may have been exacerbated by old and poorly maintained transmission lines that were unable to reroute electricity from hydro facilities less affected by the drought. • Power shortages in China from 2002 to 2005 may have been worsened by grid bottlenecks from limited transmission capacity between regional grids, weakness in transmission of bulk power at local levels and weak interconnection.
• Statistics however show that Australia’s transmission reliability is good, and that outages are due to natural disasters (fire, flood, cyclones) and multiple contingencies, rather than underinvestment.
November 2011 9
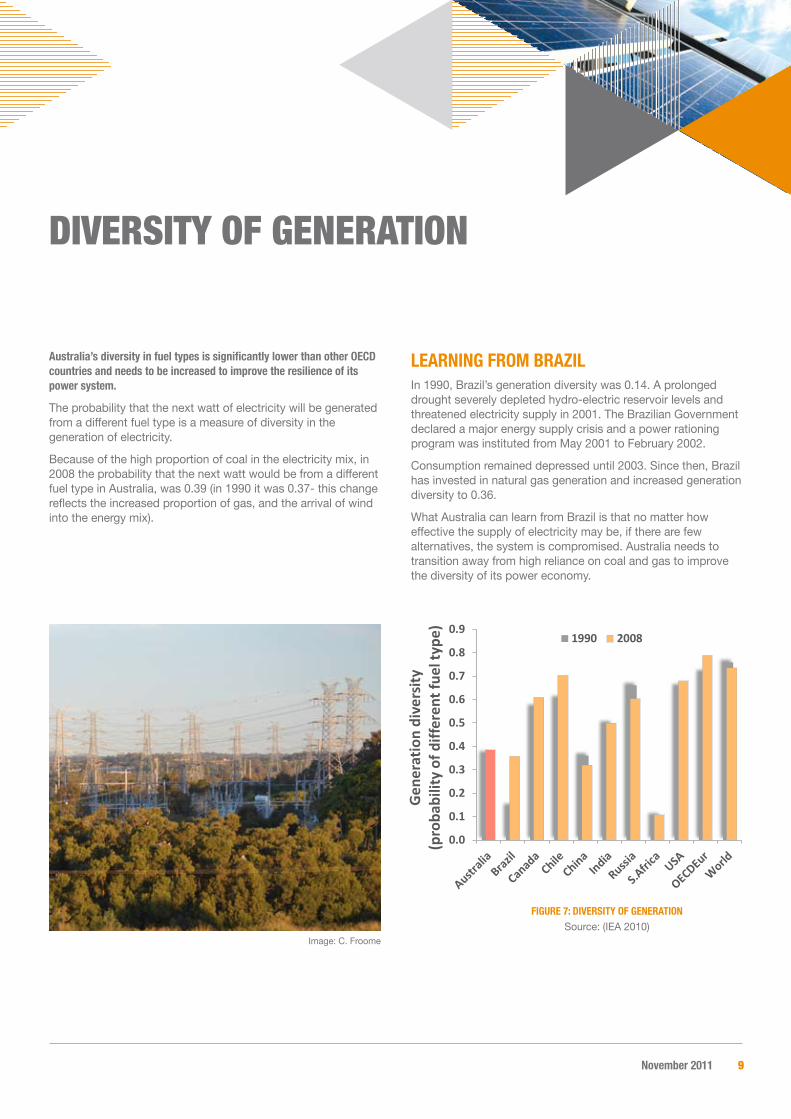
Australia’s diversity in fuel types is significantly lower than other OECD countries and needs to be increased to improve the resilience of its power system.
The probability that the next watt of electricity will be generated from a different fuel type is a measure of diversity in the generation of electricity.
Because of the high proportion of coal in the electricity mix, in 2008 the probability that the next watt would be from a different fuel type in Australia, was 0.39 (in 1990 it was 0.37- this change reflects the increased proportion of gas, and the arrival of wind into the energy mix).
leArNiNg FroM brAZilIn 1990, Brazil’s generation diversity was 0.14. A prolonged drought severely depleted hydro-electric reservoir levels and threatened electricity supply in 2001. The Brazilian Government declared a major energy supply crisis and a power rationing program was instituted from May 2001 to February 2002.
Consumption remained depressed until 2003. Since then, Brazil has invested in natural gas generation and increased generation diversity to 0.36.
What Australia can learn from Brazil is that no matter how effective the supply of electricity may be, if there are few alternatives, the system is compromised. Australia needs to transition away from high reliance on coal and gas to improve the diversity of its power economy.
Diversity oF generation
0.0
0.1
0.2
0.3
0.4
0.5
0.6
0.7
0.8
0.9
Gen
erat
ion
dive
rsity
(p
roba
bilit
y of
diff
eren
t fue
l typ
e) 1990 2008
Figure 7: diversity oF geNerAtioNSource: (IEA 2010)
Image: C. Froome
10 Part 1: Australia’s global position
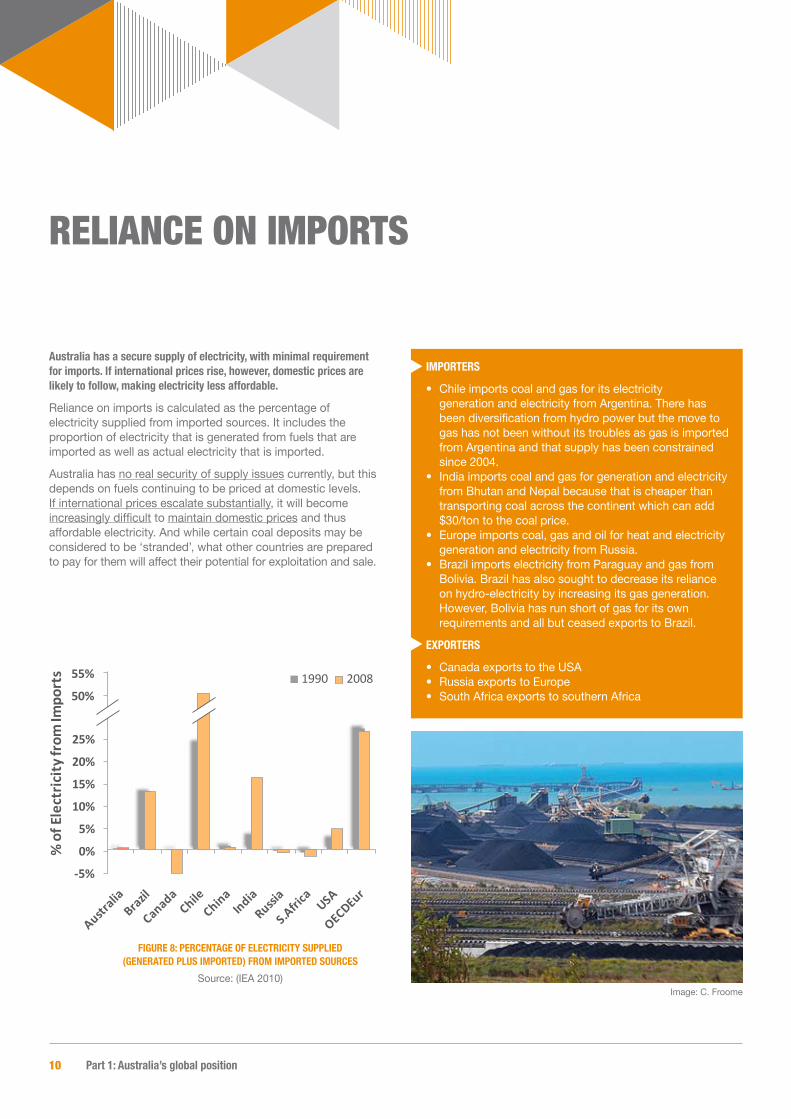
Australia has a secure supply of electricity, with minimal requirement for imports. if international prices rise, however, domestic prices are likely to follow, making electricity less affordable.
Reliance on imports is calculated as the percentage of electricity supplied from imported sources. It includes the proportion of electricity that is generated from fuels that are imported as well as actual electricity that is imported.
Australia has no real security of supply issues currently, but this depends on fuels continuing to be priced at domestic levels. If international prices escalate substantially, it will become increasingly difficult to maintain domestic prices and thus affordable electricity. And while certain coal deposits may be considered to be ‘stranded’, what other countries are prepared to pay for them will affect their potential for exploitation and sale.
reliance on imports
-5%
0%
5%
10%
15%
20%
25%
30%
35%
40%
% o
f Ele
ctric
ity fr
om Im
port
s 1990 200850%
55%
55
Figure 8: PerCeNtAge oF eleCtriCity suPPlied (geNerAted Plus iMPorted) FroM iMPorted sourCes
Source: (IEA 2010)
iMPorters
• Chile imports coal and gas for its electricity generation and electricity from Argentina. There has been diversification from hydro power but the move to gas has not been without its troubles as gas is imported from Argentina and that supply has been constrained since 2004. • India imports coal and gas for generation and electricity from Bhutan and Nepal because that is cheaper than transporting coal across the continent which can add $30/ton to the coal price. • Europe imports coal, gas and oil for heat and electricity generation and electricity from Russia. • Brazil imports electricity from Paraguay and gas from Bolivia. Brazil has also sought to decrease its reliance on hydro-electricity by increasing its gas generation. However, Bolivia has run short of gas for its own requirements and all but ceased exports to Brazil.
exPorters
• Canada exports to the USA • Russia exports to Europe • South Africa exports to southern Africa
Image: C. Froome

November 2011 11
despite its wealth in resources, Australia has very little “spare” (redundant) electricity in case of an increase in demand, which may impact on economic growth.
Electricity shortages impact on a nation’s economy, as electricity fuels growth and if electricity is squeezed, growth may be reduced. As a result, the spare capacity in a nation’s electricity system – its redundancy - is used as a parameter in measuring resilience.
This measure reflects positively on economies with a high component of spare electricity capacity within GDP, and negatively on economies with little spare electricity for every dollar earned.
Lenin is reputed to have said that Communism is “Soviet power plus the electrification of the whole country.” Massive investment in electrification and free provision of utilities led to very large consumption of power in Russia. However, the
charging for the use of utilities after 1990 has substantially reduced power consumption and increased efficiency.
Studies have also found a relationship between electricity consumption and GDP in China. China’s high level of spare capacity has served its growth targets well.
lessoNs FroM ChileChile’s only recession between 1990 and 2008 was in 1999 after a hydro-electricity crisis in 1998 that followed 40 years of drought.
The coupling of GDP growth to electricity growth appears to uncouple after the 2004 electricity crisis as a result of gas constraints.
However, Chile adopted resilience measures after 1999 including requirements/incentives for generators and large industrial customers to have diesel-generated back-up.
reDunDant power For use in gDp
0.00.10.20.30.40.50.60.70.80.9
kWh/
GDP
($20
08)
19902008
Figure 9: sPAre eleCtriCity For use iN eArNiNg iNCoMeSource: (IEA 2010)
-2%
0%
2%
4%
6%
8%
10%
12%
14%
16%
1991 1995 1999 2003 2007
Grow
th
Annual growth (GDP)Annual growth (TWh)
Figure 10: Chile groWth gdP vs tWhSource: (IEA 2010), (IMF 2011)
12 Part 1: Australia’s global position
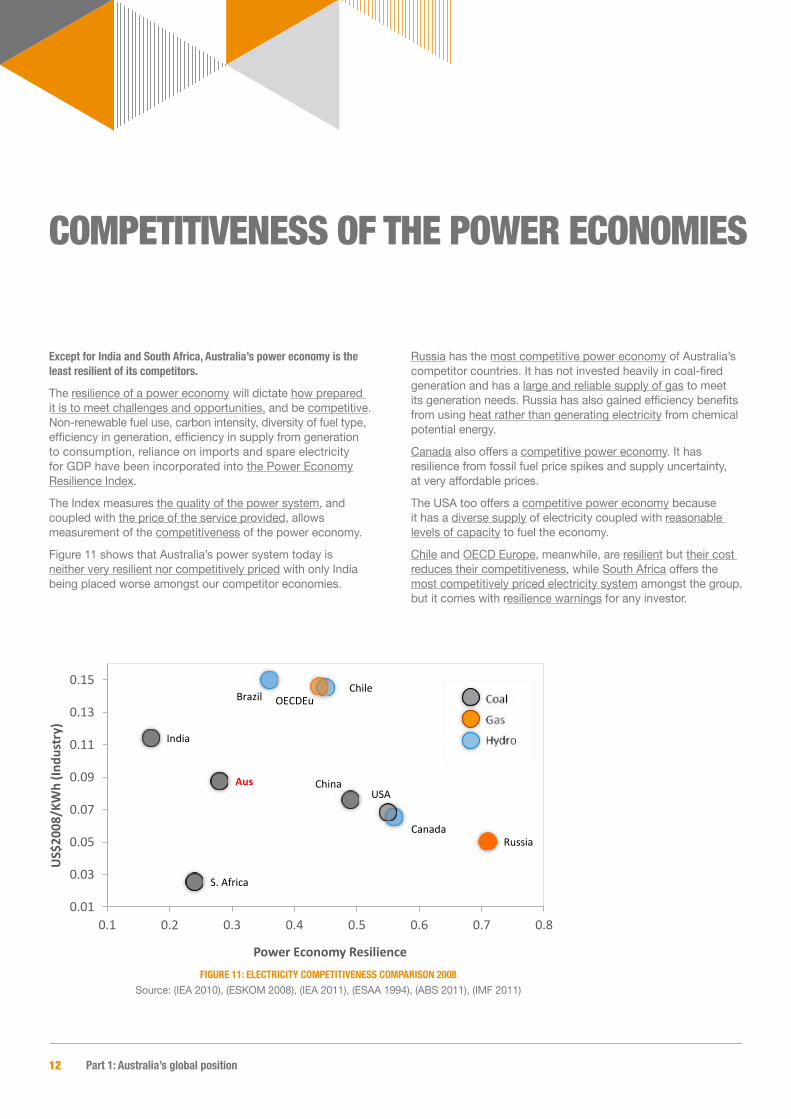
except for india and south Africa, Australia’s power economy is the least resilient of its competitors.
The resilience of a power economy will dictate how prepared it is to meet challenges and opportunities, and be competitive. Non-renewable fuel use, carbon intensity, diversity of fuel type, efficiency in generation, efficiency in supply from generation to consumption, reliance on imports and spare electricity for GDP have been incorporated into the Power Economy Resilience Index.
The Index measures the quality of the power system, and coupled with the price of the service provided, allows measurement of the competitiveness of the power economy.
Figure 11 shows that Australia’s power system today is neither very resilient nor competitively priced with only India being placed worse amongst our competitor economies.
Russia has the most competitive power economy of Australia’s competitor countries. It has not invested heavily in coal-fired generation and has a large and reliable supply of gas to meet its generation needs. Russia has also gained efficiency benefits from using heat rather than generating electricity from chemical potential energy.
Canada also offers a competitive power economy. It has resilience from fossil fuel price spikes and supply uncertainty, at very affordable prices.
The USA too offers a competitive power economy because it has a diverse supply of electricity coupled with reasonable levels of capacity to fuel the economy.
Chile and OECD Europe, meanwhile, are resilient but their cost reduces their competitiveness, while South Africa offers the most competitively priced electricity system amongst the group, but it comes with resilience warnings for any investor.
competitiveness oF tHe power economies
Aus
Brazil
China
India
RussiaCanada
USA
Chile
S. Africa
OECDEu
0.01
0.03
0.05
0.07
0.09
0.11
0.13
0.15
0.1 0.2 0.3 0.4 0.5 0.6 0.7 0.8
US$
2008
/KW
h (In
dust
ry)
Power Economy Resilience Figure 11: eleCtriCity CoMPetitiveNess CoMPArisoN 2008
Source: (IEA 2010), (ESKOM 2008), (IEA 2011), (ESAA 1994), (ABS 2011), (IMF 2011)

November 2011 13
the competitiveness of the power economy - its resilience and price - is driven by many factors. We examine some of these below.
PoliCy ANd iNstitutioNAl eNviroNMeNtAustralia lacks national, strategic planning when it comes to power generation. The Renewable Energy Target (RET) remains the only incentive for investment in low-emission generation. The inability to introduce a carbon price has increased uncertainty for strategic investment. There is no policy to address potential base-load renewable generation located considerable distances from existing grid infrastructure providing a significant challenge for network connection and operation.
Australia has three regulatory environments with a combination of private and government ownership.
• The Australian Energy Regulator (AER) has oversight of the largest regulatory environment, the National Electricity Market (NEM) which supplies electricity to the Eastern states. The NEM has deregulated generation and is operated by the Australian Energy Market Operator (AEMO). • The Economic Regulation Authority (ERA) regulates the Wholesale Electricity Market (WEM) supplying electricity to Western Australia with separated generation from networks and retail. • Power and Water, a state owned corporation, is the primary supplier of electricity to the Northern Territories.
A history of state-based power system development has created a high number of generators, transmitters, distributors and retailers and lead to fragmented policy development as a result of regional target setting rather than national, strategic planning.
competitiveness oF tHe power economies Key Drivers oF tHe past anD tHe Future
Image: NASA

14 Part 1: Australia’s global position
eleCtriCity deMANd ANd loAd ProFileAustralian consumption has increased more than generation since 1990. The increase in peak demand will continue to contribute to the increased need for greater peaking capacity.
This will weigh heavily on electricity tariffs unless measures are taken to address energy efficiency, energy conservation and demand management.
Most competitor countries have increased generation capacity in line with consumption growth. South Africa and Australia are notable exceptions.
lessoNs FroM south AFriCATo decrease the public utility, ESKOM’s, monopoly, the South African government introduced a requirement that 30% of power generation come from independent power producers (IPPs), but due to the low price for electricity none came forward. Consumption continued to grow but government policy on IPPs only changed in 2004 when it instructed ESKOM to increase capacity. By then the reserve margin was already exposed. In 2006, mandatory load shedding started and continued until 2008.
0.0%
0.5%
1.0%
1.5%
2.0%
2.5%
3.0%
3.5%
2008/1990 2020/2008
Per a
nnum
gro
wth
(%)
GWh consumedGeneration plant installedSummer Maximum demand (MW)
Figure 12: AustrAliAN eleCtriCity systeM groWth
Source: (ESAA 1994), (ESAA 2010), (AEMO 2010), (WesternPower 2009), (IES 2011)
Image: UQ OMC

November 2011 15
trANsMissioNAustralia’s transmission network needs to be upgraded and expanded. The NEM transmission network has evolved from the joining of state based transmission networks, originally designed and constructed independently to meet the supply needs within each state.
As a result, the primary transmission voltage for each state is varied and inconsistent from state to state limiting its effectiveness.
Australia’s long distance transmission networks are primarily overhead and the NEM has very limited high voltage DC network systems.
By comparison China, USA and Canada have an AC primary backbone at voltages greater than 400kV and long extensive high voltage DC (HVDC) networks for system security. These countries have lower losses from transmission as a result.
Many countries around the world developed their transmission infrastructures more than thirty years ago. In 2000, 50% of Australian substation transformers were older than 24 years.
Substantial upgrades and network augmentation are needed as depicted by AEMO’s NEMLink, to increase power transfer capabilities from South Australia and Tasmania to Queensland.
In the next twenty years, it is imperative that expansion of the AC transmission system be at a higher level with long distance transfer optimized to reduce system loss and increased reliability to meet the future growth predictions and remotely located renewable energy plants.
eNergy seCurityWith a large supply of local fuels, Australia is considered to have energy security, with international pricing, to date, not being passed through to the cost of electricity.
A simple extrapolation of global fuel prices applied to NEM generation in 2008/09, however, suggests that the bulk cost of electricity in the NEM would have jumped from $53/MWh to $74/MWh; an increase of 40%. This provides an indication of the potential threat to Australia’s power system if global market forces are brought to bear on fuel costs.
$0$10$20$30$40$50$60$70$80
2008 Actual Cost 2008 at Global Fuel Cost
Bulk
Cos
t of E
lect
ricity
/MW
h
Fuel costFixed and Variable Generation CostsAdmin/Overhead costTransmission cost
Figure 14: Cost oF eleCtriCity iF globAl Fuel Costs Are PAid ($8/gJ For gAs ANd $4/gJ For therMAl CoAl)
Source: (ACIL Tasman 2009), (ESAA 2010), (Abare 2010), (AER 2011)
$0$10$20$30$40$50$60$70$80
2008 Actual Cost 2008 at Global Fuel Cost
Bulk
Cos
t of E
lect
ricity
/MW
h
Fuel costFixed and Variable Generation CostsAdmin/Overhead costTransmission cost
0
2,000
4,000
6,000
8,000
10,000
500kV 330kV 275kV 220kV 132 kV
Dist
ance
(km
)
QueenslandNSW + ACTVictoria
Figure 13: trANsMissioN NetWorKs iN the eAsterN stAtes oF the NeMSource: (ESAA 2010)

16 Part 1: Australia’s global position
0
2
4
6
8
10
12
14
1990 1992 1994 1996 1998 2000 2002 2004 2006 2008
US$/
GJ (n
omin
al)
Japan LNG importLNG AUS exportJapan coal importThermal coal AUS exportElectricity fuel cost/GJ
Cost driversKeeping fuel costs low for local electricity generation has been possible because of a combination of coal mine ownership by generators, long term contracts with mines that reflect lower thermal coal prices and ‘stranded’ resources, that is resources unable to be exported because of lack of infrastructure or demand.
It is believed generators will seek to fend off international price impacts but how long will generators be successful at gaining access to fuel at favourable domestic rates as international demand increases?
Figure 15 provides an overview of coal and gas export values compared to electricity fuel cost.
The weighted average real cost of the fuel used in the NEM has decreased by an average of 2.2% per annum.
During the same period, the thermal coal export values increased from $49 to $109.75 per ton which translates to a real price increase of 1.9% per annum.
Figure 15: CoMPArisoN globAl versus doMestiC Fuel CostsSources: (ABARES 1999), (ABARES 2011), (ESAA 1994),
(ACIL Tasman 2009), (AEMO 2010), (BP 2010)
teChNology PersPeCtivesThe use of non-renewable fuels perpetuates vulnerability to fuel shortages and global price increases.
There is no simple path to follow to achieve resilience; it will only result from the pursuit of a combination of renewable energy generation coupled with energy storage, demand side management, bulk power trading across the NEM and an efficient transmission system.
Here are the key features of the technology options available to diversify the supply base.
Power generation: Photovoltaic
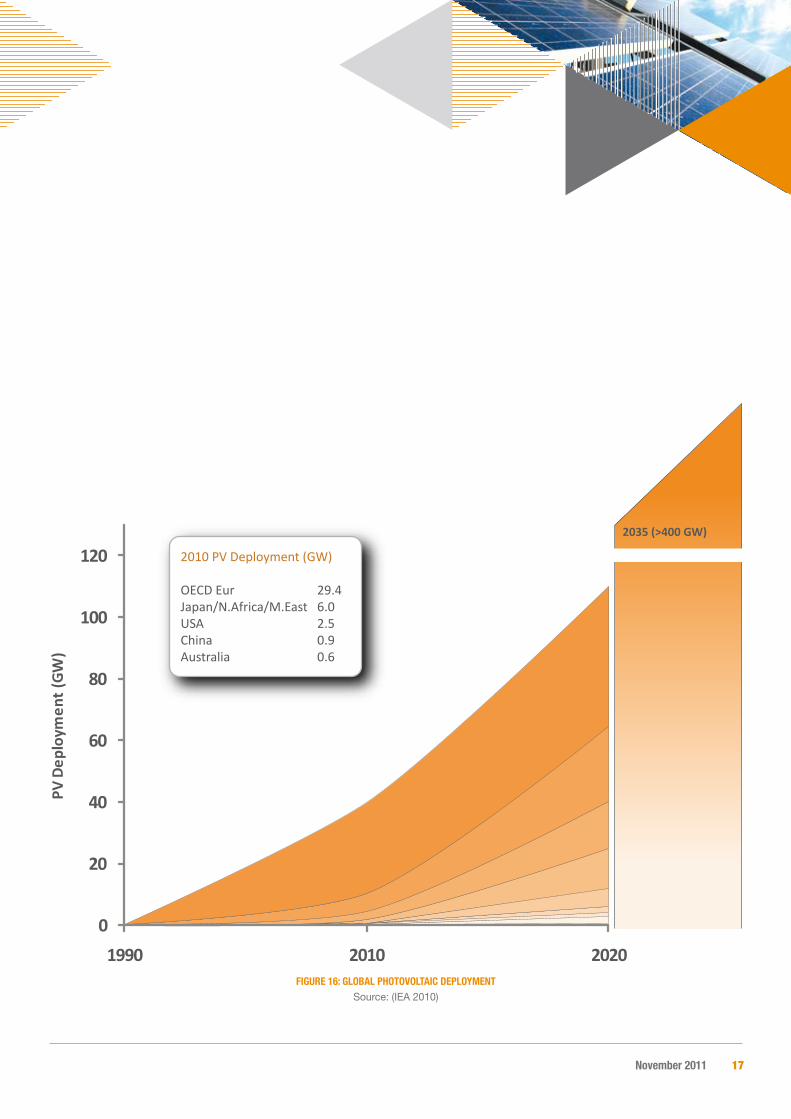
Costs for PV modules have more than halved in the past 2 years, while world production capacity for PV exceeded 16GW in 2010 with estimated cumulative installed capacity of 40GW.
The firm-prediction of production capacity in 2011 is 22GW with an associated ~$7 billion of capital investment in manufacturing capability.
This exponential growth is set to continue with sub $150/MWh being plausible by 2015. The European PV Industry Association predicts a total global installed capacity of between 130 and 190 GW in 2015. The IEA predicts a global installed capacity in excess of 400 GW by 2035.
November 2011 17
OECD Europe
Japan/N.Africa/M.East
USA
China
IndiaBrazilAustraliaS.Africa/Russia/Canada
2035 (>400 GW)
0
20
40
60
80
100
120
1990 2010 2020
PV D
eplo
ymen
t (GW
)
2010 PV Deployment (GW)
OECD Eur 29.4 Japan/N.Africa/M.East 6.0USA 2.5China 0.9Australia 0.6
Figure 16: globAl PhotovoltAiC dePloyMeNtSource: (IEA 2010)
18 Part 1: Australia’s global position
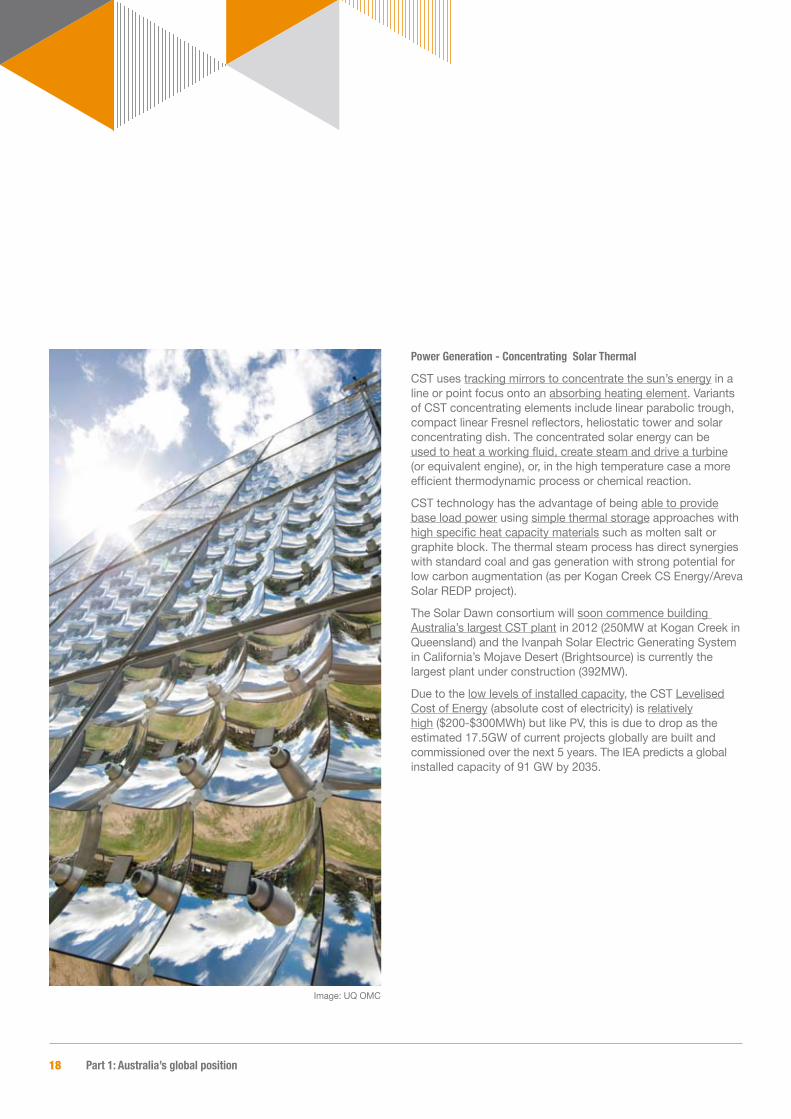
Power generation - Concentrating solar thermal
CST uses tracking mirrors to concentrate the sun’s energy in a line or point focus onto an absorbing heating element. Variants of CST concentrating elements include linear parabolic trough, compact linear Fresnel reflectors, heliostatic tower and solar concentrating dish. The concentrated solar energy can be used to heat a working fluid, create steam and drive a turbine (or equivalent engine), or, in the high temperature case a more efficient thermodynamic process or chemical reaction.
CST technology has the advantage of being able to provide base load power using simple thermal storage approaches with high specific heat capacity materials such as molten salt or graphite block. The thermal steam process has direct synergies with standard coal and gas generation with strong potential for low carbon augmentation (as per Kogan Creek CS Energy/Areva Solar REDP project).
The Solar Dawn consortium will soon commence building Australia’s largest CST plant in 2012 (250MW at Kogan Creek in Queensland) and the Ivanpah Solar Electric Generating System in California’s Mojave Desert (Brightsource) is currently the largest plant under construction (392MW).
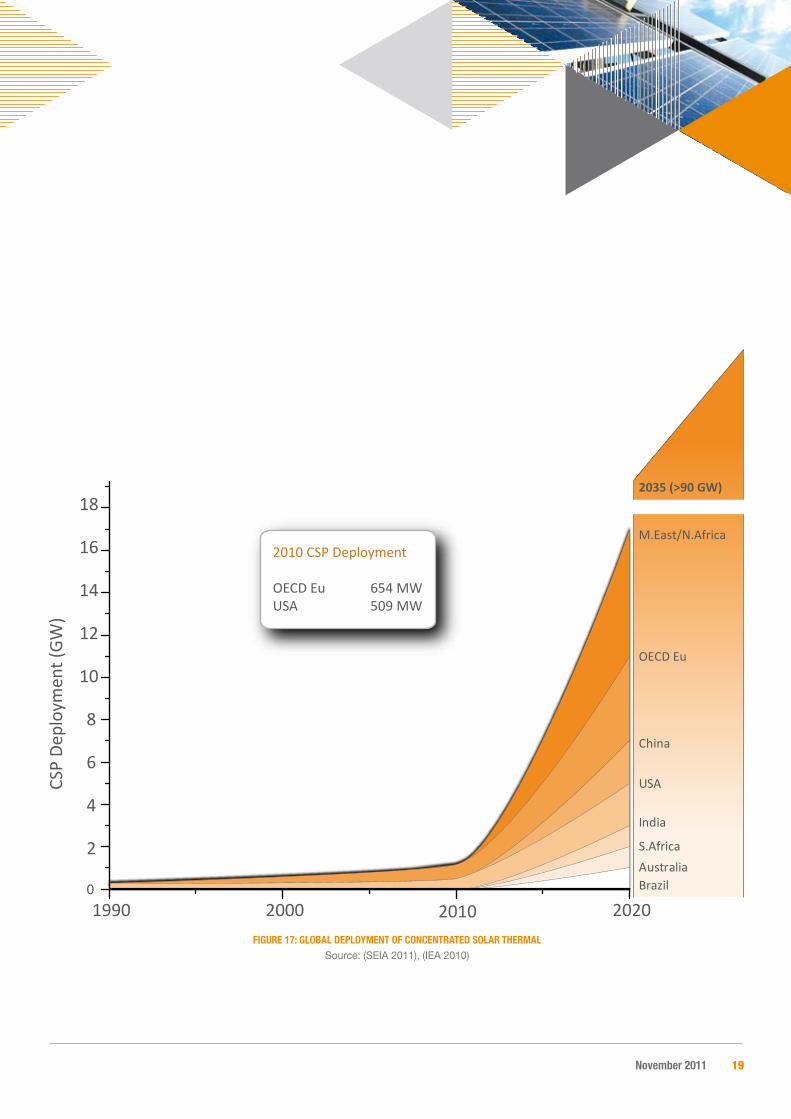
Due to the low levels of installed capacity, the CST Levelised Cost of Energy (absolute cost of electricity) is relatively high ($200-$300MWh) but like PV, this is due to drop as the estimated 17.5GW of current projects globally are built and commissioned over the next 5 years. The IEA predicts a global installed capacity of 91 GW by 2035.
Image: UQ OMC
November 2011 19
M.East/N.Africa
OECD Eu
USA
China
India
S.AfricaAustraliaBrazil
2035 (>90 GW)
1990 2000 2010 20200
2
4
6
8
10
12
14
16
18
CSP
Depl
oym
ent (
GW)
2010 CSP Deployment
OECD Eu 654 MW USA 509 MW
Figure 17: globAl dePloyMeNt oF CoNCeNtrAted solAr therMAlSource: (SEIA 2011), (IEA 2010)

20 Part 1: Australia’s global position
Power generation: Wind
Global installed wind generation capacity was 197GW in 2010. On-shore and off-shore wind-farms have reached utility scale with the London array, an offshore facility expected to reach 1000MW.
However, it requires system integration, transmission capacity and energy storage. Significant deployment has led to cost reductions and efficiency improvements reaching grid parity in many regions with strong wind resources.
In the Australian context, South Australia has good-to-excellent resources but grid strength and the grid interconnection with other states constrain greater levels of deployment at this point in time.
Image: ©Steve Ford Elliott

November 2011 21
0
100
200
300
400
500
600
700
1990 2010 2020
WIn
d De
ploy
men
t (G
W)
Canada > Australia > BrazilIndia
Other
USA
China
OECD Eur
2010 Wind Deployment (GW)
OECD Eur 86 China 45USA 40India 13Other 6Canada 4Australia 2Brazil 1
2035 (>1 TW)
Figure 18: globAl WiNd dePloyMeNtSource: (IEA 2010), (UNData 2011)

22 Part 1: Australia’s global position
energy storage
A key function of energy storage facilities is to provide and absorb intermittent energy (power). That means the storage reacts similarly to a rapid response power plant in peak-load situations and like a dispatchable large consumer in times of power oversupply.
Large scale storage technologies are of key importance as they can provide flexible control energy to backup intermittent generation technologies; increase grid reliability; reduce peak demand and most importantly improve asset utilisation.
Although there are currently many research and development programs globally looking at energy storage, current production capacity is insufficient to make any impact on networks.
Globally, hydro pump storage facilities amount to 127 GW and pump storage is the only reliable storage technology of utility scale today. Of this amount, Australia has 1.5 GW of hydro pump storage with little opportunity for any additional large scale projects.
Other potential storage technologies include: air pressure storage; heat storage (molten salt, basalt, water); inertial flywheel; electro-chemical (batteries); chemical storage (production of hydrogen, methane, methanol); ammonia cracking; electrical (super conducting coils).
Air pressure and heat storage have lower efficiency, battery storage is capital intensive, and the remaining technologies are at an early stage of development although US stimulus funding may catalyse new storage demonstrations by 2012.
Image: RedFlow Limited

November 2011 23
0
20
40
60
80
100
120
140
160
180
200
1990 2008 2020
Ener
gy St
orag
e De
ploy
men
t (GW
)
OECD Eu
USA
Other
AustraliaS.Africa/Russia/Canada
2035 (>200 GW)
2008 Storage Deployment
OECD Eu 42.0 . GW Other 31.9 GWUSA 21.9 GWAustralia 1.5 GWS.Africa 1.4 GWRussia 1.2 GWCanada 0.2 GW
Figure 19: eleCtriCity eNergy storAge dePloyMeNtSource: (IEA 2010), (EIA 2011), (Inage 2009)

24 Part 1: Australia’s global position
Power generation - geothermal (hot dry rock (hdr) or enchanced geothermal systems)
Geothermal energy is capable of contributing large-scale, low-emission base load power. At present, there are technical and cost barriers to large scale implementation. These are expected to be overcome but only in the medium term.
HDR provides potential for higher temperatures and therefore higher efficiencies, however there are only a handful of small power plants operating today. To improve efficiency rates, staged steam cycles such as binary cycles or kalian cycles are required which increases technological complexity and investment costs.
Hot sedimentary aquifers (HSA) are only viable in regions with district heating markets.
The Australian Government believes that geothermal energy will make a significant contribution to Australia’s Renewable Energy Target by 2020. However, as shown in Figure 21, due to the long lead periods required to establish geothermal generation facilities and the current lack of network infrastructure from the areas where the greatest resources are located, the majority of the growth to 2035 will occur post-2020.

November 2011 25
0
5
10
15
20
25
30
1990 2010 2020
Geo
ther
mal
Dep
loym
ent (
GW
) 2035 (>40 GW)
ChinaRussia
OECD Eur
Australia
USA
Other
2010 Geothermal Deployment
Other. 2.6 GWUSA 3 GWOECD Eu 2 GWAustralia 0.2 GW
Figure 20: globAl dePloyMeNt oF geotherMAlSource: (IEA 2010), (UNData 2011)

26 Part 1: Australia’s global position
Power generation – Nuclear
The lifecycle cost has been shown to be very high, and disposal of spent fuel and decommissioned power plants remain problematic although the fuel price impact on generation cost is as low as 10%. Due to lack of adequate information, lifecycle costs are generally not included in levelised cost analyses, making comparisons with other technologies misleading.
Nuclear Power is limited to countries where state owned utilities or governments shoulder the risk. There are substantial risks associated with fuel supply, operational costs and decommissioning. In Germany the development and decommissioning of nuclear power technology is heavily subsidised.
Australia has substantial viably extractable Uranium resources (i.e. Olympic dam).

November 2011 27
0
100
200
300
400
500
600
700
1990 2011 2020
Nuc
lear
Dep
loym
ent (
GW
)
India>Brazil>S.AfricaCanadaRussia
China
USA
OECD Eur
E.Europe/Japan/Korea
India>Brazil>S.AfricaCanadaRussia
China
USA
OECD Eur
E.Europe/Japan/Korea
2035 (> 640 GW)
2011 Nuclear Deployment (GW)
OECD Eur 130 E.Europe/Japan/Korea 85USA 99Russia 23China 10Canada 13India/Brazil/S.Africa 8
Figure 21: globAl dePloyMeNt oF NuCleArSource: (UNData 2011), (IEA 2010)

28 Part 1: Australia’s global position
Carbon dioxide Capture and storage
Carbon Capture and Storage is an energy intensive process, as a result of sequestration, transportation, treatment and storage, as shown below.
• Sequestration – Carbon Capture (pre- and post-combustion) = 0.2 MWh/t CO2 • CO2 Transportation =0.1MWh/t CO2/400km • Treatment and storage =0.15 MWh/t/CO2
The molecular dimension of Hydrocarbons (small) and CO2
(large) differ substantially. With CO2 storage, oxygen is also stored underground, requiring significant infrastructure investment. There are a few small pilot programs in early stages of testing.
Carbon capture technology has also been deployed to improve gas and oil extraction in eight Carbon Capture plants, capturing carbon from gas fields and fuel processing plants with 2.7 million tonnes of carbon per annum re-injected into reservoirs and 21.5 million tonnes of carbon per annum used for enhanced oil recovery. According to the Global Carbon Capture and Storage Institute, current projects planned will result in total capture and storage of carbon from 29GW of power plants before 2020.
Image: C. Grieg

November 2011 29
0
5
10
15
20
25
30
35
2010 2016 2020
CSS D
eplo
ymen
t (GW
gen
erati
on ca
ptur
ed)
2035 (29 MW)
AustraliaKorea/UAE
Canada
China
USA
OECDEur
Figure 22: globAl dePloyMeNt oF CCs
Source: (GCCSI 2011), (IEA 2010)

30 Part 1: Australia’s global position
Comparative Costs of technology options
One of the more common, accepted methodologies of comparing the absolute costs of electricity is the Levelised Cost of Energy (LCoE) which seeks to provide a single cost price for every KWh of electricity for the plant’s useful life.
$0
$50
$100
$150
$200
$250
$300
$350
Leve
lised
Cos
t of E
nerg
y ($
/MW
h)
Figure 23: levelised Cost oF eleCtriCity: teChNology CoMPArisoN (gAs $4/gJ, CoAl $1.50/gJ, urANiuM, $0.83/gJ, $23 CArboN PriCe, $40 reC)
Source: (Wagner and Foster 2011)
What the levelised cost technology comparison tells us
• Wind generation is now within reach of the coal and gas fired generation cost which is why there is an escalation of wind power deployment around the world • Geothermal offers cost effective potential but needs to overcome its implementation challenges • Nuclear provides cost effective potential but needs to overcome its uninsurable risk and storage challenges • Solar technologies still present a cost challenge but with the projected deployments around the world, prices will reduce substantially as discussed in previous sections
Image: ©Carlos Paes
November 2011 31
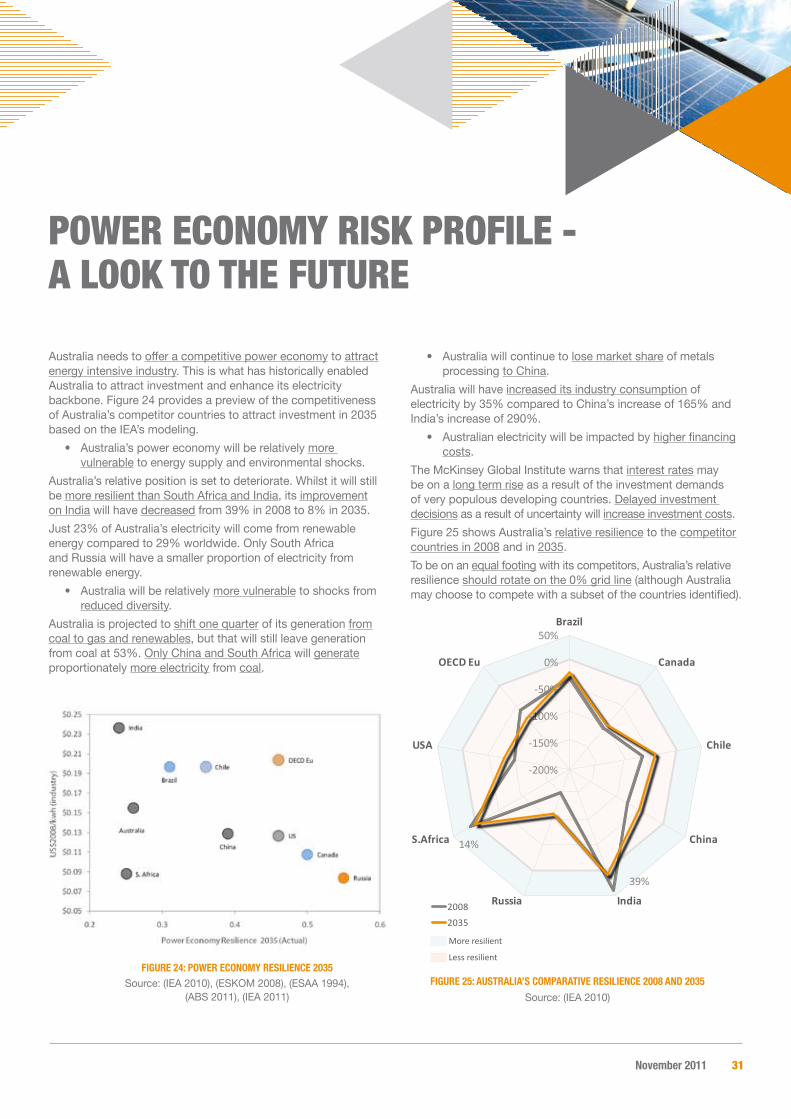
Australia needs to offer a competitive power economy to attract energy intensive industry. This is what has historically enabled Australia to attract investment and enhance its electricity backbone. Figure 24 provides a preview of the competitiveness of Australia’s competitor countries to attract investment in 2035 based on the IEA’s modeling.
• Australia’s power economy will be relatively more vulnerable to energy supply and environmental shocks.
Australia’s relative position is set to deteriorate. Whilst it will still be more resilient than South Africa and India, its improvement on India will have decreased from 39% in 2008 to 8% in 2035.
Just 23% of Australia’s electricity will come from renewable energy compared to 29% worldwide. Only South Africa and Russia will have a smaller proportion of electricity from renewable energy.
• Australia will be relatively more vulnerable to shocks from reduced diversity.
Australia is projected to shift one quarter of its generation from coal to gas and renewables, but that will still leave generation from coal at 53%. Only China and South Africa will generate proportionately more electricity from coal.
• Australia will continue to lose market share of metals processing to China.
Australia will have increased its industry consumption of electricity by 35% compared to China’s increase of 165% and India’s increase of 290%.
• Australian electricity will be impacted by higher financing costs.
The McKinsey Global Institute warns that interest rates may be on a long term rise as a result of the investment demands of very populous developing countries. Delayed investment decisions as a result of uncertainty will increase investment costs.
Figure 25 shows Australia’s relative resilience to the competitor countries in 2008 and in 2035.
To be on an equal footing with its competitors, Australia’s relative resilience should rotate on the 0% grid line (although Australia may choose to compete with a subset of the countries identified).
power economy risK proFile - a looK to tHe Future
Figure 24: PoWer eCoNoMy resilieNCe 2035Source: (IEA 2010), (ESKOM 2008), (ESAA 1994),
(ABS 2011), (IEA 2011)
-200%
-150%
-100%
-50%
0%
50%
39%
14%
Brazil
Canada
Chile
China
IndiaRussia
S.Africa
USA
OECD Eu
2008
2035
More resilient
Less resilient
-200%
-150%
-100%
-50%
0%
50%
39%
14%
Brazil
Canada
Chile
China
IndiaRussia
S.Africa
USA
OECD Eu
2008
2035
More resilient
Less resilient
Figure 25: AustrAliA’s CoMPArAtive resilieNCe 2008 ANd 2035
Source: (IEA 2010)
32 Part 1: Australia’s global position
In general, Australia is less resilient than its competitors. In 2008 Australia was 39% more resilient than India and 14% more resilient than South Africa, but by 2035 the IEA modeling predicts that Australia will be 8% more resilient than India and 4% more resilient than South Africa.
Australia’s options to improve power economy resilience
We have identified seven key options open to Australia to help improve its future power economy resilience. These are:
• Greater investment in renewable energy will improve Australia’s non-renewable fuel use, its carbon emissions and its diversity of generation • Offering incentives for more efficient coal fired generation, in particular encouraging a shift away from brown coal fired generation, will improve Australia’s generation efficiency • Investing in high voltage transmission infrastructure will improve Australia’s transmission efficiency and reduce its requirement for new generation capacity to service peak load • Offering incentives to replace aged power plants with Concentrated Solar Power plants (with storage) rather than gas fired power plants will encourage a shift away from base-load generation vulnerable to global energy pressures • Focusing on the whole power system rather than on the component parts is required. A national policy framework taking into account the whole power economy will ensure that the optimum level of investment is made for the targeted outcome • With an ageing fleet of base-load generators, Australia has a golden opportunity now to make the leap to a resilient power economy instead of shuffling forward based on business as usual, but it will require planning and commitment by the key stakeholders to identify and shift to this new paradigm • Government, large power users and residential end-users each have roles in this transformation process. China and India have already formulated the strategic vision of their power economies and are moving forward not because they have to, but because they are preparing for the future. Australia too needs to prepare now for a power economy fit for the future.

November 2011 33
Image: C. Froome
About the globAl ChANge iNstituteThe Global Change Institute at The University of Queensland contributes to evidence-based, progressive solutions to the problems of a rapidly changing world within the existing and projected frameworks of those issues: political, environmental, social, economic, technical.
It investigates complex, interconnected issues in innovative ways to achieve multi-disciplinary, integrated solutions.
The University of Queensland is a respected leader in many research areas associated with global change and is well positioned to provide national and international direction. The Global Change Institute is a vehicle for the collaborative research, learning, engagement and advocacy required to address the major global change issues.

T: (+61 7) 3365 3555 / E: [email protected]
Level 7, Gehrmann Laboratories (60)
University of Queensland
St Lucia QLD 4072, Australia
www.gci.uq.edu.au
Printed on carbon neutral paper.