deliverable d7.1: kpi definition 1_kpi definition_v1 2_final.pdf · the ide4l kpi set has been...
TRANSCRIPT
IDE4L is a project co-funded by the European Commission
Project no: 608860
Project acronym: IDE4L
Project title: IDEAL GRID FOR ALL
Deliverable D7.1: KPI Definition
Due date of deliverable: 30.11.2014
Actual submission date: 02.12.2014
Start date of project: 01.09.2013 Duration: 36 months
Lead beneficial name: Tampere University of Technology, Finland
Writers/authors: Fernando Salazar (UFD); Fernando Martín (UFD); Maite Hormigo (GNF)
Dissemination level: PU
Track Changes
Version Date Description Author Reviewer
V0.0 01/04/2014 Table of Contents Maite Hormigo
V 0.1 21/04/2014 A2A comments Alessio Dede
V0.2 22/04/2014 WP7 meeting comments Maite Hormigo
V0.3 29/04/2014 Content update (state of the art) Maite Hormigo
V0.4 21/05/2014 A2A comments Alessio Dede
V0.5 27/05/2014 Document update Maite Hormigo Alessio Dede
V0.6 22/07/2014 Inserted chapter 8 summary Maite Hormigo
IDE4L Deliverable D7.1
2 IDE4L is a project co-funded by the European Commission
V0.7 01/08/2014 Inserted chapter 8 content Maite Hormigo Amelia Álvarez Alessio Dede
Per Routh
V0.8 10/10/2014 Insertion of KPIs, Abstract, ToC update, Acronyms
Maite Hormigo
V0.9 21/10/2014 IDE4L and EEGI KPI correspondence review
Maite Hormigo Juan Luis Garrote Miquel Cruz Alessio Dede
V1.0 24/11/2014 Deliverable review Maite Hormigo Fernando Salazar Fernando Martín Alessio Dede Per Routh Lukas Verheggen Juan Luis Garrote Andrea Angioni Antonino Riccobono Sami Repo Stefano Zanini Antti Mutanen Zaid Al-Jassim Jasmin Mehmedalic Hossein Hooshyar Miquel Cruz Julio Usaola

IDE4L Deliverable D7.1
3 IDE4L is a project co-funded by the European Commission
1. EXECUTIVE SUMMARY
This document provides a comprehensive context and description of the KPI definition and
selection procedure, in order to assess the performance of the IDE4L architecture and use cases.
The IDE4L KPI set has been developed using the European Electricity Grid Initiative (EEGI)
methodology as the reference framework for this task. Therefore, the EEGI KPI structure is
introduced and given an ample depiction at the beginning of the deliverable (Chapter 4).
The IDE4L KPIs are going to be used as a fundamental tool for evaluating the Use Cases to be
tested within the project, so a deep analysis of the Use Cases has been performed, and a specific
set of KPIs has been designed for each one.
In the process of crafting KPIs for the IDE4L use cases, two templates have been used:
1. a short one for a first approach of the selection, and
2. a detailed one for a complete definition of the selected ones
The correspondence between Use Cases and KPIs is shown in Chapter 5, whereas their whole
description can be found in Chapter 6.
In Chapter 7, some guidelines for the KPI calculation are given, in order to explain how to use and
make the most of them. This process is defined as a flow chart, starting with the validation of all
the inputs in the different demonstration scenarios, and then continuing with the evaluation of the
KPI. Moreover, a template for the results is designed, in order to standardize and facilitate this
task.
Finally, in order to determine the impact on the DSO business performance of IDE4L project, a map
from IDE4L to EEGI KPIs is drawn.

IDE4L Deliverable D7.1
4 IDE4L is a project co-funded by the European Commission
TABLE OF CONTENTS:
1. EXECUTIVE SUMMARY .................................................................................................................................. 3
2. ACRONYMS ................................................................................................................................................... 6
3. INTRODUCTION .......................................................................................................................................... 10
4. REFERENCE FRAMEWORK FOR KPI DEFINITION ......................................................................................... 11
4.1 EEGI methodology ........................................................................................................................... 11
4.2 Overarching KPIs (EEGI Level 1) ....................................................................................................... 12
4.3 Specific KPIs (EEGI Level 2) .............................................................................................................. 14
4.4 Project KPIs (EEGI Level 3) ............................................................................................................... 19
4.5 EEGI Framework contextualization for IDE4L: IDE4L methodology ................................................ 20
5. KPIS AND USE CASES CORRESPONDANCE .................................................................................................. 24
6. KPI DEFINITION ........................................................................................................................................... 26
6.1 UC1: MV & LV Real-time monitoring ............................................................................................... 26
6.2 UC2: MV & LV State estimation ....................................................................................................... 41
6.3 UC3: Dynamic Monitoring for TSO .................................................................................................. 45
6.4 UC4: Communication devices for transmitting signals considering long distances within the
electrical distribution system ...................................................................................................................... 48
6.5 UC5: PLC communications for the active distribution grid ............................................................. 50
6.6 UC6: MV&LV Load Forecast ............................................................................................................. 52
6.7 UC7: MV&LV State Forecast ............................................................................................................ 55
6.8 UC8: Network Description Update .................................................................................................. 60
6.9 UC9: Protection Configuration Update ........................................................................................... 63
6.10 UC10: Control Center Network Power Control (Tertiary Control) .................................................. 65
6.11 UC11: LV Network Power Control (Secondary control)................................................................... 74
6.12 UC12: MV Network Power Control (Primary Control) ..................................................................... 83
6.13 UC13: Decentralized FLISR ............................................................................................................... 92
6.14 UC14: Power quality control ........................................................................................................... 99
6.15 UC15: Expansion Planning ............................................................................................................. 103
6.16 UC16: Operational Planning .......................................................................................................... 110
6.17 UC17: Target network Planning ..................................................................................................... 113
6.18 UC18 and UC19: Load Areas Configuration; Flexible Table ........................................................... 115
6.19 UC20: Off-Line Validation .............................................................................................................. 116
6.20 UC21: Real-time Validation ........................................................................................................... 118
6.21 UC22: SRP and CRP Day-Ahead and Intra-Day Market Procurement ........................................... 120

IDE4L Deliverable D7.1
5 IDE4L is a project co-funded by the European Commission
6.22 UC23: Conditional re-profiling activation (CRP activation) ........................................................... 122
6.23 UC24: Day-ahead Demand Response ............................................................................................ 123
6.24 UC25: Day-ahead Dynamic Tariff................................................................................................... 125
7. GUIDELINES FOR KPI EVALUATION ........................................................................................................... 129
7.1 Introduction to the methodology .................................................................................................. 129
7.2 IDE4L to EEGI KPIs mapping ........................................................................................................... 129
7.3 Step-by-step approach for KPI evaluation ..................................................................................... 132
7.4 Results template description ......................................................................................................... 133
8 REFERENCES ............................................................................................................................................. 136
IDE4L Deliverable D7.1
6 IDE4L is a project co-funded by the European Commission
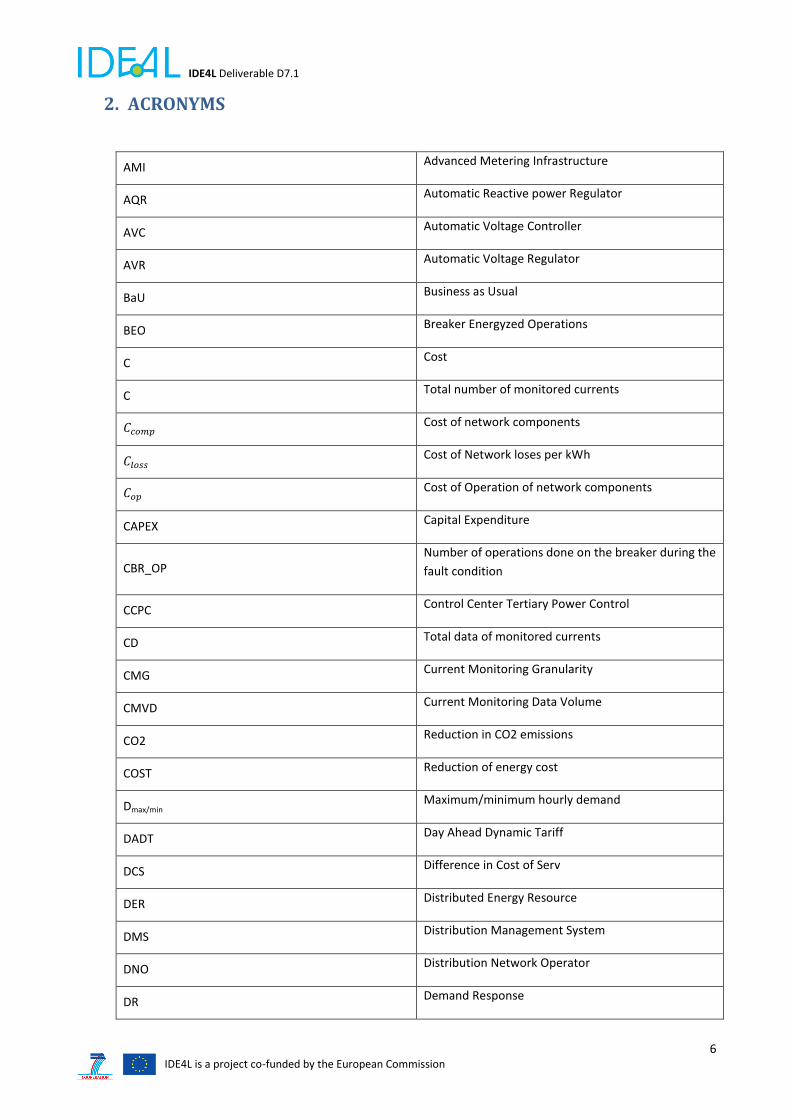
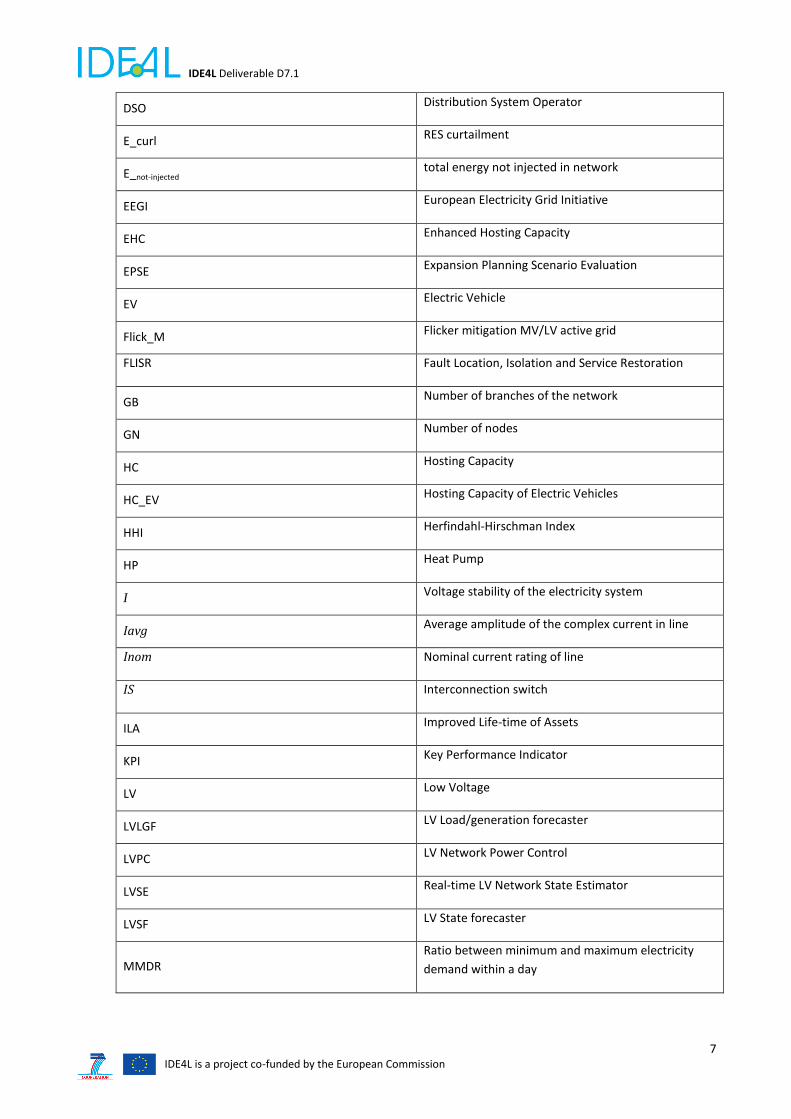
2. ACRONYMS
AMI Advanced Metering Infrastructure
AQR Automatic Reactive power Regulator
AVC Automatic Voltage Controller
AVR Automatic Voltage Regulator
BaU Business as Usual
BEO Breaker Energyzed Operations
C Cost
C Total number of monitored currents
𝐶𝑐𝑜𝑚𝑝 Cost of network components
𝐶𝑙𝑜𝑠𝑠 Cost of Network loses per kWh
𝐶𝑜𝑝 Cost of Operation of network components
CAPEX Capital Expenditure
CBR_OP Number of operations done on the breaker during the
fault condition
CCPC Control Center Tertiary Power Control
CD Total data of monitored currents
CMG Current Monitoring Granularity
CMVD Current Monitoring Data Volume
CO2 Reduction in CO2 emissions
COST Reduction of energy cost
Dmax/min Maximum/minimum hourly demand
DADT Day Ahead Dynamic Tariff
DCS Difference in Cost of Serv
DER Distributed Energy Resource
DMS Distribution Management System
DNO Distribution Network Operator
DR Demand Response
IDE4L Deliverable D7.1
7 IDE4L is a project co-funded by the European Commission
DSO Distribution System Operator
E_curl RES curtailment
E_not-injected total energy not injected in network
EEGI European Electricity Grid Initiative
EHC Enhanced Hosting Capacity
EPSE Expansion Planning Scenario Evaluation
EV Electric Vehicle
Flick_M Flicker mitigation MV/LV active grid
FLISR Fault Location, Isolation and Service Restoration
GB Number of branches of the network
GN Number of nodes
HC Hosting Capacity
HC_EV Hosting Capacity of Electric Vehicles
HHI Herfindahl-Hirschman Index
HP Heat Pump
I Voltage stability of the electricity system
Iavg Average amplitude of the complex current in line
Inom Nominal current rating of line
IS Interconnection switch
ILA Improved Life-time of Assets
KPI Key Performance Indicator
LV Low Voltage
LVLGF LV Load/generation forecaster
LVPC LV Network Power Control
LVSE Real-time LV Network State Estimator
LVSF LV State forecaster
MMDR Ratio between minimum and maximum electricity
demand within a day

IDE4L Deliverable D7.1
8 IDE4L is a project co-funded by the European Commission
MO Market Operator
MV Medium Voltage
MVLGF MV Load/generation forecaster
MVPC MV Network Power Control
MVSE Real-time MV Network State Estimator
MVSF MV State forecaster
NC Increase in Network Capacity
NCAC Network Capacity at an Affordable Cost
NDU Network Description Update
OLTC On-load Tap Changer
OLV Off-line Validation
OPEX Operational Expenditure
P Total number of monitored active powers
Pcur Curtailed Production for generation unit
Pdr Curtailed/moved Load of load unit
Pload Active Power consumed by the load
Pprod Active Power of production unit
PRL Peak Load Reduction
Pt Active Power going through Transformer
P/QMG Power Monitoring Granularity
PCU Protection Configuration Update
PD Total data of monitored active powers
PD Peak demand reduction ratio
PER Packet Error Rate
PLC Power Line Communication
PMDV Power Monitoring Data Volume
Q Total number of monitored reactive powers
QD Total data of monitored reactive power
IDE4L Deliverable D7.1
9 IDE4L is a project co-funded by the European Commission
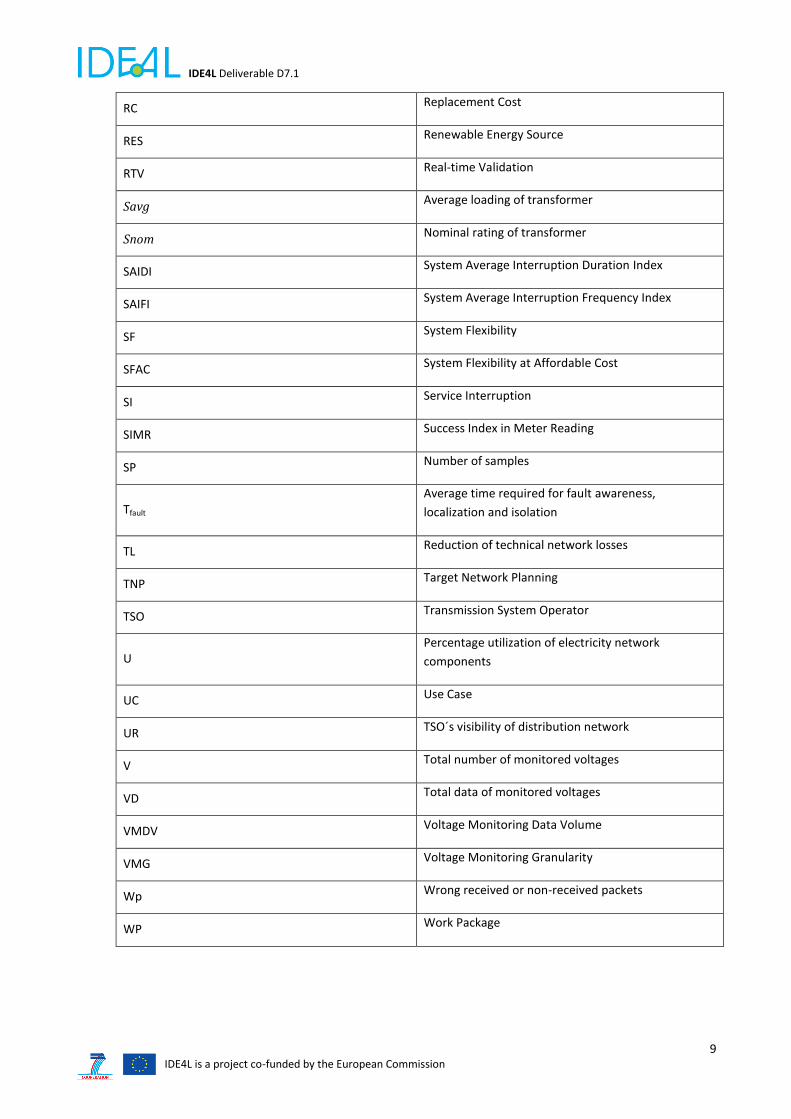
RC Replacement Cost
RES Renewable Energy Source
RTV Real-time Validation
Savg Average loading of transformer
Snom Nominal rating of transformer
SAIDI System Average Interruption Duration Index
SAIFI System Average Interruption Frequency Index
SF System Flexibility
SFAC System Flexibility at Affordable Cost
SI Service Interruption
SIMR Success Index in Meter Reading
SP Number of samples
Tfault Average time required for fault awareness,
localization and isolation
TL Reduction of technical network losses
TNP Target Network Planning
TSO Transmission System Operator
U Percentage utilization of electricity network
components
UC Use Case
UR TSO´s visibility of distribution network
V Total number of monitored voltages
VD Total data of monitored voltages
VMDV Voltage Monitoring Data Volume
VMG Voltage Monitoring Granularity
Wp Wrong received or non-received packets
WP Work Package

IDE4L Deliverable D7.1
10 IDE4L is a project co-funded by the European Commission
3. INTRODUCTION
In IDE4L project, 22 Use Cases are going to be tested in different environments: development
laboratories, demonstration laboratories, and field demonstrators. In order to evaluate the
solutions, algorithms and procedures to be tested, a proper methodology has to be defined. This
document aims at deeply describing the methodology defined in IDE4L for the KPIs selection and
definition, and also establishing a set of guidelines to help the calculations.

IDE4L Deliverable D7.1
11 IDE4L is a project co-funded by the European Commission
4. REFERENCE FRAMEWORK FOR KPI DEFINITION
4.1 EEGI methodology
After the analysis of the different frameworks for KPIs using the judgement and experience of the
project participants, the EEGI framework has been adopted as a reference for the IDE4L KPI study,
due to its simplicity and level of development.
EEGI has analysed the energy targets for the future electricity sector decarbonisation, and it has
developed a complete roadmap for 2022, where a set of Key Performance Indicators (KPI) are
defined in order to quantify the proposed goals for a low carbon economy at affordable costs
[EEGI_roadmap].
The EEGI framework is developed under the GRID+ project [grid+], oriented to support the
development of EEGI initiative. With this purpose, three levels of KPIs have been introduced, each
level having a specific management goal of the Research and Innovation Roadmap. These KPIs are
not oriented to evaluate the results of R&I projects, but to estimate their contribution to achieve
the EU goals.
In the following figure, the three EEGI KPI levels are shown:
Figure 1 EEGI KPI levels
Source: EEGI Grid+ project
Level 1: “Overarching KPIs” consist of a set of indicators which trace clear progress brought
by EEGI activities towards its overarching goal
Level 2: “Specific KPIs” include those indicators oriented to quantify the expected impacts
of a group of R&I activities in view of meeting the R&I roadmap overarching goal
Level 3: “Project KPIs” are a set of indicators proposed by each R&I project in view of
detailing further the contribution of each R&I project to level 2 KPIs
In the study of KPIs, some scenarios shall be taken into consideration. First of all, the current
situation must be analyzed as a reference, and then two possible future situations:

IDE4L Deliverable D7.1
12 IDE4L is a project co-funded by the European Commission
Figure 2 Scenarios to be measured
Source: EEGI Grid+ project
Business as Usual (BAU) case: this scenario shows what would be the situation if
conventional solutions are applied (it reflects the normal evolution that the network would
have)
R&I case: this scenario corresponds to a future situation where innovative solutions
provided by R&I project results are implemented. This impact can be technical, economical,
or both of them
Baseline case: reference scenario
Once the scenarios are defined, EEGI proposes a step-by-step methodology to measure the KPIs. It
is a six-step process, defined as it follows:
1 STEP 1: Determination of the reference scenario or initial situation, the problems to
solve, needs to satisfy, and the drivers that trigger a network/system improvement
2 STEP 2: Analysis of the future situation when the conventional evolution of the
network happens (BAU situation)
3 STEP 3: Calculation of the correspondent KPI to evaluate the BAU situation
4 STEP 4: Analysis of the future situation when smart grid solutions are deployed in
the network (R&I situation)
5 STEP 5: Calculation of the correspondent KPI to evaluate the R&I situation
6 STEP 6: Comparison of both scenarios, and calculation of the final indicator
applying the proposed formula
4.2 Overarching KPIs (EEGI Level 1)
The EEGI Roadmap has identified an overarching goal of allowing European electricity networks
continuously deliver effective flexible capacities to integrate actions of grid users at affordable

IDE4L Deliverable D7.1
13 IDE4L is a project co-funded by the European Commission
costs, keeping the system reliability at levels compatible with societal needs. In order to evaluate
the approach of R&I activities to this goal, two KPIs are defined to be applied to clusters of projects:
1. A.1 Increased network capacity at affordable cost
This indicator evaluates the increase/decrease of network capacity at an affordable cost
(NCAC) for all grid-users (generation and demand), wherever and whenever it is necessary,
maintaining an affordable cost, i.e. maximising the added network capacity per euro of
investment. Two different calculations are provided:
a) Variation of the amount of network capacity per euro of cost:
∆𝑁𝐶𝐴𝐶 = 𝑁𝐶𝐴𝐶𝑅&𝐼 − 𝑁𝐶𝐴𝐶𝐵𝐴𝑈 [unit: W/€]
Being 𝑁𝐶𝐴𝐶𝑅&𝐼 = 𝑁𝐶𝑅&𝐼/𝐶𝑅&𝐼 ; and 𝑁𝐶𝐴𝐶𝐵𝐴𝑈 = 𝑁𝐶𝐵𝐴𝑈/𝐶𝐵𝐴𝑈
It can also be expressed in terms of percentage:
∆𝑁𝐶𝐴𝐶% = ((𝑁𝐶𝐴𝐶𝑅&𝐼 − 𝑁𝐶𝐴𝐶𝐵𝐴𝑈)/𝑁𝐶𝐴𝐶𝐵𝐴𝑈) × 100
b) There is the possibility that the R&I project does not provide an improvement of the
network capacity, but a reduction of the cost. In this case, the interesting indicator is the
one proposed:
∆𝐶 = 𝐶𝑅&𝐼 − 𝐶𝐵𝐴𝑈 [𝑢𝑛𝑖𝑡: €]
∆𝐶% = ((𝐶𝑅&𝐼 − 𝐶𝐵𝐴𝑈)/𝐶𝐵𝐴𝑈) × 100 [𝑢𝑛𝑖𝑡: %]
Where:
NC is the Increase in Network Capacity (through BAU or R&I) (increase in the amount of
electrical power that can be transmitted or distributed in the selected frame) [W]
C is the Cost (OPEX and/or CAPEX) [€]
NCAC is the Increase of Network Capacity at Affordable Cost [W/€]
2. A.2 Increased system flexibility at affordable cost
This indicator evaluates the increase/decrease of system flexibility for all grid-users
(generation, loads, and network operators), while avoiding potential instability and
blackouts, keeping an affordable cost. The following general indicator is provided:
∆𝑆𝐹𝐴𝐶 = 𝑆𝐹𝐴𝐶𝑅&𝐼 − 𝑆𝐹𝐴𝐶𝐵𝐴𝑈 [𝑢𝑛𝑖𝑡: 𝑊 𝑜𝑟 𝑀𝑉𝐴𝑟/€]
being 𝑆𝐹𝐴𝐶𝑅&𝐼 = 𝑆𝐹𝑅&𝐼/𝐶𝑅&𝐼
and 𝑆𝐹𝐴𝐶𝐵𝐴𝑈 = 𝑆𝐹𝐵𝐴𝑈/𝐶𝐵𝐴𝑈

IDE4L Deliverable D7.1
14 IDE4L is a project co-funded by the European Commission
It can also be expressed in terms of percentage:
∆𝑆𝐹𝐴𝐶% = ((𝑆𝐹𝐴𝐶𝑅&𝐼 − 𝑆𝐹𝐴𝐶𝐵𝐴𝑈)/𝑆𝐹𝐴𝐶𝐵𝐴𝑈) × 100
Two more indicators are provided, for the following special cases:
a) If the R&I project does not know information about the cost of the innovative solutions
they are testing, the indicator will only take the system flexibility into account:
∆𝑆𝐹 = 𝑆𝐹𝑅&𝐼 − 𝑆𝐹𝐵𝐴𝑈 [𝑢𝑛𝑖𝑡: 𝑊 𝑜𝑟 𝑀𝑉𝐴𝑟]
∆𝑆𝐹% = ((𝑆𝐹𝑅&𝐼 − 𝑆𝐹𝐵𝐴𝑈)/𝑆𝐹𝐵𝐴𝑈) × 100 [𝑢𝑛𝑖𝑡: %]
b) If the R&I project does not provide an improvement of the network capacity, but a
reduction of the cost:
∆𝐶 = 𝐶𝑅&𝐼 − 𝐶𝐵𝐴𝑈 [𝑢𝑛𝑖𝑡: €]
∆𝐶% = ((𝐶𝑅&𝐼 − 𝐶𝐵𝐴𝑈)/𝐶𝐵𝐴𝑈) × 100 [𝑢𝑛𝑖𝑡: %]
Where:
SF = System Flexibility: amount of electrical power (generation and load) that can be
modulated to the needs of the system operation within a specified unit of time [W or
MVAr]
SFAC = System flexibility at affordable cost [W or MVAr/€]
C = OPEX and CAPEX estimated to manage the flexibility of the network [€]
4.3 Specific KPIs (EEGI Level 2)
The overarching goals aforementioned (increasing network capacity and system flexibility) can be
further quantified and monitored through seven specific KPIs; six of them are common for DSOs
and TSOs, and the last one is specific for DSOs only.
Common TSO and DSO Specific KPIs
B.1 Increased RES and DER hosting capacity. B.2 Reduced energy curtailment of RES and DER. B.3 Power quality and quality of supply. B.4 Extended asset life time. B.5 Increased flexibility from energy players. B.6 Improved competitiveness of the electricity
market.
DSO Specific KPI B.7 Increased hosting capacity for electric vehicles (EVs) and other new loads.

IDE4L Deliverable D7.1
15 IDE4L is a project co-funded by the European Commission
These KPIs also cover the functional objectives defined in EEGI Roadmap. They are explained in the
following list:
1 B.1 Increased RES and DER hosting capacity (DSO+TSO)
This KPI is intended to give a statement about the additional RES/DER that can be installed
in the network, when R&I solutions are applied, and compared to the BAU scenario. This
improvement can be quantified by means of the following percentage:
𝐸𝐻𝐶% =𝐻𝐶𝑅&𝐼 − 𝐻𝐶𝐵𝐴𝑈
𝐻𝐶𝐵𝐴𝑈× 100 [𝑢𝑛𝑖𝑡: %]
The formula is applicable for TSO with RES integration and for DSO with DER integration.
Where:
EHC % is the enhanced hosting capacity of RES/DER when R&I solutions are applied with
respect to BAU scenario.
HCR&I is the additional hosting capacity of RES/DER when R&I solutions are applied with
respect to currently connected generation (GW or MW)
HCBAU is the additional hosting capacity of RES/DER in BAU scenario applied with respect to
currently connected generation (GW or MW).
2 B.2 Reduced energy curtailment of RES and DER (DSO+TSO)
The objective of this KPI is the reduction of energy curtailment due to technical and
operational problems, such as over voltage, over frequency, local congestion, etc. In the
case of the DSO, the increased presence of monitoring will have an impact on producers, as
the time for curtailment will be reduced, and the operative range will be wider. This
indicator can be measured as the percentage of GWh electricity curtailment from DER
reduction of R&I solution compared to BAU for a period of time, i.e. a year.
𝐸𝑛𝑜𝑡−𝑖𝑛𝑗𝑒𝑐𝑡𝑒𝑑 =𝐸𝑛𝑜𝑡−𝑖𝑛𝑗𝑒𝑐𝑡𝑒𝑑
𝑏𝑎𝑠𝑒𝑙𝑖𝑛𝑒 − 𝐸𝑛𝑜𝑡−𝑖𝑛𝑗𝑒𝑐𝑡𝑒𝑑𝑚𝑒𝑎𝑠𝑢𝑟𝑒𝑑
𝐸𝑛𝑜𝑡−𝑖𝑛𝑗𝑒𝑐𝑡𝑒𝑑𝑏𝑎𝑠𝑒𝑙𝑖𝑛𝑒
Where:
Enot-injected is the percentage reduction in energy not injected in network due to MV/LV
network conditions [MWh].
E_not-injected, baseline is the total energy not injected in network due to MV/LV network
conditions under baseline condition [MWh].
E_not-injected, measured is the total energy not injected in network due to MV/LV network
conditions under new measured condition [MWh].

IDE4L Deliverable D7.1
16 IDE4L is a project co-funded by the European Commission
3 B.3 Power Quality and Quality of Supply (DSO+TSO)
This KPI is based on the goal of maintaining high quality of power supply to end users via
preventive actions with early warning system, advanced and optimal system development
and operation tools, and high availability of assets via optimal maintenance strategies and
planning tools. For the DSO, three indicators are proposed:
a) SAIDI and SAIFI indicators:
∆𝑆𝐴𝐼𝐷𝐼% =𝑆𝐴𝐼𝐷𝐼𝑆𝐺 − 𝑆𝐴𝐼𝐷𝐼𝑏𝑎𝑠𝑒𝑙𝑖𝑛𝑒
𝑆𝐴𝐼𝐷𝐼𝑏𝑎𝑠𝑒𝑙𝑖𝑛𝑒× 100 [𝑢𝑛𝑖𝑡: %]
∆𝑆𝐴𝐼𝐹𝐼% =𝑆𝐴𝐼𝐹𝐼𝑆𝐺 − 𝑆𝐴𝐼𝐹𝐼𝑏𝑎𝑠𝑒𝑙𝑖𝑛𝑒
𝑆𝐴𝐼𝐹𝐼𝑏𝑎𝑠𝑒𝑙𝑖𝑛𝑒× 100 [𝑢𝑛𝑖𝑡: %]
Where:
SAIDI is the System Average Interruption Duration Index
SAIFI is the System Average Interruption Frequency Index
b) Line voltage profiles fulfilling grid nominal voltage requirements, as defined in EN 50160
standard [EN 50160]:
𝑉% =𝑉𝑏𝑎𝑠𝑒𝑙𝑖𝑛𝑒 − 𝑉𝑆𝐺
𝑉𝑏𝑎𝑠𝑒𝑙𝑖𝑛𝑒× 100 [𝑢𝑛𝑖𝑡: %]
Where:
V% is the evolution of the line voltage profiles
VSG is defined as the line voltage profiles with SG solutions
Vbaseline is the line voltage profiles in baseline situation
The definition of voltage profile can vary, including different options:
- Vmax: maximum reached line voltage during defined monitoring period
- V95%: value for which 95% of all voltage line measurements fall below
- Total number of voltage line violations
c) Average time needed for awareness, localization and isolation of grid fault:
∆𝑇𝑓𝑎𝑢𝑙𝑡[%] =𝑇𝑓𝑎𝑢𝑙𝑡,𝑏𝑎𝑠𝑒𝑙𝑖𝑛𝑒 − 𝑇𝑓𝑎𝑢𝑙𝑡,𝑆𝐺
𝑇𝑓𝑎𝑢𝑙𝑡,𝑏𝑎𝑠𝑒𝑙𝑖𝑛𝑒× 100 [𝑢𝑛𝑖𝑡: %]
Where:
∆Tfault [%] is the percentage reduction in time required for fault awareness, localization and
isolation
Tfault,SG is the average time required for fault awareness, localization and isolation with
Smart Grid Solutions
Tfault,Baseline is the average time required for fault awareness, localization and isolation in
Baseline situation

IDE4L Deliverable D7.1
17 IDE4L is a project co-funded by the European Commission
4 B.4 Extended asset lifetime (DSO+TSO)
The base of this KPI is that, thanks to R&I solutions, network assets can last longer while
maintaining the system reliability, so the replacement costs are reduced. There are two
alternatives to define this indicator:
a) Improved Life-time of Assets takes into account the total cost of exploiting a given
group of assets, including the capital expenditure and the operational expenditure:
𝐼𝐿𝐴 =(𝐶𝐴𝑃𝐸𝑋𝐵𝐴𝑈 + 𝑂𝑃𝐸𝑋𝐵𝐴𝑈) − (𝐶𝐴𝑃𝐸𝑋𝑅&𝐷 + 𝑂𝑃𝐸𝑋𝑅&𝐷)
(𝐶𝐴𝑃𝐸𝑋𝐵𝐴𝑈 + 𝑂𝑃𝐸𝑋𝐵𝐴𝑈)
b) Improved Life-time of Assets looking only at the replacement costs (RC):
𝐼𝐿𝐴 = (𝑅𝐶𝐵𝐴𝑈 − 𝑅𝐶𝑅&𝐷)/(𝐶𝐴𝑃𝐸𝑋𝐵𝐴𝑈)
Where:
CAPEX is the Capital Expenditure
OPEX is the Operational Expenditure
RC is the Replacement cost
5 B.5 Increased flexibility from energy players (DSO+TSO)
The flexibility is an indication of the ability of the electricity system to respond and balance
supply and demand in real-time. To this matter, dispatchable generation technologies help
to adjust output on demand serve.
Regarding DSO operations, power flexibility is mainly measured through
demand/generation response capabilities, so both indexes will be defined:
Demand:
𝑃𝐷𝑆𝑀 =(𝑃𝐷𝑆𝑀)𝑆𝐺 − (𝑃𝐷𝑆𝑀)𝐵𝐴𝑈
𝑃𝑝𝑒𝑎𝑘
∆𝑃𝑅𝐿% =𝑃𝐿𝑅𝑆𝐺
𝑃𝑏𝑎𝑠𝑒𝑙𝑖𝑛𝑒,𝑝𝑒𝑎𝑘
Generation:
𝑃𝐷𝐸𝑅 =(𝑃𝐷𝐸𝑅)𝑆𝐺
∑ 𝑃𝑅 𝑆𝐺−
(𝑃𝐷𝐸𝑅)𝐵𝐴𝑈
∑ 𝑃𝑅 𝐵𝐴𝑈
Where
PRL is the Peak Load Reduction
PDSM represents the amount of load capacity participating in DSM in the BAU and SG
scenario
IDE4L Deliverable D7.1
18 IDE4L is a project co-funded by the European Commission
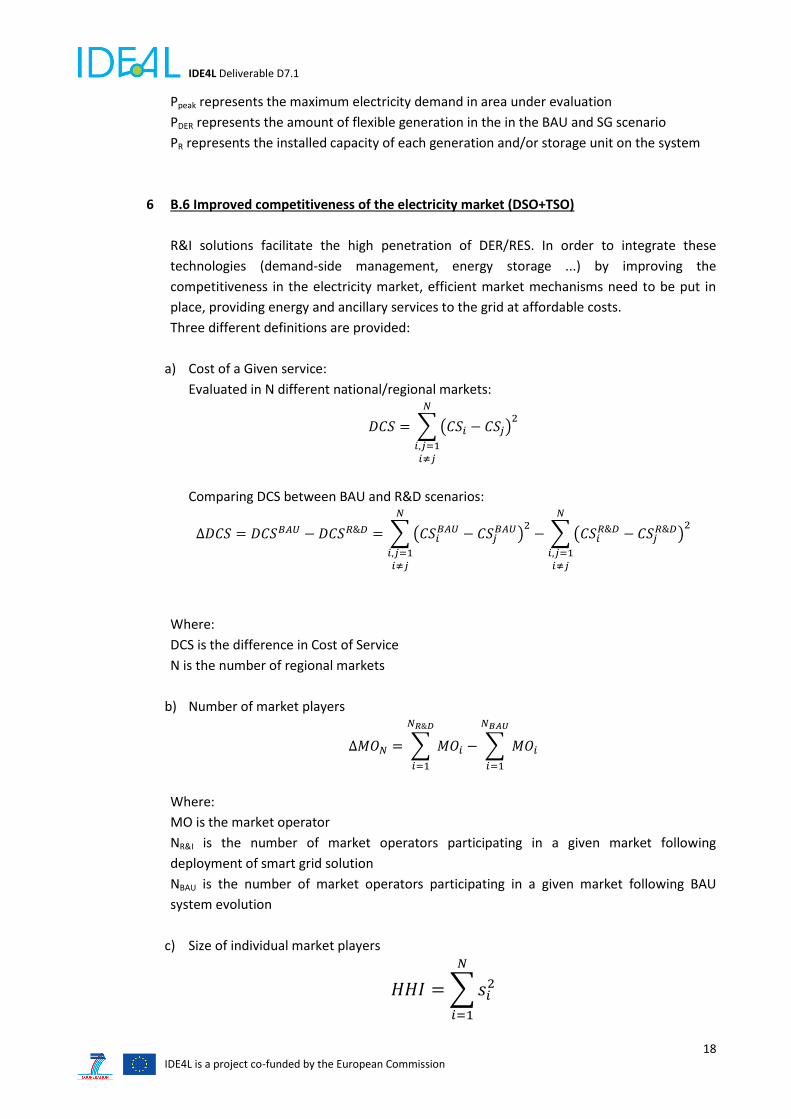
Ppeak represents the maximum electricity demand in area under evaluation
PDER represents the amount of flexible generation in the in the BAU and SG scenario
PR represents the installed capacity of each generation and/or storage unit on the system
6 B.6 Improved competitiveness of the electricity market (DSO+TSO)
R&I solutions facilitate the high penetration of DER/RES. In order to integrate these
technologies (demand-side management, energy storage ...) by improving the
competitiveness in the electricity market, efficient market mechanisms need to be put in
place, providing energy and ancillary services to the grid at affordable costs.
Three different definitions are provided:
a) Cost of a Given service:
Evaluated in N different national/regional markets:
𝐷𝐶𝑆 = ∑ (𝐶𝑆𝑖 − 𝐶𝑆𝑗)2
𝑁
𝑖,𝑗=1𝑖≠𝑗
Comparing DCS between BAU and R&D scenarios:
∆𝐷𝐶𝑆 = 𝐷𝐶𝑆𝐵𝐴𝑈 − 𝐷𝐶𝑆𝑅&𝐷 = ∑ (𝐶𝑆𝑖𝐵𝐴𝑈 − 𝐶𝑆𝑗
𝐵𝐴𝑈)2
𝑁
𝑖,𝑗=1𝑖≠𝑗
− ∑ (𝐶𝑆𝑖𝑅&𝐷 − 𝐶𝑆𝑗
𝑅&𝐷)2
𝑁
𝑖,𝑗=1𝑖≠𝑗
Where:
DCS is the difference in Cost of Service
N is the number of regional markets
b) Number of market players
∆𝑀𝑂𝑁 = ∑ 𝑀𝑂𝑖
𝑁𝑅&𝐷
𝑖=1
− ∑ 𝑀𝑂𝑖
𝑁𝐵𝐴𝑈
𝑖=1
Where:
MO is the market operator
NR&I is the number of market operators participating in a given market following
deployment of smart grid solution
NBAU is the number of market operators participating in a given market following BAU
system evolution
c) Size of individual market players
𝐻𝐻𝐼 = ∑ 𝑠𝑖2
𝑁
𝑖=1

IDE4L Deliverable D7.1
19 IDE4L is a project co-funded by the European Commission
Where:
HHI (Herfindahl-Hirschman Index or simply Herfindal Index) is a measure of the size of firms
in relation to the industry and an indicator of the amount of competition among them.
HHI is defined as the sum of the squares of the market shares (s, expressed as fraction or as
percentage) of the different firms (i = firm number i, from a total of N) within a given
industry. HHI ranges from 1/N to 1. An increase in the HHI generally indicates a decrease in
competition and an increase of market power
7 B.7 Increased hosting capacity for Electric Vehicles and other new loads (DSO)
This KPI is intended to measure the capacity of the network to host the new load that
emergent large fleets of electric vehicles (EV) represent. A proposal for this calculation is
provided:
𝐻𝐶_𝐸𝑉% =𝐻𝐶_𝐸𝑉𝑆𝐺 − 𝐻𝐶_𝐸𝑉𝑏𝑎𝑠𝑒𝑙𝑖𝑛𝑒
𝐻𝐶_𝐸𝑉𝑏𝑎𝑠𝑒𝑙𝑖𝑛𝑒× 100
Where:
HC_EVSG is the Hosting Capacity of Electric Vehicles in MV and LV network with Smart Grid
solutions
HC_EVbaseline is the Hosting Capacity of Electric Vehicles in MV and LV network under a
normal baseline situation (no intelligent solutions)
HC_EV% is the percentage of increase in Hosting Capacity of Electric Vehicles in MV and LV
network with Smart Grid solutions
4.4 Project KPIs (EEGI Level 3)
EEGI establishes this level to include indicators explicitly designed for specific R&I projects under
the EEGI Roadmap, in order to test the impact of the solutions implemented in the demonstration
fields. However, they are expected to be similar to level 2 EEGI KPIs, or at least to contribute to
them in any case, so the following mapping can be identified:
IDE4L Deliverable D7.1
20 IDE4L is a project co-funded by the European Commission
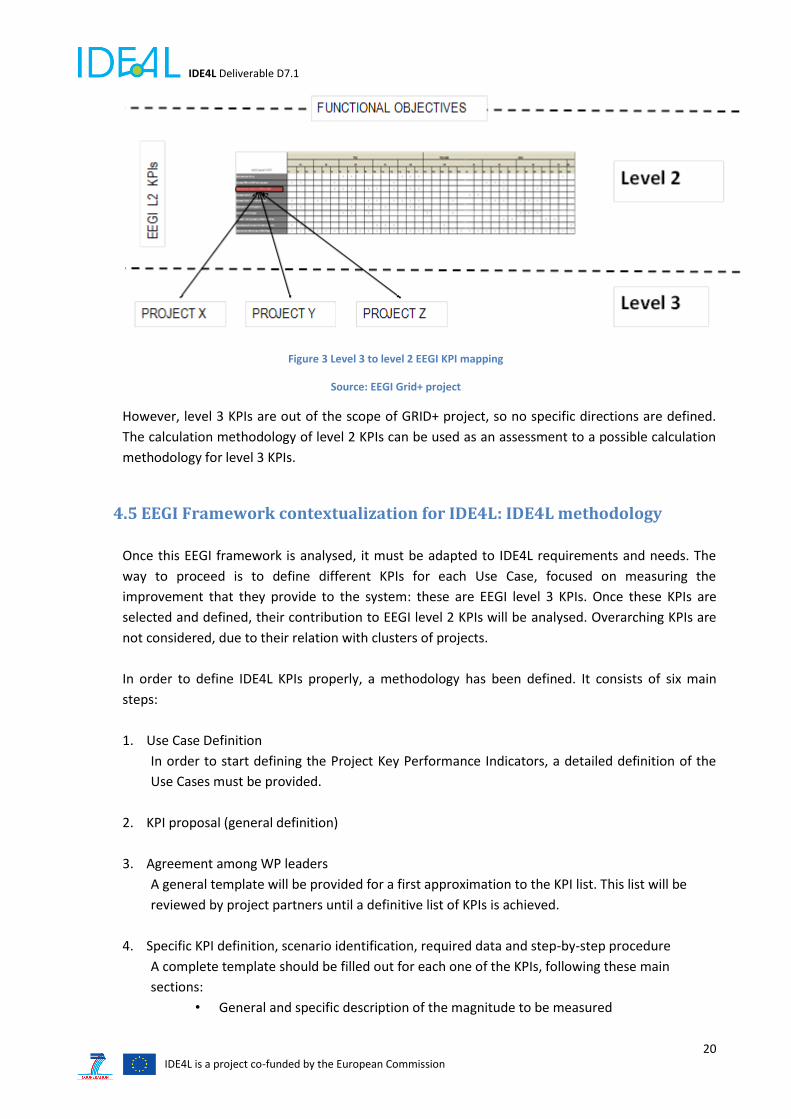
Figure 3 Level 3 to level 2 EEGI KPI mapping
Source: EEGI Grid+ project
However, level 3 KPIs are out of the scope of GRID+ project, so no specific directions are defined.
The calculation methodology of level 2 KPIs can be used as an assessment to a possible calculation
methodology for level 3 KPIs.
4.5 EEGI Framework contextualization for IDE4L: IDE4L methodology
Once this EEGI framework is analysed, it must be adapted to IDE4L requirements and needs. The
way to proceed is to define different KPIs for each Use Case, focused on measuring the
improvement that they provide to the system: these are EEGI level 3 KPIs. Once these KPIs are
selected and defined, their contribution to EEGI level 2 KPIs will be analysed. Overarching KPIs are
not considered, due to their relation with clusters of projects.
In order to define IDE4L KPIs properly, a methodology has been defined. It consists of six main
steps:
1. Use Case Definition
In order to start defining the Project Key Performance Indicators, a detailed definition of the
Use Cases must be provided.
2. KPI proposal (general definition)
3. Agreement among WP leaders
A general template will be provided for a first approximation to the KPI list. This list will be
reviewed by project partners until a definitive list of KPIs is achieved.
4. Specific KPI definition, scenario identification, required data and step-by-step procedure
A complete template should be filled out for each one of the KPIs, following these main
sections:
• General and specific description of the magnitude to be measured
IDE4L Deliverable D7.1
21 IDE4L is a project co-funded by the European Commission
• Main objective
• Connection with other KPIs and Use Cases
• Magnitude formula
• Formula of the KPI as a difference (improvement or worsening) between scenarios
• Step-by-step methodology for the evaluation
• Required data and granularity
• Definition of scenarios (Baseline, BaU, Smart Grid) where the magnitude must be
measured
5. Data Collection
Depending on the type of data required and the frequency of data acquisition, proper
templates will be prepared in order to collect the information needed to calculate the KPI.
6. KPI Calculation
KPI is calculated using a data compilation tool, e.g., an Excel file. The evaluations will include
the calculation of the magnitude in the specific scenarios, and their comparison using the KPI
formula.
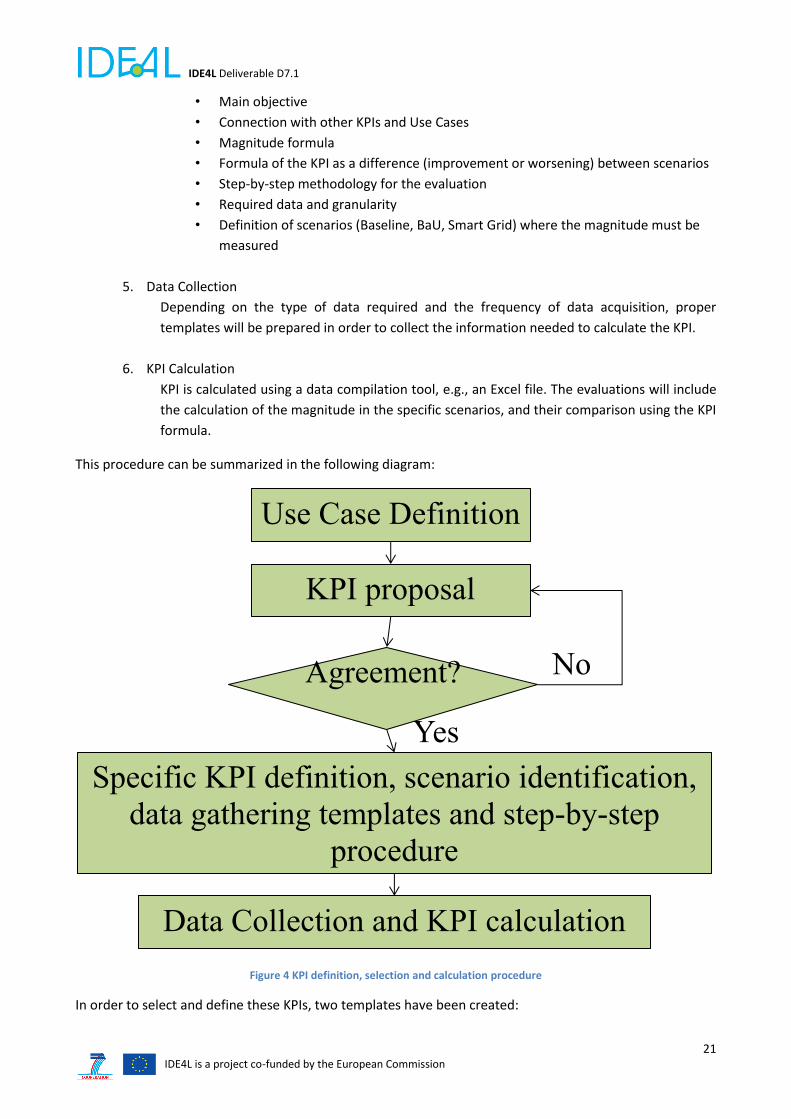
This procedure can be summarized in the following diagram:
Figure 4 KPI definition, selection and calculation procedure
In order to select and define these KPIs, two templates have been created:
Use Case Definition
KPI proposal
Agreement?
Specific KPI definition, scenario identification,
data gathering templates and step-by-step
procedure
Data Collection and KPI calculation
Yes
No
IDE4L Deliverable D7.1
22 IDE4L is a project co-funded by the European Commission
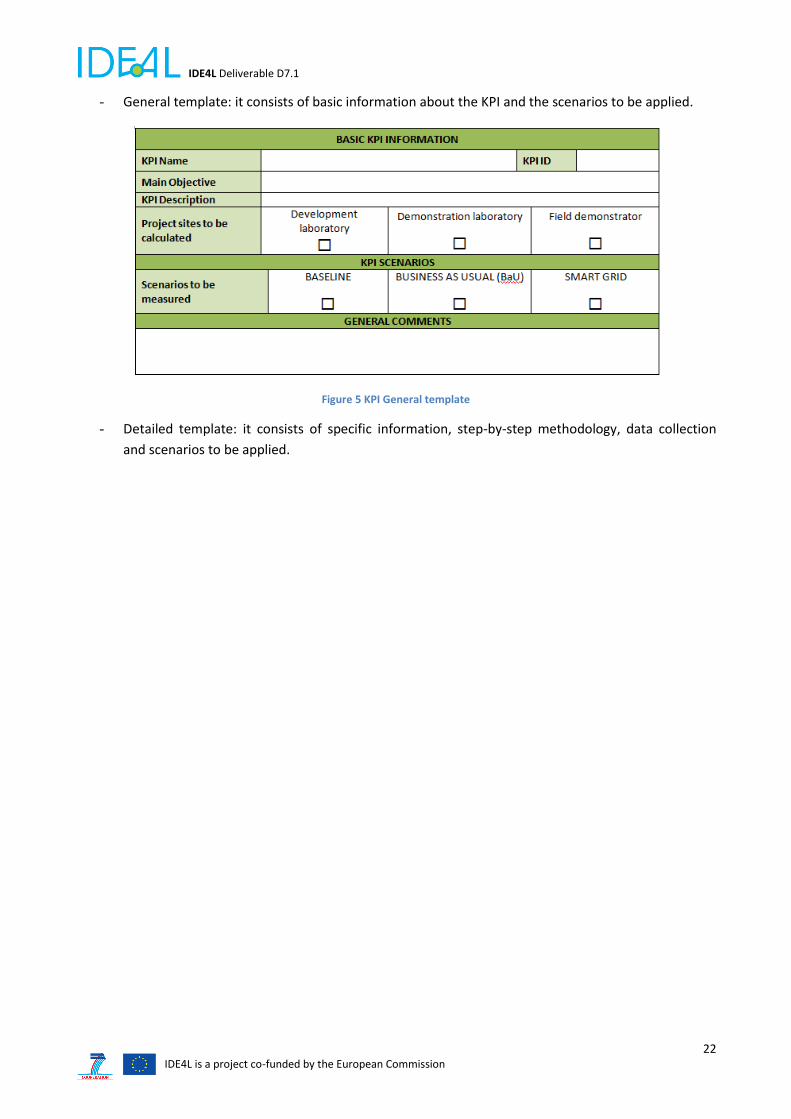
- General template: it consists of basic information about the KPI and the scenarios to be applied.
Figure 5 KPI General template
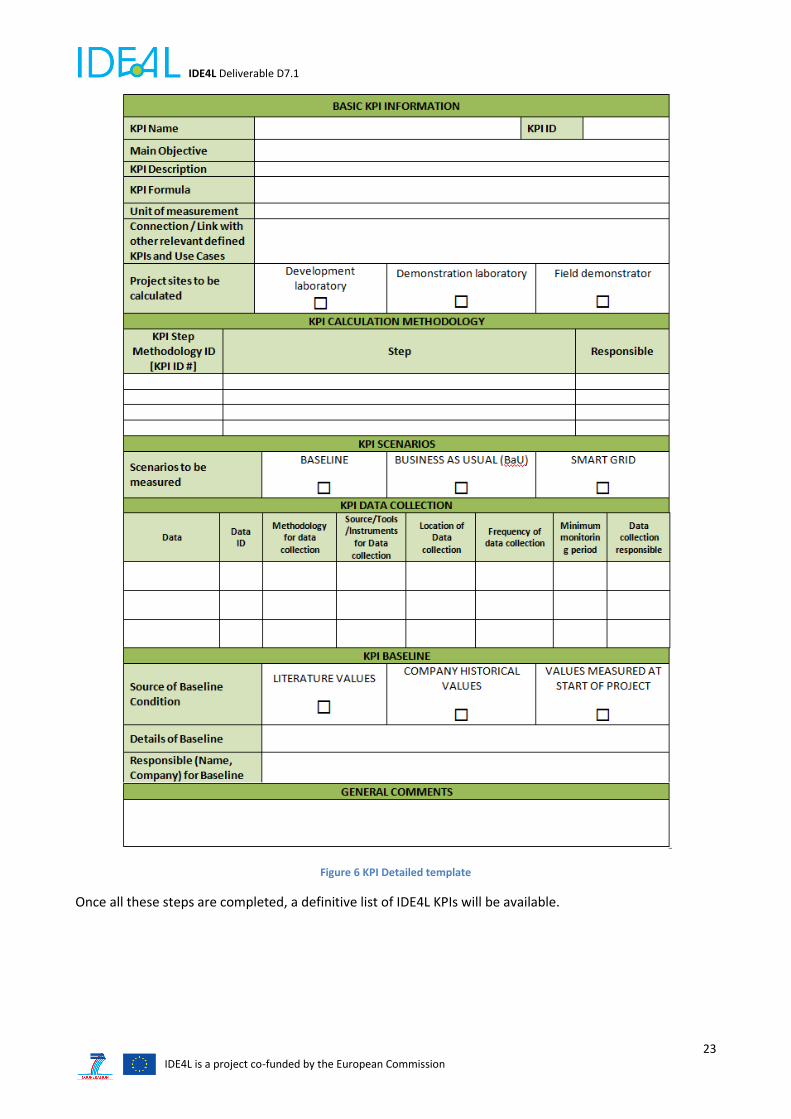
- Detailed template: it consists of specific information, step-by-step methodology, data collection
and scenarios to be applied.
IDE4L Deliverable D7.1
23 IDE4L is a project co-funded by the European Commission
Figure 6 KPI Detailed template
Once all these steps are completed, a definitive list of IDE4L KPIs will be available.
IDE4L Deliverable D7.1
24 IDE4L is a project co-funded by the European Commission
5. KPIS AND USE CASES CORRESPONDANCE
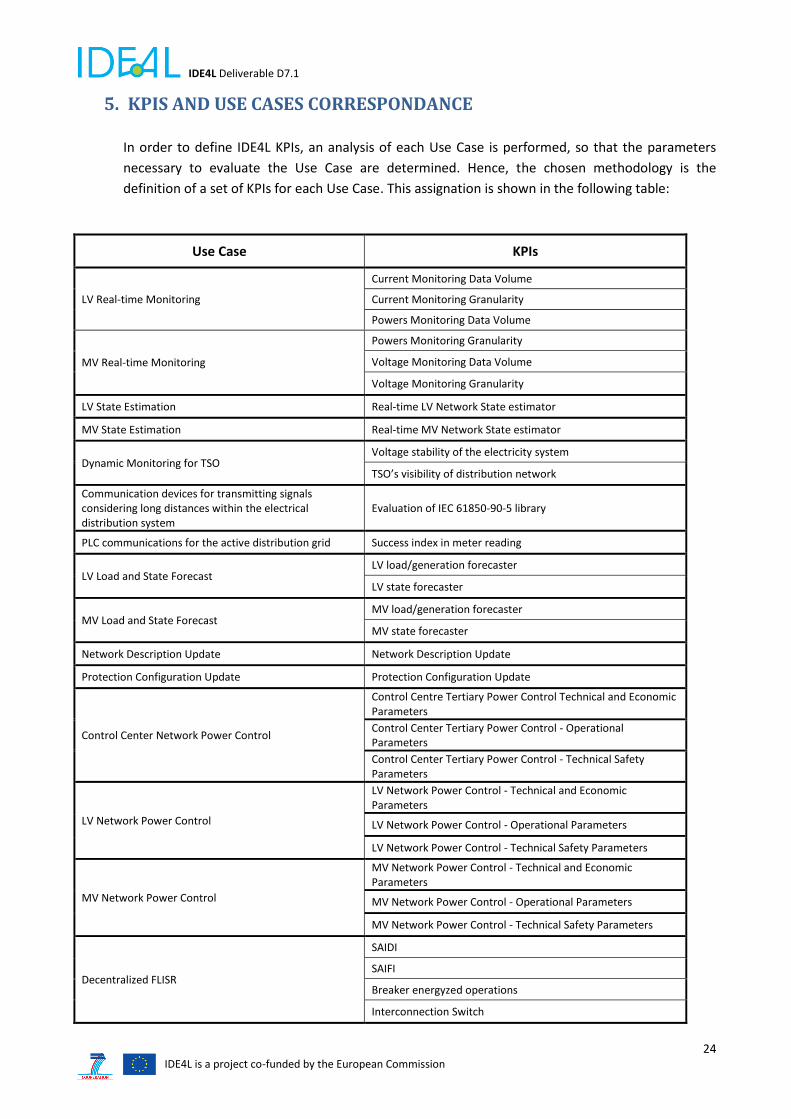
In order to define IDE4L KPIs, an analysis of each Use Case is performed, so that the parameters
necessary to evaluate the Use Case are determined. Hence, the chosen methodology is the
definition of a set of KPIs for each Use Case. This assignation is shown in the following table:
Use Case KPIs
LV Real-time Monitoring
Current Monitoring Data Volume
Current Monitoring Granularity
Powers Monitoring Data Volume
MV Real-time Monitoring
Powers Monitoring Granularity
Voltage Monitoring Data Volume
Voltage Monitoring Granularity
LV State Estimation Real-time LV Network State estimator
MV State Estimation Real-time MV Network State estimator
Dynamic Monitoring for TSO Voltage stability of the electricity system
TSO’s visibility of distribution network
Communication devices for transmitting signals considering long distances within the electrical distribution system
Evaluation of IEC 61850-90-5 library
PLC communications for the active distribution grid Success index in meter reading
LV Load and State Forecast LV load/generation forecaster
LV state forecaster
MV Load and State Forecast MV load/generation forecaster
MV state forecaster
Network Description Update Network Description Update
Protection Configuration Update Protection Configuration Update
Control Center Network Power Control
Control Centre Tertiary Power Control Technical and Economic Parameters
Control Center Tertiary Power Control - Operational Parameters
Control Center Tertiary Power Control - Technical Safety Parameters
LV Network Power Control
LV Network Power Control - Technical and Economic Parameters
LV Network Power Control - Operational Parameters
LV Network Power Control - Technical Safety Parameters
MV Network Power Control
MV Network Power Control - Technical and Economic Parameters
MV Network Power Control - Operational Parameters
MV Network Power Control - Technical Safety Parameters
Decentralized FLISR
SAIDI
SAIFI
Breaker energyzed operations
Interconnection Switch

IDE4L Deliverable D7.1
25 IDE4L is a project co-funded by the European Commission
Power Quality Control Flicker mitigation MV/LV active grid
Expansion Planning Expansion Planning Scenario Evaluation
Operational Planning
Reduction of energy cost
Ratio between minimum and maximum electricity demand within a day
Target Network Planning Target Network Planning
Load Areas Configuration Reduction of technical network losses
Flexibility table
Off-Line Validation Peak demand reduction ratio
Real-time Validation Percentage utilization of electricity network components
SRP and CRP Day-Ahead and Intra-Day Market Procurement
Reduction in CO2 emissions
Conditional re-profiling activation (CRP Activation) RES curtailment
Day-Ahead Demand Response Demand Response (DR)
Day-Ahead Dynamic Tariff Day Ahead Dynamic Tariff (DADT)
IDE4L Deliverable D7.1
26 IDE4L is a project co-funded by the European Commission
6. KPI DEFINITION
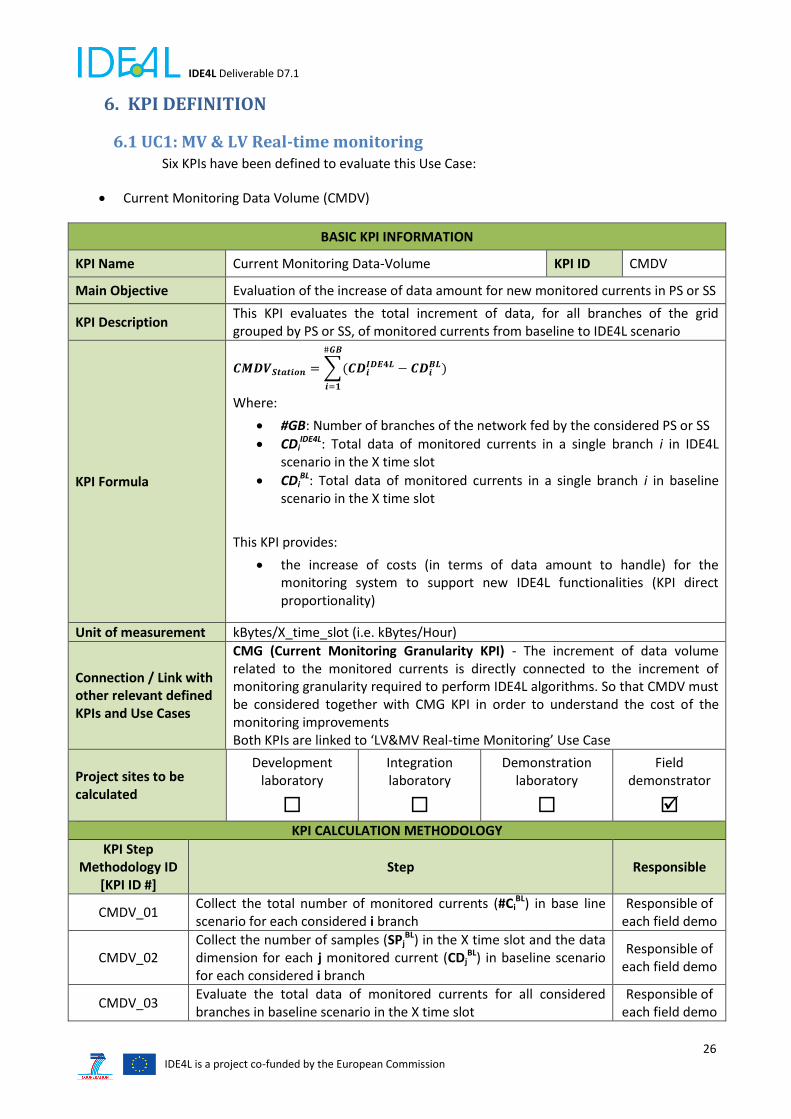
6.1 UC1: MV & LV Real-time monitoring Six KPIs have been defined to evaluate this Use Case:
Current Monitoring Data Volume (CMDV)
BASIC KPI INFORMATION
KPI Name Current Monitoring Data-Volume KPI ID CMDV
Main Objective Evaluation of the increase of data amount for new monitored currents in PS or SS
KPI Description This KPI evaluates the total increment of data, for all branches of the grid grouped by PS or SS, of monitored currents from baseline to IDE4L scenario
KPI Formula
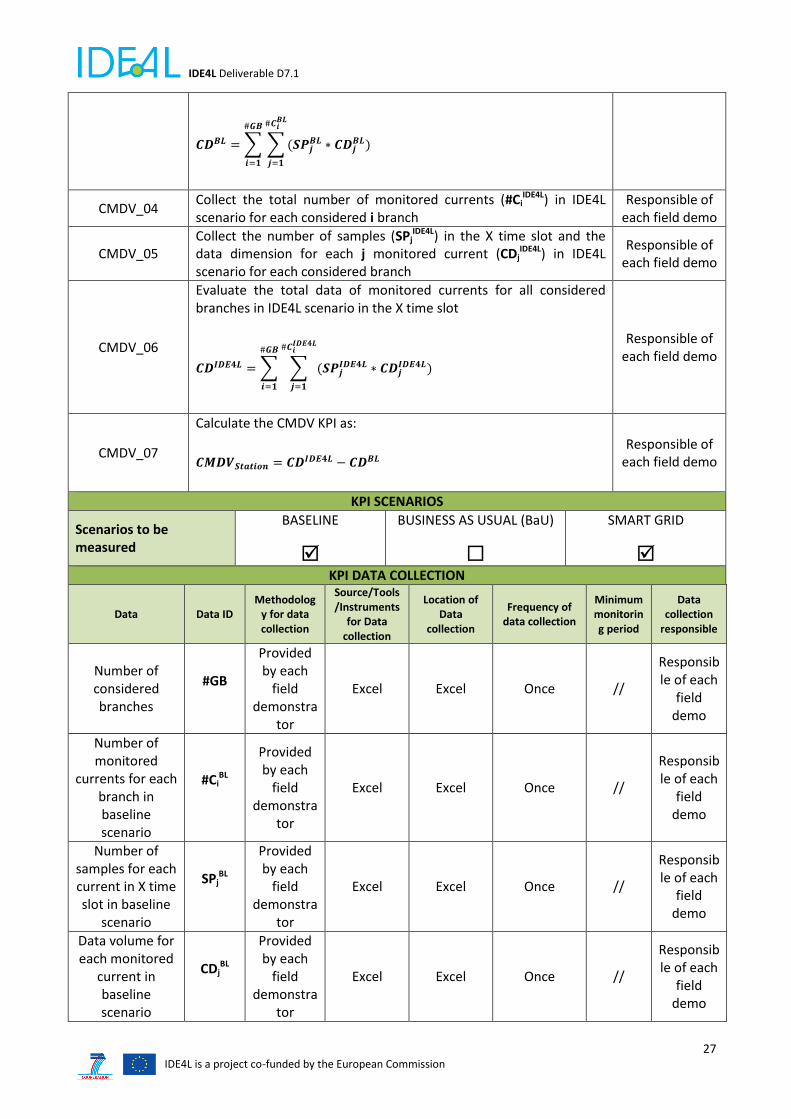
𝑪𝑴𝑫𝑽𝑺𝒕𝒂𝒕𝒊𝒐𝒏 = ∑(𝑪𝑫𝒊𝑰𝑫𝑬𝟒𝑳 − 𝑪𝑫𝒊
𝑩𝑳)
#𝑮𝑩
𝒊=𝟏
Where:
#GB: Number of branches of the network fed by the considered PS or SS
CDiIDE4L: Total data of monitored currents in a single branch i in IDE4L
scenario in the X time slot
CDiBL: Total data of monitored currents in a single branch i in baseline
scenario in the X time slot
This KPI provides:
the increase of costs (in terms of data amount to handle) for the monitoring system to support new IDE4L functionalities (KPI direct proportionality)
Unit of measurement kBytes/X_time_slot (i.e. kBytes/Hour)
Connection / Link with other relevant defined KPIs and Use Cases
CMG (Current Monitoring Granularity KPI) - The increment of data volume related to the monitored currents is directly connected to the increment of monitoring granularity required to perform IDE4L algorithms. So that CMDV must be considered together with CMG KPI in order to understand the cost of the monitoring improvements Both KPIs are linked to ‘LV&MV Real-time Monitoring’ Use Case
Project sites to be calculated
Development laboratory
Integration laboratory
Demonstration laboratory
Field demonstrator
KPI CALCULATION METHODOLOGY
KPI Step Methodology ID
[KPI ID #] Step Responsible
CMDV_01 Collect the total number of monitored currents (#Ci
BL) in base line scenario for each considered i branch
Responsible of each field demo
CMDV_02 Collect the number of samples (SPj
BL) in the X time slot and the data dimension for each j monitored current (CDj
BL) in baseline scenario for each considered i branch
Responsible of each field demo
CMDV_03 Evaluate the total data of monitored currents for all considered branches in baseline scenario in the X time slot
Responsible of each field demo
IDE4L Deliverable D7.1
27 IDE4L is a project co-funded by the European Commission
𝑪𝑫𝑩𝑳 = ∑ ∑ (𝑺𝑷𝒋𝑩𝑳 ∗ 𝑪𝑫𝒋
𝑩𝑳)
#𝑪𝒊𝑩𝑳
𝒋=𝟏
#𝑮𝑩
𝒊=𝟏
CMDV_04 Collect the total number of monitored currents (#Ci
IDE4L) in IDE4L scenario for each considered i branch
Responsible of each field demo
CMDV_05 Collect the number of samples (SPj
IDE4L) in the X time slot and the data dimension for each j monitored current (CDj
IDE4L) in IDE4L scenario for each considered branch
Responsible of each field demo
CMDV_06
Evaluate the total data of monitored currents for all considered branches in IDE4L scenario in the X time slot
𝑪𝑫𝑰𝑫𝑬𝟒𝑳 = ∑ ∑ (𝑺𝑷𝒋𝑰𝑫𝑬𝟒𝑳 ∗ 𝑪𝑫𝒋
𝑰𝑫𝑬𝟒𝑳)
#𝑪𝒊𝑰𝑫𝑬𝟒𝑳
𝒋=𝟏
#𝑮𝑩
𝒊=𝟏
Responsible of each field demo
CMDV_07
Calculate the CMDV KPI as:
𝑪𝑴𝑫𝑽𝑺𝒕𝒂𝒕𝒊𝒐𝒏 = 𝑪𝑫𝑰𝑫𝑬𝟒𝑳 − 𝑪𝑫𝑩𝑳
Responsible of each field demo
KPI SCENARIOS
Scenarios to be measured
BASELINE
BUSINESS AS USUAL (BaU)
SMART GRID
KPI DATA COLLECTION
Data Data ID Methodolog
y for data collection
Source/Tools/Instruments
for Data collection
Location of Data
collection
Frequency of data collection
Minimum monitoring period
Data collection
responsible
Number of considered branches
#GB
Provided by each
field demonstra
tor
Excel Excel Once //
Responsible of each
field demo
Number of monitored
currents for each branch in baseline scenario
#CiBL
Provided by each
field demonstra
tor
Excel Excel Once //
Responsible of each
field demo
Number of samples for each current in X time slot in baseline
scenario
SPjBL
Provided by each
field demonstra
tor
Excel Excel Once //
Responsible of each
field demo
Data volume for each monitored
current in baseline scenario
CDjBL
Provided by each
field demonstra
tor
Excel Excel Once //
Responsible of each
field demo
IDE4L Deliverable D7.1
28 IDE4L is a project co-funded by the European Commission
Number of monitored
currents for each branch in IDE4L
scenario
#CiIDE4L
Provided by each
field demonstra
tor
Excel Excel Once //
Responsible of each
field demo
Number of samples for each current in X time
slot in IDE4L scenario
SPjIDE4L
Provided by each
field demonstra
tor
Excel Excel Once //
Responsible of each
field demo
Data volume for each monitored current in IDE4L
scenario
CDjIDE4L
Provided by each
field demonstra
tor
Excel Excel Once //
Responsible of each
field demo
KPI BASELINE
Source of Baseline Condition
LITERATURE VALUES
COMPANY HISTORICAL VALUES
VALUES MEASURED AT START OF PROJECT
Details of Baseline Data needed to evaluate the KPI can be collected in a “single-shot”.
Responsible (Name, Company) for Baseline
This KPI will be calculated only by DSOs because inputs are about real network
GENERAL COMMENTS
The goals is to evaluate the increase of data amount for a fixed time slot X (X = hour, day, month, year, …) – in kBytes/X – due to the improvement of current monitoring granularity to support the new IDE4L functionalities. This increment directly impacts both on the data layer of the Substation Automation Unit (SAU) and on the communication infrastructures.
The evaluation is performed calculating the total increase over all branches of the considered PS or SS.
Current Monitoring Granularity (CMG)
BASIC KPI INFORMATION
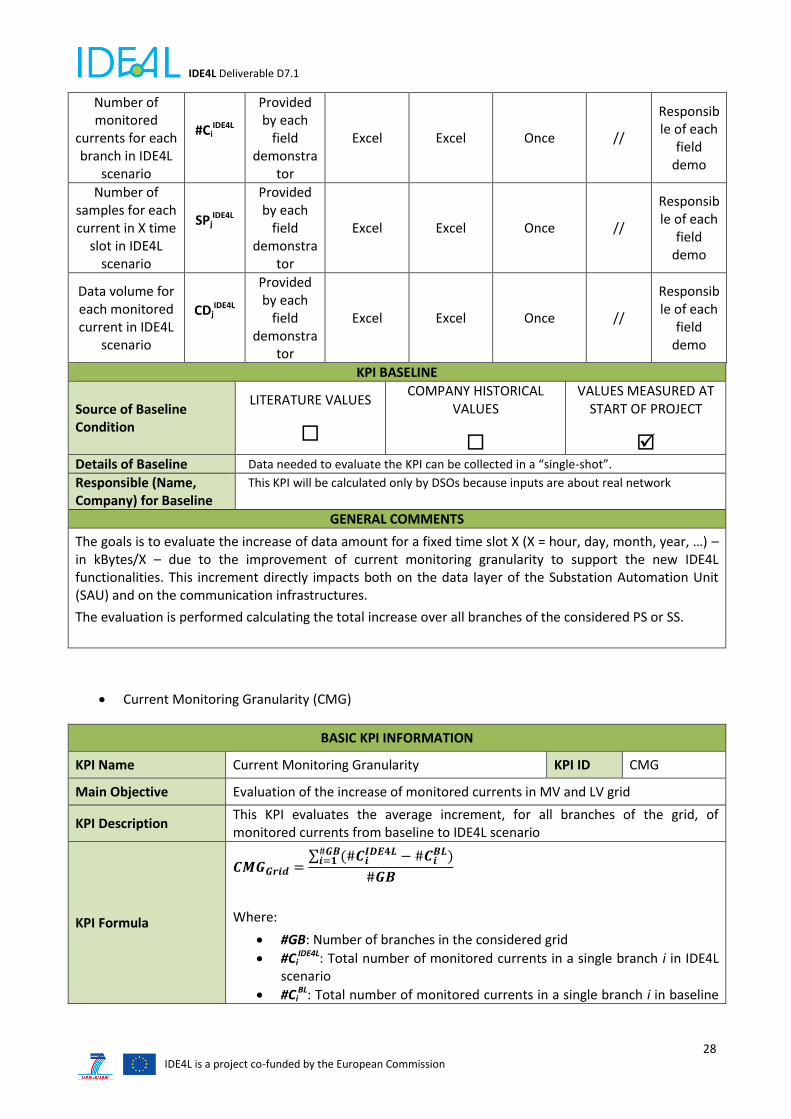
KPI Name Current Monitoring Granularity KPI ID CMG
Main Objective Evaluation of the increase of monitored currents in MV and LV grid
KPI Description This KPI evaluates the average increment, for all branches of the grid, of monitored currents from baseline to IDE4L scenario
KPI Formula
𝑪𝑴𝑮𝑮𝒓𝒊𝒅 =∑ (#𝑪𝒊
𝑰𝑫𝑬𝟒𝑳 − #𝑪𝒊𝑩𝑳)#𝑮𝑩
𝒊=𝟏
#𝑮𝑩
Where:
#GB: Number of branches in the considered grid
#CiIDE4L: Total number of monitored currents in a single branch i in IDE4L
scenario
#CiBL: Total number of monitored currents in a single branch i in baseline
IDE4L Deliverable D7.1
29 IDE4L is a project co-funded by the European Commission
scenario
This KPI provides:
the increase of the current monitoring granularity (KPI direct proportionality)
Unit of measurement %/Branch
Connection / Link with other relevant defined KPIs and Use Cases
CMDV (Current Monitoring Data-Volume KPI) - The increment of current monitoring granularity entails also the increment of data volume related to the monitored currents. So that CMG must be considered together with CMDV KPI in order to understand the cost of the monitoring improvements Both KPIs are linked to ‘LV&MV Real-time Monitoring’ Use Case
Project sites to be calculated
Development laboratory
Integration laboratory
Demonstration laboratory
Field demonstrator
KPI CALCULATION METHODOLOGY
KPI Step Methodology ID
[KPI ID #] Step Responsible
CMG_01 Collect the total number of monitored currents (#Ci
BL) in base line scenario for each considered i branch
Responsible of each field demo
CMG_02
Evaluate the total number of monitored currents for all considered branches in baseline scenario
#𝑪𝑩𝑳 = ∑ #𝑪𝒊𝑩𝑳
#𝑮𝑩
𝒊=𝟏
Responsible of each field demo
CMG_03 Collect the total number of monitored currents (#Ci
IDE4L) in IDE4L scenario for each considered i branch
Responsible of each field demo
CMG_04
Evaluate the total number of monitored currents for all considered branches in IDE4L scenario
#𝑪𝑰𝑫𝑬𝟒𝑳 = ∑ #𝑪𝒊𝑰𝑫𝑬𝟒𝑳
#𝑮𝑩
𝒊=𝟏
Responsible of each field demo
CMG_05
Calculate the CMG KPI as:
𝑪𝑴𝑮𝑮𝒓𝒊𝒅 =#𝑪𝑰𝑫𝑬𝟒𝑳 − #𝑪𝑩𝑳
#𝑮𝑩
Responsible of each field demo
KPI SCENARIOS
Scenarios to be measured
BASELINE
BUSINESS AS USUAL (BaU)
SMART GRID
KPI DATA COLLECTION
Data Data ID Methodolog
y for data collection
Source/Tools/Instruments
for Data collection
Location of Data
collection
Frequency of data collection
Minimum monitoring period
Data collection
responsible

IDE4L Deliverable D7.1
30 IDE4L is a project co-funded by the European Commission
Number of considered branches
#GB
Provided by each
field demonstra
tor
Excel Excel File Once //
Responsible of each
field demo
Number of monitored
currents for each branch in baseline scenario
#CiBL
Provided by each
field demonstra
tor
Excel Excel File Once //
Responsible of each
field demo
Number of monitored
currents for each branch in IDE4L
scenario
#CiIDE4L
Provided by each
field demonstra
tor
Excel Excel Once //
Responsible of each
field demo
KPI BASELINE
Source of Baseline Condition
LITERATURE VALUES
COMPANY HISTORICAL VALUES
VALUES MEASURED AT START OF PROJECT
Details of Baseline Data needed to evaluate the KPI can be collected in a “single-shot”.
Responsible (Name, Company) for Baseline
This KPI will be calculated only by DSOs because inputs are about real network
GENERAL COMMENTS
The goals is to demonstrate the improvements of the current monitoring granularity in MV and LV grids thanks to new automation systems installed in PS and SS to support new IDE4L functionalities, such as State Estimation, Optimal Power Flow, …
The evaluation is performed calculating the average increase over all branches of the considered grid.
Power Monitoring Data Volume (PMDV)
BASIC KPI INFORMATION
KPI Name Powers Monitoring Data-Volume KPI ID PMDV
Main Objective Evaluation of the increase of data amount for new monitored powers in PS or SS
KPI Description This KPI evaluates the total data increment, for all branches of the grid grouped by PS or SS, of monitored powers (active and reactive) from baseline to IDE4L scenario
KPI Formula
𝑷𝑴𝑫𝑽𝑺𝒕𝒂𝒕𝒊𝒐𝒏 = ∑(𝑷𝑫𝒊𝑰𝑫𝑬𝟒𝑳 − 𝑷𝑫𝒊
𝑩𝑳)
#𝑮𝑩
𝒊=𝟏
+ ∑(𝑸𝑫𝒊𝑰𝑫𝑬𝟒𝑳 − 𝑸𝑫𝒊
𝑩𝑳)
#𝑮𝑩
𝒊=𝟏
Where:
#GB: Number of branches of the network fed by the considered PS or SS
PDiIDE4L: Total data of monitored active powers in a single branch i in
IDE4L scenario in the X time slot
PDiBL: Total data of monitored active powers in a single branch i in

IDE4L Deliverable D7.1
31 IDE4L is a project co-funded by the European Commission
baseline scenario in the X time slot
QDiIDE4L: Total data of monitored reactive powers in a single branch i in
IDE4L scenario in the X time slot
QDiBL: Total data of monitored reactive powers in a single branch i in
baseline scenario in the X time slot
This KPI provides:
the increase of costs (in terms of data amount to handle) for the monitoring system to support new IDE4L functionalities (KPI direct proportionality)
Unit of measurement kBytes/X_time_slot (i.e. kBytes/Hour)
Connection / Link with other relevant defined KPIs and Use Cases
P/QMG (P/Q Powers Monitoring Granularity KPI) - The increment of data volume related to the monitored powers is directly connected to the increment of monitoring granularity required to perform IDE4L algorithms. So that PMDV must be considered together with P/QMG KPI in order to understand the cost of the monitoring improvements Both KPIs are linked to ‘LV&MV Real-time Monitoring’ Use Case
Project sites to be calculated
Development laboratory
Integration laboratory
Demonstration laboratory
Field demonstrator
KPI CALCULATION METHODOLOGY
KPI Step Methodology ID
[KPI ID #] Step Responsible
PMDV_01 Collect the total number of monitored active (#Pi
BL) and reactive (#Qi
BL) powers in baseline scenario for each considered i branch Responsible of
each field demo
PMDV_02
Collect the number of samples (SPPjBL and SPQj
BL) in the X time slot and the data dimension for each j monitored active (PDj
BL) and reactive (QDj
BL) power in baseline scenario for each considered i branch
Responsible of each field demo
PMDV_03
Evaluate the total data of monitored active and reactive powers for all considered branches in baseline scenario in the X time slot
𝑷𝑫𝑽𝑩𝑳 = ∑ ( ∑ (𝑺𝑷𝑷𝒋𝑩𝑳 ∗ 𝑷𝑫𝒋
𝑩𝑳)
#𝑷𝒊𝑩𝑳
𝒋=𝟏
+ ∑ (𝑺𝑷𝑸𝒋𝑩𝑳 ∗ 𝑸𝑫𝒋
𝑩𝑳)
#𝑸𝒊𝑩𝑳
𝒋=𝟏
)
#𝑮𝑩
𝒊=𝟏
Responsible of each field demo
PMDV_04 Collect the total number of monitored active (#Pi
IDE4L) and reactive (#Qi
IDE4L) powers in IDE4L scenario for each considered i branch Responsible of
each field demo
PMDV_05
Collect the number of samples (SPPjIDE4L and SPQj
IDE4L) in the X time slot and the data dimension for each j monitored active (PDj
IDE4L) and reactive (QDj
IDE4L) power in the IDE4L scenario for each considered i branch
Responsible of each field demo
PMDV_06 Evaluate the total data of monitored active and reactive powers for all considered branches in IDE4L scenario in the X time slot
Responsible of each field demo

IDE4L Deliverable D7.1
32 IDE4L is a project co-funded by the European Commission
𝑷𝑫𝑽𝑰𝑫𝑬𝟒𝑳 = ∑ ( ∑ (𝑺𝑷𝑷𝒋𝑰𝑫𝑬𝟒𝑳 ∗ 𝑷𝑫𝒋
𝑰𝑫𝑬𝟒𝑳)
#𝑷𝒊𝑰𝑫𝑬𝟒𝑳
𝒋=𝟏
+ ∑ (𝑺𝑷𝑸𝒋𝑰𝑫𝑬𝟒𝑳 ∗ 𝑸𝑫𝒋
𝑰𝑫𝑬𝟒𝑳)
#𝑸𝒊𝑰𝑫𝑬𝟒𝑳
𝒋=𝟏
)
#𝑮𝑩
𝒊=𝟏
PMDV_07
Calculate the PMDV KPI as:
𝑷𝑴𝑫𝑽𝑺𝒕𝒂𝒕𝒊𝒐𝒏 = 𝑷𝑫𝑽𝑰𝑫𝑬𝟒𝑳 − 𝑷𝑫𝑽𝑩𝑳
Responsible of each field demo
KPI SCENARIOS
Scenarios to be measured
BASELINE
BUSINESS AS USUAL (BaU)
SMART GRID
KPI DATA COLLECTION
Data Data ID Methodolog
y for data collection
Source/Tools/Instruments
for Data collection
Location of Data
collection
Frequency of data collection
Minimum monitoring period
Data collection
responsible
Number of considered branches
#GN
Provided by each
field demonstra
tor
Excel Excel Once //
Responsible of each
field demo
Number of monitored
active powers for each branch
in baseline scenario
#PiBL
Provided by each
field demonstra
tor
Excel Excel Once //
Responsible of each
field demo
Number of monitored
reactive powers for each branch
in baseline scenario
#QiBL
Provided by each
field demonstra
tor
Excel Excel Once //
Responsible of each
field demo
Number of samples for each active power in
X time slot in baseline scenario
SPPjBL
Provided by each
field demonstra
tor
Excel Excel Once //
Responsible of each
field demo
Number of samples for each reactive power in X time slot in
baseline scenario
SPQjBL
Provided by each
field demonstra
tor
Excel Excel Once //
Responsible of each
field demo
Data volume for each monitored active power in
baseline scenario
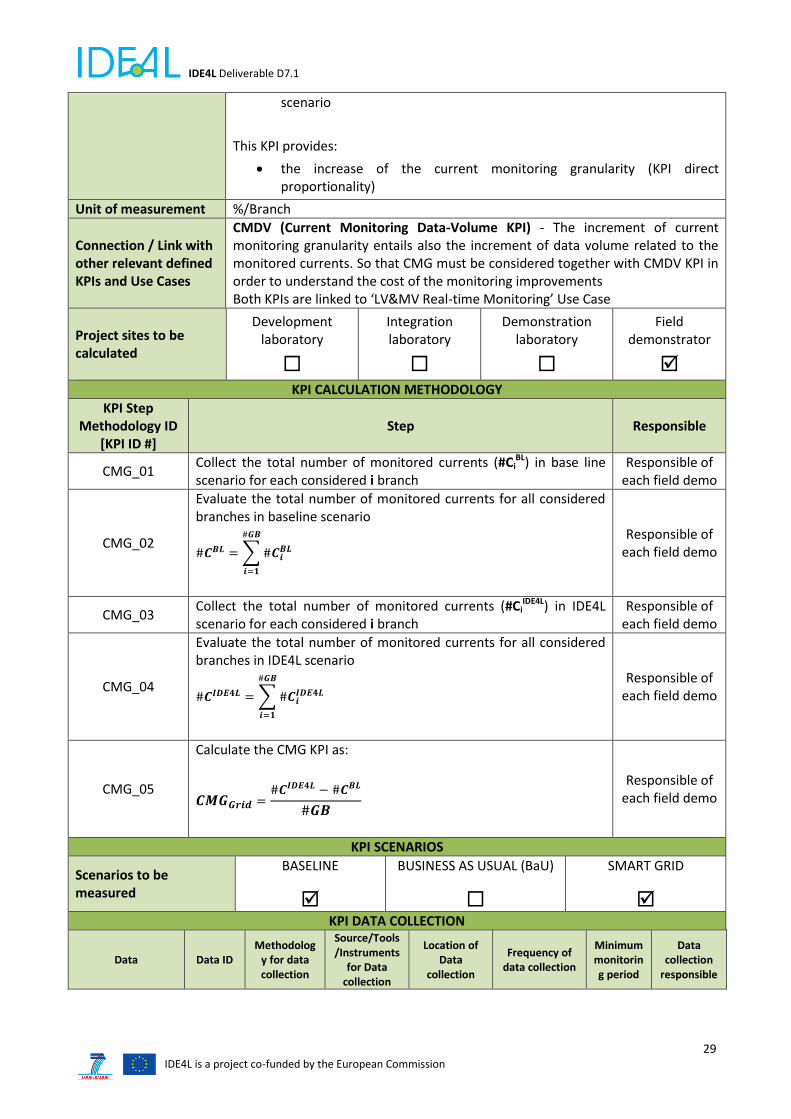
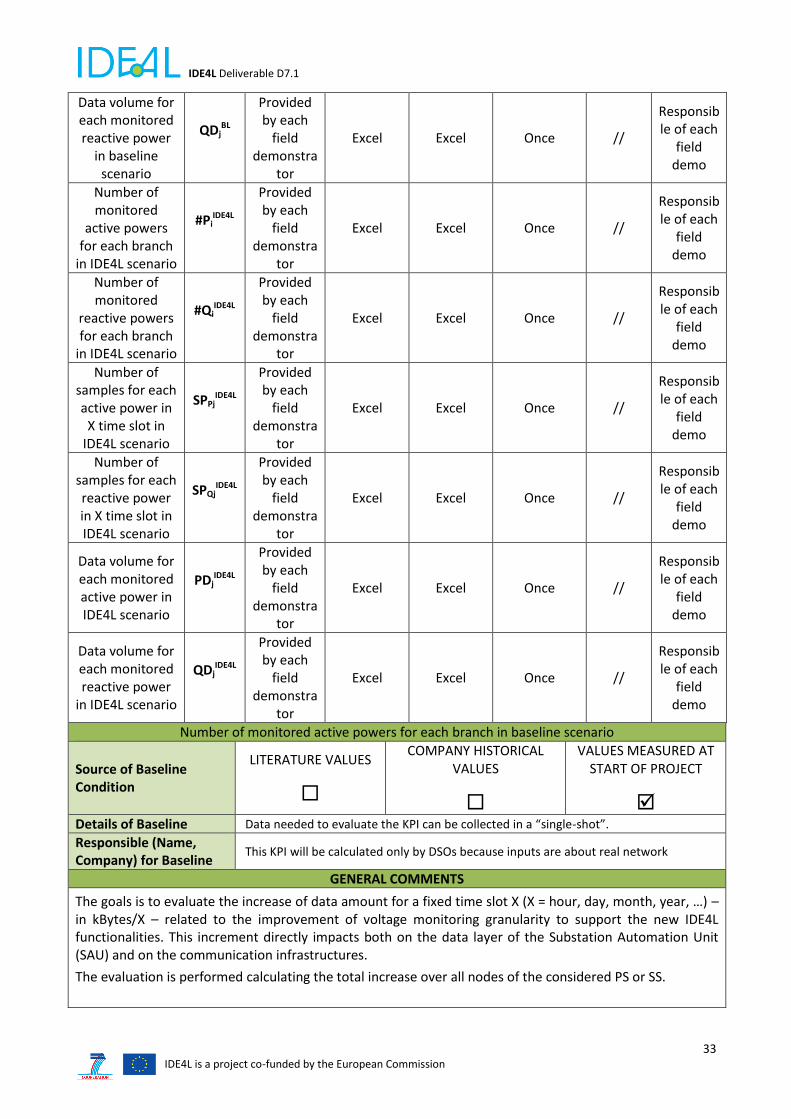
PDjBL
Provided by each
field demonstra
tor
Excel Excel Once //
Responsible of each
field demo
IDE4L Deliverable D7.1
33 IDE4L is a project co-funded by the European Commission
Data volume for each monitored reactive power
in baseline scenario
QDjBL
Provided by each
field demonstra
tor
Excel Excel Once //
Responsible of each
field demo
Number of monitored
active powers for each branch
in IDE4L scenario
#PiIDE4L
Provided by each
field demonstra
tor
Excel Excel Once //
Responsible of each
field demo
Number of monitored
reactive powers for each branch
in IDE4L scenario
#QiIDE4L
Provided by each
field demonstra
tor
Excel Excel Once //
Responsible of each
field demo
Number of samples for each active power in
X time slot in IDE4L scenario
SPPjIDE4L
Provided by each
field demonstra
tor
Excel Excel Once //
Responsible of each
field demo
Number of samples for each reactive power in X time slot in IDE4L scenario
SPQjIDE4L
Provided by each
field demonstra
tor
Excel Excel Once //
Responsible of each
field demo
Data volume for each monitored active power in IDE4L scenario
PDjIDE4L
Provided by each
field demonstra
tor
Excel Excel Once //
Responsible of each
field demo
Data volume for each monitored reactive power
in IDE4L scenario
QDjIDE4L
Provided by each
field demonstra
tor
Excel Excel Once //
Responsible of each
field demo
Number of monitored active powers for each branch in baseline scenario
Source of Baseline Condition
LITERATURE VALUES
COMPANY HISTORICAL VALUES
VALUES MEASURED AT START OF PROJECT
Details of Baseline Data needed to evaluate the KPI can be collected in a “single-shot”.
Responsible (Name, Company) for Baseline
This KPI will be calculated only by DSOs because inputs are about real network
GENERAL COMMENTS
The goals is to evaluate the increase of data amount for a fixed time slot X (X = hour, day, month, year, …) – in kBytes/X – related to the improvement of voltage monitoring granularity to support the new IDE4L functionalities. This increment directly impacts both on the data layer of the Substation Automation Unit (SAU) and on the communication infrastructures.
The evaluation is performed calculating the total increase over all nodes of the considered PS or SS.
IDE4L Deliverable D7.1
34 IDE4L is a project co-funded by the European Commission
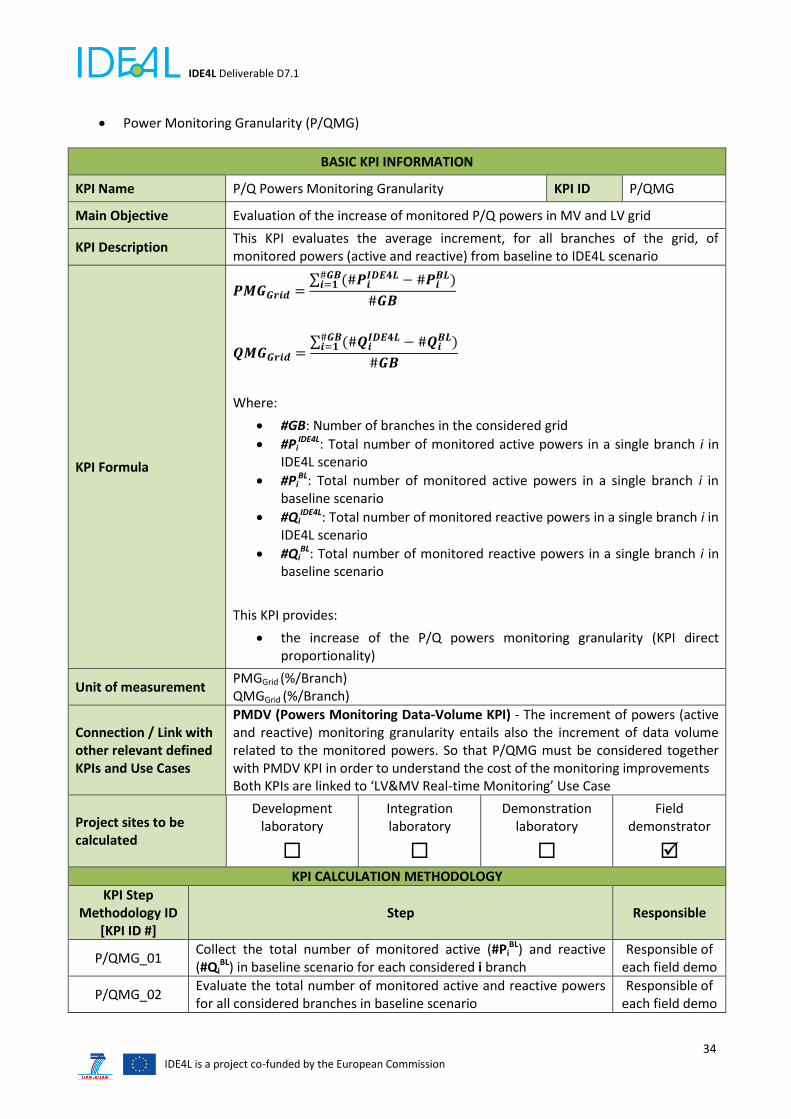
Power Monitoring Granularity (P/QMG)
BASIC KPI INFORMATION
KPI Name P/Q Powers Monitoring Granularity KPI ID P/QMG
Main Objective Evaluation of the increase of monitored P/Q powers in MV and LV grid
KPI Description This KPI evaluates the average increment, for all branches of the grid, of monitored powers (active and reactive) from baseline to IDE4L scenario
KPI Formula
𝑷𝑴𝑮𝑮𝒓𝒊𝒅 =∑ (#𝑷𝒊
𝑰𝑫𝑬𝟒𝑳 − #𝑷𝒊𝑩𝑳)#𝑮𝑩
𝒊=𝟏
#𝑮𝑩
𝑸𝑴𝑮𝑮𝒓𝒊𝒅 =∑ (#𝑸𝒊
𝑰𝑫𝑬𝟒𝑳 − #𝑸𝒊𝑩𝑳)#𝑮𝑩
𝒊=𝟏
#𝑮𝑩
Where:
#GB: Number of branches in the considered grid
#PiIDE4L: Total number of monitored active powers in a single branch i in
IDE4L scenario
#PiBL: Total number of monitored active powers in a single branch i in
baseline scenario
#QiIDE4L: Total number of monitored reactive powers in a single branch i in
IDE4L scenario
#QiBL: Total number of monitored reactive powers in a single branch i in
baseline scenario
This KPI provides:
the increase of the P/Q powers monitoring granularity (KPI direct proportionality)
Unit of measurement PMGGrid (%/Branch) QMGGrid (%/Branch)
Connection / Link with other relevant defined KPIs and Use Cases
PMDV (Powers Monitoring Data-Volume KPI) - The increment of powers (active and reactive) monitoring granularity entails also the increment of data volume related to the monitored powers. So that P/QMG must be considered together with PMDV KPI in order to understand the cost of the monitoring improvements Both KPIs are linked to ‘LV&MV Real-time Monitoring’ Use Case
Project sites to be calculated
Development laboratory
Integration laboratory
Demonstration laboratory
Field demonstrator
KPI CALCULATION METHODOLOGY
KPI Step Methodology ID
[KPI ID #] Step Responsible
P/QMG_01 Collect the total number of monitored active (#Pi
BL) and reactive (#Qi
BL) in baseline scenario for each considered i branch Responsible of
each field demo
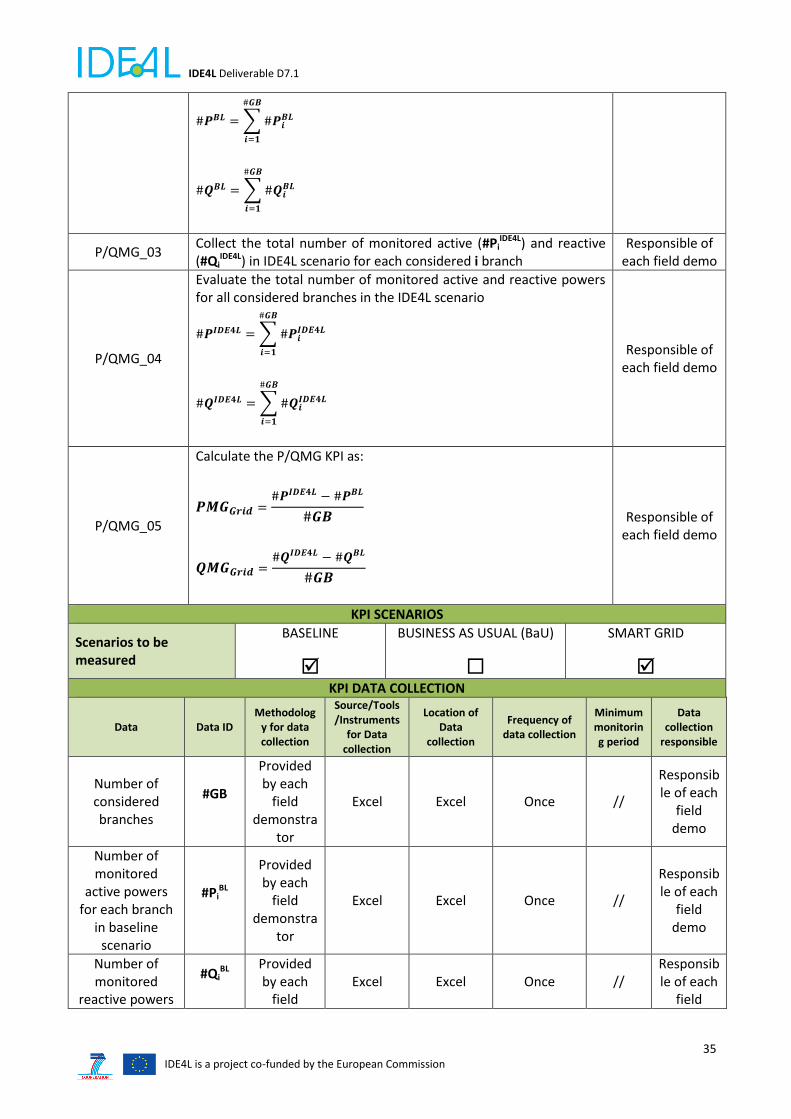
P/QMG_02 Evaluate the total number of monitored active and reactive powers for all considered branches in baseline scenario
Responsible of each field demo
IDE4L Deliverable D7.1
35 IDE4L is a project co-funded by the European Commission
#𝑷𝑩𝑳 = ∑ #𝑷𝒊𝑩𝑳
#𝑮𝑩
𝒊=𝟏
#𝑸𝑩𝑳 = ∑ #𝑸𝒊𝑩𝑳
#𝑮𝑩
𝒊=𝟏
P/QMG_03 Collect the total number of monitored active (#Pi
IDE4L) and reactive (#Qi
IDE4L) in IDE4L scenario for each considered i branch Responsible of
each field demo
P/QMG_04
Evaluate the total number of monitored active and reactive powers for all considered branches in the IDE4L scenario
#𝑷𝑰𝑫𝑬𝟒𝑳 = ∑ #𝑷𝒊𝑰𝑫𝑬𝟒𝑳
#𝑮𝑩
𝒊=𝟏
#𝑸𝑰𝑫𝑬𝟒𝑳 = ∑ #𝑸𝒊𝑰𝑫𝑬𝟒𝑳
#𝑮𝑩
𝒊=𝟏
Responsible of each field demo
P/QMG_05
Calculate the P/QMG KPI as:
𝑷𝑴𝑮𝑮𝒓𝒊𝒅 =#𝑷𝑰𝑫𝑬𝟒𝑳 − #𝑷𝑩𝑳
#𝑮𝑩
𝑸𝑴𝑮𝑮𝒓𝒊𝒅 =#𝑸𝑰𝑫𝑬𝟒𝑳 − #𝑸𝑩𝑳
#𝑮𝑩
Responsible of each field demo
KPI SCENARIOS
Scenarios to be measured
BASELINE
BUSINESS AS USUAL (BaU)
SMART GRID
KPI DATA COLLECTION
Data Data ID Methodolog
y for data collection
Source/Tools/Instruments
for Data collection
Location of Data
collection
Frequency of data collection
Minimum monitoring period
Data collection
responsible
Number of considered branches
#GB
Provided by each
field demonstra
tor
Excel Excel Once //
Responsible of each
field demo
Number of monitored
active powers for each branch
in baseline scenario
#PiBL
Provided by each
field demonstra
tor
Excel Excel Once //
Responsible of each
field demo
Number of monitored
reactive powers
#QiBL
Provided by each
field Excel Excel Once //
Responsible of each
field
IDE4L Deliverable D7.1
36 IDE4L is a project co-funded by the European Commission
for each branch in baseline
scenario
demonstrator
demo
Number of monitored
active powers for each branch
in IDE4L scenario
#PiIDE4L
Provided by each
field demonstra
tor
Excel Excel Once //
Responsible of each
field demo
Number of monitored
reactive powers for each branch
in IDE4L scenario
#QiIDE4L
Provided by each
field demonstra
tor
Excel Excel Once //
Responsible of each
field demo
KPI BASELINE
Source of Baseline Condition
LITERATURE VALUES
COMPANY HISTORICAL VALUES
VALUES MEASURED AT START OF PROJECT
Details of Baseline Data needed to evaluate the KPI can be collected in a “single-shot”.
Responsible (Name, Company) for Baseline
This KPI will be calculated only by DSOs because inputs are about real network
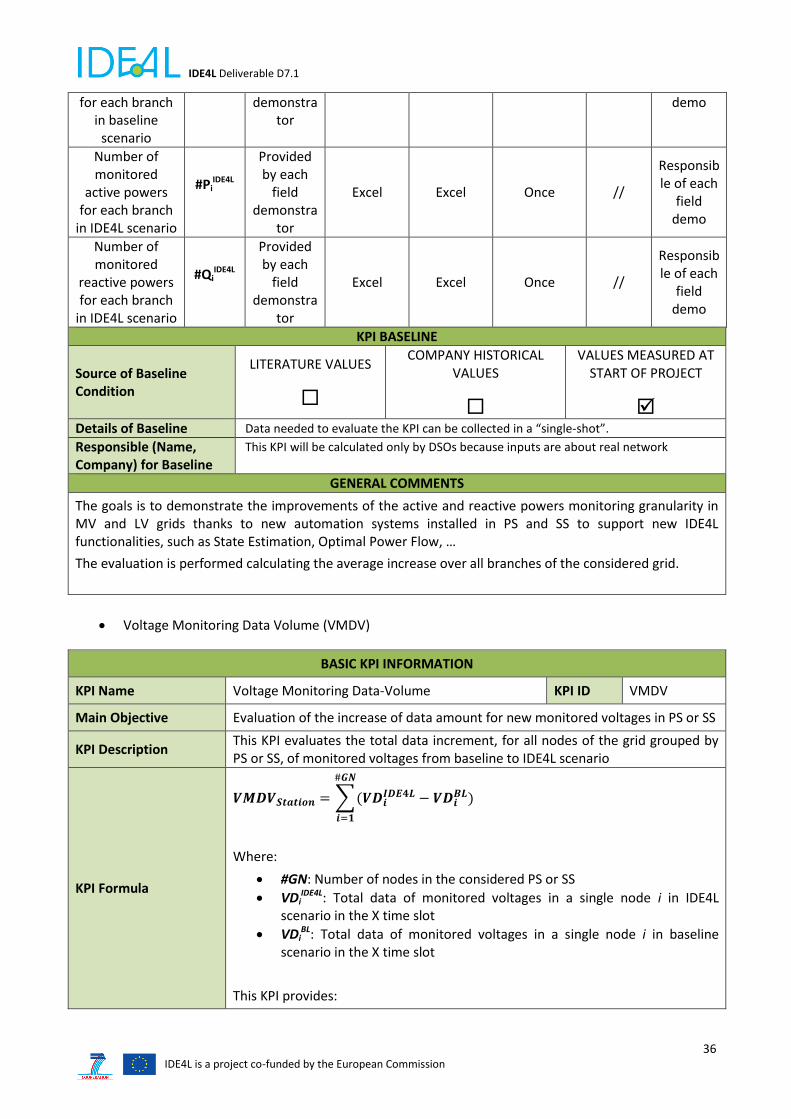
GENERAL COMMENTS
The goals is to demonstrate the improvements of the active and reactive powers monitoring granularity in MV and LV grids thanks to new automation systems installed in PS and SS to support new IDE4L functionalities, such as State Estimation, Optimal Power Flow, …
The evaluation is performed calculating the average increase over all branches of the considered grid.
Voltage Monitoring Data Volume (VMDV)
BASIC KPI INFORMATION
KPI Name Voltage Monitoring Data-Volume KPI ID VMDV
Main Objective Evaluation of the increase of data amount for new monitored voltages in PS or SS
KPI Description This KPI evaluates the total data increment, for all nodes of the grid grouped by PS or SS, of monitored voltages from baseline to IDE4L scenario
KPI Formula
𝑽𝑴𝑫𝑽𝑺𝒕𝒂𝒕𝒊𝒐𝒏 = ∑(𝑽𝑫𝒊𝑰𝑫𝑬𝟒𝑳 − 𝑽𝑫𝒊
𝑩𝑳)
#𝑮𝑵
𝒊=𝟏
Where:
#GN: Number of nodes in the considered PS or SS
VDiIDE4L: Total data of monitored voltages in a single node i in IDE4L
scenario in the X time slot
VDiBL: Total data of monitored voltages in a single node i in baseline
scenario in the X time slot
This KPI provides:

IDE4L Deliverable D7.1
37 IDE4L is a project co-funded by the European Commission
the increase of costs (in terms of data amount to handle) for the monitoring system to support new IDE4L functionalities (KPI direct proportionality)
Unit of measurement kBytes/X_time_slot (i.e. kBytes/Hour)
Connection / Link with other relevant defined KPIs and Use Cases
VMG (Voltage Monitoring Granularity KPI) - The increment of data volume related to the monitored voltages is directly connected to the increment of monitoring granularity required to perform IDE4L algorithms. So that VMDV must be considered together with VMG KPI in order to understand the cost of the monitoring improvements Both KPIs are linked to ‘LV&MV Real-time Monitoring’ Use Case
Project sites to be calculated
Development laboratory
Integration laboratory
Demonstration laboratory
Field demonstrator
KPI CALCULATION METHODOLOGY
KPI Step Methodology ID
[KPI ID #] Step Responsible
VMDV_01 Collect the total number of monitored voltages (#Vi
BL) in base line scenario for each considered i node
Responsible of each field demo
VMDV_02 Collect the number of samples (SPj
BL) in the X time slot and the data dimension for each j monitored voltage (VDj
BL) in baseline scenario for each considered i node
Responsible of each field demo
VMDV_03
Evaluate the total data of monitored voltages for all considered nodes in baseline scenario in the X time slot
𝑽𝑫𝑩𝑳 = ∑ ∑ (𝑺𝑷𝒋𝑩𝑳 ∗ 𝑽𝑫𝒋
𝑩𝑳)
#𝑽𝒊𝑩𝑳
𝒋=𝟏
#𝑮𝑵
𝒊=𝟏
Responsible of each field demo
VMDV_04 Collect the total number of monitored voltages (#Vi
IDE4L) in IDE4L scenario for each considered i node
Responsible of each field demo
VMDV_05 Collect the number of samples (SPj
IDE4L) in the X time slot and the data dimension for each j monitored voltage (VDj
IDE4L) in IDE4L scenario for each considered i node
Responsible of each field demo
VMDV_06
Evaluate the total data of monitored voltages for all considered nodes in IDE4L scenario in the X time slot
𝑽𝑫𝑰𝑫𝑬𝟒𝑳 = ∑ ∑ (𝑺𝑷𝒋𝑰𝑫𝑬𝟒𝑳 ∗ 𝑽𝑫𝒋
𝑰𝑫𝑬𝟒𝑳)
#𝑽𝒊𝑰𝑫𝑬𝟒𝑳
𝒋=𝟏
#𝑮𝑵
𝒊=𝟏
Responsible of each field demo
VMDV_07
Calculate the VMDV KPI as:
𝑽𝑴𝑫𝑽𝑺𝒕𝒂𝒕𝒊𝒐𝒏 = 𝑽𝑫𝑰𝑫𝑬𝟒𝑳 − 𝑽𝑫𝑩𝑳
Responsible of each field demo
KPI SCENARIOS
Scenarios to be measured
BASELINE BUSINESS AS USUAL (BaU) SMART GRID

IDE4L Deliverable D7.1
38 IDE4L is a project co-funded by the European Commission
KPI DATA COLLECTION
Data Data ID Methodolog
y for data collection
Source/Tools/Instruments
for Data collection
Location of Data
collection
Frequency of data collection
Minimum monitoring period
Data collection
responsible
Number of considered branches
#GN
Provided by each
field demonstra
tor
Excel Excel Once //
Responsible of each
field demo
Number of monitored
voltages for each node in baseline
scenario
#ViBL
Provided by each
field demonstra
tor
Excel Excel Once //
Responsible of each
field demo
Number of samples for each voltage in X time slot in baseline
scenario
SPjBL
Provided by each
field demonstra
tor
Excel Excel Once //
Responsible of each
field demo
Data volume for each monitored
voltage in baseline scenario
VDjBL
Provided by each
field demonstra
tor
Excel Excel Once //
Responsible of each
field demo
Number of monitored
voltages for each node in IDE4L
scenario
#CiIDE4L
Provided by each
field demonstra
tor
Excel Excel Once //
Responsible of each
field demo
Number of samples for each voltage in X time
slot in IDE4L scenario
SPjIDE4L
Provided by each
field demonstra
tor
Excel Excel Once //
Responsible of each
field demo
Data volume for each monitored voltage in IDE4L
scenario
VDjIDE4L
Provided by each
field demonstra
tor
Excel Excel Once //
Responsible of each
field demo
KPI BASELINE
Source of Baseline Condition
LITERATURE VALUES
COMPANY HISTORICAL VALUES
VALUES MEASURED AT START OF PROJECT
Details of Baseline Data needed to evaluate the KPI can be collected in a “single-shot”
Responsible (Name, Company) for Baseline
This KPI will be calculated only by DSOs because inputs are about real network.
GENERAL COMMENTS

IDE4L Deliverable D7.1
39 IDE4L is a project co-funded by the European Commission
The goals is to evaluate the increase of data amount for a fixed time slot X (X = hour, day, month, year, …) – in kBytes/X – related to the improvement of voltage monitoring granularity to support the new IDE4L functionalities. This increment directly impacts both on the data layer of the Substation Automation Unit (SAU) and on the communication infrastructures.
The evaluation is performed calculating the total increase over all nodes of the considered PS or SS.
Voltage Monitoring Granularity (VMG)
BASIC KPI INFORMATION
KPI Name Voltage Monitoring Granularity KPI ID VMG
Main Objective Evaluation of the increase of monitored voltages in MV and LV grid
KPI Description This KPI evaluates the average increment, for all nodes of the grid, of monitored voltages from baseline to IDE4L scenario
KPI Formula
𝑽𝑴𝑮𝑮𝒓𝒊𝒅 =∑ (#𝑽𝒊
𝑰𝑫𝑬𝟒𝑳 − #𝑽𝒊𝑩𝑳)#𝑮𝑵
𝒊=𝟏
#𝑮𝑵
Where:
#GN: Number of nodes in the considered grid
#ViIDE4L: Total number of monitored voltages in a single node i in IDE4L
scenario
#ViBL: Total number of monitored voltages in a single node i in baseline
scenario
This KPI provides:
the increase of the voltage monitoring granularity in the considered grid (KPI direct proportionality)
Unit of measurement %/Branch
Connection / Link with other relevant defined KPIs and Use Cases
CMDV (Current Monitoring Data-Volume KPI) - The increment of current monitoring granularity entails also the increment of data volume related to the monitored currents. So that CMG must be considered together with CMDV KPI in order to understand the cost of the monitoring improvements Both KPIs are linked to ‘LV&MV Real-time Monitoring’ Use Case
Project sites to be calculated
Development laboratory
Integration laboratory
Demonstration laboratory
Field demonstrator
KPI CALCULATION METHODOLOGY
KPI Step Methodology ID
[KPI ID #] Step Responsible
VMG_01 Collect the total number of monitored voltages (#Vi
BL) in base line scenario for each considered i node
Responsible of each field demo
VMG_02 Evaluate the total number of monitored voltages for all considered nodes in baseline scenario
Responsible of each field demo
IDE4L Deliverable D7.1
40 IDE4L is a project co-funded by the European Commission
#𝑽𝑩𝑳 = ∑ #𝑽𝒊𝑩𝑳
#𝑮𝑵
𝒊=𝟏
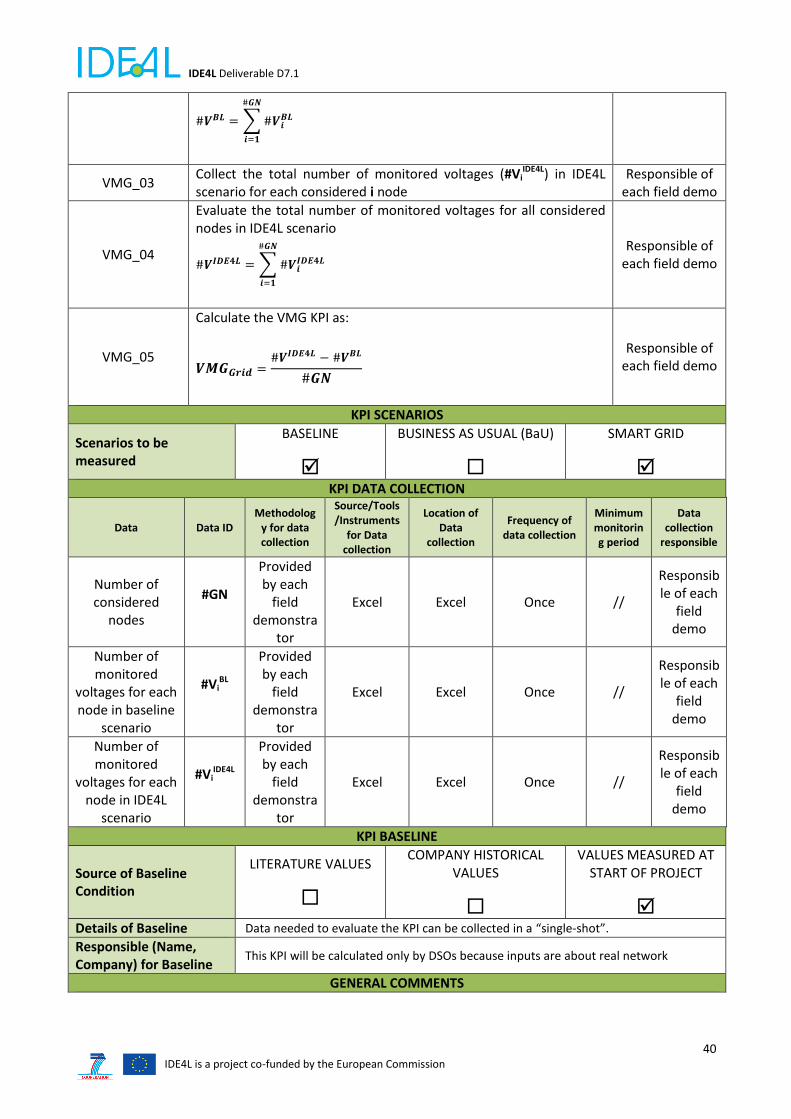
VMG_03 Collect the total number of monitored voltages (#Vi
IDE4L) in IDE4L scenario for each considered i node
Responsible of each field demo
VMG_04
Evaluate the total number of monitored voltages for all considered nodes in IDE4L scenario
#𝑽𝑰𝑫𝑬𝟒𝑳 = ∑ #𝑽𝒊𝑰𝑫𝑬𝟒𝑳
#𝑮𝑵
𝒊=𝟏
Responsible of each field demo
VMG_05
Calculate the VMG KPI as:
𝑽𝑴𝑮𝑮𝒓𝒊𝒅 =#𝑽𝑰𝑫𝑬𝟒𝑳 − #𝑽𝑩𝑳
#𝑮𝑵
Responsible of each field demo
KPI SCENARIOS
Scenarios to be measured
BASELINE
BUSINESS AS USUAL (BaU)
SMART GRID
KPI DATA COLLECTION
Data Data ID Methodolog
y for data collection
Source/Tools/Instruments
for Data collection
Location of Data
collection
Frequency of data collection
Minimum monitoring period
Data collection
responsible
Number of considered
nodes
#GN
Provided by each
field demonstra
tor
Excel Excel Once //
Responsible of each
field demo
Number of monitored
voltages for each node in baseline
scenario
#ViBL
Provided by each
field demonstra
tor
Excel Excel Once //
Responsible of each
field demo
Number of monitored
voltages for each node in IDE4L
scenario
#ViIDE4L
Provided by each
field demonstra
tor
Excel Excel Once //
Responsible of each
field demo
KPI BASELINE
Source of Baseline Condition
LITERATURE VALUES
COMPANY HISTORICAL VALUES
VALUES MEASURED AT START OF PROJECT
Details of Baseline Data needed to evaluate the KPI can be collected in a “single-shot”.
Responsible (Name, Company) for Baseline
This KPI will be calculated only by DSOs because inputs are about real network
GENERAL COMMENTS

IDE4L Deliverable D7.1
41 IDE4L is a project co-funded by the European Commission
The goals is to demonstrate the improvements of the voltage monitoring granularity in MV and LV grids thanks to new automation systems installed in PS and SS to support new IDE4L functionalities, such as State Estimation, Optimal Power Flow, …
The evaluation is performed calculating the average increase over all nodes of the considered grid.
6.2 UC2: MV & LV State estimation In this Use Case, two KPIs have been defined:
Real-time LV Network State Estimator (LVSE)
BASIC KPI INFORMATION
KPI Name Real-time LV network State Estimator KPI ID LVSE
Main Objective Evaluate the accuracy of the state estimates
KPI Description This KPI evaluates the accuracy of the real-time LV network state estimates by comparing the estimated values with actual simulated values.
KPI Formula
𝐿𝑉𝑆𝐸 =1
𝑁∑ √
1
𝑇∑(�̃�(𝑡)𝑛 − 𝑥(𝑡)𝑛)2
𝑇
𝑡=1
𝑁
𝑛=1
where:
𝑁 : number of studied state variables
𝑇 : number of time intervals under study
�̃�(𝑡)𝑛 : real instantaneous value for the state variable at time t
𝑥(𝑡)𝑛 : estimated value for the state variable n with at time t.
Unit of measurement
KPI LVSE can be calculated for several different variables. Units of measurements used are as follows:
Injected active power (kW)
Injected reactive power (kVAr)
Line current (A)
Node voltage (V)
Connection / Link with other relevant defined KPIs and Use Cases
LVSE KPI formula is identical with MVSE KPI formula
Project sites to be calculated
Development laboratory
Demonstration laboratory
Field demonstrator
KPI CALCULATION METHODOLOGY
KPI Step Methodology ID
[KPI ID #] Step Responsible
LVSE_01
The first step is the collection of real-time measurements. The real time measurements are collected either form the simulated network (laboratory demos) or from the real distribution network (field demos). Part of the real-time measurements is used as inputs to the state estimator and the others are used for KPI calculation. The
Research organism (TUT)
IDE4L Deliverable D7.1
42 IDE4L is a project co-funded by the European Commission
measurements are stored into DXP.
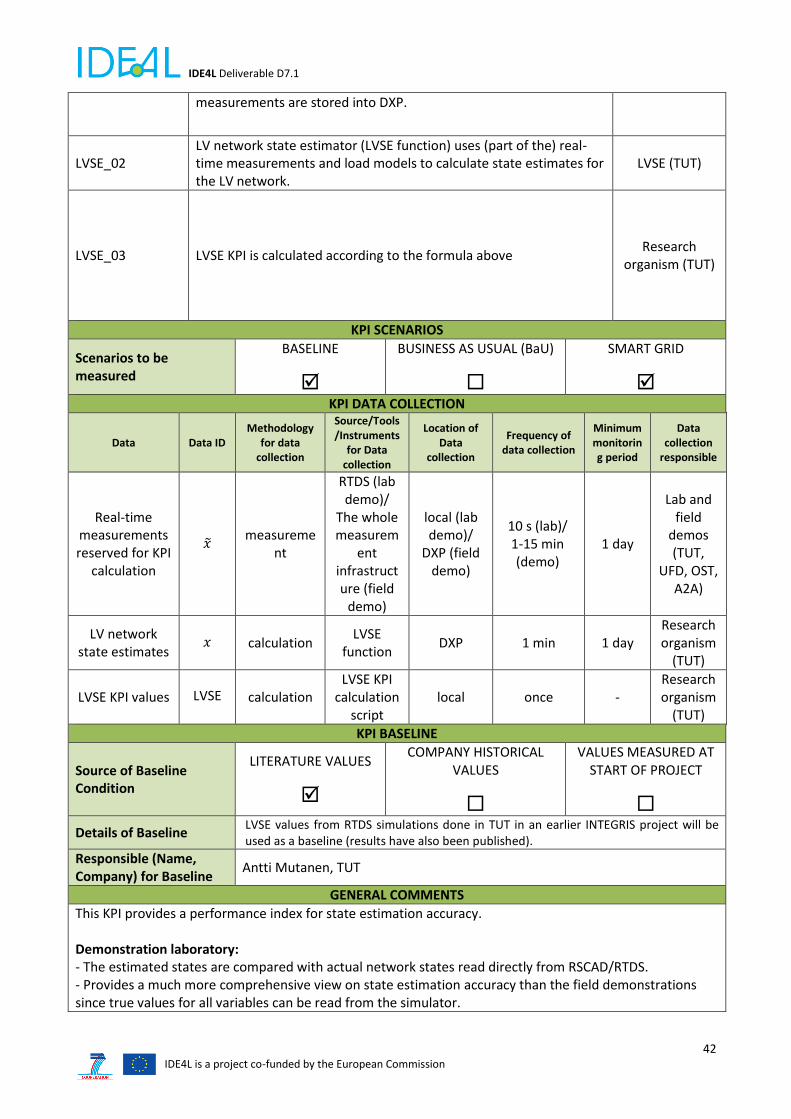
LVSE_02 LV network state estimator (LVSE function) uses (part of the) real-time measurements and load models to calculate state estimates for the LV network.
LVSE (TUT)
LVSE_03 LVSE KPI is calculated according to the formula above Research
organism (TUT)
KPI SCENARIOS
Scenarios to be measured
BASELINE
BUSINESS AS USUAL (BaU)
SMART GRID
KPI DATA COLLECTION
Data Data ID Methodology
for data collection
Source/Tools/Instruments
for Data collection
Location of Data
collection
Frequency of data collection
Minimum monitoring period
Data collection
responsible
Real-time measurements reserved for KPI
calculation
�̃� measureme
nt
RTDS (lab demo)/
The whole measurem
ent infrastructure (field
demo)
local (lab demo)/
DXP (field demo)
10 s (lab)/ 1-15 min (demo)
1 day
Lab and field
demos (TUT,
UFD, OST, A2A)
LV network state estimates
𝑥 calculation LVSE
function DXP 1 min 1 day
Research organism
(TUT)
LVSE KPI values LVSE calculation LVSE KPI
calculation script
local once - Research organism
(TUT)
KPI BASELINE
Source of Baseline Condition
LITERATURE VALUES
COMPANY HISTORICAL VALUES
VALUES MEASURED AT START OF PROJECT
Details of Baseline LVSE values from RTDS simulations done in TUT in an earlier INTEGRIS project will be used as a baseline (results have also been published).
Responsible (Name, Company) for Baseline
Antti Mutanen, TUT
GENERAL COMMENTS
This KPI provides a performance index for state estimation accuracy. Demonstration laboratory: - The estimated states are compared with actual network states read directly from RSCAD/RTDS. - Provides a much more comprehensive view on state estimation accuracy than the field demonstrations since true values for all variables can be read from the simulator.

IDE4L Deliverable D7.1
43 IDE4L is a project co-funded by the European Commission
- The LVSE KPI will be calculated with the highest possible frequency (e.g. once every 10 seconds) so that even the effects that temporary fluctuations in electricity consumption have on LV network state are taken into account. Field demonstrations: - Some of the real-time measurements are reserved for KPI calculation and only a part of real-time measurements are used as inputs to the LVSE. At the moment (2014), the DNOs participating to this project do not have LV network state estimation capabilities. Also, in general, calculation of LV network state estimates does not belong to current DNO practices. Therefore, the KPI’s for business-as-usual scenarios are not calculated. However, comparisons with different measurement setups are made. In addition to the above defined KPI, another important performance metric for LV network state estimation is the state estimation function execution time which is measured separately.
Real-time MV Network State Estimator (MVSE)
BASIC KPI INFORMATION
KPI Name Real-time MV network state Estimator KPI ID MVSE
Main Objective Evaluate the accuracy of the state estimation
KPI Description This KPI evaluates the accuracy of the real-time MV network state estimator by comparing the estimated values with actual simulated values.
KPI Formula
𝑀𝑉𝑆𝐸 =1
𝑁∑ √
1
𝑇∑(�̃�(𝑡)𝑛 − 𝑥(𝑡)𝑛)2
𝑇
𝑡=1
𝑁
𝑛=1
where:
𝑁 : number of studied state variables
𝑇 : number of time intervals under study
�̃�(𝑡)𝑛 : real instantaneous value for the state variable at time t
𝑥(𝑡)𝑛 : estimated value for the state variable n with at time t.
Unit of measurement
KPI MVSE can be calculated for several different variables. Units of measurements used are as follows:
Injected active power (kW)
Injected reactive power (kVAr)
Line current (A)
Node voltage (V)
Connection / Link with other relevant defined KPIs and Use Cases
MVSE KPI formula is identical with LVSE KPI formula
Project sites to be calculated
Development laboratory
Demonstration laboratory
Field demonstrator
KPI CALCULATION METHODOLOGY

IDE4L Deliverable D7.1
44 IDE4L is a project co-funded by the European Commission
KPI Step Methodology ID
[KPI ID #] Step Responsible
MVSE_01
The first step is the collection of real-time measurements. The real time measurements are collected either form the simulated network (laboratory demos) or from the real distribution network (field demos). Part of the real-time measurements is used as inputs to the state estimator and the others are used for KPI calculation. The measurements are stored into DXP.
Lab and field demos (TUT,
A2A)
MVSE_02 MV network state estimator (MVSE function) uses real-time measurements and load models to calculate state estimates for the MV network.
MVSE (TUT)
MVSE_03 KPI is calculated according to the MVSE KPI formula
Research organism (TUT)
KPI SCENARIOS
Scenarios to be measured
BASELINE
BUSINESS AS USUAL (BaU)
SMART GRID
KPI DATA COLLECTION
Data Data ID Methodology
for data collection
Source/Tools/Instruments
for Data collection
Location of Data
collection
Frequency of data collection
Minimum monitoring period
Data collection
responsible
Real-time measurements reserved for KPI
calculation
�̃� measureme
nt
RTDS (lab demo)/
The whole measurem
ent infrastructure (field
demo)
local (lab demo)/
DXP (field demo)
10 s (lab)/ 1-15 min (demo)
1 day (TUT)
MV network state estimates
𝑥 calculation MVSE
function DXP 1 min 1 day (TUT)
MVSE KPI values
𝑀𝑉𝑆𝐸 calculation MVSE KPI
calculation script
local once - (TUT)
KPI BASELINE
Source of Baseline Condition
LITERATURE VALUES
COMPANY HISTORICAL VALUES
VALUES MEASURED AT START OF PROJECT
Details of Baseline
Distribution network calculation software and practices vary from country to country and utility to utility. Therefore it is impossible to define one universal baseline case for state estimation. Some network management programs are capable of calculating MV network state estimates. The DNOs participating in field demonstrations do not have (yet) this possibility and therefore baseline performance indices are not calculated for MV network state estimation.
Responsible (Name, Company) for Baseline
GENERAL COMMENTS
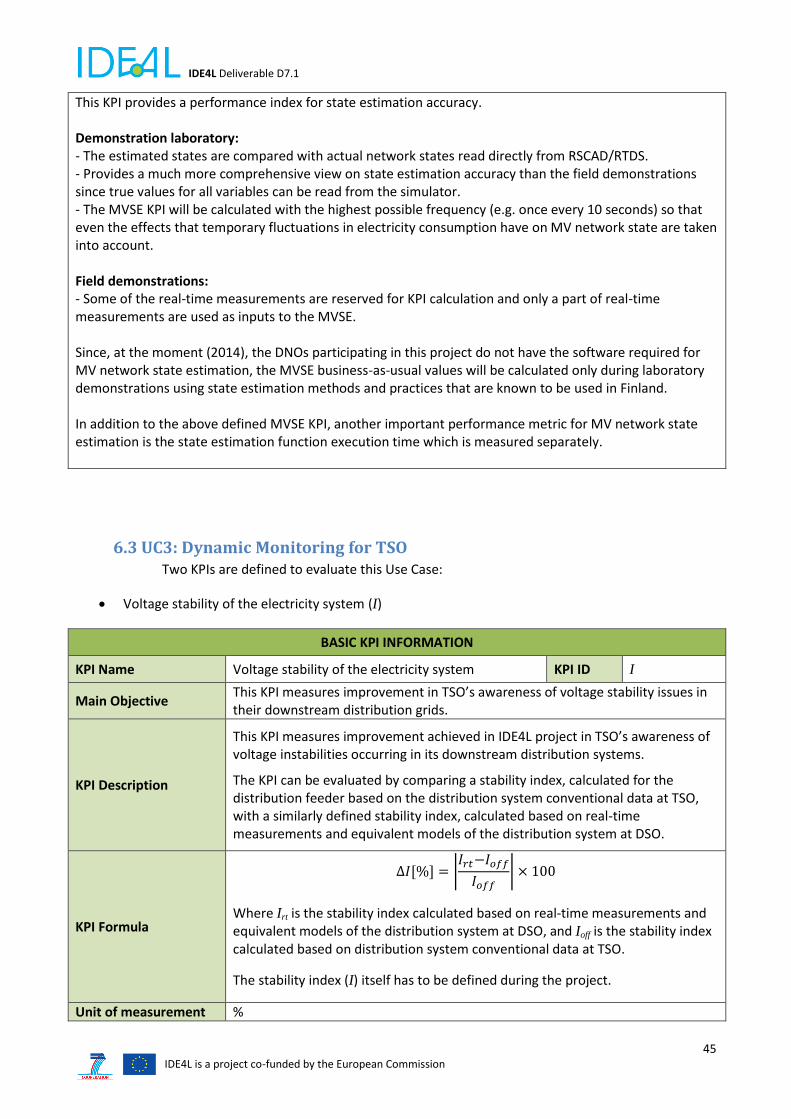
IDE4L Deliverable D7.1
45 IDE4L is a project co-funded by the European Commission
This KPI provides a performance index for state estimation accuracy. Demonstration laboratory: - The estimated states are compared with actual network states read directly from RSCAD/RTDS. - Provides a much more comprehensive view on state estimation accuracy than the field demonstrations since true values for all variables can be read from the simulator. - The MVSE KPI will be calculated with the highest possible frequency (e.g. once every 10 seconds) so that even the effects that temporary fluctuations in electricity consumption have on MV network state are taken into account. Field demonstrations: - Some of the real-time measurements are reserved for KPI calculation and only a part of real-time measurements are used as inputs to the MVSE. Since, at the moment (2014), the DNOs participating in this project do not have the software required for MV network state estimation, the MVSE business-as-usual values will be calculated only during laboratory demonstrations using state estimation methods and practices that are known to be used in Finland. In addition to the above defined MVSE KPI, another important performance metric for MV network state estimation is the state estimation function execution time which is measured separately.
6.3 UC3: Dynamic Monitoring for TSO Two KPIs are defined to evaluate this Use Case:
Voltage stability of the electricity system (I)
BASIC KPI INFORMATION
KPI Name Voltage stability of the electricity system KPI ID I
Main Objective This KPI measures improvement in TSO’s awareness of voltage stability issues in their downstream distribution grids.
KPI Description
This KPI measures improvement achieved in IDE4L project in TSO’s awareness of voltage instabilities occurring in its downstream distribution systems.
The KPI can be evaluated by comparing a stability index, calculated for the distribution feeder based on the distribution system conventional data at TSO, with a similarly defined stability index, calculated based on real-time measurements and equivalent models of the distribution system at DSO.
KPI Formula
∆𝐼[%] = |𝐼𝑟𝑡−𝐼𝑜𝑓𝑓
𝐼𝑜𝑓𝑓| × 100
Where Irt is the stability index calculated based on real-time measurements and equivalent models of the distribution system at DSO, and Ioff is the stability index calculated based on distribution system conventional data at TSO.
The stability index (I) itself has to be defined during the project.
Unit of measurement %

IDE4L Deliverable D7.1
46 IDE4L is a project co-funded by the European Commission
Connection / Link with other relevant defined KPIs and Use Cases
This KPI is defined in conjunction with UC “Dynamic Monitoring for TSO”.
Project sites to be calculated
Development laboratory
Demonstration laboratory
Field demonstrator
KPI CALCULATION METHODOLOGY
KPI Step Methodology ID
[KPI ID #] Step Responsible
I_01 Definition of stability index. Research
organism (KTH)
I_02 Definition of scenario(s) under which the KPI will be measured. Research
organism (KTH)
I_03 Calculate the KPI for the reference grid. Research
organism (KTH)
KPI SCENARIOS
Scenarios to be measured
BASELINE
BUSINESS AS USUAL (BaU)
SMART GRID
The calculation of this KPI will be done totally based on simulation data. This means that there will be two main simulations:
1. A simulation including the development that we are going to achieve (Smart grid scenario)
2. A simulation that does not include that development (BaU scenario)
The Ioff will be calculated based on a reduced model of the reference grid that is assumed to be available to TSO, i.e., a model not containing detailed data about DG units – typical situation for DSOs –.
KPI DATA COLLECTION
Data Data ID
Methodology for data
collection
Source/Tools/Instruments
for Data collection
Location of Data
collection
Frequency of data collection
Minimum monitoring period
Data collection
responsible
Stability index calculated based on distribution system conventional data
Ioff Calculation --- SmarTS Lab
(KTH) --- ---
Research organism
(KTH)
Stability index calculated based on real-time measurements and equivalent models of the distribution system
Irt HIL
Simualtion
PMU, RT-Simulator,
Data mediator
SmarTS Lab (KTH)
As required As
required
Research organism
(KTH)
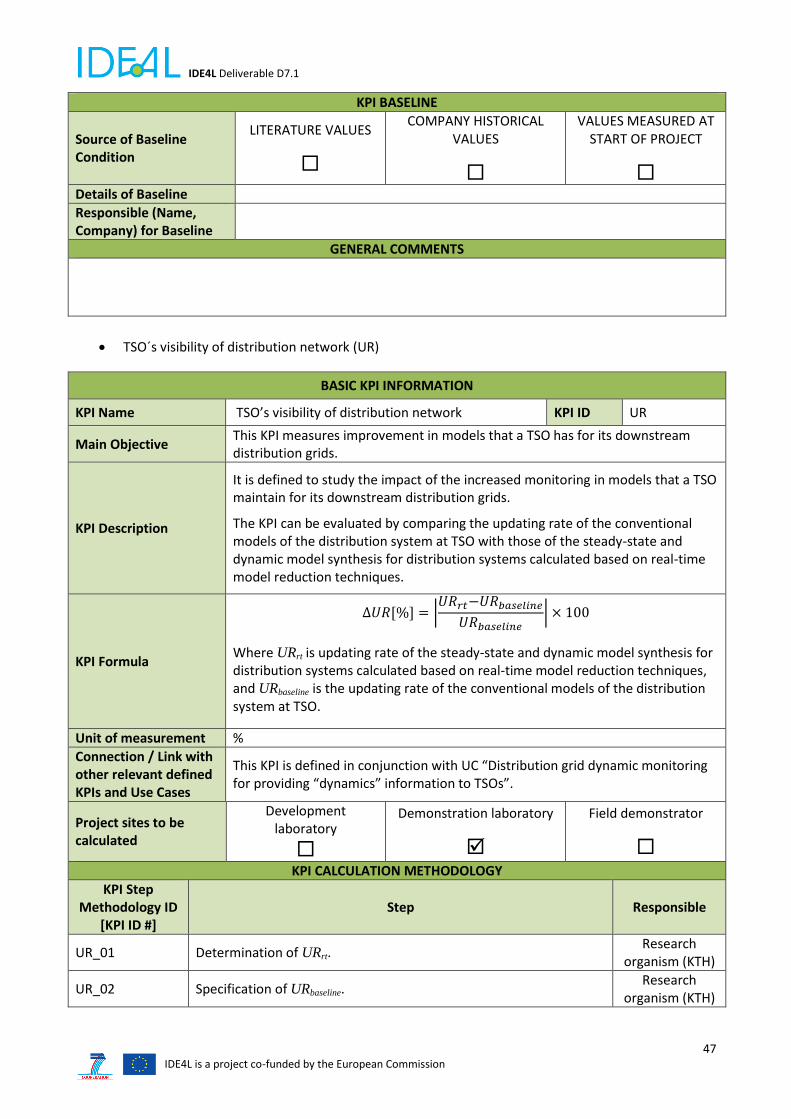
IDE4L Deliverable D7.1
47 IDE4L is a project co-funded by the European Commission
KPI BASELINE
Source of Baseline Condition
LITERATURE VALUES
COMPANY HISTORICAL VALUES
VALUES MEASURED AT START OF PROJECT
Details of Baseline
Responsible (Name, Company) for Baseline
GENERAL COMMENTS
TSO´s visibility of distribution network (UR)
BASIC KPI INFORMATION
KPI Name TSO’s visibility of distribution network KPI ID UR
Main Objective This KPI measures improvement in models that a TSO has for its downstream distribution grids.
KPI Description
It is defined to study the impact of the increased monitoring in models that a TSO maintain for its downstream distribution grids.
The KPI can be evaluated by comparing the updating rate of the conventional models of the distribution system at TSO with those of the steady-state and dynamic model synthesis for distribution systems calculated based on real-time model reduction techniques.
KPI Formula
∆𝑈𝑅[%] = |𝑈𝑅𝑟𝑡−𝑈𝑅𝑏𝑎𝑠𝑒𝑙𝑖𝑛𝑒
𝑈𝑅𝑏𝑎𝑠𝑒𝑙𝑖𝑛𝑒| × 100
Where URrt is updating rate of the steady-state and dynamic model synthesis for distribution systems calculated based on real-time model reduction techniques, and URbaseline is the updating rate of the conventional models of the distribution system at TSO.
Unit of measurement %
Connection / Link with other relevant defined KPIs and Use Cases
This KPI is defined in conjunction with UC “Distribution grid dynamic monitoring for providing “dynamics” information to TSOs”.
Project sites to be calculated
Development laboratory
Demonstration laboratory
Field demonstrator
KPI CALCULATION METHODOLOGY
KPI Step Methodology ID
[KPI ID #] Step Responsible
UR_01 Determination of URrt. Research
organism (KTH)
UR_02 Specification of URbaseline. Research
organism (KTH)
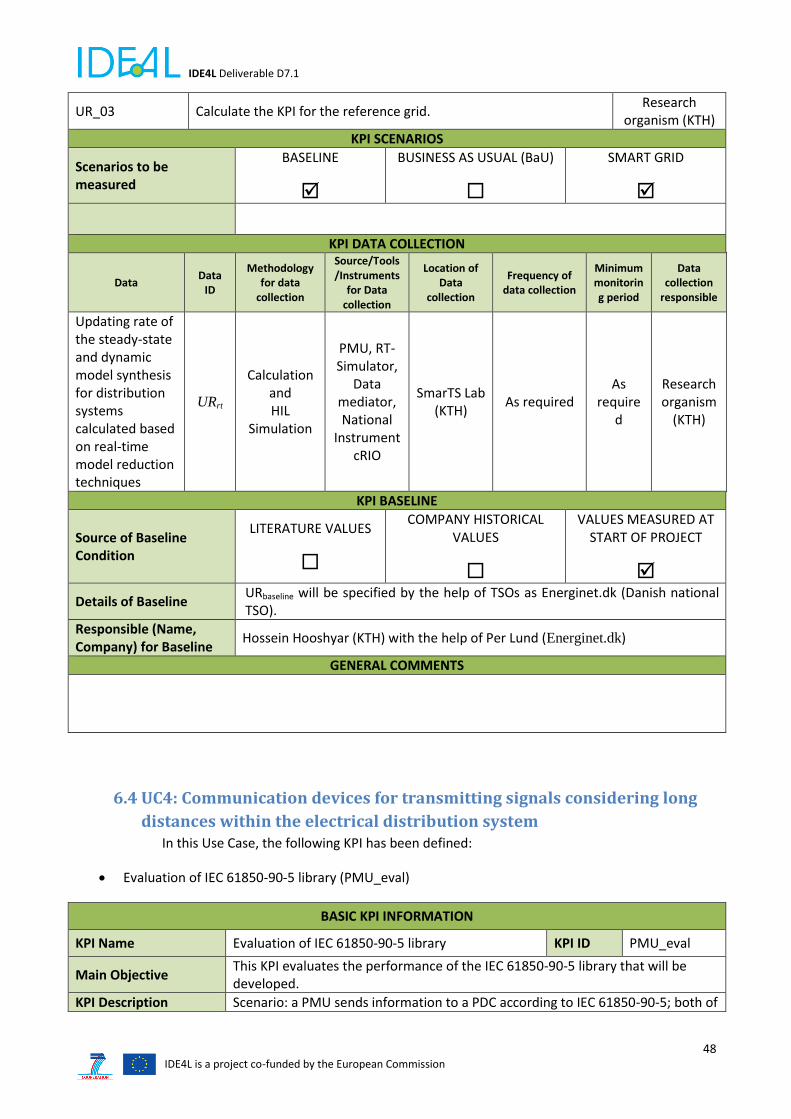
IDE4L Deliverable D7.1
48 IDE4L is a project co-funded by the European Commission
UR_03 Calculate the KPI for the reference grid. Research
organism (KTH)
KPI SCENARIOS
Scenarios to be measured
BASELINE
BUSINESS AS USUAL (BaU)
SMART GRID
KPI DATA COLLECTION
Data Data ID
Methodology for data
collection
Source/Tools/Instruments
for Data collection
Location of Data
collection
Frequency of data collection
Minimum monitoring period
Data collection
responsible
Updating rate of the steady-state and dynamic model synthesis for distribution systems calculated based on real-time model reduction techniques
URrt
Calculation and HIL
Simulation
PMU, RT-Simulator,
Data mediator, National
Instrument cRIO
SmarTS Lab (KTH)
As required As
required
Research organism
(KTH)
KPI BASELINE
Source of Baseline Condition
LITERATURE VALUES
COMPANY HISTORICAL VALUES
VALUES MEASURED AT START OF PROJECT
Details of Baseline URbaseline will be specified by the help of TSOs as Energinet.dk (Danish national TSO).
Responsible (Name, Company) for Baseline
Hossein Hooshyar (KTH) with the help of Per Lund (Energinet.dk)
GENERAL COMMENTS
6.4 UC4: Communication devices for transmitting signals considering long
distances within the electrical distribution system In this Use Case, the following KPI has been defined:
Evaluation of IEC 61850-90-5 library (PMU_eval)
BASIC KPI INFORMATION
KPI Name Evaluation of IEC 61850-90-5 library KPI ID PMU_eval
Main Objective This KPI evaluates the performance of the IEC 61850-90-5 library that will be developed.
KPI Description Scenario: a PMU sends information to a PDC according to IEC 61850-90-5; both of

IDE4L Deliverable D7.1
49 IDE4L is a project co-funded by the European Commission
them use the library developed by IREC:
The KPI evaluates if the implementation of Sample Value protocol and GOOSE protocol is as defined in the standard. In particular, it will be evaluated if the PMU correctly generates Sample Value and GOOSE messages To do so, it will be used Wireshark, which has support for Sample Value and GOOSE messages:
KPI Formula
100 different messages will be sent from the PMU and parsed by Wireshark.
PMU_eval = number_of_messages_well_parsed_by_Wireshark / 100
Unit of measurement %
Connection / Link with other relevant defined KPIs and Use Cases
Use Case: Communication devices for transmitting signals considering long distances within the electrical distribution system.
Project sites to be calculated
Development laboratory
Demonstration laboratory
Field demonstrator
KPI CALCULATION METHODOLOGY
KPI Step Methodology ID
[KPI ID #] Step Responsible
PMU_eval_01 The PMU generates a message (according to IEC 61850-90-5). Research
organism (IREC)
PMU_eval_02 Wireshark captures the message. Research
organism (IREC)
PMU_eval_03 Wireshark “tries” to parse the message. Research
organism (IREC)
KPI SCENARIOS
Scenarios to be measured
BASELINE
BUSINESS AS USUAL (BaU)
SMART GRID
KPI DATA COLLECTION
Data Data ID
Methodology for data
collection
Source/Tools/Instruments for Data collection
Location of Data
collection
Frequency of data collection
Minimum monitoring period
Data collection
responsible
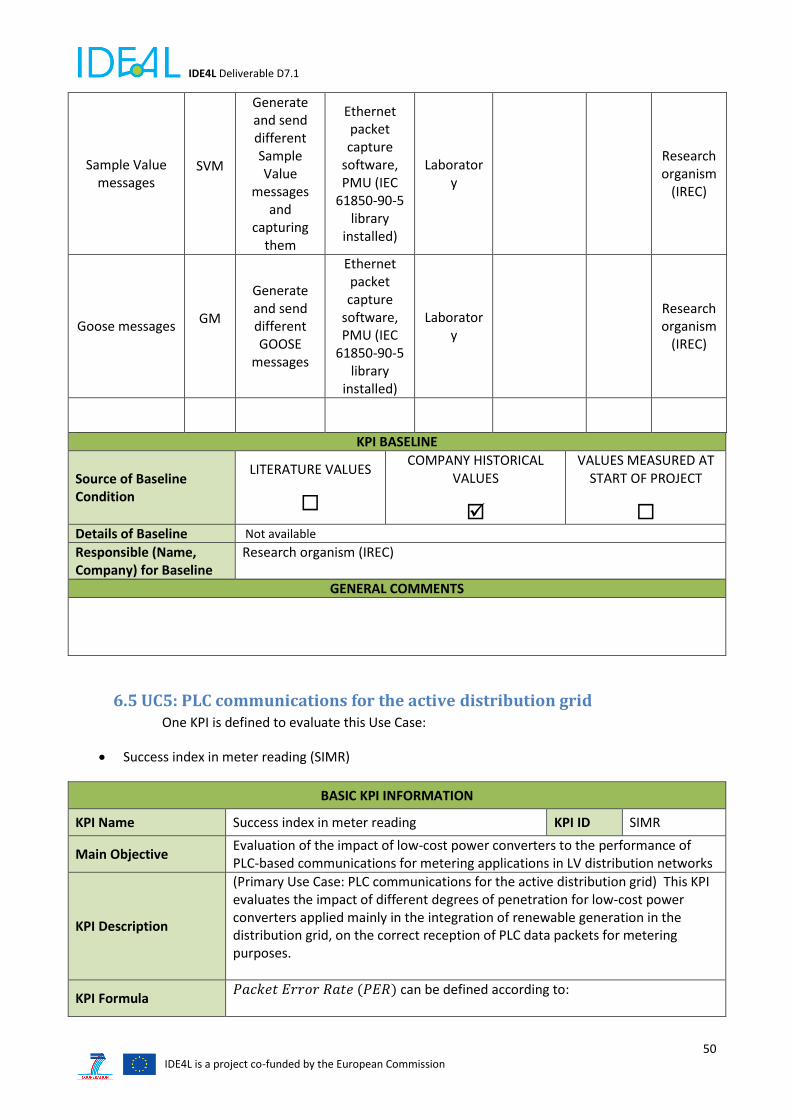
IDE4L Deliverable D7.1
50 IDE4L is a project co-funded by the European Commission
Sample Value messages
SVM
Generate and send different Sample Value
messages and
capturing them
Ethernet packet capture
software, PMU (IEC
61850-90-5 library
installed)
Laboratory
Research organism
(IREC)
Goose messages GM
Generate and send different GOOSE
messages
Ethernet packet capture
software, PMU (IEC
61850-90-5 library
installed)
Laboratory
Research organism
(IREC)
KPI BASELINE
Source of Baseline Condition
LITERATURE VALUES
COMPANY HISTORICAL VALUES
VALUES MEASURED AT START OF PROJECT
Details of Baseline Not available
Responsible (Name, Company) for Baseline
Research organism (IREC)
GENERAL COMMENTS
6.5 UC5: PLC communications for the active distribution grid One KPI is defined to evaluate this Use Case:
Success index in meter reading (SIMR)
BASIC KPI INFORMATION
KPI Name Success index in meter reading KPI ID SIMR
Main Objective Evaluation of the impact of low-cost power converters to the performance of PLC-based communications for metering applications in LV distribution networks
KPI Description
(Primary Use Case: PLC communications for the active distribution grid) This KPI evaluates the impact of different degrees of penetration for low-cost power converters applied mainly in the integration of renewable generation in the distribution grid, on the correct reception of PLC data packets for metering purposes.
KPI Formula 𝑃𝑎𝑐𝑘𝑒𝑡 𝐸𝑟𝑟𝑜𝑟 𝑅𝑎𝑡𝑒 (𝑃𝐸𝑅) can be defined according to:

IDE4L Deliverable D7.1
51 IDE4L is a project co-funded by the European Commission
𝑃𝐸𝑅 =𝑎𝑚𝑜𝑢𝑛𝑡 𝑜𝑓 𝑖𝑛𝑐𝑜𝑟𝑟𝑒𝑐𝑡𝑙𝑦 𝑟𝑒𝑐𝑒𝑖𝑣𝑒𝑑 𝑑𝑎𝑡𝑎 𝑝𝑎𝑐𝑘𝑒𝑡𝑠 𝑖𝑛 ′Δ𝑡′
𝑡𝑜𝑡𝑎𝑙 𝑎𝑚𝑜𝑢𝑛𝑡 𝑜𝑓 𝑡𝑟𝑎𝑛𝑠𝑚𝑖𝑡𝑡𝑒𝑑 𝑑𝑎𝑡𝑎 𝑝𝑎𝑐𝑘𝑒𝑡𝑠 𝑖𝑛 ′Δ𝑡′
So it will be evaluated by considering:
1. Number of packets that are being sent by the transmitter during a time interval ‘Δt’.
2. Number of packets that are being received during the same time interval ‘Δt’, and
3. The ones that are being received incorrectly The evaluation of this KPI is performed previously calculating the packet error rate (PER) of the communication between the PLC transmitter and receiver, according to the expression:
𝑆𝐼𝑀𝑅𝑡 =𝑃𝐸𝑅𝑏𝑎𝑠𝑒𝑙𝑖𝑛𝑒 − 𝑃𝐸𝑅𝐵𝑎𝑈
𝑃𝐸𝑅𝑏𝑎𝑠𝑒𝑙𝑖𝑛𝑒
Where: 𝑆𝐼𝑀𝑅𝑡 is the success index in meter reading during a given period 𝑡 𝑃𝐸𝑅𝑏𝑎𝑠𝑒𝑙𝑖𝑛𝑒 is the packet error rate in the baseline scenario 𝑃𝐸𝑅𝐵𝑎𝑈 is the packet error rate in the business as usual scenario
Unit of measurement %
Connection / Link with other relevant defined KPIs and Use Cases
- Current monitoring data weight - Voltage monitoring data weight - Monitoring level in the network state estimation
Project sites to be calculated
Development laboratory
Demonstration laboratory
Field demonstrator
KPI CALCULATION METHODOLOGY
KPI Step Methodology ID
[KPI ID #] Step Responsible
SIMR_01 Measurement of the quantity of information packets being sent by the AMI transmitter
Research organism (IREC)
SIMR_02 Measurement of the quantity of information packets being received correctly by the Concentrator receiver
Research organism (IREC)
SIMR_03 Measurement of the communication failures (wrong received and non-received packets)
Research organism (IREC)
SIMR_04 Number of times that the test is being performed Research
organism (IREC)
KPI SCENARIOS
Scenarios to be measured
BASELINE
BUSINESS AS USUAL (BaU)
SMART GRID
KPI DATA COLLECTION
Data Data ID
Methodology for data
collection
Source/Tools/Instruments
for Data collection
Location of Data
collection
Frequency of data collection
Minimum monitoring period
Data collection
responsible
Wrong received or non-received
Wp SIMR1, SIMR3
Oscilloscope, data
laboratory Every time a
packet is 20*SIM
R4 Research organism
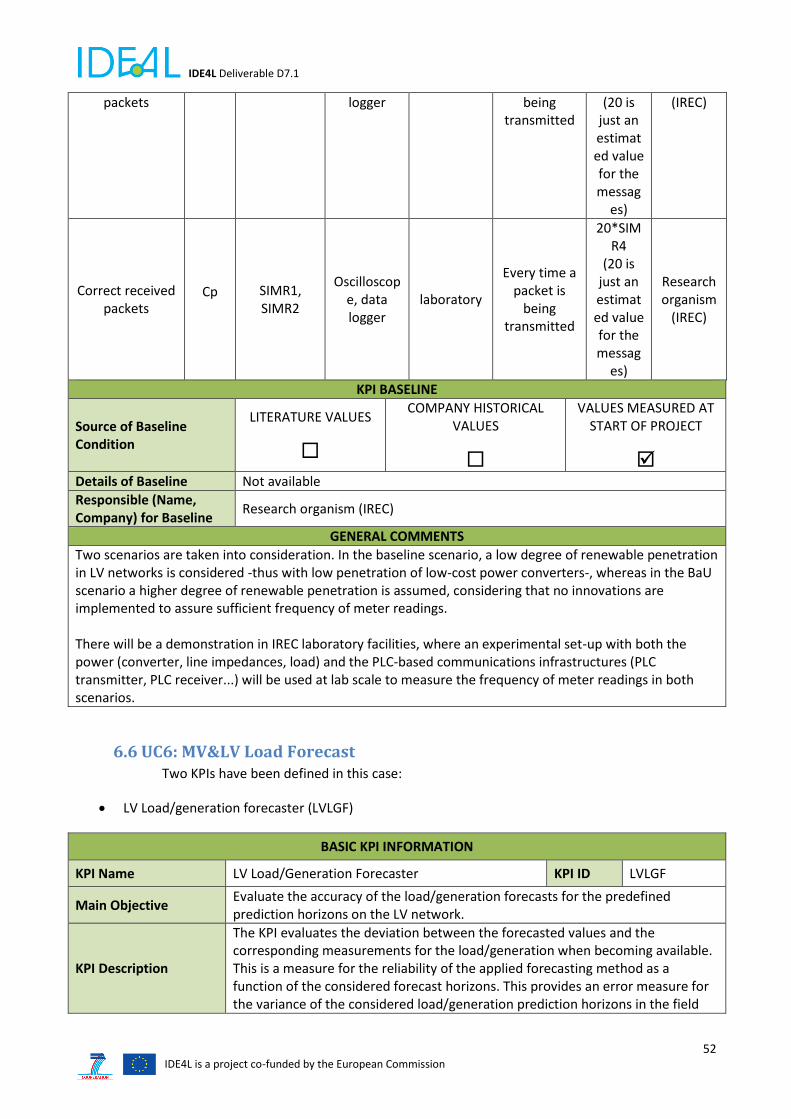
IDE4L Deliverable D7.1
52 IDE4L is a project co-funded by the European Commission
packets logger being transmitted
(20 is just an estimated value for the messag
es)
(IREC)
Correct received packets
Cp SIMR1, SIMR2
Oscilloscope, data logger
laboratory
Every time a packet is
being transmitted
20*SIMR4
(20 is just an estimated value for the messag
es)
Research organism
(IREC)
KPI BASELINE
Source of Baseline Condition
LITERATURE VALUES
COMPANY HISTORICAL VALUES
VALUES MEASURED AT START OF PROJECT
Details of Baseline Not available
Responsible (Name, Company) for Baseline
Research organism (IREC)
GENERAL COMMENTS
Two scenarios are taken into consideration. In the baseline scenario, a low degree of renewable penetration in LV networks is considered -thus with low penetration of low-cost power converters-, whereas in the BaU scenario a higher degree of renewable penetration is assumed, considering that no innovations are implemented to assure sufficient frequency of meter readings. There will be a demonstration in IREC laboratory facilities, where an experimental set-up with both the power (converter, line impedances, load) and the PLC-based communications infrastructures (PLC transmitter, PLC receiver...) will be used at lab scale to measure the frequency of meter readings in both scenarios.
6.6 UC6: MV&LV Load Forecast Two KPIs have been defined in this case:
LV Load/generation forecaster (LVLGF)
BASIC KPI INFORMATION
KPI Name LV Load/Generation Forecaster KPI ID LVLGF
Main Objective Evaluate the accuracy of the load/generation forecasts for the predefined prediction horizons on the LV network.
KPI Description
The KPI evaluates the deviation between the forecasted values and the corresponding measurements for the load/generation when becoming available. This is a measure for the reliability of the applied forecasting method as a function of the considered forecast horizons. This provides an error measure for the variance of the considered load/generation prediction horizons in the field
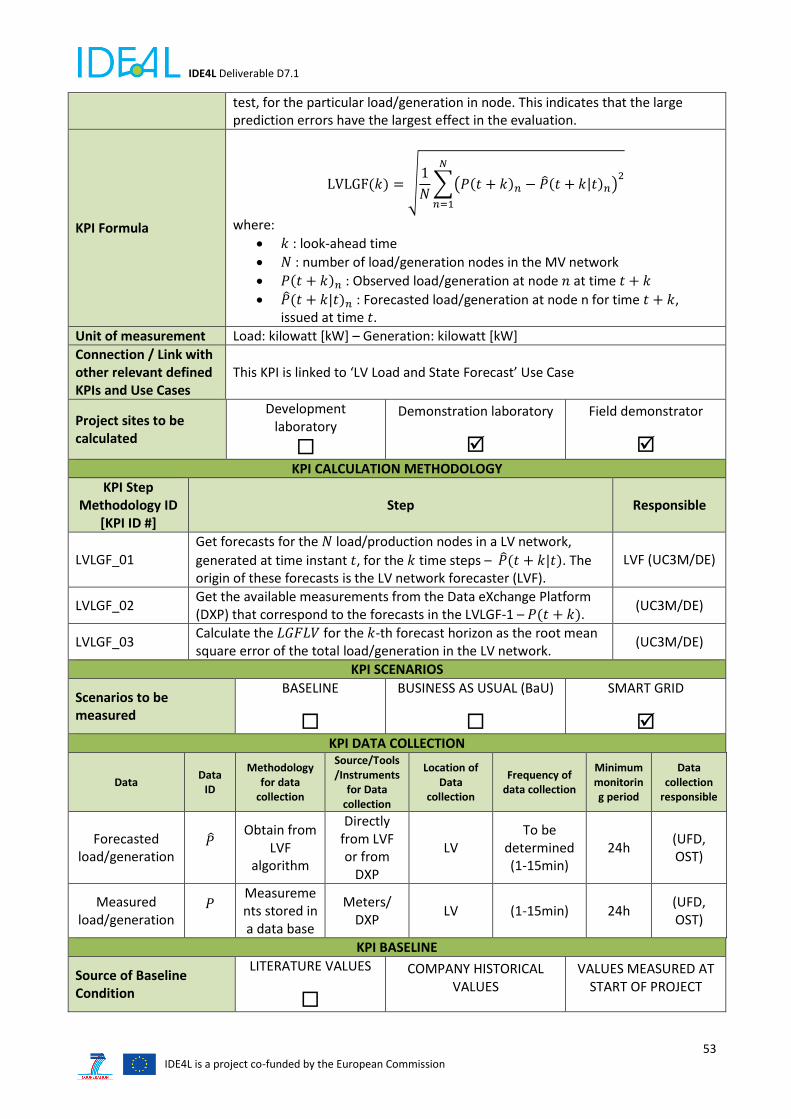
IDE4L Deliverable D7.1
53 IDE4L is a project co-funded by the European Commission
test, for the particular load/generation in node. This indicates that the large prediction errors have the largest effect in the evaluation.
KPI Formula
LVLGF(𝑘) = √1
𝑁∑(𝑃(𝑡 + 𝑘)𝑛 − �̂�(𝑡 + 𝑘|𝑡)𝑛)
2𝑁
𝑛=1
where:
𝑘 : look-ahead time
𝑁 : number of load/generation nodes in the MV network
𝑃(𝑡 + 𝑘)𝑛 : Observed load/generation at node 𝑛 at time 𝑡 + 𝑘
�̂�(𝑡 + 𝑘|𝑡)𝑛 : Forecasted load/generation at node n for time 𝑡 + 𝑘, issued at time 𝑡.
Unit of measurement Load: kilowatt [kW] – Generation: kilowatt [kW]
Connection / Link with other relevant defined KPIs and Use Cases
This KPI is linked to ‘LV Load and State Forecast’ Use Case
Project sites to be calculated
Development laboratory
Demonstration laboratory
Field demonstrator
KPI CALCULATION METHODOLOGY
KPI Step Methodology ID
[KPI ID #] Step Responsible
LVLGF_01 Get forecasts for the 𝑁 load/production nodes in a LV network,
generated at time instant 𝑡, for the 𝑘 time steps – �̂�(𝑡 + 𝑘|𝑡). The origin of these forecasts is the LV network forecaster (LVF).
LVF (UC3M/DE)
LVLGF_02 Get the available measurements from the Data eXchange Platform (DXP) that correspond to the forecasts in the LVLGF-1 – 𝑃(𝑡 + 𝑘).
(UC3M/DE)
LVLGF_03 Calculate the 𝐿𝐺𝐹𝐿𝑉 for the 𝑘-th forecast horizon as the root mean square error of the total load/generation in the LV network.
(UC3M/DE)
KPI SCENARIOS
Scenarios to be measured
BASELINE
BUSINESS AS USUAL (BaU)
SMART GRID
KPI DATA COLLECTION
Data Data ID
Methodology for data
collection
Source/Tools/Instruments
for Data collection
Location of Data
collection
Frequency of data collection
Minimum monitoring period
Data collection
responsible
Forecasted load/generation
�̂� Obtain from
LVF algorithm
Directly from LVF or from
DXP
LV To be
determined (1-15min)
24h (UFD, OST)
Measured load/generation
𝑃 Measurements stored in a data base
Meters/ DXP
LV (1-15min) 24h (UFD, OST)
KPI BASELINE
Source of Baseline Condition
LITERATURE VALUES
COMPANY HISTORICAL VALUES
VALUES MEASURED AT START OF PROJECT
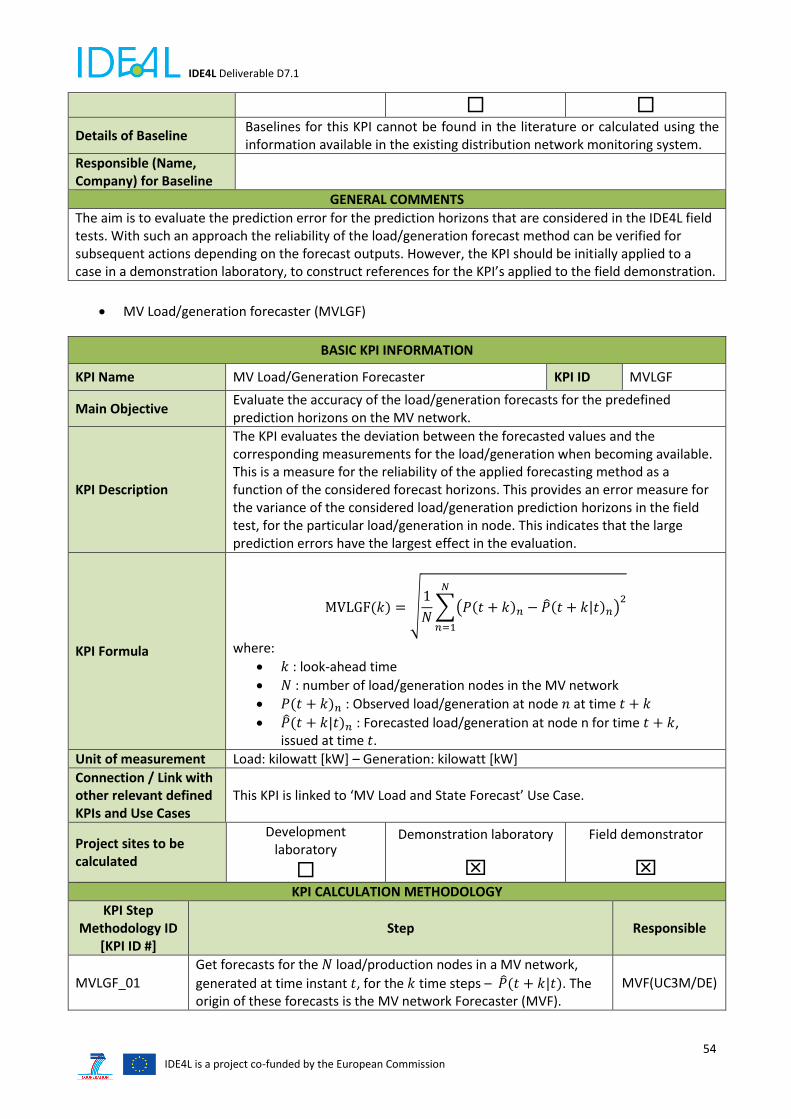
IDE4L Deliverable D7.1
54 IDE4L is a project co-funded by the European Commission
Details of Baseline Baselines for this KPI cannot be found in the literature or calculated using the information available in the existing distribution network monitoring system.
Responsible (Name, Company) for Baseline
GENERAL COMMENTS
The aim is to evaluate the prediction error for the prediction horizons that are considered in the IDE4L field tests. With such an approach the reliability of the load/generation forecast method can be verified for subsequent actions depending on the forecast outputs. However, the KPI should be initially applied to a case in a demonstration laboratory, to construct references for the KPI’s applied to the field demonstration.
MV Load/generation forecaster (MVLGF)
BASIC KPI INFORMATION
KPI Name MV Load/Generation Forecaster KPI ID MVLGF
Main Objective Evaluate the accuracy of the load/generation forecasts for the predefined prediction horizons on the MV network.
KPI Description
The KPI evaluates the deviation between the forecasted values and the corresponding measurements for the load/generation when becoming available. This is a measure for the reliability of the applied forecasting method as a function of the considered forecast horizons. This provides an error measure for the variance of the considered load/generation prediction horizons in the field test, for the particular load/generation in node. This indicates that the large prediction errors have the largest effect in the evaluation.
KPI Formula
MVLGF(𝑘) = √1
𝑁∑(𝑃(𝑡 + 𝑘)𝑛 − �̂�(𝑡 + 𝑘|𝑡)𝑛)
2𝑁
𝑛=1
where:
𝑘 : look-ahead time
𝑁 : number of load/generation nodes in the MV network
𝑃(𝑡 + 𝑘)𝑛 : Observed load/generation at node 𝑛 at time 𝑡 + 𝑘
�̂�(𝑡 + 𝑘|𝑡)𝑛 : Forecasted load/generation at node n for time 𝑡 + 𝑘, issued at time 𝑡.
Unit of measurement Load: kilowatt [kW] – Generation: kilowatt [kW]
Connection / Link with other relevant defined KPIs and Use Cases
This KPI is linked to ‘MV Load and State Forecast’ Use Case.
Project sites to be calculated
Development laboratory
Demonstration laboratory
Field demonstrator
KPI CALCULATION METHODOLOGY
KPI Step Methodology ID
[KPI ID #] Step Responsible
MVLGF_01
Get forecasts for the 𝑁 load/production nodes in a MV network,
generated at time instant 𝑡, for the 𝑘 time steps – �̂�(𝑡 + 𝑘|𝑡). The origin of these forecasts is the MV network Forecaster (MVF).
MVF(UC3M/DE)

IDE4L Deliverable D7.1
55 IDE4L is a project co-funded by the European Commission
MVLGF_02 Get the available measurements from the Data eXchange Platform (DXP) that correspond to the forecasts in the MVLGF-1 – 𝑃(𝑡 + 𝑘).
(UC3M/DE)
MVLGF_03 Calculate the 𝑀𝑉𝐿𝐺𝐹 for the 𝑘-th forecast horizon as the root mean square error of the total load/generation in the MV network.
(UC3M/DE)
KPI SCENARIOS
Scenarios to be measured
BASELINE
BUSINESS AS USUAL (BaU)
SMART GRID
KPI DATA COLLECTION
Data Data ID
Methodology for data
collection
Source/Tools/Instruments
for Data collection
Location of Data
collection
Frequency of data collection
Minimum monitoring period
Data collection
responsible
Forecasted load/generation
�̂� Obtain from
MVF algorithm
Directly from MVF
or from DXP
MV To be
determined (1-15min)
24h
Measured load/generation
𝑃 Measurements stored in a data base
Meters/ DXP
MV (1-15min) 24h
KPI BASELINE
Source of Baseline Condition
LITERATURE VALUES
COMPANY HISTORICAL VALUES
VALUES MEASURED AT START OF PROJECT
Details of Baseline Baselines for this KPI cannot be found in the literature or calculated using the information available in the existing distribution network monitoring system.
Responsible (Name, Company) for Baseline
GENERAL COMMENTS
The aim is to evaluate the prediction error for the prediction horizons that are considered in the IDE4L field tests. With such an approach the reliability of the load/generation forecast method can be verified for subsequent actions depending on the forecast outputs. However, the KPI should be initially applied to a case in a demonstration laboratory, to construct references for the KPI’s applied to the field demonstration.
6.7 UC7: MV&LV State Forecast In order to evaluate this Use Case, two KPIs are defined:
LV State forecaster (LVSF)
BASIC KPI INFORMATION
KPI Name LV state forecaster KPI ID LVSF
Main Objective Evaluate the accuracy of the state forecasts for the predetermined prediction horizons on the LV network.
KPI Description The KPI evaluates the performance of the short-term state forecasts by considering the deviation between the estimated states and corresponding state forecasts.
KPI Formula
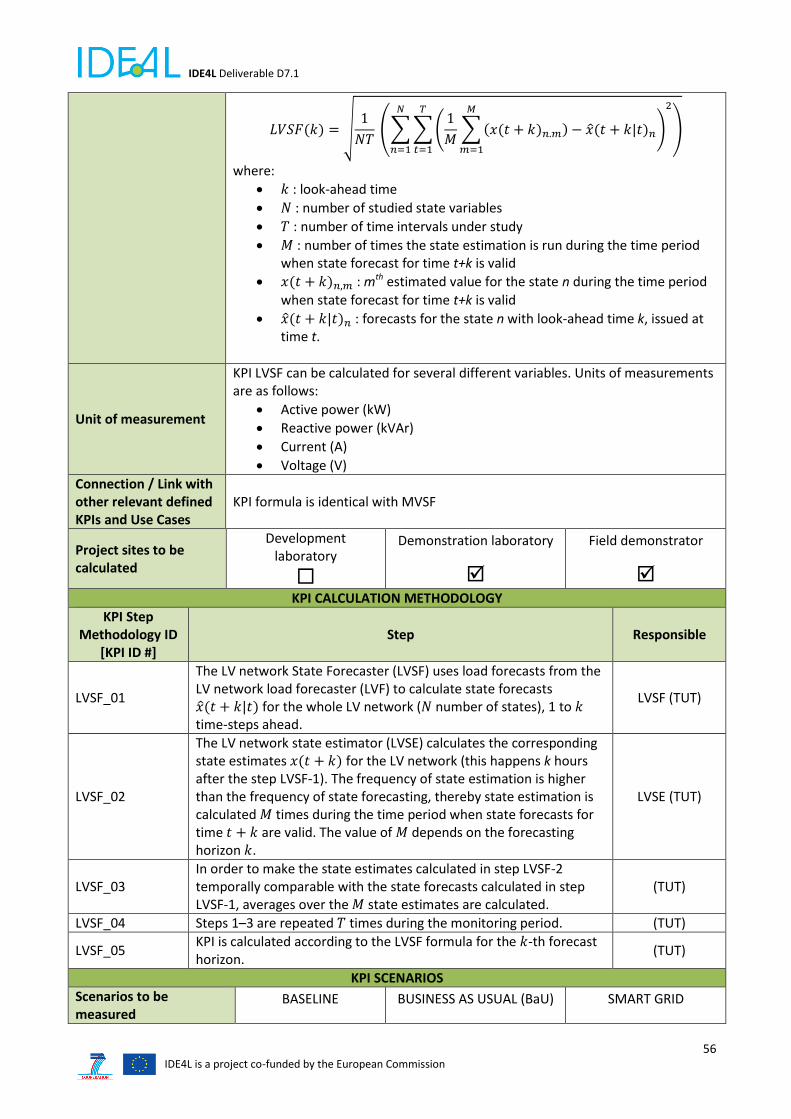
IDE4L Deliverable D7.1
56 IDE4L is a project co-funded by the European Commission
𝐿𝑉𝑆𝐹(𝑘) = √1
𝑁𝑇 (∑ ∑ (
1
𝑀∑ (𝑥(𝑡 + 𝑘)𝑛.𝑚)
𝑀
𝑚=1
− 𝑥(𝑡 + 𝑘|𝑡)𝑛)
𝑇
𝑡=1
2𝑁
𝑛=1
)
where:
𝑘 : look-ahead time
𝑁 : number of studied state variables
𝑇 : number of time intervals under study
𝑀 : number of times the state estimation is run during the time period when state forecast for time t+k is valid
𝑥(𝑡 + 𝑘)𝑛,𝑚 : mth estimated value for the state n during the time period when state forecast for time t+k is valid
𝑥(𝑡 + 𝑘|𝑡)𝑛 : forecasts for the state n with look-ahead time k, issued at time t.
Unit of measurement
KPI LVSF can be calculated for several different variables. Units of measurements are as follows:
Active power (kW)
Reactive power (kVAr)
Current (A)
Voltage (V)
Connection / Link with other relevant defined KPIs and Use Cases
KPI formula is identical with MVSF
Project sites to be calculated
Development laboratory
Demonstration laboratory
Field demonstrator
KPI CALCULATION METHODOLOGY
KPI Step Methodology ID
[KPI ID #] Step Responsible
LVSF_01
The LV network State Forecaster (LVSF) uses load forecasts from the LV network load forecaster (LVF) to calculate state forecasts 𝑥(𝑡 + 𝑘|𝑡) for the whole LV network (𝑁 number of states), 1 to 𝑘 time-steps ahead.
LVSF (TUT)
LVSF_02
The LV network state estimator (LVSE) calculates the corresponding state estimates 𝑥(𝑡 + 𝑘) for the LV network (this happens k hours after the step LVSF-1). The frequency of state estimation is higher than the frequency of state forecasting, thereby state estimation is calculated 𝑀 times during the time period when state forecasts for time 𝑡 + 𝑘 are valid. The value of 𝑀 depends on the forecasting horizon 𝑘.
LVSE (TUT)
LVSF_03 In order to make the state estimates calculated in step LVSF-2 temporally comparable with the state forecasts calculated in step LVSF-1, averages over the 𝑀 state estimates are calculated.
(TUT)
LVSF_04 Steps 1–3 are repeated 𝑇 times during the monitoring period. (TUT)
LVSF_05 KPI is calculated according to the LVSF formula for the 𝑘-th forecast horizon.
(TUT)
KPI SCENARIOS
Scenarios to be measured
BASELINE BUSINESS AS USUAL (BaU) SMART GRID

IDE4L Deliverable D7.1
57 IDE4L is a project co-funded by the European Commission
KPI DATA COLLECTION
Data Data
ID
Methodology for data
collection
Source/Tools/Instruments
for Data collection
Location of Data
collection
Frequency of data collection
Minimum monitoring period
Data collection
responsible
LV network state estimates
𝑥 Calculation LVSE
function LV DXP 1 min 1 week
(TUT, UFD, OST)
LV network state forecasts
𝑥 Calculation LVSF
function LV DXP 10 min 1 week
(TUT, UFD, OST)
KPI values 𝐿𝑉𝑆𝐹 Calculation LVSF script local once - (TUT,
UFD, OST)
KPI BASELINE
Source of Baseline Condition
LITERATURE VALUES
COMPANY HISTORICAL VALUES
VALUES MEASURED AT START OF PROJECT
Details of Baseline Baselines for this KPI cannot be found in the literature or calculated using the information available in the existing distribution network monitoring system.
Responsible (Name, Company) for Baseline
GENERAL COMMENTS
This KPI provides a performance index for state forecasting accuracy. The performance index is calculated as a function of look-ahead time. The forecasted states are compared with estimated states instead of actual measured states. This is because in field demonstrations all states are not measured and measurement data can contain errors. Measurement errors are detected and filtered during the state estimation process. Therefore, the estimated state values are the best possible estimates we have on our disposal. During laboratory demonstration it would also be possible to use real measured values but then the LVSF’s would not be comparable with LVSF’s calculated during field demonstrations. LVSF can be calculated for single (N=1) or multiple (N>1) state variables and for different types of state variables. During IDE4L project, LVSF will be calculated for the following cases with multiple state variables:
1) customer connection point voltages 2) customer connection point power flows 3) line currents (all lines within LV network).
Three cases with different types of variables are calculated because the results of LVSF are utilized for a variety of purposes, and although these variables are interconnected, separate accuracy indices for different variables help us to evaluate the effect of forecasting errors on specific control functions (e.g. voltage control). LVSFs for individual state variables will be calculated only if a special need to study them arises during simulations or demonstrations. The forecasting horizon can be as long as 48 hours and is divided into time intervals of unequal length. For the first couple of hours the forecasts are made with high resolution (e.g. 10 minutes) but after that the forecasts are made on an hourly basis. The state estimation is run several times during one hour (e.g. once a minute). Therefore, average values over the forecasting window (e.g. 10 min or 1 h) must be calculated so that the state estimates can be compared with the state forecasts. Distribution network calculation software and practices vary from country to country and utility to utility.

IDE4L Deliverable D7.1
58 IDE4L is a project co-funded by the European Commission
Therefore it is impossible to define one universal business-as-usual case for state forecasting. To our knowledge there is no automatic state forecasting in existing network calculation or management software. However, Finnish DNOs for example have possibility to initiate manually LV network load flow calculation for any given hour in the future. This calculation utilises customer class load profiles. This could be considered as rudimental state forecasting. The DNOs participating in field demonstrations do not have this possibility and therefore the baseline and business-as-usual performance indices are not calculated for LV state forecasting. In addition to the above defined LVSF index, another important performance metric for LV network state forecasting is the state forecasting function execution time which is measured separately.
MV State forecaster (MVSF)
BASIC KPI INFORMATION
KPI Name MV state forecaster KPI ID MVSF
Main Objective Evaluate the accuracy of the state forecasts for the predetermined prediction horizons on the MV network.
KPI Description The KPI evaluates the performance of the short-term state forecasts by considering the deviation between the estimated states and corresponding state forecasts.
KPI Formula
𝑀𝑉𝑆𝐹(𝑘) = √1
𝑁𝑇 (∑ ∑ (
1
𝑀∑ (𝑥(𝑡 + 𝑘)𝑛.𝑚)
𝑀
𝑚=1
− 𝑥(𝑡 + 𝑘|𝑡)𝑛)
𝑇
𝑡=1
2𝑁
𝑛=1
)
where:
𝑘 : look-ahead time
𝑁 : number of studied state variables
𝑇 : number of time intervals under study
𝑀 : number of times the state estimation is run during the time period when state forecast for time t+k is valid
𝑥(𝑡 + 𝑘)𝑛,𝑚 : mth estimated value for the state n during the time period when state forecast for time t+k is valid
𝑥(𝑡 + 𝑘|𝑡)𝑛 : forecasts for the state n with look-ahead time k, issued at time t.
Unit of measurement
KPI MVSF can be calculated for several different variables. Units of measurements are as follows:
Active power (kW)
Reactive power (kVAr)
Current (A)
Voltage (V)
Connection / Link with other relevant defined KPIs and Use Cases
KPI formula is identical with LVSF This KPI is linked to ‘MV Load and State Forecast’ Use Case
Project sites to be calculated
Development laboratory
Demonstration laboratory Field demonstrator
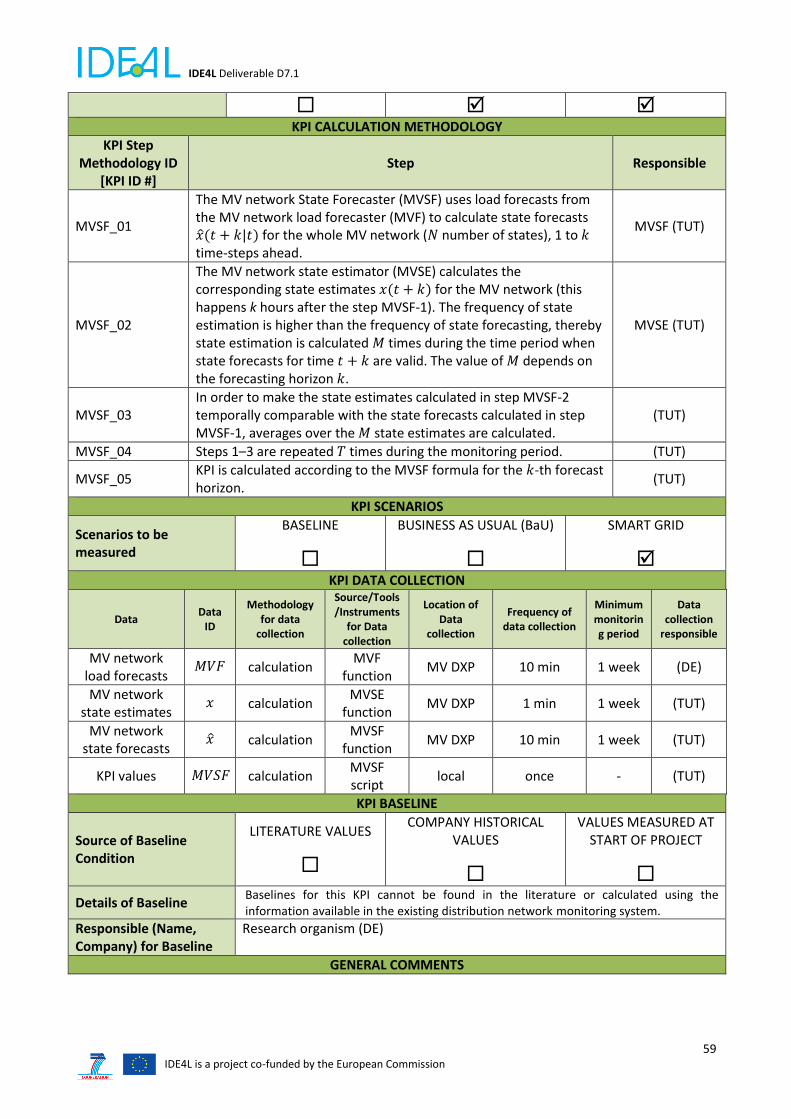
IDE4L Deliverable D7.1
59 IDE4L is a project co-funded by the European Commission
KPI CALCULATION METHODOLOGY
KPI Step Methodology ID
[KPI ID #] Step Responsible
MVSF_01
The MV network State Forecaster (MVSF) uses load forecasts from the MV network load forecaster (MVF) to calculate state forecasts 𝑥(𝑡 + 𝑘|𝑡) for the whole MV network (𝑁 number of states), 1 to 𝑘 time-steps ahead.
MVSF (TUT)
MVSF_02
The MV network state estimator (MVSE) calculates the corresponding state estimates 𝑥(𝑡 + 𝑘) for the MV network (this happens k hours after the step MVSF-1). The frequency of state estimation is higher than the frequency of state forecasting, thereby state estimation is calculated 𝑀 times during the time period when state forecasts for time 𝑡 + 𝑘 are valid. The value of 𝑀 depends on the forecasting horizon 𝑘.
MVSE (TUT)
MVSF_03 In order to make the state estimates calculated in step MVSF-2 temporally comparable with the state forecasts calculated in step MVSF-1, averages over the 𝑀 state estimates are calculated.
(TUT)
MVSF_04 Steps 1–3 are repeated 𝑇 times during the monitoring period. (TUT)
MVSF_05 KPI is calculated according to the MVSF formula for the 𝑘-th forecast horizon.
(TUT)
KPI SCENARIOS
Scenarios to be measured
BASELINE
BUSINESS AS USUAL (BaU)
SMART GRID
KPI DATA COLLECTION
Data Data ID
Methodology for data
collection
Source/Tools/Instruments
for Data collection
Location of Data
collection
Frequency of data collection
Minimum monitoring period
Data collection
responsible
MV network load forecasts
𝑀𝑉𝐹 calculation MVF
function MV DXP 10 min 1 week (DE)
MV network state estimates
𝑥 calculation MVSE
function MV DXP 1 min 1 week (TUT)
MV network state forecasts
𝑥 calculation MVSF
function MV DXP 10 min 1 week (TUT)
KPI values 𝑀𝑉𝑆𝐹 calculation MVSF script
local once - (TUT)
KPI BASELINE
Source of Baseline Condition
LITERATURE VALUES
COMPANY HISTORICAL VALUES
VALUES MEASURED AT START OF PROJECT
Details of Baseline Baselines for this KPI cannot be found in the literature or calculated using the information available in the existing distribution network monitoring system.
Responsible (Name, Company) for Baseline
Research organism (DE)
GENERAL COMMENTS
IDE4L Deliverable D7.1
60 IDE4L is a project co-funded by the European Commission
This KPI provides a performance index for state forecasting accuracy. The performance index is calculated as a function of look-ahead time. The forecasted states are compared with estimated states instead of actual measured states. This is because in field demonstrations all states are not measured and measurement data can contain errors. Measurement errors are detected and filtered during the state estimation process. Therefore, the estimated state values are the best possible estimates we have on our disposal. During laboratory demonstration it would also be possible to use real measured values but then the MVSF’s would not be comparable with MVSF’s calculated during field demonstrations. MVSF can be calculated for single (N=1) or multiple (N>1) state variables and for different types of state variables. During IDE4L project, MVSF will be calculated for the following cases with multiple state variables:
1) customer connection point voltages 2) customer connection point power flows 3) line currents (all lines within LV network).
Three cases with different types of variables are calculated because the results of MVSF are utilized for a variety of purposes, and although these variables are interconnected, separate accuracy indices for different variables help us to evaluate the effect of forecasting errors on specific control functions (e.g. voltage control). MVSFs for individual state variables will be calculated only if a special need to study them arises during simulations or demonstrations. The forecasting horizon can be as long as 48 hours and is divided into time intervals of unequal length. For the first couple of hours the forecasts are made with high resolution (e.g. 10 minutes) but after that the forecasts are made on an hourly basis. The state estimation is run several times during one hour (e.g. once a minute). Therefore, average values over the forecasting window (e.g. 10 min or 1 h) must be calculated so that the state estimates can be compared with the state forecasts. Distribution network calculation software and practices vary from country to country and utility to utility. Therefore it is impossible to define one universal business-as-usual case for state forecasting. To our knowledge there is no automatic state forecasting in existing network calculation or management software. However, Finnish DNOs for example have possibility to manually initiate MV network load flow calculation for any given hour in the future. This calculation utilises customer class load profiles. This could be considered as rudimental state forecasting. The DNOs participating in field demonstrations do not have this possibility and therefore baseline and business-as-usual performance indices are not calculated for MV state forecasting. In addition to the above defined MVSF index, another important performance metric for MV network state forecasting is the state forecasting function execution time which is measured separately.
6.8 UC8: Network Description Update One KPI has been defined to evaluate this Use Case:
Network Description Update (NDU)
BASIC KPI INFORMATION
KPI Name Network Description Update KPI ID NDU

IDE4L Deliverable D7.1
61 IDE4L is a project co-funded by the European Commission
Main Objective Evaluation of the percentage of the grid which can be actually managed by using WP5-like algorithms
KPI Description
Assuming that there isn’t any tool to align the central database which contains overall description of the network and the distributed DBs located in PSs and SSs. Each change in the network (new customer connected, changing of cables, new substation, new PV, etc.) implies that an entire area cannot be managed by WP5-like algorithms (State Estimation, Power Flow Control, etc.) which rely on the accurate description of the network topology. Summing the average number of changes per year per type, we can estimate the percentage of the grid which can be actually managed by IDE4L features.
KPI Formula
This KPI is evaluated by using historical data about changes on the network description.
As an example, the impact due to changes related to new customers in one year can be determined in the following way:
𝑵𝑫𝑼 =𝒁
𝑲∗ 𝟏𝟎𝟎
Where:
Z: Average number of feeders which have new customers in one year
K: Total number of feeders present in the network
And Z can be calculated as:
𝒁 =𝑿
𝒀
Where:
X: Number of new customers in one year
Y: Average number of new customers per feeder in one year
This KPI provides:
the average percentage of LV feeder which cannot be managed by WP5-
like algorithms due to new customers activated in one year
Unit of measurement %
Connection / Link with other relevant defined KPIs and Use Cases
This KPI is linked to ‘Network Description Update’ Use Case
Project sites to be calculated
Development laboratory
Integration laboratory
Demonstration laboratory
Field demonstrator
KPI CALCULATION METHODOLOGY
KPI Step Methodology ID
[KPI ID #] Step Responsible
NDU_01 Collect the average number of new customers in one year (X) and the average number of new customers per each feeder in one year (Y)
Responsible of each field demo

IDE4L Deliverable D7.1
62 IDE4L is a project co-funded by the European Commission
NDU_02
Calculate the average number of feeders which have new customers in one year (Z)
𝒁 =𝑿
𝒀
Responsible of each field demo
NDU_03
Calculate the NDU KPI due to new customers as:
𝑵𝑫𝑼 =𝒁
𝑲∗ 𝟏𝟎𝟎
Responsible of each field demo
KPI SCENARIOS
Scenarios to be measured
BASELINE
BUSINESS AS USUAL (BaU)
SMART GRID
KPI DATA COLLECTION
Data Data ID Methodolog
y for data collection
Source/Tools/Instruments
for Data collection
Location of Data
collection
Frequency of data collection
Minimum monitoring period
Data collection
responsible
Number of new customers in
one year
X
Provided by each
field demonstra
tor
Excel Excel Once //
Responsible of each
field demo
Average number of new
customers per feeder in one
year
Y
Provided by each
field demonstra
tor
Excel Excel Once //
Responsible of each
field demo
Total number of feeders present in the network
K
Provided by each
field demonstra
tor
Excel Excel Once //
Responsible of each
field demo
KPI BASELINE
Source of Baseline Condition
LITERATURE VALUES
COMPANY HISTORICAL VALUES
VALUES MEASURED AT START OF PROJECT
Details of Baseline Data needed to evaluate the KPI can be collected in a “single-shot”.
Responsible (Name, Company) for Baseline
DSO (A2A)
GENERAL COMMENTS
Further considerations (not included in the KPI itself) could be:
- If we invest E € per LV feeder to setup WP5-like algorithms - And we have Y LV feeders - The over-cost for the installation is
𝑬 ∗ 𝒀 €
- Because of the mismatch about the topology description we are wasting:

IDE4L Deliverable D7.1
63 IDE4L is a project co-funded by the European Commission
𝑾 = 𝑬 ∗ 𝒀 ∗ 𝑷 €𝒚𝒆𝒂𝒓⁄
6.9 UC9: Protection Configuration Update One KPI has been defined to evaluate this Use Case:
Protection Configuration Update (PCU)
BASIC KPI INFORMATION
KPI Name Protection Configuration Update KPI ID PCU
Main Objective Evaluation the percentage of the grid which can be actually managed by using WP4-like algorithms
KPI Description
Assuming that there isn’t any tool to align the central database which contains overall description of the automation system DBs located in PSs and SSs. Each change in the network configuration (e.g. after a fault) implies that an entire area cannot be managed by WP4-like algorithms (FLISR, etc.) which rely on the accurate description of the network configuration, maximum current calculation, and a coordination amongst the IEDs. Summing the average number of changes per year, we can estimate the percentage of the grid which can be actually managed by IDE4L features
KPI Formula
This KPI is evaluated by using historical data about changing on the network description.
As an example, the impact due to changes related to MV network configuration in one year can be determined in the following way:
𝑷𝑪𝑼 =𝟐 ∗ 𝑿
𝒀∗ 𝟏𝟎𝟎
Where:
X: Average number of changes in the MV network configuration per year
Y: Total number of MV feeders present in the network
Hyp:
Consider that when the MV network configuration changes in average 2
feeders are involved, so 2*X is the number of MV feeders involved in one
year in MV network reconfigurations
This KPI provides:
The average percentage of MV feeders which cannot be managed by
WP4-like algorithms due to network reconfigurations in one year
Unit of measurement %
Connection / Link with other relevant defined KPIs and Use Cases
This KPI is linked to ‘Protection Configuration Update’ Use Case
Project sites to be Development Integration Demonstration Field
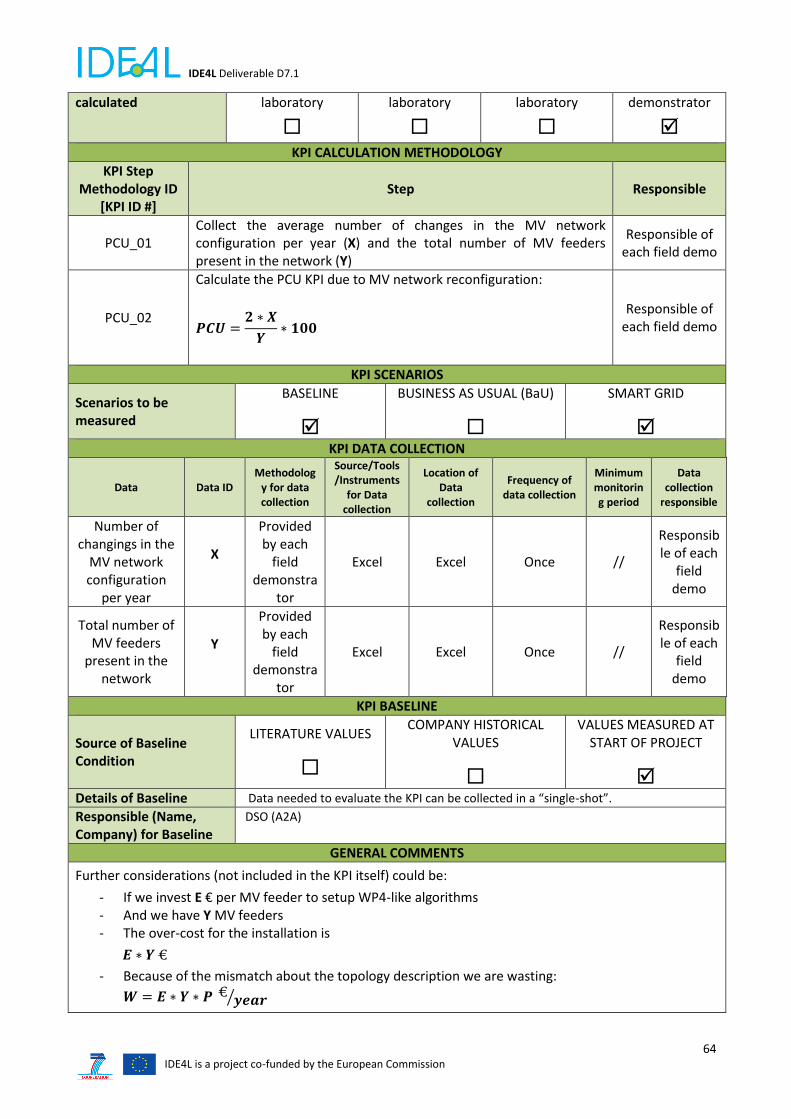
IDE4L Deliverable D7.1
64 IDE4L is a project co-funded by the European Commission
calculated laboratory
laboratory
laboratory
demonstrator
KPI CALCULATION METHODOLOGY
KPI Step Methodology ID
[KPI ID #] Step Responsible
PCU_01 Collect the average number of changes in the MV network configuration per year (X) and the total number of MV feeders present in the network (Y)
Responsible of each field demo
PCU_02
Calculate the PCU KPI due to MV network reconfiguration:
𝑷𝑪𝑼 =𝟐 ∗ 𝑿
𝒀∗ 𝟏𝟎𝟎
Responsible of each field demo
KPI SCENARIOS
Scenarios to be measured
BASELINE
BUSINESS AS USUAL (BaU)
SMART GRID
KPI DATA COLLECTION
Data Data ID Methodolog
y for data collection
Source/Tools/Instruments
for Data collection
Location of Data
collection
Frequency of data collection
Minimum monitoring period
Data collection
responsible
Number of changings in the
MV network configuration
per year
X
Provided by each
field demonstra
tor
Excel Excel Once //
Responsible of each
field demo
Total number of MV feeders
present in the network
Y
Provided by each
field demonstra
tor
Excel Excel Once //
Responsible of each
field demo
KPI BASELINE
Source of Baseline Condition
LITERATURE VALUES
COMPANY HISTORICAL VALUES
VALUES MEASURED AT START OF PROJECT
Details of Baseline Data needed to evaluate the KPI can be collected in a “single-shot”.
Responsible (Name, Company) for Baseline
DSO (A2A)
GENERAL COMMENTS
Further considerations (not included in the KPI itself) could be:
- If we invest E € per MV feeder to setup WP4-like algorithms - And we have Y MV feeders - The over-cost for the installation is
𝑬 ∗ 𝒀 €
- Because of the mismatch about the topology description we are wasting:
𝑾 = 𝑬 ∗ 𝒀 ∗ 𝑷 €𝒚𝒆𝒂𝒓⁄
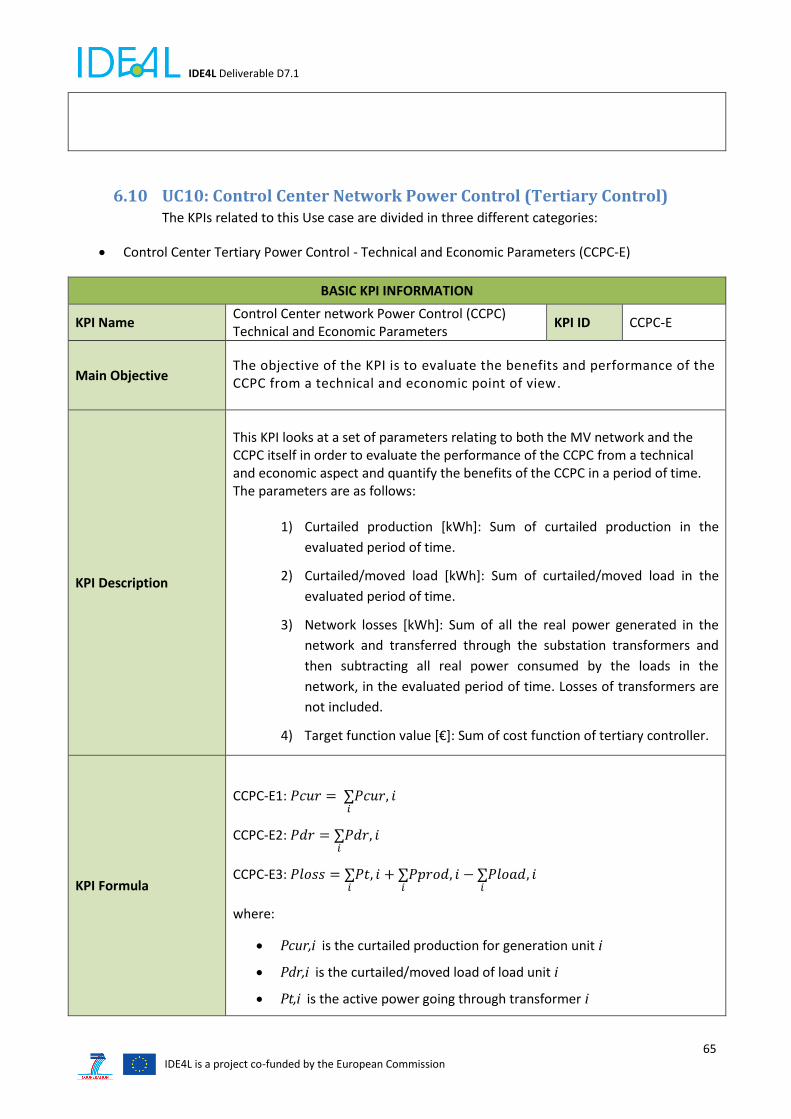
IDE4L Deliverable D7.1
65 IDE4L is a project co-funded by the European Commission
6.10 UC10: Control Center Network Power Control (Tertiary Control) The KPIs related to this Use case are divided in three different categories:
Control Center Tertiary Power Control - Technical and Economic Parameters (CCPC-E)
BASIC KPI INFORMATION
KPI Name Control Center network Power Control (CCPC) Technical and Economic Parameters
KPI ID CCPC-E
Main Objective
The objective of the KPI is to evaluate the benefits and performance of the CCPC from a technical and economic point of view.
KPI Description
This KPI looks at a set of parameters relating to both the MV network and the CCPC itself in order to evaluate the performance of the CCPC from a technical and economic aspect and quantify the benefits of the CCPC in a period of time. The parameters are as follows:
1) Curtailed production [kWh]: Sum of curtailed production in the
evaluated period of time.
2) Curtailed/moved load [kWh]: Sum of curtailed/moved load in the
evaluated period of time.
3) Network losses [kWh]: Sum of all the real power generated in the
network and transferred through the substation transformers and
then subtracting all real power consumed by the loads in the
network, in the evaluated period of time. Losses of transformers are
not included.
4) Target function value [€]: Sum of cost function of tertiary controller.
KPI Formula
CCPC-E1: 𝑃𝑐𝑢𝑟 = ∑𝑖
𝑃𝑐𝑢𝑟, 𝑖
CCPC-E2: 𝑃𝑑𝑟 = ∑𝑖
𝑃𝑑𝑟, 𝑖
CCPC-E3: 𝑃𝑙𝑜𝑠𝑠 = ∑𝑖
𝑃𝑡, 𝑖 + ∑𝑖
𝑃𝑝𝑟𝑜𝑑, 𝑖 − ∑𝑖
𝑃𝑙𝑜𝑎𝑑, 𝑖
where:
Pcur,i is the curtailed production for generation unit i
Pdr,i is the curtailed/moved load of load unit i
Pt,i is the active power going through transformer i
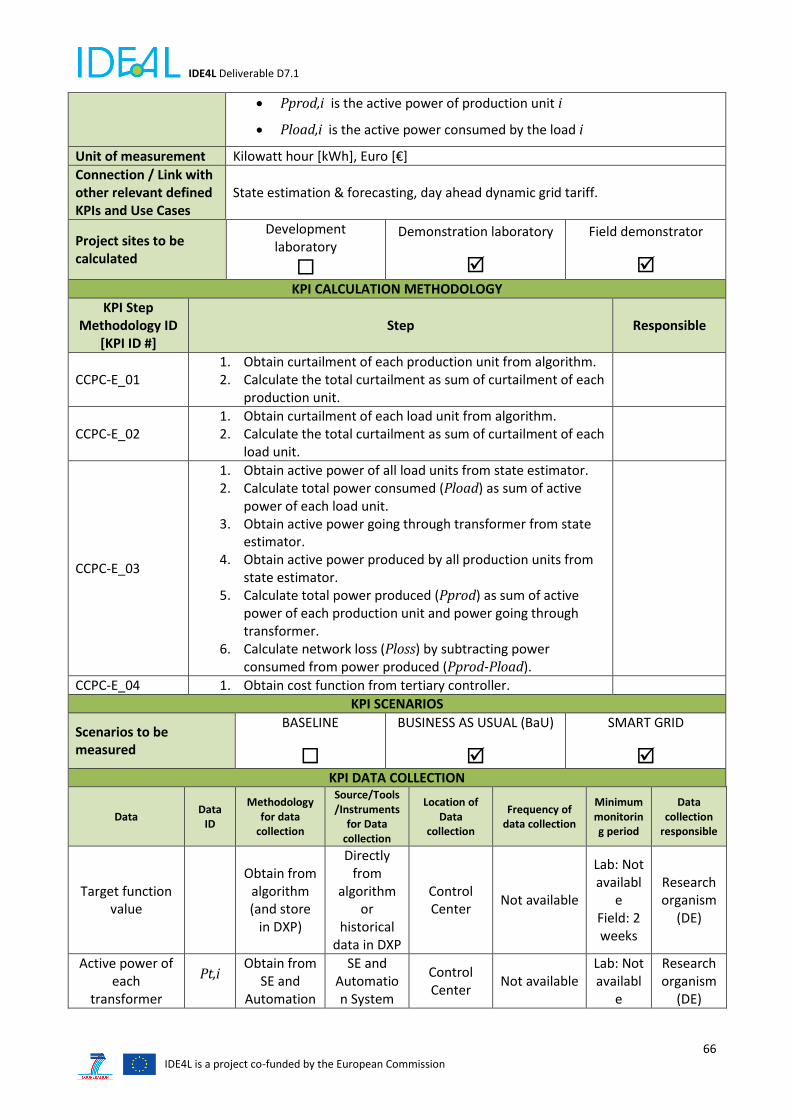
IDE4L Deliverable D7.1
66 IDE4L is a project co-funded by the European Commission
Pprod,i is the active power of production unit i
Pload,i is the active power consumed by the load i
Unit of measurement Kilowatt hour [kWh], Euro [€]
Connection / Link with other relevant defined KPIs and Use Cases
State estimation & forecasting, day ahead dynamic grid tariff.
Project sites to be calculated
Development laboratory
Demonstration laboratory
Field demonstrator
KPI CALCULATION METHODOLOGY
KPI Step Methodology ID
[KPI ID #] Step Responsible
CCPC-E_01 1. Obtain curtailment of each production unit from algorithm. 2. Calculate the total curtailment as sum of curtailment of each
production unit.
CCPC-E_02 1. Obtain curtailment of each load unit from algorithm. 2. Calculate the total curtailment as sum of curtailment of each
load unit.
CCPC-E_03
1. Obtain active power of all load units from state estimator. 2. Calculate total power consumed (Pload) as sum of active
power of each load unit. 3. Obtain active power going through transformer from state
estimator. 4. Obtain active power produced by all production units from
state estimator. 5. Calculate total power produced (Pprod) as sum of active
power of each production unit and power going through transformer.
6. Calculate network loss (Ploss) by subtracting power consumed from power produced (Pprod-Pload).
CCPC-E_04 1. Obtain cost function from tertiary controller.
KPI SCENARIOS
Scenarios to be measured
BASELINE
BUSINESS AS USUAL (BaU)
SMART GRID
KPI DATA COLLECTION
Data Data ID
Methodology for data
collection
Source/Tools/Instruments
for Data collection
Location of Data
collection
Frequency of data collection
Minimum monitoring period
Data collection
responsible
Target function value
Obtain from algorithm (and store
in DXP)
Directly from
algorithm or
historical data in DXP
Control Center
Not available
Lab: Not availabl
e Field: 2 weeks
Research organism
(DE)
Active power of each
transformer
Pt,i Obtain from
SE and Automation
SE and Automation System
Control Center
Not available Lab: Not availabl
e
Research organism
(DE)

IDE4L Deliverable D7.1
67 IDE4L is a project co-funded by the European Commission
System (through
DXP)
(through DXP)
Field: 2 weeks
Active power of each node
Pi
Obtain from SE and
Automation System
(through DXP)
SE and Automation System (through
DXP)
Control Center
Not available
Lab: Not availabl
e Field: 2 weeks
Research organism
(DE)
KPI BASELINE
Source of Baseline Condition
LITERATURE VALUES
COMPANY HISTORICAL VALUES
VALUES MEASURED AT START OF PROJECT
Details of Baseline
Responsible (Name, Company) for Baseline
Research organism (DE)
GENERAL COMMENTS
Control schemes used in tests: 1. Base case: No control. 2. Non-market case: Tertiary control without market integration (directly controlled DER only). In this
case, DER is either owned by DSO or under a bilateral contract that allows the DSO to control it directly.
3. Market case: Tertiary control with market integration (dynamic grid tariff, indirectly controlled DER).
Test setup:
Network reconfiguration: Tertiary controller uses network reconfiguration algorithm to find the optimal configuration for the MV network.
Network reconfiguration with directly controlled DER: Tertiary controller uses network reconfiguration algorithm to find the optimal configuration for the MV network and then applies power limits and voltage references to the secondary controllers (MVPC/LVPC).
Dynamic tariff: Tertiary controller applies a dynamic grid tariff to avoid network congestion. This test setup goes together with DADT KPI, where the setup is described in more detail.
DSO asking to buy flexibility services in the market The 4 parameters described before are calculated for the purpose of comparing results of the different test
sequences.
Control Center Tertiary Power Control - Operational Parameters (CCPC-O)
BASIC KPI INFORMATION
KPI Name Control Center network Power Control (CCPC) Operational Parameters
KPI ID CCPC-O
Main Objective
The objective of the KPI is to evaluate the operational performance of the CCPC.
KPI Description

IDE4L Deliverable D7.1
68 IDE4L is a project co-funded by the European Commission
This KPI looks at a set of technical parameters relating to both the MV network and the CCPC itself in order to evaluate the performance of the CCPC from an operational aspect and quantify the benefits of the CCPC in a period of time. The operational parameters are:
1) Average algorithm execution time [s]: Average of tertiary controller
execution time.
2) Alerts [pcs]: Alerts (maximum iterations reached, not converged, etc.) of
tertiary control algorithm.
3) OLTC steps taken [pcs]: Number of OLTC step actions.
4) P set point changes [pcs]: Number of active power set point changes.
5) Q set point changes [pcs]: Number of reactive power set point changes.
6) V set point changes [pcs]: Number of voltage set point changes.
7) Switch activations [pcs]: Number of times a switch is closed or opened.
8) Capacity utilization [%]: Average loading of each electrical component (line/transformer).
KPI Formula
Capacity utilization of each line/transformer can be obtained through:
CCPC-O8:
For transformers: 𝐶𝑎𝑝𝑎𝑐𝑖𝑡𝑦 𝑢𝑡𝑖𝑙𝑖𝑧𝑎𝑡𝑖𝑜𝑛𝑖 =𝑆𝑎𝑣𝑔,𝑖
𝑆𝑛𝑜𝑚,𝑖⋅ 100%
For lines: 𝐶𝑎𝑝𝑎𝑐𝑖𝑡𝑦 𝑢𝑡𝑖𝑙𝑖𝑧𝑎𝑡𝑖𝑜𝑛𝑖 =𝐼𝑎𝑣𝑔,𝑖𝑗
𝐼𝑛𝑜𝑚,𝑖𝑗⋅ 100%
where
Savg,i is the average loading of transformer i
Snom,i is the nominal rating of transformer i
Iavg,ij is the average amplitude of the complex current in line i
Inom,ij is the nominal current rating of line i
Unit of measurement Seconds [s], pieces/count/number of [pcs], Percent [%]
Connection / Link with other relevant defined KPIs and Use Cases
State estimation & forecasting, day ahead dynamic grid tariff.
Project sites to be calculated
Development laboratory
Demonstration laboratory
Field demonstrator
KPI CALCULATION METHODOLOGY
KPI Step Methodology ID
[KPI ID #] Step Responsible
CCPC-O_01 1. Obtain the execution time of algorithm at each time point
from algorithm. 2. Calculate the average execution time.
CCPC-O_02 1. Count number of alerts.
CCPC-O_03
1. Obtain state of tap changer at each time point. 2. Find the number of OLTC step actions. 3. ALT: Count number of OLTC step actions (e.g. obtain it from
algorithm or measurement).

IDE4L Deliverable D7.1
69 IDE4L is a project co-funded by the European Commission
CCPC-O_04
1. Obtain active power setpoint at each time point. 2. Find number of active power setpoint changes. 3. ALT: Count number of active power setpoint changes (e.g.
obtain it from algorithm or measurement).
CCPC-O_05
1. Obtain reactive power setpoint at each time point. 2. Find number of reactive power setpoint changes. 3. ALT: Count number of reactive power setpoint changes (e.g.
obtain it from algorithm or measurement).
CCPC-O_06
1. Obtain voltage setpoint at each time point. 2. Find number of voltage setpoint changes. 3. ALT: Count number of voltage setpoint changes (e.g. obtain
it from algorithm or measurement).
CCPC-O_07
1. Obtain switch states at each time point. 2. Find number of times a switch is closed or opened. 3. ALT: Count number of times a switch is closed or opened
(e.g. obtain it from algorithm or measurement).
CCPC-O_08
1. Obtain loading of each transformer in kVA at each time point.
2. Calculate average loading (Savg) of each transformer in kVA. 3. Find relative average loading of each transformer (in %) by
dividing the average loading with nominal rating and multiplying by 100 (Savg/Snom*100).
4. Obtain loading of each line in A at each time point. 5. Calculate average loading (Iavg) of each line in A. 6. Find relative average loading of each line (in %) by dividing
the average loading with nominal rating and multiplying by 100 (Iavg/Inom*100).
KPI SCENARIOS
Scenarios to be measured
BASELINE
BUSINESS AS USUAL (BaU)
SMART GRID
KPI DATA COLLECTION
Data Data ID
Methodology for data
collection
Source/Tools/Instruments
for Data collection
Location of Data
collection
Frequency of data collection
Minimum monitoring period
Data collection
responsible
Execution time
Measure in algorithm (and store
in DXP)
Directly from
algorithm or
historical data in DXP
Control Center
Every timestep
Lab: Not availabl
e Field: 2 weeks
Alerts
Store alerts in DXP or
count alerts in algorithm
Historical data in DXP or directly
from algorithm
Control Center
Not available
Lab: Not availabl
e Field: 2 weeks
OLTC steps
Obtain from measureme
nt system/logs
or count
Historical data from measurem
ents or directly
Control Center
Every timestep
Lab: Not availabl
e Field: 2 weeks

IDE4L Deliverable D7.1
70 IDE4L is a project co-funded by the European Commission
steps in algorithm
from algorithm
Active/reactive power setpoint
Store setpoints in
DXP or count
changes in algorithm
Historical data in DXP or directly
from algorithm
Control Center
Every timestep
Lab: Not availabl
e Field: 2 weeks
Voltage setpoint
Store setpoints in
DXP or count
changes in algorithm
Historical data in DXP or directly
from algorithm
Control Center
Every timestep
Lab: Not availabl
e Field: 2 weeks
Switch activations
Obtain from measureme
nt system/logs
or count activations
in algorithm
Historical data from measurem
ents or directly
from algorithm
Control Center
Every timestep
Lab: Not availabl
e Field: 2 weeks
Apparent power of each
transformer
St,i
Obtain from SE and
Automation System
(through DXP)
SE and Automation System (through
DXP)
Control Center
Every timestep
Lab: Not availabl
e Field: 2 weeks
Amplitude of complex current
of each line
Iij
Obtain from SE and
Automation System
(through DXP)
SE and Automation System (through
DXP)
Control Center
Every timestep
Lab: Not availabl
e Field: 2 weeks
KPI BASELINE
Source of Baseline Condition
LITERATURE VALUES
COMPANY HISTORICAL VALUES
VALUES MEASURED AT START OF PROJECT
Details of Baseline
Responsible (Name, Company) for Baseline
GENERAL COMMENTS
Control schemes used in tests: 1. Base case: No control. 2. Non-market case: Tertiary control without market integration (directly controlled DER only). In this
case, DER is either owned by DSO or under a bilateral contract that allows the DSO to control it directly.
3. Market case: Tertiary control with market integration (dynamic grid tariff, indirectly controlled DER).
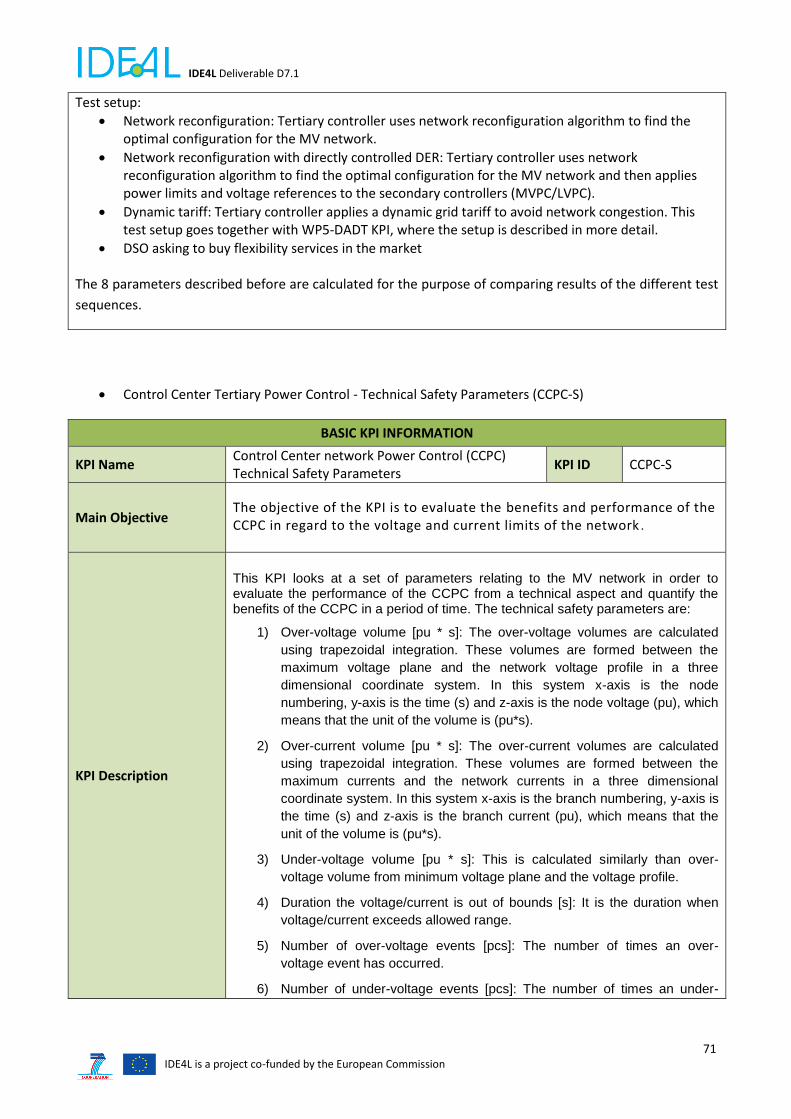
IDE4L Deliverable D7.1
71 IDE4L is a project co-funded by the European Commission
Test setup:
Network reconfiguration: Tertiary controller uses network reconfiguration algorithm to find the optimal configuration for the MV network.
Network reconfiguration with directly controlled DER: Tertiary controller uses network reconfiguration algorithm to find the optimal configuration for the MV network and then applies power limits and voltage references to the secondary controllers (MVPC/LVPC).
Dynamic tariff: Tertiary controller applies a dynamic grid tariff to avoid network congestion. This test setup goes together with WP5-DADT KPI, where the setup is described in more detail.
DSO asking to buy flexibility services in the market The 8 parameters described before are calculated for the purpose of comparing results of the different test
sequences.
Control Center Tertiary Power Control - Technical Safety Parameters (CCPC-S)
BASIC KPI INFORMATION
KPI Name Control Center network Power Control (CCPC) Technical Safety Parameters
KPI ID CCPC-S
Main Objective
The objective of the KPI is to evaluate the benefits and performance of the CCPC in regard to the voltage and current limits of the network .
KPI Description
This KPI looks at a set of parameters relating to the MV network in order to evaluate the performance of the CCPC from a technical aspect and quantify the benefits of the CCPC in a period of time. The technical safety parameters are:
1) Over-voltage volume [pu * s]: The over-voltage volumes are calculated
using trapezoidal integration. These volumes are formed between the
maximum voltage plane and the network voltage profile in a three
dimensional coordinate system. In this system x-axis is the node
numbering, y-axis is the time (s) and z-axis is the node voltage (pu), which
means that the unit of the volume is (pu*s).
2) Over-current volume [pu * s]: The over-current volumes are calculated
using trapezoidal integration. These volumes are formed between the
maximum currents and the network currents in a three dimensional
coordinate system. In this system x-axis is the branch numbering, y-axis is
the time (s) and z-axis is the branch current (pu), which means that the
unit of the volume is (pu*s).
3) Under-voltage volume [pu * s]: This is calculated similarly than over-
voltage volume from minimum voltage plane and the voltage profile.
4) Duration the voltage/current is out of bounds [s]: It is the duration when
voltage/current exceeds allowed range.
5) Number of over-voltage events [pcs]: The number of times an over-
voltage event has occurred.
6) Number of under-voltage events [pcs]: The number of times an under-

IDE4L Deliverable D7.1
72 IDE4L is a project co-funded by the European Commission
voltage event has occurred.
7) Number of over-current events [pcs]: The number of times an over-current
event has occurred.
KPI Formula
CCPC-S1: ∑𝑖
∫ max (0, 𝑈𝑖 − 𝑈𝑚𝑎𝑥)
CCPC-S2: ∑𝑖𝑗
∫ max (0, 𝐼𝑖𝑗 − 𝐼𝑚𝑎𝑥, 𝑖𝑗)
CCPC-S3: ∑𝑖
∫ max (0, 𝑈𝑚𝑖𝑛 − 𝑈𝑖)
Unit of measurement Seconds [s], per unit times seconds [pu * s]
Connection / Link with other relevant defined KPIs and Use Cases
State estimation & forecasting, day ahead dynamic grid tariff.
Project sites to be calculated
Development laboratory
Demonstration laboratory
Field demonstrator
KPI CALCULATION METHODOLOGY
KPI Step Methodology ID
[KPI ID #] Step Responsible
CCPC-S_01
1. Obtain voltage at each node (Ui) from state estimator. 2. If voltage is higher than Umax, obtain voltage violation (Uvi)
by subtracting Umax from the node voltage (Ui-Umax). 3. Find the overvoltage area of each node by integrating the
voltage violation of each node (Uvi) with respect to time. 4. Calculate the overvoltage volume as the sum of all
overvoltage areas.
CCPC-S_02
1. Obtain current in each line (Iij) from state estimator. 2. If the current in a line (Iij) is higher than the max allowed
current in that line (Imax,ij), obtain current violation (Ivij) by subtracting max allowed current from line current (Iij-Imax,ij).
3. Find the overcurrent area of each line by integrating the current violation of each line (Ivij) with respect to time.
4. Calculate the overcurrent volume as the sum of all overcurrent areas.
CCPC-S_03
1. Obtain voltage at each node (Ui) from state estimator. 2. If voltage is lower than Umin, obtain voltage violation (Uvi)
by subtracting the node voltage from Umin (Umin-Ui). 3. Find the undervoltage area of each node by integrating the
voltage violation of each node (Uvi) with respect to time. 4. Calculate the undervoltage volume as the sum of all
undervoltage areas.
CCPC-S_04
1. Obtain all time points in which voltage or current is out of bounds (all time instances with over/undervoltage or overcurrent).
2. Calculate the total duration as the number of time points multiplied with the time resolution in seconds.
CCPC-S_05 1. Obtain all time points in which overvoltage was detected.

IDE4L Deliverable D7.1
73 IDE4L is a project co-funded by the European Commission
2. Find the number of overvoltage events. 3. ALT: Count number of overvoltage events (e.g. obtain it
from algorithm or measurement).
CCPC-S_06
1. Obtain all time points in which undervoltage was detected. 2. Find the number of undervoltage events. 3. ALT: Count number of undervoltage events (e.g. obtain it
from algorithm or measurement).
CCPC-S_07
1. Obtain all time points in which overcurrent was detected. 2. Find the number of overcurrent events. 3. ALT: Count number of overcurrent events (e.g. obtain it
from algorithm or measurement).
KPI SCENARIOS
Scenarios to be measured
BASELINE
BUSINESS AS USUAL (BaU)
SMART GRID
KPI DATA COLLECTION
Data Data
ID
Methodology for data
collection
Source/Tools/Instruments
for Data collection
Location of Data
collection
Frequency of data collection
Minimum monitoring period
Data collection
responsible
Voltage of each node
Ui
Obtain from SE and
Automation System
(through DXP)
SE and Automation System (through
DXP)
Control Center
Not available
Lab: Not availabl
e Field: 2 weeks
Research organism
(DE)
Current of each line
Iij
Obtain from SE and
Automation System
(through DXP)
SE and Automation System (through
DXP)
Control Center
Not available
Lab: Not availabl
e Field: 2 weeks
Research organism
(DE)
KPI BASELINE
Source of Baseline Condition
LITERATURE VALUES
COMPANY HISTORICAL VALUES
VALUES MEASURED AT START OF PROJECT
Details of Baseline
Responsible (Name, Company) for Baseline
Research organism (DE)
GENERAL COMMENTS
Control schemes used in tests: 1. Base case: No control. 2. Non-market case: Tertiary control without market integration (directly controlled DER only). In this
case, DER is either owned by DSO or under a bilateral contract that allows the DSO to control it directly.
3. Market case: Tertiary control with market integration (dynamic grid tariff, indirectly controlled DER).
Test setup:
Network reconfiguration: Tertiary controller uses network reconfiguration algorithm to find the

IDE4L Deliverable D7.1
74 IDE4L is a project co-funded by the European Commission
optimal configuration for the MV network.
Network reconfiguration with directly controlled DER: Tertiary controller uses network reconfiguration algorithm to find the optimal configuration for the MV network and then applies power limits and voltage references to the secondary controllers (MVPC/LVPC).
Dynamic tariff: Tertiary controller applies a dynamic grid tariff to avoid network congestion. This test setup goes together with WP5-DADT KPI, where the setup is described in more detail.
DSO asking to buy flexibility services in the market The 7 parameters described before are calculated for the purpose of comparing results of the different test
sequences.
6.11 UC11: LV Network Power Control (Secondary control) The KPIs related to this Use case are divided in three different categories:
LV Network Power Control - Technical and Economic Parameters (LVPC-E)
BASIC KPI INFORMATION
KPI Name Low Voltage network Power Control (LVPC) Technical and Economic Parameters
KPI ID LVPC-E
Main Objective
The objective of the KPI is to evaluate the benefits and performance of the LVPC from a technical and economic point of view.
KPI Description
This KPI looks at a set of parameters relating to the LV network in order to
evaluate the performance of the LVPC from a technical and economic aspect and
quantify the benefits of the LVPC in a period of time. The parameters are as
follows:
1) Curtailed production [kWh]: Sum of curtailed production in the evaluated
period of time.
2) Network losses [kWh]: Sum of all the real power generated in the
network and transferred through the substation transformer and then
subtracting all real power consumed by the loads in the network in the
evaluated period of time. Losses of transformer are not included.
3) Target function value [€]: Sum of cost function of secondary controller.
KPI Formula
LVPC-E1: 𝑃𝑐𝑢𝑟 = ∑𝑖
𝑃𝑐𝑢𝑟, 𝑖
LVPC-E2: 𝑃𝑙𝑜𝑠𝑠 = 𝑃𝑡 + ∑𝑖
𝑃𝑝𝑟𝑜𝑑, 𝑖 − ∑𝑖
𝑃𝑙𝑜𝑎𝑑, 𝑖
where:
Pcur,i is the curtailed production for generation unit i Pt is the active power going through the transformer
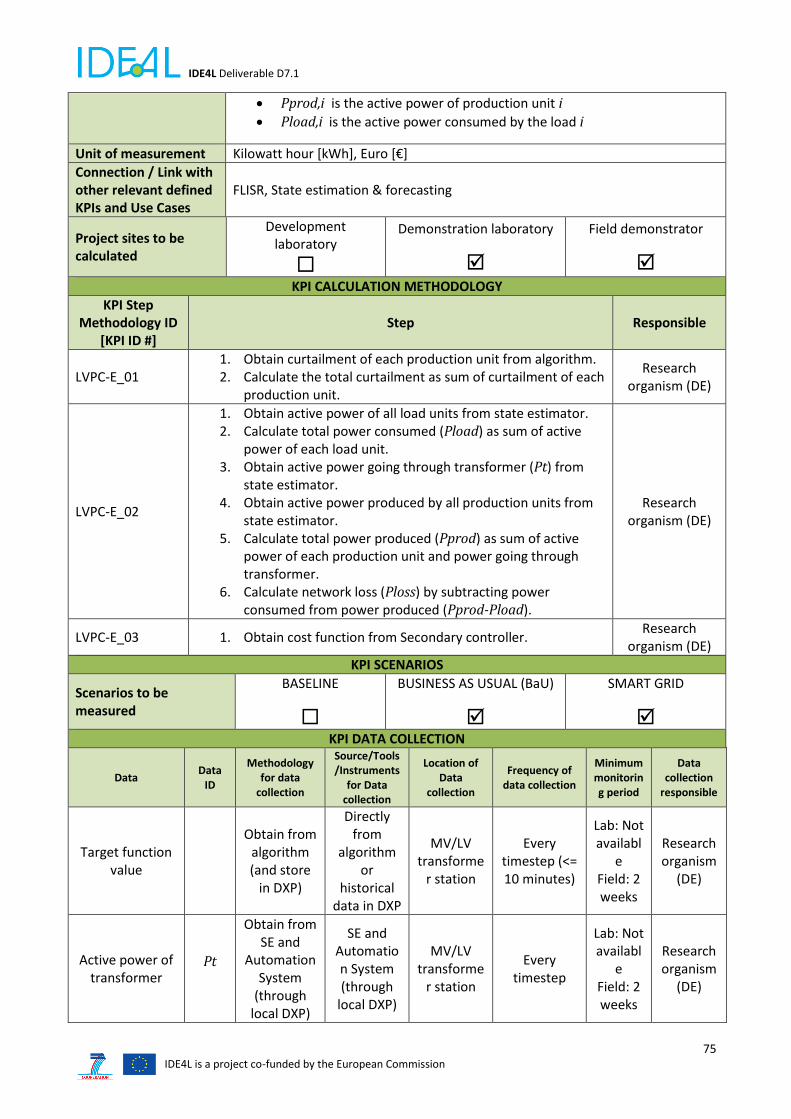
IDE4L Deliverable D7.1
75 IDE4L is a project co-funded by the European Commission
Pprod,i is the active power of production unit i
Pload,i is the active power consumed by the load i
Unit of measurement Kilowatt hour [kWh], Euro [€]
Connection / Link with other relevant defined KPIs and Use Cases
FLISR, State estimation & forecasting
Project sites to be calculated
Development laboratory
Demonstration laboratory
Field demonstrator
KPI CALCULATION METHODOLOGY
KPI Step Methodology ID
[KPI ID #] Step Responsible
LVPC-E_01 1. Obtain curtailment of each production unit from algorithm. 2. Calculate the total curtailment as sum of curtailment of each
production unit.
Research organism (DE)
LVPC-E_02
1. Obtain active power of all load units from state estimator. 2. Calculate total power consumed (Pload) as sum of active
power of each load unit. 3. Obtain active power going through transformer (Pt) from
state estimator. 4. Obtain active power produced by all production units from
state estimator. 5. Calculate total power produced (Pprod) as sum of active
power of each production unit and power going through transformer.
6. Calculate network loss (Ploss) by subtracting power consumed from power produced (Pprod-Pload).
Research organism (DE)
LVPC-E_03 1. Obtain cost function from Secondary controller. Research
organism (DE)
KPI SCENARIOS
Scenarios to be measured
BASELINE
BUSINESS AS USUAL (BaU)
SMART GRID
KPI DATA COLLECTION
Data Data ID
Methodology for data
collection
Source/Tools/Instruments
for Data collection
Location of Data
collection
Frequency of data collection
Minimum monitoring period
Data collection
responsible
Target function value
Obtain from algorithm (and store
in DXP)
Directly from
algorithm or
historical data in DXP
MV/LV transforme
r station
Every timestep (<= 10 minutes)
Lab: Not availabl
e Field: 2 weeks
Research organism
(DE)
Active power of transformer
Pt
Obtain from SE and
Automation System
(through local DXP)
SE and Automation System (through
local DXP)
MV/LV transforme
r station
Every timestep
Lab: Not availabl
e Field: 2 weeks
Research organism
(DE)

IDE4L Deliverable D7.1
76 IDE4L is a project co-funded by the European Commission
Active power of each node
Pi
Obtain from SE and
Automation System
(through local DXP)
SE and Automation System (through
local DXP)
MV/LV transforme
r station
Every timestep
Lab: Not availabl
e Field: 2 weeks
Research organism
(DE)
KPI BASELINE
Source of Baseline Condition
LITERATURE VALUES
COMPANY HISTORICAL VALUES
VALUES MEASURED AT START OF PROJECT
Details of Baseline
Responsible (Name, Company) for Baseline
Research organism (DE)
GENERAL COMMENTS
Control schemes used in tests:
– Base case; no control
– Primary control schemes:
a. Single type of controllers: AVC control, AQR control, AVR control, AVR control with a deadband
b. Combination of two independent primary controllers: AVC and AQR, AVC and AVR, AVC and AVR
with a deadband
– Secondary control schemes
a. CVC control with AQR
b. CVC control with AVR
Controllers:
1. Automatic Voltage Controller (AVC) of the OLTC
2. Automatic Voltage Regulator (AVR) of the DER unit
3. Automatic Reactive power Regulator (AQR) of the DER unit
4. Production curtailment of the DER unit
5. Direct load control (load shedding) of the DER unit
Test setup:
AVC control: The AVC control is realized using an AVC-relay connected to the substation transformer,
which maintains the constant secondary voltage of transformer as close to the reference value as
possible.
AQR control: DER units control the power factor (or reactive power) of their connection points.
AVR control: DER units control the voltage of their connection points.
AVR control with a deadband: AVR control with a deadband the PID controller only changes reactive
power generation or consumption when the connection point voltage is outside of the allowed range
of voltage.
AVC control and AVR control: Combination of two control schemes.
AVC control and AVR control with a deadband: Combination of two control schemes. AVC relay

IDE4L Deliverable D7.1
77 IDE4L is a project co-funded by the European Commission
controlling the OLTC has a deadband to prevent changes of tap position unless the voltage differs
enough from the reference value.
CVC control with AQR: Secondary controller (OPF algorithm) controls the reference values of AVC and
DERs (reactive and real power).
CVC control with AVR: Similarly like previous control scheme, except that AVRs of DER units are
operated in voltage control mode during the delay of OLTC when it is activated by the secondary
controller and for a safety period after the tap change. During this time period the secondary
controller provides the voltage reference for AVR instead of reactive power reference.
The 3 parameters described before are calculated for the purpose of comparing results of the different test
sequences.
LV Network Power Control - Operational Parameters (LVPC-O)
BASIC KPI INFORMATION
KPI Name Low Voltage network Power Control (LVPC) Operational Parameters
KPI ID LVPC-O
Main Objective
The objective of the KPI is to evaluate the operational performance of the LVPC.
KPI Description
This KPI looks at a set of operational parameters relating to the LVPC in order to
evaluate the performance of the LVPC from a technical aspect. The KPI
parameters are as follows:
1) Average algorithm execution time [s]: Average of secondary controller
execution time.
2) Alerts [pcs]: Alerts (maximum iterations reached, not converged, etc.)
of secondary control algorithm.
3) OLTC steps taken [pcs]: Number of OLTC step actions.
4) P set point changes [pcs]: Number of active power set point changes.
5) Q set point changes [pcs]: Number of reactive power set point
changes.
6) V set point changes [pcs]: Number of voltage set point changes.
KPI Formula See general comments
Unit of measurement Seconds [s], pieces/count/number of [pcs]
Connection / Link with other relevant defined KPIs and Use Cases
FLISR, State estimation & forecasting
Project sites to be calculated
Development laboratory
Demonstration laboratory
Field demonstrator
KPI CALCULATION METHODOLOGY
KPI Step Step Responsible

IDE4L Deliverable D7.1
78 IDE4L is a project co-funded by the European Commission
Methodology ID [KPI ID #]
LVPC-O_01 1. Obtain the execution time of algorithm at each time point
from algorithm. 2. Calculate the average execution time.
Research organism (DE)
LVPC-O_02 1. Count number of alerts. Research
organism (DE)
LVPC-O_03
1. Obtain state of tap changer at each time point. 2. Find the number of OLTC step actions. 3. ALT: Count number of OLTC step actions (e.g. obtain it from
algorithm or measurement).
Research organism (DE)
LVPC-O_04
1. Obtain active power setpoint at each time point. 2. Find number of active power setpoint changes. 3. ALT: Count number of active power setpoint changes (e.g.
obtain it from algorithm or measurement).
Research organism (DE)
LVPC-O_05
1. Obtain reactive power setpoint at each time point. 2. Find number of reactive power setpoint changes. 3. ALT: Count number of reactive power setpoint changes (e.g.
obtain it from algorithm or measurement).
Research organism (DE)
LVPC-O_06
1. Obtain voltage setpoint at each time point. 2. Find number of voltage setpoint changes. 3. ALT: Count number of voltage setpoint changes (e.g. obtain
it from algorithm or measurement).
Research organism (DE)
KPI SCENARIOS
Scenarios to be measured
BASELINE
BUSINESS AS USUAL (BaU)
SMART GRID
KPI DATA COLLECTION
Data Data
ID
Methodology for data
collection
Source/Tools/Instruments
for Data collection
Location of Data
collection
Frequency of data collection
Minimum monitoring period
Data collection
responsible
Execution time
Measure in algorithm (and store
in DXP)
Directly from
algorithm or
historical data in DXP
MV/LV transforme
r station
Every timestep (<= 10 minutes)
Lab: Not availabl
e Field: 2 weeks
Research organism
(DE)
Alerts
Store alerts in DXP or
count alerts in algorithm
Historical data in DXP or directly
from algorithm
MV/LV transforme
r station Not available
Lab: Not availabl
e Field: 2 weeks
Research organism
(DE)
OLTC steps
Obtain from measureme
nt system/logs
or count steps in
algorithm
Historical data from measurem
ents or directly
from algorithm
MV/LV transforme
r station
Every timestep
Lab: Not availabl
e Field: 2 weeks
Research organism
(DE)
Active/reactive power setpoint
Store setpoints in
Historical data in DXP
MV/LV transforme
Every timestep
Lab: Not availabl
Research organism

IDE4L Deliverable D7.1
79 IDE4L is a project co-funded by the European Commission
DXP or count
changes in algorithm
or directly from
algorithm
r station e Field: 2 weeks
(DE)
Voltage setpoint
Store setpoints in
DXP or count
changes in algorithm
Historical data in DXP or directly
from algorithm
MV/LV transforme
r station
Every timestep
Lab: Not availabl
e Field: 2 weeks
Research organism
(DE)
KPI BASELINE
Source of Baseline Condition
LITERATURE VALUES
COMPANY HISTORICAL VALUES
VALUES MEASURED AT START OF PROJECT
Details of Baseline
Responsible (Name, Company) for Baseline
Research organism (DE)
GENERAL COMMENTS
Control schemes used in tests:
– Base case; no control
– Primary control schemes:
a. Single type of controllers: AVC control, AQR control, AVR control, AVR control with a deadband
b. Combination of two independent primary controllers: AVC and AQR, AVC and AVR, AVC and AVR
with a deadband
– Secondary control schemes
a. CVC control with AQR
b. CVC control with AVR
Controllers:
1. Automatic Voltage Controller (AVC) of the OLTC
2. Automatic Voltage Regulator (AVR) of the DER unit
3. Automatic Reactive power Regulator (AQR) of the DER unit
4. Production curtailment of the DER unit
5. Direct load control (load shedding) of the DER unit
Test setup:
AVC control: The AVC control is realized using an AVC-relay connected to the substation transformer,
which maintains the constant secondary voltage of transformer as close to the reference value as
possible.
AQR control: DER units control the power factor (or reactive power) of their connection points.
AVR control: DER units control the voltage of their connection points.
AVR control with a deadband: AVR control with a deadband the PID controller only changes reactive
power generation or consumption when the connection point voltage is outside of the allowed range
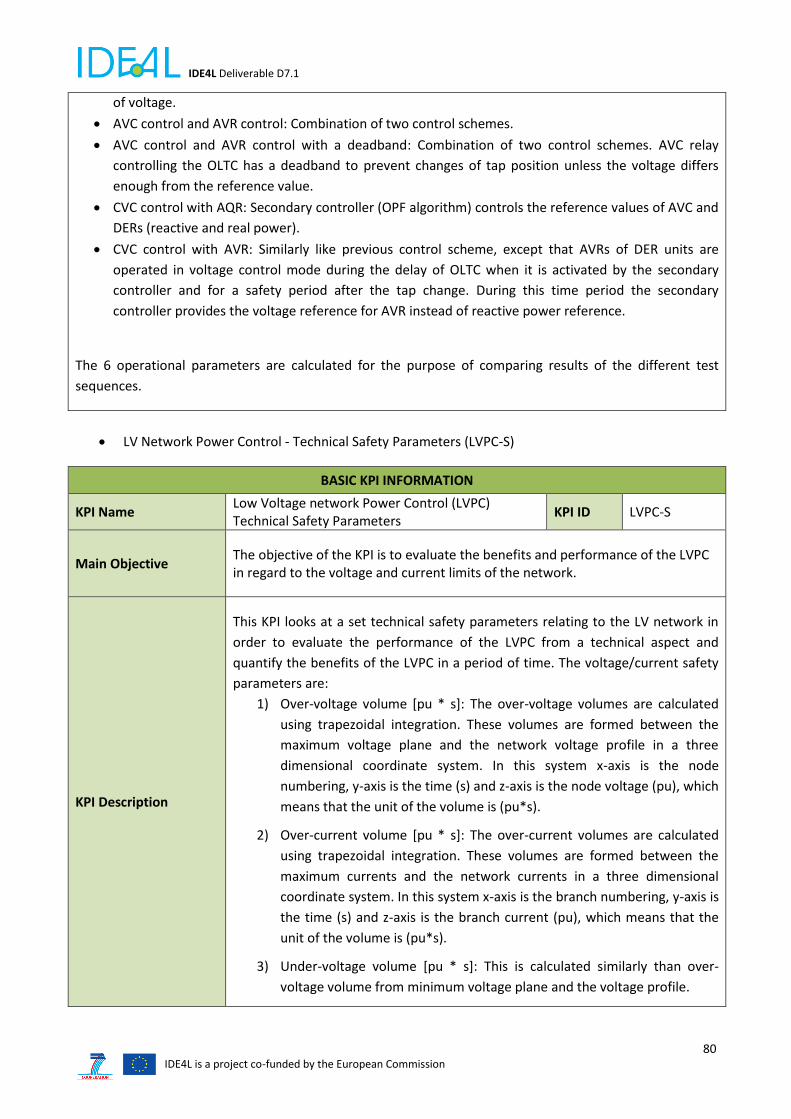
IDE4L Deliverable D7.1
80 IDE4L is a project co-funded by the European Commission
of voltage.
AVC control and AVR control: Combination of two control schemes.
AVC control and AVR control with a deadband: Combination of two control schemes. AVC relay
controlling the OLTC has a deadband to prevent changes of tap position unless the voltage differs
enough from the reference value.
CVC control with AQR: Secondary controller (OPF algorithm) controls the reference values of AVC and
DERs (reactive and real power).
CVC control with AVR: Similarly like previous control scheme, except that AVRs of DER units are
operated in voltage control mode during the delay of OLTC when it is activated by the secondary
controller and for a safety period after the tap change. During this time period the secondary
controller provides the voltage reference for AVR instead of reactive power reference.
The 6 operational parameters are calculated for the purpose of comparing results of the different test
sequences.
LV Network Power Control - Technical Safety Parameters (LVPC-S)
BASIC KPI INFORMATION
KPI Name Low Voltage network Power Control (LVPC) Technical Safety Parameters
KPI ID LVPC-S
Main Objective
The objective of the KPI is to evaluate the benefits and performance of the LVPC in regard to the voltage and current limits of the network.
KPI Description
This KPI looks at a set technical safety parameters relating to the LV network in
order to evaluate the performance of the LVPC from a technical aspect and
quantify the benefits of the LVPC in a period of time. The voltage/current safety
parameters are:
1) Over-voltage volume [pu * s]: The over-voltage volumes are calculated
using trapezoidal integration. These volumes are formed between the
maximum voltage plane and the network voltage profile in a three
dimensional coordinate system. In this system x-axis is the node
numbering, y-axis is the time (s) and z-axis is the node voltage (pu), which
means that the unit of the volume is (pu*s).
2) Over-current volume [pu * s]: The over-current volumes are calculated
using trapezoidal integration. These volumes are formed between the
maximum currents and the network currents in a three dimensional
coordinate system. In this system x-axis is the branch numbering, y-axis is
the time (s) and z-axis is the branch current (pu), which means that the
unit of the volume is (pu*s).
3) Under-voltage volume [pu * s]: This is calculated similarly than over-
voltage volume from minimum voltage plane and the voltage profile.
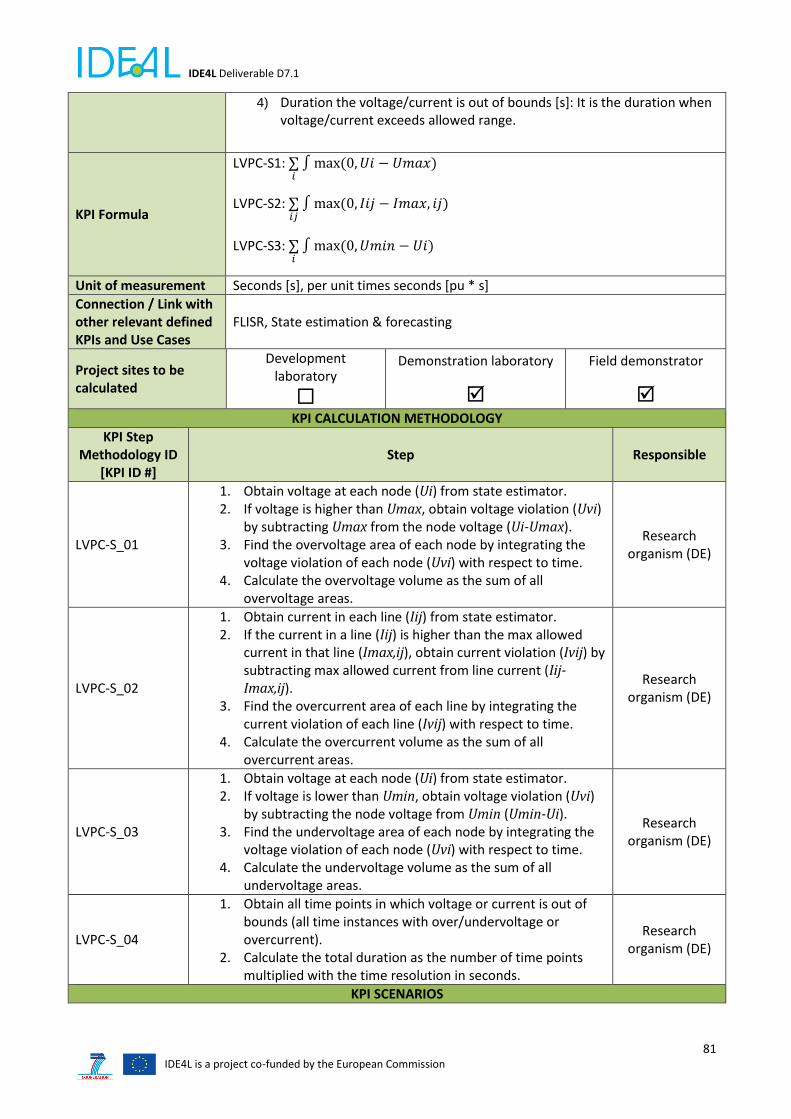
IDE4L Deliverable D7.1
81 IDE4L is a project co-funded by the European Commission
4) Duration the voltage/current is out of bounds [s]: It is the duration when voltage/current exceeds allowed range.
KPI Formula
LVPC-S1: ∑𝑖
∫ max (0, 𝑈𝑖 − 𝑈𝑚𝑎𝑥)
LVPC-S2: ∑𝑖𝑗
∫ max (0, 𝐼𝑖𝑗 − 𝐼𝑚𝑎𝑥, 𝑖𝑗)
LVPC-S3: ∑𝑖
∫ max (0, 𝑈𝑚𝑖𝑛 − 𝑈𝑖)
Unit of measurement Seconds [s], per unit times seconds [pu * s]
Connection / Link with other relevant defined KPIs and Use Cases
FLISR, State estimation & forecasting
Project sites to be calculated
Development laboratory
Demonstration laboratory
Field demonstrator
KPI CALCULATION METHODOLOGY
KPI Step Methodology ID
[KPI ID #] Step Responsible
LVPC-S_01
1. Obtain voltage at each node (Ui) from state estimator. 2. If voltage is higher than Umax, obtain voltage violation (Uvi)
by subtracting Umax from the node voltage (Ui-Umax). 3. Find the overvoltage area of each node by integrating the
voltage violation of each node (Uvi) with respect to time. 4. Calculate the overvoltage volume as the sum of all
overvoltage areas.
Research organism (DE)
LVPC-S_02
1. Obtain current in each line (Iij) from state estimator. 2. If the current in a line (Iij) is higher than the max allowed
current in that line (Imax,ij), obtain current violation (Ivij) by subtracting max allowed current from line current (Iij-Imax,ij).
3. Find the overcurrent area of each line by integrating the current violation of each line (Ivij) with respect to time.
4. Calculate the overcurrent volume as the sum of all overcurrent areas.
Research organism (DE)
LVPC-S_03
1. Obtain voltage at each node (Ui) from state estimator. 2. If voltage is lower than Umin, obtain voltage violation (Uvi)
by subtracting the node voltage from Umin (Umin-Ui). 3. Find the undervoltage area of each node by integrating the
voltage violation of each node (Uvi) with respect to time. 4. Calculate the undervoltage volume as the sum of all
undervoltage areas.
Research organism (DE)
LVPC-S_04
1. Obtain all time points in which voltage or current is out of bounds (all time instances with over/undervoltage or overcurrent).
2. Calculate the total duration as the number of time points multiplied with the time resolution in seconds.
Research organism (DE)
KPI SCENARIOS

IDE4L Deliverable D7.1
82 IDE4L is a project co-funded by the European Commission
Scenarios to be measured
BASELINE
BUSINESS AS USUAL (BaU)
SMART GRID
KPI DATA COLLECTION
Data Data ID
Methodology for data
collection
Source/Tools/Instruments
for Data collection
Location of Data
collection
Frequency of data collection
Minimum monitoring period
Data collection
responsible
Voltage of each node
Ui
Obtain from SE and
Automation System
(through local DXP)
SE and Automation System (through
local DXP)
MV/LV transforme
r station Not available
Lab: Not availabl
e Field: 2 weeks
Research organism
(DE)
Current of each line
Iij
Obtain from SE and
Automation System
(through local DXP)
SE and Automation System (through
local DXP)
MV/LV transforme
r station Not available
Lab: Not availabl
e Field: 2 weeks
Research organism
(DE)
KPI BASELINE
Source of Baseline Condition
LITERATURE VALUES
COMPANY HISTORICAL VALUES
VALUES MEASURED AT START OF PROJECT
Details of Baseline
Responsible (Name, Company) for Baseline
Research organism (DE)
GENERAL COMMENTS
Control schemes used in tests:
– Base case; no control
– Primary control schemes:
a. Single type of controllers: AVC control, AQR control, AVR control, AVR control with a deadband
b. Combination of two independent primary controllers: AVC and AQR, AVC and AVR, AVC and AVR
with a deadband
– Secondary control schemes
a. CVC control with AQR
b. CVC control with AVR
Controllers:
1. Automatic Voltage Controller (AVC) of the OLTC
2. Automatic Voltage Regulator (AVR) of the DER unit
3. Automatic Reactive power Regulator (AQR) of the DER unit
4. Production curtailment of the DER unit
5. Direct load control (load shedding) of the DER unit
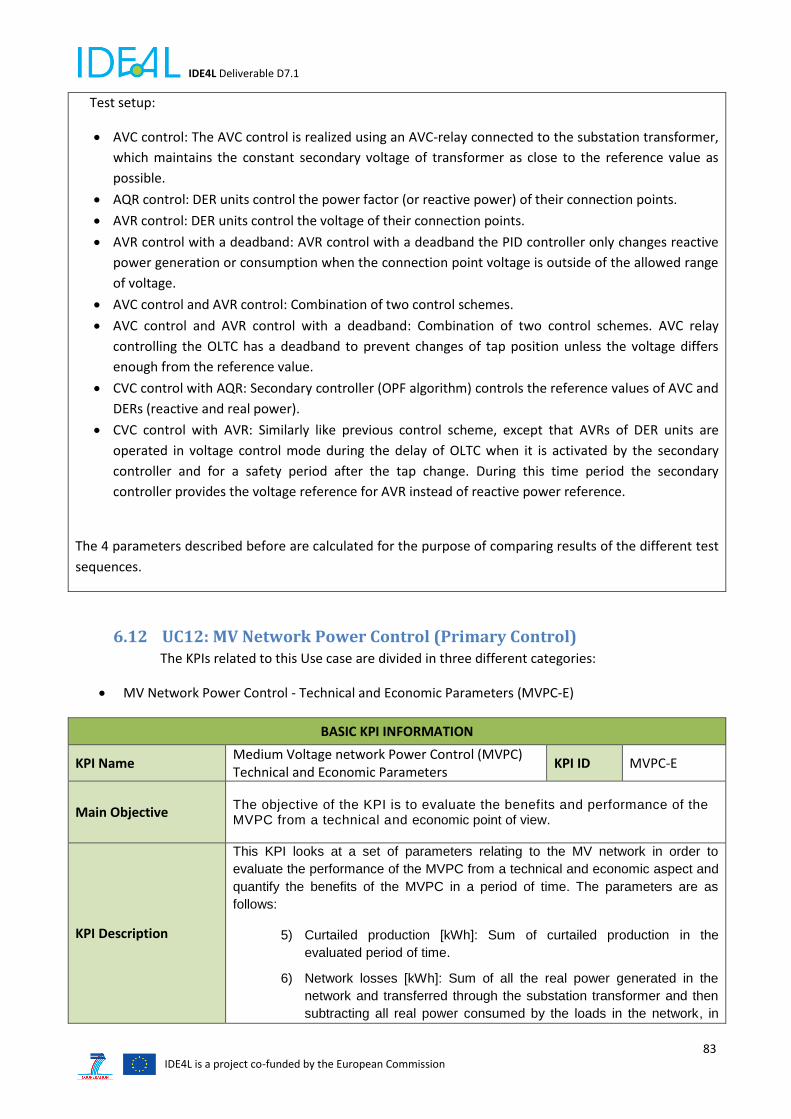
IDE4L Deliverable D7.1
83 IDE4L is a project co-funded by the European Commission
Test setup:
AVC control: The AVC control is realized using an AVC-relay connected to the substation transformer,
which maintains the constant secondary voltage of transformer as close to the reference value as
possible.
AQR control: DER units control the power factor (or reactive power) of their connection points.
AVR control: DER units control the voltage of their connection points.
AVR control with a deadband: AVR control with a deadband the PID controller only changes reactive
power generation or consumption when the connection point voltage is outside of the allowed range
of voltage.
AVC control and AVR control: Combination of two control schemes.
AVC control and AVR control with a deadband: Combination of two control schemes. AVC relay
controlling the OLTC has a deadband to prevent changes of tap position unless the voltage differs
enough from the reference value.
CVC control with AQR: Secondary controller (OPF algorithm) controls the reference values of AVC and
DERs (reactive and real power).
CVC control with AVR: Similarly like previous control scheme, except that AVRs of DER units are
operated in voltage control mode during the delay of OLTC when it is activated by the secondary
controller and for a safety period after the tap change. During this time period the secondary
controller provides the voltage reference for AVR instead of reactive power reference.
The 4 parameters described before are calculated for the purpose of comparing results of the different test
sequences.
6.12 UC12: MV Network Power Control (Primary Control) The KPIs related to this Use case are divided in three different categories:
MV Network Power Control - Technical and Economic Parameters (MVPC-E)
BASIC KPI INFORMATION
KPI Name Medium Voltage network Power Control (MVPC) Technical and Economic Parameters
KPI ID MVPC-E
Main Objective
The objective of the KPI is to evaluate the benefits and performance of the MVPC from a technical and economic point of view.
KPI Description
This KPI looks at a set of parameters relating to the MV network in order to
evaluate the performance of the MVPC from a technical and economic aspect and
quantify the benefits of the MVPC in a period of time. The parameters are as
follows:
5) Curtailed production [kWh]: Sum of curtailed production in the
evaluated period of time.
6) Network losses [kWh]: Sum of all the real power generated in the
network and transferred through the substation transformer and then
subtracting all real power consumed by the loads in the network, in

IDE4L Deliverable D7.1
84 IDE4L is a project co-funded by the European Commission
the evaluated period of time. Losses of transformer are not included.
7) Target function value [€]: Sum of cost function of secondary controller.
KPI Formula
MVPC-E1: 𝑃𝑐𝑢𝑟 = ∑𝑖
𝑃𝑐𝑢𝑟, 𝑖
MVPC-E2: 𝑃𝑙𝑜𝑠𝑠 = 𝑃𝑡 + ∑𝑖
𝑃𝑝𝑟𝑜𝑑, 𝑖 − ∑𝑖
𝑃𝑙𝑜𝑎𝑑, 𝑖
where:
Pcur,i is the curtailed production for generation unit i Pt is the active power going through the substation transformer
Pprod,i is the active power of production unit i
Pload,i is the active power consumed by the load i
Unit of measurement Kilowatt hour [kWh], Euro [€]
Connection / Link with other relevant defined KPIs and Use Cases
FLISR, State estimation & forecasting
Project sites to be calculated
Development laboratory
Demonstration laboratory
Field demonstrator
KPI CALCULATION METHODOLOGY
KPI Step Methodology ID
[KPI ID #] Step Responsible
MVPC-E_01 1. Obtain curtailment of each production unit from algorithm. 2. Calculate the total curtailment as sum of curtailment of each
production unit.
Research organism (DE)
MVPC-E_02
1. Obtain active power of all load units from state estimator. 2. Calculate total power consumed (Pload) as sum of active
power of each load unit. 3. Obtain active power going through transformer (Pt) from
state estimator. 4. Obtain active power produced by all production units from
state estimator. 5. Calculate total power produced (Pprod) as sum of active
power of each production unit and power going through transformer.
6. Calculate network loss (Ploss) by subtracting power consumed from power produced (Pprod-Pload).
Research organism (DE)
MVPC-E_03 1. Obtain cost function from Secondary controller. Research
organism (DE)
KPI SCENARIOS
Scenarios to be measured
BASELINE
BUSINESS AS USUAL (BaU)
SMART GRID
KPI DATA COLLECTION
Data Data ID
Methodology for data
collection
Source/Tools/Instruments
for Data collection
Location of Data
collection
Frequency of data collection
Minimum monitoring period
Data collection
responsible
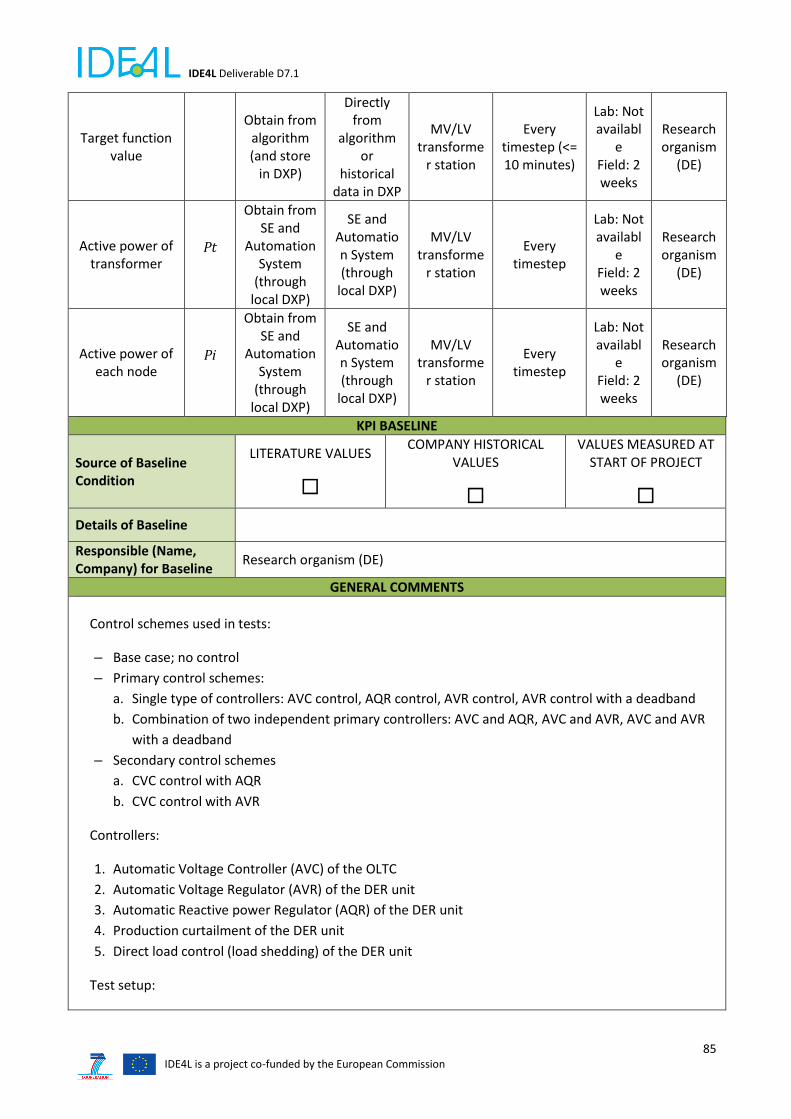
IDE4L Deliverable D7.1
85 IDE4L is a project co-funded by the European Commission
Target function value
Obtain from algorithm (and store
in DXP)
Directly from
algorithm or
historical data in DXP
MV/LV transforme
r station
Every timestep (<= 10 minutes)
Lab: Not availabl
e Field: 2 weeks
Research organism
(DE)
Active power of transformer
Pt
Obtain from SE and
Automation System
(through local DXP)
SE and Automation System (through
local DXP)
MV/LV transforme
r station
Every timestep
Lab: Not availabl
e Field: 2 weeks
Research organism
(DE)
Active power of each node
Pi
Obtain from SE and
Automation System
(through local DXP)
SE and Automation System (through
local DXP)
MV/LV transforme
r station
Every timestep
Lab: Not availabl
e Field: 2 weeks
Research organism
(DE)
KPI BASELINE
Source of Baseline Condition
LITERATURE VALUES
COMPANY HISTORICAL VALUES
VALUES MEASURED AT START OF PROJECT
Details of Baseline
Responsible (Name, Company) for Baseline
Research organism (DE)
GENERAL COMMENTS
Control schemes used in tests:
– Base case; no control
– Primary control schemes:
a. Single type of controllers: AVC control, AQR control, AVR control, AVR control with a deadband
b. Combination of two independent primary controllers: AVC and AQR, AVC and AVR, AVC and AVR
with a deadband
– Secondary control schemes
a. CVC control with AQR
b. CVC control with AVR
Controllers:
1. Automatic Voltage Controller (AVC) of the OLTC
2. Automatic Voltage Regulator (AVR) of the DER unit
3. Automatic Reactive power Regulator (AQR) of the DER unit
4. Production curtailment of the DER unit
5. Direct load control (load shedding) of the DER unit
Test setup:

IDE4L Deliverable D7.1
86 IDE4L is a project co-funded by the European Commission
AVC control: The AVC control is realized using an AVC-relay connected to the substation transformer,
which maintains the constant secondary voltage of transformer as close to the reference value as
possible.
AQR control: DER units control the power factor (or reactive power) of their connection points.
AVR control: DER units control the voltage of their connection points.
AVR control with a deadband: AVR control with a deadband the PID controller only changes reactive
power generation or consumption when the connection point voltage is outside of the allowed range
of voltage.
AVC control and AVR control: Combination of two control schemes.
AVC control and AVR control with a deadband: Combination of two control schemes. AVC relay
controlling the OLTC has a deadband to prevent changes of tap position unless the voltage differs
enough from the reference value.
CVC control with AQR: Secondary controller (OPF algorithm) controls the reference values of AVC and
DERs (reactive and real power).
CVC control with AVR: Similarly like previous control scheme, except that AVRs of DER units are
operated in voltage control mode during the delay of OLTC when it is activated by the secondary
controller and for a safety period after the tap change. During this time period the secondary
controller provides the voltage reference for AVR instead of reactive power reference.
The 3 parameters described before are calculated for the purpose of comparing results of the different test
sequences.
MV Network Power Control - Operational Parameters (MVPC-O)
BASIC KPI INFORMATION
KPI Name Medium Voltage network Power Control (MVPC) Operational Parameters
KPI ID MVPC-O
Main Objective
The objective of the KPI is to evaluate the benefits and performance of the MVPC from an operational point of view.
KPI Description
This KPI looks at a set of technical parameters relating to the MVPC in order to
evaluate the performance of the MVPC from an operational aspect. The
parameters are as follows:
1) Average algorithm execution time [s]: Average of secondary
controller execution time.
2) Alerts [pcs]: Alerts (maximum iterations reached, not converged,
etc.) of secondary control algorithm.
3) OLTC steps taken [pcs]: Number of OLTC step actions.
4) P set point changes [pcs]: Number of active power set point changes.
5) Q set point changes [pcs]: Number of reactive power set point
changes.
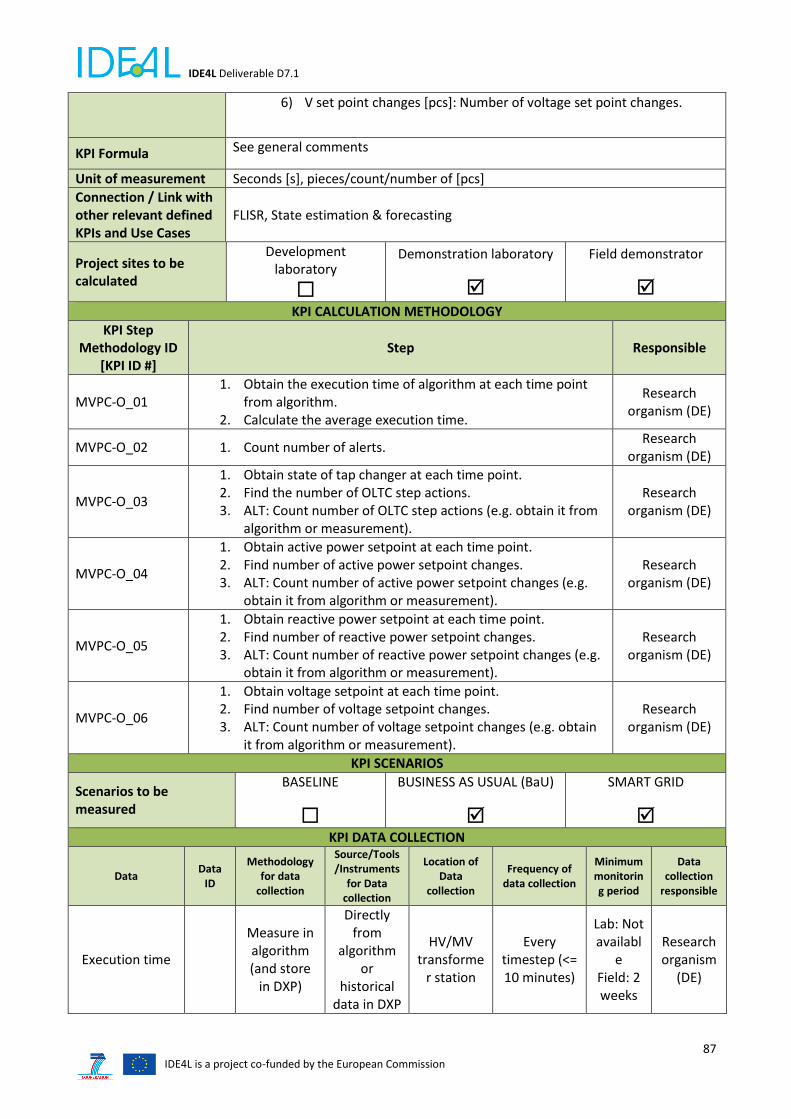
IDE4L Deliverable D7.1
87 IDE4L is a project co-funded by the European Commission
6) V set point changes [pcs]: Number of voltage set point changes.
KPI Formula See general comments
Unit of measurement Seconds [s], pieces/count/number of [pcs]
Connection / Link with other relevant defined KPIs and Use Cases
FLISR, State estimation & forecasting
Project sites to be calculated
Development laboratory
Demonstration laboratory
Field demonstrator
KPI CALCULATION METHODOLOGY
KPI Step Methodology ID
[KPI ID #] Step Responsible
MVPC-O_01 1. Obtain the execution time of algorithm at each time point
from algorithm. 2. Calculate the average execution time.
Research organism (DE)
MVPC-O_02 1. Count number of alerts. Research
organism (DE)
MVPC-O_03
1. Obtain state of tap changer at each time point. 2. Find the number of OLTC step actions. 3. ALT: Count number of OLTC step actions (e.g. obtain it from
algorithm or measurement).
Research organism (DE)
MVPC-O_04
1. Obtain active power setpoint at each time point. 2. Find number of active power setpoint changes. 3. ALT: Count number of active power setpoint changes (e.g.
obtain it from algorithm or measurement).
Research organism (DE)
MVPC-O_05
1. Obtain reactive power setpoint at each time point. 2. Find number of reactive power setpoint changes. 3. ALT: Count number of reactive power setpoint changes (e.g.
obtain it from algorithm or measurement).
Research organism (DE)
MVPC-O_06
1. Obtain voltage setpoint at each time point. 2. Find number of voltage setpoint changes. 3. ALT: Count number of voltage setpoint changes (e.g. obtain
it from algorithm or measurement).
Research organism (DE)
KPI SCENARIOS
Scenarios to be measured
BASELINE
BUSINESS AS USUAL (BaU)
SMART GRID
KPI DATA COLLECTION
Data Data ID
Methodology for data
collection
Source/Tools/Instruments
for Data collection
Location of Data
collection
Frequency of data collection
Minimum monitoring period
Data collection
responsible
Execution time
Measure in algorithm (and store
in DXP)
Directly from
algorithm or
historical data in DXP
HV/MV transforme
r station
Every timestep (<= 10 minutes)
Lab: Not availabl
e Field: 2 weeks
Research organism
(DE)
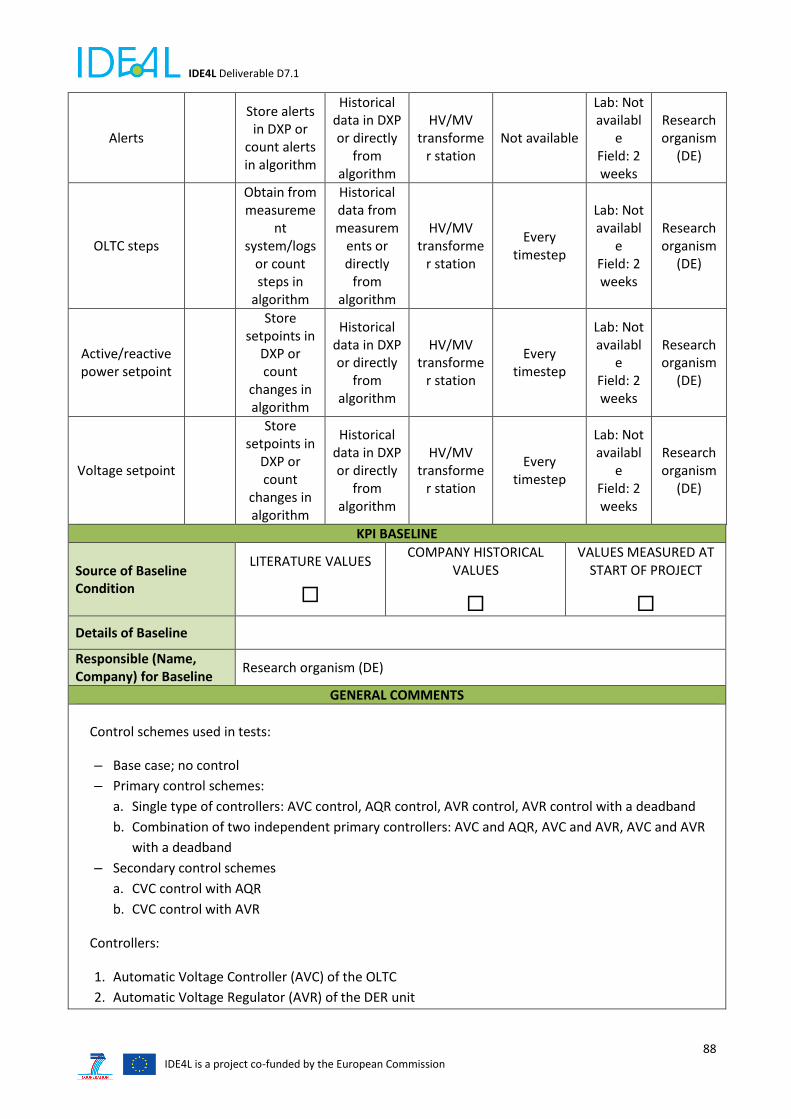
IDE4L Deliverable D7.1
88 IDE4L is a project co-funded by the European Commission
Alerts
Store alerts in DXP or
count alerts in algorithm
Historical data in DXP or directly
from algorithm
HV/MV transforme
r station Not available
Lab: Not availabl
e Field: 2 weeks
Research organism
(DE)
OLTC steps
Obtain from measureme
nt system/logs
or count steps in
algorithm
Historical data from measurem
ents or directly
from algorithm
HV/MV transforme
r station
Every timestep
Lab: Not availabl
e Field: 2 weeks
Research organism
(DE)
Active/reactive power setpoint
Store setpoints in
DXP or count
changes in algorithm
Historical data in DXP or directly
from algorithm
HV/MV transforme
r station
Every timestep
Lab: Not availabl
e Field: 2 weeks
Research organism
(DE)
Voltage setpoint
Store setpoints in
DXP or count
changes in algorithm
Historical data in DXP or directly
from algorithm
HV/MV transforme
r station
Every timestep
Lab: Not availabl
e Field: 2 weeks
Research organism
(DE)
KPI BASELINE
Source of Baseline Condition
LITERATURE VALUES
COMPANY HISTORICAL VALUES
VALUES MEASURED AT START OF PROJECT
Details of Baseline
Responsible (Name, Company) for Baseline
Research organism (DE)
GENERAL COMMENTS
Control schemes used in tests:
– Base case; no control
– Primary control schemes:
a. Single type of controllers: AVC control, AQR control, AVR control, AVR control with a deadband
b. Combination of two independent primary controllers: AVC and AQR, AVC and AVR, AVC and AVR
with a deadband
– Secondary control schemes
a. CVC control with AQR
b. CVC control with AVR
Controllers:
1. Automatic Voltage Controller (AVC) of the OLTC
2. Automatic Voltage Regulator (AVR) of the DER unit
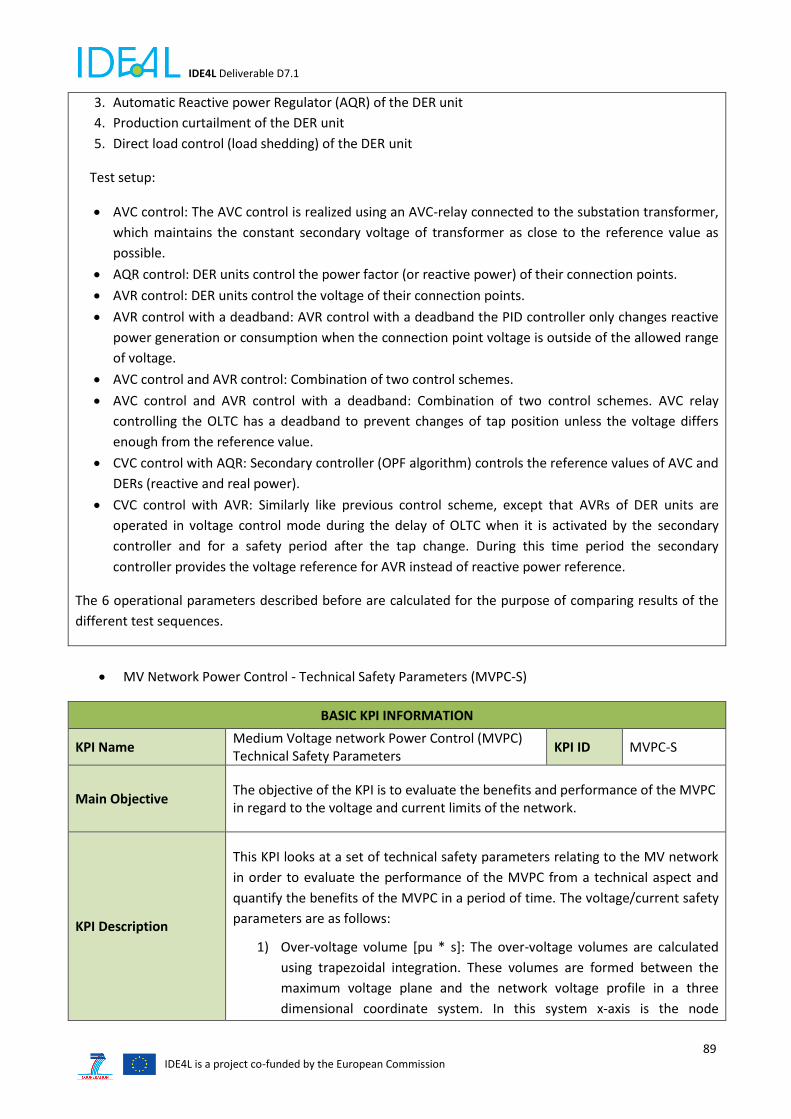
IDE4L Deliverable D7.1
89 IDE4L is a project co-funded by the European Commission
3. Automatic Reactive power Regulator (AQR) of the DER unit
4. Production curtailment of the DER unit
5. Direct load control (load shedding) of the DER unit
Test setup:
AVC control: The AVC control is realized using an AVC-relay connected to the substation transformer,
which maintains the constant secondary voltage of transformer as close to the reference value as
possible.
AQR control: DER units control the power factor (or reactive power) of their connection points.
AVR control: DER units control the voltage of their connection points.
AVR control with a deadband: AVR control with a deadband the PID controller only changes reactive
power generation or consumption when the connection point voltage is outside of the allowed range
of voltage.
AVC control and AVR control: Combination of two control schemes.
AVC control and AVR control with a deadband: Combination of two control schemes. AVC relay
controlling the OLTC has a deadband to prevent changes of tap position unless the voltage differs
enough from the reference value.
CVC control with AQR: Secondary controller (OPF algorithm) controls the reference values of AVC and
DERs (reactive and real power).
CVC control with AVR: Similarly like previous control scheme, except that AVRs of DER units are
operated in voltage control mode during the delay of OLTC when it is activated by the secondary
controller and for a safety period after the tap change. During this time period the secondary
controller provides the voltage reference for AVR instead of reactive power reference.
The 6 operational parameters described before are calculated for the purpose of comparing results of the
different test sequences.
MV Network Power Control - Technical Safety Parameters (MVPC-S)
BASIC KPI INFORMATION
KPI Name Medium Voltage network Power Control (MVPC) Technical Safety Parameters
KPI ID MVPC-S
Main Objective
The objective of the KPI is to evaluate the benefits and performance of the MVPC in regard to the voltage and current limits of the network.
KPI Description
This KPI looks at a set of technical safety parameters relating to the MV network
in order to evaluate the performance of the MVPC from a technical aspect and
quantify the benefits of the MVPC in a period of time. The voltage/current safety
parameters are as follows:
1) Over-voltage volume [pu * s]: The over-voltage volumes are calculated
using trapezoidal integration. These volumes are formed between the
maximum voltage plane and the network voltage profile in a three
dimensional coordinate system. In this system x-axis is the node
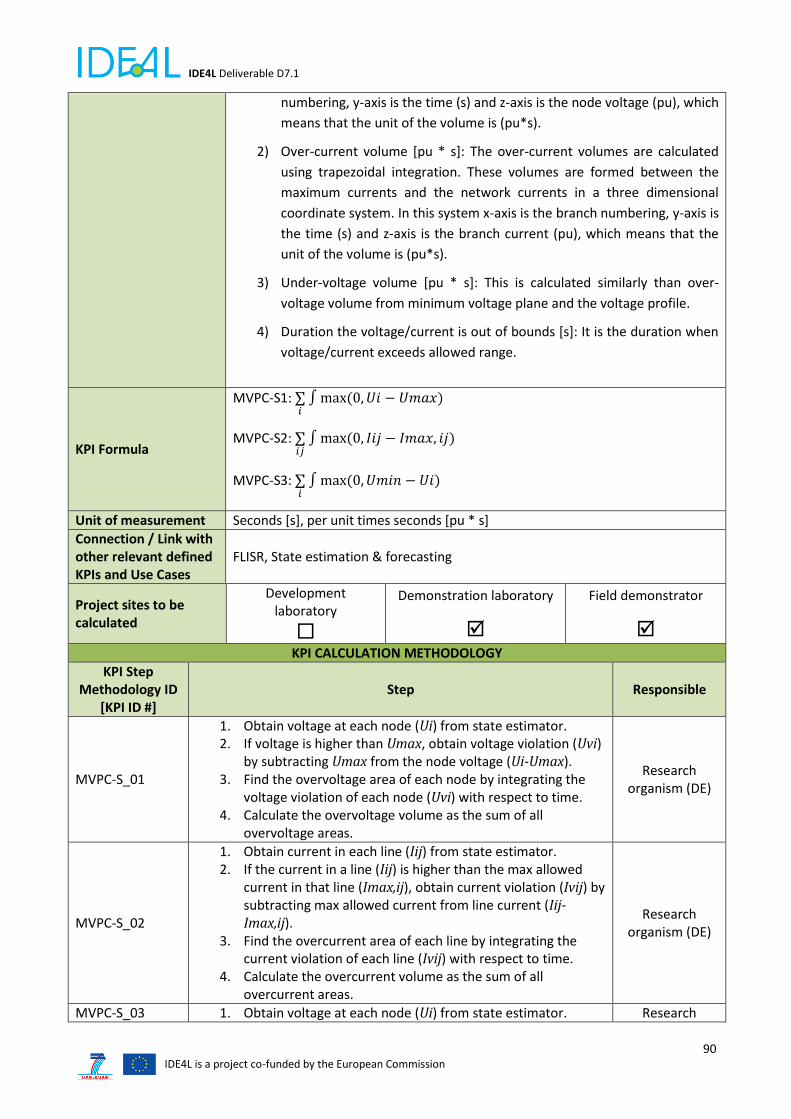
IDE4L Deliverable D7.1
90 IDE4L is a project co-funded by the European Commission
numbering, y-axis is the time (s) and z-axis is the node voltage (pu), which
means that the unit of the volume is (pu*s).
2) Over-current volume [pu * s]: The over-current volumes are calculated
using trapezoidal integration. These volumes are formed between the
maximum currents and the network currents in a three dimensional
coordinate system. In this system x-axis is the branch numbering, y-axis is
the time (s) and z-axis is the branch current (pu), which means that the
unit of the volume is (pu*s).
3) Under-voltage volume [pu * s]: This is calculated similarly than over-
voltage volume from minimum voltage plane and the voltage profile.
4) Duration the voltage/current is out of bounds [s]: It is the duration when
voltage/current exceeds allowed range.
KPI Formula
MVPC-S1: ∑𝑖
∫ max (0, 𝑈𝑖 − 𝑈𝑚𝑎𝑥)
MVPC-S2: ∑𝑖𝑗
∫ max (0, 𝐼𝑖𝑗 − 𝐼𝑚𝑎𝑥, 𝑖𝑗)
MVPC-S3: ∑𝑖
∫ max (0, 𝑈𝑚𝑖𝑛 − 𝑈𝑖)
Unit of measurement Seconds [s], per unit times seconds [pu * s]
Connection / Link with other relevant defined KPIs and Use Cases
FLISR, State estimation & forecasting
Project sites to be calculated
Development laboratory
Demonstration laboratory
Field demonstrator
KPI CALCULATION METHODOLOGY
KPI Step Methodology ID
[KPI ID #] Step Responsible
MVPC-S_01
1. Obtain voltage at each node (Ui) from state estimator. 2. If voltage is higher than Umax, obtain voltage violation (Uvi)
by subtracting Umax from the node voltage (Ui-Umax). 3. Find the overvoltage area of each node by integrating the
voltage violation of each node (Uvi) with respect to time. 4. Calculate the overvoltage volume as the sum of all
overvoltage areas.
Research organism (DE)
MVPC-S_02
1. Obtain current in each line (Iij) from state estimator. 2. If the current in a line (Iij) is higher than the max allowed
current in that line (Imax,ij), obtain current violation (Ivij) by subtracting max allowed current from line current (Iij-Imax,ij).
3. Find the overcurrent area of each line by integrating the current violation of each line (Ivij) with respect to time.
4. Calculate the overcurrent volume as the sum of all overcurrent areas.
Research organism (DE)
MVPC-S_03 1. Obtain voltage at each node (Ui) from state estimator. Research
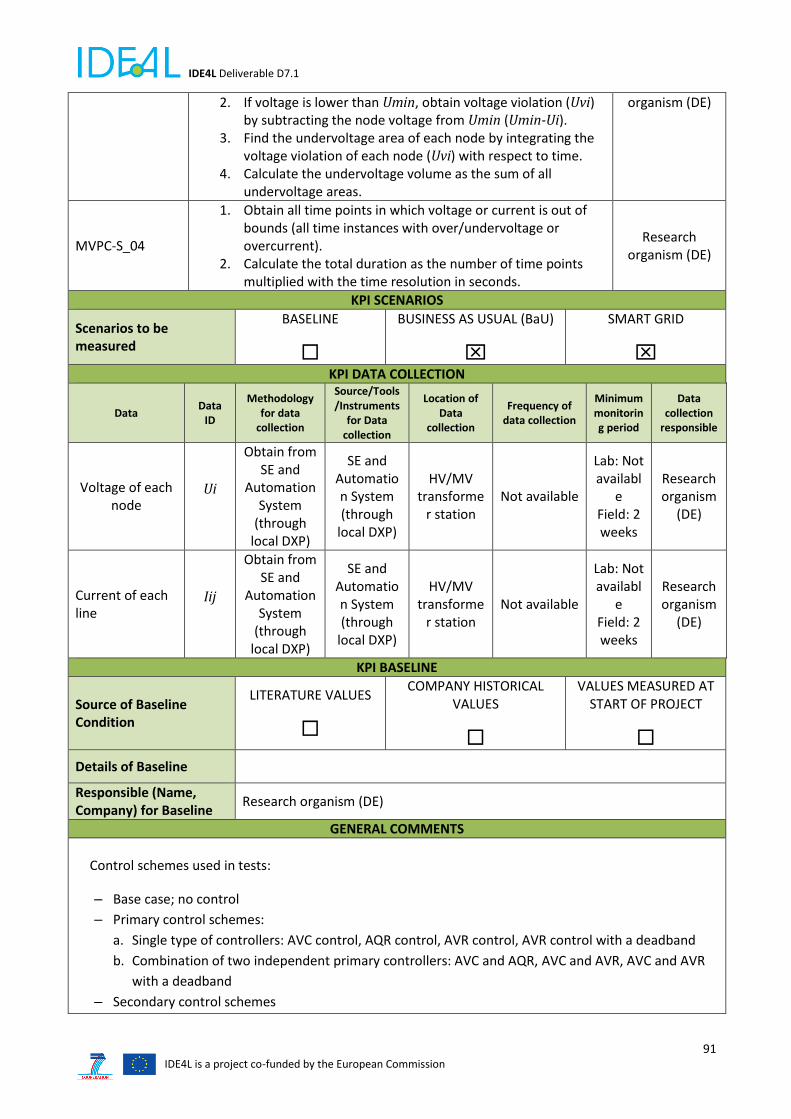
IDE4L Deliverable D7.1
91 IDE4L is a project co-funded by the European Commission
2. If voltage is lower than Umin, obtain voltage violation (Uvi) by subtracting the node voltage from Umin (Umin-Ui).
3. Find the undervoltage area of each node by integrating the voltage violation of each node (Uvi) with respect to time.
4. Calculate the undervoltage volume as the sum of all undervoltage areas.
organism (DE)
MVPC-S_04
1. Obtain all time points in which voltage or current is out of bounds (all time instances with over/undervoltage or overcurrent).
2. Calculate the total duration as the number of time points multiplied with the time resolution in seconds.
Research organism (DE)
KPI SCENARIOS
Scenarios to be measured
BASELINE
BUSINESS AS USUAL (BaU)
SMART GRID
KPI DATA COLLECTION
Data Data
ID
Methodology for data
collection
Source/Tools/Instruments
for Data collection
Location of Data
collection
Frequency of data collection
Minimum monitoring period
Data collection
responsible
Voltage of each node
Ui
Obtain from SE and
Automation System
(through local DXP)
SE and Automation System (through
local DXP)
HV/MV transforme
r station Not available
Lab: Not availabl
e Field: 2 weeks
Research organism
(DE)
Current of each line
Iij
Obtain from SE and
Automation System
(through local DXP)
SE and Automation System (through
local DXP)
HV/MV transforme
r station Not available
Lab: Not availabl
e Field: 2 weeks
Research organism
(DE)
KPI BASELINE
Source of Baseline Condition
LITERATURE VALUES
COMPANY HISTORICAL VALUES
VALUES MEASURED AT START OF PROJECT
Details of Baseline
Responsible (Name, Company) for Baseline
Research organism (DE)
GENERAL COMMENTS
Control schemes used in tests:
– Base case; no control
– Primary control schemes:
a. Single type of controllers: AVC control, AQR control, AVR control, AVR control with a deadband
b. Combination of two independent primary controllers: AVC and AQR, AVC and AVR, AVC and AVR
with a deadband
– Secondary control schemes

IDE4L Deliverable D7.1
92 IDE4L is a project co-funded by the European Commission
a. CVC control with AQR
b. CVC control with AVR
Controllers:
1. Automatic Voltage Controller (AVC) of the OLTC
2. Automatic Voltage Regulator (AVR) of the DER unit
3. Automatic Reactive power Regulator (AQR) of the DER unit
4. Production curtailment of the DER unit
5. Direct load control (load shedding) of the DER unit
Test setup:
AVC control: The AVC control is realized using an AVC-relay connected to the substation transformer,
which maintains the constant secondary voltage of transformer as close to the reference value as
possible.
AQR control: DER units control the power factor (or reactive power) of their connection points.
AVR control: DER units control the voltage of their connection points.
AVR control with a deadband: AVR control with a deadband the PID controller only changes reactive
power generation or consumption when the connection point voltage is outside of the allowed range
of voltage.
AVC control and AVR control: Combination of two control schemes.
AVC control and AVR control with a deadband: Combination of two control schemes. AVC relay
controlling the OLTC has a deadband to prevent changes of tap position unless the voltage differs
enough from the reference value.
CVC control with AQR: Secondary controller (OPF algorithm) controls the reference values of AVC and
DERs (reactive and real power).
CVC control with AVR: Similarly like previous control scheme, except that AVRs of DER units are
operated in voltage control mode during the delay of OLTC when it is activated by the secondary
controller and for a safety period after the tap change. During this time period the secondary
controller provides the voltage reference for AVR instead of reactive power reference.
The 4 parameters described before are calculated for the purpose of comparing results of the different test
sequences.
6.13 UC13: Decentralized FLISR Four different KPIs are defined for this Use Case:
SAIDI
BASIC KPI INFORMATION
KPI Name SAIDI KPI ID SAIDI
Main Objective Estimate the average interruption duration
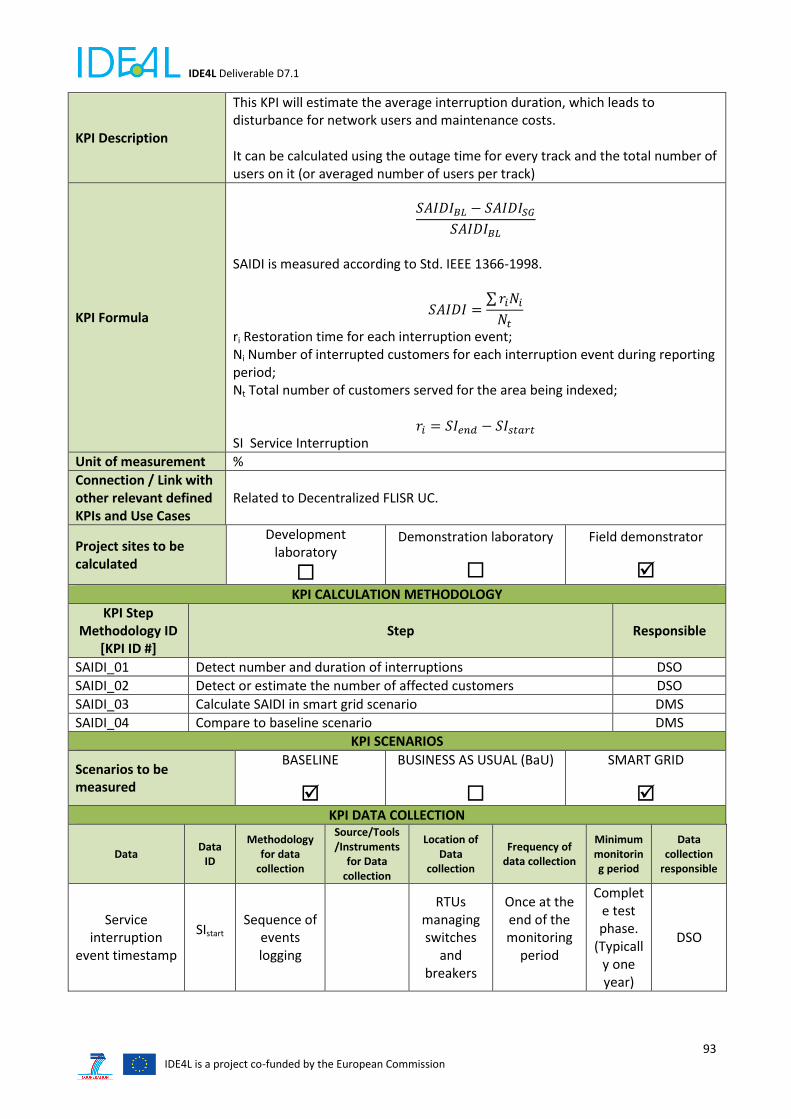
IDE4L Deliverable D7.1
93 IDE4L is a project co-funded by the European Commission
KPI Description
This KPI will estimate the average interruption duration, which leads to disturbance for network users and maintenance costs. It can be calculated using the outage time for every track and the total number of users on it (or averaged number of users per track)
KPI Formula
𝑆𝐴𝐼𝐷𝐼𝐵𝐿 − 𝑆𝐴𝐼𝐷𝐼𝑆𝐺
𝑆𝐴𝐼𝐷𝐼𝐵𝐿
SAIDI is measured according to Std. IEEE 1366-1998.
𝑆𝐴𝐼𝐷𝐼 =∑ 𝑟𝑖𝑁𝑖
𝑁𝑡
ri Restoration time for each interruption event; Ni Number of interrupted customers for each interruption event during reporting period; Nt Total number of customers served for the area being indexed;
𝑟𝑖 = 𝑆𝐼𝑒𝑛𝑑 − 𝑆𝐼𝑠𝑡𝑎𝑟𝑡 SI Service Interruption
Unit of measurement %
Connection / Link with other relevant defined KPIs and Use Cases
Related to Decentralized FLISR UC.
Project sites to be calculated
Development laboratory
Demonstration laboratory
Field demonstrator
KPI CALCULATION METHODOLOGY
KPI Step Methodology ID
[KPI ID #] Step Responsible
SAIDI_01 Detect number and duration of interruptions DSO
SAIDI_02 Detect or estimate the number of affected customers DSO
SAIDI_03 Calculate SAIDI in smart grid scenario DMS
SAIDI_04 Compare to baseline scenario DMS
KPI SCENARIOS
Scenarios to be measured
BASELINE
BUSINESS AS USUAL (BaU)
SMART GRID
KPI DATA COLLECTION
Data Data ID
Methodology for data
collection
Source/Tools/Instruments
for Data collection
Location of Data
collection
Frequency of data collection
Minimum monitoring period
Data collection
responsible
Service interruption
event timestamp
SIstart Sequence of
events logging
RTUs managing switches
and breakers
Once at the end of the monitoring
period
Complete test phase.
(Typically one year)
DSO

IDE4L Deliverable D7.1
94 IDE4L is a project co-funded by the European Commission
Restoration command timestamp
SIend Sequence of
events logging
RTUs managing switches
and breakers
Once at the end of the monitoring
period
Complete test phase.
(Typically one year)
DSO
Number of interrupted customers
Ni
Adding the number of customers
in the affected
areas
DMS
Once at the end of the monitoring
period
Complete test phase.
(Typically one year)
DMS
KPI BASELINE
Source of Baseline Condition
LITERATURE VALUES
COMPANY HISTORICAL VALUES
VALUES MEASURED AT START OF PROJECT
Details of Baseline Previous SAIDI values in the same area.
Responsible (Name, Company) for Baseline
DSOs
GENERAL COMMENTS
This KPI has been defined for UC “Decentralized FLISR”
SAIFI
BASIC KPI INFORMATION
KPI Name SAIFI KPI ID SAIFI
Main Objective Measure the number of service interruptions suffered by a average user.
KPI Description This KPI will estimate the average number of service interruptions detected by a typical end user in the network during a defined time t (typically one year)
KPI Formula
𝑆𝐴𝐼𝐹𝐼𝐵𝐿 − 𝑆𝐴𝐼𝐹𝐼𝑆𝐺
𝑆𝐴𝐼𝐹𝐼𝐵𝐿
SAIFI is measured according to IEEE 1366-1998:
𝑆𝐴𝐼𝐹𝐼 =∑ 𝑁𝑖
𝑁𝑡
Where :
Ni Number of interrupted customers for each interruption event during reporting period: Nt Total number of customers served for the area being indexed;
Unit of measurement %
Connection / Link with other relevant defined KPIs and Use Cases
Related to Decentralized FLISR UC.

IDE4L Deliverable D7.1
95 IDE4L is a project co-funded by the European Commission
Project sites to be calculated
Development laboratory
Demonstration laboratory
Field demonstrator
×
KPI CALCULATION METHODOLOGY
KPI Step Methodology ID
[KPI ID #] Step Responsible
SAIFI_01 Detect or estimate the number of affected customers DSO
SAIFI_02 Calculate SAIFI in smart grid scenario DMS
SAIFI_03 Compare to baseline scenario DMS
KPI SCENARIOS
Scenarios to be measured
BASELINE
BUSINESS AS USUAL (BaU)
SMART GRID
KPI DATA COLLECTION
Data Data
ID
Methodology for data
collection
Source/Tools/Instruments
for Data collection
Location of Data
collection
Frequency of data collection
Minimum monitoring period
Data collection
responsible
Number of interrupted customers
Ni
Adding the number of customers
in the affected
areas
DMS
Once at the end of the monitoring
period
Complete test phase.
(Typically one year)
DMS
Total number of customers
Nt
Adding the number of customers in test area
DMS
Once at the end of the monitoring
period
Complete test phase.
(Typically one year)
DMS
KPI BASELINE
Source of Baseline Condition
LITERATURE VALUES
COMPANY HISTORICAL VALUES
×
VALUES MEASURED AT START OF PROJECT
Details of Baseline Previous SAIFI values in the same area.
Responsible (Name, Company) for Baseline
DSOs
GENERAL COMMENTS
This KPI has been defined for UC “Decentralized FLISR”
Breaker energized operations (BEO)
BASIC KPI INFORMATION
KPI Name Breaker energized operations KPI ID BEO

IDE4L Deliverable D7.1
96 IDE4L is a project co-funded by the European Commission
Main Objective Measure the load for breakers due to the number of energized operations in terms of cost.
KPI Description This KPI will estimate the maintenance cost due to breaker energized operations. This could be measured by counting the average total number of breaker energized operations in a fault isolation activity.
KPI Formula
BEO = ∑ 𝐶𝐵𝑅_𝑂𝑃𝑖
𝑁−1
𝑖=0
Where: N is the number of breakers in the test network CBR_OPi is the number of operation done on the breaker i during the fault condition
Unit of measurement %
Connection / Link with other relevant defined KPIs and Use Cases
Related to Fault detection, isolation and location UC.
Project sites to be calculated
Development laboratory
Demonstration laboratory
Field demonstrator
KPI CALCULATION METHODOLOGY
KPI Step Methodology ID
[KPI ID #] Step Responsible
BEO_01 Detect CBs involved and collect the number of operations DSO
BEO_02 Collect the number of available CBs DSO
BEO_03 Calculate BEO in the smart grid scenario DMS
BEO_04 Compare to baseline scenario DMS
KPI SCENARIOS
Scenarios to be measured
BASELINE
BUSINESS AS USUAL (BaU)
SMART GRID
KPI DATA COLLECTION
Data Data ID
Methodology for data
collection
Source/Tools/Instruments
for Data collection
Location of Data
collection
Frequency of data collection
Minimum monitoring period
Data collection
responsible
Breaker operation counter
Sequence of events
logging or breaker
operation counter
RTUs
managing breakers
Just after every fault
event.
Depending on
the number
of events. At least
30 events.
DSO
Number of available CBs in
the test network
N
Count the CBs
declared in active
topology
DMS Just after
every fault event
Depending on
the number
of events. At least
DSO
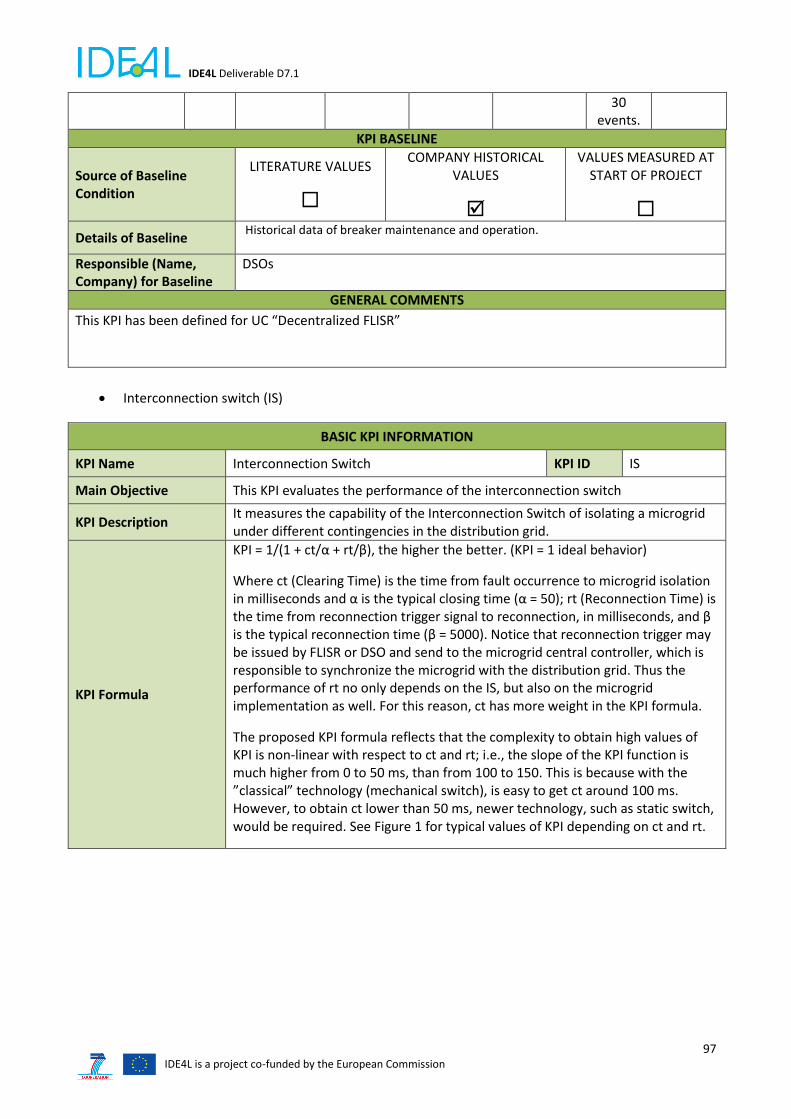
IDE4L Deliverable D7.1
97 IDE4L is a project co-funded by the European Commission
30 events.
KPI BASELINE
Source of Baseline Condition
LITERATURE VALUES
COMPANY HISTORICAL VALUES
VALUES MEASURED AT START OF PROJECT
Details of Baseline Historical data of breaker maintenance and operation.
Responsible (Name, Company) for Baseline
DSOs
GENERAL COMMENTS
This KPI has been defined for UC “Decentralized FLISR”
Interconnection switch (IS)
BASIC KPI INFORMATION
KPI Name Interconnection Switch KPI ID IS
Main Objective This KPI evaluates the performance of the interconnection switch
KPI Description It measures the capability of the Interconnection Switch of isolating a microgrid under different contingencies in the distribution grid.
KPI Formula
KPI = 1/(1 + ct/α + rt/β), the higher the better. (KPI = 1 ideal behavior)
Where ct (Clearing Time) is the time from fault occurrence to microgrid isolation in milliseconds and α is the typical closing time (α = 50); rt (Reconnection Time) is the time from reconnection trigger signal to reconnection, in milliseconds, and β is the typical reconnection time (β = 5000). Notice that reconnection trigger may be issued by FLISR or DSO and send to the microgrid central controller, which is responsible to synchronize the microgrid with the distribution grid. Thus the performance of rt no only depends on the IS, but also on the microgrid implementation as well. For this reason, ct has more weight in the KPI formula.
The proposed KPI formula reflects that the complexity to obtain high values of KPI is non-linear with respect to ct and rt; i.e., the slope of the KPI function is much higher from 0 to 50 ms, than from 100 to 150. This is because with the ”classical” technology (mechanical switch), is easy to get ct around 100 ms. However, to obtain ct lower than 50 ms, newer technology, such as static switch, would be required. See Figure 1 for typical values of KPI depending on ct and rt.

IDE4L Deliverable D7.1
98 IDE4L is a project co-funded by the European Commission
Figure 7, illustration of KPI values for different ct and rt times.
Unit of measurement ct: milliseconds rt: milliseconds KPI in per unit (adimensional)
Connection / Link with other relevant defined KPIs and Use Cases
This KPI is linked to the Use Case: Decentralized FLISR
Project sites to be calculated
Development laboratory
Demonstration laboratory
Field demonstrator
KPI CALCULATION METHODOLOGY
KPI Step Methodology ID
[KPI ID #] Step Responsible
IS_01 Measure current at the distribution side of interconnection switch Research
organism (IREC)
IS_02 Trigger a distribution side fault. Research
organism (IREC)
IS_03 Time from fault occurrence to instant when current measured is zero.
Research organism (IREC)
IS_04 Clear the distribution fault, and signal IS to reconnect. Research
organism (IREC)
IS_05 Time from reconnection trigger to reconnection of the microgrid with the distribution grid. (i.e. current starts flowing again)
Research organism (IREC)
KPI SCENARIOS
Scenarios to be measured
BASELINE
BUSINESS AS USUAL (BaU)
SMART GRID
KPI DATA COLLECTION
Data Data ID
Methodology for data
collection
Source/Tools/Instruments for Data collection
Location of Data
collection
Frequency of data collection
Minimum monitoring period
Data collection
responsible
Clearing time ct
Step_1,2,3 Oscilloscope laboratory punctual 3 min Research organism
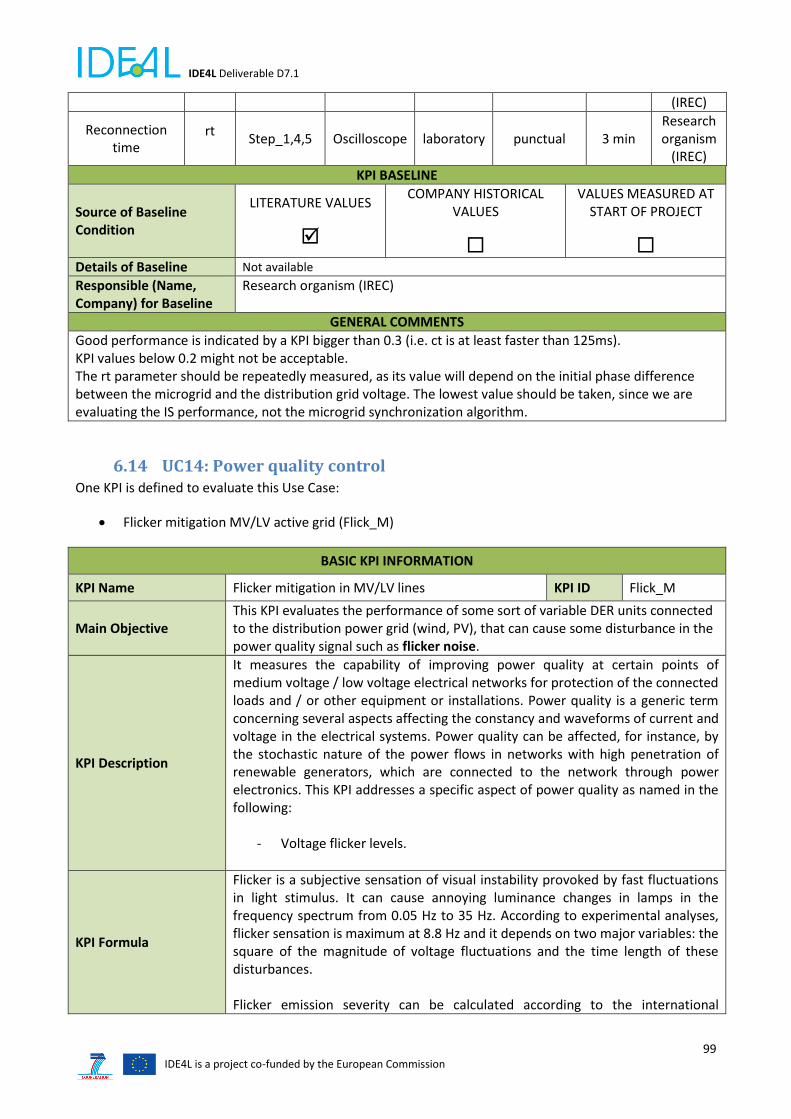
IDE4L Deliverable D7.1
99 IDE4L is a project co-funded by the European Commission
(IREC)
Reconnection time
rt Step_1,4,5 Oscilloscope laboratory punctual 3 min
Research organism
(IREC)
KPI BASELINE
Source of Baseline Condition
LITERATURE VALUES
COMPANY HISTORICAL VALUES
VALUES MEASURED AT START OF PROJECT
Details of Baseline Not available
Responsible (Name, Company) for Baseline
Research organism (IREC)
GENERAL COMMENTS
Good performance is indicated by a KPI bigger than 0.3 (i.e. ct is at least faster than 125ms). KPI values below 0.2 might not be acceptable. The rt parameter should be repeatedly measured, as its value will depend on the initial phase difference between the microgrid and the distribution grid voltage. The lowest value should be taken, since we are evaluating the IS performance, not the microgrid synchronization algorithm.
6.14 UC14: Power quality control One KPI is defined to evaluate this Use Case:
Flicker mitigation MV/LV active grid (Flick_M)
BASIC KPI INFORMATION
KPI Name Flicker mitigation in MV/LV lines KPI ID Flick_M
Main Objective This KPI evaluates the performance of some sort of variable DER units connected to the distribution power grid (wind, PV), that can cause some disturbance in the power quality signal such as flicker noise.
KPI Description
It measures the capability of improving power quality at certain points of medium voltage / low voltage electrical networks for protection of the connected loads and / or other equipment or installations. Power quality is a generic term concerning several aspects affecting the constancy and waveforms of current and voltage in the electrical systems. Power quality can be affected, for instance, by the stochastic nature of the power flows in networks with high penetration of renewable generators, which are connected to the network through power electronics. This KPI addresses a specific aspect of power quality as named in the following:
- Voltage flicker levels.
KPI Formula
Flicker is a subjective sensation of visual instability provoked by fast fluctuations in light stimulus. It can cause annoying luminance changes in lamps in the frequency spectrum from 0.05 Hz to 35 Hz. According to experimental analyses, flicker sensation is maximum at 8.8 Hz and it depends on two major variables: the square of the magnitude of voltage fluctuations and the time length of these disturbances. Flicker emission severity can be calculated according to the international

IDE4L Deliverable D7.1
100 IDE4L is a project co-funded by the European Commission
standard IEC 61000-4-15. This standard describes the so-called flicker meter. This device provides two flicker indices: short and long term flicker severity, from the measurement and processing of voltage signal at the required connection point. Also, it can provide a third index, the instantaneous flicker sensation. This instantaneous flicker index is intended to represent the instantaneous sensation experienced by humans while subjected to a fluctuating light stimulus. Short-term flicker severity index requires precise measurement of RMS voltage level for at least 10 minutes, while continuous measurement of voltage for up to 2 hours is needed for determining long-term flicker index. According to IEC 61000-4-15, the flicker meter is composed by the 5 major modules represented in the following figure.
Figure 8, Flicker meter representation
As shown, the determination of the instantaneous flicker severity index, 𝑃𝑖𝑛𝑠𝑡(𝑡), is required to compute both short-term and long-term indices (𝑃𝑠𝑡(𝑡) and 𝑃𝑙𝑡(𝑡) respectively). In order to compute 𝑃𝑖𝑛𝑠𝑡(𝑡), first voltage measurement has to be scaled to a 230 V RMS signal in Module 1, then the square of this signal is obtained in Module 2 and all serve to represent the equivalent voltage fluctuation of a domestic lamp. The obtained signal at this point is double-filtered in Module 3 to obtain the instantaneous sensation of flicker just prior being processed by the brain. To this aim, Module 3 firstly applies a first-order Butterworth high-pass filter with cut-off frequency 0.05 Hz. Then, the resultant signal is further modified by a high-pass filter (sixth order, Butterworth type, with a cut-off frequency 35 Hz, thus bounding at this frequency voltage fluctuations associated to flicker). Finally, Module 3 applies a third transfer function in order to emulate the response or the effect of voltage fluctuations of a domestic lamp in human eyes. All these filters and transfer functions serves to obtain a fluctuating signal which is further processed and low-pass filtered in Module 4 of flickermeter, emulating the instantaneous response of human brain to such fluctuating light stimulus, so giving the instantaneous sensation of flicker index 𝑃𝑖𝑛𝑠𝑡(𝑡). As previously noted, the instantaneous flicker index serves to compute 𝑃𝑠𝑡(𝑡) and 𝑃𝑙𝑡(𝑡) and these are calculated applying statistic treatment to 𝑃𝑖𝑛𝑠𝑡(𝑡). Detailed description around these statistics will be offered when convenient. To sum up, and for the sake of clarity, the mathematical expressions for 𝑃𝑠𝑡(𝑡) is calculated as
𝑃𝑠𝑡(𝑡) = √0.314𝑃0.1 + 0.0525𝑃1𝑠 + 0.0657𝑃3𝑠 + 0.28𝑃10𝑠 + 0.08𝑃50𝑠,
Module 3
Signal filtering:
Module 1 Module 2 Module 4 Module 5
ADC module
Signalprocessing:
u2
Signalfiltering
and processing
Compu-tation of
short and long
termindices
u(t)
Pst (t)
Plt (t)
Pinst (t)
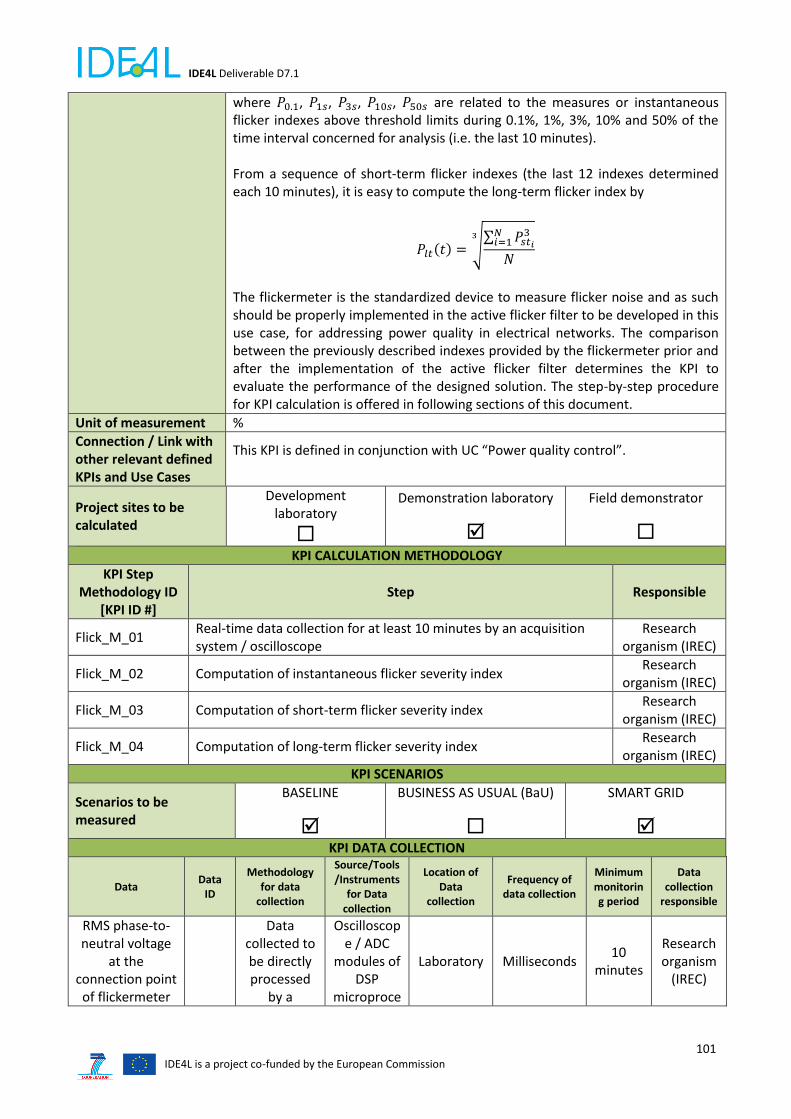
IDE4L Deliverable D7.1
101 IDE4L is a project co-funded by the European Commission
where 𝑃0.1, 𝑃1𝑠, 𝑃3𝑠, 𝑃10𝑠, 𝑃50𝑠 are related to the measures or instantaneous flicker indexes above threshold limits during 0.1%, 1%, 3%, 10% and 50% of the time interval concerned for analysis (i.e. the last 10 minutes). From a sequence of short-term flicker indexes (the last 12 indexes determined each 10 minutes), it is easy to compute the long-term flicker index by
𝑃𝑙𝑡(𝑡) = √∑ 𝑃𝑠𝑡𝑖
3𝑁𝑖=1
𝑁
3
The flickermeter is the standardized device to measure flicker noise and as such should be properly implemented in the active flicker filter to be developed in this use case, for addressing power quality in electrical networks. The comparison between the previously described indexes provided by the flickermeter prior and after the implementation of the active flicker filter determines the KPI to evaluate the performance of the designed solution. The step-by-step procedure for KPI calculation is offered in following sections of this document.
Unit of measurement %
Connection / Link with other relevant defined KPIs and Use Cases
This KPI is defined in conjunction with UC “Power quality control”.
Project sites to be calculated
Development laboratory
Demonstration laboratory
Field demonstrator
KPI CALCULATION METHODOLOGY
KPI Step Methodology ID
[KPI ID #] Step Responsible
Flick_M_01 Real-time data collection for at least 10 minutes by an acquisition system / oscilloscope
Research organism (IREC)
Flick_M_02 Computation of instantaneous flicker severity index Research
organism (IREC)
Flick_M_03 Computation of short-term flicker severity index Research
organism (IREC)
Flick_M_04 Computation of long-term flicker severity index Research
organism (IREC)
KPI SCENARIOS
Scenarios to be measured
BASELINE
BUSINESS AS USUAL (BaU)
SMART GRID
KPI DATA COLLECTION
Data Data ID
Methodology for data
collection
Source/Tools/Instruments
for Data collection
Location of Data
collection
Frequency of data collection
Minimum monitoring period
Data collection
responsible
RMS phase-to-neutral voltage
at the connection point of flickermeter
Data collected to be directly processed
by a
Oscilloscope / ADC
modules of DSP
microproce
Laboratory Milliseconds 10
minutes
Research organism
(IREC)

IDE4L Deliverable D7.1
102 IDE4L is a project co-funded by the European Commission
microprocessor of the
active filter to be
designed in the project
or to be saved for further
analyses.
ssor building up the active
filter based on power
electronics to be
developed in the
project. The sample rate should
be in the range of no more than 20 ms so as
to represent
phenomena with a
frequency lower than 50 Hz. This continuous measurement serves
to continuously update
the so called
instantaneous flicker index. This
index is averaged
(considering the last
10 minutes of
measurements) to
calculate the so-called
short-term flicker
index (see the
description in KPI
formula

IDE4L Deliverable D7.1
103 IDE4L is a project co-funded by the European Commission
section).
KPI BASELINE
Source of Baseline Condition
LITERATURE VALUES
COMPANY HISTORICAL VALUES
VALUES MEASURED AT START OF PROJECT
Details of Baseline Proposed concepts are to be tested in laboratory, so this provides us with flexibility to perform the baseline scenario from which it would be easy to evaluate the proposed KPI.
Responsible (Name, Company) for Baseline
Research organism (IREC)
GENERAL COMMENTS
6.15 UC15: Expansion Planning In this Use Case, one KPI has been defined:
Expansion planning scenario evaluation (EPSE)
BASIC KPI INFORMATION
KPI Name Expansion Planning Scenario Evaluation KPI ID EPSE
Main Objective To evaluate different planning strategies’ pros and cons.
KPI Description The KPI evaluates the quality of planning solution in comparison to other possible development sequences.
KPI Formula
Nomenclature
Vn, h nodal voltage on node n at hour h
Nnodes Number of system nodes
Ncust Total number of customers
Toutage,ann,x Annual outage time at location x
Ncust,x Number of customers at location x
λx Annual average fault rate at location x
Ncomp Number of network components
CMaint,i(t) Annual maintenance costs of component i at year t
Vul Highest permissible voltage (pu)
Vll Lowest permissible voltage (pu)
Irating, i Current rating for component i
Icomp,i,h Current of component i at hour h
CCIC Total cost of interruption

IDE4L Deliverable D7.1
104 IDE4L is a project co-funded by the European Commission
Cintr,s,i Cost of short interruption for customer i
Cintr,i(T) Cost of interruption of T hours for customer i
Pgen Total nominal generation in the system
Pgen,cap System hosting capacity
Pload Total nominal load in the system
Pload,cap System loading capacity
CDFV,n,h(V) Cumulative distribution function of nodal voltage at hour h on node n
Pdist,i per kWh price of distribution for customer i.
Edemand, i Average hourly demand of energy for customer i
Toutage, i Average annual outage time for customer i
Nintr,s,i Average annual number of short interruptions for customer i
tbeg first year of development step
tend last year of development step
Cinv,k(t) Annual investments at year t, for transition k
tref Reference year for capitalization
r interest rate
Nk Number of transitions in development scenario
Closs Total cost of network losses during one development step
closs(t) Average cost of loss energy
Eloss,i(t) Annual energy loss of component i
Cact,i(t) Cost of active services for customer i
CAct Total cost of active services
NAct Total number of active control actions
Nact,i(t) Number of active control actions for customer i
NAct,cust Total number of customers providing active control services
Following formulas are calculated for every development step of the expansion planning scenario. This gives a sequence of values for every variable so that the evolution of a single variable can be observed trough the planning scenario.
NETWORK CAPACITY
Network hosting capacity for generation and load is defined as a difference
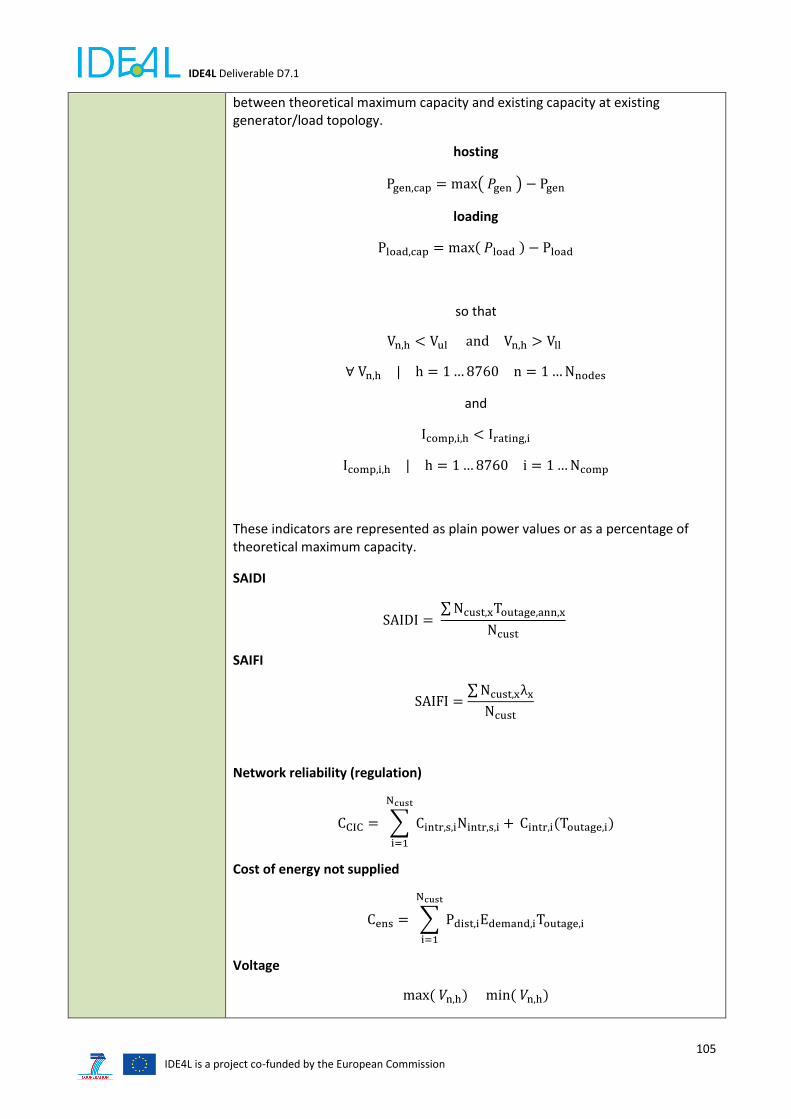
IDE4L Deliverable D7.1
105 IDE4L is a project co-funded by the European Commission
between theoretical maximum capacity and existing capacity at existing generator/load topology.
hosting
Pgen,cap = max( 𝑃gen ) − Pgen
loading
Pload,cap = max( 𝑃load ) − Pload
so that
Vn,h < Vul and Vn,h > Vll
∀ Vn,h | h = 1 … 8760 n = 1 … Nnodes
and
Icomp,i,h < Irating,i
Icomp,i,h | h = 1 … 8760 i = 1 … Ncomp
These indicators are represented as plain power values or as a percentage of theoretical maximum capacity.
SAIDI
SAIDI = ∑ Ncust,xToutage,ann,x
Ncust
SAIFI
SAIFI =∑ Ncust,xλx
Ncust
Network reliability (regulation)
CCIC = ∑ Cintr,s,iNintr,s,i +
Ncust
i=1
Cintr,i(Toutage,i)
Cost of energy not supplied
Cens = ∑ Pdist,iEdemand,iToutage,i
Ncust
i=1
Voltage
max ( 𝑉n,h) min ( 𝑉n,h)

IDE4L Deliverable D7.1
106 IDE4L is a project co-funded by the European Commission
𝑉n,h = {Vn,h} | h = 1 … 8760 n = 1 … Nnodes
This is a direct output of power flow calculation
Probability of under/overvoltage
povervoltage = 1 − CDFV,n,h(Vul)
where n and h are the node and hour of highest system voltage respectively
pundervoltage = CDFV,n,h(Vll)
where n and h are the node and hour of lowest system voltage
Costs of losses
Closs = ∑ ∑ closs(t)Eloss,i(t)
Ncomp
i=1
tend
t=tbeg
Maintenance costs
CMaint = ∑ ∑ CMaint,i(t)
Ncomp
i=1
tend
t=tbeg
Investment costs
Cinvestments = ∑ ∑1
(1 + r100⁄ )
t−tref
tend
t=tbeg
k=Nk
k=1
Cinv,k(t)
Usage of active control services
CAct = ∑ ∑ Cact,i(t)
Ncust
i=1
tend
t=tbeg
NAct = ∑ ∑ Nact,i(t)
Ncust
i=1
tend
t=tbeg
NAct,cust = ∑ Ni
Ncust
i=1
Ni , customer i is active (1,0)
Unit of measurement €, kW, pu, %, interruptions per customer, hours or unitless
Connection / Link with other relevant defined KPIs and Use Cases
This KPI is linked to ‘Expansion Planning’ Use Case Also connection with KPI Target Network Planning
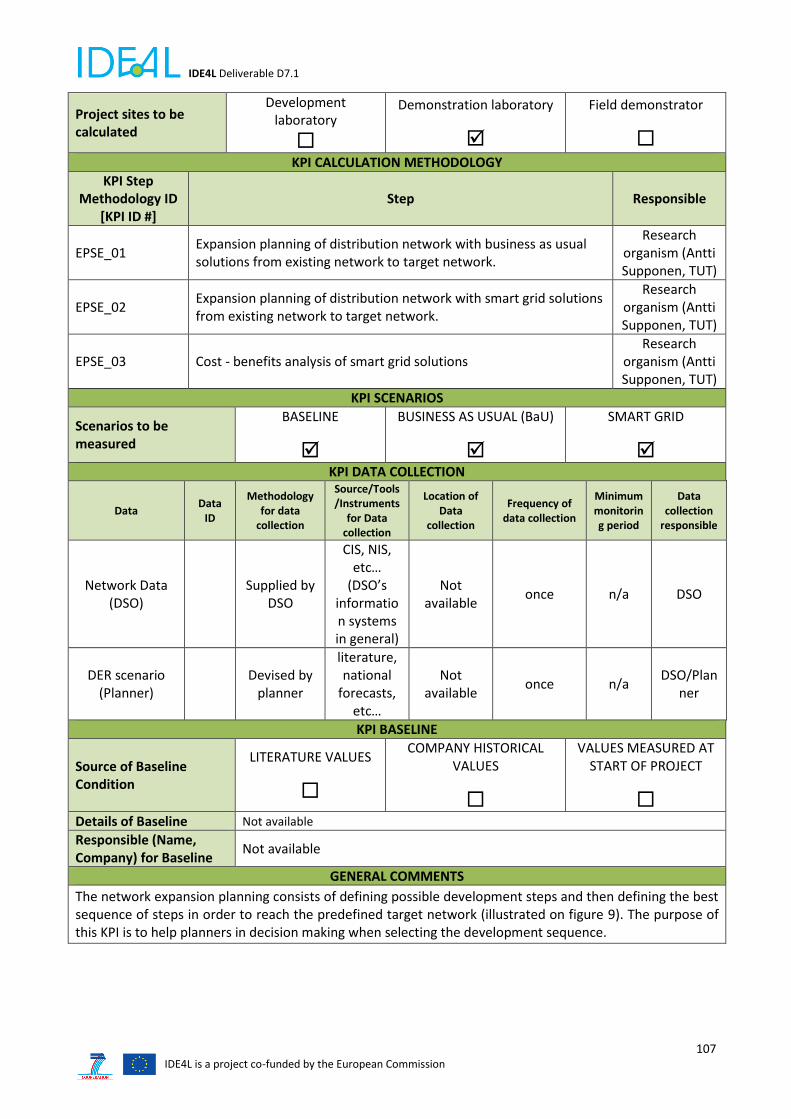
IDE4L Deliverable D7.1
107 IDE4L is a project co-funded by the European Commission
Project sites to be calculated
Development laboratory
Demonstration laboratory
Field demonstrator
KPI CALCULATION METHODOLOGY
KPI Step Methodology ID
[KPI ID #] Step Responsible
EPSE_01 Expansion planning of distribution network with business as usual solutions from existing network to target network.
Research organism (Antti Supponen, TUT)
EPSE_02 Expansion planning of distribution network with smart grid solutions from existing network to target network.
Research organism (Antti Supponen, TUT)
EPSE_03 Cost - benefits analysis of smart grid solutions Research
organism (Antti Supponen, TUT)
KPI SCENARIOS
Scenarios to be measured
BASELINE
BUSINESS AS USUAL (BaU)
SMART GRID
KPI DATA COLLECTION
Data Data
ID
Methodology for data
collection
Source/Tools/Instruments
for Data collection
Location of Data
collection
Frequency of data collection
Minimum monitoring period
Data collection
responsible
Network Data (DSO)
Supplied by DSO
CIS, NIS, etc…
(DSO’s information systems in general)
Not available
once n/a DSO
DER scenario (Planner)
Devised by planner
literature, national
forecasts, etc…
Not available
once n/a DSO/Plan
ner
KPI BASELINE
Source of Baseline Condition
LITERATURE VALUES
COMPANY HISTORICAL VALUES
VALUES MEASURED AT START OF PROJECT
Details of Baseline Not available
Responsible (Name, Company) for Baseline
Not available
GENERAL COMMENTS
The network expansion planning consists of defining possible development steps and then defining the best sequence of steps in order to reach the predefined target network (illustrated on figure 9). The purpose of this KPI is to help planners in decision making when selecting the development sequence.

IDE4L Deliverable D7.1
108 IDE4L is a project co-funded by the European Commission
Current network
Target Network(s)
Possible developement steps
One possible developement scenario
Figure 9: Expansion planning
Assumptions of calculations:
Temporal information from city planning is available.
DER scenario provides information about changes of loads and production in general.
Planning will consider only MV network. HV network is assumed to be ideal. Primary and secondary
substation sitting is not considered i.e. substations are located in given places. LV customers are
divided between neighboring secondary substations based on “electrical distance” principle.
o LV feeders are not modeled. Distribution transformer is included in the model.
o Aggregated loads (statistical sum of load profiles) and production (time series of DG unit
types, correlation within DG unit type is one)
o Replacement costs are considered (aging of network (possible maximum service lifetime) or
component rating).
o Protection requirements (short-circuit current) determine the size of cables and over-
loading of cables is not possible with hourly average values. Therefore congestion
management is needed only for a secondary transformer.
Outage costs:
o Fictive cost utilized in network regulation (profit regulation) to optimize network
investment cost and inconvenience caused by outage from societal viewpoint.
Variable cost component dependent on outage duration: very short < 1s and short
< 3 min (low value) and long (high value)
o Direct cost of energy not supplied only for faults of long duration.

IDE4L Deliverable D7.1
109 IDE4L is a project co-funded by the European Commission
Assumptions of reliability analysis:
o Substation and HV network failures are not considered.
o Failure rate of MV line is dependent on type of line (cable, covered conductor overhead line
or bare overhead line) and terrain of overhead line (field, beside a road or in forest).
o Failure rate of components is dependent on age of component after nominal lifetime (<
possible maximum service lifetime).
o Outage duration: switching time (automation functionality (fast < 1s, slow < 3 min, very
slow ASAP) and type of switches), repair time of permanent faults (statistical variable), and
number of simultaneous faults.
o Island operation is not considered.
Investment costs:
o Electrical component costs are fixed. They don’t change over time.
o Investment has an initial cost. For example if two investments from the same area may be
combined together, they have also a single initial cost.
o Rates of inflation, interest, etc. are constants.
Parameters of automation/ICT: Initial cost, operational cost (maintenance/service cost), size of
system, and number of actions (amount of data). Three scenarios for automation/ICT: i) DSO owns
and operates everything, ii) DSO owns controls of DER but purchase communication services, and
iii) DSO purchase only services.
Costs of active controls:
o Direct control of DSO’s resources has fixed value based on average maintenance cost of
resource.
o Direct control of DERs has fixed compensation per action (e.g. €/kWh/h) and annual
compensation (compensation may have different value for each DER)
o Indirect control has variable compensation per action based on day-ahead market price.
Energy consumed by network losses:
o The cost of losses is the average of day-ahead market price over several years.
o The cost itself may be part of DSO planning optimization or not (depending who is paying
losses in national regulation model).
Modeling of operational decisions is simplified:
o Energy management of day-ahead market does not include forecasting of price, load or
production (price, load and generation has a given scenario), bidding strategies, etc. The
demand response of DERs is based on cost optimization of energy price (consumed and
produced) and variable grid tariff (consumed and produced).
o Intra-hour behavior of DERs is not considered.
o Availabilities of DERs, communication, active controls, etc. are based on normal behavior,
i.e. failures of them are not considered. Alternative scenario may consider different kind of
availabilities.
The progress of following network performance variables are considered through the planning horizon:
Network capacity
- loading and hosting
Reliability

IDE4L Deliverable D7.1
110 IDE4L is a project co-funded by the European Commission
- indexes (SAIDI, SAIFI, …)
- cost of reliability (outage costs)
Voltage level
- Lowest and highest voltage levels in network
- Probability of under or overvoltage
- Costs of losses
Maintenance cost
- The age of network components impact on maintenance cost.
Investment costs
- Costs of transition from one development step to another
Usage of active control methods (DR, AVC, Congestion management, …)
- Cost of usage (production curtailment, ancillary services, …)
The KPI shall indicate if a strategy of using active network management functionalities would lead to lower total expenses for DSO over the planning horizon than a strategy of using passive reinforcement methods.
6.16 UC16: Operational Planning Two KPIs are defined in this case:
Reduction of energy cost (COST)
BASIC KPI INFORMATION
KPI Name Reduction of energy cost KPI ID COST
Main Objective Assess the economic benefits of a scheduling strategy for prosumers coordinated by an aggregator.
KPI Description The KPI will measure the cost of the energy traded by an aggregator in the organized markets (day-ahead and intraday) when following different optimization strategies, and will compare them.
KPI Formula COST = COSTSmartGrid – COSTBaseline/BAU
Unit of measurement Euro per year (or other period of time).
Connection / Link with other relevant defined KPIs and Use Cases
The KPI is for the use case “Operational Planning”. Similar to WP5-DADR
Project sites to be calculated
Development laboratory
Demonstration laboratory
Field demonstrator
KPI CALCULATION METHODOLOGY
KPI Step Methodology ID
[KPI ID #] Step Responsible
COST_01 Baseline scenario definition Grid
operator/evaluator
COST_02 Simulation baseline scenario Evaluator
COST_03 Cost evaluation of baseline scenario Evaluator
COST_04 BaU scenario definition Grid
operator/evaluator
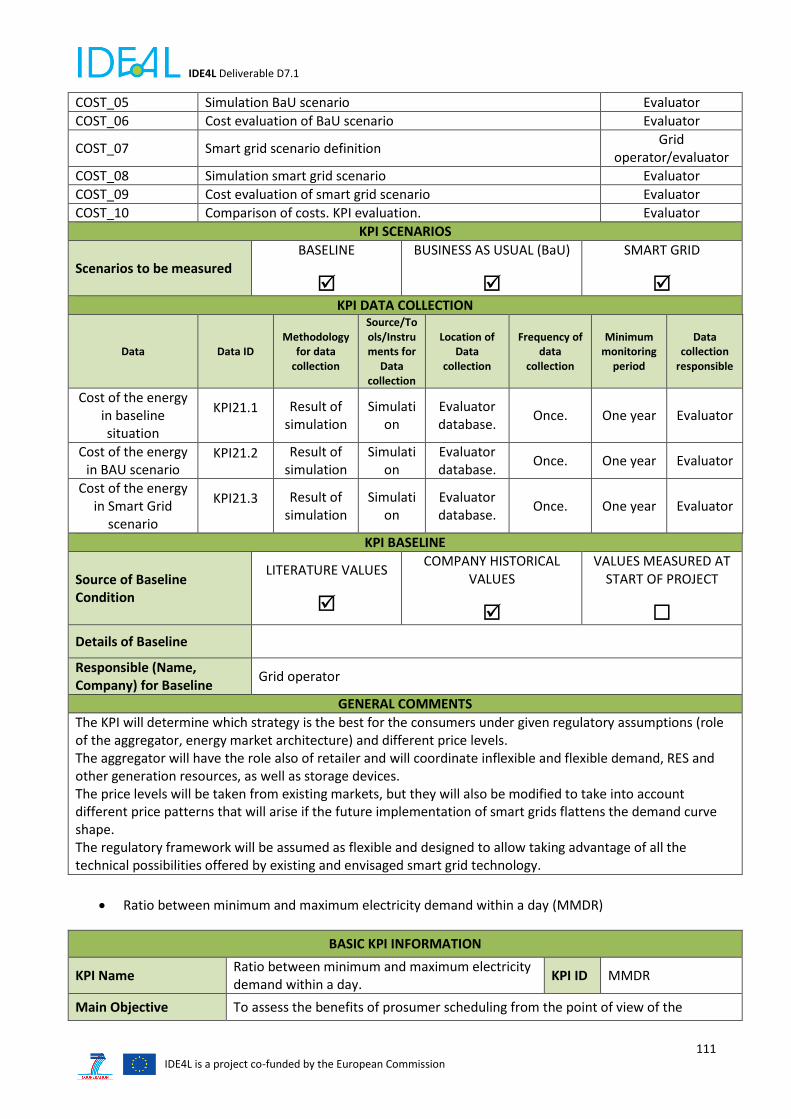
IDE4L Deliverable D7.1
111 IDE4L is a project co-funded by the European Commission
COST_05 Simulation BaU scenario Evaluator
COST_06 Cost evaluation of BaU scenario Evaluator
COST_07 Smart grid scenario definition Grid
operator/evaluator
COST_08 Simulation smart grid scenario Evaluator
COST_09 Cost evaluation of smart grid scenario Evaluator
COST_10 Comparison of costs. KPI evaluation. Evaluator
KPI SCENARIOS
Scenarios to be measured BASELINE
BUSINESS AS USUAL (BaU)
SMART GRID
KPI DATA COLLECTION
Data Data ID Methodology
for data collection
Source/Tools/Instruments for
Data collection
Location of Data
collection
Frequency of data
collection
Minimum monitoring
period
Data collection
responsible
Cost of the energy in baseline situation
KPI21.1 Result of simulation
Simulation
Evaluator database.
Once. One year Evaluator
Cost of the energy in BAU scenario
KPI21.2 Result of simulation
Simulation
Evaluator database.
Once. One year Evaluator
Cost of the energy in Smart Grid
scenario
KPI21.3 Result of simulation
Simulation
Evaluator database.
Once. One year Evaluator
KPI BASELINE
Source of Baseline Condition
LITERATURE VALUES
COMPANY HISTORICAL VALUES
VALUES MEASURED AT START OF PROJECT
Details of Baseline
Responsible (Name, Company) for Baseline
Grid operator
GENERAL COMMENTS
The KPI will determine which strategy is the best for the consumers under given regulatory assumptions (role of the aggregator, energy market architecture) and different price levels. The aggregator will have the role also of retailer and will coordinate inflexible and flexible demand, RES and other generation resources, as well as storage devices. The price levels will be taken from existing markets, but they will also be modified to take into account different price patterns that will arise if the future implementation of smart grids flattens the demand curve shape. The regulatory framework will be assumed as flexible and designed to allow taking advantage of all the technical possibilities offered by existing and envisaged smart grid technology.
Ratio between minimum and maximum electricity demand within a day (MMDR)
BASIC KPI INFORMATION
KPI Name Ratio between minimum and maximum electricity demand within a day.
KPI ID MMDR
Main Objective To assess the benefits of prosumer scheduling from the point of view of the

IDE4L Deliverable D7.1
112 IDE4L is a project co-funded by the European Commission
utilisation of the grid elements. The KPI is for the use case “Operational Planning”.
KPI Description
The ratios between maximum and minimum load for the daily consumption will be compared under different optimized scheduled, to see what is the most favourable for the system, allowing a better utilisation of existing assets and reducing the need of grid updates.
KPI Formula MMDR =
Dmax
Dmin
æ
èçö
ø÷jj=1
N
å
N N, number of days; Dmax/min maximum/minimum hourly
demand; j, day.
Unit of measurement Per unit/adimensional.
Connection / Link with other relevant defined KPIs and Use Cases
The KPI is for the use case “Operational Planning”.
Project sites to be calculated
Development laboratory
Demonstration laboratory
Field demonstrator
KPI CALCULATION METHODOLOGY
KPI Step Methodology ID
[KPI ID #] Step Responsible
MMDR_01 Baseline scenario definition Grid
operator/evaluator
MMDR_02 Simulation baseline scenario Evaluator
MMDR_03 Cost evaluation of baseline scenario Evaluator
MMDR_04 BaU scenario definition Grid
operator/evaluator
MMDR_05 Simulation BaU scenario Evaluator
MMDR_06 Cost evaluation of BaU scenario Evaluator
MMDR_07 Smart grid scenario definition Grid
operator/evaluator
MMDR_08 Simulation smart grid scenario Evaluator
MMDR_09 Cost evaluation of smart grid scenario Evaluator
MMDR_10 Comparison of costs. KPI evaluation. Evaluator
KPI SCENARIOS
Scenarios to be measured BASELINE
BUSINESS AS USUAL (BaU)
SMART GRID
KPI DATA COLLECTION
Data Data ID Methodology for data collection
Source/Tools/Instruments for Data collection
Location of Data
collection
Frequency of data
collection
Minimum monitoring
period
Data collection
responsible
Maximum hourly demand for every
day in a sample year
KPI22.1 Result of simulation
Simulation
Evaluator database.
Once One year Evaluator
Minimum hourly demand for every
day in a sample year
KPI22.1 Result of simulation
Simulation
Evaluator database.
Once One year Evaluator

IDE4L Deliverable D7.1
113 IDE4L is a project co-funded by the European Commission
KPI BASELINE
Source of Baseline Condition
LITERATURE VALUES
COMPANY HISTORICAL VALUES
VALUES MEASURED AT START OF PROJECT
Details of Baseline
Responsible (Name, Company) for Baseline
Grid operator
GENERAL COMMENTS
The use of scheduling strategies leads to the flattening of load curve, enabling a better utilisation of grid elements. This is possible thanks to optimized schedules that increase the consumption in the valley hours and reduce it in the peak hours. The reduction of this ratio leads to a better use of grid components. Different conditions, such as electrical heating, weather conditions, shares of industrial and domestic load will be taken into account, if there are data available. This KPI has been proposed by the EC Task Force for Smart Grids (KPI no. 21). [Giordano]
6.17 UC17: Target network Planning One KPI is defined to evaluate this Use Case:
Target network planning (TNP)
BASIC KPI INFORMATION
KPI Name Target Network Planning KPI ID TNP
Main Objective Planning future network under consideration of smart grid technologies
KPI Description This KPI plans long-term future and cost-optimal network for Medium and Low Voltage Level. In the long-term planning the benefits of considering smart-grid components could be evaluated.
KPI Formula
𝑇𝑁𝑃 = 𝐶𝑜𝑠𝑡𝑠𝐵𝑎𝑈 − 𝐶𝑜𝑠𝑡𝑠𝑆𝐺 or 𝑇𝑁𝑃 =𝐶𝑜𝑠𝑡𝑠𝐵𝑎𝑈−𝐶𝑜𝑠𝑡𝑠𝑆𝐺
𝐶𝑜𝑠𝑡𝑠𝐵𝑎𝑈⋅ 100%
With:
𝐶𝑜𝑠𝑡𝑠𝑥 = ∑(𝐶𝑐𝑜𝑚𝑝,𝑖,𝑥 + 𝐶𝑜𝑝,𝑖,𝑥) + 𝑃𝑙𝑜𝑠𝑠,𝑥 ⋅
𝑁
𝑖=0
𝐶𝑙𝑜𝑠𝑠
Unit of measurement Euro or %
Connection / Link with other relevant defined KPIs and Use Cases
This KPI is linked to ‘Target Network Planning’ Use Case
Project sites to be calculated
Development laboratory
Demonstration laboratory
Field demonstrator
KPI CALCULATION METHODOLOGY
KPI Step Methodology ID
[KPI ID #] Step Responsible
TNP_01 Business as usual planning of distribution network and evaluation of network costs 𝐶𝑜𝑠𝑡𝑠𝐵𝑎𝑈
Research organism
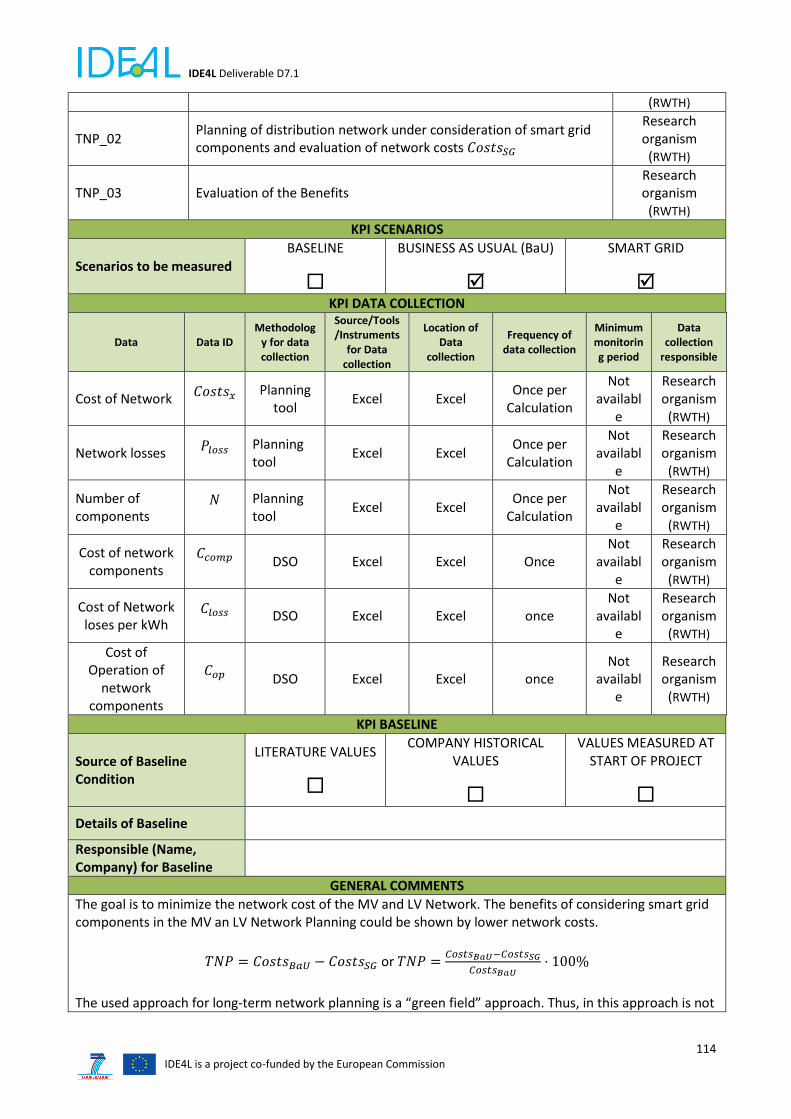
IDE4L Deliverable D7.1
114 IDE4L is a project co-funded by the European Commission
(RWTH)
TNP_02 Planning of distribution network under consideration of smart grid components and evaluation of network costs 𝐶𝑜𝑠𝑡𝑠𝑆𝐺
Research organism (RWTH)
TNP_03 Evaluation of the Benefits Research organism (RWTH)
KPI SCENARIOS
Scenarios to be measured BASELINE
BUSINESS AS USUAL (BaU)
SMART GRID
KPI DATA COLLECTION
Data Data ID Methodolog
y for data collection
Source/Tools/Instruments
for Data collection
Location of Data
collection
Frequency of data collection
Minimum monitoring period
Data collection
responsible
Cost of Network 𝐶𝑜𝑠𝑡𝑠𝑥 Planning
tool Excel Excel
Once per Calculation
Not availabl
e
Research organism (RWTH)
Network losses 𝑃𝑙𝑜𝑠𝑠 Planning tool
Excel Excel Once per
Calculation
Not availabl
e
Research organism (RWTH)
Number of components
𝑁 Planning tool
Excel Excel Once per
Calculation
Not availabl
e
Research organism (RWTH)
Cost of network components
𝐶𝑐𝑜𝑚𝑝 DSO Excel Excel Once
Not availabl
e
Research organism (RWTH)
Cost of Network loses per kWh
𝐶𝑙𝑜𝑠𝑠 DSO Excel Excel once
Not availabl
e
Research organism (RWTH)
Cost of Operation of
network components
𝐶𝑜𝑝 DSO Excel Excel once
Not availabl
e
Research organism (RWTH)
KPI BASELINE
Source of Baseline Condition
LITERATURE VALUES
COMPANY HISTORICAL VALUES
VALUES MEASURED AT START OF PROJECT
Details of Baseline
Responsible (Name, Company) for Baseline
GENERAL COMMENTS
The goal is to minimize the network cost of the MV and LV Network. The benefits of considering smart grid components in the MV an LV Network Planning could be shown by lower network costs.
𝑇𝑁𝑃 = 𝐶𝑜𝑠𝑡𝑠𝐵𝑎𝑈 − 𝐶𝑜𝑠𝑡𝑠𝑆𝐺 or 𝑇𝑁𝑃 =𝐶𝑜𝑠𝑡𝑠𝐵𝑎𝑈−𝐶𝑜𝑠𝑡𝑠𝑆𝐺
𝐶𝑜𝑠𝑡𝑠𝐵𝑎𝑈⋅ 100%
The used approach for long-term network planning is a “green field” approach. Thus, in this approach is not
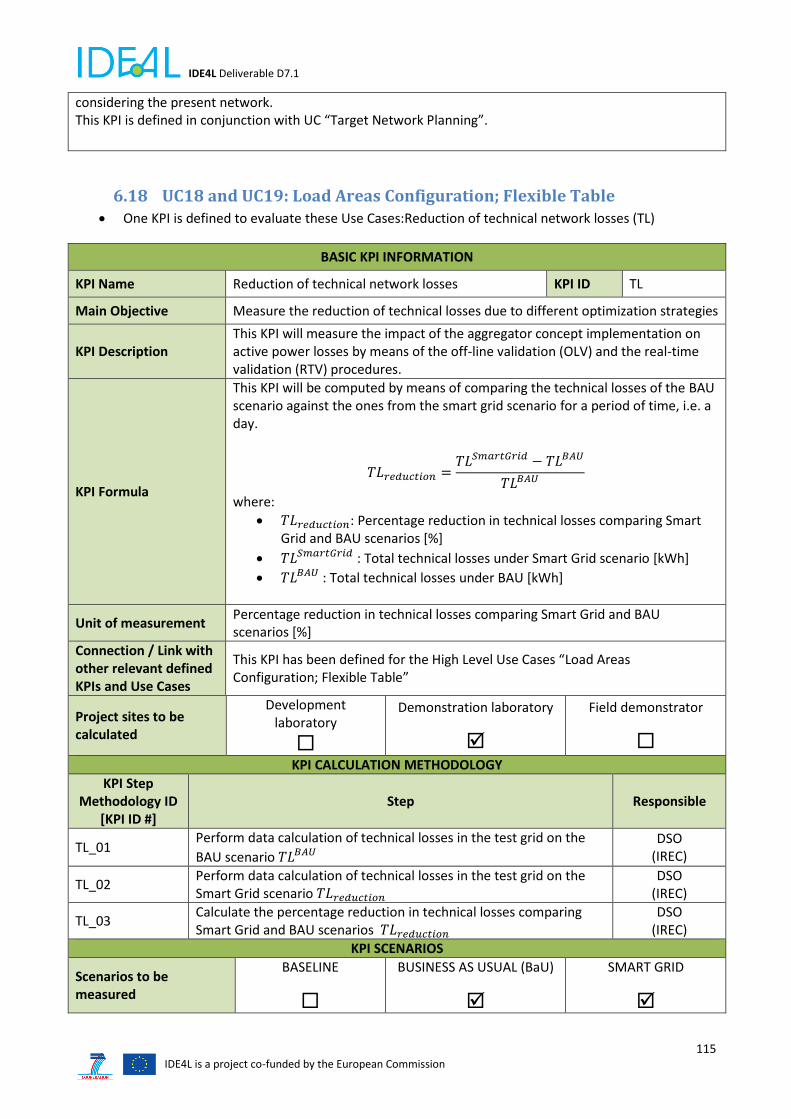
IDE4L Deliverable D7.1
115 IDE4L is a project co-funded by the European Commission
considering the present network. This KPI is defined in conjunction with UC “Target Network Planning”.
6.18 UC18 and UC19: Load Areas Configuration; Flexible Table One KPI is defined to evaluate these Use Cases:Reduction of technical network losses (TL)
BASIC KPI INFORMATION
KPI Name Reduction of technical network losses KPI ID TL
Main Objective Measure the reduction of technical losses due to different optimization strategies
KPI Description This KPI will measure the impact of the aggregator concept implementation on active power losses by means of the off-line validation (OLV) and the real-time validation (RTV) procedures.
KPI Formula
This KPI will be computed by means of comparing the technical losses of the BAU scenario against the ones from the smart grid scenario for a period of time, i.e. a day.
𝑇𝐿𝑟𝑒𝑑𝑢𝑐𝑡𝑖𝑜𝑛 =𝑇𝐿𝑆𝑚𝑎𝑟𝑡𝐺𝑟𝑖𝑑 − 𝑇𝐿𝐵𝐴𝑈
𝑇𝐿𝐵𝐴𝑈
where:
𝑇𝐿𝑟𝑒𝑑𝑢𝑐𝑡𝑖𝑜𝑛: Percentage reduction in technical losses comparing Smart Grid and BAU scenarios [%]
𝑇𝐿𝑆𝑚𝑎𝑟𝑡𝐺𝑟𝑖𝑑 : Total technical losses under Smart Grid scenario [kWh]
𝑇𝐿𝐵𝐴𝑈 : Total technical losses under BAU [kWh]
Unit of measurement Percentage reduction in technical losses comparing Smart Grid and BAU scenarios [%]
Connection / Link with other relevant defined KPIs and Use Cases
This KPI has been defined for the High Level Use Cases “Load Areas Configuration; Flexible Table”
Project sites to be calculated
Development laboratory
Demonstration laboratory
Field demonstrator
KPI CALCULATION METHODOLOGY
KPI Step Methodology ID
[KPI ID #] Step Responsible
TL_01 Perform data calculation of technical losses in the test grid on the
BAU scenario 𝑇𝐿𝐵𝐴𝑈
DSO (IREC)
TL_02 Perform data calculation of technical losses in the test grid on the Smart Grid scenario 𝑇𝐿𝑟𝑒𝑑𝑢𝑐𝑡𝑖𝑜𝑛
DSO (IREC)
TL_03 Calculate the percentage reduction in technical losses comparing Smart Grid and BAU scenarios 𝑇𝐿𝑟𝑒𝑑𝑢𝑐𝑡𝑖𝑜𝑛
DSO (IREC)
KPI SCENARIOS
Scenarios to be measured
BASELINE
BUSINESS AS USUAL (BaU)
SMART GRID
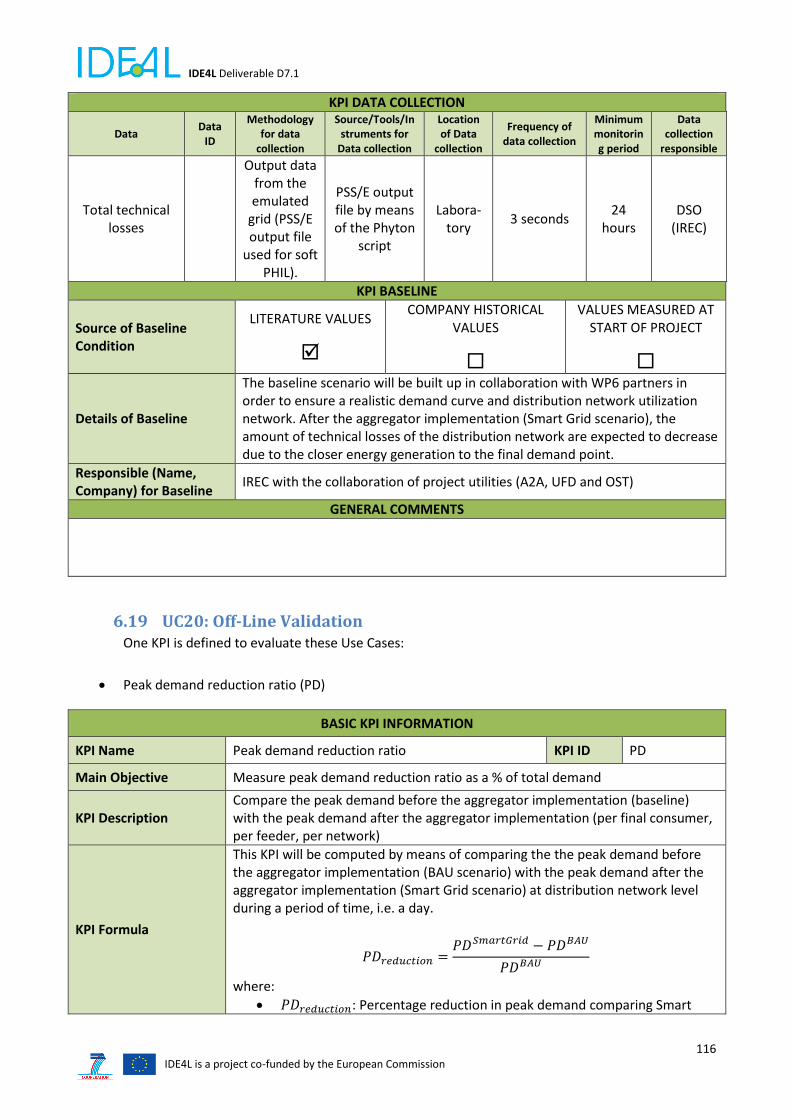
IDE4L Deliverable D7.1
116 IDE4L is a project co-funded by the European Commission
KPI DATA COLLECTION
Data Data ID
Methodology for data
collection
Source/Tools/Instruments for
Data collection
Location of Data
collection
Frequency of data collection
Minimum monitoring period
Data collection
responsible
Total technical losses
Output data from the emulated
grid (PSS/E output file
used for soft PHIL).
PSS/E output file by means of the Phyton
script
Labora-tory
3 seconds 24
hours DSO
(IREC)
KPI BASELINE
Source of Baseline Condition
LITERATURE VALUES
COMPANY HISTORICAL VALUES
VALUES MEASURED AT START OF PROJECT
Details of Baseline
The baseline scenario will be built up in collaboration with WP6 partners in order to ensure a realistic demand curve and distribution network utilization network. After the aggregator implementation (Smart Grid scenario), the amount of technical losses of the distribution network are expected to decrease due to the closer energy generation to the final demand point.
Responsible (Name, Company) for Baseline
IREC with the collaboration of project utilities (A2A, UFD and OST)
GENERAL COMMENTS
6.19 UC20: Off-Line Validation One KPI is defined to evaluate these Use Cases:
Peak demand reduction ratio (PD)
BASIC KPI INFORMATION
KPI Name Peak demand reduction ratio KPI ID PD
Main Objective Measure peak demand reduction ratio as a % of total demand
KPI Description Compare the peak demand before the aggregator implementation (baseline) with the peak demand after the aggregator implementation (per final consumer, per feeder, per network)
KPI Formula
This KPI will be computed by means of comparing the the peak demand before the aggregator implementation (BAU scenario) with the peak demand after the aggregator implementation (Smart Grid scenario) at distribution network level during a period of time, i.e. a day.
𝑃𝐷𝑟𝑒𝑑𝑢𝑐𝑡𝑖𝑜𝑛 =𝑃𝐷𝑆𝑚𝑎𝑟𝑡𝐺𝑟𝑖𝑑 − 𝑃𝐷𝐵𝐴𝑈
𝑃𝐷𝐵𝐴𝑈
where:
𝑃𝐷𝑟𝑒𝑑𝑢𝑐𝑡𝑖𝑜𝑛: Percentage reduction in peak demand comparing Smart
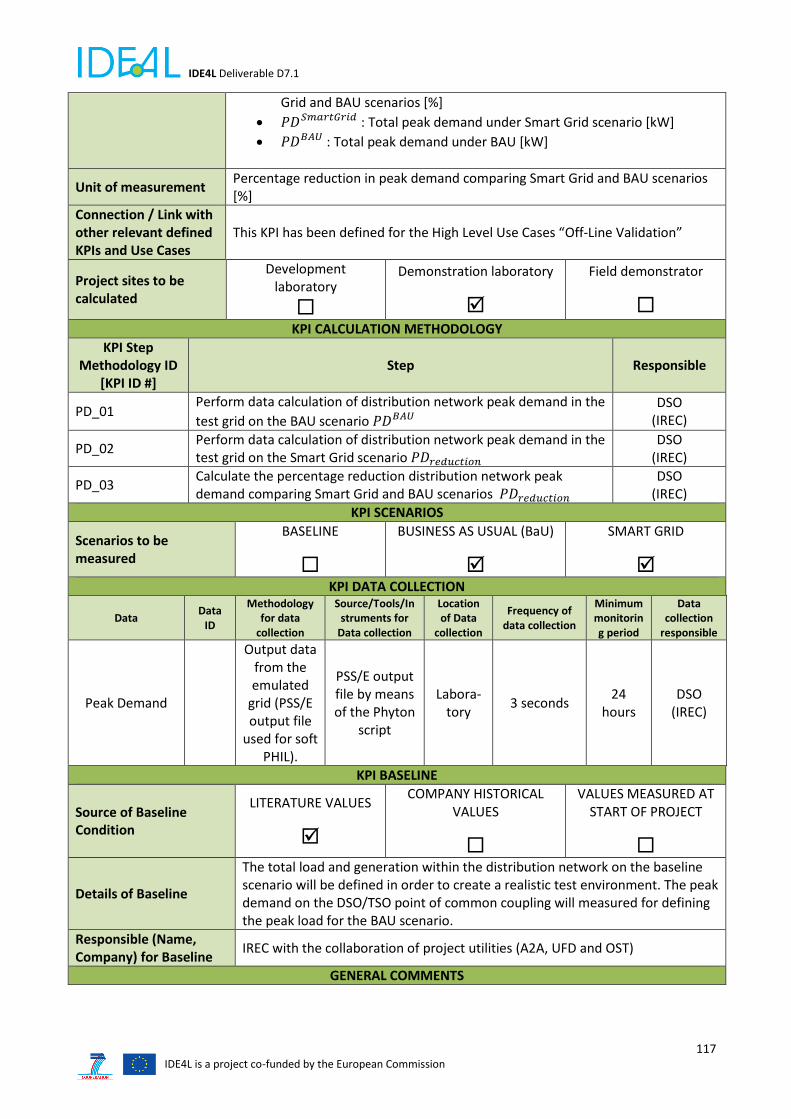
IDE4L Deliverable D7.1
117 IDE4L is a project co-funded by the European Commission
Grid and BAU scenarios [%]
𝑃𝐷𝑆𝑚𝑎𝑟𝑡𝐺𝑟𝑖𝑑 : Total peak demand under Smart Grid scenario [kW]
𝑃𝐷𝐵𝐴𝑈 : Total peak demand under BAU [kW]
Unit of measurement Percentage reduction in peak demand comparing Smart Grid and BAU scenarios [%]
Connection / Link with other relevant defined KPIs and Use Cases
This KPI has been defined for the High Level Use Cases “Off-Line Validation”
Project sites to be calculated
Development laboratory
Demonstration laboratory
Field demonstrator
KPI CALCULATION METHODOLOGY
KPI Step Methodology ID
[KPI ID #] Step Responsible
PD_01 Perform data calculation of distribution network peak demand in the
test grid on the BAU scenario 𝑃𝐷𝐵𝐴𝑈
DSO (IREC)
PD_02 Perform data calculation of distribution network peak demand in the test grid on the Smart Grid scenario 𝑃𝐷𝑟𝑒𝑑𝑢𝑐𝑡𝑖𝑜𝑛
DSO (IREC)
PD_03 Calculate the percentage reduction distribution network peak demand comparing Smart Grid and BAU scenarios 𝑃𝐷𝑟𝑒𝑑𝑢𝑐𝑡𝑖𝑜𝑛
DSO (IREC)
KPI SCENARIOS
Scenarios to be measured
BASELINE
BUSINESS AS USUAL (BaU)
SMART GRID
KPI DATA COLLECTION
Data Data ID
Methodology for data
collection
Source/Tools/Instruments for
Data collection
Location of Data
collection
Frequency of data collection
Minimum monitoring period
Data collection
responsible
Peak Demand
Output data from the emulated
grid (PSS/E output file
used for soft PHIL).
PSS/E output file by means of the Phyton
script
Labora-tory
3 seconds 24
hours DSO
(IREC)
KPI BASELINE
Source of Baseline Condition
LITERATURE VALUES
COMPANY HISTORICAL VALUES
VALUES MEASURED AT START OF PROJECT
Details of Baseline
The total load and generation within the distribution network on the baseline scenario will be defined in order to create a realistic test environment. The peak demand on the DSO/TSO point of common coupling will measured for defining the peak load for the BAU scenario.
Responsible (Name, Company) for Baseline
IREC with the collaboration of project utilities (A2A, UFD and OST)
GENERAL COMMENTS

IDE4L Deliverable D7.1
118 IDE4L is a project co-funded by the European Commission
6.20 UC21: Real-time Validation One KPI is defined to evaluate this Use Case:
Percentage utilization of electricity network components (U)
BASIC KPI INFORMATION
KPI Name Percentage utilization of electricity network components
KPI ID U
Main Objective Calculate the percentage utilization of the components of the distribution network under analysis
KPI Description This KPI captures the relative improvement of capacity utilization in the SG scenario compared to the BaU scenario, normalized by means of the nominal capacity of the component weighted with the capital cost of the component
KPI Formula
This KPI will be computed by means of comparing the weighted capacity utilization of the electricity network components on the BAU scenario against the ones from the smart grid scenario for a period of time, i.e. a day.
𝑈𝑖𝑛𝑐𝑟𝑒𝑎𝑠𝑒 =𝑈𝑆𝑚𝑎𝑟𝑡𝐺𝑟𝑖𝑑 − 𝑈𝐵𝐴𝑈
𝑈𝐵𝐴𝑈
where:
𝑈𝑖𝑛𝑐𝑟𝑒𝑎𝑠𝑒: Increase of the weighted capacity utilization of the electricity network components [%]
𝑈𝑆𝑚𝑎𝑟𝑡𝐺𝑟𝑖𝑑 : weighted capacity utilization of the electricity network components for the smart grid scenario [%]
𝑈𝐵𝐴𝑈 : weighted capacity utilization of the electricity network components for the business as usual scenario [%]
The calculation of the weighted capacity utilization of the electricity network components is described below:
𝑈𝑆 = ∑ 𝑈𝑖 ·𝐶𝑖
𝐶𝑇
𝑖=𝑁
𝑖=1
𝑈𝑖 =𝑃𝑖
𝑎𝑣𝑔
𝑃𝑖𝑛𝑜𝑚 · 100
𝐶𝑇 = ∑ 𝐶𝑖
𝑖=𝑁
𝑖=1
where:
𝑖 : index for the distribution network components (line or transformer)
𝑁 : total number of distribution network components
𝑈𝑆: weighted capacity utilization of the electricity distribution network
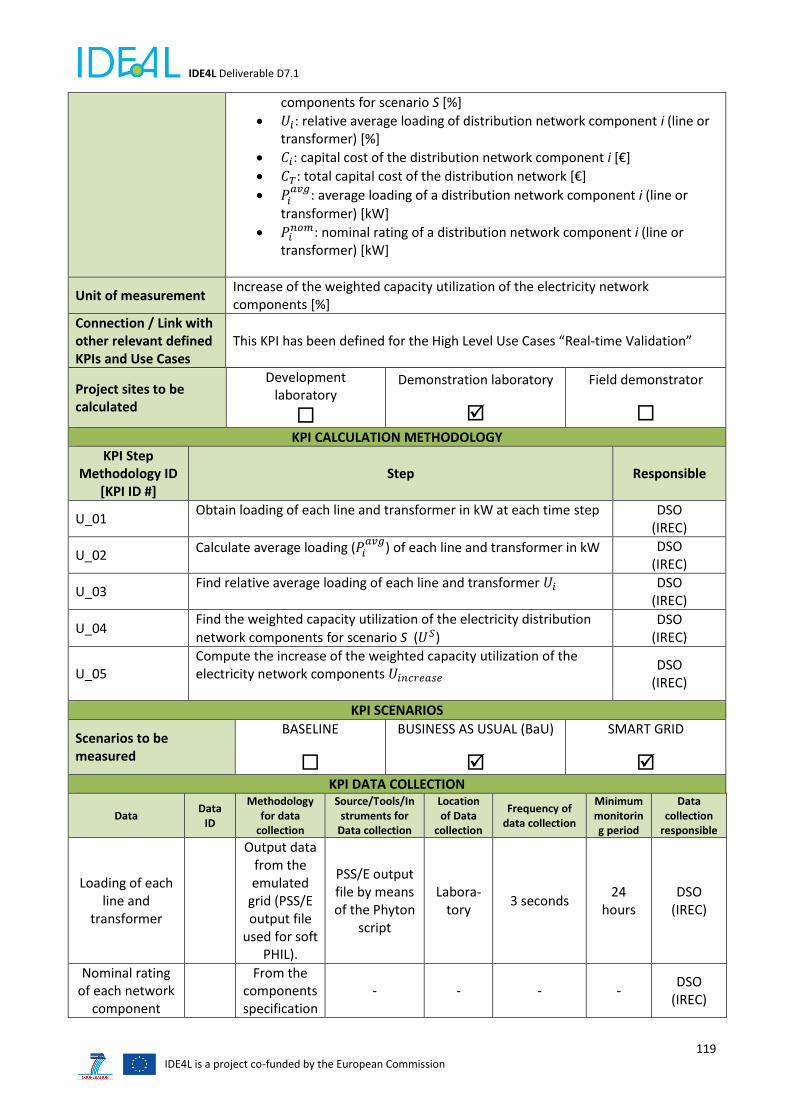
IDE4L Deliverable D7.1
119 IDE4L is a project co-funded by the European Commission
components for scenario S [%]
𝑈𝑖: relative average loading of distribution network component i (line or transformer) [%]
𝐶𝑖: capital cost of the distribution network component i [€]
𝐶𝑇: total capital cost of the distribution network [€]
𝑃𝑖𝑎𝑣𝑔
: average loading of a distribution network component i (line or
transformer) [kW]
𝑃𝑖𝑛𝑜𝑚: nominal rating of a distribution network component i (line or
transformer) [kW]
Unit of measurement Increase of the weighted capacity utilization of the electricity network components [%]
Connection / Link with other relevant defined KPIs and Use Cases
This KPI has been defined for the High Level Use Cases “Real-time Validation”
Project sites to be calculated
Development laboratory
Demonstration laboratory
Field demonstrator
KPI CALCULATION METHODOLOGY
KPI Step Methodology ID
[KPI ID #] Step Responsible
U_01 Obtain loading of each line and transformer in kW at each time step DSO
(IREC)
U_02 Calculate average loading (𝑃𝑖
𝑎𝑣𝑔) of each line and transformer in kW DSO
(IREC)
U_03 Find relative average loading of each line and transformer 𝑈𝑖 DSO
(IREC)
U_04 Find the weighted capacity utilization of the electricity distribution network components for scenario S (𝑈𝑆)
DSO (IREC)
U_05 Compute the increase of the weighted capacity utilization of the electricity network components 𝑈𝑖𝑛𝑐𝑟𝑒𝑎𝑠𝑒
DSO (IREC)
KPI SCENARIOS
Scenarios to be measured
BASELINE
BUSINESS AS USUAL (BaU)
SMART GRID
KPI DATA COLLECTION
Data Data ID
Methodology for data
collection
Source/Tools/Instruments for
Data collection
Location of Data
collection
Frequency of data collection
Minimum monitoring period
Data collection
responsible
Loading of each line and
transformer
Output data from the emulated
grid (PSS/E output file
used for soft PHIL).
PSS/E output file by means of the Phyton
script
Labora-tory
3 seconds 24
hours DSO
(IREC)
Nominal rating of each network
component
From the
components specification
- - - - DSO
(IREC)
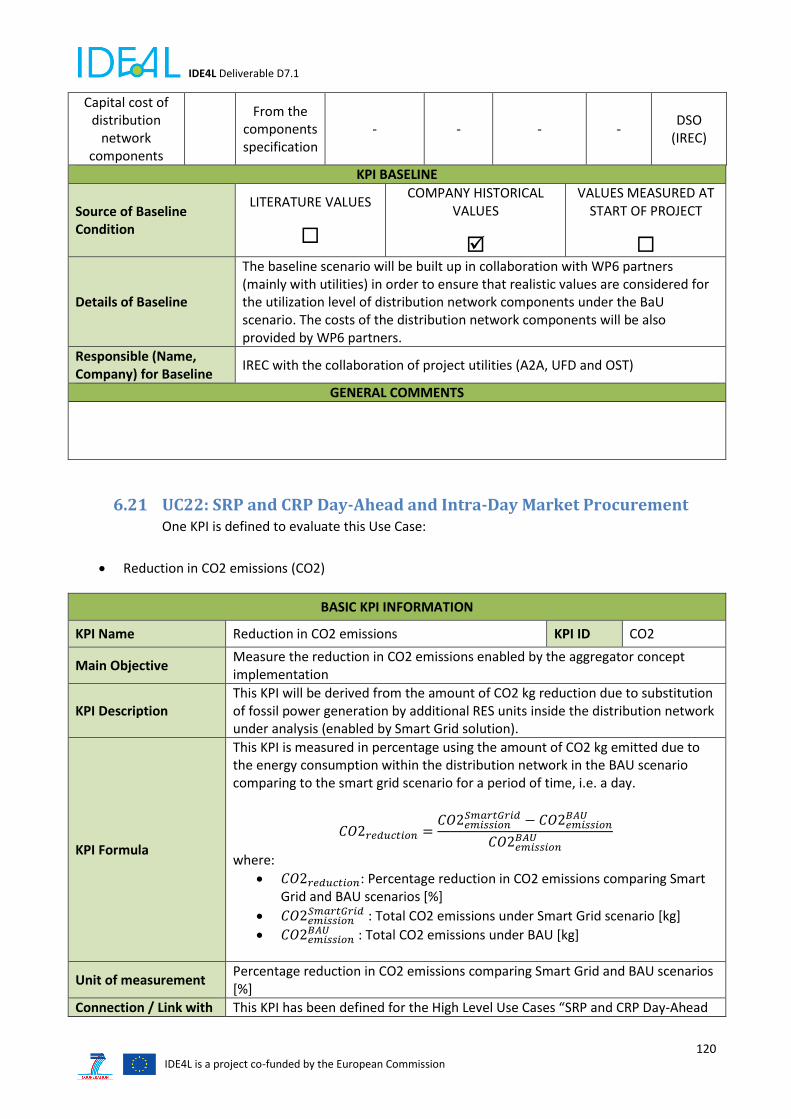
IDE4L Deliverable D7.1
120 IDE4L is a project co-funded by the European Commission
Capital cost of distribution
network components
From the
components specification
- - - - DSO
(IREC)
KPI BASELINE
Source of Baseline Condition
LITERATURE VALUES
COMPANY HISTORICAL VALUES
VALUES MEASURED AT START OF PROJECT
Details of Baseline
The baseline scenario will be built up in collaboration with WP6 partners (mainly with utilities) in order to ensure that realistic values are considered for the utilization level of distribution network components under the BaU scenario. The costs of the distribution network components will be also provided by WP6 partners.
Responsible (Name, Company) for Baseline
IREC with the collaboration of project utilities (A2A, UFD and OST)
GENERAL COMMENTS
6.21 UC22: SRP and CRP Day-Ahead and Intra-Day Market Procurement One KPI is defined to evaluate this Use Case:
Reduction in CO2 emissions (CO2)
BASIC KPI INFORMATION
KPI Name Reduction in CO2 emissions KPI ID CO2
Main Objective Measure the reduction in CO2 emissions enabled by the aggregator concept implementation
KPI Description This KPI will be derived from the amount of CO2 kg reduction due to substitution of fossil power generation by additional RES units inside the distribution network under analysis (enabled by Smart Grid solution).
KPI Formula
This KPI is measured in percentage using the amount of CO2 kg emitted due to the energy consumption within the distribution network in the BAU scenario comparing to the smart grid scenario for a period of time, i.e. a day.
𝐶𝑂2𝑟𝑒𝑑𝑢𝑐𝑡𝑖𝑜𝑛 =𝐶𝑂2𝑒𝑚𝑖𝑠𝑠𝑖𝑜𝑛
𝑆𝑚𝑎𝑟𝑡𝐺𝑟𝑖𝑑 − 𝐶𝑂2𝑒𝑚𝑖𝑠𝑠𝑖𝑜𝑛𝐵𝐴𝑈
𝐶𝑂2𝑒𝑚𝑖𝑠𝑠𝑖𝑜𝑛𝐵𝐴𝑈
where:
𝐶𝑂2𝑟𝑒𝑑𝑢𝑐𝑡𝑖𝑜𝑛: Percentage reduction in CO2 emissions comparing Smart Grid and BAU scenarios [%]
𝐶𝑂2𝑒𝑚𝑖𝑠𝑠𝑖𝑜𝑛𝑆𝑚𝑎𝑟𝑡𝐺𝑟𝑖𝑑 : Total CO2 emissions under Smart Grid scenario [kg]
𝐶𝑂2𝑒𝑚𝑖𝑠𝑠𝑖𝑜𝑛𝐵𝐴𝑈 : Total CO2 emissions under BAU [kg]
Unit of measurement Percentage reduction in CO2 emissions comparing Smart Grid and BAU scenarios [%]
Connection / Link with This KPI has been defined for the High Level Use Cases “SRP and CRP Day-Ahead

IDE4L Deliverable D7.1
121 IDE4L is a project co-funded by the European Commission
other relevant defined KPIs and Use Cases
and Intra-Day Market Procurement”
Project sites to be calculated
Development laboratory
Demonstration laboratory
Field demonstrator
KPI CALCULATION METHODOLOGY
KPI Step Methodology ID
[KPI ID #] Step Responsible
CO2_01 Perform data calculation of CO2 kg emission in the test grid on the
BAU scenario 𝐶𝑂2𝑒𝑚𝑖𝑠𝑠𝑖𝑜𝑛𝐵𝐴𝑈
DSO (IREC)
CO2_02 Perform data calculation of CO2 kg emission in the test grid on the
Smart Grid scenario 𝐶𝑂2𝑒𝑚𝑖𝑠𝑠𝑖𝑜𝑛𝑆𝑚𝑎𝑟𝑡𝐺𝑟𝑖𝑑
DSO (IREC)
CO2_03 Calculate the percentage reduction in CO2 emissions comparing Smart Grid and BAU scenarios 𝐶𝑂2𝑟𝑒𝑑𝑢𝑐𝑡𝑖𝑜𝑛
DSO (IREC)
KPI SCENARIOS
Scenarios to be measured
BASELINE
BUSINESS AS USUAL (BaU)
SMART GRID
KPI DATA COLLECTION
Data Data ID
Methodology for data
collection
Source/Tools/Instruments for
Data collection
Location of Data
collection
Frequency of data collection
Minimum monitoring period
Data collection
responsible
CO2 emission estimation
Output data from the emulated microgrid
(emulation cabinet), or
from the emulated
grid (PSS/E output file
used for soft PHIL).
Microgrid cabinet meter
/ PSS/E output file by means of the Phyton script
Utilization emission
factors of the different energy
sources. Estimation of
the C02 emissions per
kWh consumed from the
transmission grid
Labora-tory
3 seconds 24
hours DSO
(IREC)
KPI BASELINE
Source of Baseline Condition
LITERATURE VALUES
COMPANY HISTORICAL VALUES
VALUES MEASURED AT START OF PROJECT
Details of Baseline The main CO2 emissions will come from the energy consumed from the transmission system through the point of common coupling between the DSO
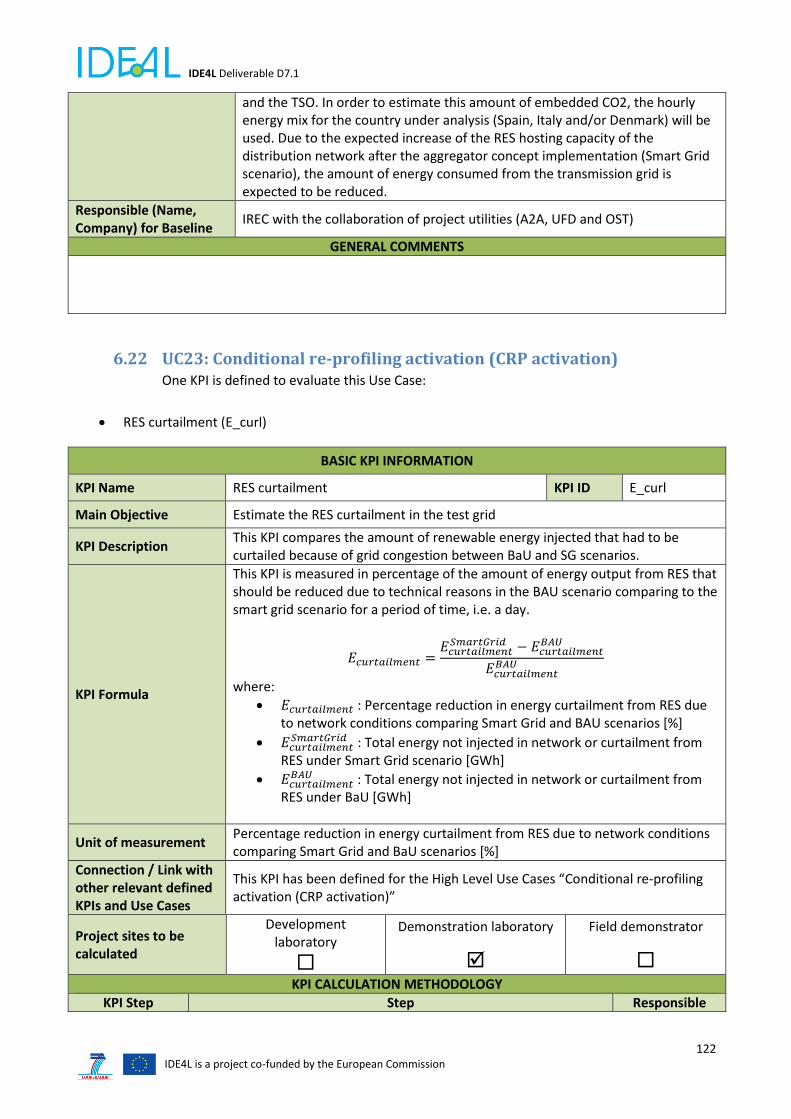
IDE4L Deliverable D7.1
122 IDE4L is a project co-funded by the European Commission
and the TSO. In order to estimate this amount of embedded CO2, the hourly energy mix for the country under analysis (Spain, Italy and/or Denmark) will be used. Due to the expected increase of the RES hosting capacity of the distribution network after the aggregator concept implementation (Smart Grid scenario), the amount of energy consumed from the transmission grid is expected to be reduced.
Responsible (Name, Company) for Baseline
IREC with the collaboration of project utilities (A2A, UFD and OST)
GENERAL COMMENTS
6.22 UC23: Conditional re-profiling activation (CRP activation) One KPI is defined to evaluate this Use Case:
RES curtailment (E_curl)
BASIC KPI INFORMATION
KPI Name RES curtailment KPI ID E_curl
Main Objective Estimate the RES curtailment in the test grid
KPI Description This KPI compares the amount of renewable energy injected that had to be curtailed because of grid congestion between BaU and SG scenarios.
KPI Formula
This KPI is measured in percentage of the amount of energy output from RES that should be reduced due to technical reasons in the BAU scenario comparing to the smart grid scenario for a period of time, i.e. a day.
𝐸𝑐𝑢𝑟𝑡𝑎𝑖𝑙𝑚𝑒𝑛𝑡 =𝐸𝑐𝑢𝑟𝑡𝑎𝑖𝑙𝑚𝑒𝑛𝑡
𝑆𝑚𝑎𝑟𝑡𝐺𝑟𝑖𝑑 − 𝐸𝑐𝑢𝑟𝑡𝑎𝑖𝑙𝑚𝑒𝑛𝑡𝐵𝐴𝑈
𝐸𝑐𝑢𝑟𝑡𝑎𝑖𝑙𝑚𝑒𝑛𝑡𝐵𝐴𝑈
where:
𝐸𝑐𝑢𝑟𝑡𝑎𝑖𝑙𝑚𝑒𝑛𝑡 : Percentage reduction in energy curtailment from RES due to network conditions comparing Smart Grid and BAU scenarios [%]
𝐸𝑐𝑢𝑟𝑡𝑎𝑖𝑙𝑚𝑒𝑛𝑡𝑆𝑚𝑎𝑟𝑡𝐺𝑟𝑖𝑑 : Total energy not injected in network or curtailment from
RES under Smart Grid scenario [GWh]
𝐸𝑐𝑢𝑟𝑡𝑎𝑖𝑙𝑚𝑒𝑛𝑡𝐵𝐴𝑈 : Total energy not injected in network or curtailment from
RES under BaU [GWh]
Unit of measurement Percentage reduction in energy curtailment from RES due to network conditions comparing Smart Grid and BaU scenarios [%]
Connection / Link with other relevant defined KPIs and Use Cases
This KPI has been defined for the High Level Use Cases “Conditional re-profiling activation (CRP activation)”
Project sites to be calculated
Development laboratory
Demonstration laboratory
Field demonstrator
KPI CALCULATION METHODOLOGY
KPI Step Step Responsible
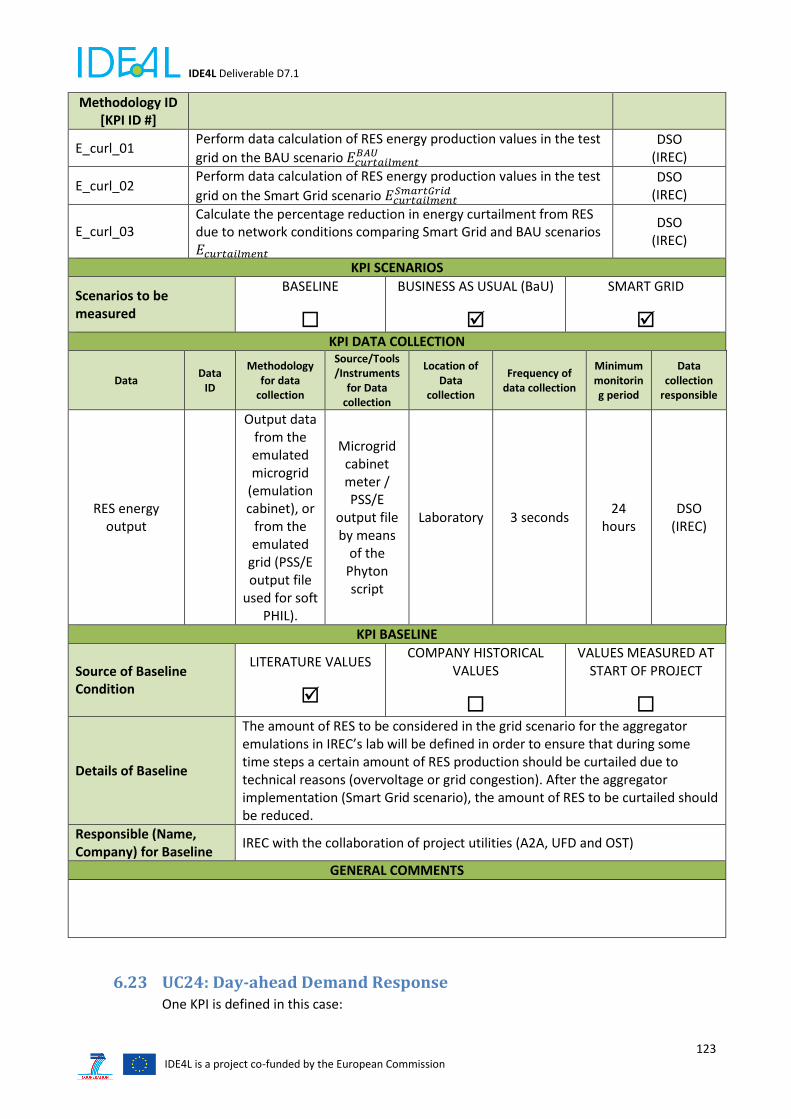
IDE4L Deliverable D7.1
123 IDE4L is a project co-funded by the European Commission
Methodology ID [KPI ID #]
E_curl_01 Perform data calculation of RES energy production values in the test
grid on the BAU scenario 𝐸𝑐𝑢𝑟𝑡𝑎𝑖𝑙𝑚𝑒𝑛𝑡𝐵𝐴𝑈
DSO (IREC)
E_curl_02 Perform data calculation of RES energy production values in the test
grid on the Smart Grid scenario 𝐸𝑐𝑢𝑟𝑡𝑎𝑖𝑙𝑚𝑒𝑛𝑡𝑆𝑚𝑎𝑟𝑡𝐺𝑟𝑖𝑑
DSO (IREC)
E_curl_03 Calculate the percentage reduction in energy curtailment from RES due to network conditions comparing Smart Grid and BAU scenarios 𝐸𝑐𝑢𝑟𝑡𝑎𝑖𝑙𝑚𝑒𝑛𝑡
DSO (IREC)
KPI SCENARIOS
Scenarios to be measured
BASELINE
BUSINESS AS USUAL (BaU)
SMART GRID
KPI DATA COLLECTION
Data Data ID
Methodology for data
collection
Source/Tools/Instruments
for Data collection
Location of Data
collection
Frequency of data collection
Minimum monitoring period
Data collection
responsible
RES energy output
Output data from the emulated microgrid
(emulation cabinet), or
from the emulated
grid (PSS/E output file
used for soft PHIL).
Microgrid cabinet meter / PSS/E
output file by means
of the Phyton script
Laboratory 3 seconds 24
hours DSO
(IREC)
KPI BASELINE
Source of Baseline Condition
LITERATURE VALUES
COMPANY HISTORICAL VALUES
VALUES MEASURED AT START OF PROJECT
Details of Baseline
The amount of RES to be considered in the grid scenario for the aggregator emulations in IREC’s lab will be defined in order to ensure that during some time steps a certain amount of RES production should be curtailed due to technical reasons (overvoltage or grid congestion). After the aggregator implementation (Smart Grid scenario), the amount of RES to be curtailed should be reduced.
Responsible (Name, Company) for Baseline
IREC with the collaboration of project utilities (A2A, UFD and OST)
GENERAL COMMENTS
6.23 UC24: Day-ahead Demand Response One KPI is defined in this case:

IDE4L Deliverable D7.1
124 IDE4L is a project co-funded by the European Commission
Demand Response (DR)
BASIC KPI INFORMATION
KPI Name Demand Response (DR) KPI ID DR
Main Objective
The objective of the Day Ahead Demand Response (DADR) is to represent the
energy plan of flexible demands such as electric vehicles (EVs) and heat pumps (HPs) with the electricity cost minimized according to the predicted day-ahead electricity prices.
KPI Description
This KPI evaluates the electricity cost per kWh which is to check the optimization of the energy plan of flexible demands.
KPI Formula See general comments
Unit of measurement €/kWh
Connection / Link with other relevant defined KPIs and Use Cases
Day-ahead dynamic tariff, Forecasting, aggregator
Project sites to be calculated
Development laboratory
Demonstration laboratory
Field demonstrator
KPI CALCULATION METHODOLOGY
KPI Step Methodology ID
[KPI ID #] Step Responsible
DR_01 Obtain the day-ahead forecast of system energy prices Aggregators
DR_02
Obtain the day-ahead dynamic grid tariff from DSO
Aggregators
Determine the energy plan of flexible demand with both system energy prices and day-ahead dynamic grid tariff
Aggregators
Determine the energy plan of flexible demand without considering the prices (base case)
Aggregators
DR_03
Obtain the average energy cost for both cases, i.e. with and without considering prices in the energy planning stage. For the base case, it is assumed that both the day-ahead energy price and DADT will be included for calculating the cost.
Aggregators
KPI SCENARIOS
Scenarios to be measured
BASELINE
BUSINESS AS USUAL (BaU)
SMART GRID
KPI DATA COLLECTION
Data Data ID
Methodology for data
collection
Source/Tools/Instruments
for Data collection
Location of Data
collection
Frequency of data collection
Minimum monitoring period
Data collection
responsible
total energy cost D1 Obtain from
commercial aggregators
commercial
aggregator optimizatio
n
Load points Once a day
Lab: not availabl
e
Aggregators

IDE4L Deliverable D7.1
125 IDE4L is a project co-funded by the European Commission
total energy consumption
D2 Obtain from commercial aggregators
commercial
aggregator optimizatio
n
Load points Once a day
Lab: not availabl
e
Aggregators
KPI BASELINE
Source of Baseline Condition
LITERATURE VALUES
COMPANY HISTORICAL VALUES
VALUES MEASURED AT START OF PROJECT
Details of Baseline
Responsible (Name, Company) for Baseline
GENERAL COMMENTS
Scenarios used in tests:
– Base case; without considering prices
– Optimization with system prices and day ahead dynamic grid tariffs
Controllers:
– Commercial aggregators determine the energy plan of flexible demands by minimizing the energy
cost
Test setup:
DR: commercial aggregators determine the energy plan of flexible demands by minimizing the energy
cost.
KPIs are calculated for the purpose of comparing results of the two test cases with and without DADT.
1. Economic KPIs
8) Average energy cost of EVs and HPs: €/kWh. KPI=total cost
total energy consumption
6.24 UC25: Day-ahead Dynamic Tariff In this case, one KPI has been defined:
Day Ahead Dynamic Tariff (DADT)
BASIC KPI INFORMATION
KPI Name Day Ahead Dynamic Tariff (DADT) KPI ID DADT
Main Objective The objective of the Day Ahead Dynamic Tariff (DADT) is to alleviate predicted

IDE4L Deliverable D7.1
126 IDE4L is a project co-funded by the European Commission
overloading at the medium voltage (MV) grid in the day-ahead electricity market time frame by sending proper hourly varying grid tariff on top of the fixed grid tariff to commercial aggregators.
KPI Description
This KPI evaluates the loading of the power components of the MV grid with and without the DADT. Time series power flow studies shall be carried out with inputs of the demand profile of inflexible demands and flexible demand, production of distributed generation, and the grid model to evaluate the DADT KPI.
KPI Formula See general comments
Unit of measurement %
Connection / Link with other relevant defined KPIs and Use Cases
Forecasting, aggregator, CCPC
Project sites to be calculated
Development laboratory
Demonstration laboratory
Field demonstrator
KPI CALCULATION METHODOLOGY
KPI Step Methodology ID
[KPI ID #] Step Responsible
DADT_01 Obtain the day-ahead forecast of inflexible demand, production of DGs, flexible demands and system energy prices(through DXP at the Control Centre)
DSO
DADT_02
DSO run the one day time series low flow study with the MV distribution grid model to check if there is congestion for the next day
DSO and
commercial
aggregators
If there is congestion, an initial congestion grid tariff will be determined and sent to the commercial aggregators
Commercial aggregators determine a new energy plan of all flexible demands according to the day-ahead system energy prices and the congestion grid tariff.
DSO run the one day time series load flow study with the MV distribution grid model with the updated energy plan of flexible demand to check if there is congestion for the next day. If there is congestion, go to Step 5, otherwise, go to Step 8.
Increase the congestion grid tariff with a certain amount and send the congestion grid tariff to commercial aggregators.
Commercial aggregators determine a new energy plan of all flexible demands according to the day-ahead system energy prices and the congestion grid tariff.
Go back to Step 4 (in 1b).
Dynamic tariff is determined.
DADT_03 Extract the highest loading with and without day-ahead dynamic tariff
DSO
KPI SCENARIOS
Scenarios to be measured
BASELINE
BUSINESS AS USUAL (BaU)
SMART GRID
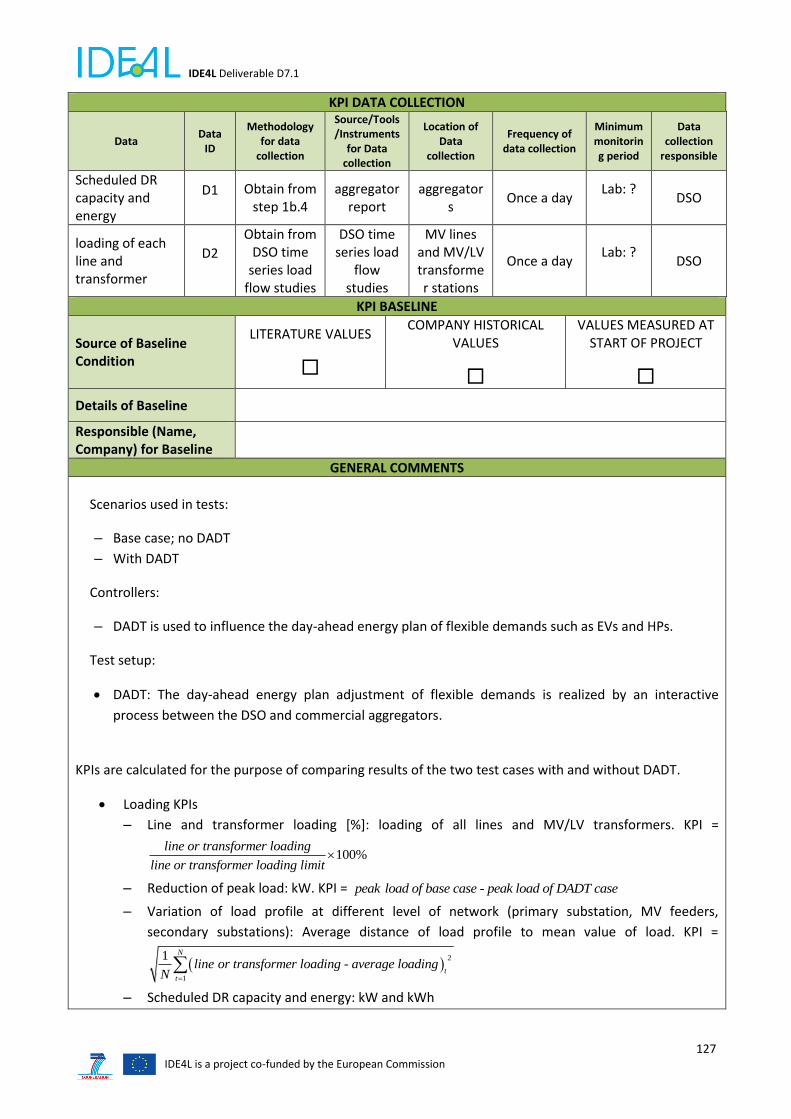
IDE4L Deliverable D7.1
127 IDE4L is a project co-funded by the European Commission
KPI DATA COLLECTION
Data Data
ID
Methodology for data
collection
Source/Tools/Instruments
for Data collection
Location of Data
collection
Frequency of data collection
Minimum monitoring period
Data collection
responsible
Scheduled DR capacity and energy
D1 Obtain from step 1b.4
aggregator report
aggregators
Once a day Lab: ?
DSO
loading of each line and transformer
D2
Obtain from DSO time
series load flow studies
DSO time series load
flow studies
MV lines and MV/LV transformer stations
Once a day Lab: ?
DSO
KPI BASELINE
Source of Baseline Condition
LITERATURE VALUES
COMPANY HISTORICAL VALUES
VALUES MEASURED AT START OF PROJECT
Details of Baseline
Responsible (Name, Company) for Baseline
GENERAL COMMENTS
Scenarios used in tests:
– Base case; no DADT
– With DADT
Controllers:
– DADT is used to influence the day-ahead energy plan of flexible demands such as EVs and HPs.
Test setup:
DADT: The day-ahead energy plan adjustment of flexible demands is realized by an interactive
process between the DSO and commercial aggregators.
KPIs are calculated for the purpose of comparing results of the two test cases with and without DADT.
Loading KPIs
– Line and transformer loading [%]: loading of all lines and MV/LV transformers. KPI =
100%line or transformer loading
line or transformer loading limit
– Reduction of peak load: kW. KPI = peak load of base case - peak load of DADT case
– Variation of load profile at different level of network (primary substation, MV feeders,
secondary substations): Average distance of load profile to mean value of load. KPI =
2
1
1 N
tt
line or transformer loading - average loadingN
– Scheduled DR capacity and energy: kW and kWh

IDE4L Deliverable D7.1
128 IDE4L is a project co-funded by the European Commission
– Increase of pay-back demand: kW and kWh
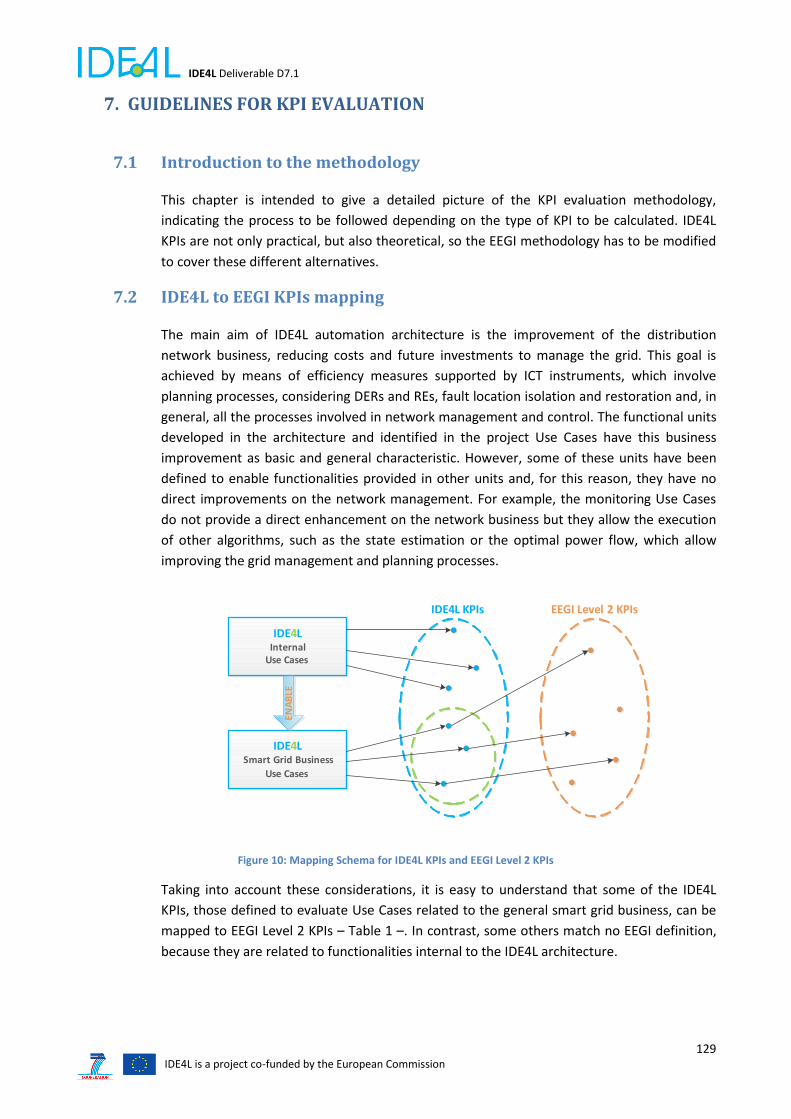
IDE4L Deliverable D7.1
129 IDE4L is a project co-funded by the European Commission
7. GUIDELINES FOR KPI EVALUATION
7.1 Introduction to the methodology
This chapter is intended to give a detailed picture of the KPI evaluation methodology,
indicating the process to be followed depending on the type of KPI to be calculated. IDE4L
KPIs are not only practical, but also theoretical, so the EEGI methodology has to be modified
to cover these different alternatives.
7.2 IDE4L to EEGI KPIs mapping
The main aim of IDE4L automation architecture is the improvement of the distribution
network business, reducing costs and future investments to manage the grid. This goal is
achieved by means of efficiency measures supported by ICT instruments, which involve
planning processes, considering DERs and REs, fault location isolation and restoration and, in
general, all the processes involved in network management and control. The functional units
developed in the architecture and identified in the project Use Cases have this business
improvement as basic and general characteristic. However, some of these units have been
defined to enable functionalities provided in other units and, for this reason, they have no
direct improvements on the network management. For example, the monitoring Use Cases
do not provide a direct enhancement on the network business but they allow the execution
of other algorithms, such as the state estimation or the optimal power flow, which allow
improving the grid management and planning processes.
Figure 10: Mapping Schema for IDE4L KPIs and EEGI Level 2 KPIs
Taking into account these considerations, it is easy to understand that some of the IDE4L
KPIs, those defined to evaluate Use Cases related to the general smart grid business, can be
mapped to EEGI Level 2 KPIs – Table 1 –. In contrast, some others match no EEGI definition,
because they are related to functionalities internal to the IDE4L architecture.
IDE4L KPIs EEGI Level 2 KPIs
IDE4LInternal
Use Cases
IDE4LSmart Grid Business
Use Cases
ENA
BLE
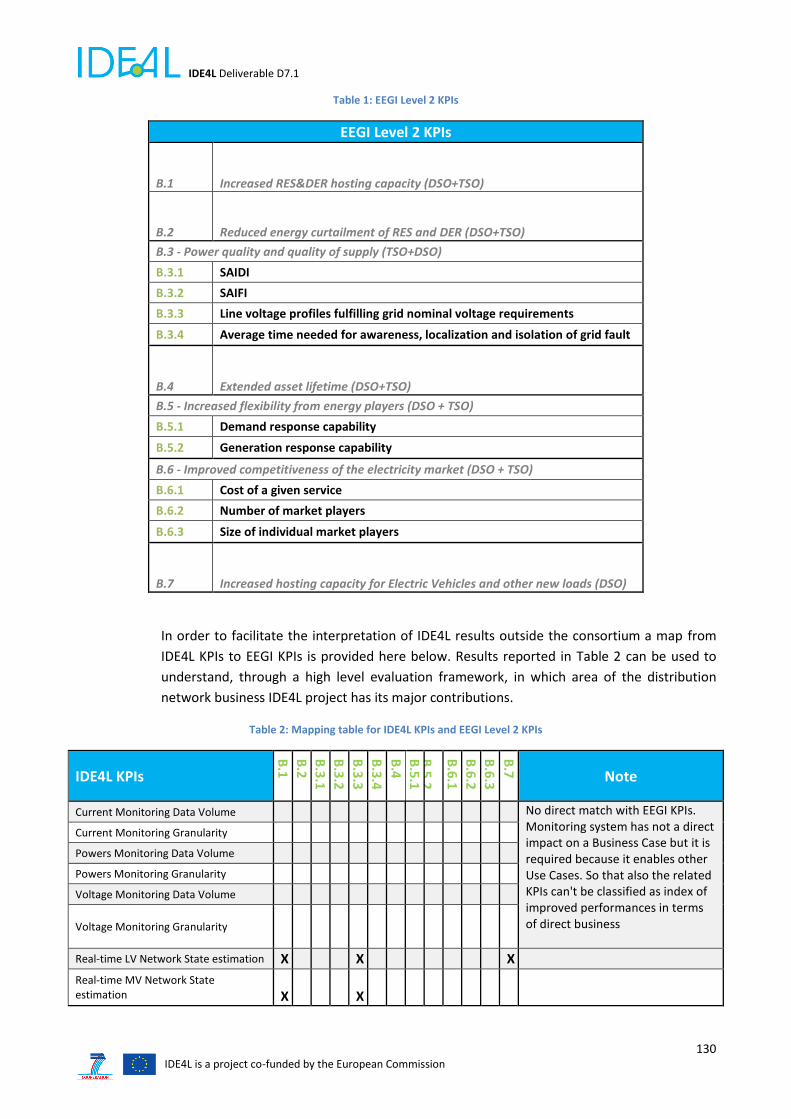
IDE4L Deliverable D7.1
130 IDE4L is a project co-funded by the European Commission
Table 1: EEGI Level 2 KPIs
EEGI Level 2 KPIs
B.1 Increased RES&DER hosting capacity (DSO+TSO)
B.2 Reduced energy curtailment of RES and DER (DSO+TSO)
B.3 - Power quality and quality of supply (TSO+DSO)
B.3.1 SAIDI
B.3.2 SAIFI
B.3.3 Line voltage profiles fulfilling grid nominal voltage requirements
B.3.4 Average time needed for awareness, localization and isolation of grid fault
B.4 Extended asset lifetime (DSO+TSO)
B.5 - Increased flexibility from energy players (DSO + TSO)
B.5.1 Demand response capability
B.5.2 Generation response capability
B.6 - Improved competitiveness of the electricity market (DSO + TSO)
B.6.1 Cost of a given service
B.6.2 Number of market players
B.6.3 Size of individual market players
B.7 Increased hosting capacity for Electric Vehicles and other new loads (DSO)
In order to facilitate the interpretation of IDE4L results outside the consortium a map from
IDE4L KPIs to EEGI KPIs is provided here below. Results reported in Table 2 can be used to
understand, through a high level evaluation framework, in which area of the distribution
network business IDE4L project has its major contributions.
Table 2: Mapping table for IDE4L KPIs and EEGI Level 2 KPIs
IDE4L KPIs
B.1
B.2
B.3
.1
B.3
.2
B.3
.3
B.3
.4
B.4
B.5
.1 B
.5.2
B.6
.1
B.6
.2
B.6
.3
B.7
Note
Current Monitoring Data Volume No direct match with EEGI KPIs. Monitoring system has not a direct impact on a Business Case but it is required because it enables other Use Cases. So that also the related KPIs can't be classified as index of improved performances in terms of direct business
Current Monitoring Granularity
Powers Monitoring Data Volume
Powers Monitoring Granularity
Voltage Monitoring Data Volume
Voltage Monitoring Granularity
Real-time LV Network State estimation X X X
Real-time MV Network State estimation
X
X

IDE4L Deliverable D7.1
131 IDE4L is a project co-funded by the European Commission
Voltage stability of the electricity system
No direct match with EEGI level 2 KPIs
TSO´s visibility of distribution network X X No direct match with EEGI level 2 KPIs
Evaluation of IEC 61850-90-5 library
No direct match with EEGI level 2 KPIs
Success index in meter reading No direct match with EEGI level 2 KPIs
LV load/generation forecaster X X
MV load/generation forecaster X X
LV state forecaster X X X
MV state forecaster X X X
Network Description Update No direct match with EEGI level 2 KPIs. To update the system does not provide a direct impact on the main business but it is needed to maximize the performance of other use cases.
Protection Configuration Update
Control Centre Tertiary Power Control - Technical and Economic Parameters
X X X X
Control Center Tertiary Power Control - Operational Parameters
X X
X
X
Control Center Tertiary Power Control - Technical Safety Parameters
X X
X
X
LV Network Power Control - Technical and Economic Parameters
X X X X
LV Network Power Control - Operational Parameters
X X
X
X
LV Network Power Control - Technical Safety Parameters
X X
X
X
MV Network Power Control - Technical and Economic Parameters
X X X X
MV Network Power Control - Operational Parameters
X X
X
X
MV Network Power Control - Technical Safety Parameters
X X
X
X
SAIDI X
X
They do not follow the common definition of SAIDI but they provide a similar evaluation (B3.1). Time needed for FLI is related to averaged interruption time.
SAIFI X X
They do not follow the common definition of SAIFI but they provide a similar evaluation (B3.2). Number of voltage line violations is related to averaged interruption frequency.
Breaker energized operations X
Reduction of breaker operations in fault condition extends asset lifetime
Interconnection Switch No direct match with EEGI level 2 KPIs
Flicker mitigation MV/LV active grid X Flicker mitigation improves the fulfill of the nominal voltages

IDE4L Deliverable D7.1
132 IDE4L is a project co-funded by the European Commission
requirements
Expansion Planning Scenario Evaluation
X X X X X X X X X
Expansion planning will consider the usage of FLISR and congestion management as an alternative solution to network investments and to postpone these investments.
Target network Planning No direct match with EEGI level 2 KPIs
Reduction of technical network losses No direct match with EEGI level 2 KPIs
Peak demand reduction ratio
No direct match with EEGI level 2 KPIs
Percentage utilization of electricity network components
No direct match with EEGI level 2 KPIs
Reduction in CO2 emissions
No direct match with EEGI level 2 KPIs
RES curtailment X
They look similar according the definition. Detailed description of KPI is needed to evaluate the complete or partial equivalence
Demand Response
X
Day Ahead Dynamic Tariff
X
7.3 Step-by-step approach for KPI evaluation
As it has been defined in previous chapters, there are two types of KPIs:
- Measured KPIs: based on the empirical results obtained from the tests carried out in
demo sites or laboratories, and
- Theoretical KPIs: based on calculations and simulations
Given this fact, there would be two different procedures to face IDE4L KPI evaluation.
Measured KPIs
Step 1. The scenario must be determined and defined. Also, the parameter that will
characterize the Use Case validation must be analyzed and the needed data have to be
clearly selected.
Step 2. The measurements for the selected reference scenario must be collected. If baseline
scenario is chosen, the measurements must have been collected before the test cases, or
historical data must be provided. In case that not all the measurements are available, a state
estimator algorithm can be used to get all the values. If BaU scenario is the reference, these
BaU values related to the future must be calculated.
Step 3. The measurements for the smart scenario must be collected at the end of the test
cases. Just in case, a state estimator algorithm can be used to get all the values.
Step 4. The KPI is the comparison between values obtained in steps 2 and 3.

IDE4L Deliverable D7.1
133 IDE4L is a project co-funded by the European Commission
Step 5. The result must be analysed and well explained.
Theoretical KPIs
Step 1. The scenarios must be determined and defined. Also, the parameter that will
characterize the Use Case validation must be analyzed and the needed data have to be
clearly selected.
Step 2. The values for the selected reference scenario (baseline or BaU) must be calculated
from simulations or theoretical calculations.
Step 3. The measurements for the smart scenario must be calculated from simulations or
theoretical calculations.
Step 4. The KPI is the comparison between values obtained in steps 2 and 3.
Step 5. The result must be analysed and well explained.
7.4 Results template description
The numerical results of the evaluation of each KPI, as well as test conditions and conclusions
will be collected in a result template form.
The result of each KPI will be a numerical comparison of a particular feature of the use case
evaluated in two different scenarios.
To obtain these results, three different types of method can be applied:
- Based on demo measurements: Preferably, this type of method will be applied as
it will provide more accurate and realistic results.
It will be necessary to analyse if for the specific KPI to be evaluated and the demo
deployed for the particular Use Case, tools and/or measurement equipment can be
applied to determine the value of the KPI under certain operation conditions that
will be recreate on the demo site. Both operation conditions and the mechanisms
used to determine the value of the KPI will be introduced in the form under the
field “KPI Conditions Where Calculated” and “Evaluation”, respectively.
- Based on historical data: In case specific demo measurements cannot be obtained,
due to demo constraints, and historic data are available in the operation conditions
defined to obtain the KPIs, these could be used to determine the KPI in a particular
scenario.
This type of methods could be applied only for Baseline Scenarios, so it is important
to highlight that, in order to compare values with other scenarios; the same
conditions have to be considered. For instance, in case of KPI related to FLISR Use
Case, Fault Conditions has to be considered in the same points of the grid for both
scenarios.
- Based on theoretical computations: This type of method will be applied only when
none of the methods above can be used. They are based on the use of technical
data and mathematical equations for particular operation configurations of the

IDE4L Deliverable D7.1
134 IDE4L is a project co-funded by the European Commission
scenario under study. The result template should collect the relations and
explanations of the applied equations to obtain the KPI values.
For each scenario and each KPI may be applied different class of method depending of the
demo conditions and available tools. For this reason, in case of using different methods, the
result template should include a justification that values obtained with both methods are
equivalent.
In case none of the methods can be applied, KPI will be considered as not evaluable.
Figure 11 shows the steps and verifications explained above for methods selection and KPI
evaluation:
Figure 11 KPI Calculation Diagram
Figure 12 shows the result template form to be completed for each KPI. The type of method
applied for each scenario will be indicated in the field “Evaluation and Interpretation”.

IDE4L Deliverable D7.1
135 IDE4L is a project co-funded by the European Commission
Figure 12 Results template

IDE4L Deliverable D7.1
136 IDE4L is a project co-funded by the European Commission
8 REFERENCES
[EEGI_roadmap] http://www.gridplus.eu/Documents/20130228_EEGI%20Roadmap%202013-
2022_to%20print.pdf
[EN 50160]
http://www.aenor.es/aenor/normas/normas/fichanorma.asp?tipo=N&codigo=N0046945&PDF=Si
[Giordano] V. Giordano, et al. "Guidelines for conducting a cost-benefit analysis of Smart Grid
projects” Report EUR 25246 EN. Joint Research Centre, Institute for Energy and Transport (2012).
[GRID+] http://www.gridplus.eu/