deliverable d2.3.4, type report - transphorm.eu · d2.3.4 transphorm deliverable 3 summary this...
TRANSCRIPT
TRANSPHORM
Transport related Air Pollution and Health impacts – Integrated Methodologies for Assessing Particulate Matter
Collaborative Project, Large-scale Integrating Project
SEVENTH FRAMEWORK PROGRAMME
ENV.2009.1.2.2.1 Transport related air pollution and health impacts
Deliverable D2.3.4, type Report
Description and development of simplified models for policy
assessment
Due date of deliverable: project month 48
Actual submission date: project month 54
Start date of project: 1 January 2010 Duration: 54 months
Organisation name of lead contractor for this deliverable: UH
Contributions from: AUTH, NILU, TNO and FMI

D2.3.4 TRANSPHORM Deliverable
2
Table of Contents
Summary ..................................................................................................................................... 3
PART I: MODELS FOR POLICY IMPACT ASSESSMENT ...................................................................... 3
1. Introduction ............................................................................................................................. 3
2. Data sources and models .......................................................................................................... 3
3. Policy scenarios ........................................................................................................................ 4
4. Impact assessment ................................................................................................................... 4
5. Scenario analysis ...................................................................................................................... 7
6. Conclusions ............................................................................................................................ 10
PART II :THE URBAN INCREMENT METHOD: a simple approach to model urban concentration
increments ................................................................................................................................ 11
1. Introduction ........................................................................................................................... 11
2. Methodology ......................................................................................................................... 11
3. Development and results ........................................................................................................ 13
4. Conclusions ............................................................................................................................ 23
References ................................................................................................................................. 24

D2.3.4 TRANSPHORM Deliverable
3
Summary This document describes the development and improvement of simplified models for the
impact assessment. In TRANSPHORM efforts have been made through regional and local
modelling studies to understand and study the policy scenarios. The impact assessment
studies have been carried out for the TRANSPHORM target cities (Athens, Helsinki, London,
Rotterdam and Oslo) for PM10, PM25, EC, BaP and PNC.
This document has been divided into two parts. The first part describes modelling setup,
policy scenarios and impact of policy scenarios. The second part reports the urban
increment method, a simple approach that has been developed and applied for London,
Lisbon and Rotterdam to model urban concentration increments due to urban emissions.
PART I: MODELS FOR POLICY IMPACT ASSESSMENT
1. Introduction In this part, we report the on the simpler, but operational models, for the first phase of
policy development, where efficient and quick impact assessment studies are carried out as
an alternative to the advanced models. The models developed by TRANSPHORM consortium
have been used to analyse the policy scenarios.
2. Data sources and models The health impact of policy scenarios has been analysed for the five TRANSPHORM target
cities (Athens, Helsinki, London, Rotterdam and Oslo). The models and application regions
have previously been described in TRANSPHORM deliverable D2.3.3. Table 1 lists the models
and inputs data that has been used to analyse the policy scenarios for each city.
Table 1 TRANSPHORM target cities, models and input data.
Athens Helsinki London Rotterdam Oslo
Model Name MARS CAR-FMI OSCAR Urbis AirQuis
Traffic data and emissions
Hellenic Institute of Transport (traffic) LAT (EFs)
HSY 2005 HSL 2008 LOTOS-EUROS
LAEI-2008 DCMR-2008 (traffic) Dutch Ministry (ef)
Oslo traffic authorities, local + LAT emissions
Future projections
HIT, MinEnv, LAT TRL report, UK
TREMOVE for traffic BBR (high estimate reduction policy) for emission factors
Norwegian traffic institute
Meteorological data
Prognostic (MEMO), El. Veniz. Data
MPP-FMI, Helsinki-Vantaa,
MIDAS, Heathrow
Zestienhoven airport (for local models)
Diagnostic
D2.3.4 TRANSPHORM Deliverable
4
Kumpula, Jokioinen
Background concentration
LOTOS-EUROS LOTOS-EUROS
LOTOS-EUROS
LOTOS-EUROS LOTOS-EUROS scaled to obs
Population CLC2000-EEA HSY ONS (2001), UK
ACN (Dutch Cadastre)
National (SSB)
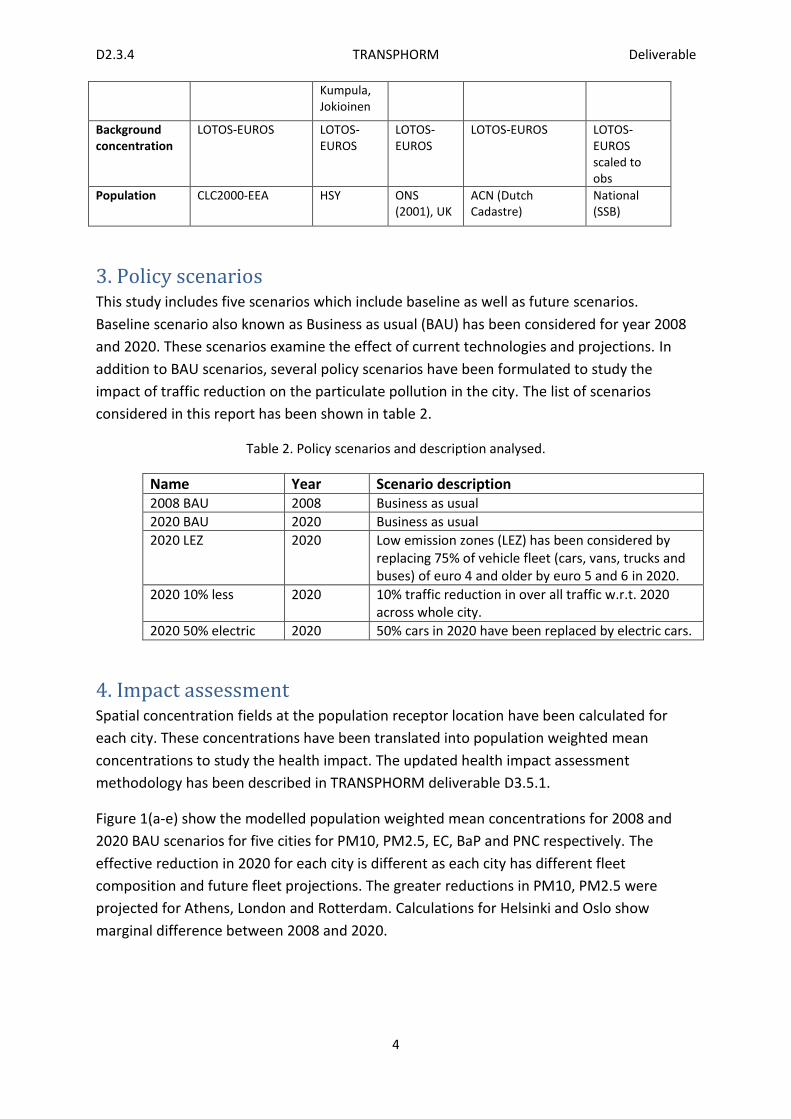
3. Policy scenarios This study includes five scenarios which include baseline as well as future scenarios.
Baseline scenario also known as Business as usual (BAU) has been considered for year 2008
and 2020. These scenarios examine the effect of current technologies and projections. In
addition to BAU scenarios, several policy scenarios have been formulated to study the
impact of traffic reduction on the particulate pollution in the city. The list of scenarios
considered in this report has been shown in table 2.
Table 2. Policy scenarios and description analysed.
Name Year Scenario description 2008 BAU 2008 Business as usual
2020 BAU 2020 Business as usual
2020 LEZ 2020 Low emission zones (LEZ) has been considered by replacing 75% of vehicle fleet (cars, vans, trucks and buses) of euro 4 and older by euro 5 and 6 in 2020.
2020 10% less 2020 10% traffic reduction in over all traffic w.r.t. 2020 across whole city.
2020 50% electric 2020 50% cars in 2020 have been replaced by electric cars.
4. Impact assessment Spatial concentration fields at the population receptor location have been calculated for
each city. These concentrations have been translated into population weighted mean
concentrations to study the health impact. The updated health impact assessment
methodology has been described in TRANSPHORM deliverable D3.5.1.
Figure 1(a-e) show the modelled population weighted mean concentrations for 2008 and
2020 BAU scenarios for five cities for PM10, PM2.5, EC, BaP and PNC respectively. The
effective reduction in 2020 for each city is different as each city has different fleet
composition and future fleet projections. The greater reductions in PM10, PM2.5 were
projected for Athens, London and Rotterdam. Calculations for Helsinki and Oslo show
marginal difference between 2008 and 2020.

D2.3.4 TRANSPHORM Deliverable
5
(a)
(b)
(c)

D2.3.4 TRANSPHORM Deliverable
6
(d)
(e)
Figure 1(a-e) Modelled population weighted mean concentrations for 2008 and 2020 BAU scenarios for five cities for PM10, PM2.5, EC, BaP and PNC.
In order to understand the differences, here we compare the different vehicle emission
category distributions predicted for the year 2020. This enables us to assess differences
between the cities and the way they react to scenarios. This comparison does not include
Rotterdam but includes Prague city however Prague has not been included in the policy
assessment. The change per individual city can be seen in the individual city results.

D2.3.4 TRANSPHORM Deliverable
7
Figure 2: Vehicle emission category distribution for cars (Top) and HDV and bus (Bottom) in 2020 for TRANSPHORM cities.
It can be seen in figure 2 that some variation is expected as each city has different estimates
of fleets. In 2020, Oslo has a much larger diesel PC fleet (60%) than the other cities. London
projects use of cleaner vehicle by 2020 therefore has no vehicles older than Euro 4 in their
fleet, except for buses.
All five cities show a larger reduction in EC and PNC due to reduction in exhaust emissions.
While most of the cities show marginal reduction in BaP, Oslo show slight increase in 2020.
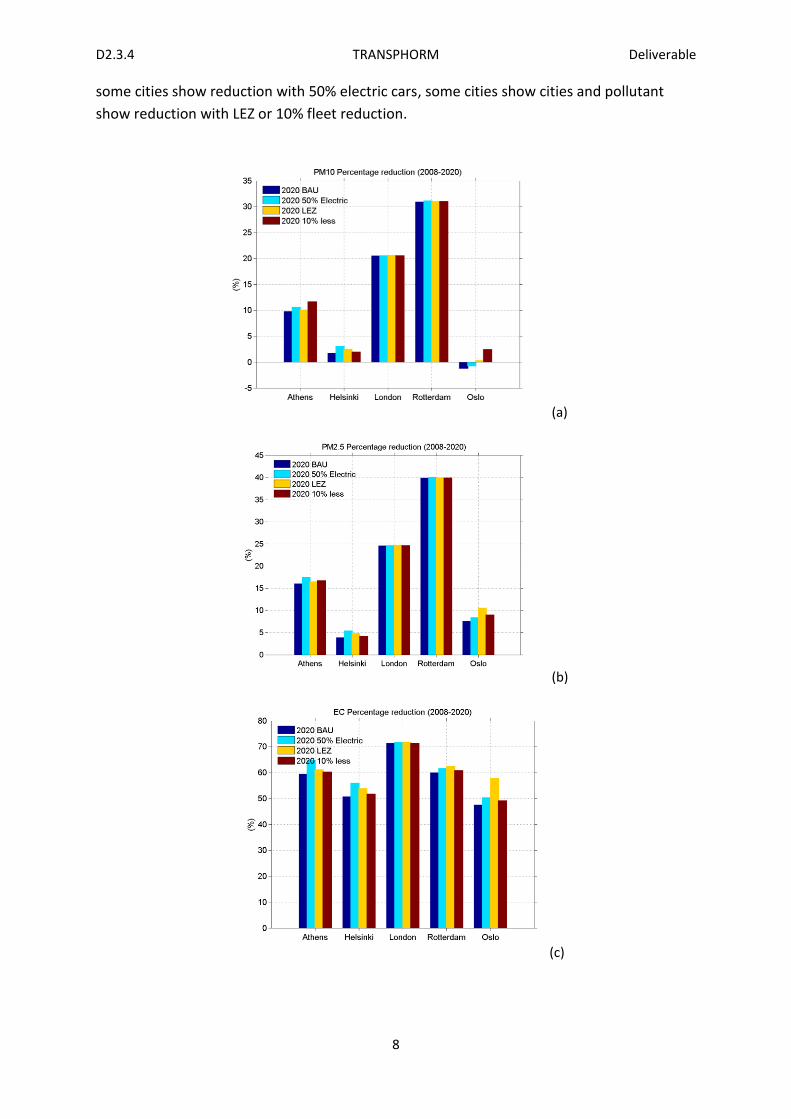
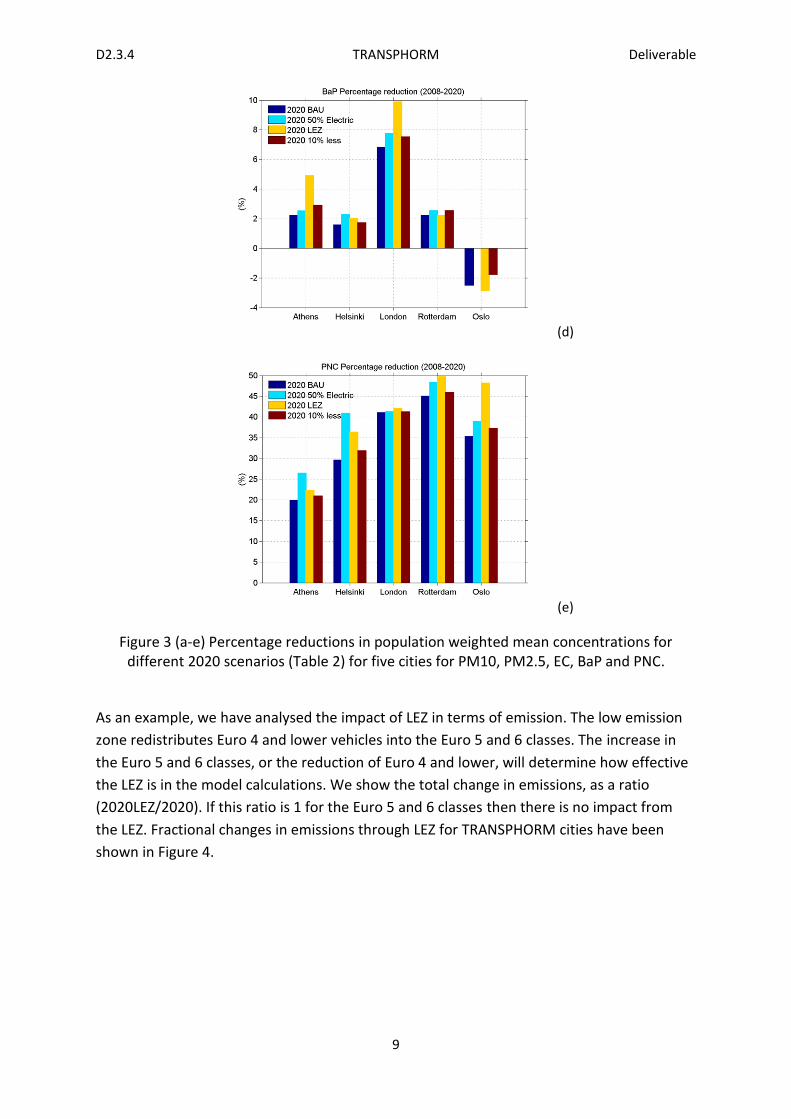
5. Scenario analysis
In this section, we have analysed the effect of various 2020 scenarios (Table 2) as compared
to 2008. Figure 3 (a-e) show the percentage reductions in population weighted mean
concentrations for different 2020 scenarios (Table 2) for five cities for PM10, PM2.5, EC, BaP
and PNC. It can be noticed that the most of the changes with respect to 2008 can be
attributed to the 2020 BAU projections and other scenarios have very little impact on
pollution concentrations. However the effects of scenarios are different for each city. While
D2.3.4 TRANSPHORM Deliverable
8
some cities show reduction with 50% electric cars, some cities show cities and pollutant
show reduction with LEZ or 10% fleet reduction.
(a)
(b)
(c)
D2.3.4 TRANSPHORM Deliverable
9
(d)
(e)
Figure 3 (a-e) Percentage reductions in population weighted mean concentrations for different 2020 scenarios (Table 2) for five cities for PM10, PM2.5, EC, BaP and PNC.
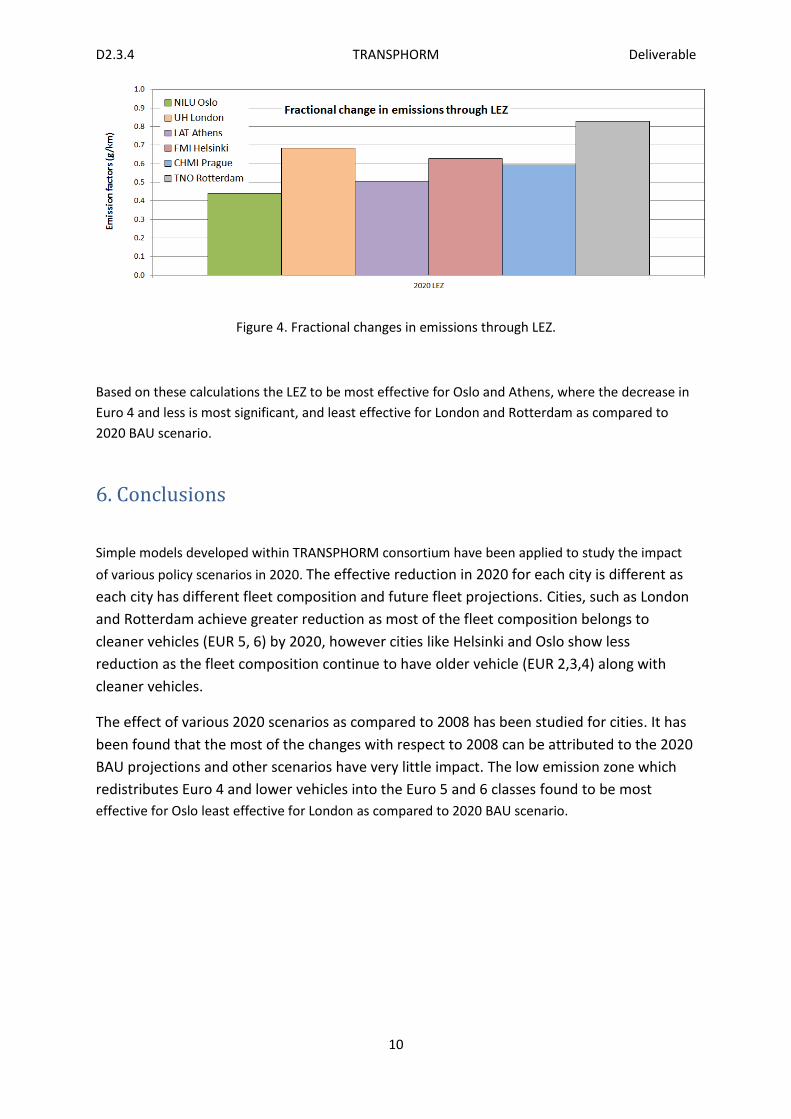
As an example, we have analysed the impact of LEZ in terms of emission. The low emission
zone redistributes Euro 4 and lower vehicles into the Euro 5 and 6 classes. The increase in
the Euro 5 and 6 classes, or the reduction of Euro 4 and lower, will determine how effective
the LEZ is in the model calculations. We show the total change in emissions, as a ratio
(2020LEZ/2020). If this ratio is 1 for the Euro 5 and 6 classes then there is no impact from
the LEZ. Fractional changes in emissions through LEZ for TRANSPHORM cities have been
shown in Figure 4.
D2.3.4 TRANSPHORM Deliverable
10
Figure 4. Fractional changes in emissions through LEZ.
Based on these calculations the LEZ to be most effective for Oslo and Athens, where the decrease in
Euro 4 and less is most significant, and least effective for London and Rotterdam as compared to
2020 BAU scenario.
6. Conclusions
Simple models developed within TRANSPHORM consortium have been applied to study the impact
of various policy scenarios in 2020. The effective reduction in 2020 for each city is different as
each city has different fleet composition and future fleet projections. Cities, such as London
and Rotterdam achieve greater reduction as most of the fleet composition belongs to
cleaner vehicles (EUR 5, 6) by 2020, however cities like Helsinki and Oslo show less
reduction as the fleet composition continue to have older vehicle (EUR 2,3,4) along with
cleaner vehicles.
The effect of various 2020 scenarios as compared to 2008 has been studied for cities. It has
been found that the most of the changes with respect to 2008 can be attributed to the 2020
BAU projections and other scenarios have very little impact. The low emission zone which
redistributes Euro 4 and lower vehicles into the Euro 5 and 6 classes found to be most
effective for Oslo least effective for London as compared to 2020 BAU scenario.
D2.3.4 TRANSPHORM Deliverable
11
PART II :THE URBAN INCREMENT METHOD: a simple approach
to model urban concentration increments
1. Introduction The output of a regional scale dispersion model is the pollutant concentration averaged in a
grid cell with resolutions ranging from about 1010 km2 to 5050 km2. However, air quality
data from monitoring stations indicate that the concentrations of certain atmospheric
pollutants (e.g. PM2.5 and PM10) are higher while ozone concentration is lower in urban
areas located inside a particular grid cell, compared to the pollutant concentrations in rural
areas located in the same cell. Thus, in order to realistically evaluate the impact of
abatement policies on urban air quality, it is important to estimate this additional pollutant
concentration that is characteristic in urban areas due to localized emissions, termed as the
‘urban increment’. For the development of EU level air quality strategies, a common
methodology to determine the urban increment for all cities of the European region is
required. For this purpose, a simple methodology for determining the urban concentration
increment on top of the regional scale background has been further developed and
evaluated within the project based on earlier work by Moussiopoulos et al. (2012).
The urban increment (UI) estimation is based on the application of a simple numerical
model for the efficient assessment of PM10 and NO2 concentration increments caused by
traffic, as well as other local sources, such as space heating (domestic and commercial),
nearby industrial activities, etc. The method relies on the extraction of a functional
relationship between local meteorological parameters, city characteristics and urban
emissions on the basis of measured increments on sample locations, which are generalized
throughout Europe. Therefore, the availability of up-to-date, high resolution meteorological
data (e.g. wind speed and direction, average mixing height and stability classes) and
emission information covering all major urban emitters is a necessary prerequisite for the
successful application of the UI approach. Within the frame of TRANSPHORM, the method
was revised through a number of test applications and improvements were implemented.
The method has been tested by taking into account different parameters for the
classification of atmospheric stability, such as mixing height and precipitation.
2. Methodology The standard procedure for determining the urban increment can be described as a
sequence of three main processing stages (Moussiopoulos et al., 2012):
1. Spatial sampling: selection of representative rural-urban measurement station pairs across Europe.
2. Multiple regression analysis for determining a functional relationship. 3. Generalisation: estimation of urban increments for other European cities.
In order to extract concentration increments, several station pairs consisting of one rural
and one urban background station need to be selected. The investigation initially focused on 20 cities that had been studied before in the framework of various EU funded projects (e.g. the MERLIN project, URL1), namely Antwerp, Athens, Barcelona, Berlin, Brussels, Budapest,
D2.3.4 TRANSPHORM Deliverable
12
Copenhagen, Gdansk, Graz, Helsinki, Katowice, Lisbon, London, Marseille, Milan, Paris, Prague, Rome, Stuttgart and Thessaloniki. Data associated with the main meteorological parameters, available for the year 2003 from the regional model PARLAM-PS (Bjørge and Skålin, 1995) were used in conjunction with AirBase (Airbase, 2008) datasets for 2003 throughout the calculation procedure. Station pairs were selected according to the following criteria:
The two stations of the pair should be categorised explicitly as rural (or suburban) background and urban background, respectively. Station categorisation was based on the AirBase metadata entries.
Both stations should have better than 90% (for NO2) or 75% (for PM10) data completeness for the reference year (as reported in AirBase).
The two stations should be located close enough, preferably within the same 5050 km2 PARLAM-PS cell.
At the second stage of the methodology, the urban background increments are determined
through a piecewise functional relationship which is established on the basis of certain
variables that are known to be important (Amann et al., 2007). These variables include the
level of emissions within the urban area, the size/area of the urban entity, the urban and
regional background concentrations, as well as the wind speed and the atmospheric
stability.
A novel element of this approach, compared to previous similar attempts (Ortiz, 2010), consisted of improvements with respect to the part of the meteorological input, firstly with the use of an advanced interpolator for meteorological parameters at the sub-grid level and, secondly, with the incorporation of atmospheric stability as an important factor contributing to the profile of the urban increments. In order to obtain the relationship between the urban increment and the variables mentioned above, a multiple regression analysis was carried out, using the following formulation:
SciUESc Sc Sc ScSc
i iiurban iruralScavgUE
EC C
A u
Where: Ci urban = Urban increment of pollutant i. EiUE = Total emission of pollutant i within an urban entity in tons. AUE = Urban area in km2. uavg = Urban entity average wind speed in m/s. Ci rural = Rural background concentration of pollutant i in µg/m3.
ωi, i, and γi = Multiple-regression parameters for pollutant i. SC = The Pasquill-Gifford stability class
The regression analysis was performed on the cities identified during the station pair
selection process. A separate version of the above formulation has been extracted for each
of the six Pasquill-Gifford stability classes (SC = 1...6), thus taking into account the
dependence of concentrations on atmospheric stability. Values of all the variables were
averaged over the periods identified through the stability categorisation. Regarding the data
that were used in the multiple regression analysis, the urban areas were defined on the

D2.3.4 TRANSPHORM Deliverable
13
basis of land use as provided by the European 1 km resolution land use map of the CORINE
Land Cover 2000 (CLC2000) project (Büttner et al., 2004). Besides, it was also assumed that
only primary emissions released from low sources increase concentrations within the cities
(Amann et al., 2007). Estimates of the urban emissions for each city were based on the
MEGAPOLI European Gridded Emission Inventory (Kuenen et al., 2010), which is a version of
the TNO emissions data-set, available for the whole of Europe in a resolution of 0.0625°
0.125° (latitude longtitude).
3. Development and results Aiming at further improving and evaluating the methodology, a range of enhancements in
the main computational procedures have been introduced and validated. More specifically,
two additional meteorological variables, mixing height and precipitation, were introduced in
order to examine the possibility of replacing atmospheric stability classes as a means to
describe the mixing conditions in the lower troposphere and, subsequently, its effects in
pollutant concentrations.
In this direction, a total of three cities were investigated, namely Lisbon, London and
Rotterdam, all having different characteristics in terms of their extent, meteorology and
human activity, the aim being to perform a study of the correlation of the UI with the
aforementioned meteorological parameters. Tables 1 and 2 present the stations whose
measurements were used for the estimation of UI in each city for NO2 and PM10,
respectively.
Table 1. Stations used for the estimation of the UI for the three cities of the application as regards
NO2.
City Urban Background Stations Rural Background Stations
Lisbon Olivais Chamusca
London Kensington Harwell
Rotterdam Westmaas-Groeneweg
Cabauw-Zijdeweg
Bentinckplein
Vlaardingen
Table 2: Stations used for the extraction of the UI for the three cities of the application as regards
ΡΜ10.
City Urban Background Stations Rural Background Stations
Lisbon Loures Chamusca
London Kensington Harwell
Rotterdam Westmaas-Groeneweg
Bentinckplein
Vlaardingen
Schiedamsevest
D2.3.4 TRANSPHORM Deliverable
14
Measurement data were obtained from the Airbase database (Airbase, 2012). It should be
noted that the data as regards the mixing height and precipitation originated from
calculations using the SILAM model (Kukkonen et al., 2012) for the corresponding years.
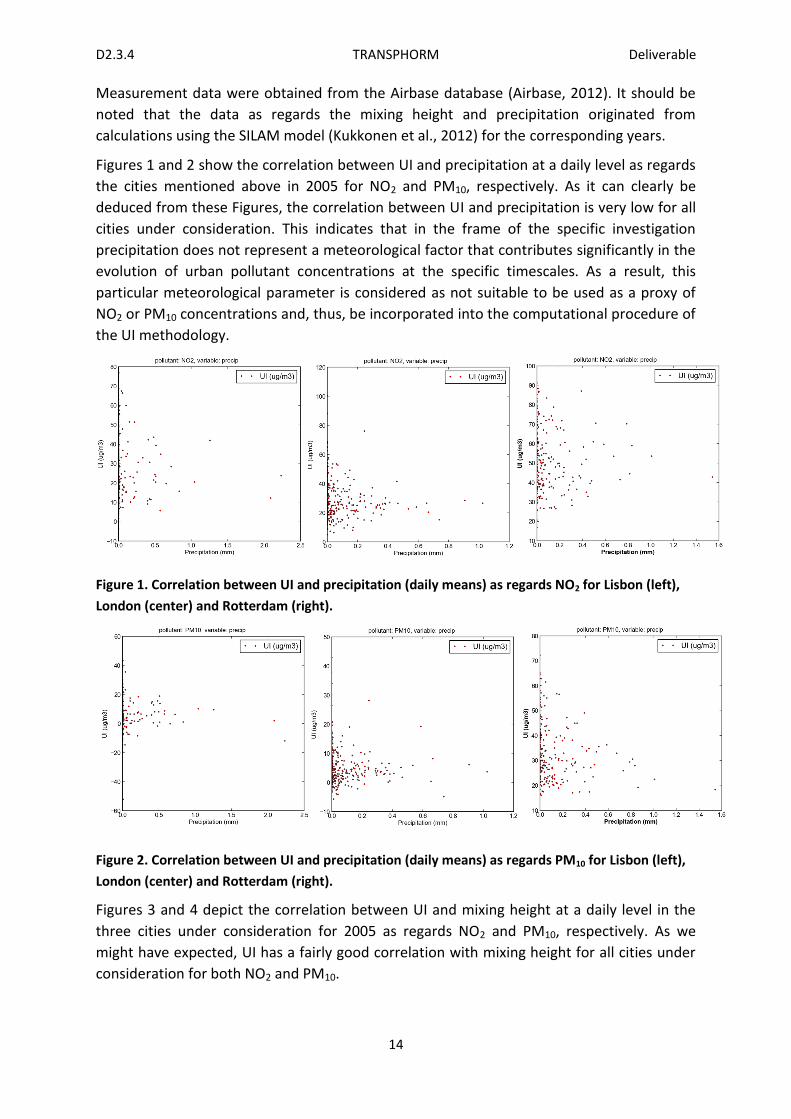
Figures 1 and 2 show the correlation between UI and precipitation at a daily level as regards
the cities mentioned above in 2005 for NO2 and PM10, respectively. As it can clearly be
deduced from these Figures, the correlation between UI and precipitation is very low for all
cities under consideration. This indicates that in the frame of the specific investigation
precipitation does not represent a meteorological factor that contributes significantly in the
evolution of urban pollutant concentrations at the specific timescales. As a result, this
particular meteorological parameter is considered as not suitable to be used as a proxy of
NO2 or PM10 concentrations and, thus, be incorporated into the computational procedure of
the UI methodology.
Figure 1. Correlation between UI and precipitation (daily means) as regards ΝΟ2 for Lisbon (left),
London (center) and Rotterdam (right).
Figure 2. Correlation between UI and precipitation (daily means) as regards ΡΜ10 for Lisbon (left),
London (center) and Rotterdam (right).
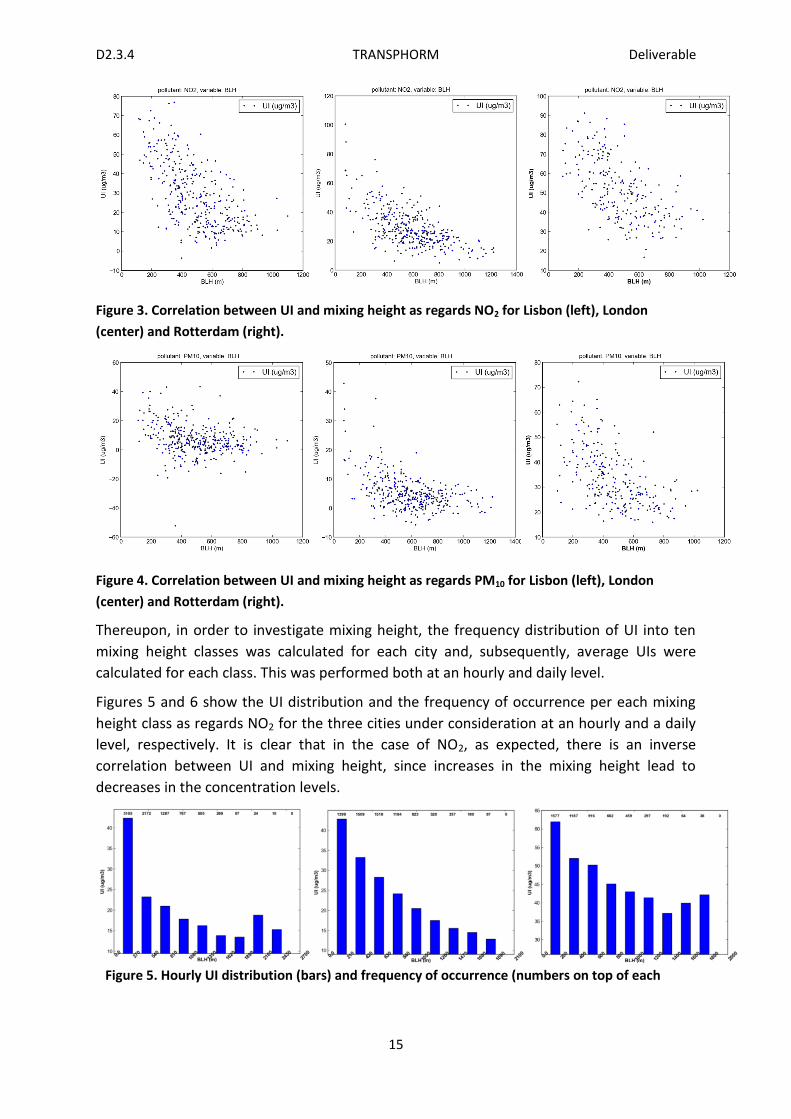
Figures 3 and 4 depict the correlation between UI and mixing height at a daily level in the
three cities under consideration for 2005 as regards NO2 and PM10, respectively. As we
might have expected, UI has a fairly good correlation with mixing height for all cities under
consideration for both NO2 and PM10.
D2.3.4 TRANSPHORM Deliverable
15
Figure 3. Correlation between UI and mixing height as regards ΝΟ2 for Lisbon (left), London
(center) and Rotterdam (right).
Figure 4. Correlation between UI and mixing height as regards ΡΜ10 for Lisbon (left), London
(center) and Rotterdam (right).
Thereupon, in order to investigate mixing height, the frequency distribution of UI into ten
mixing height classes was calculated for each city and, subsequently, average UIs were
calculated for each class. This was performed both at an hourly and daily level.
Figures 5 and 6 show the UI distribution and the frequency of occurrence per each mixing
height class as regards NO2 for the three cities under consideration at an hourly and a daily
level, respectively. It is clear that in the case of NO2, as expected, there is an inverse
correlation between UI and mixing height, since increases in the mixing height lead to
decreases in the concentration levels.
Figure 5. Hourly UI distribution (bars) and frequency of occurrence (numbers on top of each

D2.3.4 TRANSPHORM Deliverable
16
chart) per mixing height class as regards ΝΟ2 for Lisbon (left), London (center) and Rotterdam
(right).
Figure 6. Daily UI distribution (bars) and occurring frequency of occurrence (numbers on top of
each chart) per mixing height class as regards ΝΟ2 for Lisbon (left), London (center) and Rotterdam
(right).
Finally, Figures 7 and 8 present the hourly and daily distribution of UI and frequency of
occurrence per mixing height class as regards PM10 for Lisbon, London and Rotterdam. As in
the case of NO2, a high negative correlation between UI and mixing height is also evident,
with the only exception being the hourly concentrations in Lisbon, in which some outliers in
the larger mixing height classes lead to very high numbers of UI.
Figure 7. Hourly UI distribution (bars) and frequency of occurrence (numbers on top of each chart)
per mixing height class as regards ΡΜ10 for Lisbon (left), London (right) and Rotterdam (right).
Figure 8. Daily UI distribution (bars) and frequency of occurrence (numbers on top of each chart)
per mixing height class as regards ΡΜ10 for Lisbon (left), London (center) and Rotterdam (right).
Based on the above, it can be concluded that mixing height constitutes a variable which can
be incorporated in the UI calculation process instead of the currently used stability class,
contrary to the case of precipitation, which has a low correlation with UI.

D2.3.4 TRANSPHORM Deliverable
17
The following sections present three applications conducted using the mixing height instead
of stability class in the computational part of the methodology.
Application 1
The functional structure of the methodology provides the capability for application in two
different ways, more specifically a multi-area (multi-city) or an interannual. The first
approach considers a fixed period of time, usually a full calendar year and requires data on a
set of urban areas that will be used for the estimation of the functional relationship
(calibration stage).
On the other hand, the interannual application approach looks into a specific urban area
and normally requires data for a set of calendar years. Similar to the case of the multi-area
approach, this set is used for the setup of the functional relationship. Obviously, for the
purposes of validation, sets of data that were not used in the calibration phase are required.
For this particular application, data from a set of European cities for the year of 2005 were
used, in order to extract the statistical relationship for the methodology (calibration), which
was later used for the city of London for the same year (validation). Specifically, the cities
that were used for the calibration process were Athens, Genoa, Gent, Graz, Helsinki,
Copenhagen, Lisbon, Madrid, Marseille and Prague.
Then, 10 classes were defined in respect to the mixing height and for each one of them, the
methodology for creating the UI calculation relationship was applied. Data regarding
measured pollutant concentrations were acquired from the Airbase data base, while data
regarding meteorological parameters (mixing height, wind speed) was provided by the
SILAM model.
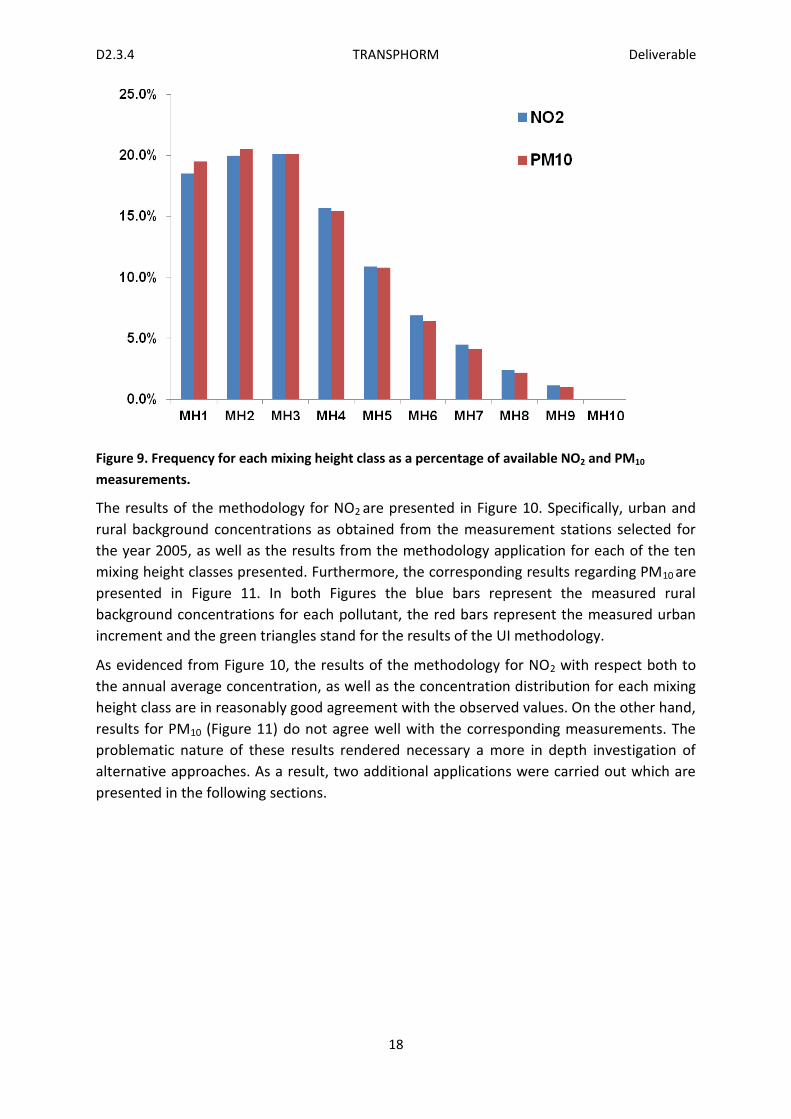
The mixing height classes used for this particular application and their corresponding
frequencies based on the availability of hourly measurements for NO2 and PM10 for the city
of London, is presented in Table 3. The frequency of appearance for each mixing height class
is presented in Figure 9 as a percentage of total available NO2 and PM10 measurements.
Table 3. Mixing height classes and their corresponding frequencies for London for the year 2005.
Class 1 2 3 4 5 6 7 8 9 10
Range
(m) 0 -210
210 -
420
420 -
630
630 -
840
840 -
1050
1050 -
1260
1260 -
1470
1470 -
1680
1680 -
1890
1890 -
2100
ΝΟ2 1399 1509 1518 1184 823 520 337 180 87 0
ΡΜ10 1611 1696 1662 1277 892 528 338 181 81 0
D2.3.4 TRANSPHORM Deliverable
18
Figure 9. Frequency for each mixing height class as a percentage of available ΝΟ2 and ΡΜ10
measurements.
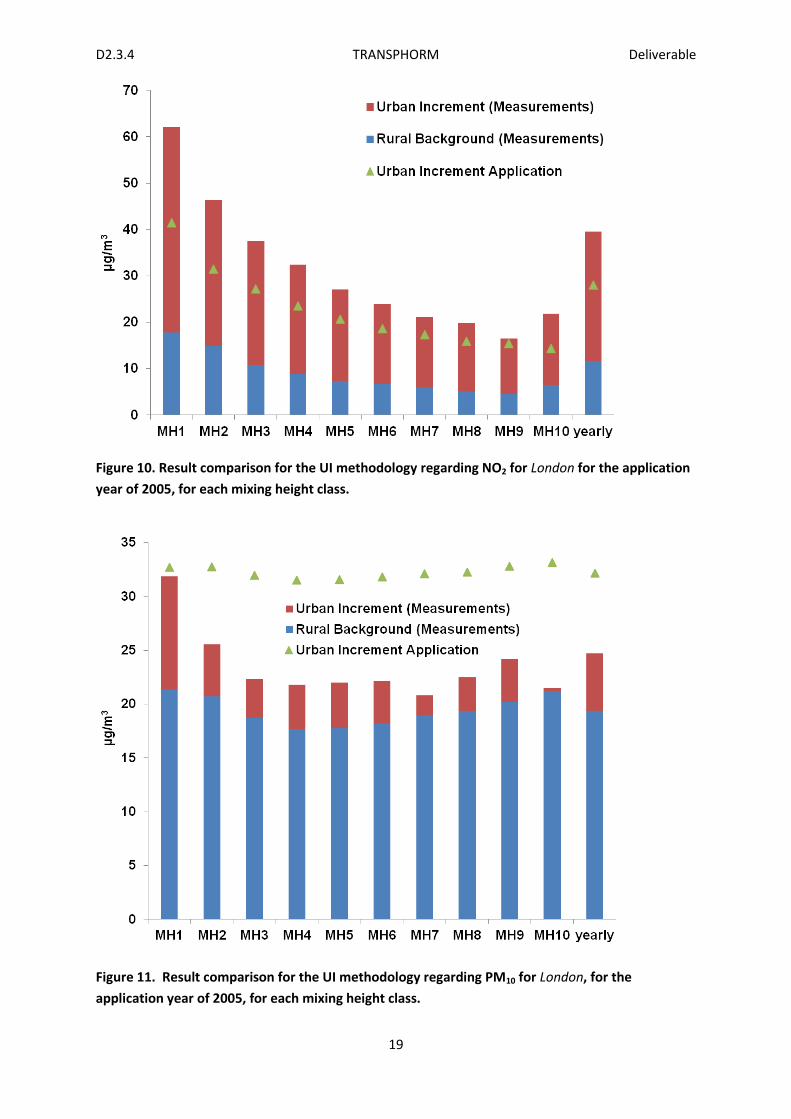
The results of the methodology for NO2 are presented in Figure 10. Specifically, urban and
rural background concentrations as obtained from the measurement stations selected for
the year 2005, as well as the results from the methodology application for each of the ten
mixing height classes presented. Furthermore, the corresponding results regarding PM10 are
presented in Figure 11. In both Figures the blue bars represent the measured rural
background concentrations for each pollutant, the red bars represent the measured urban
increment and the green triangles stand for the results of the UI methodology.
As evidenced from Figure 10, the results of the methodology for NO2 with respect both to
the annual average concentration, as well as the concentration distribution for each mixing
height class are in reasonably good agreement with the observed values. On the other hand,
results for PM10 (Figure 11) do not agree well with the corresponding measurements. The
problematic nature of these results rendered necessary a more in depth investigation of
alternative approaches. As a result, two additional applications were carried out which are
presented in the following sections.
D2.3.4 TRANSPHORM Deliverable
19
Figure 10. Result comparison for the UI methodology regarding NO2 for London for the application
year of 2005, for each mixing height class.
Figure 11. Result comparison for the UI methodology regarding PM10 for London, for the
application year of 2005, for each mixing height class.
D2.3.4 TRANSPHORM Deliverable
20
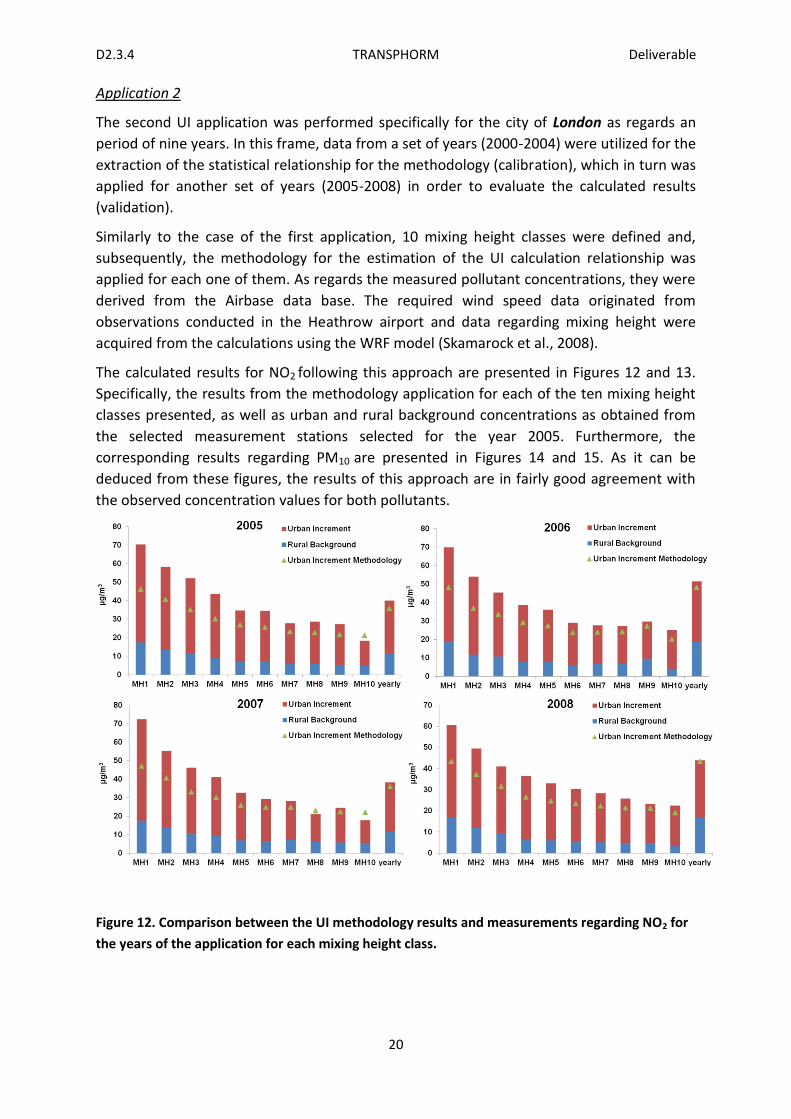
Application 2
The second UI application was performed specifically for the city of London as regards an
period of nine years. In this frame, data from a set of years (2000-2004) were utilized for the
extraction of the statistical relationship for the methodology (calibration), which in turn was
applied for another set of years (2005-2008) in order to evaluate the calculated results
(validation).
Similarly to the case of the first application, 10 mixing height classes were defined and,
subsequently, the methodology for the estimation of the UI calculation relationship was
applied for each one of them. As regards the measured pollutant concentrations, they were
derived from the Airbase data base. The required wind speed data originated from
observations conducted in the Heathrow airport and data regarding mixing height were
acquired from the calculations using the WRF model (Skamarock et al., 2008).
The calculated results for NO2 following this approach are presented in Figures 12 and 13.
Specifically, the results from the methodology application for each of the ten mixing height
classes presented, as well as urban and rural background concentrations as obtained from
the selected measurement stations selected for the year 2005. Furthermore, the
corresponding results regarding PM10 are presented in Figures 14 and 15. As it can be
deduced from these figures, the results of this approach are in fairly good agreement with
the observed concentration values for both pollutants.
Figure 12. Comparison between the UI methodology results and measurements regarding NO2 for
the years of the application for each mixing height class.

D2.3.4 TRANSPHORM Deliverable
21
Figure 13. Comparison between the UI methodology results and measurements at a yearly level
regarding NO2 for the years of the application.
Figure 14. Comparison between the UI methodology results and measurements regarding PM10 for
the years of the application for each mixing height class.
D2.3.4 TRANSPHORM Deliverable
22
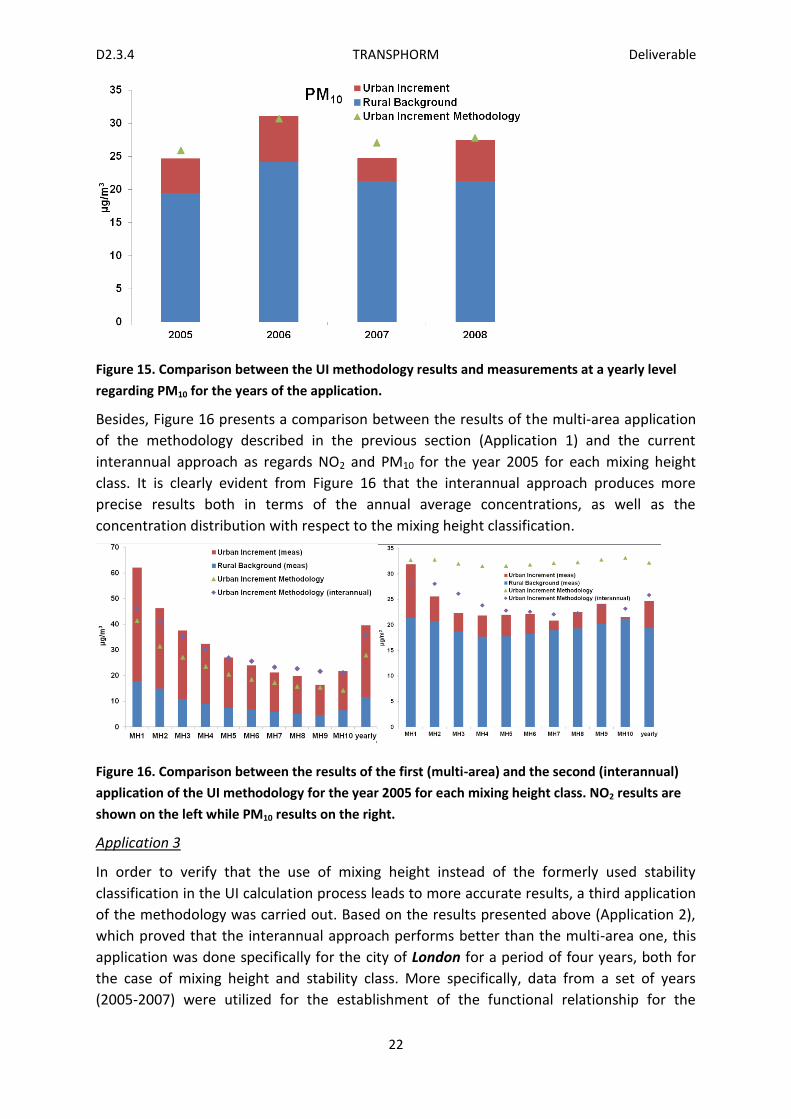
Figure 15. Comparison between the UI methodology results and measurements at a yearly level
regarding PM10 for the years of the application.
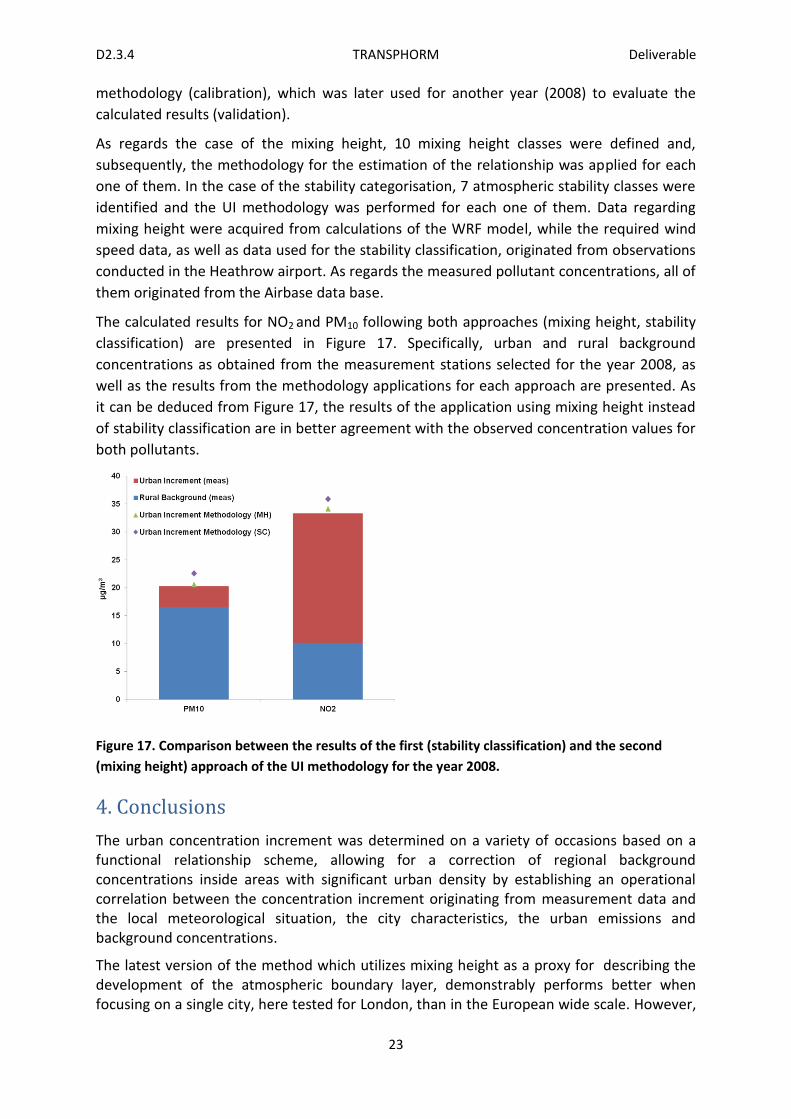
Besides, Figure 16 presents a comparison between the results of the multi-area application
of the methodology described in the previous section (Application 1) and the current
interannual approach as regards NO2 and PM10 for the year 2005 for each mixing height
class. It is clearly evident from Figure 16 that the interannual approach produces more
precise results both in terms of the annual average concentrations, as well as the
concentration distribution with respect to the mixing height classification.
Figure 16. Comparison between the results of the first (multi-area) and the second (interannual)
application of the UI methodology for the year 2005 for each mixing height class. NO2 results are
shown on the left while PM10 results on the right.
Application 3
In order to verify that the use of mixing height instead of the formerly used stability
classification in the UI calculation process leads to more accurate results, a third application
of the methodology was carried out. Based on the results presented above (Application 2),
which proved that the interannual approach performs better than the multi-area one, this
application was done specifically for the city of London for a period of four years, both for
the case of mixing height and stability class. More specifically, data from a set of years
(2005-2007) were utilized for the establishment of the functional relationship for the
D2.3.4 TRANSPHORM Deliverable
23
methodology (calibration), which was later used for another year (2008) to evaluate the
calculated results (validation).
As regards the case of the mixing height, 10 mixing height classes were defined and,
subsequently, the methodology for the estimation of the relationship was applied for each
one of them. In the case of the stability categorisation, 7 atmospheric stability classes were
identified and the UI methodology was performed for each one of them. Data regarding
mixing height were acquired from calculations of the WRF model, while the required wind
speed data, as well as data used for the stability classification, originated from observations
conducted in the Heathrow airport. As regards the measured pollutant concentrations, all of
them originated from the Airbase data base.
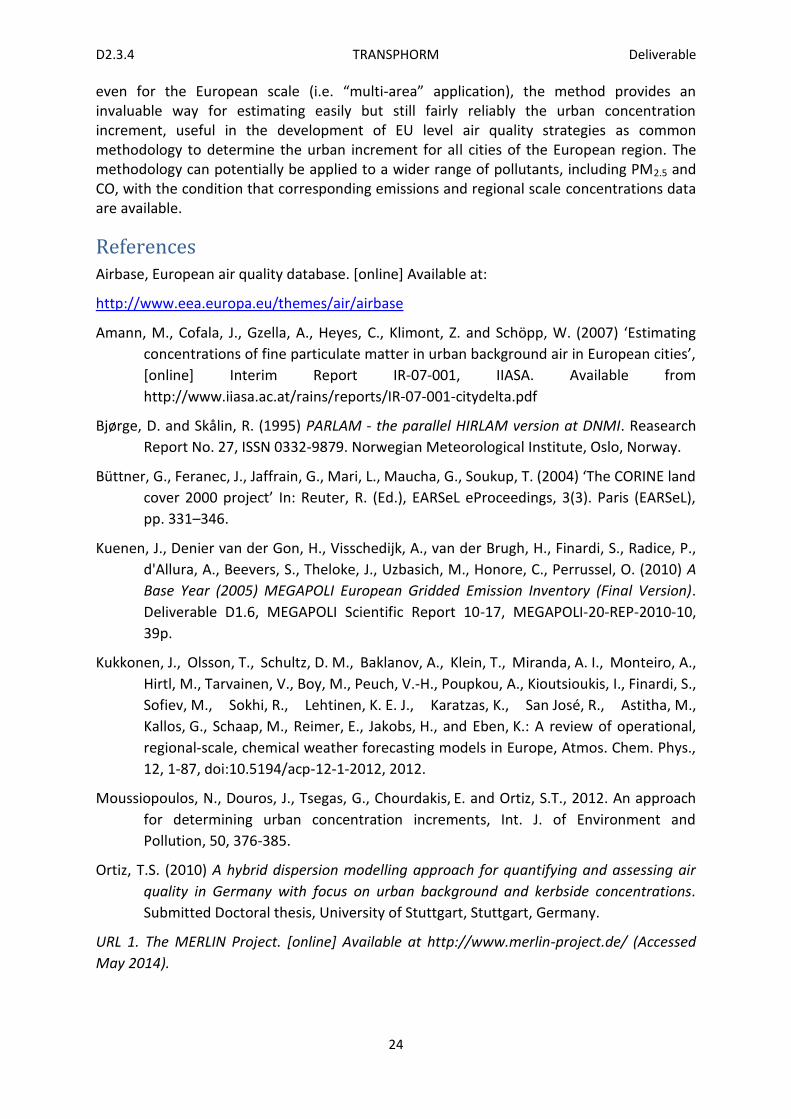
The calculated results for NO2 and PM10 following both approaches (mixing height, stability
classification) are presented in Figure 17. Specifically, urban and rural background
concentrations as obtained from the measurement stations selected for the year 2008, as
well as the results from the methodology applications for each approach are presented. As
it can be deduced from Figure 17, the results of the application using mixing height instead
of stability classification are in better agreement with the observed concentration values for
both pollutants.
Figure 17. Comparison between the results of the first (stability classification) and the second
(mixing height) approach of the UI methodology for the year 2008.
4. Conclusions
The urban concentration increment was determined on a variety of occasions based on a functional relationship scheme, allowing for a correction of regional background concentrations inside areas with significant urban density by establishing an operational correlation between the concentration increment originating from measurement data and the local meteorological situation, the city characteristics, the urban emissions and background concentrations.
The latest version of the method which utilizes mixing height as a proxy for describing the development of the atmospheric boundary layer, demonstrably performs better when focusing on a single city, here tested for London, than in the European wide scale. However,
D2.3.4 TRANSPHORM Deliverable
24
even for the European scale (i.e. “multi-area” application), the method provides an invaluable way for estimating easily but still fairly reliably the urban concentration increment, useful in the development of EU level air quality strategies as common methodology to determine the urban increment for all cities of the European region. The methodology can potentially be applied to a wider range of pollutants, including PM2.5 and CO, with the condition that corresponding emissions and regional scale concentrations data are available.
References Airbase, European air quality database. [online] Available at:
http://www.eea.europa.eu/themes/air/airbase
Amann, M., Cofala, J., Gzella, A., Heyes, C., Klimont, Z. and Schöpp, W. (2007) ‘Estimating
concentrations of fine particulate matter in urban background air in European cities’,
[online] Interim Report IR-07-001, IIASA. Available from
http://www.iiasa.ac.at/rains/reports/IR-07-001-citydelta.pdf
Bjørge, D. and Skålin, R. (1995) PARLAM - the parallel HIRLAM version at DNMI. Reasearch
Report No. 27, ISSN 0332-9879. Norwegian Meteorological Institute, Oslo, Norway.
Büttner, G., Feranec, J., Jaffrain, G., Mari, L., Maucha, G., Soukup, T. (2004) ‘The CORINE land
cover 2000 project’ In: Reuter, R. (Ed.), EARSeL eProceedings, 3(3). Paris (EARSeL),
pp. 331–346.
Kuenen, J., Denier van der Gon, H., Visschedijk, A., van der Brugh, H., Finardi, S., Radice, P.,
d'Allura, A., Beevers, S., Theloke, J., Uzbasich, M., Honore, C., Perrussel, O. (2010) A
Base Year (2005) MEGAPOLI European Gridded Emission Inventory (Final Version).
Deliverable D1.6, MEGAPOLI Scientific Report 10-17, MEGAPOLI-20-REP-2010-10,
39p.
Kukkonen, J., Olsson, T., Schultz, D. M., Baklanov, A., Klein, T., Miranda, A. I., Monteiro, A.,
Hirtl, M., Tarvainen, V., Boy, M., Peuch, V.-H., Poupkou, A., Kioutsioukis, I., Finardi, S.,
Sofiev, M., Sokhi, R., Lehtinen, K. E. J., Karatzas, K., San José, R., Astitha, M.,
Kallos, G., Schaap, M., Reimer, E., Jakobs, H., and Eben, K.: A review of operational,
regional-scale, chemical weather forecasting models in Europe, Atmos. Chem. Phys.,
12, 1-87, doi:10.5194/acp-12-1-2012, 2012.
Moussiopoulos, N., Douros, J., Tsegas, G., Chourdakis, E. and Ortiz, S.T., 2012. An approach
for determining urban concentration increments, Int. J. of Environment and
Pollution, 50, 376-385.
Ortiz, T.S. (2010) A hybrid dispersion modelling approach for quantifying and assessing air
quality in Germany with focus on urban background and kerbside concentrations.
Submitted Doctoral thesis, University of Stuttgart, Stuttgart, Germany.
URL 1. The MERLIN Project. [online] Available at http://www.merlin-project.de/ (Accessed
May 2014).