deliverable c1.1 life cycle assessment: report on
TRANSCRIPT

With the contribution of the LIFE financial instrument of the European Community
Action - C1
Project management and monitoring of the project progress
Deliverable C1.1
Life Cycle Assessment: report on environmental performance of the final
product, the validation according to the ISO standards and summary of the
environmental indicators
Document Type : Deliverable
Document Version : 1
Document Preparation Date : 01/02/2019
Author(s) : Heiling Rich, Parenti Vanni
File Name : C1.1 - LCA
Project Ref. Number : LIFE13 ENV/IT/001238 K-12
Project Start Date : 01/06/2014
Project Duration : 42 months +12 months extension
Website : www.dow.com/k12
748-07301_Life cycle assessment (LCA) of K12 polyols for refrigerator insulation

With the contribution of the LIFE financial instrument of the European Community
If you have any comment to make, please feel free to contact the following author.
authorVanni Parenti
companyDow Italia
departmentR&D
address Via Carpi, 29 42015 Correggio (RE) Italy
tel.+39 0522645829
faxNA
Document history
REV. Content Resp. partner Date
1 First Draft for Dow internal revision
DOW Italia 15/01/2019
2 Second Draft DOW Italia 15/02/2019
3 Review and approval Afros
4 Review and approval Dow Italia
748-07301_Life cycle assessment (LCA) of K12 polyols for refrigerator insulation

Deliverable C 1.1
LCA
3 of 29
LIFE13 ENV/IT/001238 K-12
Life Cycle Assessment
Life cycle assessment (LCA) of K12 polyols for refrigerator insulation
Commissioned by the Dow Italia & Dow Polyurethanes business unit With the support of Life 13 ENV IT001238 K12
Chartered: August, 2018 Completed: February. 2019
Authors:
Dr. Richard Helling EH&S / Sustainability
Dr. Vanni Parenti Dow Polyurethanes
748-07301_Life cycle assessment (LCA) of K12 polyols for refrigerator insulation

Deliverable C 1.1
LCA
4 of 29
LIFE13 ENV/IT/001238 K-12
CONTENTS
CONTENTS ..................................................................................................................................................... 4
EXECUTIVE SUMMARY .................................................................................................................................. 6
INTRODUCTION ............................................................................................................................................. 6
PREVIOUS WORK ........................................................................................................................................... 7
GOAL AND SCOPE .......................................................................................................................................... 8 Goal ........................................................................................................................................................... 8 Function .................................................................................................................................................... 8 Functional Units ........................................................................................................................................ 8 System Boundaries .................................................................................................................................... 8
Consideration of Capital Equipment and Buildings .............................................................................. 9 Transportation ...................................................................................................................................... 9 Period under Consideration .................................................................................................................. 9 Allocation .............................................................................................................................................. 9 Cut-Off Criteria .................................................................................................................................... 10
LIFE CYCLE IMPACT ASSESSMENT ............................................................................................................... 10 LCIA Methods .......................................................................................................................................... 10
Global Warming Potential (GWP) ....................................................................................................... 11 Ozone Depletion Potential (ODP) ....................................................................................................... 11 Acidification Potential (aquatic and terrestrial) (AAP, TAP) ............................................................... 11 Eutrophication Potential (EP) ............................................................................................................. 11 Tropospheric Ozone Formation Potential (TOP) ................................................................................ 11 Non-renewable energy (NRE) ............................................................................................................. 11 General LCIA Comment ....................................................................................................................... 11
Critical Review ......................................................................................................................................... 12 Normalization ..................................................................................................................................... 12
LIFE CYCLE INVENTORY ANALYSIS ............................................................................................................... 12 Data Collection and Sources ................................................................................................................... 12 Consistency ............................................................................................................................................. 17 Data Validation ........................................................................................................................................ 17
LIFE CYCLE INTERPRETATION (RESULTS AND DISCUSSION) ........................................................................ 17 Reference (conventional) foam for refrigerator ..................................................................................... 17 K12 foam for refrigerator ........................................................................................................................ 18 Comparison of conventional and K12 foam for refrigerator insulation ................................................. 20 Reference (conventional) refrigerator assembly .................................................................................... 21 K12 refrigerator assembly ....................................................................................................................... 22 Comparison of conventional and K12 refrigerator assemblies ............................................................... 23
UNCERTAINTY ANALYSIS ............................................................................................................................. 24 Data Quality Assessment .................................................................................................................... 24
CONCLUSIONS ............................................................................................................................................. 25
748-07301_Life cycle assessment (LCA) of K12 polyols for refrigerator insulation

Deliverable C 1.1 LCA
5 of 29
LIFE13 ENV/IT/001238 K-12
CRITICAL REVIEW ........................................................................................................................................ 25
APPENDIX .................................................................................................................................................... 26 Sensitivity analysis: Impact of isocyanate model ................................................................................... 26 Vacuum pump energy use for “carbon neutrality” ................................................................................. 26
REFERENCES ................................................................................................................................................ 27
748-07301_Life cycle assessment (LCA) of K12 polyols for refrigerator insulation

Deliverable C 1.1 LCA
6 of 29
LIFE13 ENV/IT/001238 K-12
EXECUTIVE SUMMARY
Life cycle assessment (LCA) is a useful methodology for examining the potential environmental impacts of a product or service. The goal of this study was to compare the potential cradle-to-gate environmental burdens of an innovative new technology to create low-thermal conductivity insulations in appliances to those for existing technologies. The LCA is part of an overall project between Dow, Whirlpool Corporation, and CANNON Afros, which was partially funded by the European “Life Plus” program. The new technology uses a novel “K12” polyol, CO2 as a blowing agent and evacuation of the CO2 during fabrication of the appliance; the benchmark technology uses an existing polyol, cyclopentane as the blowing agent, and has no evacuation step. The study considered the potential impact categories of global warming, stratospheric ozone depletion, acidification for land and water sources, eutrophication, formation of tropospheric ozone and depletion of nonrenewable energy resources. Results are presented on a “cradle to gate” basis for both the foam (only) and a refrigerator assembly as the use-phase performance of the two refrigerator systems is the same, as is the expected end-of-life fate. The major conclusions from this study are:
Per kg of foam inputs, the K12 system has generally similar or lower (15-30%) burdens than the conventional system. The difference is based on the lower use rate of MDI (methylene diphenyl diisocyanate) in the K12 system, and is sensitive to the choice of models for MDI.
Per refrigerator, using the K12 system has generally higher burdens (5-10%) due to the electricity required to evacuate the CO2. Reducing the electricity required, or using renewable energy, for the evacuation is a key improvement opportunity.
The greatest burdens for the assembled refrigerator come from the use of steel. This study underwent a critical review by a single reviewer (an expert in LCA and insulation systems, internal to Dow, but independent of the project) following the ISO standards for LCA. This was an appropriate level for comparing the use of different Dow materials. This report has been abridged to remove proprietary information; the reviewer had full access to the entire report.
INTRODUCTION
Life Cycle Assessment (LCA) is a useful methodology for examining the potential environmental impacts of a product or service. It enables decisions to be made that avoid unknowingly shifting burdens from one stage of a product life cycle to another or from one potential impact to another. LCA is framed by ISO standards 14040 and 14044 [1,2] which provide comprehensive guidelines for conducting an LCA study. Reference and textbooks [3,4,5], as well as previous Dow reports [6,7,8,9,10] describe the LCA approach well, so we will not include a review of the methodology in this report.
748-07301_Life cycle assessment (LCA) of K12 polyols for refrigerator insulation

Deliverable C 1.1 LCA
7 of 29
LIFE13 ENV/IT/001238 K-12
Refrigerators are a major contributor to household energy use, and their performance has improved dramatically over the last 20 years [11]. The European Ecodesign Directive and the Energy Label Directive focuses “energy using products (EuP)”, which consume energy when they are used (the “use phase” in life cycle assessment). The use phase accounts for 80-90% of the appliance industry’s environmental impact. Dow, Whirlpool Corporation, and CANNON Afros initiated a project to continue the improvements in refrigerator technology which was partially funded by the European “Life Plus” program. The new technology uses a novel “K12” polyol, CO2 as a blowing agent and evacuation of the CO2 during fabrication of the appliance. LCA was used to compare the potential environmental burdens of this new technology to a benchmark technology that uses an existing polyol, cyclopentane as the blowing agent, and has no evacuation step. The study considered the potential impact categories of global warming, stratospheric ozone depletion, acidification for land and water sources, eutrophication, formation of tropospheric ozone (TOP) and depletion of nonrenewable energy resources. Results are presented on a “cradle to gate” basis as the use-phase performance of the two refrigerator systems is the same, as is the expected end-of-life fate. Much of the data for this project came from Dow databases. Dow data sources and how to use them for LCAs are described in detail in a previous report [12]. Three main sources of data for this project were:
GEI – Global Emissions Inventory. Contains data for air emissions, water emissions, and flows to waste treatment devices, one spreadsheet per Dow facility. GAUR – Global Asset Utilization Report. Contains data for total production and energy and utilities use, one spreadsheet for each data type for all of Dow, with data by Dow facility available using a pivot table. BOM – bills of materials, from SAP systems
GEI and GAUR data are usually allocated by mass equally to all the production from a facility. Dow data for a facility are typically reported on an annual basis, so they include all products and operations that occurred in that facility for that year. These annual totals (in absolute amounts) are divided by the production of all products from that plant for the same year to get average values. It is usually not possible to allocate the products of such a multi-product facility differently by another physical rationale. The BOM provide the exact input recipes used for raw material purchases and planning. SimaPro 8.5.2.0 from PRé Consultants was the life cycle assessment software used in this study. It is a widely used LCA tool, selected previously as the standard for Dow LCA work [13]. Data from GEI, GAUR and BOM were used to create and document process models in SimaPro. Ecoinvent v3.3 [14] was used within SimaPro to model utility process operations, and some material inputs. Life cycle impact assessment (LCIA) was performed using valuation systems available in SimaPro, and primarily that of IMPACT 2002+ [15] with no normalization to a target or weighting of different impact categories.
PREVIOUS WORK
Although there are not previous LCA on K12 systems, many other polyurethane components and systems have been studied in Dow [7,8,9,16, 17] as has propylene oxide [18], a key input.
748-07301_Life cycle assessment (LCA) of K12 polyols for refrigerator insulation

Deliverable C 1.1 LCA
8 of 29
LIFE13 ENV/IT/001238 K-12
GOAL AND SCOPE
Goal
The goal of this study was to compare the potential cradle-to-gate environmental burdens of an innovated new technology to create low-thermal conductivity insulations in appliances to existing technologies. The LCA is part of an overall project between Dow, Whirlpool Corporation, and CANNON Afros, which was partially funded by the European “Life Plus” program. The target audiences for this report are initially the Dow technical community, specifically Dow Polyurethanes business, with the possible future use with customers or consultants under a secrecy agreement.
Function
The primary function of K12 polyurethane systems is to provide thermal insulation in refrigerators.
Functional Units
The primary functional unit for this study is the material to produce one kilogram of foam for use in refrigerators. This is not a true functional unit, but a convenient basis for data and calculations from this project. The systems are also compared on the level of a refrigerator assembly to put the differences in the foams into perspective (the two refrigerators have identical performance, so no use-phase differences).
System Boundaries
This was initially a cradle-to-gate study, so the boundaries extended upstream to materials in the earth and end with insulation system materials ready for use at a factory. The life cycle stages included are:
• Raw material production including extraction of primary raw materials, raw material manufacturing, and disposal of key raw material production waste;
• Major raw material transportation to manufacturing locations; • Production of all foam components • Production of insulation foam system.
The use-phase performance of the two systems is the same, as is the expected end-of-life fate, so excluding these stages allows a more direct comparison of the insulation systems.
A high level view of the process flow is shown in Figure 1. This figure leaves out minor flows, but there are utilities, wastes, emissions and other minor inputs to each box. The dashed lined indicates the boundaries for the cradle-to-gate, foam-only, analyses. The figure also includes assembly of the refrigerator. Detailed process models are included in the appendix. Additional information on data collection is in the Life Cycle Inventory section of this report.
748-07301_Life cycle assessment (LCA) of K12 polyols for refrigerator insulation

Deliverable C 1.1 LCA
9 of 29
LIFE13 ENV/IT/001238 K-12
Figure 1: High level process map for refrigerator insulation foam and refrigerator assembly
Consideration of Capital Equipment and Buildings
Process infrastructure, such as capital equipment and buildings, were excluded in this study, which is a common practice in the chemical industry, based on work by Boustead [19]. Transportation
Transportation was included for all significant (>5% by mass) inputs not described by a global (GLO) or market models in ecoinvent (which already include transportation. Truck transport of 500 km was assumed for the transport to the final assembly location; rail transport in Europe is or pipeline is used for all other significant upstream inputs.
Period under Consideration
All Dow primary data for emissions, utilities and wastes in the product models created in the study were taken from the GEI and GAUR systems for the full year 2016 or 2017. 2017 was preferred but 2016 was used when the 2017 data was judged to be of lower quality or a 2016 model already existed from prior projects. Allocation
Dow process energy and utility inputs are typically known at the level of a “facility”, which is usually one of many production facilities at a Dow site. The burdens for utilities and energy inputs, and also for direct air emissions, were divided by the total production of a facility, and allocated by mass equally to all products from that facility.
748-07301_Life cycle assessment (LCA) of K12 polyols for refrigerator insulation

Deliverable C 1.1 LCA
10 of 29
LIFE13 ENV/IT/001238 K-12
Cut-Off Criteria
Cut-off criteria are conditions that specify how much of the data obtained in the study will be used in modeling the system. For an extremely detailed life cycle inventory, accounting for every input is likely to be impractical within reasonable time constraints; hence, cut-off criteria help guide the rationale for excluding any data. To provide a robust and credible analysis, and to thereby enhance the credibility of the study, the approach taken towards cut-off criteria in this study was to include as much of the life cycle inventory data in the models as possible. All the known inputs have been included for the Dow-controlled operations. The implicit cut-off for this data source is relevance: inputs and outputs related directly to the chemical operation are included; ancillary inputs (office supplies and travel, for example) are not included. The cut-offs for non-Dow-controlled operations were the ones used in the ecoinvent process models.
LIFE CYCLE IMPACT ASSESSMENT
LCIA Methods
The study considered the potential impact categories of global warming (GWP), stratospheric ozone depletion (ODP), acidification for land and water sources (AP), eutrophication (EP), formation of tropospheric ozone (TOP) and depletion of nonrenewable energy resources (NRE). This is the required set of indicators for a whole-building LCA under LEED v4. Although refrigerators would not be included in such an LCA, this suite of metrics has been used for other polyurethane LCA, and include a reasonable variety of potential impacts. LEED v4 does not specify specific methods, but the indicators in the same units quoted by LEED v4 are all available in the IMPACT 2002+ method [20], v 2.12 (2014). The indicators are listed below in Table 1.
Table 1: IMPACT 2002+ Impact Categories examined
Impact Category Indicator Unit
Global warming Global Warming Potential (GWP) kg CO2eq
Depletion of the stratospheric ozone layer
Ozone Depletion Potential (ODP) kg CFC-11
Acidification of water sources Aquatic acidification Potential (AAP) kg SO2
Terrestrial acidification Terrestrial Acidification Potential (TAP) kg SO2
Eutrophication of water Eutrophication Potential (EP) kg N or kg P
Formation of tropospheric ozone (“respiratory organics”)
Tropospheric ozone formation potential (TOP)
kg NOx or kg ethene
Depletion of nonrenewable energy resources
Nonrenewable energy use (NRE) MJ
748-07301_Life cycle assessment (LCA) of K12 polyols for refrigerator insulation

Deliverable C 1.1 LCA
11 of 29
LIFE13 ENV/IT/001238 K-12
Global Warming Potential (GWP)
Climate change is the result of the anthropogenic addition of greenhouse gases into the atmosphere. These gases trap heat in the atmosphere, leading to a wide diversity of effects. Climate change impact is a global issue with well-established characterization factors. A 500-year time horizon is used in IMPACT 2002+ v2.14, the latest version in SimaPro v8.5.2 (IMPACT 2002+ v2.21 uses a 100 year time horizon). Ozone Depletion Potential (ODP)
Ozone depletion occurs when reactive and persistent substances interact with the beneficial ozone in the upper atmosphere, or stratosphere. Stratospheric ozone depletion is a global phenomenon due to the relative stability of ozone-depleting chemicals. Acidification Potential (aquatic and terrestrial) (AAP, TAP)
Acidification causes the destruction of aquatic and terrestrial ecosystems through the wet and dry deposition of strong acids and ammonia. Although the characterizations factors for both are expressed in kg SO2eq, factors exist for aquatic acidification potential (AAP) for emissions to air, water and soil, but only exist for emissions to air for terrestrial acidification potential (TAP). Eutrophication Potential (EP)
Eutrophication of water bodies is the overgrowth of biomass caused by the anthropogenic release of nutrients, particularly fixed nitrogen and phosphorus. IMPACT 2002+ contains characterization factors for P-limited, N-limited and undefined. The default (used here) is P-limited. This is more often the limiting factor for freshwater eutrophication in lakes and rivers. The factors are based on fate and transport models for Europe. Tropospheric Ozone Formation Potential (TOP)
Photochemical smog is produced when oxides of nitrogen and volatile organic substances are present in the troposphere (lower atmosphere) in the presence of sunlight. It is sometimes named “Respiratory effects from organics”. The midpoint impact metric can be expressed as “kg ethene” (ethylene) [21]. Non-renewable energy (NRE)
Use of non-renewable energy (NRE) is a concern for the long-term sustainability of a process or product, and is also often a useful surrogate indicator for other potential impacts. IMPACT 2002+ uses the upper heating value for the characterization factors for the life-cycle use of NRE. Non-renewable energy sources include coal, oil, gas, peat and uranium. General LCIA Comment
The LCIA results presented in this study are relative expressions, and do not predict impacts on category endpoints, the exceeding of thresholds, safety margins, or risks.
748-07301_Life cycle assessment (LCA) of K12 polyols for refrigerator insulation

Deliverable C 1.1 LCA
12 of 29
LIFE13 ENV/IT/001238 K-12
Critical Review
A critical review is required by ISO 14044 for comparative assertions intended for public disclosure. Critical review ensures consistency between a life cycle assessment and the ISO requirements for it. The main purpose of a critical review is to ensure a well-defined, expertly executed, transparent LCA that complies with ISO standards for LCA. The critical review is carried out by an expert or a panel of experts, depending on the scope of the LCA, to, amongst other things, decrease the likelihood of miscommunication. The review is conducted by parties independent of the generators of the LCA, whose role it is to determine if: • the methods used to carry out the LCA are consistent with the ISO standards, • the methods used to carry out the LCA are scientifically and technically valid, • the data used are appropriate and reasonable in relation to the goal of the study, • the interpretations reflect the limitations identified and the goal of the study, and • the study report is transparent and consistent. A critical review was conducted for this study. A single internal reviewer was deemed sufficient for this study, as no comparisons are made to a competitor’s product, and it is not intended to be used as-is for public disclosure. Normalization
LCIA provides a comparative assessment of multiple products or services across chosen impact categories. One approach to interpreting the results of LCIA, which aims at identifying the relative significance of each life cycle impact, is normalization. In this approach, the impact category results for the product(s) under assessment are normalized relative to a reference value, such as a total regional, national, or global impact. These normalized results can then be compared to each other, so that any areas of major concern can be identified as being significantly greater in normalized magnitude than the others. Normalization was not done in this study, except for those graphs were the results were normalized with respect to the maximum impact in a category. For all such plots, the absolute numerical value corresponding to 100% is given in the text.
LIFE CYCLE INVENTORY ANALYSIS
Data Collection and Sources
All Dow primary data for the energy and material inputs and emissions during production was collected by the authors from Dow data sources and facility operating records. The data was used for the energy and material inputs and emissions during production. Ecoinvent was the usual source of background data. Details of the specific data sources and assumptions follow. As shown above in Figure 1, the insulation foams have three primary components: a polyol or polyol blend, an isocyanate and a blowing agent. The specified recipes are given below in Table 2 for two products a reference (or benchmark) conventional system, and the new K12 system. The conventional foam has a higher ratio of isocyanate to polyol than does the K12 foam. The mass of the two blowing agents are different, but they are the same number of moles (or volume, at the same conditions). The compositions of the two polyols is given in Table 3.
748-07301_Life cycle assessment (LCA) of K12 polyols for refrigerator insulation

Deliverable C 1.1 LCA
13 of 29
LIFE13 ENV/IT/001238 K-12
Table 2: Specified composition for reference (conventional) and K12 foams
Foam component type Reference system Parts by weight
K12 system Parts by weight
Polyol Reference polyol 100 K12 polyol 100
Isocyanate Voranate M229 150 Voranate M229 100
Blowing agent Cyclopentane 14 Carbon dioxide 8.8
748-07301_Life cycle assessment (LCA) of K12 polyols for refrigerator insulation

Deliverable C 1.1 LCA
14 of 29
LIFE13 ENV/IT/001238 K-12
Table 3: Compositions for Dow-produced polyols for refrigeration insulation
Reference polyol Weight, kg/100 kg
Four Dow polyols 92.1
Water 2.5
Additives 5.4
K12 polyol Weight, kg/98.22 kg
Four Dow polyols 94.6
Additives 3.6
The choices, assumptions and rationale used to translate the Dow data into to the SimaPro model are described in the following, in order as shown in Tables 2 & 3 above:
Voranate M229. Model for production of this isocyanate (MDI) by Dow in Stade, Germany, adapted from prior work (22). Utilities and emissions based on earlier data (2013), but bills of material (compositions) from 2018. We used "system expansion" to get a small credit for by-product HCl, whereas ISOPA used mass allocation to create the published environmental footprint and considered HCl to be a fully valued coproduct. The ISOPA mass allocation produces MDI with significantly lower burdens than the systems expansion approach. System expansion is consistent with recent Dow work, but results from this study should not be compared to those based on the ISOPA MDI. This issue is explained in an earlier report (23).
Cyclopentane. Cyclopentane is not in ecoinvent, but methyl cyclopentane (Methylcyclopentane {GLO}| market for | Cut-off, S) is. It has the important cylco functionality and generally higher burdens than straight pentane, and is selected as a reasonable surrogate.
Carbon dioxide. The ecoinvent model “Carbon dioxide, liquid {RER}| market for | Cut-off, S” is selected as good model for production of CO2 from a waste gas (no upstream burdens). As a “market” model, transportation is included.
Dow VORANOLs RN 482. This product is made by Dow in Terneuzen, The Netherlands. A detailed model was created for this material, accounting for all mass inputs (2018 bill of material), with utilities and emissions from 2017. The major mass inputs are propylene oxide (PO) (64.6%), VORANOL RN 482 (12.2%) and d-sorbitol (22.7%). Models for PO production by Dow in Stade, Germany, using chlorohydrin technology, were used from previous Dow work (18). Sorbitol is produced by the catalytic hydrogenation of glucose, and this process (albeit for the US) was modeled in previous Dow work [24], so that model, “Sorbitol from US glucose”, was used here. No credit was taken for capture of CO2 from the atmosphere in the upstream agricultural production.
VORANOL and TERNAROL products for this project are made in Tertre, Belgium and Terneuzen, The Netherlands. Detailed modelsw ere created for all the materials, accounting for all mass inputs (2018 bill of material), with utilities and emissions from 2016 or 2017. Major mass inputs include:
748-07301_Life cycle assessment (LCA) of K12 polyols for refrigerator insulation

Deliverable C 1.1 LCA
15 of 29
LIFE13 ENV/IT/001238 K-12
o Propylene oxide (PO). Models for PO production by Dow in Europe, were used from previous Dow work (18).
o Ethylene oxide (EO).The ecoinvent model for “Ethylene oxide {RER}| production | Cut-off, S” is a good choice for this input.
o Glycerin. The ecoinvent model “Glycerine {Europe without Switzerland}| esterification of rape oil | Cut-off, S” was used as a good model for the specified material, which is known to be produced in Europe from natural sources (it is not derived from fossil resources).
o Propylene glycol.The ecoinvent model “Propylene glycol, liquid {RER}| production | Cut-
off, S” was selected as a good match with the specified material. o Ortho-toluene diamine. The ecoinvent model “Ortho-phenylene diamine {GLO}| production |
Cut-off, S” was selected as a reasonable match with the specified material. WATER. The ecoinvent model “Water, deionised, from tap water, at user {Europe without
Switzerland}| water production, deionised, from tap water, at user | Cut-off, S” was selected as a good match to the technological inputs and global region; the model will not capture a specific location or water source, which could be important if impact methods other than IMPACT 2002+ were used (such as “AWARE”).
Additives. All additives were modeled – there was no cut-off for low-fraction inputs. Models all came from ecoinvent, and included some perfect matches, some stoichiometric mixtures and some surrogates. The choices were all reasonable for the low mass inputs of any one of the additives.
In general, GLO (global) market models from ecoinvent were used, especially for smaller inputs, as these encompass multiple technologies, with packaging and transport included. For bulk materials from known sources, Dow models or appropriate RER (European) production models were used. Specific transport models were included for the major mass flows. Also, the “cut-off” models from ecoinvent were used, as we believe these are simple and offer more transparency than the “APOS” versions (allocation at the point of substitution). Finally, S or System models are used for faster calculation, except when U models are needed for development of full Sankey diagrams or for uncertainty calculations.
In addition to material inputs, there are energy and utility inputs at each of the Dow manufacturing sites. The specific use rates are proprietary, but the choices for describing the utility inputs are given below
Electricity is supplied from the grid at the site in Belgium and is modeled using market electricity in Belgium: “Electricity, medium voltage {BE}| market for | Cut-off, S”.
Power (electricity) at the Terneuzen site comes from natural gas fired co-generation units, so is modelled as “Electricity, high voltage {Europe without Switzerland}| heat and power co-generation, natural gas, 1MW electrical, lean burn | Cut-off, S”.
Steam is used at both sites. The steam heat use has been converted to the required amount of natural gas. We used models for “heat” from ecoinvent so that the combustion emissions would be included: “Heat, district or industrial, natural gas {Europe without Switzerland}| heat production, natural gas, at industrial furnace >100kW | Cut-off, S” was used for Tertre; “Heat, district or industrial, natural gas {Europe without Switzerland}| heat and power co-generation, natural gas, 1MW electrical, lean burn | Cut-off, S” for Terneuzen, which has co-generation.
748-07301_Life cycle assessment (LCA) of K12 polyols for refrigerator insulation
Deliverable C 1.1 LCA
16 of 29
LIFE13 ENV/IT/001238 K-12
Data from the Terneuzen facility also included direct use of natural gas. As there were not data for combustion gases for this facility, a model was selected that includes combustion: “Heat, district or industrial, natural gas {Europe without Switzerland}| heat production, natural gas, at industrial furnace >100kW | Cut-off, S”.
Nitrogen use was modeled with “Nitrogen, liquid {RER}| market for | Cut-off, S”.
Use of compressed air was modeled with “Compressed air, 600 kPa gauge {RoW}| compressed air production, 600 kPa gauge, >30kW, average generation | Cut-off, S”.
We also included models for wastes sent from the plants, using appropriate ecoinvent models for landfill and incineration.
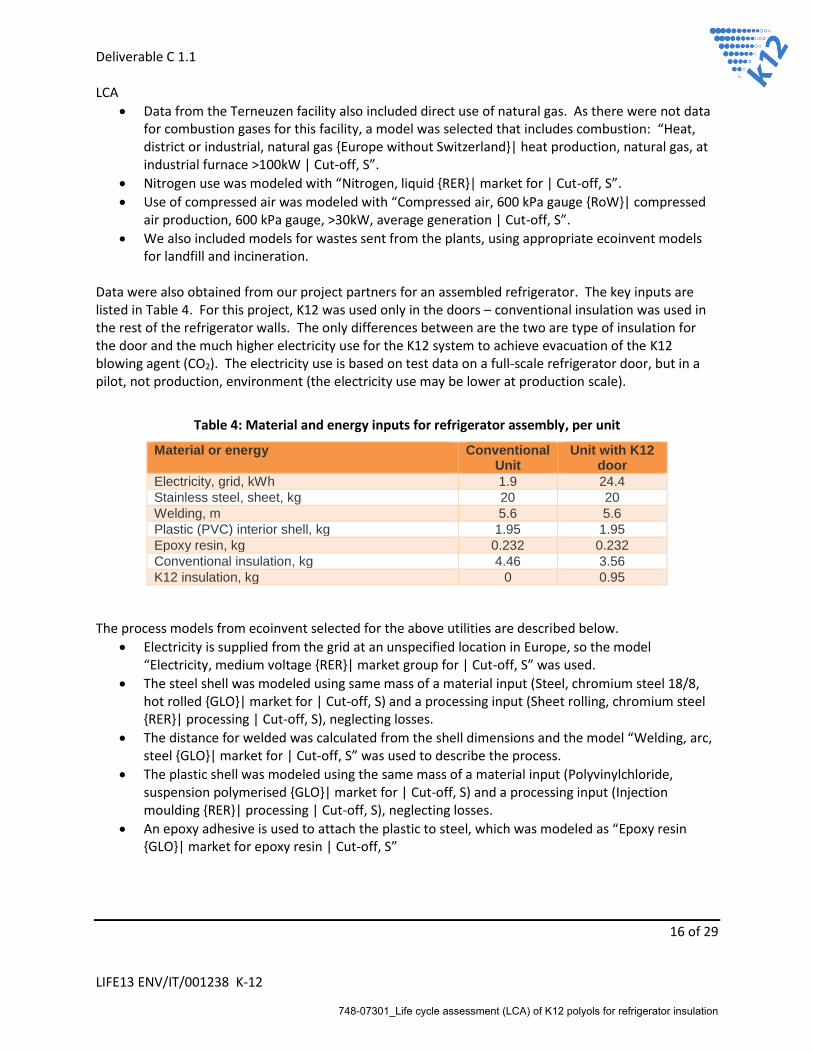
Data were also obtained from our project partners for an assembled refrigerator. The key inputs are listed in Table 4. For this project, K12 was used only in the doors – conventional insulation was used in the rest of the refrigerator walls. The only differences between are the two are type of insulation for the door and the much higher electricity use for the K12 system to achieve evacuation of the K12 blowing agent (CO2). The electricity use is based on test data on a full-scale refrigerator door, but in a pilot, not production, environment (the electricity use may be lower at production scale).
Table 4: Material and energy inputs for refrigerator assembly, per unit
Material or energy Conventional Unit
Unit with K12 door
Electricity, grid, kWh 1.9 24.4
Stainless steel, sheet, kg 20 20
Welding, m 5.6 5.6
Plastic (PVC) interior shell, kg 1.95 1.95
Epoxy resin, kg 0.232 0.232
Conventional insulation, kg 4.46 3.56
K12 insulation, kg 0 0.95
The process models from ecoinvent selected for the above utilities are described below.
Electricity is supplied from the grid at an unspecified location in Europe, so the model “Electricity, medium voltage {RER}| market group for | Cut-off, S” was used.
The steel shell was modeled using same mass of a material input (Steel, chromium steel 18/8, hot rolled {GLO}| market for | Cut-off, S) and a processing input (Sheet rolling, chromium steel {RER}| processing | Cut-off, S), neglecting losses.
The distance for welded was calculated from the shell dimensions and the model “Welding, arc, steel {GLO}| market for | Cut-off, S” was used to describe the process.
The plastic shell was modeled using the same mass of a material input (Polyvinylchloride, suspension polymerised {GLO}| market for | Cut-off, S) and a processing input (Injection moulding {RER}| processing | Cut-off, S), neglecting losses.
An epoxy adhesive is used to attach the plastic to steel, which was modeled as “Epoxy resin {GLO}| market for epoxy resin | Cut-off, S”
748-07301_Life cycle assessment (LCA) of K12 polyols for refrigerator insulation

Deliverable C 1.1 LCA
17 of 29
LIFE13 ENV/IT/001238 K-12
Consistency
A quantitative consistency check was not included in this study. Qualitatively, the use of a small number of data sources allowed collection of primary data with consistent age, quality and detail. All primary data is from operations in Europe.
Data Validation
The lead authors provided detailed review of the data provided by the project team members with respect to mass accountability and the reasonableness of engineering design calculations. This was done during the data collection process.
LIFE CYCLE INTERPRETATION (RESULTS AND DISCUSSION)
Reference (conventional) foam for refrigerator
It is possible to generate a wide range of results once one has process models in a software tool. The results are presented first for Global Warming Potential (GWP), then for other potential impacts. The GWP for the reference foam system is 4.06 kg CO2eq/kg. The VORANATE isocyanate carries the largest mass input (57%) and also carries the largest contribution to GWP (60%). At the 2nd and 3rd tiers, the largest contributors are aniline (42%, used to make the isocyanate) and propylene oxide (28% used to make the VORANOL polyols. Figure 2 shows the contributions of the 1st tier components for all the selected potential impacts. As with the GWP, the isocyanate contributes 56-73% and the polyols combine to contribute 22-41% to these potential impacts.
748-07301_Life cycle assessment (LCA) of K12 polyols for refrigerator insulation

Deliverable C 1.1 LCA
18 of 29
LIFE13 ENV/IT/001238 K-12
Figure 2: Contributions of 1st tier components to selected potential impacts for reference system
The absolute results for the potential impacts shown in Figure 2 are listed below in Table 5.
Table 5: Potential impacts for 1 kg of conventional PU foam for refrigerator
Impact category Unit Total
Non-renewable energy MJ primary 104 Global warming kg CO2 eq 4.06 Aquatic eutrophication kg PO4 P-lim 0.00166 Aquatic acidification kg SO2 eq 0.0205 Terrestrial acidification kg SO2 eq 0.0784 Respiratory organics kg ethane eq 0.00317 Ozone layer depletion kg CFC-11 eq 6.59E-07
K12 foam for refrigerator
The GWP for the K12 foam system is 3.45 kg CO2eq/kg. The VORANATE isocyanate and K12 polyol both have the same mass fraction (48%) and carry about the contribution to GWP (48%). At the 2nd and 3rd tiers, the largest contributors are aniline (34%, used to make the isocyanate) and propylene oxide (39% used to make the VORANOL polyols. Figure 3 shows the contributions of the 1st tier components for all
748-07301_Life cycle assessment (LCA) of K12 polyols for refrigerator insulation

Deliverable C 1.1 LCA
19 of 29
LIFE13 ENV/IT/001238 K-12
the selected potential impacts. As with the GWP, the isocyanate contributes 48-68% and the polyols combine to contribute 30-48% to these potential impacts.
Figure 3: Contributions of 1st tier components to selected potential impacts for 1 kg K12 foam
The absolute results for the potential impacts shown in Figure 3 are listed below in Table 6.
Table 7: Potential impacts for 1 kg of K12 PU foam for refrigerator
Impact category Unit Total
Non-renewable energy MJ primary 85.2 Global warming kg CO2 eq 3.45 Aquatic eutrophication kg PO4 P-lim 0.00121 Aquatic acidification kg SO2 eq 0.0159 Terrestrial acidification kg SO2 eq 0.0644 Respiratory organics kg ethane eq 0.00229 Ozone layer depletion kg CFC-11 eq 4.66E-07
748-07301_Life cycle assessment (LCA) of K12 polyols for refrigerator insulation

Deliverable C 1.1 LCA
20 of 29
LIFE13 ENV/IT/001238 K-12
Comparison of conventional and K12 foam for refrigerator insulation
The results for the selected metrics listed in Table 4 & 5 are presented graphically in Figure 4, where the results have been normalized by the larger of the two in each category. In all categories, the conventional foam is 15-30% the higher, and is shown in the red bars; the lower values for K12 are shown in green.
Figure 4: Comparison of potential impacts per kg of conventional and K12 foam (only)
The differences between the two foams is due primarily to the generally higher potential impacts per kilogram for the isocyanate (VORANATE M229) compared to the polyol blends, and that proportionally higher isocyanate is used in the conventional. The impacts per kilogram of polyol blends and isocyanate are shown in Figure 5, where the results have been normalized by the larger of the three in each category. In all categories except aquatic eutrophication, the isocyanate is the higher, and is shown in the orange bars; the conventional polyol mixture is shown in red and K12 polyol in green.
748-07301_Life cycle assessment (LCA) of K12 polyols for refrigerator insulation

Deliverable C 1.1 LCA
21 of 29
LIFE13 ENV/IT/001238 K-12
Figure 5: Comparison of potential impacts per kg of isocyanate and polyol
Reference (conventional) refrigerator assembly
Figure 6 shows the contributions of the 1st tier components for all the selected potential impacts. Steel production is the largest contributor to all the metrics, ranging from 53-72%, with an additional 8-9% for the second, cold, rolling processing. The conventional insulation is the 2nd largest contributor, bring 13-32% of the potential impacts. Contributions from other inputs are small.
Figure 6: Contributions of 1st tier components to selected potential impacts for reference refrigerator
The absolute results for the potential impacts shown in Figure 6 are listed below in Table 7.
748-07301_Life cycle assessment (LCA) of K12 polyols for refrigerator insulation

Deliverable C 1.1 LCA
22 of 29
LIFE13 ENV/IT/001238 K-12
Table 7: Potential impacts for a conventional refrigerator
Impact category Unit Total
Non-renewable energy MJ primary 2010 Global warming kg CO2 eq 132 Aquatic eutrophication kg PO4 P-lim 0.028 Aquatic acidification kg SO2 eq 0.733 Terrestrial acidification kg SO2 eq 2.51 Respiratory organics kg ethane eq 0.0718 Ozone layer depletion kg CFC-11 eq 9.26E-06
K12 refrigerator assembly
Figure 7 shows the contributions of the 1st tier components for all the selected potential impacts. Steel production is again the largest contributor to all the metrics, ranging from 49-70%, with an additional 7-8% for the second, cold, rolling processing. Insulation (conventional in the body and K12 in the door) is again the 2nd largest contributor, bring 11-27% of the potential impacts. But there is now a dominant 3rd contributor – electricity use (the sum of two items in the graph – the base electricity use plus the extra for the evacuation of blowing agent) which contribute 9-33%. Contributions from other inputs are small.
Figure 7: Contributions of 1st tier components to selected potential impacts for K12 refrigerator
The absolute results for the potential impacts shown in Figure 7 are listed below in Table 8.
748-07301_Life cycle assessment (LCA) of K12 polyols for refrigerator insulation

Deliverable C 1.1 LCA
23 of 29
LIFE13 ENV/IT/001238 K-12
Table 8: Potential impacts for a K12 refrigerator
Impact category Unit Total
Non-renewable energy MJ primary 2210 Global warming kg CO2 eq 141 Aquatic eutrophication kg PO4 P-lim 0.031 Aquatic acidification kg SO2 eq 0.782 Terrestrial acidification kg SO2 eq 2.67 Respiratory organics kg ethane eq 0.0718 Ozone layer depletion kg CFC-11 eq 1.01E-05
Comparison of conventional and K12 refrigerator assemblies
The results for the selected metrics listed in Table 7 & 8 are presented graphically in Figure 8, where the results have been normalized by the larger of the two in each category. In all categories, the conventional foam is the same or 5-10% slower, and is shown in the red bars; the same or higher values for K12 are shown in green. The comparison shows that the increased burdens from the higher electricity exceeds the benefits per kilogram for using K12 that are shown in Figure 6. The exception is the category of respiratory organics (smog), where the increase due to the higher electricity use is small, and offset by lower impacts of this kind for the K12 foam. Also, the use phase was excluded from this analysis as it would be the same for both systems. The impacts of electricity consumption during the use phase can be much larger than the electricity used in fabrication of either refrigerator (Table 5). For example, electricity consumption of a class A refrigerator is 303 kWh/yr [25], so that in a 12 –year service life, 3636 kWh would be consumed, about 150 times that used for assembly of the K12 unit or 1,900 times that of the conventional unit
Figure 8: Comparison of potential impacts per refrigerator using conventional and K12 foam.
748-07301_Life cycle assessment (LCA) of K12 polyols for refrigerator insulation
Deliverable C 1.1 LCA
24 of 29
LIFE13 ENV/IT/001238 K-12
UNCERTAINTY ANALYSIS
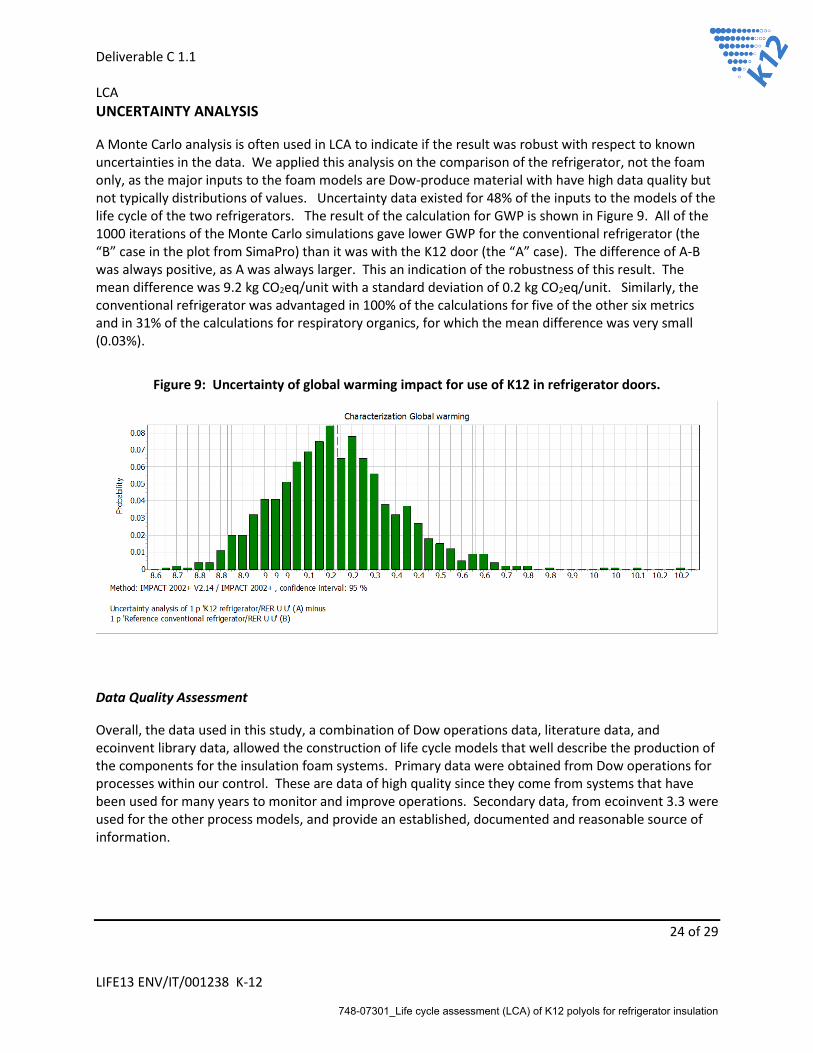
A Monte Carlo analysis is often used in LCA to indicate if the result was robust with respect to known uncertainties in the data. We applied this analysis on the comparison of the refrigerator, not the foam only, as the major inputs to the foam models are Dow-produce material with have high data quality but not typically distributions of values. Uncertainty data existed for 48% of the inputs to the models of the life cycle of the two refrigerators. The result of the calculation for GWP is shown in Figure 9. All of the 1000 iterations of the Monte Carlo simulations gave lower GWP for the conventional refrigerator (the “B” case in the plot from SimaPro) than it was with the K12 door (the “A” case). The difference of A-B was always positive, as A was always larger. This an indication of the robustness of this result. The mean difference was 9.2 kg CO2eq/unit with a standard deviation of 0.2 kg CO2eq/unit. Similarly, the conventional refrigerator was advantaged in 100% of the calculations for five of the other six metrics and in 31% of the calculations for respiratory organics, for which the mean difference was very small (0.03%).
Figure 9: Uncertainty of global warming impact for use of K12 in refrigerator doors.
Data Quality Assessment
Overall, the data used in this study, a combination of Dow operations data, literature data, and ecoinvent library data, allowed the construction of life cycle models that well describe the production of the components for the insulation foam systems. Primary data were obtained from Dow operations for processes within our control. These are data of high quality since they come from systems that have been used for many years to monitor and improve operations. Secondary data, from ecoinvent 3.3 were used for the other process models, and provide an established, documented and reasonable source of information.
748-07301_Life cycle assessment (LCA) of K12 polyols for refrigerator insulation

Deliverable C 1.1 LCA
25 of 29
LIFE13 ENV/IT/001238 K-12
CONCLUSIONS
The major conclusions from this study are:
Per kg of foam inputs, the K12 system has generally similar or lower (15-30%) burdens than the conventional system. The difference is based on the lower use rate of MDI (methylene diphenyl diisocyanate) in the K12 system, and is sensitive to the choice of models for MDI.
Per refrigerator, using the K12 system has generally higher burdens (5-10%) due to the electricity required to evacuate the CO2. Reducing the electricity required, or using renewable energy, for the evacuation is a key improvement opportunity.
On this regard we considered in appendix of the present deliverable how we could mitigate the energy required for the evacuation by using renewable sources. On the other hand, it is important to underline that the expected electricity consumption for the refrigerator evacuation in the final production line (with target foam, industrial dedicated equipment, etc. ) would be one twentieth with respect to the one needed at laboratory scale as presented in this document.
The greatest burdens for the assembled refrigerator come from the use of steel.
CRITICAL REVIEW
An internal critical review was conducted in February, 2019, by Jennifer Princing, subject matter expert in insulation systems, LCA and Sustainability, The Dow Chemical Company, Midland, Michigan USA. This report has been abridged to remove proprietary information; the reviewer had full access to the entire report. Her review statement is:
The LCA, “Life cycle assessment (LCA) of K12 polyols for refrigerator insulation “, described in the CRI Report SCS 2019-001 of 8 February 2019 has been carried out according to the international standard ISO 14044. The work is well made and constitutes a very professional study. The report of the work contains an excellent discussion of the relevant and comprehensive sensitivity analysis scenarios that were carried out.
748-07301_Life cycle assessment (LCA) of K12 polyols for refrigerator insulation

Deliverable C 1.1 LCA
26 of 29
LIFE13 ENV/IT/001238 K-12
APPENDIX
Sensitivity analysis: Impact of isocyanate model
As noted earlier, the Dow models for isocyanate yield typically higher impacts than those from ecoinvent, and in particular the ISOPA data captured in “Methylenediphenyl diisocyanate (MDI)/EU-27” in the “Industry data 2.0” library in SimaPro. Since the lower potential impacts for the K12 polyol shown in Figure 6 were attributed to using a lower proportion of the higher-burdened isocyanate, it is prudent to test the robustness of those results to the choice of MDI model (and in effect, the choice of allocation methods for MDI & upstream processes). Models for both foam systems were created using the Industry data 2.0 model, and are compared in Figure A-1. The K12 foam system is still advantaged in all categories by 7-24%, although this is smaller than the 15-30% shown in Figure 6. This is a small difference that does not change the overall trends in the results per kg, nor would it for a whole refrigerator.
Figure A-1: Impact of POCl3 model on comparison of VORACOR products
Vacuum pump energy use for “carbon neutrality”
The primary difference between the two refrigerators is the additional use of electricity in the models for the refrigerator with the K12 insulation in the door. The 22.5 kWh of grid electricity used to evacuate the CO2 per door results in 9.56 kg CO2eq/refrigerator global warming potential impact, which is nearly the same as the 9.18 kg CO2eq/refrigerator difference. The difference between the two – 0.38 kg CO2eq/refrigerator – has the same carbon footprint as about 0.9 kWh or market grid electricity in Europe, so one could use at most that much extra grid electricity for a K12 door to have the carbon footprint be the same for the two refrigerator systems. Another way to achieve carbon neutrality would be to obtain renewable power for the extra demand. Figure A-2 is a comparison of the two refrigerator systems (as in Figure 10), but with an added bar for a K12 refrigerator using German wind-power for the 22.5 kWh of additional energy (the bar in blue). The blue and red bars are essentially identical for all
748-07301_Life cycle assessment (LCA) of K12 polyols for refrigerator insulation

Deliverable C 1.1 LCA
27 of 29
LIFE13 ENV/IT/001238 K-12
metrics, showing the source of electricity during the assembly step can have a large impact on the comparison of the systems.
Figure A-2: Comparison of potential impacts per refrigerator using conventional foam, K12 foam, and K12 foam with renewable power for vacuum system.
REFERENCES
748-07301_Life cycle assessment (LCA) of K12 polyols for refrigerator insulation
Deliverable C 1.1 LCA
28 of 29
LIFE13 ENV/IT/001238 K-12
1. International Standard ISO 14040, “Environmental management – Life cycle assessment – Principles and framework”, Second edition, 01 July 2006.
2. International Standard ISO 14044, “Environmental management – Life cycle assessment – Requirements and guidelines”, First edition, 01 July 2006.
3. European Commission - Joint Research Centre - Institute for Environment and Sustainability: International Reference Life Cycle Data System (ILCD) Handbook - General guide for Life Cycle Assessment - Detailed guidance. First edition March 2010. EUR 24708 EN. Luxembourg. Publications Office of the European Union; 2010.
4. Environmental Life Cycle Assessment, Rita Schenck and Philip White, editors, American Center for Life cycle Assessment ISBN: 978-0-9882145-3-8 2014
5. Life Cycle Assessment Handbook, Mary Ann Curran, editor, Scrivener Publishing 2012 ISBN: 978-1118099728
6. Helling, Richard K.; Russell, David A. “Use of life cycle assessment to characterize the environmental impacts of polyol production options” Green Chemistry 11(3), 380-389, 2009 DOI:10.1039/b815833a
7. Helling, Richard, Vanni Parenti “Life Cycle Assessment: ENERG-ICE, a new polyurethane foam technology for the cold appliance industry” ISO 14044 Public Report, The Dow Chemical Company, May, 2013
8 . Helling, Rich, Cecilia Girotti, Giuseppe Vairo, Han Zhang, “It’s the End that Matters: A Case Study of New Foam Blowing Technology” Life Cycle Assessment XIV: Proceedings, San Francisco 2014, ACLCA, 2014
9. Helling, R., R. Paludetto, A. Benvenuti, G. Lista, “Life Cycle Assessment of polyurethanes for shoe soles with at least 20% renewable (bio-based) content: The Green Footprint Project” LCA public report, report released October, 2011 also available in “The impact of bio-feedstock choice on the LCA of renewable shoe soles” Proceedings of the LCA XI International Conference, Chicago, October, ACLCA 2012
10. Helling, Richard K., Ian Cass, Joshua Merrill “Using LCA to Identify Options for Greenhouse Gas Emission Reductions in Australian Wheat Farming” Proceedings of the 9th International Conference LCA of Food San Francisco, USA 8-10 October 2014
11. Horie, Yuhta Alan “Life Cycle Optimization of Household Refrigerator-Freezer Replacement” Report No. CSS04-13, Center for Sustainable Systems, University of Michigan, August 14, 2004
12. Dow internal report 2012 13. Dow internal report 2011 14. Ecoinvent v2.2, Swiss Centre for Life Cycle Inventories, 2010. 15. Humbert, Sébastien, An De Schryver, Xavier Bengoa, Manuele Margni, Olivier Jolliet “IMPACT 2002+:
User Guide - Draft for version Q2.21” Quantis International, 1 November 2012, available at http://www.quantis-intl.com/pdf/IMPACT2002_UserGuide_for_vQ2.21.pdf
16. Dow internal report 2016 17. Dow internal report 2018 18. Dow internal report 2011 19. Boustead, Ian “An Introduction to Life Cycle Assessment”, Boustead Consulting Ltd., 2003 20. Humbert, Sébastien, An De Schryver, Xavier Bengoa, Manuele Margni, Olivier Jolliet “IMPACT 2002+:
User Guide - Draft for version Q2.21” Quantis International, 1 November 2012, available at http://www.quantis-intl.com/pdf/IMPACT2002_UserGuide_for_vQ2.21.pdf
748-07301_Life cycle assessment (LCA) of K12 polyols for refrigerator insulation

Deliverable C 1.1 LCA
29 of 29
LIFE13 ENV/IT/001238 K-12
21. Goedkoop M and Spriensma R . “The Eco-indicator 99: A Damage Oriented Method for Life Cycle
Assessment, Methodology Report, second edition”. PRé Consultants, Amersfoort, The Netherlands. (2000)
22 . Zhang, Han (H),Helling, Rich (RK), Enache Pommer, Elena (E), Schmidt, Amy (A) “Life Cycle Assessment for Polyisocyanurate Rigid Foam” Dow CRI report, lab code SCS 2014-001, 7 March 2014
23. Dow internal report 2016 24. Dow internal report 2004 25. European Directive 2010/30/EU
748-07301_Life cycle assessment (LCA) of K12 polyols for refrigerator insulation