deliverable 7.1 definition of test protocols - europa · deliverable 7.1 definition of test...
TRANSCRIPT
“Demonstration Project for
Power Supply to Telecom Stations
through FC technology”
Deliverable 7.1 Definition of test protocols
Version 5.0 Report submission date: 20140130 Dissemination level: PU Work Package 7 - Testing Work Package Leader: JRC Contributors: JRC, UNIROMA2, Ericsson
This project is co-financed by funds from the 7th EU Frameworkl programme on Research, technological Development and Demonstration activities through the Fuel Cell and Hydrogen Joint Undertaking
Application Area: SP1-JTI-FCH.4: Early Markets
Call topic: SP1-JTI-FCH.2010.4.2 Demonstration of industrial application readiness of fuel cell generators for power supply to off-grid stations, including the hydrogen supply solution
FCH-JU-2010-1 Grant Agreement number 278921.
Dissemination Level
PU Public X
PP Restricted to other program participants (including the Commission Services)
RE Restricted to a group specified by the consortium (including the Commission Services)
CO Confidential, only for members of the consortium (including the Commission Services)

“Demonstration Project for
Power Supply to Telecom Stations through FC technology”
Page 2 of 17
Contact Details:
Project coordinator: Dr. Giancarlo TOMARCHIO - ERICSSON Telecomunicazioni S.p.A.
Document prepared and contributed by
Dr.-Ing. Thomas Malkow & Alberto Pilenga, European Commission, Directorate-General Joint Research Centre, Institute for Energy and Transport E-mail: [email protected]
Ing. Vincenzo Mulone, University of Rome Tor Vergata E-mail: [email protected]
Marco Filonzi Ericsson E-mail: [email protected]
Andrea Giordani Ericsson E-mail: [email protected]
Document Log:
Version
Date
Summary of changes Author
1.0 18/04/2012 First revision T. Malkow
2.0 26/04/2013 Revised according to agreed
objective and input profiles to be used
A. Pilenga
3.0 21/01/2014 Revised mostly for the definition
of test results evaluation V. Mulone
4.0 27/01/2014 Editorial & technical
improvements T. Malkow, A. Pilenga
5.0 30/01/2014 Updating field test details M. Filonzi, A. Giordani

“Demonstration Project for
Power Supply to Telecom Stations through FC technology”
Page 3 of 17
Table of Contents
LIST OF TABLES .............................................................................................................................. 4
LIST OF FIGURES ............................................................................................................................. 4
1. Introduction ....................................................................................................................... 5
2. Objective of this deliverable ......................................................................................... 6
3. Scope of the test ................................................................................................................ 6
4. System benchmark definition ...................................................................................... 6
4.1 General Statements ................................................................................................................... 6
4.2 PV input profile: latitude ............................................................................................................ 7
4.3 PV input profile: weather effect................................................................................................. 8
4.4 RBS load profile ........................................................................................................................ 10
5. Laboratory trial tests .................................................................................................... 10
5.1 Input and output test parameter ...................................................................................... 10
5.2 Performance characterisation test .................................................................................... 12
5.3 Test procedure ................................................................................................................... 12
6. Field tests .......................................................................................................................... 12
7. Evaluation of test results ............................................................................................. 15
7.1 Data analysis of laboratory trial tests ................................................................................ 15
7.2 Data analysis of field trial tests ............................................. Error! Bookmark not defined.
7.3 TCO and efficiency calculations.......................................................................................... 16

“Demonstration Project for
Power Supply to Telecom Stations through FC technology”
Page 4 of 17
LIST OF FIGURES
Figure 1 Layout of the FCpowered RBS system in the laboratory test setup ........ 7
Figure 2 PV input profile latitude estimation ..................................................... 8
Figure 3 Representative operating conditions ................................................... 9
LIST OF TABLES
Table 1 – measured variables ........................................................................ 11
“Demonstration Project for
Power Supply to Telecom Stations through FC technology”
Page 5 of 17
Introduction
Fuel Cell powered RBS (Demonstration of Project for Power Supply to Telecom Stations through FC technology) is an FCH-JU funded project to implement several field trials to assess the market readiness of Fuel Cell (FC) technology and relative H2 infrastructure for telecom applications, specific for off-grid Radio Base Stations (RBS).
The project will apply Renewable Energy Systems, typically Photovoltaic (PV) Energy Systems and FC Systems, to power off-grid sites, to maximize taking actions to the energy efficiency and to reduce power losses.
The main objectives of FC powered RBS Project are:
Demonstrate the effective operation of solution powered mainly by FC, with the target to have overall 20 sites (two of them by research centres).
Analyze statistically significant number of RBS sites in order to meet market criteria.
Contribute to overcome the lack of awareness about this technology, as a key factor to increase sales and foster market penetration.

“Demonstration Project for
Power Supply to Telecom Stations through FC technology”
Page 6 of 17
1. Objective of this deliverable The objective of this deliverables is the development of test protocols for each system application to be valid as a benchmark protocol concerning basic requirements of the customers (end user), possible extreme values anticipated for normal system operation and possible risks.
2. Scope of the test The main purpose of these test protocols is to confirm that the FCpoweredRBS systems reach their objective that is to accurately estimate by testing and evaluation of the test results obtained in the laboratory tests conducted by UNIROMA2 and JRC during about 18 months of project duration (laboratory trial tests) and in the field tests.
For the laboratory test the main goal are:
1. Test the system under operating conditions that are representative of real operation
2. test all the devices that compose the system
3. evaluate the efficiency of the system
4. obtain a TCO (total cost of owenership) value of the system combining laboratory and field test results
In the field tests comprising about 6 months per RBS power generation unit this will include:
• Realistic system start-ups and shut-downs and
• RBS load power tests including the recoding of delivered PV power and of stored energy through the use of batteries and of the hydrogen produced by water electrolysis.
• System reliability by recording any failure in particular out of DC (direct current) bus voltage range during testing and
Key system performance parameters such as current, voltage, power and efficiency of FC, batteries and electrolyser as well as PV panels will be continuously monitored and recorded for data analysis to identify potential system degradation and that of the mentioned system components.
Detailed descriptions of system components are given in the deliverable D2.2 "Target specifications".
3. System benchmark definition
4.1 General Statements

“Demonstration Project for
Power Supply to Telecom Stations through FC technology”
Page 7 of 17
The system operation is imposed by input/output power profiles and SOC (state of
charge) via the following
Dependence on latitude of PV power production
Dependence on seasons and weather
RBS load requirements
The final layout of the lab setup, according to configuration C, and better described in
deliverable 2.2, is schematized in Figure 1.
Figure 1 Layout of the FCpowered RBS system in the laboratory test setup
4.2 PV input profile: latitude
The latitude considered for employing PV and FC powered RBS systems in
Europe was chosen as 47° North by bi-normal distribution calculation (Figure 2)
radiation frequency versus latitude .

“Demonstration Project for
Power Supply to Telecom Stations through FC technology”
Page 8 of 17
Figure 2 PV input profile latitude estimation
In making this calculation idealised (smoothed) summer and winter radiation profiles
were used based on averaged data recorded at the said latitude. Characteristic of
seasons especially for spring and autumn are oscillations in the radiation profiles at a
time-scale of about one hour constituting the envelope of profiles considered good
(summer) and worse (winter).
4.3 PV input profile: weather effect
The benchmark profile must test the system according to seasonal variations to have
realistic data over longer periods, typically a whole year. Also, this profile should be
representative of a whole year's operation for the PV component. First an equinox day
duration (which is average over the year) is identified, and elaborated considering three
options to account for different weather, Figure 3:
Good weather day, full radiation for the chosen latitude, representing a typical
summer day.
Bad weather day, complete cloudy day, radiation of 10% of that of a good
weather day, representing a typical winter day.
Variable weather day, both cloudy and sunny, radiation regularly oscillating
between good and bad weather conditions, representing typical spring and
autumn days alike The resulting radiation power profile of such day was taken
twice allowing for

“Demonstration Project for
Power Supply to Telecom Stations through FC technology”
Page 9 of 17
Figure 3 Representative radiation power profiles
The benchmark radiation profile for the tests comprises a consecutive period of 72
hours, Figure 5 starting with the profile of the winter day at 6 am, that is a condition for
sure characterized by zero SOC in the real field. The test start condition is that the
batteries shall be at minimum SOC not to influence the evaluation of system
performance.
Figure 4 Idealised radiation profile (Power per unit of PV panel surface area (in m2) vs. 72 hours of test duration) with three representative days (bad,
good & variable weather)
This PV power profile (Figure 4) derived from the radiation profiles (Figure 3) considers
the following relation:
𝑃 = 𝜂 𝐼 𝑆 (𝜂=0.1, 𝑆 =66.6 m2)
where 𝜂 is the efficiency of the PV panels (that takes into account the panels'
orientation and tilt towards the sun),
0 2 4 6 8 10 12 14 16 18 20 22 240
100
200
300
400
500
600
700
800
time [h]
radia
tion [
W/m
q]
latitude=47°
0 2 4 6 8 10 12 14 16 18 20 22 240
100
200
300
400
500
600
700
800
time [h]
radia
tion [
W/m
q]
good weather
variable weather
bad weather
0
100
200
300
400
500
600
700
800
900
1000
0 20 40 60
Ra
dia
tio
n p
ow
er
[W/
m^
2]
Time [h]
Day 1
Day 2 Day 3

“Demonstration Project for
Power Supply to Telecom Stations through FC technology”
Page 10 of 17
𝐼 [W/m2] is the solar radiation measured by the weather station, and
𝑆 [m2] is the surface area of the panels.
4.4 RBS load profile
A constant RBS load being an average DC consumption was assumed as power
demand (Pload) for the test. The DC loads are 1 kW for the Dantherm system, and 900
W for the MES system due to different nominal operating conditions. In both the cases
the power is within the usual range of real world RBS applications, nevertheless.
4. Laboratory trial tests The laboratory tests to be conducted on the systems are the performance
characterisation tests described below.
In the block diagram (Figure 5) the main system parameters are depict towards the
calculation of the main performance indicators of the entire system as well as of
individual system components.
Figure 5 Block diagram of the laboratory test setup
5.1 Input and output test parameter
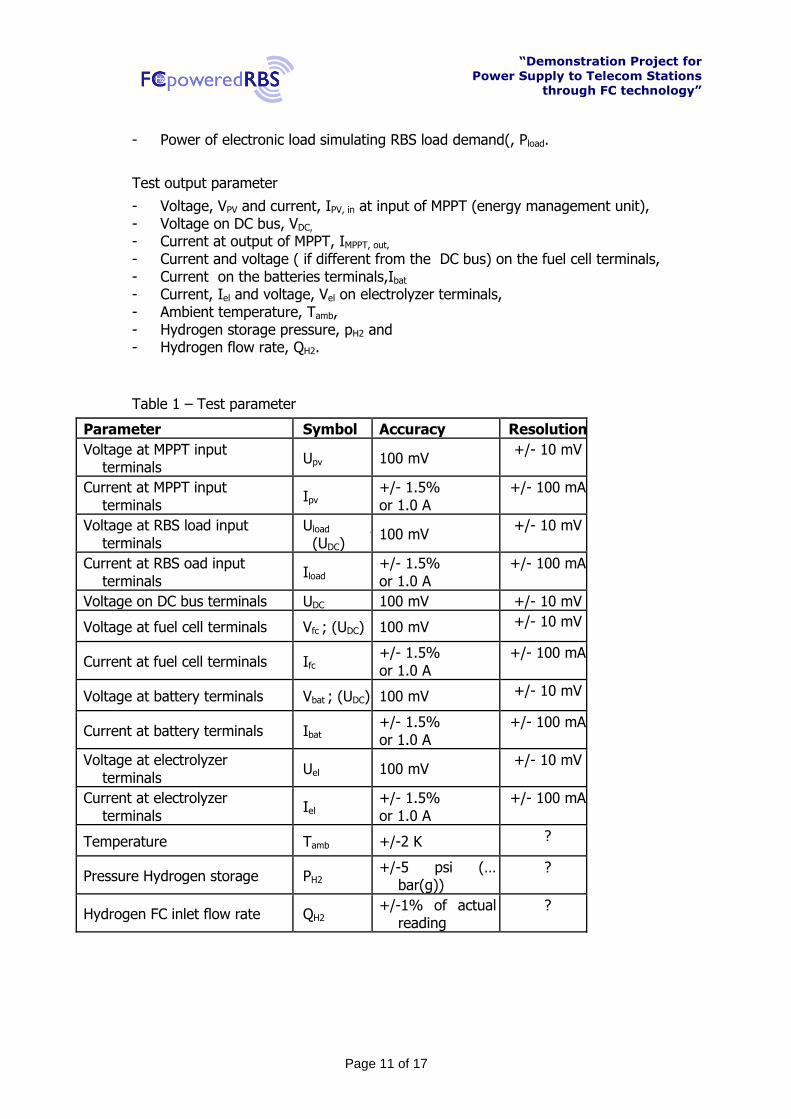
All data should continuously be recorded at a sampling rate of 1 Hz using appropriate measurement devices and software (Figure 5). The test parameters are as follows:
Test input parameter
- Power of PV panel simulator, PPV and
“Demonstration Project for
Power Supply to Telecom Stations through FC technology”
Page 11 of 17
- Power of electronic load simulating RBS load demand(, Pload.
Test output parameter
- Voltage, VPV and current, IPV, in at input of MPPT (energy management unit), - Voltage on DC bus, VDC, - Current at output of MPPT, IMPPT, out, - Current and voltage ( if different from the DC bus) on the fuel cell terminals, - Current on the batteries terminals,Ibat - Current, Iel and voltage, Vel on electrolyzer terminals, - Ambient temperature, Tamb, - Hydrogen storage pressure, pH2 and - Hydrogen flow rate, QH2.
Table 1 – Test parameter
Parameter Symbol Accuracy Resolution
Voltage at MPPT input terminals
Upv 100 mV +/- 10 mV
Current at MPPT input
terminals Ipv
+/- 1.5%
or 1.0 A
+/- 100 mA
Voltage at RBS load input
terminals
Uload ;
(UDC) 100 mV
+/- 10 mV
Current at RBS oad input
terminals Iload
+/- 1.5%
or 1.0 A
+/- 100 mA
Voltage on DC bus terminals UDC 100 mV +/- 10 mV
Voltage at fuel cell terminals Vfc ; (UDC) 100 mV +/- 10 mV
Current at fuel cell terminals Ifc +/- 1.5%
or 1.0 A
+/- 100 mA
Voltage at battery terminals Vbat ; (UDC) 100 mV +/- 10 mV
Current at battery terminals Ibat +/- 1.5%
or 1.0 A
+/- 100 mA
Voltage at electrolyzer
terminals Uel 100 mV
+/- 10 mV
Current at electrolyzer
terminals Iel
+/- 1.5%
or 1.0 A
+/- 100 mA
Temperature Tamb +/-2 K ?
Pressure Hydrogen storage PH2 +/-5 psi (…
bar(g)) ?
Hydrogen FC inlet flow rate QH2 +/-1% of actual
reading ?

“Demonstration Project for
Power Supply to Telecom Stations through FC technology”
Page 12 of 17
5.2 Performance characterisation test
The system performance will be characterised by applying during the test duration, Ttest the RBS load profiles , PPV , (Figure 4) and drawing the specified RBS load power, Pload.
The duration of this test is 72 hours for each of the two systems to be tested.
5.3 Test procedure
Upon system installation and safety checks, tests start with the activation of the system
to provide the specified RBS load to constitute T0 hrs.
The three days of testing - Day 1 to Day 3 (see Figure 4) - in the benchmark
characterisation test are conducted consecutively as follows:
Test day 1
1- (T0 hrs) Activation of system with the following conditions:
- Battery SOC at minimum level
- Set specified RBS load
- Set PPV equal to zero – all power should be provided by FC2- (T6 hrs) set PPV profile
(Figure 4)
- Set PPV equal to bad weather power profile - system should operate autonomously
3- (T18 hrs) Set PPV power to zero0 – system should operate on battery and FC
Test day 2
4- (T30 hrs) Set PV power to Spring equinox profile - system should operate autonously
5- (T42 hrs) Set PPV power to zero - system should operate on battery and FC
Test day 3
4- (T54 hrs) Set PV power to variable weather conditions profile - system should operate autonomously
5- (T66 hrs) Set PPV pow1400er to zero - system should operate on battery and FC
6- test ends when battery SOC reaches its specified minimum or 72 hours of test elapsed whichever is earlier.
5. Field tests

“Demonstration Project for
Power Supply to Telecom Stations through FC technology”
Page 13 of 17
For the field test trial, the same parameters as listed in Table 1 shall be measured using
the a logic control system (PLC type RES) implemented with algorithm described in WP2.
The logic control board detects all parameters showing every value through a user
interface displayed in figure 6, that allows the remote control and monitoring. System
can work automatically or manually according the different need of user.
The system reads voltage (V) value on the iDC bus and detects current values (A)
according the source of power that is working in every time step (photovoltaic, battery,
fuel cell). All parameters are showed in the interface and is possible to check every
quantity: voltage detected (V), current density (I), calculated power (kW).
Every energy source is identified by a code (DC1 for battery, DC2 for photovoltaic panels
and DC3 for fuel cells), plus the electrolyser situated on the right side of the interface
and fuelled by a surplus power (W) coming from photovoltaic during sunny dais
monitored by solarimeter which allows to know the value associated to each source.
For fuel cell two different values of power are displayed in order to collect data either for
power given (positive energy in kWh) either for power required (negative energy kWh)
while for battery is possible to know charge and discharge power according power
output operation or battery recharging (both measured in kWh).
The system is equipped by different types of alarm that alert the user in case of
operational issues.
Results of measurements can be showed in graphics as reported in figure 7 where is
showed as example a time step in which all different type of energy sources worked to
power the load according the algorithm. Starting from photovoltaic supply the battery
starts to give power where the PV was not able to power the load by itself until the fuel
cell shut on, when the battery charged drop down to the established lower limit of
operation.
Before field test, site acceptance and standalone operation check lists have to be filled
up (all check lists required to test the correct operation are included in deliverable 3.2).

“Demonstration Project for
Power Supply to Telecom Stations through FC technology”
Page 14 of 17
Figure 6 Remote user interface
Figure 7 Graphics showing the system status by remote control monitoring
“Demonstration Project for
Power Supply to Telecom Stations through FC technology”
Page 15 of 17
6. Evaluation of test results
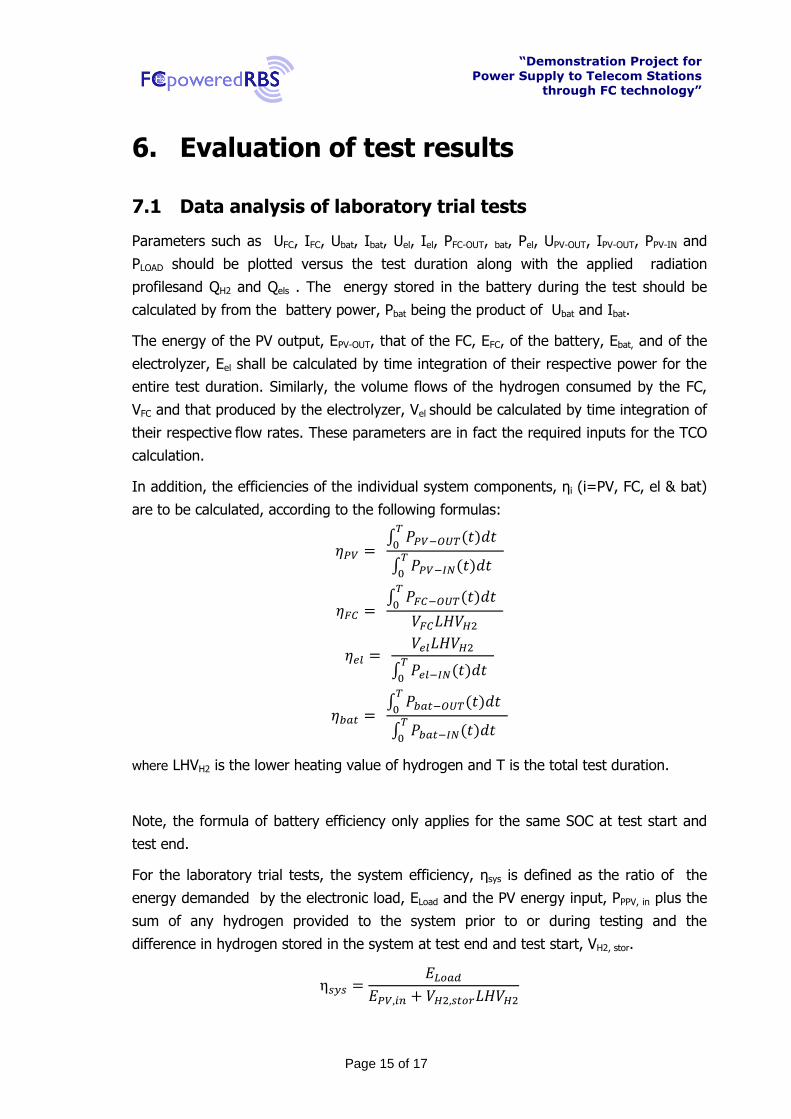
7.1 Data analysis of laboratory trial tests
Parameters such as UFC, IFC, Ubat, Ibat, Uel, Iel, PFC-OUT, bat, Pel, UPV-OUT, IPV-OUT, PPV-IN and
PLOAD should be plotted versus the test duration along with the applied radiation
profilesand QH2 and Qels . The energy stored in the battery during the test should be
calculated by from the battery power, Pbat being the product of Ubat and Ibat.
The energy of the PV output, EPV-OUT, that of the FC, EFC, of the battery, Ebat, and of the
electrolyzer, Eel shall be calculated by time integration of their respective power for the
entire test duration. Similarly, the volume flows of the hydrogen consumed by the FC,
VFC and that produced by the electrolyzer, Vel should be calculated by time integration of
their respective flow rates. These parameters are in fact the required inputs for the TCO
calculation.
In addition, the efficiencies of the individual system components, ηi (i=PV, FC, el & bat)
are to be calculated, according to the following formulas:
𝜂𝑃𝑉 = ∫ 𝑃𝑃𝑉−𝑂𝑈𝑇(𝑡)𝑑𝑡
𝑇
0
∫ 𝑃𝑃𝑉−𝐼𝑁(𝑡)𝑑𝑡 𝑇
0
𝜂𝐹𝐶 = ∫ 𝑃𝐹𝐶−𝑂𝑈𝑇(𝑡)𝑑𝑡
𝑇
0
𝑉𝐹𝐶𝐿𝐻𝑉𝐻2
𝜂𝑒𝑙 = 𝑉𝑒𝑙𝐿𝐻𝑉𝐻2
∫ 𝑃𝑒𝑙−𝐼𝑁(𝑡)𝑑𝑡 𝑇
0
𝜂𝑏𝑎𝑡 = ∫ 𝑃𝑏𝑎𝑡−𝑂𝑈𝑇(𝑡)𝑑𝑡
𝑇
0
∫ 𝑃𝑏𝑎𝑡−𝐼𝑁(𝑡)𝑑𝑡 𝑇
0
where LHVH2 is the lower heating value of hydrogen and T is the total test duration.
Note, the formula of battery efficiency only applies for the same SOC at test start and
test end.
For the laboratory trial tests, the system efficiency, ηsys is defined as the ratio of the
energy demanded by the electronic load, ELoad and the PV energy input, PPPV, in plus the
sum of any hydrogen provided to the system prior to or during testing and the
difference in hydrogen stored in the system at test end and test start, VH2, stor.
η𝑠𝑦𝑠 =𝐸𝐿𝑜𝑎𝑑
𝐸𝑃𝑉,𝑖𝑛 + 𝑉𝐻2,𝑠𝑡𝑜𝑟𝐿𝐻𝑉𝐻2

“Demonstration Project for
Power Supply to Telecom Stations through FC technology”
Page 16 of 17
7.3 TCO and efficiency calculations
Loadsys
RES FES
E
E E
(RES=Renewable Energy Sources, FES=Fossil Energy Sources). The hydrogen
consumption is referred to the FES as the hydrogen is produced from Fossil Fuels.
Loadsys
RES FES
E
E E
A size Index is then introduced as Loadsize
RES
EI
E
(2)
could be evaluated a priori.
A size index is then introduced, whose main goal is to classify different systems (for
example depending on different PV and RBS power size, based on the non-dimensional
RES availability over a year:
Loadsize
RES
EI
E
If Isize << 1, the HPS may be considered to be a stand-alone system, and the FES
requirement over the year could theoretically be equal to zero. In such cases ηsys could
be considered in the order of the theoretically achievable energy conversion efficiency
from RES, ηRES* which, in the case of a PV powerplant, is in the order of 15%. The
obtainment of lower values is indicative of poor performance of the HPS in terms of RES
exploitation.
If Isize >> 1, the micro-grid mainly relies on FES and their minimum requirements over
the year is the mere difference between the load requirement and the renewable energy
available after the conversion and assuming a “perfect” conversion of the primary source
into electricity.
The system efficiency can be developed as a function of the average PV panel efficiency
PV and average fuel cell efficiency FC . Also a reference reforming efficiency is
introduced to take into account the primary energy (FES) consumption.
*
PV RES FC reform FESLoadsys
RES FES RES FES
E EE
E E E E
As a further development, two performance coefficients of the PV panel
,
*
RES e PVPV
MPP PV
E
E
and the FC
**
*
FC reformFESFC
FES diesel
E
E
can be introduced, defined as

“Demonstration Project for
Power Supply to Telecom Stations through FC technology”
Page 17 of 17
the ratios between the average efficiency and a reference energy efficiency (in the case
of the PV panel defined as the MPPT nominal efficiency, while in the case of Fuel Cells
the Diesel Genset efficiency diesel (7)
The two performance coefficients allow to compare the performance of the fuel cell with
regard to the Diesel genset, and to highlight the capability of the system of extracting
the whole amount of the renewable energy available during the year. It is finally worth
noting that PV takes into account the battery efficiency and storage, although it does
not directly appear in the formula.
* *
* *
1
FESPV PV diesel FC
PV PV RES diesel FC FES RESsys
FESRES FES
RES
E
E E E
EE E
E
Based on the system efficiency the CO2 savings can be calculated for each solution.
The TCO would be a function of CAP-EX (Capital Expenses) and OP-EX (Operational
Expenses). With regard to the OP-EX contribution, the H2 mass consumption represents
the main input parameter. With regard to the 72h benchmark tests, it may be promptly
calculated through the following formula
2
2
2
2
*
H
H
H
reformFES
HLHV
E
LHV
EM
where EH2 represents the energy consumed by the fuel cell and LHVH2 the Low Heating
Value of Hydrogen. This would allow to compare the H2 costs of different systems
having same size index Isize, and may be used to have an annual projection of MH2 .