deliquescence of nacl–nano3, kno3–nano3, and nacl–kno3 ... · tures of the pure phases using...
TRANSCRIPT
GEOCHEMICAL TRANSACTIONS VOLUME 6, NUMBER 2 JUNE 2005
Deliquescence of NaCl–NaNO3 , KNO3 – NaNO3 , and NaCl–KNO3salt mixtures from 90 to 120°C
Susan Carroll,a) Laura Craig, and Thomas J. WoleryEnergy and Environment Directorate, Lawrence Livermore National Laboratory, Livermore, California 94550
~Received 11 November 2004; accepted 26 January 2005; published online 11 April 2005!
We conducted reversed deliquescence experiments in saturated NaCl–NaNO3 – H2O,KNO3 – NaNO3 – H2O, and NaCl–KNO3 – H2O systems from 90 to 120 °C as a function of relativehumidity and solution composition. NaCl, NaNO3 , and KNO3 represent members of dust saltassemblages that are likely to deliquesce and form concentrated brines on high-level radioactivewaste package surfaces in a repository environment at Yucca Mountain, NV. Discrepancy betweenmodel prediction and experiment can be as high as 8% for relative humidity and 50% for dissolvedion concentration. The discrepancy is attributed primarily to the use of 25 °C models for Cl–NO3
and K–NO3 ion interactions in the current Yucca Mountain Project high-temperature Pitzer modelto describe the nonideal behavior of these highly concentrated solutions. © 2005 AmericanInstitute of Physics. @DOI: 10.1063/1.1872292#
I. INTRODUCTION
Yucca Mountain, NV is the designated geologic reposi-tory for permanent disposal of high-level nuclear waste. Cur-rent waste package design calls for double walled containerswith an inner wall of stainless steel and an outer wall ofhighly corrosion resistant Ni–Cr–Mo alloy, which are pro-tected with Ti shields to prevent rocks and seepage waterfrom contacting the containers.1 Of concern are the corrosionresistance and long-term integrity of these metal barriers. Ifthe Yucca Mountain site license is approved, the waste pack-ages will be placed in tunnels several hundred meters belowthe ground surface in partially saturated volcanic tuff, butstill well above the groundwater table. A likely source ofbrines that may potentially corrode metal containers and dripshields are those formed by the absorption of water by hy-groscopic salts found in local and regional dust depositedduring repository construction and ventilation stages.
Accurate prediction of brine formation is important forthe safe disposal of radioactive waste, because brine compo-sition is an indicator of the corrosiveness of the aqueousenvironment and the relationship between deliquescencerelative humidity and temperature is an indicator of ‘‘reposi-tory dryness.’’ Deliquescence refers to the formation of anaqueous solution by the absorption of water by hygroscopicsalt minerals. This process allows brines to form above100 °C at standard atmospheric pressure of 1.013 25 bar ~orabove 96 °C and 0.9 bar at the repository elevation of 1039–1107 m; BSC, 2004a, Sec. 6.7.2.1!. The relative humidity atwhich salts deliquesce is dependent on temperature and ischaracteristic to each salt mineral or assemblage of salt min-erals. For example at 90 °C, MgCl2 deliquesces at 24% rela-tive humidity and KCl deliquesces at 78.5% relativehumidity.2 Generally, the deliquescence relative humidity fora salt mixture is lower than the deliquescence relative humid-
a!Author to whom correspondence should be addressed; electronic mail:[email protected]
191467-4866/2005/6(2)/19/12/$22.00
ity for its pure salt components. Salt deliquescence data arelargely limited to 25 °C for mixed salts3–5 but are widelyavailable for single salts at higher temperatures.2
The range of brines formed by the deliquescence of hy-groscopic salts found in dusts can be calculated from mix-tures of the pure phases using equilibrium thermodynamics,because relative humidity is related to the activity of waterand solution composition. Wolery and Wang6 used the EQ3/6
geochemical code and the Yucca Mountain Project high-temperature Pitzer model to predict the deliquescence of saltmixtures found in Yucca Mountain dust samples collectedfrom exploratory tunnels. The modeling results predict thatmixtures of NaCl, KNO3 , and/or NaNO3 are the most preva-lent mineral assemblages, and that inclusion of KNO3~s!lowers the deliquescence relative humidity from values near70% at 25 °C to values as low as 20% at 160 °C. This analy-sis implies that concentrated brines may contact the metalcontainer and drip shield surfaces at low relative humidityand high temperature.
In this paper we compare model predictions and experi-mental results of relative humidity and solution compositionsfor saturated NaCl–NaNO3 – H2O, KNO3 – NaNO3 – H2O,and NaCl–KNO3 – H2O systems from 90 to 120 °C. Theseare benchmark experiments that can be used to assess thevalidity of the model calculations and Pitzer parameters thataccount for nonideal ion interactions in these highly concen-trated solutions.
II. MODEL CALCULATIONS
Relative humidity is thermodynamically tied to solutioncomposition through the activity of water. For water, its ac-tivity, aw , is the product of its mole fraction, xw , and itsmole fraction activity coefficient, gw :
aw5xwgw . ~1!
The mole fraction of water is dependent on the solution com-position:
© 2005 American Institute of Physics

20 Geochem. Trans., Vol. 6, No. 2, June 2005 Carroll et al.
FIG. 1. ~Color! Deliquescence of NaCl–NaNO3 salts at 90 °C starting from initially dissolved and initially solid mixtures plotted as ~a! % relative humidityand ~b! solution composition.
xw5nw Y S nw1(i
niD ~2!
where nw and ni are the number of moles of water and ofdissolved ionic constituent i, respectively. The concentrationsof the dissolved constituents are limited by the solubilities ofthe thermodynamically stable salt minerals. If we use halite~NaCl! as an example, then the solubility product, KNaCl , ata given temperature is dependent on the Na1 and Cl2 con-centrations and activity coefficients according to the massbalance reaction:
NaCl~s)5Na11Cl1, ~3a!
KNaCl5~mNa1gNa1!~mCl2gCl2!, ~3b!
where mi and g i indicate the molality and activity coefficientof species i, with unit activity implied for the solid ~NaCl!.
Relative humidity, RHfrac, is related to activity of waterthrough the partial pressure of water vapor, and is equivalentto
RHfrac5pw /pw0 , ~4!
where pw is the partial pressure of water vapor over an aque-ous solution and pw
0 is the partial pressure of water vaporover pure water. Similarly, the activity of water is equivalentto
aw5 f w / f w0 , ~5!
where f w is the fugacity of water vapor over an aqueoussolution and f w
0 is the fugacity of water vapor over purewater. Equating fugacity with its partial pressure:
f w / f w0 5pw /pw
0 ~6!
yields:
RHfrac5aw . ~7!
The activity of water is commonly expressed in decimalform and RH is commonly expressed as a percentage; thusRH%51003aw .
In hydrologically unsaturated environments, the partialpressure of water cannot exceed the total pressure. The par-tial pressure of water is related to the vapor pressure of purewater and the activity of water by pw5pw
0 aw . Both the va-por pressure of pure water and the partial pressure of waterover a salt solution increase strongly with temperature above100 °C. Brines cannot exist at temperatures above the dry-outtemperature, where the partial pressure of water equals thetotal pressure. Above the dry-out temperature only solid saltminerals and water vapor occur. Since this process is revers-ible, the dry-out temperature is also the deliquescence tem-perature for the same assemblage of salt minerals ~note: atmuch lower temperature, generally 25 °C or less, dry-out or‘‘efflorescence’’ is controlled by salt mineral nucleation in-stead of equilibrium thermodynamics.5 The deliquescencetemperature is also equivalent to the boiling point for thesaturated solution.
Brines formed by the absorption of water by deliques-cent minerals are thermodynamically equivalent to brinesthat are saturated with respect to the same deliquescent min-erals. Figures 1–5 show the model calculations of relativehumidity and solution composition from 90 to 120 °C versusXNO3 or XNa for the NaCl–NaNO3 – H2O, theKNO3 – NaNO3 – H2O, and the NaCl–KNO3 – H2O systems.For the NaCl–NaNO3 – H2O system, this is done by addingsoda niter (NaNO3) to a halite ~NaCl! saturated solution un-til the solution is saturated with both soda niter and halite.This represents the eutonic point for the NaCl–NaNO3 saltassemblage. The calculation for this assemblage is completedby a complementary run in which halite is added to a sodaniter saturated solution until the same eutonic point is

21Geochem. Trans., Vol. 6, No. 2, June 2005 Deliquescence salt mixtures at high temperatures
FIG. 2. ~Color! Deliquescence of NaCl–NaNO3 salts at 110 °C starting from initially dissolved and initially solid mixtures plotted as ~a! % relative humidityand ~b! solution composition.
reached. An identical approach is used for theKNO3 – NaNO3 – H2O and NaCl–KNO3 – H2O systems. Weuse the EQ3/6 geochemical code7 and the Yucca MountainProject high-temperature Pitzer model.8 This model is basedon the Pitzer equations ~cf. Ref. 9! to account for the non-ideal behavior of the brine solutions. Reaction pressure wasallowed to vary by means of the 1.013 bar/steam-saturationcurve. The Pitzer model is based on the available experimen-tal data and includes binary interactions(bM,X
(0) ,bM,X(1) ,bM,X
(2) ,CM,Xf ) between two different kinds of
ions of opposite charge ~cation M and anion X!, and alsobinary (uM,M8 ,uX,X8) interactions between ions of like
charge and ternary interactions (cM,M8,X ,cX,X8,M) involvingthree ions in common-cation and common-anion ternary sys-tems. Pitzer parameters relevant to this study are listed inTable I.
III. EXPERIMENTAL METHODS
A. Starting materials
Analytical grade sodium chloride ~NaCl, 100.1% pure!,sodium nitrate (NaNO3 , 99.7% pure!, and potassium nitrate(KNO3 , 99.5% pure! were used to synthesize dissolved anddry salt mixtures. Impurities in NaCl include less than 0.01%
FIG. 3. ~Color! Deliquescence of KNO3 – NaNO3 salts at 90 °C starting from initially dissolved and initially solid mixtures plotted as ~a! % relative humidityand ~b! solution composition.
22 Geochem. Trans., Vol. 6, No. 2, June 2005 Carroll et al.
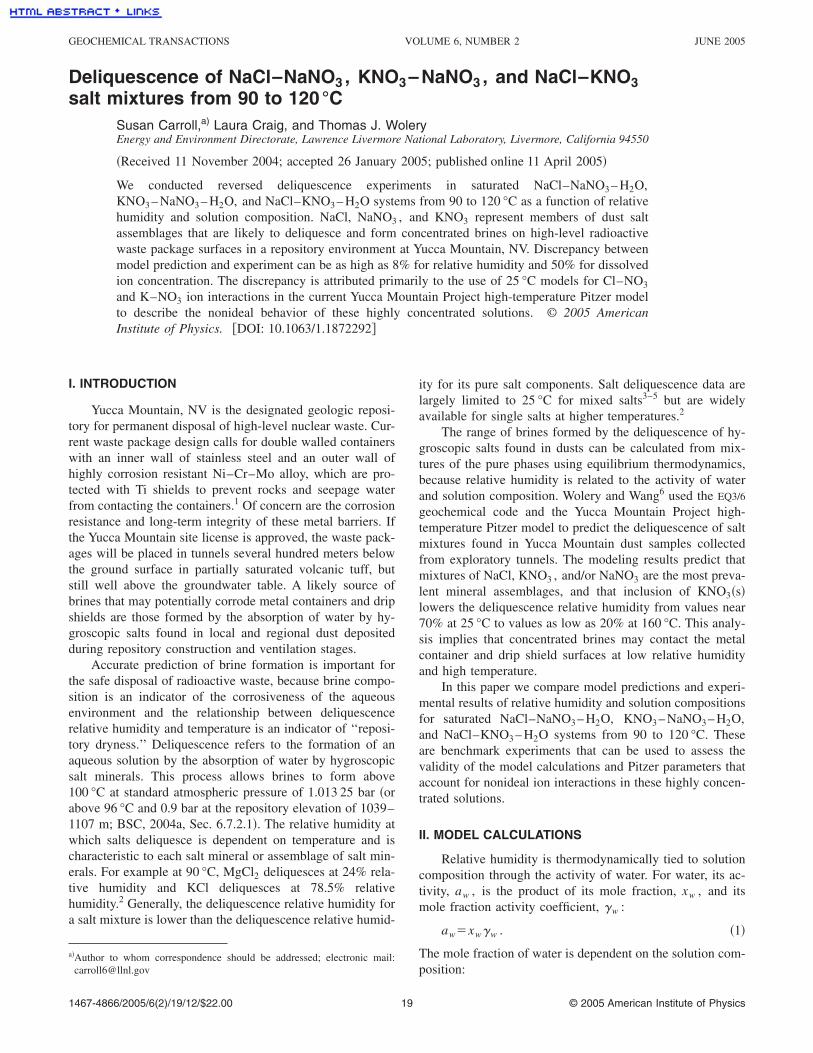
FIG. 4. ~Color! Deliquescence of NaCl–KNO3 salts at 90 °C starting from initially dissolved and initially solid mixtures plotted as ~a! % relative humidityand ~b! solution composition.
Br; 0.005% K; 0.004% SO4 , 0.003% ClO4 , NO3 , and Ba;0.002% I and Ca; 0.001% Mg; 5 ppm PO4 ; 2 ppm heavymetals, and 1 ppm Fe. Impurities in NaNO3 include less than0.002% K; 0.001% SO4 , NO2 , Ca, Mg, and R2O3 ; 0.0005%Cl; 3 ppm PO4 and heavy metals, and 1 ppm Fe and IO3 .Impurities in KNO3 include less than 0.004% Na; 0.002%SO4; 0.001% Cl, and NO2 , 0.0005% Ca; 0.0002% Mg; 3ppm heavy metals, 2 ppm PO4 ; and 1 ppm Fe and IO3 .Distilled and de-ionized ~18 M V! water was used to makeall solutions.
B. Reverse deliquescence experiments
We measured brine composition at controlled relativehumidity for NaCl–NaNO3 , KNO3 – NaNO3 , andNaCl–KNO3 salt mixtures from 90 to 120 °C as a functionof XNO3 or XNa. Our experimental design mimics the modelcalculations in that one salt in the binary system will com-pletely dissolve and the dissolution of the other will be lim-ited by its solubility. We approached the equilibrium brinecomposition by placing identical mole fractions of dissolved
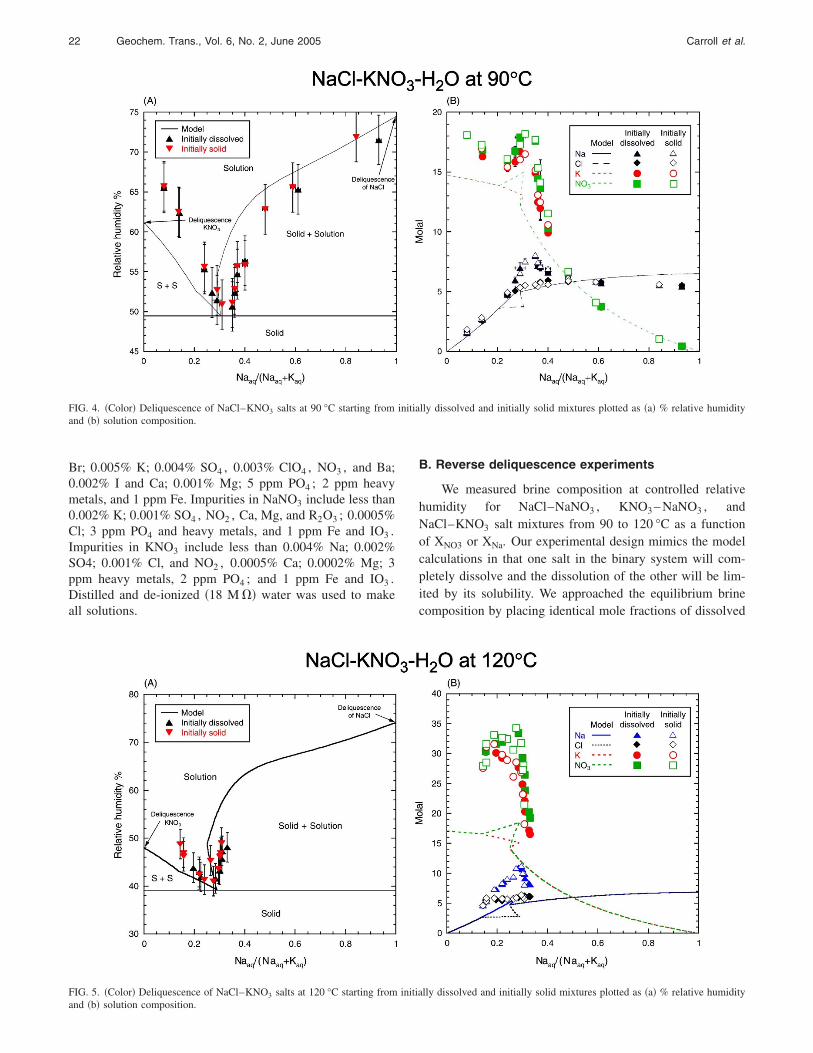
FIG. 5. ~Color! Deliquescence of NaCl–KNO3 salts at 120 °C starting from initially dissolved and initially solid mixtures plotted as ~a! % relative humidityand ~b! solution composition.

23Geochem. Trans., Vol. 6, No. 2, June 2005 Deliquescence salt mixtures at high temperatures
TABLE I. Pitzer interaction parameters used with EQ3/6 to calculate relative humidity and solution compositionin saturated brines containing Na, K, Cl, and NO3 . Temperature dependence of each of these ion interactionparameters is derived from Eq. ~11!: x(T)5a11a2 /(T2Tr)1a3 ln(T/Tr)1a4(T2Tr).
Ion interactions
Pitzer interaction parameters
ReferenceCoefficients a1 a2 a3 a4
K–Cl bMX(0) 4.78310202 23.43310102 21.38 1.34 3 10203 10
bMX(1) 2.16310201 25.76310102 22.88 4.64 3 10203
bMX(2) 0.00
CMXf 27.49310204 3.65310101 1.48310201 21.47 3 10204
K–NO3 bMX(0) 28.16310202 9
bMX(1) 4.94310202
bMX(2) 0.00
CMXf 6.60310203
Na–Cl bMX(0) 7.46310202 24.71310102 21.85 1.66 3 10203 10
bMX(1) 2.75310201 25.21310102 22.88 4.71 3 10203
bMX(2) 0.00
CMXf 1.54310203 4.81310101 1.75310201 21.56 3 10204
Na–NO3 bMX(0) 3.57310203 27.03310102 23.35 3.98 3 10203 11
bMX(1) 2.32310201 22.73310103 21.30310101 2.07 3 10202
bMX(2) 0.00
CMXf 24.15310205 6.48310101 3.18310201 23.84 3 10204
K–Na SuMM8 23.20310203 1.40310101 9.09310213 22.66 3 10215 10
Cl–NO3SuXX8 1.60310202 9
K–Na–Cl cMM8X 23.69310203 25.10 23.41310213 6.66 3 10216 10
~with about 150 g H2O) and solid salt mixtures in an envi-ronmental chamber ~Ecosphere, Despatch! at controlled rela-tive humidity and temperature. Under these conditions thedissolved salt mixture evaporates concentrating the solutionand precipitating one of the two salts, and the solid salt mix-ture absorbs water dissolving the salts until equilibrium isreached.
For each run, four Teflon™ beakers containing the dis-solved salts and four beakers containing the solid salts wereplaced into the chamber and sequential pairs of initiallyaqueous and initially solid beakers were sampled over time.Figure 6 shows that steady-state relative humidity and solu-tion composition are achieved with in the first 200 h of re-action and that solution composition of initially dissolved
and initially solid samples converge over the time period ofthe experiments. Samples were typically taken every one tothree days. Calibrated temperature ~61°! and relative humid-ity probes ~Vaisala Inc., model HMP243 or HMP233! wereplaced just above the solutions in the beakers, because mi-croenvironments within the beakers differed from the envi-ronmental chamber relative humidity by as much as 5% rela-tive humidity. Relative humidity probe calibration checkswere conducted in saturated KNO3 solutions from 90 to110 °C. Statistical analysis of these RH measurements to-gether with vapor pressure measurements for KNO3 ~Ref.12! yield an average standard deviation of about 1.6 RHunits. Uncertainty reported in the tables and figures is calcu-lated as 2s ~3.1% RH units!.
FIG. 6. Examples of the brine % rela-tive humidity and composition as afunction of time for the reversed deli-quescence experiments at 90 °C for ~a!NaCl–NaNO3 and the ~b!KNO3 – NaNO3 mixtures.

24 Geochem. Trans., Vol. 6, No. 2, June 2005 Carroll et al.
TABLE II. Solution % RH and composition from reversed deliquescence of NaCl–NaNO3 mixtures at 90 °C.Reported values represent the average steady-state solution composition.
Expt. ID T (°C)%RH63.1 Na molal Cl molal NO3 molal @NO3#/@NO3#1@Cl#
Initially dissolved salt
MS-9A 91 74.6 7.4460.01 6.6060.03 0.8560.00 0.1160.00MS-10A 90 69.3 9.7060.16 5.2960.01 4.5060.02 0.4660.00MS-11A 90 57.6 19.0960.09 1.8360.00 17.3060.01 0.9160.00MS-12A 90 59.6 16.7460.98 3.5660.27 13.3160.62 0.7960.00MS-13A 90 55.8 18.1460.41 2.7960.10 15.1060.13 0.8460.00
Initially solid salt
MS-9B 91 74.7 7.7460.02 6.4860.00 1.2760.00 0.1660.00MS-10B 91 69.2 9.7560.25 4.8660.10 4.8660.12 0.5060.00MS-11B 91 57.6 19.2060.06 1.8760.00 17.6860.08 0.9060.02MS-12B 91 59.4 16.5960.12 3.3960.08 13.5460.08 0.8060.01MS-13B 91 55.7 18.7060.48 2.8460.03 15.7360.18 0.8560.00
Samples were taken when there was at least 10 g ofsolution in each beaker. The exact amount of solution wasdependent on relative humidity and solubility of the salt mix-ture. About 1 g of solution was collected from each beakerand filtered through a 0.45 mm syringe-less filter into a sam-pling bottle, the bottle was sealed and weighed to determinesample amount, and then diluted with about 250 g of distilledand de-ionized water. All dilution factors were determinedgravimetrically. Each time a pair of samples was taken, thetemperature and relative humidity probes were moved tomonitor the next pair of beakers. Solids from the fourth pairof samples were separated from the remaining solution byfiltration ~0.45 mm pore size!, dried, and stored in a desicca-tor until analyzed by powder x-ray diffraction.
C. Analytical techniques
All aqueous samples were analyzed by inductivelycoupled plasma-atomic emission spectrometry ~ICP-AES!for sodium, and by ion chromatography ~IC! for chloride,nitrate, potassium, and ~for some samples! sodium. Analyti-
cal uncertainty for the ICP-AES and the IC is less than 2%.Solids were analyzed using powder x-ray diffraction for de-tection of halite, sylvite, soda niter, and niter. Trace amountsof a specified solid phase indicate that the intensity of majorpeak was generally less than 5% of the most intense peak.We suspect that the small amount of the minor componentrepresents solution trapped during the filtration process andnot an equilibrium solid.
IV. RESULTS
The deliquescence of NaCl–NaNO3 , KNO3 – NaNO3 ,and NaCl–KNO3 salt mixtures from 90 to 120 °C is summa-rized in Tables II–VI and in Figs. 1–5. Figures 1 and 2compare the experimental results of the reversed deliques-cence experiments with the model calculations for theNaCl–NaNO3 – H2O system at 90 and 110 °C. Equilibrium isshown by the convergence of the measured relative humidityand solution composition for the initially dissolved and ini-tially solid salt mixtures. At 90 °C, we also show previoussolubility data by Linke,13 which agrees with our results.
TABLE III. Solution % RH and composition from reversed deliquescence of NaCl–NaNO3 mixtures at 110 °C.Reported values represent the average steady-state solution composition.
Expt. ID T (°C)% RH63.1 Na molal Cl molal NO3 molal
@NO3#/@NO3#1@Cl#
Initially dissolved salt
MS45-A 110 52.3 23.2560.44 2.3460.00 20.7560.06 0.9060.01MS46-A 110 56.3 19.2360.20 3.1760.01 16.0160.25 0.8360.00MS47-A 110 60.3 15.9660.20 3.6360.01 12.6460.15 0.7860.00
MS48-3A 110 69.6 9.5360.01 5.6260.00 4.0760.02 0.4260.02MS49-4A 110 65.6 12.5460.02 4.6560.01 7.9760.03 0.6360.01MS50R-A 110 54.9 22.0260.55 0.4360.01 21.2660.58 0.9860.01
Initially solid salt
MS45B 110 51.5 22.8460.03 2.5360.00 20.5660.03 0.8960.01MS46-B 110 55.8 19.7760.30 3.0660.01 16.5760.25 0.8460.00MS47-B 110 59.6 16.4860.27 3.4260.08 13.3060.18 0.8060.00
MS48-3B 110 69.0 9.9960.00 5.2560.01 4.7960.01 0.4860.01MS49-4B 110 64.8 13.6260.03 4.0760.01 9.6560.00 0.7060.01
MS50R-B3 110 54.5 22.3460.02 0.8760.00 21.3760.01 0.9660.00

25Geochem. Trans., Vol. 6, No. 2, June 2005 Deliquescence salt mixtures at high temperatures
TABLE IV. Solution % RH and composition from reversed deliquescence of NaNO3 – KNO3 mixtures at 90 °C.Reported values represent the average steady-state solution composition, unless otherwise noted.
Expt.ID T (°C)
% RH63.1 Na molal K molal NO3 molal
@Na#/@Na#1@K#
Initially dissolved salt
MS-14A1 90 65.5 3.3560.01 18.1560.04 22.0260.076 0.16 60.00MS-14A 90 67.5 1.4460.39 18.2760.13 20.4060.12 0.07 60.02MS-15A 90 58.6 18.8160.10 1.0160.04 20.2360.64 0.95 60.00MS-16A 90 55.5 20.3660.95 2.5460.26 23.0260.90 0.89 60.01MS-17A 90 55.6 10.7760.59 19.6761.47 31.0462.52 0.35 60.01MS-18A 90 50.3 14.8460.41 20.1660.36 35.4760.86 0.42 60.00MS-19A 90 50.6 21.4060.26 9.0060.50 30.8960.80 0.70 60.01MS-20A 90 45.0 18.6760.27 21.6560.72 40.2460.68 0.46 60.01MS-21A 90 45.6 22.8260.98 16.4360.42 39.1761.36 0.58 60.01
Initially solid salt
MS-14B 90 67.4 2.3660.17 17.9360.63 20.8260.63 0.11660.00MS-15B 90 58.3 18.5360.79 1.1260.23 20.4761.32 0.94360.01MS-16B 90 55.2 20.3260.98 3.3360.30 23.3660.73 0.86060.01
MS-17B3 90 55.3 10.9460.00 18.5860.33 30.0160.03 0.37160.01MS-18B3 90 50.4 14.4460.05 19.7260.05 33.6660.02 0.42360.01MS-19B 90 50.7 21.6660.60 9.8060.90 31.8460.66 0.68960.02MS-20B 90 45.5 19.7160.46 22.5360.40 42.4860.71 0.46760.01MS-21B 90 45.9 22.5460.58 16.3760.15 38.9560.94 0.57960.01
Although there is good agreement between experiment andmodel for solutions XNO3,0.5, there are discrepancies forboth solution composition and relative humidity for nitrate-rich solutions near the eutonic. The model overpredicts rela-
tive humidity by as much as 8% relative humidity and un-derpredicts the solution composition by as much as 8 molal~or 40%!. At 90 °C, the experimental data suggest a deliques-cence relative humidity of 56% RH (XNO350.85) compared
TABLE V. Solution % RH and composition from reversed deliquescence of NaCl–KNO3 mixtures at 90 °C.Reported values represent the average steady-state solution composition.
Expt. ID T (°C)% RH63.1 Na molal K molal Cl molal NO3 molal
@Na#/@Na#1@K#
Initially dissolved salt
MS-24A3 90 62.4 2.6860.00 16.2960.02 2.5460.00 16.8460.01 0.1460.00MS-25A4 90 6.0760.01 6.5660.04 5.8260.01 6.5860.01 0.4860.01MS-26A 90 55.3 4.7560.14 15.3660.20 4.7160.08 15.9560.30 0.2460.01MS-27A 90 54.7 7.0760.34 11.9761.04 5.8060.08 13.6461.49 0.3760.01MS-28A 90 65.5 1.5560.11 18.0960.04 1.6360.06 18.0760.05 0.0860.01MS-29A 90 65.3 5.7160.09 3.7160.23 5.7960.05 3.7460.22 0.6160.01MS-30A 90 71.5 5.4360.00 0.4260.07 5.5360.01 0.4460.06 0.9360.01MS-31A 90 52.4 5.9660.25 15.8560.39 5.0660.09 16.7460.40 0.2760.00
MS-32A4 90 52.4 7.1760.02 12.4860.07 5.5160.02 14.4660.00 0.3660.01MS-35A4 90 56.4 6.6160.07 9.9060.03 5.9360.00 10.2960.05 0.4060.01MS-36A 90 51.5 6.9860.43 16.6860.38 5.3560.06 17.9160.05 0.2960.02MS-37A 90 50.7 8.0060.06 14.9160.07 5.5660.04 17.5960.12 0.3560.00
Initially solid salt
MS-24B3 90 62.5 2.7260.02 16.9660.04 2.8260.00 17.2960.02 0.1460.00MS-25B4 90 62.8 6.2260.01 6.6160.06 5.8960.04 6.6860.01 0.4860.01MS-26B 90 55.6 4.9960.05 15.4060.37 4.9360.04 16.0860.22 0.2460.00MS-27B 90 55.7 7.1760.40 12.4861.45 5.7360.09 14.1161.91 0.3760.01MS-28B 90 65.7 1.6460.09 18.1060.20 1.8260.09 18.0860.21 0.0860.00MS-29B 90 65.6 5.8160.02 4.0960.21 5.8060.01 4.0860.23 0.5960.01MS-30B 90 71.9 5.5460.02 1.0360.04 5.6060.02 1.0560.03 0.8460.00MS-31B 90 52.7 6.5760.16 16.0460.04 5.3460.11 17.2860.07 0.2960.00
MS-32B4 90 52.8 7.4760.02 13.0860.08 5.4360.01 15.3360.01 0.3660.00MS-35B4 90 55.8 6.9160.06 10.5760.07 5.6060.02 11.5460.02 0.4060.01MS-36B 90 50.9 7.5360.20 16.5060.22 5.5260.11 18.1860.28 0.3160.00MS-37B 90 51.1 8.0660.07 15.1260.11 5.5860.05 17.7060.18 0.3560.00

26 Geochem. Trans., Vol. 6, No. 2, June 2005 Carroll et al.
TABLE VI. Solution % RH and composition from reversed deliquescence of NaCl–KNO3 mixtures at 120 °C.Reported values represent the average steady-state solution composition.
Expt. ID T (°C)% RH63.1 Na molal K molal Cl molal NO3 molal
@Na#/@Na#1@K#
Initially dissolved salt
MS-34A~44! 120 43.0 8.3560.00 17.1960.32 6.1460.00 20.2260.05 0.3360.01MS-34A~41! 120 41.6 10.9860.03 27.7260.06 5.9560.00 33.4360.14 0.2860.01MS-34A~48! 120 48.1 8.1860.06 16.5560.25 6.0960.02 19.2760.06 0.3360.01
MS-39A 119 47.3 9.1460.07 20.3360.13 6.0960.04 23.8560.09 0.3160.01MS-40A 119 47.9 5.5460.05 30.2660.08 5.5360.00 30.3860.13 0.1660.00MS-41A 119 45.7 9.8660.05 22.0960.03 6.2260.02 26.4460.06 0.3160.01
MS-42A2 119 43.8 7.3560.02 30.1460.14 5.6060.00 31.6260.03 0.2060.00MS-43A2 119 43.3 10.6560.03 24.9060.04 6.0060.03 29.2960.17 0.3060.00
MS-44A~40! 119 41.9 8.5760.01 29.3060.18 5.7160.00 32.5160.03 0.2360.00MS-44A~41! 119 42.9 8.1960.01 29.2860.09 5.4560.00 31.9460.05 0.2260.00
Initially solid salt
MS-33B~48! 120 48.7 4.6460.03 27.6060.22 4.6060.03 27.9460.03 0.1460.00MS-34B~44! 120 45.3 9.4560.09 26.1660.16 5.7460.00 30.6760.07 0.2760.01MS-34B~41! 120 41.0 10.8960.03 28.5360.11 5.9260.00 34.2660.06 0.2860.01MS-34B~48! 119 49.0 8.1160.02 18.2060.27 5.7660.02 21.4760.03 0.3160.01
MS-38B 119 46.9 5.3060.01 28.4860.16 5.3160.02 28.5060.03 0.1660.00MS-39B 120 46.9 10.1160.02 23.2160.01 6.1560.03 28.0560.00 0.3060.01MS-40B 119 46.2 5.8460.01 31.1160.01 5.8660.00 31.6260.16 0.1660.00MS-41B 119 46.1 10.0260.03 23.2060.06 6.0160.02 27.2560.15 0.3060.00
MS-42B2 119 7.3760.01 31.5860.16 5.8360.00 33.1160.01 0.1960.00MS-43B2 120 43.6 11.2460.01 26.8760.05 6.3660.01 31.7360.08 0.3060.00
MS-44B~40! 119 41.3 9.1160.05 28.9160.31 5.6960.01 32.4260.02 0.2460.00MS-44B~41! 119 42.4 8.3760.03 29.7960.51 5.7260.01 32.6560.10 0.2260.00
to the model prediction of 59% RH (XNO350.92). Similarlyat 110 °C, the experimental data suggest a deliquescencerelative humidity of 52% RH (XNO350.9) compared to themodel prediction of 56% RH (XNO350.97).
Although there are discrepancies in the absolute RH andsolution composition, both experiment and model exhibitsimilar trends. Relative humidity decreases from a high valuenear 75% at low XNO3 to a minimum near the eutonic point.Above the eutonic point, the relative humidity increases withincreasing XNO3 as the deliquescence point of pure soda niteris approached. The higher solubility of soda niter generatesnitrate concentrations that are substantially higher than thechloride concentrations above XNO350.5. Chloride concen-trations decrease with increasing XNO3 , because chloridesolubility is limited by the increasing sodium concentrationsfrom dissolving soda niter ~the common ion effect!.
The solids consisted of halite with trace soda niter belowthe eutonic and of soda niter with trace halite above theeutonic. Trace amounts of soda niter and halite probably rep-resent residual solution that was trapped in pore spaces dur-ing the filtration process when the salts were dried. Haliteshould be the only solid phase present below the eutonicbecause the solution is saturated with respect to halite andundersaturated with respect to soda niter. Above the eutonic,soda niter should be the only solid phase present, because thesolution is saturated with respect to soda niter and undersatu-rated with respect to halite. Only at the eutonic, where bothminerals are saturated, would one expect to find both haliteand soda niter.
Figure 3 compares the experimental results of the re-
versed deliquescence experiments with the model calcula-tions for the KNO3 – NaNO3 – H2O system at 90 °C. Similarto the NaCl–NaNO3 – H2O system, the convergence betweenthe measured relative humidity and solution composition forinitially dissolved and initially solid salt mixtures indicatesthat equilibrium was achieved. However, there is poor agree-ment between experiment and model for both the relativehumidity and solution composition. Experimental relativehumidity values are as much as eight percentage pointshigher than those predicted by the model on the niter side ofthe eutonic (XNa,0.2). Trends in the experimental data in-dicate that the deliquescence relative humidity of about 42%agrees with the model prediction, but yields a more KNO3
rich brine ~about XNa 0.5! than predicted by the model.A large discrepancy between experiment and model is
seen in the solution composition. Dissolved potassium, so-dium, and nitrate concentrations follow similar trends as themodel predictions, but the absolute concentrations are sig-nificantly higher. In the most extreme case, solution compo-sitions are roughly twice the model prediction with experi-mental sodium520 molal, potassium522 molal, andnitrate542 molal. The high experimental molal concentra-tions are not an artifact of deriving the values from solutionanalyses ~see Sec. III D!. A test of the analytical methodol-ogy using highly concentrated solutions showed that analyti-cally and gravimetrically determined values were generallywithin 4% of each other. The solids consisted of niter withtrace soda niter, below the experimental eutonic and of sodaniter with trace niter, above the experimental eutonic. Traceamounts of soda niter or niter probably represent residual
27Geochem. Trans., Vol. 6, No. 2, June 2005 Deliquescence salt mixtures at high temperatures
solution that was trapped in pore spaces during the filtrationprocess when the salts were dried.
Figures 4 and 5 compare the experimental results of thereversed deliquescence experiments with the model calcula-tions for the NaCl–KNO3 – H2O system at 90 and 120 °C.Similar to the other salt systems studied here, the conver-gence between the measured relative humidity and solutioncomposition for initially dissolved and initially solid saltmixtures indicates that equilibrium was achieved. Values forthe deliquescence relative humidity are in agreement at bothtemperatures. This agreement at the eutonic relative humidityappears to be fortuitous, because there is poor agreementbetween experiment and model for relative humidity and allsolution composition. The extent of the mismatch is muchgreater at 120 °C than at 90 °C. At 90 °C, the greatest mis-match occurs in KNO3-rich solutions where the model un-derpredicts relative humidity by as much as five percentagepoints and underpredicts solution composition by as much as4 molal ~about 30%!. In solutions dominated by NaCl(XNa.0.5), there is reasonable agreement between modeland experiment. At 120 °C, the mismatch between experi-ment and model relative humidity is similar to that at 90 °C.However, at this higher temperature, the model significantlyunderpredicts the solution composition. In the most extremecase, solution compositions are roughly twice the model pre-diction with experimental sodium511 molal, potassium528molal, chloride56 molal, and nitrate533 molal. At 120 °C,atmospheric pressure limits the experiments to 50% relativehumidity, so we cannot determine if the model adequatelypredicts relative humidity and solution composition in NaCl-rich solutions.
Analysis of the solids show that sylvite ~KCl! is an im-portant solubility control near the experimental eutonic inagreement with the results of model calculations at thesetemperatures. At 90 °C, niter, sylvite and minor amounts ofhalite were detected just to the left of the eutonic (0.28<XNa<0.31), and halite, sylvite and minor amounts of niterwere detected to the right side of the eutonic (0.35<XNa
<0.40). As is expected, the solids consisted of niter (XNa
<0.25) and halite (XNa>0.60) on their respective limbs ofthe phase diagram. At 120 °C, solutions were saturated withrepect to niter, sylvite, and halite between most of samplesbetween 0.15<XNa>0.30. One sample at XNa50.14 con-tained only niter, two samples at XNa50.16 and XNa50.30contained niter and halite, but no sylvite. Any trace amountsof salt detected probably represent residual solution that wastrapped in pore spaces during the filtration process when thesalts were dried.
V. DISCUSSION
A. Na–Cl, Na–NO3 , and K–NO3 high-temperaturePitzer models
The comparison of model predictions and experimentalresults of relative humidity and solution compositions for theNaCl–NaNO3 – H2O, KNO3 – NaNO3 – H2O, and theNaCl–KNO3 – H2O systems from 90 to 120 °C indicate thatsome parameters used in the current high-temperature Pitzermodel do not adequately describe brine chemistry formed by
deliquescence of these salt mixtures. Before we discuss thespecific data needs to resolve discrepancies between experi-mental results and model predictions, we review the basichigh-temperature Pitzer model used in these simulations.8
The Pitzer model is derived by first defining an expres-sion for the excess Gibbs free energy (Gex) of the total so-lution @Ref. 9, Eq. ~23!#:
Gex
RTww5 f ~I !1(
i(
jl i j~I !nin j
1(i
(j
(k
m i jknin jnk , ~8!
where Gex is the difference or ‘‘excess’’ in the Gibbs freeenergy between a real solution and an ideal solution definedon the molality composition scale, R is the universal gasconstant, T is the absolute temperature, ww is the mass ~kg!of solvent water, f is a Debye–Huckel function that dependson the ionic strength (I51/2( imizi
2), l i j is a second-orderinteraction coefficient ~also a function of I!, m i jk is a third-order interaction coefficient, n denotes the number of molesof a species, and i, j, and k denote solute species. Here mdenotes molality and z the charge number. Note that molalityis defined as mi5ni /ww . Upon substitution of miww for ni
~and so forth for the j and k cases! in Eq. ~8!, the ionic soluteactivity coefficient (g i) and the solvent osmotic coefficient~f! may be calculated as the partial derivatives with respectto the molality of the ionic solute and the mass of water,respectively:
ln g i5@]~Gex/wwRT !/]mi#nw, ~9!
f2152~]Gex/]ww!ni/RT(
imi ~10!
@Ref. 9, Eqs. ~34! and ~35!#. The activity of water is closelyrelated to the osmotic coefficient (ln aw52((imi /V)w, whereV is the number of moles of water comprising a 1 kg mass,approximately 55.51!.
Substitution of Eq. ~8! into Eqs. ~9! and ~10! followed bydifferentiation yields the fundamental Pitzer equations forthe solute activity coefficient and the osmotic coefficient ~oralternative forms for the activity of water or the activity co-efficient of water!. See BSC8 or Pitzer9 for full details of theapplied forms of the Pitzer equations and the correspondingpractical interaction coefficients. Values for the practical in-teraction coefficients are generally obtained by fitting physi-cal property measurements, such as the osmotic coefficient,the vapor pressure of water over salt solutions, or ~less com-monly! mineral solubilities.
The model requires only two-ion (bMX(0) , bMX
(1) , bMX(2) ,
CMXf , SuMM8 and SuXX8) and three-ion (cMM8X and cMXX8)
interaction parameters in the present study of ionic systems.Here M denotes a cation, M8 a different cation, X an anion,and X8 a different anion. The SuMM8 , SuXX8 , cMM8X , andcMXX8 parameters occur only in mixtures of aqueous elec-troltyes ~e.g., MX–M8X, MX–MX8, or more complex mix-tures!. Within the framework of the standard Pitzer model,the values of the mixing parameters are independent of thepossible presence of other types of ions in the solution, and

28 Geochem. Trans., Vol. 6, No. 2, June 2005 Carroll et al.
FIG. 7. Comparison of predicted andmeasured niter (KNO3) ~a! % relativehumidity and ~b! solubility as a func-tion of temperature. Measured data arefrom Kracek12 and Linke,13 respec-tively. Predictions were made usingEQ3/6 version 8 geochemical code andthe Yucca Mountain high temperaturedPitzer ion interaction thermodynamicdatabase ~Refs. 6 and 8!.
once their values have been determined for a particular sys-tem, the same values may be used for all other relevantsystems.9
The high-temperature Pitzer model8 employed in thepresent study uses the following equation to represent thetemperature dependence of each of these ion interaction pa-rameters:
x~T !5a11a2
~T2Tr!1a3 ln~T/Tr!1a4~T2Tr!, ~11!
where x represents any of the above-noted practical interac-tion parameters,13 Tr is the reference temperature ~298.15K!, and a1 , a2 , a3 , and a4 are fitted coefficients. A varietyof other forms are extant in the literature ~e.g., Refs. 10, 14!.For the model used here,8 data taken from other models ~seethe following! were refit as necessary for consistency withthe above temperature function. The differences associatedwith refitting from a different temperature function are neg-ligible within the temperature ranges of the original fits.
Although the high-temperature Pitzer model used in thepresent study is a fairly comprehensive one accounting forthe nonideal behavior of highly concentrated electrolytesover a wide range of temperature ~nominally 0–200 °C!,there are still significant data needs for common ions. Thepresent model was founded on earlier high-temperaturePitzer models ~Refs. 10, 14, and references cited by them!,supplemented by parameter data from several othersources.11,15–24 It is also partly based on refitting of param-etrizations from the published literature to the most widelyused ~standard! form of the Pitzer equations.25
The Yucca Mountain Project high-temperature Pitzermodel contains robust thermodynamic submodels for theNa–NO3 , Na–Cl, K–Cl, Na–K, and K–Na–Cl ion interac-tions. The Na–NO3 model is based on data from 237 to152 °C11 that was refit for consistency with the standardPitzer form. Some degradation in fit quality results from thisrefitting, increasing the deviation in the osmotic coefficientfrom about 0.01 to about 0.02.25 Similarly, two-ion andthree-ion models in the K–Na–Cl system are based on datafrom 0 to 300 °C10 fit using the standard Pitzer form. Incontrast, the K–NO3 and Cl–NO3 models are based on only25 °C data9 and there are no parameters for the Na–K–NO3 ,
Na–Cl–NO3 , or K–Cl–NO3 ion interactions. Our experi-mental data in the NaCl–NaNO3 – H2O system indicate thattemperature dependent parameters for Cl–NO3 and/orNa–Cl–NO3 ion interactions are needed to describe the rela-tive humidity and the solution composition near the eutonicwhere maximum solubilities are approached. The absence oftemperature dependent parameters for K–NO3 ion interac-tions in the Yucca Mountain Project high-temperature Pitzermodel is the primary cause of the poor prediction of thedeliquescence of salt mixtures containing KNO3 at elevatedtemperatures ~Figs. 3–5! as well as the measured % relativehumidity and solubility of KNO3 at elevated temperature~Fig. 7!. Additionally, some of the mismatch in theNaCl–KNO3 – H2O system may also be due to the absenceof temperature dependent paramaters for Cl–NO3 ,Na–Cl–NO3 , and/or K–Cl–NO3 ion interactions, in addi-tion to the absence of temperature dependent K–NO3 ioninteraction parameters.
B. Implications for radioactive waste disposal
It is important that geochemical calculations of thechemical environment at the waste package surfaces use arobust high-temperature Pitzer ion interaction model forcommon ions, because the deliquescence of aerosol salts anddust is likely to be a primary source of brines that contact thewaste containers and drip shields. In addition to the discrep-ancy identified for relative humidity and solution composi-tion for salt mixtures containing KNO3 stemming from theuse of a constant temperature model for K–NO3 interactions,discrepancies for magnesium and ammonium salt mixtures atelevated temperatures are likely because the model includesconstant temperature models for many of their respective ioninteractions.8 Osmotic and activity coefficients must be ex-perimentally determined as a function of temperature to de-rive the ion interaction parameters needed to describe thenonideal behavior of these concentrated solutions, becausethe Pitzer model is empirically based. Of the salt systemslisted above, robust models for potassium salts are probablythe most important at high temperature, because magnesium

29Geochem. Trans., Vol. 6, No. 2, June 2005 Deliquescence salt mixtures at high temperatures
FIG. 8. Model predictions of brine ~a!% relative humidity and ~b! solutioncomposition as a function of tempera-ture at the deliquescence point for aNaCl–NaNO3 – KNO3 mineral assem-blage ~Ref. 8!. Predictions were madewith EQ3/6 geochemical code and thehigh temperature Pitzer ion interactionthermodynamic data base. Triangles,circles, squares, and diamonds repre-sent NO3 , Na, K, and Cl concentra-tions.
concentrations are likely to be limited by insoluble silicateminerals26 and ammonium concentrations are likely to belimited by gas volatility.
Recent modeling efforts by the Yucca Mountain Projectpredict that mixtures of NaCl, KNO3 and/or NaNO3 are themost prevalent mineral assemblages that may deliquesce inrepository environments using the current high-temperaturePitzer model.8 As the temperature increases, the deliques-cence relative humidity and the NO3 concentrations increase~Fig. 7!. We expect only small differences between predictedand actual deliquescence relative humidity and brine compo-sition at temperatures below 60 °C, because the model ad-equately predicts niter solubility at these temperatures. How-ever, at higher temperatures, much larger differencesbetween predicted and actual environment are expected, be-cause the model underpredicts niter solubility by about 200%at 135 °C @Fig. 7~b!#. At these temperatures the current Pitzermodel will significantly underpredict brine NO3 brine com-position because the K–NO3 interactions will be more im-portant. This is clearly illustrated in our KNO3 – NaNO3 andNaCl–KNO3 deliquescence experiments, where NO3 con-centrations can be twice the predicted concentrations. Addi-tionally, it is likely that calculated deliquescence relative hu-midities for the three salt system are of limited accuracy,because the current model for KNO3 is of limited accuracy athigh temperature ~Fig. 8!. Therefore calculated dry-out ordeliquescence temperatures are uncertain. Dry-out or deli-quescence temperatures made assuming a total pressure simi-lar to current atmospheric pressure ~0.90 bar! predict that abrine saturated with NaCl, NaNO3 , and KNO3 would boiljust above 135 °C.6
VI. CONCLUSIONS
Adsorption of water by deliquescent salt minerals foundin aerosols and dusts that may be deposited on waste pack-age surfaces during the construction and ventilation stages ofa high-level radioactive waste repository at Yucca Mountain,NV, will be a primary source of brines that might lead tocorrosion of the waste package surfaces. Although the deli-quescence relative humidity of most pure salt minerals isknown over a range of temperature, the behavior of salt mix-tures at elevated temperatures is unknown. Our reversed deli-quescent experimental results in saturated
NaCl–NaNO3 – H2O, KNO3 – NaNO3 – H2O, andNaCl–KNO3 – H2O systems from 90 to 120 °C show that useof 25 °C parameter values for K–NO3 and Cl–NO3 ~andpossibly for three-ion parameters in the Na–K–Cl–NO3 sys-tem! in the Yucca Mountain Project high-temperature Pitzermodel do not accurately predict the equilibrium solubilityand corresponding relative humidity of KNO3 salt mixturesand of NaCl–NaNO3 mixtures near the eutonic composition.
ACKNOWLEDGMENTS
We thank Greg Gdowski, Joe Rard, Maureen Alai, andQue Anh Nguyen for their contributions to the experiments.This work was performed under the auspices of the U.S.Department of Energy by the University of California,Lawrence Livermore National Laboratory under ContractNo. W-7405-Eng-48.
1 G. M. Gordon, Corrosion 58, 811 ~2002!.2 L. Greenspan, J. Res. Natl. Bur. Stand., Sect. A 81, 89 ~1977!.3 Z. Ge, A. S. Wexler, and M. V. Johnston, J. Phys. Chem. A 102, 173~1998!.
4 I. N. Tang and H. R. Munkelwitz, Atmos. Environ., Part A 27A, 467~1993!.
5 I. N. Tang and H. R. Munkelwitz, J. Appl. Meteorol. 33, 791 ~1994!.6 BSC ~Bechtel SAIC Company!, ANL-EBS-MD-000001 REV 01, Las Ve-gas, Nevada, 2004.
7 T. J. Wolery and R. L. Jarek, 2003. EQ3/6, Version 8.0, Software User’sManual, Software Document Number: 10813-UM-8.0-00, U.S. Depart-ment of Energy, Office of Civilian Radioactive Waste Management, Officeof Repository Development, 1261 Town Center Drive, Las Vegas, NV89144.
8 BSC ~Bechtel SAIC Company!, in ANL-EBS-MD-000045 REV 02. LasVegas, NV, Bechtel SAIC Company, 2004b.
9 K. S. Pitzer, in Activity Coefficients in Electrolyte Solutions, 2nd. ed.,edited by K. S. Pitzer ~CRC Press, Boca Raton, FL, 1991!, pp. 75–153.
10 J. P. Greenberg and N. Møller, Geochim. Cosmochim. Acta 53, 2503~1989!.
11 D. G. Archer, J. Phys. Chem. Ref. Data 29, 1141 ~2000!.12 F. C. Kracek, in International Critical Tables of Numerical Data, Physics,
Chemistry and Technology, edited by E. Washburn ~1928!, Vol. 3, pp.351–374.
13 W. F. Linke, Solubilities: Inorganic and Metal-Organic Compounds. V. 2,K-Z., 4th ed. ~American Chemical Society, Washington, DC, 1965!, p.200.
14 N. Møller, Geochim. Cosmochim. Acta 52, 821 ~1988!.15 H. F. Holmes, R. H. Busey, J. M. Simonson, and R. E. Mesmer, J. Chem.
Thermodyn. 19, 863 ~1987!.16 R. T. Pabalan and K. S. Pitzer, Geochim. Cosmochim. Acta 51, 2429
~1987!.

30 Geochem. Trans., Vol. 6, No. 2, June 2005 Carroll et al.
17 S. L. Clegg and P. Brimblecombe, J. Phys. Chem. 94, 5369 ~1990a!.18 S. L. Clegg and P. Brimblecombe, Geochim. Cosmochim. Acta 54, 3315
~1990b!.19 W. E. Thiessen and J. M. Simonson, J. Phys. Chem. 94, 7794 ~1990!.20 S. He and J. W. Morse, Geochim. Cosmochim. Acta 57, 3533 ~1993!.21 A. R. Felmy, C. C. Schroeder, and M. J. Mason, PNL-SA-25345, Pacific
Northwest National laboratory, Richland, WA, 1994.
22 S. L. Clegg, S. Milioto, and D. A. Palmer, J. Chem. Eng. Data 41, 455~1996!.
23 H. F. Holmes and R. E. Mesmer, J. Chem. Thermodyn. 30, 723 ~1998!.24 C. S. Oakes, A. R. Felmy, and S. M. Sterner, J. Chem. Thermodyn. 32, 29
~2000!.25 J. A. Rard and A. M. Wijesinghe, J. Chem. Thermodyn. 35, 439 ~2003!.26 M. Alai, M. Sutton, and S. Carroll, Geochem. Trans. ~submitted!.