delineating the subsurface tectonic setting of the ...iosrjournals.org/iosr-jagg/papers/vol. 6 issue...
TRANSCRIPT

IOSR Journal of Applied Geology and Geophysics (IOSR-JAGG)
e-ISSN: 2321–0990, p-ISSN: 2321–0982.Volume 6, Issue 5 Ver. III (Sep. – Oct. 2018), PP06-20
www.iosrjournals.org
DOI: 10.9790/0990-0605030620 www.iosrjournals.org 6 | Page
Delineating the Subsurface Tectonic Setting of the Southwestern
Part of Sinai Using Aeromagnetic and Gravity Data, Egypt
Ali A. El–Khadragy(1)
, Ahmed A. Azab(2)
, Tamer E. Attia(3)
,
Islam M. Anwar(3)*
1(Department of Geology, Faculty of Science / Zagazig University, Egypt)
2(Department of Exploration, Egyptian Petroleum Research Institute, Egypt)
3(Department of Geology, Faculty of Science, Port-Said University, Egypt)
Corresponding Author: Islam M. Anwar
Abstract: The potential field data of southwestern Sinai had been closely analyzed to delineate the regional
subsurface structure and tectonic framework. For that, several qualitative and quantitative interpretational
techniques were applied on both gravity and magnetic data including; regional-residual separation, second
vertical derivative, trend analysis, depth estimation, and Euler deconvolution. The filtered maps show that the
uplifted basement is closely associated with strong gravity and magnetic anomalies, while negative anomalies
are correlated with deeper sources or the basins. The statistical trend analyses indicate that the NW-SE (Suez)
trend plays the most significant role in complicating the subsurface structure, while the NNW, WNW, ENE and
NNE trends play a less important role. The depth to the basement rocks is largely varies, between 0 and 5km.
The basement tectonic map displays two main longitudinal ridges run parallel to the shoreline, and are
alternated with structural grabens. These NW-trending highs and lows had separated by major faults, which cut
obliquely and displaced by NE-trending faults. The intersection of these cross faults dissect the area into several
tilt-blocks of different sizes. Also, the northern part was intersected by a left-lateral shear zone, which oriented
in the NE-SW direction, parallel to Aqaba trend. Such results may encourage further explorations for ground
water and hydrocarbons.
Keywords: Basement tectonic Map, El-Qaa Plain, Euler Deconvolution, Second Vertical Derivative, Sinai,
Trend analysis.
----------------------------------------------------------------------------------------------------------------------------- ----------
Date of Submission: 12-10-2018 Date of acceptance: 27-10-2018
----------------------------------------------------------------------------------------------------------------------------- ----------
I. Introduction Southwestern part of Sinai is an interesting region from the geologic point of view where it contains a
simple and complex patterns of structural features. It locates at the triple junction between the African plate,
Arabian plate and Sinai sub-plate. The geology of El-Qaa Plain area ranges from Pre-Cambrian basement rocks
to Quaternary deposits (Fig.1). The Phanerozoic section rocks are exposed in the study area, uncomformably
overlying the Precambrian basement rocks. To the east, the southern massif of Sinai is considered as the oldest
in Egypt, where it records all tectonic events and structural elements have affected northern Egypt from
Precambrian to recent. So, the basement surface in the study area is expected to be overprinted/affected by the
same structural-tectonic features of the neighboring southern Sinai massif where the basement crops out.
Recently, south Sinai area face an increase of population as well as received intense tourism for the
glorious monasteries, the fantastic topographic scenery, and unique geological and biological environment. The
matter which entails and require an increase the natural sources for ground water and power in the area. The
development of southern Sinai are focuses on El-Qaa basin as a natural source of water and energy in order to
absorb the rapidly growth population. As well, El-Qaa plain is considered as the largest area of fair agricultural
land lies in the southern Sinai which has not been well exploited so far. Increasing the water resources in
southern Sinai by transporting water from Nile or by desalinization is very expensive. Also, the oil productions
in south Sinai are very limited and need new discoveries in order to cope with the future demands. Accordingly,
the reinvestigation and delineation of the subsurface situation are very valuable for sound economic growth
through increasing the natural water resources and further hydrocarbon explorations in the area.
The main objectives of this study are delineating the regional structure and tectonic framework of the
study area using potential field data, through determination of depths and trends of the basement and the
structures on its surface.

Delineating the Subsurface Tectonic Setting of the Southwestern Part of Sinai Using Aeromagnetic
DOI: 10.9790/0990-0605030620 www.iosrjournals.org 7 | Page
II. Geologic Setting El-Qaa Plain (Fig.1) is one of the most important and prolific areas in the southwestern part of Sinai
because of its ground water resources. It occupies the southwestern part of Sinai Peninsula, as a structural
depression trending NNW-SSE, parallel to the main rift system of the Gulf of Suez. It lies between Latitudes 28º
00' and 29º 30'N and Longitudes 32º 50' and 34º 00'E, and covers an area of about 3,900 km2.The area attains its
maximum width to the north and gets narrower southward as a result of the overlapping of the basement rocks
of the southern Sinai massif. The area extends from Abu Durba in the north to Ras Mohamed in the south and
Fig. 1: Geologic map of the El-Qaa Plain region (after [4]).

Delineating the Subsurface Tectonic Setting of the Southwestern Part of Sinai Using Aeromagnetic
DOI: 10.9790/0990-0605030620 www.iosrjournals.org 8 | Page
Fig. 2: Complete stratigraphic sequence of the study area (after [3]).
bounded from the west by the Gulf of Suez. It is separated from the Gulf by Gabel Qabaliat and Gebel
Araba in its northern part and from the east by uplift of Pre-Cambrian Mountains.
The Pre-Cambrian basement complex in the southern Sinai formed from plate movements and
adjustments between crust and mantle processes [1]. The Pre-Cambrian igneous and metamorphic basement
rocks belonging to the Arabian-Nubian shield reaches an altitude of 2641m. (Gebel St. Katherine) in the south
and are covered by a sedimentary succession in the north and becomes more recent toward the Mediterranean
Sea. The western side of El-Qaa Plain is a graben structure trending in NNW-SSE and consists mainly from
Quaternary sediments whereas; the eastern side is surrounded by a high mountainous consisting mainly from the
Pre-Cambrian basement [2].
Stratigraphically, the complete stratigraphic sequence of El-Qaa plain (Fig.2) includes rocks ranging in
age from Paleozoic to Quaternary uncomfortably overlies the pre-Cambrian basement rocks [3].
III. Sources of the Data The available gravity and magnetic data of El-Qaa Plain consist of:
3.1. Bouguer Gravity Map
The Bouguer gravity map was measured by the General Petroleum Company (G.P.C) in 1985 under the
auspices of the Egyptian Academy of Science and Technology with a scale 1:100,000 and contour interval of
2mgal. Gravity measurements were conducted by using Worden gravimeters that have a sensitivity of ±0.01
scale unit. Gravity observations were taken at each kilometer over rectangular loops in the study area. Gravity
stations were tied to the gravity main base station (Lat. 28º 14'00'', long. 33
º37'00'', elevation +75, absolute value
of 979, 148, 48 ± 0.05mgal.) At El Tor city. The map was digitized in a regular grid space of 1km interval which

Delineating the Subsurface Tectonic Setting of the Southwestern Part of Sinai Using Aeromagnetic
DOI: 10.9790/0990-0605030620 www.iosrjournals.org 9 | Page
X=65km and Y= 225km as shown in (Fig.3). Girding of the gravity data was tight enough to capture the details
of anomaly where the data was recorded at a close spacing.
3.2. Total Intensity Aeromagnetic Map
High-sensitive total intensity aeromagnetic map of El-Qaa plain was surveyed and compiled by the
Geological Survey of Israel (1980), with a scale of 1:250,000, contour interval 10nt . The map was digitized and
numerically converted to equi-space data in x-y planes of 1 km by 1km window over a grid. Reduction to the
North Magnetic pole (RTP) technique was applied on the total intensity aeromagnetic map to locate the
magnetic anomalies directly above their causative bodies as shown in (Fig.4).
IV. Data Processing 4.1. Separation Techniques
4.1.1. Spectral Frequency Analysis
Isolation of the gravity and magnetic maps into regional and residual components was done utilizing
the matched filtering technique based on spectral analysis. The Fast Fourier Transform (FFT) was applied on the
Bouguer gravity and RTP magnetic maps to calculate the energy spectrum. Based on the power spectrum curve,
filtering of the potential field data was carried out to resolve the potential field into two component maps [7].
4.1.1.1. Gravity Results
The low-pass gravity map (Fig.5) reflects the influence of the wavelength less than 85 cycle/km on the
gravitational data. The map appears to be less sharp than the Bouguer gravity map, with high degree of smooth
contours. The gravity field is characterized by anomalies of low frequency and long wavelength with noticeable
attenuation of the small anomalies than those of high frequencies. These large-scale anomalies are related with
the deep basement sources/structures. Conversely, the high-pass map (Fig.6) reflects the high frequency and
short wavelength anomalies (wavelength from 80 to 175cycle/km) which are characterized by relatively small

Delineating the Subsurface Tectonic Setting of the Southwestern Part of Sinai Using Aeromagnetic
DOI: 10.9790/0990-0605030620 www.iosrjournals.org 10 | Page
sizes, sharp amplitudes and high reliefs. Most local anomalous features had aggregated along the Gulf of Suez
shoreline associated with the shallow causative bodies/structures. The steep gradients which lie between the
positive and negative anomalies, may be signify the presence of boundary faults. The map exhibits abundance of
the NW-trending anomalies, which may indicate that the shallower structure is heavily affected by the tectonic
of the gulf.
4.1.1.2. Magnetic Results
Figure 7 displays the low-pass magnetic map resulted from isolation of particular anomalies of
specified wavelengths (<125 cycle/km). The regional magnetic components are closely related to the deep
basement structures/sources. To a large degree, the anomalous zones on the regional magnetic map are mostly
comparable with those of the regional gravity map. This similarity the may suggest that the deep basement rocks
are responsible for most magnetization/gravitation in the study. From other side, the high-pass magnetic map
(Fig.8) exhibits residual magnetic clusters of high frequencies and short wavelengths (wavelength between 120
and 260 cycle/km) which are associated with the shallower basement structures/sources. The map shows several
alternating positive and negative linear/isometric anomalies in the NW and NE trends. Visual inspection of
Figures 5-8 shows that El-Qaa basin is always correlated with low gravity/magnetic anomalies which primarily
are trending in the northwestern direction.

Delineating the Subsurface Tectonic Setting of the Southwestern Part of Sinai Using Aeromagnetic
DOI: 10.9790/0990-0605030620 www.iosrjournals.org 11 | Page
4.1.2. Second Vertical Derivative(SVD)
The vertical derivative can be regarded as a type of high-pass filters that enhance the anomalies caused
by small features and suppress the longer-wavelength regional trends. SVD technique acts as a filter arises from
the fact of the double differentiation with respect to the depth in order to emphasize the local/shallower
anomalies on the expense of the larger regional ones. Therefore, the interpretation of SVD maps give a better
resolution of some superimposed anomalies, and reflects a good representation for the source edges through
their zero contour lines [8] and [9]. The filter can be reasonably used in defining the edges of the source bodies.
4.1.2.1. Gravity Results
The basic operations were mathematically calculated in the space domain, utilizing an algorithm after
[10]. The filtering process was applied on Bouguer gravity data at various radii from 1 to 6 km, space interval of
1km. The calculated values of correlation coefficient (Table 1) between successive SVD maps of different radii
(S =1 to 6 km) were determined using [11]. The deduced coefficients indicate that the optimum level for
separation for the gravity data is represented by the fifth order surface (S=5km).
Table 1: Correlation coefficient results of SVD gravity maps. 1 order 2 order 3 order 4 order 5 order 6 order
1 order 1
2 order 0.839047 1
3 order 0.732493 0.943531 1
4 order 0.654052 0.866814 0.963071 1
5 order 0.591436 0.791777 0.899961 0.97418 1
6 order 0.543666 0.731742 0.839222 0.926597 0.981208 1
Figure 9 shows the SVD gravity map at the optimal depth of separation (5km), which seems to be
noisier than the original Bouguer map, particularly along coastal plain area. The regional gravity field had split
into a large number of small anomalies having sharp amplitudes and different polarities. The map shows that the
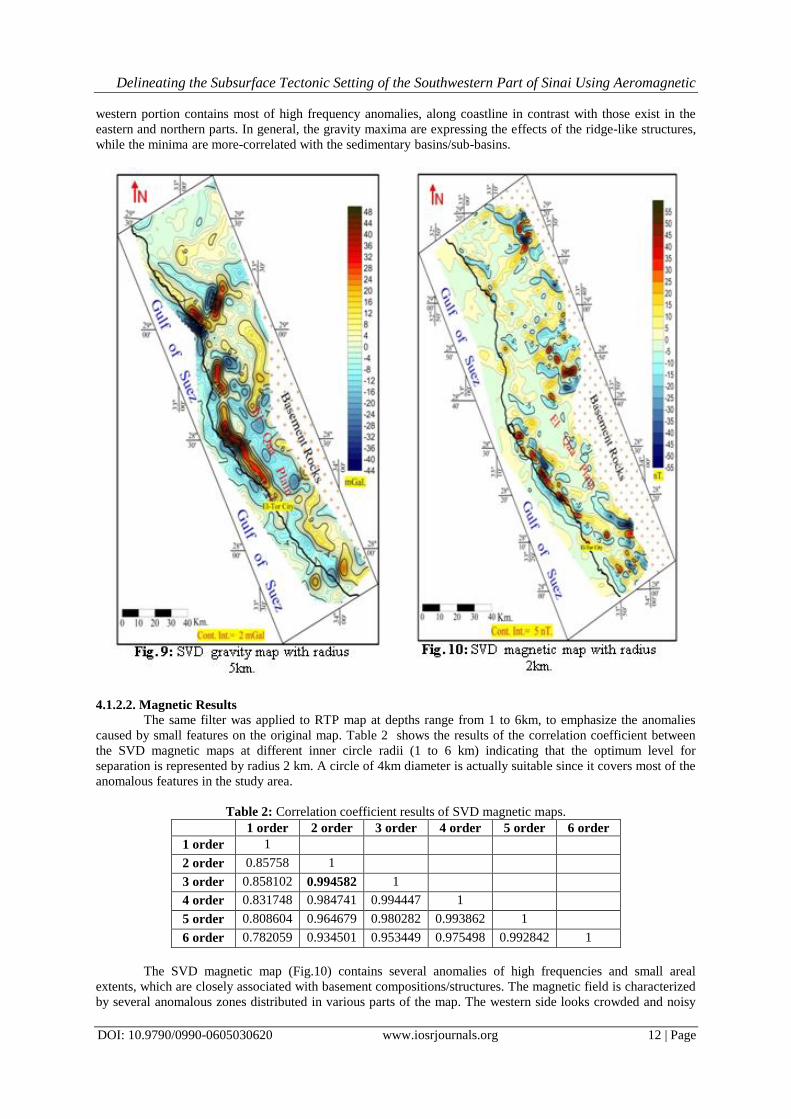
Delineating the Subsurface Tectonic Setting of the Southwestern Part of Sinai Using Aeromagnetic
DOI: 10.9790/0990-0605030620 www.iosrjournals.org 12 | Page
western portion contains most of high frequency anomalies, along coastline in contrast with those exist in the
eastern and northern parts. In general, the gravity maxima are expressing the effects of the ridge-like structures,
while the minima are more-correlated with the sedimentary basins/sub-basins.
4.1.2.2. Magnetic Results
The same filter was applied to RTP map at depths range from 1 to 6km, to emphasize the anomalies
caused by small features on the original map. Table 2 shows the results of the correlation coefficient between
the SVD magnetic maps at different inner circle radii (1 to 6 km) indicating that the optimum level for
separation is represented by radius 2 km. A circle of 4km diameter is actually suitable since it covers most of the
anomalous features in the study area.
Table 2: Correlation coefficient results of SVD magnetic maps.
1 order 2 order 3 order 4 order 5 order 6 order
1 order 1
2 order 0.85758 1
3 order 0.858102 0.994582 1
4 order 0.831748 0.984741 0.994447 1
5 order 0.808604 0.964679 0.980282 0.993862 1
6 order 0.782059 0.934501 0.953449 0.975498 0.992842 1
The SVD magnetic map (Fig.10) contains several anomalies of high frequencies and small areal
extents, which are closely associated with basement compositions/structures. The magnetic field is characterized
by several anomalous zones distributed in various parts of the map. The western side looks crowded and noisy
Delineating the Subsurface Tectonic Setting of the Southwestern Part of Sinai Using Aeromagnetic
DOI: 10.9790/0990-0605030620 www.iosrjournals.org 13 | Page
especially the coastal area as a result of shallow basement rocks. The steep gradients between high and low
anomalies denote locations of major faults/contacts, along zero lines. Generally, abundance of the NW and NE-
trending anomalies all over the area, indicate that the structure were heavily affected by the Gulf of Suez
tectonics.
4.2. Trend Analysis
The trend analysis is a method by which the tectonic setting of the area is determined, where the
tectonic history of rocks is, in some degree, recorded from the magnitude and the pattern of the gravity and the
magnetic anomalies [12]. Statistical trend analysis of gravity and magnetic trend patterns is considered as a
common approach to potential field data interpretation. Any extensive magnetic or gravity survey will contain
anomalies whose pattern is not random. These anomalies align themselves along definite and preferable axes
forming trends. The statistical analysis of the anomaly trends helps in the delineation of the major tectonic
trends that affected the deeply buried basement, their chronological sequence, the stresses that caused them and
to check whether the tectonic trends of the near-surface components follow the regional trends and are
controlled by them or not.
In this respect, the trends of all gravity and magnetic anomalies were marked and traced out from the
analyzed maps. The lengths of the fault traces were measured in the units of the map's scale and their direction
around the north (clockwise and anti-clockwise) were determined in 10° spectrum. The total length and the total
number of each trend within 10° around the north are summed up and calculated as a percentage of the total
length (L%) and total number (N%) of the trends. Hence, a careful study of these faults in terms of their azimuth
Delineating the Subsurface Tectonic Setting of the Southwestern Part of Sinai Using Aeromagnetic
DOI: 10.9790/0990-0605030620 www.iosrjournals.org 14 | Page
distribution can indicate the stress mechanism and the tectonic setting of the area. In other words, the study of
areal extensions (lengths) and numbers of the detected faults in relation to their directions gives some valuable
information about their degree of regionality, duration and intensity of the acting forces.
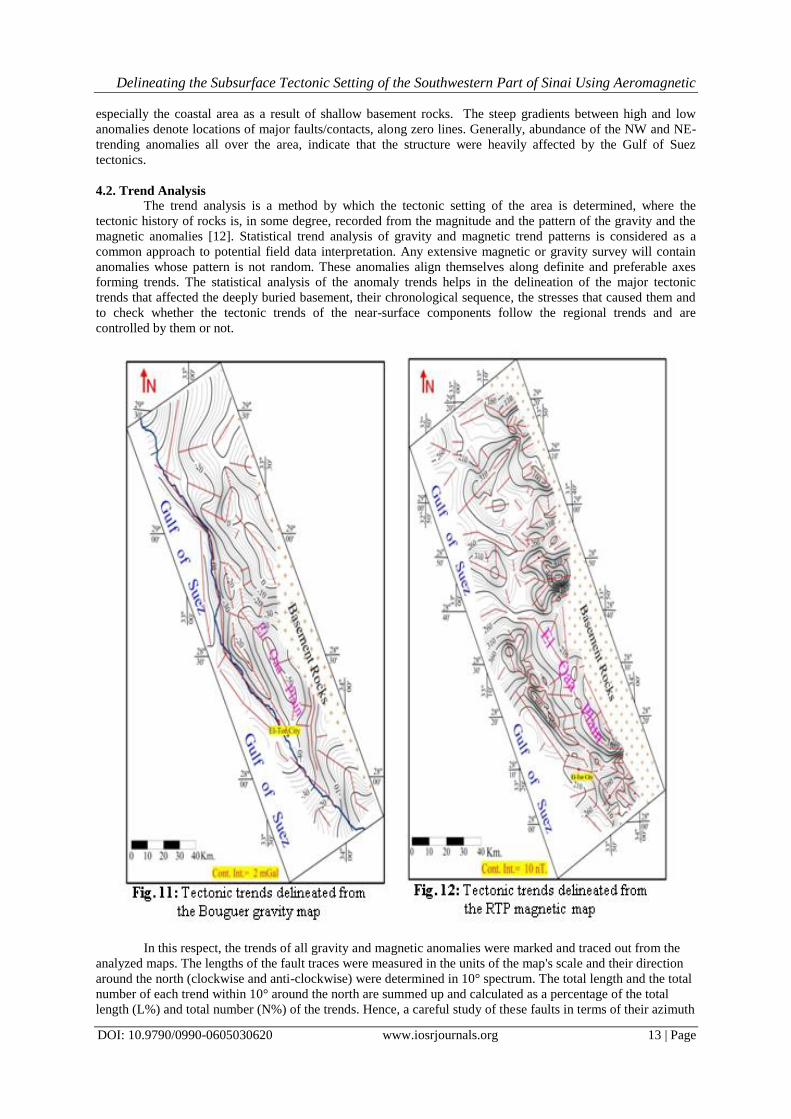
Statistical trend analyses were applied on the Bouguer and RTP maps as well as the regional and
residual filtered maps at optimum levels of separation. The deduced faults on these maps (Figs.11 & 12) helps
in delineating the major tectonic trends that affect the basement rocks and the overlying sedimentary cover. The
residual maps would reflect younger tectonic trends while regional ones may reflect older and deeper tectonic
trends. Thus, if a certain trend appears on both residual and regional maps, this is interpreted to be an old
tectonic trend that has been rejuvenated in later time.
4.2.1. Gravity Results
The parameters of the different fault trends detected from the Bouguer, regional and residual maps
were summarized in Table 3 and had presented as rose diagrams in Figure 13.
Results of trend analysis carried out on the Bouguer map (Table 3) illustrates that the area is affected by 55
faults with 827km length. The rose diagram (Fig. 13a) shows dominance of the westerly oriented trend patterns
in contrast with eastern ones. It is characterized by three major trends (NNW, NW & WNW), labelled as the
Nubia, Red Sea, and Najd trends, respectively. These basic tectonic trends and associated structures are mostly
affecting the basement surface and the overlying sedimentary cover.
Table 3: Frequency of major fault trends detected from Bouguer, regional and
residual gravity maps. Major tectonic trends Direction Azimuth Boug. map Reg. map Resid. map
No. L(km) No. L(km) No. L(km)
Tethyan(Mediterranea) E-W -80 :-90 5 43 5 63 20 134
Najd (Darag trend) WNW -55 :-80 9 143 7 90 17 186
Suez (Red Sea trend) NW -25 :-55 13 213 6 172 30 422
Nubian (East-African) N-S(NNW) 15 :-25 13 228 6 113 22 182
Aqaba trend NNE 25 : 15 5 77 3 73 8 56
Tibesti (Bukle trend) NE 55 : 25 6 83 4 77 22 152
Syrian Arc (Qattara) ENE 80 : 55 4 40 4 50 18 140
SUM 55 827 35 638 137 1272
The rose diagram of the regional gravity map (Fig. 13b) shownearly the same gravity trends previously
interpreted from regional maps. It exhibits dominance of the major western trend patterns (NW and NNW), in
addition to other three trends to the east (NNE, NE and E-W) but less significant. These trend patterns represent
the old tectonic trends which are complicating the deeply buried basement rocks.
The rose diagram of the residual gravity map (Fig. 13c) reveals that the Gulf of Suez trend is the most prevailing
all over the area, if compared with other tectonic trends. The comparative study of both regional and residual
results suggest that that the near-surface faults governed and controlled by the deep-seated regional ones.
4.2.2. Magnetic Results
The parameters of the deduced from the different magnetic maps (RTP, regional and residual). Had
been tabulated in Table 4 and imaged in Figure 14.
Table 4: Frequency of major fault trends detected from RTP, regional
and residual magnetic maps. Major tectonic trends Direction Azimuth Boug. map Reg. map Resid. map
No. L(km) No. L(km) No. L(km)
Tethyan(Mediterranean) E-W -80 :-90 20 183 14 167 29 192
Najd (Darag trend) WNW -55 :-80 21 235 10 101 41 330
Suez (Red Sea trend) NW -25 :-55 21 252 14 204 47 353
Nubian (East-African) N-S (NNW) 15 :-25 7 50 5 42 18 99
Aqaba trend NNE 25 : 15 3 15 1 5 1 1
Tibesti (Bukle trend) NE 55 : 25 19 114 8 110 16 79
Syrian Arc (Qattara) ENE 80 : 55 28 271 13 119 46 334
SUM 55 119 120 65 748 198
The results of statistical analysis of the RTP map (Table 4) indicate that the area is affected by 119
faults with about 1120 km length. Figure 14a reveals that the study area is affected by four main tectonic trends;
the Red Sea, Najd, Syrian Arc, and Mediterranean (NW, WNW, ENE, E-W, respectively), arranged in
decreasing order of magnitude. They are considered as the strongest and most widely spread in the study area.

Delineating the Subsurface Tectonic Setting of the Southwestern Part of Sinai Using Aeromagnetic
DOI: 10.9790/0990-0605030620 www.iosrjournals.org 15 | Page
Figure 14b shows that the basement rocks seem to be affected by three principal tectonic trends of regional
nature, as shown on the rose diagram. These major peaks oriented in the NW, E-W and ENE, arranged
according to their abundance. These main fault trends are considered the oldest and the most prevailing ones in
the deep structure.
Figure14c shows three predominant fault trends oriented in the NW, ENE and WNW directions. Other
minor peaks in the NE and WNW directions could be traced. The comparative study among these diagrams
shows that the magnetic trends on the regional maps still recognizable on the residual ones. This conclusion
may be confirmed by the fact that the strong peak of the NW to NNW (Suez) trend is existing in all diagrams.
This may offer a good evidence for the recurrent rejuvenation or reactivation of these fault trends during
different geologic times.
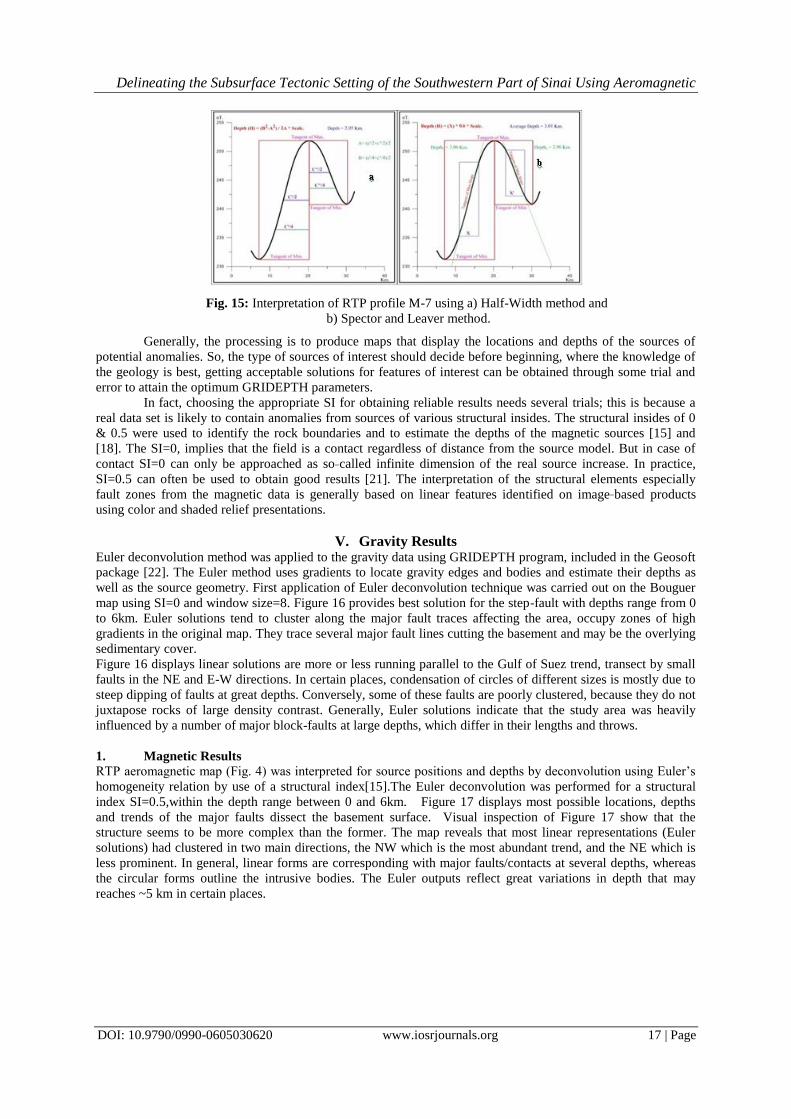
4.3- Depth Estimation
In geophysical investigations of the subsurface structures, the most important parameter to be estimated
is the depth to the anomalous structure. Different methods were applied to detect the location and depth to the
top of the causative body. Many methods deal with the peak of the anomaly and its half width [14]. These kinds

Delineating the Subsurface Tectonic Setting of the Southwestern Part of Sinai Using Aeromagnetic
DOI: 10.9790/0990-0605030620 www.iosrjournals.org 16 | Page
of methods need to have information about the shape of the causative body. Another type of methods is used to
detect the anomalies caused by abrupt changes in horizontal density or magnetization. [15] used Euler’s
homogeneity equation for the depth estimation in the magnetic method.
4.3.1. Traditional Methods
Two different methods of varying bases were applied on gravity and magnetic anomalies, utilizing
some special programs and softwares. These traditional depth methods (Half-Width Method [16] and SSM
Method [17] determine the geometry of the anomalous features in terms of depth and width. The location of
these profiles are shown on the Bouguer gravity map (Fig.3) and the RTP aeromagnetic map (Fig.4), covering
almost all the area The magnetic profile M7 was chosen for best illustration as an example shown in Figures 15a
&b.
The depth estimation along the gravity profiles in Table
5 indicate that the basement surface are extremely varies
in depth, ranges from 1.98 to 4.71km. The largest depth
values were calculated in the northern portion along
profiles G1, G2, G3, G7 & G12, while the lowest depths
exist in the west along profiles G5, G8, G9, G10 & G11.
From other side, the depth estimation results in Table 6
indicate that depth to the magnetized basement ranges
from 0.72 to 3.38km. The highest values were calculated
along profiles M7, M8, M16, M18 & M19, while the
lowest were estimated along profiles M2, M14, M15,
M24& M32.
4.3.2. Euler's Deconvolution
Lately, the use of Euler deconvolution has emerged as a powerful tool for the direct determination of
depth and probable source geometry in the gravity and magnetic data interpretation. Data need not to be pole-
reduced, so that the remanence is not an imposed by the use of structural index. The method can locate or
outline the confined sources, dykes and contacts with remarkable accuracy [18] and [19]. The Euler
deconvolution is used to correlate the magnetic data with geologic map and to confirm the modeling results,
because it is both a boundary finder and a depth estimator [20]. The Euler's homogeneity equation relates the
field (magnetic or gravity) and its gradient components to the location of the source, with the degree of
homogeneity (N), which may be interpreted as structural index [15].
Table 5: Depth estimation results along the
Bouguer gravity profiles using traditional methods.
Table 6: Depth estimation results along the
RTP magnetic profiles using traditional methods.
Delineating the Subsurface Tectonic Setting of the Southwestern Part of Sinai Using Aeromagnetic
DOI: 10.9790/0990-0605030620 www.iosrjournals.org 17 | Page
Generally, the processing is to produce maps that display the locations and depths of the sources of
potential anomalies. So, the type of sources of interest should decide before beginning, where the knowledge of
the geology is best, getting acceptable solutions for features of interest can be obtained through some trial and
error to attain the optimum GRIDEPTH parameters.
In fact, choosing the appropriate SI for obtaining reliable results needs several trials; this is because a
real data set is likely to contain anomalies from sources of various structural insides. The structural insides of 0
& 0.5 were used to identify the rock boundaries and to estimate the depths of the magnetic sources [15] and
[18]. The SI=0, implies that the field is a contact regardless of distance from the source model. But in case of
contact SI=0 can only be approached as so called infinite dimension of the real source increase. In practice,
SI=0.5 can often be used to obtain good results [21]. The interpretation of the structural elements especially
fault zones from the magnetic data is generally based on linear features identified on image based products
using color and shaded relief presentations.
V. Gravity Results Euler deconvolution method was applied to the gravity data using GRIDEPTH program, included in the Geosoft
package [22]. The Euler method uses gradients to locate gravity edges and bodies and estimate their depths as
well as the source geometry. First application of Euler deconvolution technique was carried out on the Bouguer
map using SI=0 and window size=8. Figure 16 provides best solution for the step-fault with depths range from 0
to 6km. Euler solutions tend to cluster along the major fault traces affecting the area, occupy zones of high
gradients in the original map. They trace several major fault lines cutting the basement and may be the overlying
sedimentary cover.
Figure 16 displays linear solutions are more or less running parallel to the Gulf of Suez trend, transect by small
faults in the NE and E-W directions. In certain places, condensation of circles of different sizes is mostly due to
steep dipping of faults at great depths. Conversely, some of these faults are poorly clustered, because they do not
juxtapose rocks of large density contrast. Generally, Euler solutions indicate that the study area was heavily
influenced by a number of major block-faults at large depths, which differ in their lengths and throws.
1. Magnetic Results
RTP aeromagnetic map (Fig. 4) was interpreted for source positions and depths by deconvolution using Euler’s
homogeneity relation by use of a structural index[15].The Euler deconvolution was performed for a structural
index SI=0.5,within the depth range between 0 and 6km. Figure 17 displays most possible locations, depths
and trends of the major faults dissect the basement surface. Visual inspection of Figure 17 show that the
structure seems to be more complex than the former. The map reveals that most linear representations (Euler
solutions) had clustered in two main directions, the NW which is the most abundant trend, and the NE which is
less prominent. In general, linear forms are corresponding with major faults/contacts at several depths, whereas
the circular forms outline the intrusive bodies. The Euler outputs reflect great variations in depth that may
reaches ~5 km in certain places.
Fig. 15: Interpretation of RTP profile M-7 using a) Half-Width method and
b) Spector and Leaver method.

Delineating the Subsurface Tectonic Setting of the Southwestern Part of Sinai Using Aeromagnetic
DOI: 10.9790/0990-0605030620 www.iosrjournals.org 18 | Page
Basement Relief Map
The tentative depth to the basement map (Fig.18) was prepared by using Source Parameter Imaging
SPI (Thurston and Smith, 1997). The technique based on extension of complex analytic signal to estimate the
magnetic depths. The map gives an idea about the topography of deeply buried basement and the distribution of
the sedimentary basins or sub-basins in the study area. In general, the map indicates that the basement surface is
extremely rough compared with the land surface where the depths are varying greatly from place to another (0-
5km.). The structural features were depicted as negative fault blocks alternate with positive fault blocks. The
larger depths are associated with local basins or sub basins, while lesser depths are correlated with the basement
uplifts. The structure displays a low depth zone extending longitudinally parallel to the coastline, inter between
the Gulf of Suez basin to the west and El-Qaa sub basin to the east.
Basement Tectonic Map
Basement tectonic map (Fig.19) is constructed through integration of all results obtained from previous
analytical and interpretational methods applied on both gravity and magnetic data. Close inspection of the
tectonic map reveals the following:
1- There are two major uplifted belts trending northwest (Suez trend), one of them (labeled A) extends along
the eastern border of the gulf and the other high belt (labeled B) run near and parallel to the onshore strip of
the area. These ridge-like belts are associated in place with the positive magnetic and gravity anomalies.
2- These uplifted basement belts (ridges) are alternated with structural lows (troughs), which most probably
are associated with negative gravity and magnetic anomalies.
3- The uplifted and down faulted belts were separated from each other by a set of major longitudinal faults, are
trending in the NW to NNW directions.
4- The northwesterly-trending structures had cut and offset by a set of anti-gulf faults, are belonging to the
Aqaba trend (NE faults), causing the area looks as if it is composed of large numbers of rising and sinking
tilt blocks. These transform faults (F1-F4) show a left-lateral displacement, and limit the old NW-trending
structures from the south and north
5- F1 represents the extension of a shear zone labeled II which cutting across the Gulf of Suez and extends
eastward into the study area (after [21]). This shear zone II seems to be the reason of the side-lateral
displacement between Gebel Abu Durba to the north and Gebel Araba to the south. Also, it is believed that
this shear zone II (zone of dislocation) is associated with the change in the dip of the tilted-basement
Fig. 16: Euler deconvolution of the
Bouguer gravity map.
Fig. 17: Euler deconvolution of the
RTP magnetic map.

Delineating the Subsurface Tectonic Setting of the Southwestern Part of Sinai Using Aeromagnetic
DOI: 10.9790/0990-0605030620 www.iosrjournals.org 19 | Page
Fig. 18: Basement relief map of the study
area constructed from the magnetic data,
as deduced by the SPI method.
blocks, from NE in the northern portion, to SW in the southern part, the matter that was confirmed by [24].
The depth to the basement in the area ranges from zero (outcropping basement of Gebel Araba and Gebel
Abu Durba) to ~5km (northeast El-Qaa basin).
VI. Conclusion Integrated interpretation of the Bouguer gravity map and RTP magnetic map lead to reliable results which more
or less agree with previous works. The most significant notes could be summarized as follow.
1) Close inspection of the residual and regional maps confirm that the shallow features are closely associated
with the deeper ones. This may confirm that the structural low of El-Qaa Plain is believed to be of deep-
seated origin.
2) The statistical results of both gravity and magnetic anomalies indicate that the Suez trend plays the most
important role in the tectonics of the study area. Besides, the gravity results show other three tectonic
trends ordering in the, NE, NNE and E-W directions. Whereas, the magnetic results exhibit three major
peaks, but of less magnitude, are trending in the ENE, NE and WNW directions. The results were
confirmed by the Euler method where most major trends deduced from potential maps were matched with
the linear solutions obtained from the Euler.
3) Depth determination methods show that the basement rocks along the shoreline of the gulf are shallower in
depth than those of the El-Qaa basin. The basement relief map shows that the area contains a number of
sedimentary basins with different shapes and extensions, separated from each other by local ridge-like
forms. Generally, depths to the basement rocks may reach 5km into the basins, and reach to a minimum at
the gulf coast.
4) The NW-trending structures are intersected by the major NE faults, parallel to the Gulf of Aqaba. These
cross faults have resulted in the dissection of the area into many northwesterly-trending blocks. The NW
to NNW longitudinal fault system are bounding the blocks from east and west, while the NE to ENE
traverse faults (F1 to F4) are bounding the blocks from north and south.
Fig. 19: Structure tectonic map of El-
Qaa Plain.

Delineating the Subsurface Tectonic Setting of the Southwestern Part of Sinai Using Aeromagnetic
DOI: 10.9790/0990-0605030620 www.iosrjournals.org 20 | Page
5) The interpreted structure exhibits a major shear zone (labeled II) are detected cutting across the northern
El-Qaa plain in the NE-SW direction (Aqaba trend). The origin of this shear zone is suggested to be due to
rejuvenation of the right-lateral movement across the northern Red Sea area.
6) There is a support for this argument from the discovery of ground water and hydrocarbon in the adjacent
areas within the comparable formations of some wells of El-Qaa plain area or the Gulf of Suez. So, it is
recommended to condense the exploration activities in El-Qaa area due to the encouraging evidence for
ground water and hydrocarbon occurrences in this nominated area.
References [1]. Cochran, J. R. And Karner, G. D., 2007: Constraints on the deformation and rupturing of continental lithosphere of the Red Sea: the
transition from rifting to drifting. Geol. Soc. London Spec. Publ. Vol. 282, PP. 265-289.
[2]. Massoud, U., Santos, F., El-Qady, G., Atya, M. And Soliman, M., 2010: Identification of the shallow subsurface succession and investigation of the seawater invasion to the Quaternary aquifer at the northern part of El-Qaa Plain, Southern Sinai, Egypt by
transient electromagnetic data. Geophys. Prospect. Vol. 58, PP. 267-277.
[3]. Bunter, M. A. G., 1982: Surface and subsurface geology of El-Qaa basin, Southern Sinai, A. R. E., 6th E. G. P. C. Exploration seminar, Cairo, A. R. E. Cairo, PP. 437-452.
[4]. Moustafa, A.R., 2002: Controls on the geometry of transfer zones in the Suez rift and northwest Red Sea: implications for the
structural geometry of rift systems. AAPG Bulletin Vol. 86, No. 6, PP 979–1002. [5]. GeneralPetroleum Company, G.P.C., 1985: Gravity map of Egypt, the Egyptian Academy of Scientific Research and Technology,
Cairo.
[6]. Geological Survey of Israel, 1980: Current Research, 30 Malkhei Yisrael SI., Jerusalem, 95 501, Israel, Ministry of Energy and Infrastructure, 139 pages.
[7]. Spector, A. And Grant, F. S., 1970: Statistical models for interpreted aeromagnetic data. Geophysics, Vol. 35, PP. 293-302.
[8]. Cooper, G. R. J., 1997: Grav Map and Pf Proc software for filtering geophysical map data. Computers and Geosciences, Vol. 23, No. 1, PP. 91-101.
[9]. Kaiser, M. F., Aziz, A. M., and Ghieth, B. M., 2013: Use of remote sensing techniques and aeromagnetic data to study episodic oil
seep discharges along the Gulf of Suez in Egypt. Marine pollution bulletin, 72(1), PP. 80-86. [10]. Henderson, R. G. And Zeitz, L., 1949: The computation of second vertical derivative of geomagnetic fields. Geophysics, Vol. 14,
No. 4, PP. 517-534.
[11]. Abdelrahman, E. M. And El-Araby, H. M., 1988: determination of optimum second derivative co-efficient, set for various grid systems. E. G. S. Proc. Of the 6th Ann. Meeting, PP. 44-53.
[12]. Affleck, L., 1963: Magnetic anomaly trend and spacing patterns. Geophysics, Vol. 28, No. 3, PP. 379-395.
[13]. Shendi, E.H., Ismail, A.M. and Attia, T.E., 2008:On the use of gravity and magnetic anomalies for locating probable areas of metallic mineralization in South Sinai, Egypt. Arabian Journal of Geoscience. DOI 10.1007/s12517-008-0013-1, PP.137-147.
[14]. Telford, W. M., Geldart, L. P., Sheriff. And Keys, D. A., 1981: Applied geophysics. Cambridge Univ. Press, New York, USA.
[15]. Thompson, D. T., 1982: A new technique for making a computer assisted depth estimates from magnetic data. Geophysics, Vol. 47, No. 1, PP. 31-37.
[16]. Logachive, A. A., 1968: Magnetic prospecting (in Russian) Leningrad, Mir Publisher, Moscow.
[17]. Spector, A. And Leaver, A. J., 1988: Application of harm surveng to Cambrian exploration in the Appalachian Basin. Canadian Jour. Of Explo. Geophysics, Vol. 34, No. 1 and 2, PP. 67-82.
[18]. El-Rayes, A. E., Arnous, M. O., and Aziz, A. M. 2017: Morphotectonic controls of groundwater flow regime and relating
environmental impacts in Northwest Sinai, Egypt. Arabian Journal of Geosciences, 10(18), PP. 401. [19]. Reid, A. B., Alsop, J. M., Granser, H., Millet, A. J. And Somerton, I. W., 1990: Magnetic interpretation in three dimensions using
Euler deconvolution. Geophysics, Vol. 55, PP. 80-91.
[20]. Reid, A. B., fitzgerald, D. And mcinern, P., 2003: Euler deconvolution of gravity data. SEG Ann. Meeting, Dallas, accepted for presentation.
[21]. Barbosa, V., Sliva, J. And Medeiros, W., 1999: Stability analysis and improvement of structural index in Euler deconvolution.
Geophysics, Vol. 64, No. 1, pp. 48-60.
[22]. Oasis Montaj, 1998: Geosoft Program. Geosoft mapping and application system, Inc., Suite 500, Richmond St. West Toronto, ON,
N5SIV6, Canada. [23]. El-Khadragy, A. A., Hammouda, H. And Gabr, A., 1999: Construction of the basement relief map of the western side of the Gulf of
Suez, using aeromagnetic and gravity data. E. G. S. Proc. Of the 17th Ann. Meet., PP. 303-334.
[24]. Meshref, W. M. And El-Kattan, E. M., 1989: Tectonic pattern of El-Qaa plain, Sinai, using aeromagnetic data. Proc. 2ndconf. Geol. Sinai Develop., Ismailia, PP. 33-48.
Ali A. El–Khadragy(1), " Delineating the Subsurface Tectonic Setting of the Southwestern art
of Sinai Using Aeromagnetic and Gravity Data, Egypt." IOSR Journal of Applied Geology and
Geophysics (IOSR-JAGG) 6.5 (2018): 06-20.