delaying precipitation by air pollution over the pearl...
TRANSCRIPT
Delaying precipitation by air pollution over the PearlRiver Delta: 2. Model simulationsSeoung Soo Lee1, Jianping Guo2, and Zhanqing Li1,3
1Department of Atmospheric and Oceanic Sciences and Earth System Science Interdisciplinary Center, University ofMaryland, College Park, Maryland, USA, 2State Key Laboratory of Severe Weather and Key Laboratory of AtmosphericChemistry of CMA, ChineseAcademyofMeteorological Sciences, Beijing, China, 3College of Global Change and Earth SystemScience, and State Key Laboratory of Earth Surface Processes and Resource Ecology, BeijingNormal University, Beijing, China
Abstract In Part 1 of two companion studies, analyses of observational data over the Pearl River Delta ofChina showed that larger aerosol concentrations (polluted conditions) resulted in suppressed precipitationbefore the midafternoon while resulting in enhanced precipitation after the midafternoon when comparedto precipitation with smaller aerosol concentrations (clean conditions). This suggests that there is a tippingpoint in the transition from suppressing to enhancing precipitation with increases in aerosol concentration.This paper aims to identify mechanisms that control the tipping point by performing simulations. Simulationsshow that during the first three quarters of the 12 h simulation period, aerosol as a radiation absorbersuppresses convection and precipitation by inducing greater radiative heating and stability. Convectionweakens and precipitation reduces more under polluted conditions than under clean conditions. Due to thesuppressed convection, the depletion of convective energy decreases. The reduced depletion of convectiveenergy during the period of the suppressed convection boosts the level of stored energy after this period.The boosted level of stored energy enables updrafts to be strong enough to transport a greater amount ofcloud liquid to the freezing level and to levels above it under polluted conditions than under cleanconditions. This in turn induces greater freezing-related latent heating, buoyancy, and thus strongerconvection and results in the transition from lower precipitation rates during the first three quarters of thesimulation period to higher precipitation rates during the last quarter of the period under polluted conditionsthan under clean conditions.
1. IntroductionAerosols, which are able to scatter and absorb solar radiation, can alter atmospheric stability by changingboth surface heat fluxes and radiative heating of the atmosphere [Segal et al., 1989; Hansen et al., 1997; Li,1998; Feingold et al., 2005; Jacobson, 2006, 2012; Davidi et al., 2009; Li et al., 2010]. This effect of aerosols isreferred to as aerosol radiative effects in this study. For example, aerosols that act as radiation absorbersenhance the radiative heating of the atmosphere by intercepting incident solar radiation. This interceptiondiminishes the amount of solar radiation that reaches the surface and thus tends to lower surface heat fluxes.Studies [e.g., Ackerman et al., 2000; Koren et al., 2004; Hill and Dobbie, 2008; Koch and Del Genio, 2010] haveshown that aerosol-induced reduction in surface heat fluxes and enhancement of the radiative heating ofthe atmosphere suppress convection and clouds.
Aerosols also affect clouds by acting as cloud condensation nuclei (CCN) and ice nuclei (IN) [Feingold et al.,2005; van den Heever et al., 2006; Grabowski, 2006; Khain and Lynn, 2009; Morrison and Grabowski, 2011;van den Heever et al., 2011; Guo et al., 2014]. This effect is referred to as the aerosol microphysical effects inthis study. When aerosols act as CCN, the increase in the aerosol number concentration reduces autoconver-sion. Here autoconversion is defined to be the process that converts cloud droplets to raindrops throughcollision and collection between cloud droplets [Kessler, 1969]. The reduction in autoconversion means thatthere is a smaller amount of cloud droplets or cloud liquid that is converted to rain. Hence, the reduction inautoconversion raises the ratio of cloud-liquid mass to rain mass for a given total amount of cloud water.Most of this escalation in the ratio occurs below the level of freezing in mixed-phase convective clouds[Khain et al., 2005; Seifert and Beheng, 2006; Tao et al., 2007, 2012; van den Heever and Cotton, 2007; Leeet al., 2010; Storer et al., 2010; Lee, 2011]. The enhanced ratio of cloud-liquid (or droplet) mass enables themass of cloud liquid that is transported to altitudes above the freezing level to be greater, which in turnresults in a larger amount of frozen cloud liquid for a given total amount of cloud water in convective clouds.This boosts the latent heat release, which enables air parcels to have greater thermal buoyancy and thus
LEE ET AL. AEROSOL DELAYS DIURNAL CYCLE IN RAINFALL 11,739
PUBLICATIONSJournal of Geophysical Research: Atmospheres
RESEARCH ARTICLE10.1002/2015JD024362
Special Section:East Asian Study ofTropospheric Aerosols andImpact on Cloud andPrecipitation
This article is a companion to Guo et al.[2016] doi:10.1002/2015JD023257.
Key Points:• Aerosol radiative effects initiallydominate over microphysical effectson the convection
• After the initial stage, microphysicaleffects dominate over aerosolradiative effects
• Interactions between the two effectslead to the delayed occurrence of thepeak in precipitation
Correspondence to:J. Guo,[email protected]
Citation:Lee, S. S., J. Guo, and Z. Li (2016),Delaying precipitation by air pollutionover the Pearl River Delta: 2. Modelsimulations, J. Geophys. Res. Atmos., 121,11,739–11,760, doi:10.1002/2015JD024362.
Received 17 OCT 2015Accepted 13 SEP 2016Accepted article online 15 SEP 2016Published online 8 OCT 2016
©2016. American Geophysical Union.All Rights Reserved.
more intense updrafts. These intensified updrafts are a good indication of the invigoration of convection,which produces more cloud water and precipitation [Rosenfeld et al., 2008; Li et al., 2011; Tao et al., 2012].
Aerosol radiative effects which are associated with aerosol-induced suppression of convection compete withaerosol microphysical effects which are associated with aerosol-induced invigoration of convection as foundby Koren et al. [2008] and Ten Hoeve et al. [2012]. In cases where aerosol radiative effects are dominant overaerosol microphysical effects, suppression of convection and precipitation are observed, while in other caseswhere aerosol microphysical effects are dominant over aerosol radiative effects, invigoration of convectionand enhanced precipitation are observed [Koren et al., 2008; Ten Hoeve et al., 2012].
The competition between aerosol radiative effects and aerosol microphysical effects is inferred to explain theoccurrence of the tipping point found in observations in our companion paper [Guo et al., 2016, hereafterPart 1]. Based on extensive analyses of data collected in the Pearl River Delta (PRD) region in south China wherepollution is typically heavy [Guo et al., 2011], diurnal variations in precipitation associated with thunderstormswere found to be correlated with aerosol loading as represented by themass of aerosol particles up to 10μm indiameter (PM10). A tipping point was found where a switch in the response of precipitation to increases in pol-lution level occurred. Before the midafternoon, there was a larger amount of precipitation under low aerosolloading conditions (PM10 below 42μgm�3, clean conditions) than under high aerosol loading conditions(PM10 above 57μgm�3, polluted conditions). However, after this time, the situation was reversed; i.e., therewas a larger amount of precipitation under polluted conditions than under clean conditions. The tipping pointwas hypothesized to be dictated by two primary mechanisms: aerosol radiative effects and aerosolmicrophysical effects.
While Koren et al. [2008] and Ten Hoeve et al. [2012] have provided some valuable insights into the competi-tion between the two types of aerosol effects, they did not examine the diurnal variation in the competitionand its impacts on the diurnal variation in clouds and precipitation, since clouds and precipitation in thosestudies were averaged over the diurnal cycle. As a result, our level of understanding of the mechanisms thatcontrol the effects of the diurnal variation in the competition on the diurnal variation in clouds and precipita-tion is low. This indicates that we need to perform further studies to understand the mechanisms that controlthe tipping point.
To this end, numerical simulations are performed using a cloud-system resolving model (CSRM), whichresolves cloud-scale microphysics, dynamics, and their feedbacks, thus enabling us to gain deep insights intothe mechanisms that are associated with cloud-scale processes. The simulations are for a mesoscale cloudensemble (MCE), which involves deep convective mixed-phase clouds. These clouds are the dominant cloudtype studied in Part 1.
The CSRM employed in this study is introduced in section 2, followed by a description of the simulated casesand simulations in section 3. Section 4 presents and analyzes the results of the simulations with reference toobserved phenomena. Summary and conclusions are given in section 5.
2. The CSRM
The Advanced Research Weather Research and Forecasting (ARW) model (version 3.3.1), a three-dimensionalnonhydrostatic compressible model, is used here as the CSRM. A detailed description of the governing equa-tions, numerical methods, and physics of the ARW model is documented by Skamarock et al. [2008].Shortwave and longwave radiation parameterizations have been included in all simulations by adoptingthe Rapid Radiation Transfer Model [Fouquart and Bonnel, 1980; Mlawer et al., 1997]. Microphysical processesare represented by a double-moment bin-bulk scheme that uses bin-model-derived look-up tables for hydro-meteor collection processes [Saleeby and Cotton, 2004; Lee et al., 2010]. A gamma size distribution with fixedbreadth is assumed for hydrometeor size distributions. Cloud-droplet and ice-crystal nucleation mimic a size-resolved approach [Lee and Feingold, 2010; Lee, 2012]. More details of the double-moment scheme used inthis study are found in Saleeby and Cotton [2004] and Lee et al. [2010].
Using the Noah land surface model (LSM) [Chen and Dudhia, 2001], surface heat fluxes are predicted. For theland surface, the LSM has one canopy layer and the following variables are predicted in the LSM: soil moistureand temperature in the soil layers, water stored on the canopy, and snow stored on the ground. Themultilayer soil model developed by Pan and Mahrt [1987] is coupled to the LSM to capture the evolution
Journal of Geophysical Research: Atmospheres 10.1002/2015JD024362
LEE ET AL. AEROSOL DELAYS DIURNAL CYCLE IN RAINFALL 11,740
of soil moisture and temperature byconsidering incident solar and long-wave radiation onto the surface whichserves as the primary heat source for soillayers and heat and moisture distribu-tion processes in those layers. The LSMuses four soil layers.
Aerosols are assumed to be internalmixtures of black carbon (BC, 9% mass)and sulfate (91% mass) [Zhang et al.,2012]. The radiative effect of aerosols isincluded in the simulations and is repre-
sented by a method similar to that described by Feingold et al. [2005]. The internal aerosol mixture and theARW-predicted relative humidity are used to calculate the hygroscopic growth of the aerosol particles andtheir optical properties, i.e., extinction, the single scattering albedo (SSA), and the phase function. A volumemixing rule is used to calculate the refractive index of the hydrated particles. The SSA of aerosol particles is0.88 at 470 nm in this study. This SSA value corresponds to the mean SSA in the PRD region over the summerseasons of 2008–2012 which is the target region and period in Part 1.
Prognostic equations are solved for the aerosol mass mixing ratio. The aerosol mass mixing ratio isadvected, diffused, and depleted by activation and washout by precipitable hydrometeors (i.e., nucleationand impacting scavenging) during the simulation. The prognosed supersaturation of air parcels is used toexplicitly activate aerosol particles. After activation, the aerosol mass is transported within hydrometeorsby collision-coalescence and removed from the atmosphere once hydrometeors that contain aerosolsreach the surface. Following Feingold and Kreidenweis [2002], we assume that when a portion of the totalhydrometeor mass of an original (hydrometeor) class is transported to a different class by microphysicalprocesses such as collision-coalescence, the ratio of the aerosol mass (to the total aerosol mass) that istransported from the original class (in which the total aerosol mass is embedded before the transporta-tion) to the different class is the same as the ratio of the hydrometeor mass (to the total hydrometeormass before the transportation) of the original class that is transported. Aerosols return to the atmosphereupon evaporation or sublimation of hydrometeors that contain aerosols.
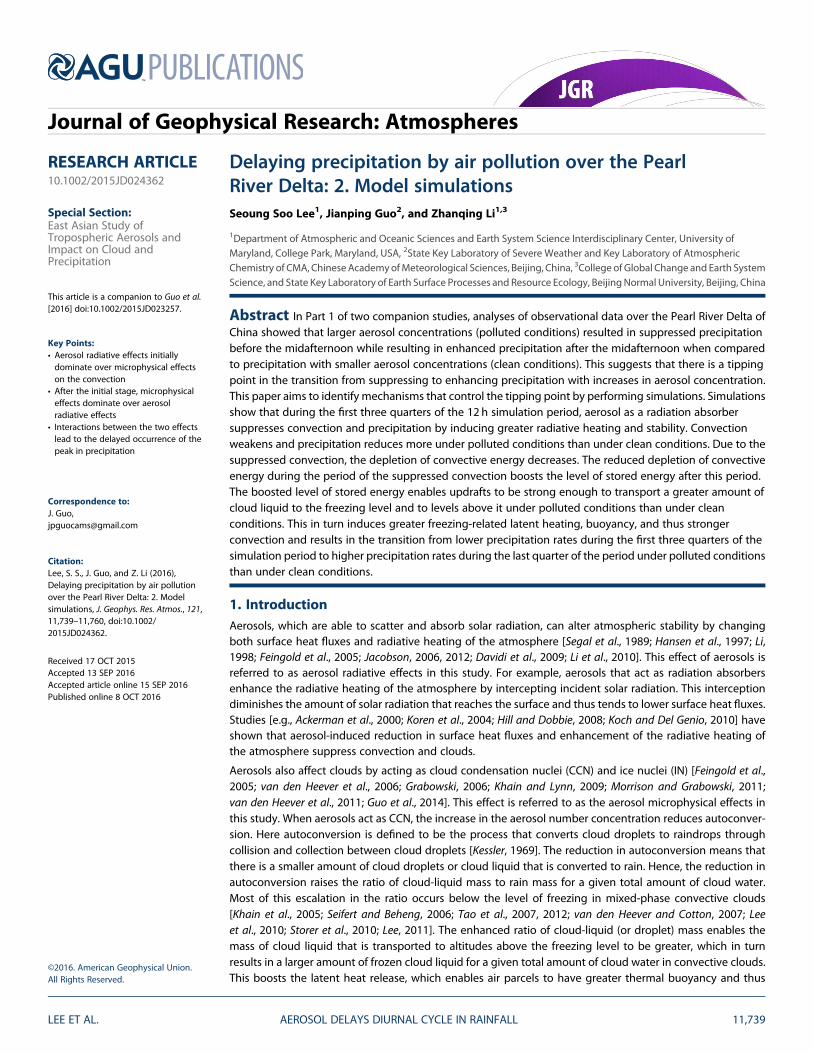
The size distribution is assumed to be trimodal lognormal and invariant, based on observations made atGuangzhou in the PRD region [Peng et al., 2014]. The modal diameter and distribution breadth of each of themodes of the size distribution are assumed to be homogenous in time and space, so aerosol particles at anygrid point in simulations in this study have the shape of the size distribution shown in Figure 1. Figure 1 showsthe initial size distribution of background aerosol particles at the surface. Thismeans that advected and diffusedaerosols and aerosols included in cloud particles via scavenging and returned to the atmosphere via evapora-tion and sublimation of cloud particles take on the shape of the size distribution shown in Figure 1. Based on theassumed trimodal lognormal distribution, the predicted aerosol mass is used to diagnose the aerosol numberconcentration that varies spatiotemporally due to clouds, advection, and diffusion.
3. Case Description and Numerical Simulations
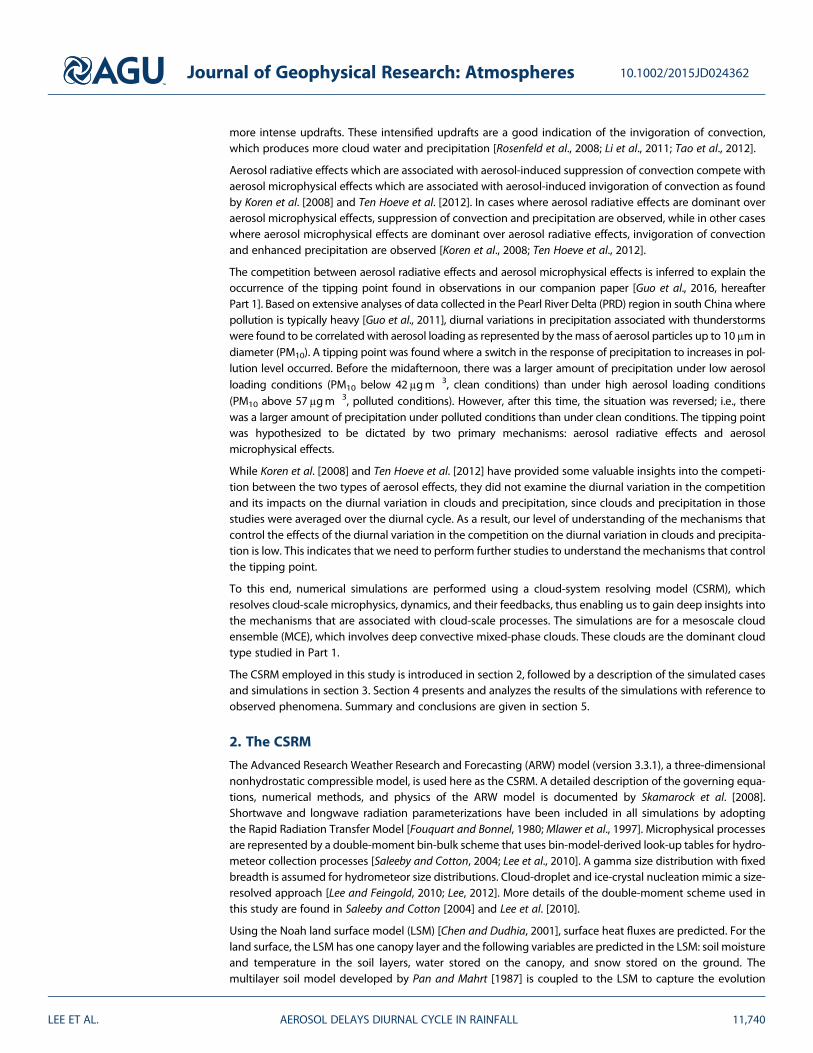
The selected study area in the PRD region for Part 1, as marked by the red rectangle in Figure 2, is a pollutedmesoscale domain that has a length of ~100 km in both directions. Since this study focuses on mechanismsthat control the tipping point observed in this study area, the size of the simulation domain for this studyshould be comparable to that of the study area. Hence, three-dimensional simulations of an observedmesos-cale system or MCE of mixed-phase convective clouds in the study area are made over a domain whoselength is 120 km in both horizontal directions and 20 km in the vertical direction. The horizontal (vertical) gridlength is 1 km (200m). The domain size adopted here is able to capture the mesoscale structure of thesystem. The resolution adopted here is known to resolve convective or updraft cores reasonably well [Tao,2007; Lee et al., 2008a].
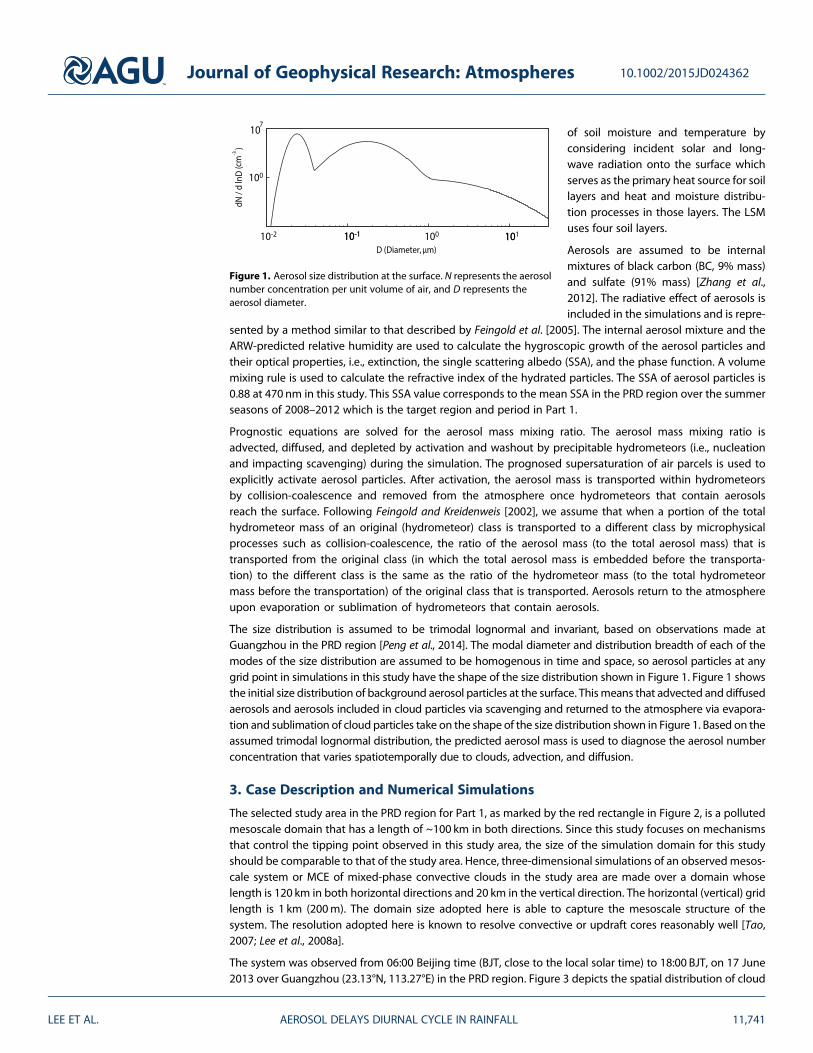
The system was observed from 06:00 Beijing time (BJT, close to the local solar time) to 18:00 BJT, on 17 June2013 over Guangzhou (23.13°N, 113.27°E) in the PRD region. Figure 3 depicts the spatial distribution of cloud
Figure 1. Aerosol size distribution at the surface. N represents the aerosolnumber concentration per unit volume of air, and D represents theaerosol diameter.
Journal of Geophysical Research: Atmospheres 10.1002/2015JD024362
LEE ET AL. AEROSOL DELAYS DIURNAL CYCLE IN RAINFALL 11,741

reflectivity observed by the Geostationary Operational Environmental Satellite at 15:00 BJT around themature stage of the system in the selected study area. Cloud cells are not organized in any particular way overthe horizontal domain unlike if squall lines, for example, were present (Figure 3). This supports the use of per-iodic boundary conditions that are applied on the horizontal boundaries. This system is characterized byweak convection in the morning and strong convection in the afternoon.
Soundings from radiosondes launched every 6 h during the period when the cloud system was observedwere collected. Measurements were taken at a 1 s resolution with measurement oscillations and noiseremoved during the ascent of the radiosondes. We calculate tendencies (or rates of temporal changes)of potential temperature and specific humidity based on the 6-hourly soundings. These tendencies
represent the advection of temperatureand humidity into or out of the modeldomain by large- or synoptic-scalemotions based on the assumptionthat the soundings represent large- orsynoptic-scale environments. Hence,these tendencies can represent theconvergence of temperature andhumidity into the model domain or thedivergence of temperature and humid-ity out of the model domain bylarge- or synoptic-scale motions. Thesetendencies are referred to as large-scaleforcings. Large-scale forcings areconsidered in simulations by addingthe tendencies to prediction equationsfor potential temperature and specifichumidity. Large-scale forcings areapplied to the model every time stepby temporal interpolation, a techniquethat has been frequently used in CSRMcomparison studies [e.g., Xu et al.,2002; van Zanten et al., 2011; Varble
Figure 2. Location of the study area. (left) The spatial distribution of the mean summertime (June through August) Moderate Resolution Imaging Spectroradiometeraerosol optical depth averaged over 2008–2012. (right) Locations of the 19 air quality observation stations (blue dots). The red triangle in Figure 2 (right) shows thelocation of Guangzhou (23.1°N, 113.3°E). The spatial extent of the 19 locations determines the selected study area that is marked by the red rectangle (22.9°N–23.7°N,113.2°E–113.8°E). Adapted from Part 1 [Guo et al., 2016].
Figure 3. Cloud-reflectivity field observed by the GeostationaryOperational Environmental Satellite at 15:00 BJT on 17 June 2013. This isaround the mature stage of the cloud system in the selected study areathat is marked by the red rectangle in Figure 2.
Journal of Geophysical Research: Atmospheres 10.1002/2015JD024362
LEE ET AL. AEROSOL DELAYS DIURNAL CYCLE IN RAINFALL 11,742
et al., 2011; Fridlind et al., 2012]. Details of the procedure for applying large-scale forcings are described byFridlind et al. [2010]. The horizontal momentum is damped to observed values following Xu et al. [2002].
For all simulations in this study, identical large-scale forcings are applied. Hence, the identical advection,convergence, and divergence of temperature and humidity at synoptic scales are applied to all simulationsin this study. However, large-scale forcings do not entirely dictate cloud processes at cloud or convectionscales. Thus, despite the identical large-scale forcings, simulations with different setups of aerosol properties(of interest to us for this study) will result in different cloud processes.
The use of periodic boundary conditions ensures that the total water and heat energy supplied to andremoved from the domain by large-scale forcings are identical between simulations. This enables the isola-tion of the effect of aerosols on interactions betweenmicrophysics and dynamics at cloud scales in this study.
Random perturbations of the potential temperature are imposed on simulations at the first time step as a wayof initiating or triggering convection. The perturbations vary in the horizontal but are constant throughoutthe lowest 1.5 km in each column of the model. The perturbations are horizontally random, generated froma uniform distribution between �0.1 and +0.1 K. These perturbations are similar to those employed byDonner et al. [1999] and Lee et al. [2014] and are chosen to be random so as not to impose organized structureon convection when it develops.
In the planetary boundary layer (PBL), the background aerosol number concentration integrated over thedistribution at the beginning of the simulation period at Guangzhou is 7500 cm�3. In the PBL, the aerosolconcentration is constant; however, beyond the PBL, it decreases exponentially with altitude. The first simu-lation is performed with this aerosol concentration of 7500 cm�3 as an initial background aerosol concentra-tion in the PBL and is referred to as the “control run.” To examine the effect of aerosols on the precipitatingcloud system, the control run is repeated with the aerosol number concentration decreased by a factor of 10.This simulation is referred to as the “low-aerosol run.” Note that both aerosol radiative and microphysicaleffects are included in the control run and the low-aerosol run. To examine aerosol radiative effects on clouddevelopment as compared to aerosol microphysical effects, the control run and low-aerosol run are repeatedwith no consideration of the effect of aerosols on radiation, i.e., before the activation of aerosol particles intodroplets. These repeated runs are referred to as the “control-no-rad run” and the “low-aerosol-no-rad run,”respectively. Hence, in the control-no-rad run and the low-aerosol-no-rad run, only aerosol microphysicaleffects are present.
In this study, on average, around 30% of aerosol particles are activated in updrafts. The mean cloud dropletnumber concentration (CDNC) over grid points with nonzero CDNC in the PBL is 2300 and 2400 cm�3 in thecontrol run and the control-no-rad run, respectively, and 220 and 270 cm�3 in the low-aerosol run andlow-aerosol-no-rad run, respectively.
4. Results4.1. Overall Evolution of Precipitation
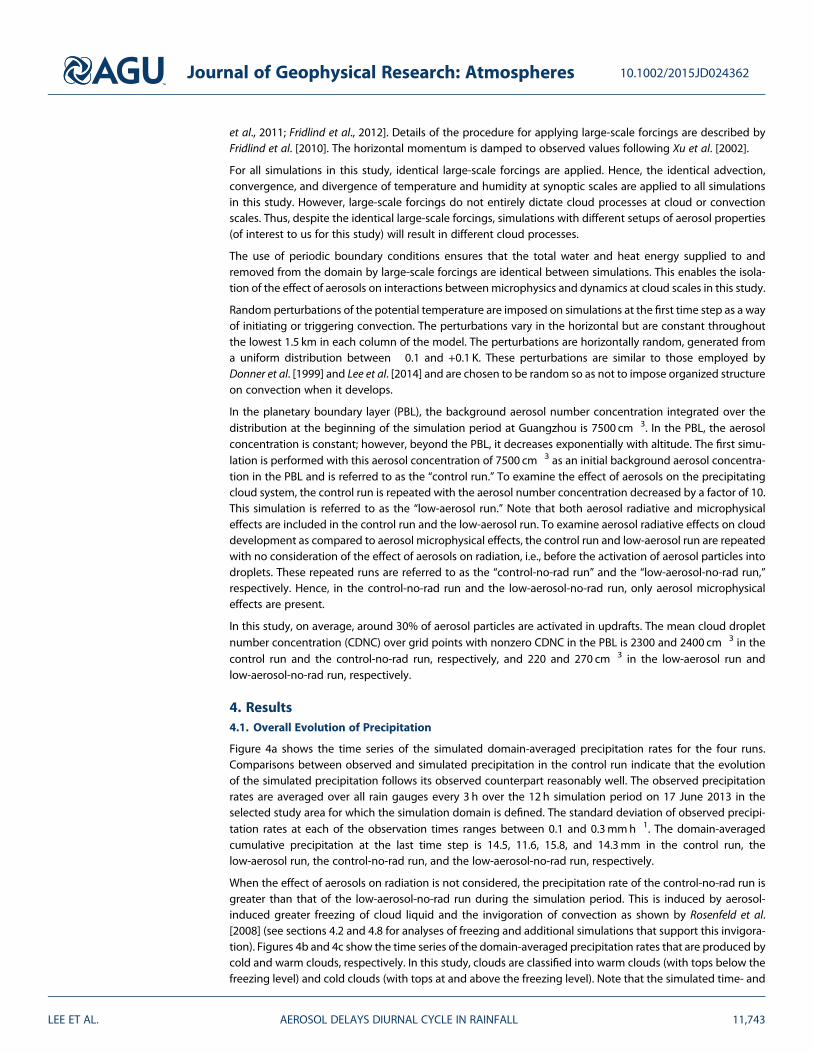
Figure 4a shows the time series of the simulated domain-averaged precipitation rates for the four runs.Comparisons between observed and simulated precipitation in the control run indicate that the evolutionof the simulated precipitation follows its observed counterpart reasonably well. The observed precipitationrates are averaged over all rain gauges every 3 h over the 12 h simulation period on 17 June 2013 in theselected study area for which the simulation domain is defined. The standard deviation of observed precipi-tation rates at each of the observation times ranges between 0.1 and 0.3mmh�1. The domain-averagedcumulative precipitation at the last time step is 14.5, 11.6, 15.8, and 14.3mm in the control run, thelow-aerosol run, the control-no-rad run, and the low-aerosol-no-rad run, respectively.
When the effect of aerosols on radiation is not considered, the precipitation rate of the control-no-rad run isgreater than that of the low-aerosol-no-rad run during the simulation period. This is induced by aerosol-induced greater freezing of cloud liquid and the invigoration of convection as shown by Rosenfeld et al.[2008] (see sections 4.2 and 4.8 for analyses of freezing and additional simulations that support this invigora-tion). Figures 4b and 4c show the time series of the domain-averaged precipitation rates that are produced bycold and warm clouds, respectively. In this study, clouds are classified into warm clouds (with tops below thefreezing level) and cold clouds (with tops at and above the freezing level). Note that the simulated time- and
Journal of Geophysical Research: Atmospheres 10.1002/2015JD024362
LEE ET AL. AEROSOL DELAYS DIURNAL CYCLE IN RAINFALL 11,743
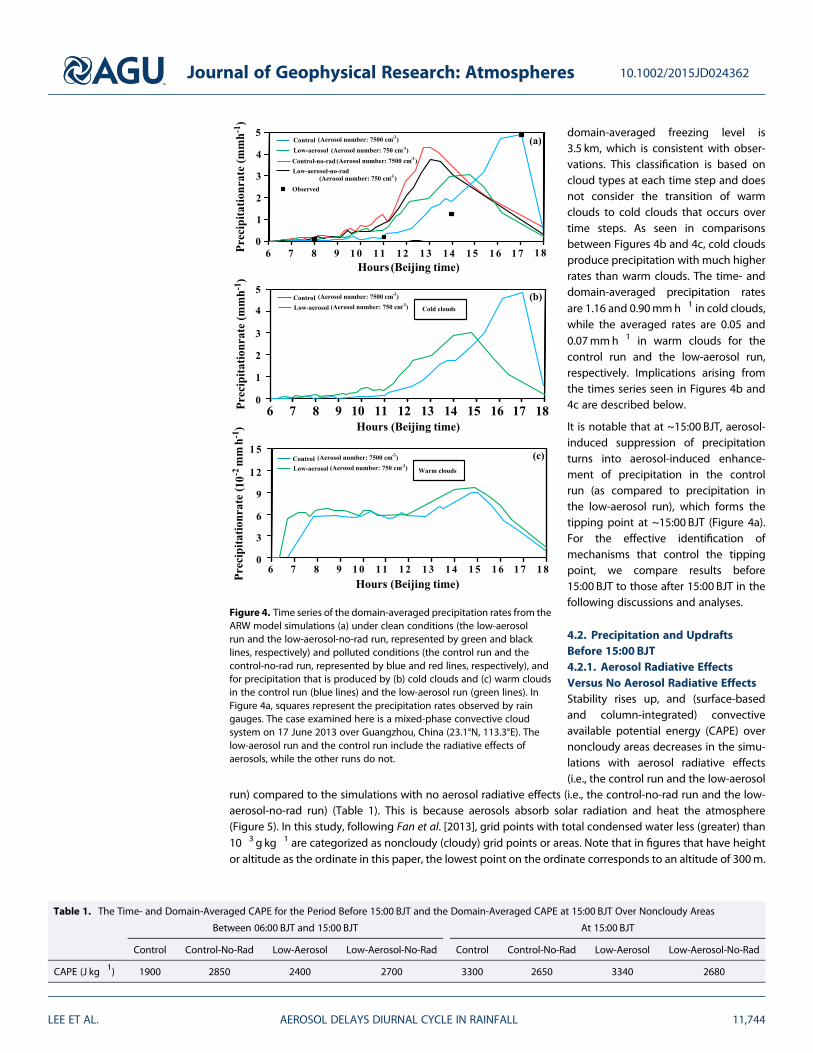
domain-averaged freezing level is3.5 km, which is consistent with obser-vations. This classification is based oncloud types at each time step and doesnot consider the transition of warmclouds to cold clouds that occurs overtime steps. As seen in comparisonsbetween Figures 4b and 4c, cold cloudsproduce precipitation with much higherrates than warm clouds. The time- anddomain-averaged precipitation ratesare 1.16 and 0.90mmh�1 in cold clouds,while the averaged rates are 0.05 and0.07mmh�1 in warm clouds for thecontrol run and the low-aerosol run,respectively. Implications arising fromthe times series seen in Figures 4b and4c are described below.
It is notable that at ~15:00 BJT, aerosol-induced suppression of precipitationturns into aerosol-induced enhance-ment of precipitation in the controlrun (as compared to precipitation inthe low-aerosol run), which forms thetipping point at ~15:00 BJT (Figure 4a).For the effective identification ofmechanisms that control the tippingpoint, we compare results before15:00 BJT to those after 15:00 BJT in thefollowing discussions and analyses.
4.2. Precipitation and UpdraftsBefore 15:00 BJT4.2.1. Aerosol Radiative EffectsVersus No Aerosol Radiative EffectsStability rises up, and (surface-basedand column-integrated) convectiveavailable potential energy (CAPE) overnoncloudy areas decreases in the simu-lations with aerosol radiative effects(i.e., the control run and the low-aerosol
run) compared to the simulations with no aerosol radiative effects (i.e., the control-no-rad run and the low-aerosol-no-rad run) (Table 1). This is because aerosols absorb solar radiation and heat the atmosphere(Figure 5). In this study, following Fan et al. [2013], grid points with total condensed water less (greater) than10�3 g kg�1 are categorized as noncloudy (cloudy) grid points or areas. Note that in figures that have heightor altitude as the ordinate in this paper, the lowest point on the ordinate corresponds to an altitude of 300m.
Figure 4. Time series of the domain-averaged precipitation rates from theARW model simulations (a) under clean conditions (the low-aerosolrun and the low-aerosol-no-rad run, represented by green and blacklines, respectively) and polluted conditions (the control run and thecontrol-no-rad run, represented by blue and red lines, respectively), andfor precipitation that is produced by (b) cold clouds and (c) warm cloudsin the control run (blue lines) and the low-aerosol run (green lines). InFigure 4a, squares represent the precipitation rates observed by raingauges. The case examined here is a mixed-phase convective cloudsystem on 17 June 2013 over Guangzhou, China (23.1°N, 113.3°E). Thelow-aerosol run and the control run include the radiative effects ofaerosols, while the other runs do not.
Table 1. The Time- and Domain-Averaged CAPE for the Period Before 15:00 BJT and the Domain-Averaged CAPE at 15:00 BJT Over Noncloudy Areas
Between 06:00 BJT and 15:00 BJT At 15:00 BJT
Control Control-No-Rad Low-Aerosol Low-Aerosol-No-Rad Control Control-No-Rad Low-Aerosol Low-Aerosol-No-Rad
CAPE (J kg�1) 1900 2850 2400 2700 3300 2650 3340 2680
Journal of Geophysical Research: Atmospheres 10.1002/2015JD024362
LEE ET AL. AEROSOL DELAYS DIURNAL CYCLE IN RAINFALL 11,744
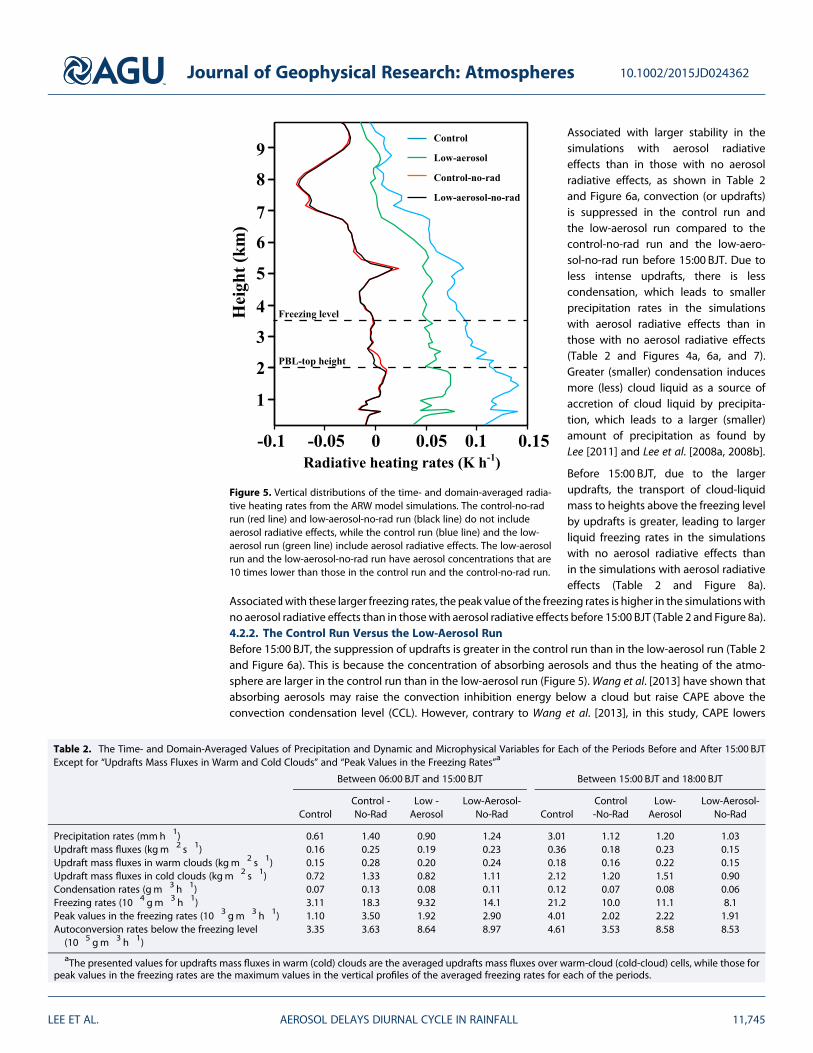
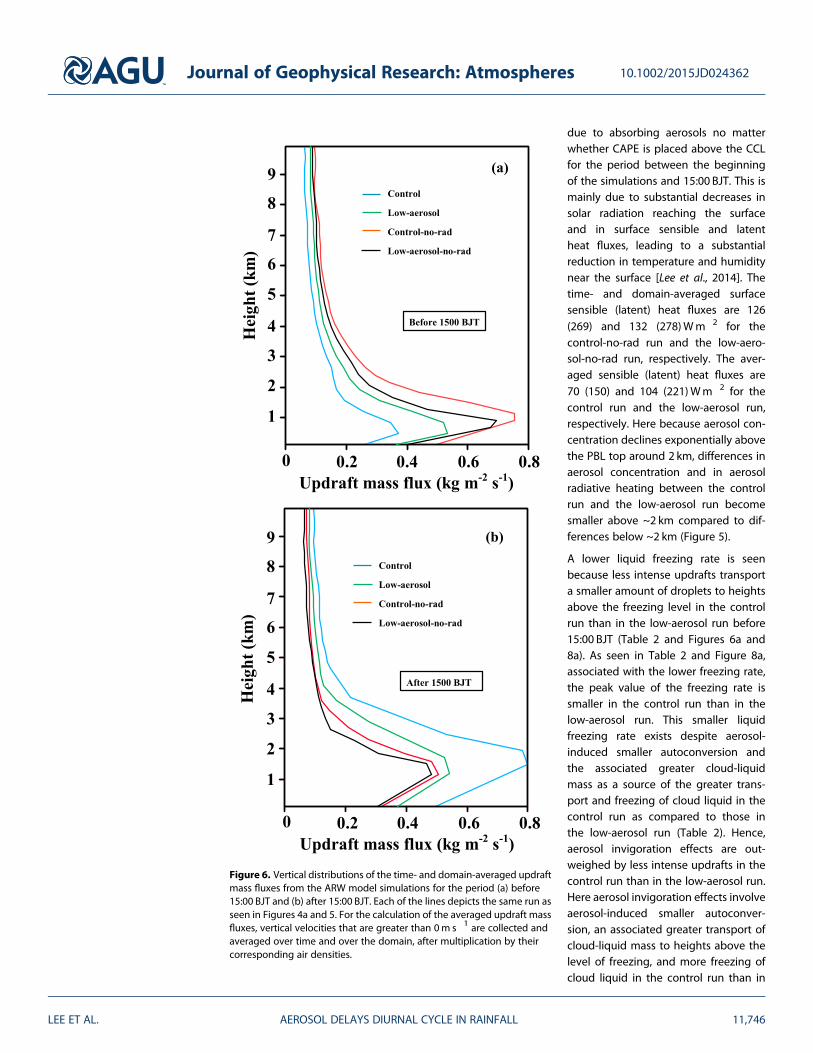
Associated with larger stability in thesimulations with aerosol radiativeeffects than in those with no aerosolradiative effects, as shown in Table 2and Figure 6a, convection (or updrafts)is suppressed in the control run andthe low-aerosol run compared to thecontrol-no-rad run and the low-aero-sol-no-rad run before 15:00 BJT. Due toless intense updrafts, there is lesscondensation, which leads to smallerprecipitation rates in the simulationswith aerosol radiative effects than inthose with no aerosol radiative effects(Table 2 and Figures 4a, 6a, and 7).Greater (smaller) condensation inducesmore (less) cloud liquid as a source ofaccretion of cloud liquid by precipita-tion, which leads to a larger (smaller)amount of precipitation as found byLee [2011] and Lee et al. [2008a, 2008b].
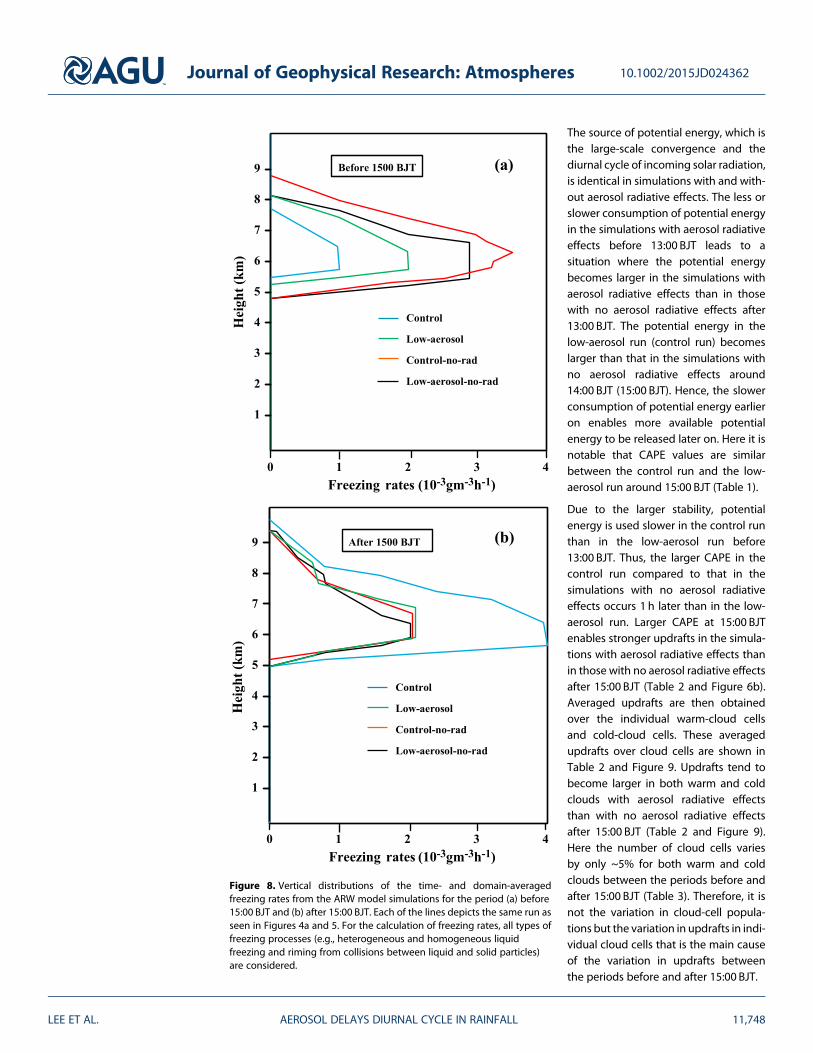
Before 15:00 BJT, due to the largerupdrafts, the transport of cloud-liquidmass to heights above the freezing levelby updrafts is greater, leading to largerliquid freezing rates in the simulationswith no aerosol radiative effects thanin the simulations with aerosol radiativeeffects (Table 2 and Figure 8a).
Associatedwith these larger freezing rates, the peak value of the freezing rates is higher in the simulationswithno aerosol radiative effects than in thosewith aerosol radiative effects before 15:00 BJT (Table 2 and Figure 8a).4.2.2. The Control Run Versus the Low-Aerosol RunBefore 15:00 BJT, the suppression of updrafts is greater in the control run than in the low-aerosol run (Table 2and Figure 6a). This is because the concentration of absorbing aerosols and thus the heating of the atmo-sphere are larger in the control run than in the low-aerosol run (Figure 5).Wang et al. [2013] have shown thatabsorbing aerosols may raise the convection inhibition energy below a cloud but raise CAPE above theconvection condensation level (CCL). However, contrary to Wang et al. [2013], in this study, CAPE lowers
Figure 5. Vertical distributions of the time- and domain-averaged radia-tive heating rates from the ARW model simulations. The control-no-radrun (red line) and low-aerosol-no-rad run (black line) do not includeaerosol radiative effects, while the control run (blue line) and the low-aerosol run (green line) include aerosol radiative effects. The low-aerosolrun and the low-aerosol-no-rad run have aerosol concentrations that are10 times lower than those in the control run and the control-no-rad run.
Table 2. The Time- and Domain-Averaged Values of Precipitation and Dynamic and Microphysical Variables for Each of the Periods Before and After 15:00 BJTExcept for “Updrafts Mass Fluxes in Warm and Cold Clouds” and “Peak Values in the Freezing Rates”a
Between 06:00 BJT and 15:00 BJT Between 15:00 BJT and 18:00 BJT
ControlControl -No-Rad
Low -Aerosol
Low-Aerosol-No-Rad Control
Control-No-Rad
Low-Aerosol
Low-Aerosol-No-Rad
Precipitation rates (mmh�1) 0.61 1.40 0.90 1.24 3.01 1.12 1.20 1.03Updraft mass fluxes (kgm�2 s�1) 0.16 0.25 0.19 0.23 0.36 0.18 0.23 0.15Updraft mass fluxes in warm clouds (kgm�2 s�1) 0.15 0.28 0.20 0.24 0.18 0.16 0.22 0.15Updraft mass fluxes in cold clouds (kgm�2 s�1) 0.72 1.33 0.82 1.11 2.12 1.20 1.51 0.90Condensation rates (gm�3 h�1) 0.07 0.13 0.08 0.11 0.12 0.07 0.08 0.06Freezing rates (10�4 gm�3 h�1) 3.11 18.3 9.32 14.1 21.2 10.0 11.1 8.1Peak values in the freezing rates (10�3 gm�3 h�1) 1.10 3.50 1.92 2.90 4.01 2.02 2.22 1.91Autoconversion rates below the freezing level(10�5 gm�3 h�1)
3.35 3.63 8.64 8.97 4.61 3.53 8.58 8.53
aThe presented values for updrafts mass fluxes in warm (cold) clouds are the averaged updrafts mass fluxes over warm-cloud (cold-cloud) cells, while those forpeak values in the freezing rates are the maximum values in the vertical profiles of the averaged freezing rates for each of the periods.
Journal of Geophysical Research: Atmospheres 10.1002/2015JD024362
LEE ET AL. AEROSOL DELAYS DIURNAL CYCLE IN RAINFALL 11,745
due to absorbing aerosols no matterwhether CAPE is placed above the CCLfor the period between the beginningof the simulations and 15:00 BJT. This ismainly due to substantial decreases insolar radiation reaching the surfaceand in surface sensible and latentheat fluxes, leading to a substantialreduction in temperature and humiditynear the surface [Lee et al., 2014]. Thetime- and domain-averaged surfacesensible (latent) heat fluxes are 126(269) and 132 (278)Wm�2 for thecontrol-no-rad run and the low-aero-sol-no-rad run, respectively. The aver-aged sensible (latent) heat fluxes are70 (150) and 104 (221)Wm�2 for thecontrol run and the low-aerosol run,respectively. Here because aerosol con-centration declines exponentially abovethe PBL top around 2 km, differences inaerosol concentration and in aerosolradiative heating between the controlrun and the low-aerosol run becomesmaller above ~2 km compared to dif-ferences below ~2 km (Figure 5).
A lower liquid freezing rate is seenbecause less intense updrafts transporta smaller amount of droplets to heightsabove the freezing level in the controlrun than in the low-aerosol run before15:00 BJT (Table 2 and Figures 6a and8a). As seen in Table 2 and Figure 8a,associated with the lower freezing rate,the peak value of the freezing rate issmaller in the control run than in thelow-aerosol run. This smaller liquidfreezing rate exists despite aerosol-induced smaller autoconversion andthe associated greater cloud-liquidmass as a source of the greater trans-port and freezing of cloud liquid in thecontrol run as compared to those inthe low-aerosol run (Table 2). Hence,aerosol invigoration effects are out-weighed by less intense updrafts in thecontrol run than in the low-aerosol run.Here aerosol invigoration effects involveaerosol-induced smaller autoconver-sion, an associated greater transport ofcloud-liquid mass to heights above thelevel of freezing, and more freezing ofcloud liquid in the control run than in
Figure 6. Vertical distributions of the time- and domain-averaged updraftmass fluxes from the ARW model simulations for the period (a) before15:00 BJT and (b) after 15:00 BJT. Each of the lines depicts the same run asseen in Figures 4a and 5. For the calculation of the averaged updraft massfluxes, vertical velocities that are greater than 0m s�1 are collected andaveraged over time and over the domain, after multiplication by theircorresponding air densities.
Journal of Geophysical Research: Atmospheres 10.1002/2015JD024362
LEE ET AL. AEROSOL DELAYS DIURNAL CYCLE IN RAINFALL 11,746

the low-aerosol run. In this situation, thegreater stability and associated lessintense updrafts result in less condensa-tion and precipitation in the controlrun than in the low-aerosol runbefore 15:00 BJT (Tables 1 and 2 andFigures 4a, 6a, and 7).4.2.3. The Control-No-Rad RunVersus the Low-Aerosol-No-Rad RunThere is an absence of aerosol-inducedsuppression of updrafts through aerosolradiative effects between the control-no-rad run and the low-aerosol-noradrun. With this absence, the reductionin autoconversion and the associatedenhancement in cloud-liquid massbelow the freezing level in the control-no-rad run (Table 2) lead to the greatertransport of cloud liquid to heightsabove the freezing level. This producesthe larger mass of frozen cloud liquidin the control-no-rad run than in thelow-aerosol-no-rad run (Figure 8a). This
invigorates updrafts more and induces larger updraft mass fluxes and higher precipitation rates in thecontrol-no-rad run than in the low-aerosol-no-rad run during the simulation period (Table 2 and Figures 4aand 6a). As seen in Table 2 and Figure 8a, associated with the larger freezing rates before 15:00 BJT, the peakvalue of the freezing rate is higher in the control-no-rad run than in the low-aerosol-no-rad run.4.2.4. Delay in Peak in Precipitation RateThe enhanced stability in the control run and the low-aerosol run as compared to that in the control-no-radrun and the low-aerosol-no-rad run delays the occurrence of the mature stage of cloud development, whichis when peak in precipitation rates occurs. This is regardless of whether the aerosol concentration is highor not as seen in Figure 4a. Peak in precipitation is delayed by 4 h in the control run compared to thecontrol-no-rad run and is delayed by 2 h in the low-aerosol run compared to the low-aerosol-no-rad run.The enhancement in stability in the control run compared to the control-no-rad run is larger than that inthe low-aerosol run compared to the low-aerosol-no-rad run (Table 1). This accompanies the greater delayin peak in the precipitation rate in the control run than in the low-aerosol run. This is likely due to the factthat updrafts need longer time to overcome the larger stability to reach their high values at the mature stage.The buildup of the background instability, which determines the occurrence of the mature stage, is con-trolled by the large-scale forcing and the diurnal cycle of incoming solar radiation. This buildup of the instabil-ity and the response of updrafts to it are slowed down more due to aerosol-induced larger increases instability in the control run than in the low-aerosol run. This is similar to what was reported by Lee et al. [2012].
4.3. Precipitation and Updrafts After 15:00BJT4.3.1. Aerosol Radiative Effects Versus No Aerosol Radiative EffectsLarge-scale moisture and heat convergence and the diurnal cycle of incoming solar radiation favor the occur-rence of maximum precipitation rates and associated convection at their mature stage around 13:00 BJT asshown in the control-no-rad run and the low-aerosol-no-rad run in Figure 4a. However, in the control runand the low-aerosol run, updrafts or convection does not grow fully to produce a maximum precipitation ratearound 13:00 BJT. This is because aerosol-induced escalation in stability blocks updrafts or convection fromgrowing fully. Associated with this, in the simulations with aerosol radiative effects, the instability fromlarge-scale convergence and the diurnal cycle of incoming solar radiation is not used by updrafts as muchas in those runs with no aerosol radiative effects around and before 13:00 BJT. In other words, potentialenergy is less used or used slower in the simulations with aerosol radiative effects than in those with no aero-sol radiative effects.
Figure 7. Vertical distributions of the time- anddomain-averagedconden-sation rates from the ARWmodel simulations for the period before15:00 BJT. Eachof the lines depicts the same run as seen in Figures 4a and5.
Journal of Geophysical Research: Atmospheres 10.1002/2015JD024362
LEE ET AL. AEROSOL DELAYS DIURNAL CYCLE IN RAINFALL 11,747
The source of potential energy, which isthe large-scale convergence and thediurnal cycle of incoming solar radiation,is identical in simulations with and with-out aerosol radiative effects. The less orslower consumption of potential energyin the simulations with aerosol radiativeeffects before 13:00 BJT leads to asituation where the potential energybecomes larger in the simulations withaerosol radiative effects than in thosewith no aerosol radiative effects after13:00 BJT. The potential energy in thelow-aerosol run (control run) becomeslarger than that in the simulations withno aerosol radiative effects around14:00 BJT (15:00 BJT). Hence, the slowerconsumption of potential energy earlieron enables more available potentialenergy to be released later on. Here it isnotable that CAPE values are similarbetween the control run and the low-aerosol run around 15:00 BJT (Table 1).
Due to the larger stability, potentialenergy is used slower in the control runthan in the low-aerosol run before13:00 BJT. Thus, the larger CAPE in thecontrol run compared to that in thesimulations with no aerosol radiativeeffects occurs 1 h later than in the low-aerosol run. Larger CAPE at 15:00 BJTenables stronger updrafts in the simula-tions with aerosol radiative effects thanin those with no aerosol radiative effectsafter 15:00 BJT (Table 2 and Figure 6b).Averaged updrafts are then obtainedover the individual warm-cloud cellsand cold-cloud cells. These averagedupdrafts over cloud cells are shown inTable 2 and Figure 9. Updrafts tend tobecome larger in both warm and coldclouds with aerosol radiative effectsthan with no aerosol radiative effectsafter 15:00 BJT (Table 2 and Figure 9).Here the number of cloud cells variesby only ~5% for both warm and coldclouds between the periods before andafter 15:00 BJT (Table 3). Therefore, it isnot the variation in cloud-cell popula-tions but the variation in updrafts in indi-vidual cloud cells that is the main causeof the variation in updrafts betweenthe periods before and after 15:00 BJT.
Figure 8. Vertical distributions of the time- and domain-averagedfreezing rates from the ARW model simulations for the period (a) before15:00 BJT and (b) after 15:00 BJT. Each of the lines depicts the same run asseen in Figures 4a and 5. For the calculation of freezing rates, all types offreezing processes (e.g., heterogeneous and homogeneous liquidfreezing and riming from collisions between liquid and solid particles)are considered.
Journal of Geophysical Research: Atmospheres 10.1002/2015JD024362
LEE ET AL. AEROSOL DELAYS DIURNAL CYCLE IN RAINFALL 11,748
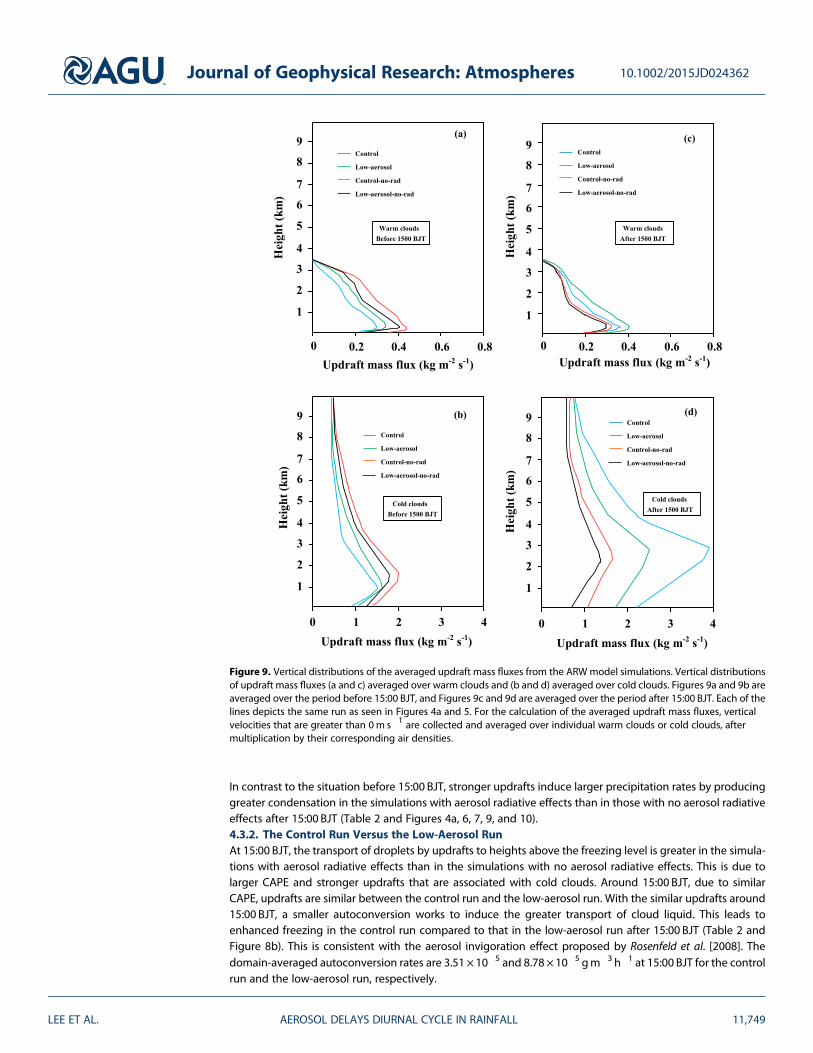
In contrast to the situation before 15:00 BJT, stronger updrafts induce larger precipitation rates by producinggreater condensation in the simulations with aerosol radiative effects than in those with no aerosol radiativeeffects after 15:00 BJT (Table 2 and Figures 4a, 6, 7, 9, and 10).4.3.2. The Control Run Versus the Low-Aerosol RunAt 15:00 BJT, the transport of droplets by updrafts to heights above the freezing level is greater in the simula-tions with aerosol radiative effects than in the simulations with no aerosol radiative effects. This is due tolarger CAPE and stronger updrafts that are associated with cold clouds. Around 15:00 BJT, due to similarCAPE, updrafts are similar between the control run and the low-aerosol run. With the similar updrafts around15:00 BJT, a smaller autoconversion works to induce the greater transport of cloud liquid. This leads toenhanced freezing in the control run compared to that in the low-aerosol run after 15:00 BJT (Table 2 andFigure 8b). This is consistent with the aerosol invigoration effect proposed by Rosenfeld et al. [2008]. Thedomain-averaged autoconversion rates are 3.51 × 10�5 and 8.78 × 10�5 gm�3 h�1 at 15:00 BJT for the controlrun and the low-aerosol run, respectively.
Figure 9. Vertical distributions of the averaged updraft mass fluxes from the ARWmodel simulations. Vertical distributionsof updraft mass fluxes (a and c) averaged over warm clouds and (b and d) averaged over cold clouds. Figures 9a and 9b areaveraged over the period before 15:00 BJT, and Figures 9c and 9d are averaged over the period after 15:00 BJT. Each of thelines depicts the same run as seen in Figures 4a and 5. For the calculation of the averaged updraft mass fluxes, verticalvelocities that are greater than 0m s�1 are collected and averaged over individual warm clouds or cold clouds, aftermultiplication by their corresponding air densities.
Journal of Geophysical Research: Atmospheres 10.1002/2015JD024362
LEE ET AL. AEROSOL DELAYS DIURNAL CYCLE IN RAINFALL 11,749

Larger freezing and related latent heating lead to larger increases in thermal buoyancy and updrafts (com-pared to thermal buoyancy and updrafts before 15:00 BJT) in the control run than in the low-aerosol run.This leads to stronger updrafts in the control run than in the low-aerosol run after 15:00 BJT (Table 2 andFigures 6a and 6b). The control run shows less intense updrafts than in the low-aerosol run throughout thesimulation period in warm clouds, while updrafts in the control run are stronger than those in the low-aerosolrun after 15:00 BJT in cold clouds (Figure 9). The different updrafts observed here confirm that the greatertransport of droplets to heights above the freezing level and the more freezing of droplets in cold cloudsinduce the stronger updrafts in the control run than in the low-aerosol run after 15:00 BJT. Associated withthe greater freezing and updrafts, a higher fraction of cold clouds is generated for the period between15:00 BJT and the end of simulations. This in turn leads to a higher faction over the whole simulation periodfor cold clouds in the control run than in the low-aerosol run as has been reported by Fan et al. [2013].However, as demonstrated by Fan et al. [2013], associated with weaker updrafts, we find a lower cloudfraction over the whole simulation period for warm clouds in the control run than in the low-aerosol run.The time- and domain-averaged cloud fraction is 0.36 and 0.31 in the control run and the low-aerosol run,respectively, for cold clouds. The averaged cloud fraction is 0.13 and 0.15 in the control run and thelow-aerosol run, respectively, for warm clouds.
After 15:00 BJT, the stronger updrafts trigger much higher condensation rates and, thus, precipitation rates inthe control run than in the low-aerosol run [Lee, 2011] as shown in Table 2 and Figures 4a and 10. Note that
the higher condensation and freezingrates cause not only the larger hydro-meteor loading by enhancing the massof hydrometeors but also greater latentheating in the control run than in thelow-aerosol run. The stronger updraftsdemonstrate that the effect of thegreater latent heating on updraftsoutweighs that of the larger loading inthe control run.
In the simulated system, relative humid-ity in the boundary layer is ~90%which corresponds to a wet environ-ment according to the categorization ofenvironment by Khain et al. [2008] andLee [2011]. Khain et al. [2008] and Lee[2011] have shown that in a dry envi-ronment, aerosol-induced increases incondensation may not produce precipi-tation enhancement. However, in thisstudy, with a wet environment, aerosol-induced higher condensation ratesresult in higher precipitation rates.4.3.3. Comparisons of Freezing Ratesand Their Peak ValuesFreezing rates are higher in the low-aerosol run and the control run thanin the simulations with no aerosol
Table 3. The Cumulative Number of Warm-Cloud and Cold-Cloud Cells for Each of the Periods Before and After 15:00 BJT
From 06:00 BJT to 15:00 BJT From 15:00 BJT to 18:00 BJT
Control Control-No-Rad Low-Aerosol Low-Aerosol-No-Rad Control Control-No-Rad Low-Aerosol Low-Aerosol-No-Rad
Warm-cloud cells 6,200 7,100 6,600 6,900 6,400 6,800 6,900 6,700Cold-cloud cells 9,400 10,200 9,800 9,900 9,700 9,900 10,100 9,600
Figure 10. Vertical distributions of the time- and domain-averagedcondensation rates from the ARW model simulations for the periodafter 15:00 BJT. Each of the lines depicts the same run as seen in Figures 4aand 5.
Journal of Geophysical Research: Atmospheres 10.1002/2015JD024362
LEE ET AL. AEROSOL DELAYS DIURNAL CYCLE IN RAINFALL 11,750

radiative effects for the period between 15:00 BJT and the end of simulations (Table 2 and Figure 8b).Associated with this, the peak values of the freezing rates are also higher in the low-aerosol run and controlrun than in the simulations with no aerosol radiative effects (Table 2 and Figure 8b). Due to greater instability,CAPE and stronger updrafts at 15:00 BJT, more transport of cloud liquid and freezing occur in the simulationswith aerosol radiative effects than in those with no aerosol radiative effects. The larger instability in thesimulations with aerosol radiative effects than with no aerosol radiative effects and smaller autoconversionin the control run than in the low-aerosol run work together to produce the highest freezing rate and peakvalue of the freezing rate in the control run among the four simulations for the period after 15:00 BJT(Table 2 and Figure 8b). This results in the second highest freezing rate and peak value of the freezing ratein the low-aerosol run for the period (Table 2 and Figure 8b).
The smaller transport of cloud liquid, the less freezing of cloud liquid, and the associated lower peak valueof the freezing rate occur despite the smaller autoconversion in the control-no-rad run than in thelow-aerosol run (Table 2 and Figure 8b). This is due to lower instability and weaker updrafts at 15:00 BJT inthe control-no-rad run than in the low-aerosol run. There is the similar instability between the control-no-radrun and the low-aerosol-no-rad run at 15:00 BJT. With this similar instability between the runs, the greaterautoconversion in the low-aerosol-no-rad run than in the control-no-rad run leads to the lowest freezing ratesand peak value in the low-aerosol-no-rad run among the four simulations for the period after 15:00 BJT(Table 2 and Figure 8b).4.3.4. Delay in Peak in Precipitation RatesJust after the time point of CAPE being larger in the low-aerosol run than in the simulations with no aerosolradiative effects, which is 14:00 BJT, the peak in precipitation rate occurs in the low-aerosol run. After~15:00 BJT, in the control run, aerosol invigoration effects are active as detailed in section 4.3.2. This leadsto peak in precipitation rate in the control run that occurs later than in the low-aerosol run by 2 h and 15min(Figure 4a). This delay in the precipitation rate is similar to the phenomenon found concerning the maximumcloud occurrence under polluted conditions reported by Fan et al. [2013] and can be explained by cold clouds(Figure 4b). Also, the greater precipitation rates (related to larger freezing, stronger updrafts, and morecondensation) in the control run than in the low-aerosol run that start to show around 15:00 BJT occur in coldclouds but not in warm clouds (Figures 4b and 4c). This indicates that freezing-related invigoration and itscompetition with aerosol radiative effects are associated with cold clouds. This close association with coldclouds demonstrates that the link between the invigoration effect and its competition with aerosol radiativeeffects in warm clouds is tenuous due to the absence of freezing in those clouds. This absence of freezing inwarm clouds prevents the additional thermal buoyancy that is produced by more freezing of droplets frominvigorating updrafts and enhancing precipitation in the control run.
4.4. Simulations With Different Initial Trigger Conditions
In the spirit of ensemble simulations, we repeated the four standard simulations (i.e., the control run, the low-aerosol run, the control-no-rad run, and the low-aerosol-no-rad run) but modified the initial random pertur-bations of potential temperature. This modification is a way of applying a different initial trigger mechanismto the repeated simulations. The first pair of repeated runs is with initial perturbations lowered by a factor of 2compared to those in the standard simulations. The second pair is with the initial perturbations increased bya factor of 2 compared to those in the standard simulations. Hence, there are two sets of ensemble simula-tions and each pair of the repeated runs represents each set of ensemble simulations. Figure 11a presentsthe same time series as in Figure 4a, along with the time series from simulations with perturbed initial con-ditions. The basic trends in the repeated runs are similar to those in the standard runs. While this “ensemble”of runs has a limited number of members, results shown in Figure 11a suggest that the analysis presentedhere is not associated with a particular set of initial trigger conditions.
4.5. Simulations With a Different Domain Size
It is possible that results here can vary with varying domain length, and to test this possibility, the standardsimulations are repeated with a larger domain length which is 300 km. These simulations are referred to asthe control-300km run, the low-aerosol-300km run, the control-no-rad-300km run, and the low-aerosol-no-rad-300km run. Selecting a domain length of 300 km that is not consistent with the 100 km length of thestudy area does not allow us to make a reasonable comparison between simulations and observations.
Journal of Geophysical Research: Atmospheres 10.1002/2015JD024362
LEE ET AL. AEROSOL DELAYS DIURNAL CYCLE IN RAINFALL 11,751

Despite this, these repeated runs can help toward evaluating the robustness of the results to the modelsetup, e.g., domain size.
As shown in Figure 11b, these repeated runs show results that are not qualitatively different from those withthe standard runs. This demonstrates that results here are quite robust to the choice of the domain size. This
Figure 11. Time series of the domain-averaged precipitation rates from the ARW model simulations. Solid lines are as inFigure 4a. (a) Dashed and dotted lines represent those runs in Figure 4a that are repeated with different initial potentialtemperature perturbations. The dashed lines show the time series from the repeated runs with the initial perturbationshalved, and the dotted lines depict the time series from the repeated runs with the initial perturbations doubled.(b) Dashed lines represent those runs in Figure 4a that are repeated with the domain length that is elongated from 120 kmto 300 km. (c) Dashed blue and red lines represent the control run and the control-no-rad run that are repeated with aerosolconcentration reduced by a factor of 2, while dotted blue and red lines represent the control run and the control-no-rad runthat are repeated with aerosol concentration reduced by a factor of 30 as compared to that in the control run and thecontrol-no-rad run, respectively. The dotted green line represents the low-aerosol run that is repeated with the averagedaerosol concentration of 2350 cm�3 over the PBL.
Journal of Geophysical Research: Atmospheres 10.1002/2015JD024362
LEE ET AL. AEROSOL DELAYS DIURNAL CYCLE IN RAINFALL 11,752
is consistent with the findings reported by Phillips and Donner [2007]. Phillips and Donner [2007] comparedresults obtained by averaging an ensemble of 85 small (~100 km) domains to those from a single large(~5000 km) domain and found that their statistical behaviors are similar. They attributed this to the fact thatthe size of individual convection, which is around 5–30 km, is much smaller than the size of the domain andthus the impact of the size of the domain on individual convection is not significant.
4.6. Simulations With Different Aerosol Perturbations
To test the robustness of results here to different aerosol concentrations for the low-aerosol simulations, werepeated the control run and the control-no-rad run by reducing aerosol concentrations by factors of 2 and30, respectively. The repeated simulations with the reduced aerosol concentration by a factor of 2 are referredto as the control-2 run and the control-no-rad-2 run, respectively. Those simulations with the reduced aerosolconcentration by a factor of 30 are referred to as the control-30 run and the control-no-rad-30 run, respec-tively. The averaged aerosol concentration over the PBL in the control-2 run and the control-no-rad-2 runis 3750 cm�3 that is higher than 750 cm�3 in the low-aerosol run and the low-aerosol-no-rad run. In thecontrol-30 run and the control-no-rad-30 run, the PBL-averaged aerosol concentration is 250 cm�3 that islower than 750 cm�3 in the low-aerosol run and the low-aerosol-no-rad run.
Similar to the low-aerosol-no-rad run, the control-no-rad-30 run and the control-no-rad-2 run show smallerprecipitation rates than the control-no-rad run (Figure 11c). However, due to lower (higher) aerosol concen-trations and associated less (more) freezing and invigoration, precipitation rates are lower (higher) in thecontrol-no-rad-30 run (the control-no-rad-2 run) than in the low-aerosol-no-rad run (Figure 11c). This demon-strates that the qualitative nature of the results here is not sensitive to the level of aerosol concentrations forlow-aerosol simulations, when it comes to simulations with no aerosol radiative effects.
Similar to what is seen in the low-aerosol run and the low-aerosol-no-rad run, due to aerosol radiative effects,precipitation is suppressed in the control-30 run and the control-2 run compared to that in the low-aerosol-no-rad run before 15:00 BJT (Figure 11c). However, the suppression is lesser (greater) due to the lower(higher) aerosol concentration that absorbs solar radiation in the control-30 run (control-2 run) than in thelow-aerosol run.
After 15:00 BJT, the control-30 run shows results that are qualitatively similar to the low-aerosol run withrespect to the control run (Figure 11c). Of interest is that in the control-2 run, there are substantial increasesin precipitation and the occurrence of the precipitation peak which are similar to those in the control run andare not present in the low-aerosol run and the control-30 run after 15:00 BJT (Figure 11c). This is due to largeraerosol concentration and the associated greater invigoration of convection in the control-2 run than in thelow-aerosol run and the control-30 run. However, due to a smaller aerosol concentration and the associatedless invigoration, the precipitation rates and their peak are lower in the control-2 run than in the control run(Figure 11c). This suggests that there is a critical level of aerosol concentration above which peaks in precipi-tation rates can be generated.
To find the critical level, we repeated the low-aerosol run by gradually increasing aerosol concentrations. Inthe repeated runs, the averaged aerosol concentration over the PBL increases in the increments of 100 cm�3
from an initial value of 750 cm�3 to a value for which the first occurrence of a precipitation peak after1500 BJT is seen. When the averaged concentration reaches 2350 cm�3, the precipitation peak starts toappear in one of the runs, i.e., the low-aerosol-2350 run in Figure 11c. Thus, 2350 cm�3 is determined to bethe estimated critical level of aerosol concentration.
4.7. Simulations With Aerosol Layers at Different Altitudes
As described in section 3, in the standard runs, the main aerosol layer is located in the PBL below ~2 km.Remember that in the main layer, aerosol concentration remains constant; however, beyond the main layer,aerosol concentration decreases exponentially. It has been shown that convective clouds in the tropicsentrain a significant amount of environmental air above the PBL [McGee and van den Heever, 2014]. Hence,it is possible that aerosol particles are transported to levels above the PBL in our study area, which can leadto heating in the atmosphere and cooling near the surface that are quantitatively different from those shownin the standard runs. Motivated by this possibility, the standard runs are repeated by shifting themain aerosollayer upward in altitude. Since the simulated cloud system is rooted in low-level clouds below an altitude of
Journal of Geophysical Research: Atmospheres 10.1002/2015JD024362
LEE ET AL. AEROSOL DELAYS DIURNAL CYCLE IN RAINFALL 11,753
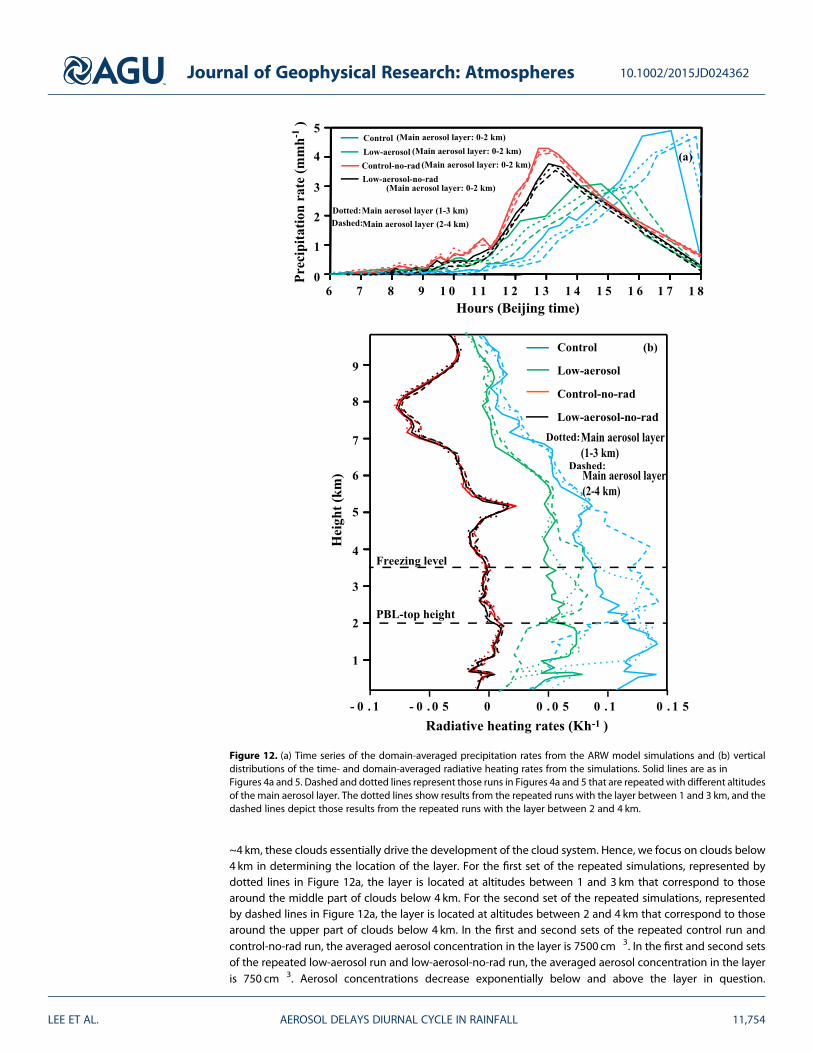
~4 km, these clouds essentially drive the development of the cloud system. Hence, we focus on clouds below4 km in determining the location of the layer. For the first set of the repeated simulations, represented bydotted lines in Figure 12a, the layer is located at altitudes between 1 and 3 km that correspond to thosearound the middle part of clouds below 4 km. For the second set of the repeated simulations, representedby dashed lines in Figure 12a, the layer is located at altitudes between 2 and 4 km that correspond to thosearound the upper part of clouds below 4 km. In the first and second sets of the repeated control run andcontrol-no-rad run, the averaged aerosol concentration in the layer is 7500 cm�3. In the first and second setsof the repeated low-aerosol run and low-aerosol-no-rad run, the averaged aerosol concentration in the layeris 750 cm�3. Aerosol concentrations decrease exponentially below and above the layer in question.
Figure 12. (a) Time series of the domain-averaged precipitation rates from the ARW model simulations and (b) verticaldistributions of the time- and domain-averaged radiative heating rates from the simulations. Solid lines are as inFigures 4a and 5. Dashed and dotted lines represent those runs in Figures 4a and 5 that are repeatedwith different altitudesof the main aerosol layer. The dotted lines show results from the repeated runs with the layer between 1 and 3 km, and thedashed lines depict those results from the repeated runs with the layer between 2 and 4 km.
Journal of Geophysical Research: Atmospheres 10.1002/2015JD024362
LEE ET AL. AEROSOL DELAYS DIURNAL CYCLE IN RAINFALL 11,754
Associated with this, larger differences in aerosol radiative heating are located in and around the layerbetween 1 and 3 km compared to those in other layers for the first set of the repeated runs (Figure 12b).The larger differences are located in and around the layer between 2 and 4 km for the second set of therepeated runs (Figure 12b).
Figure 12a shows that the qualitative nature of the results here does not depend on the altitude of the mainaerosol layer. However, as shown byWang et al. [2013] and Lee et al. [2014], as the altitudes of the layer rise, sodo aerosol-induced increases in stability over the layer below 4 km. Hence, compared to the repeated runswith no aerosol radiative effects, precipitation in the repeated runs with aerosol radiative effects is sup-pressed and this suppression enhances before 15:00 BJT compared to the situation in the standard runs.Also, peak in precipitation rates occurs later in the repeated control run (as compared to the control run)and in the repeated low-aerosol run (as compared to the low-aerosol run).
4.8. Simulations With No Effects of Freezing on Temperature
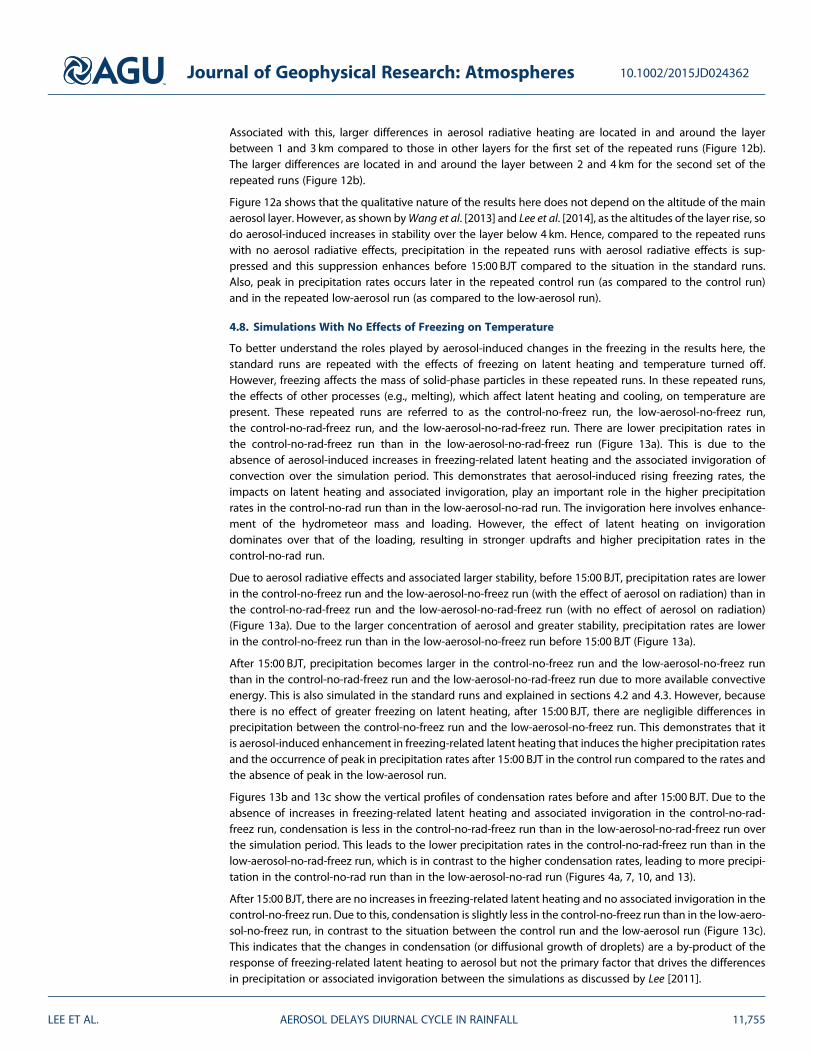
To better understand the roles played by aerosol-induced changes in the freezing in the results here, thestandard runs are repeated with the effects of freezing on latent heating and temperature turned off.However, freezing affects the mass of solid-phase particles in these repeated runs. In these repeated runs,the effects of other processes (e.g., melting), which affect latent heating and cooling, on temperature arepresent. These repeated runs are referred to as the control-no-freez run, the low-aerosol-no-freez run,the control-no-rad-freez run, and the low-aerosol-no-rad-freez run. There are lower precipitation rates inthe control-no-rad-freez run than in the low-aerosol-no-rad-freez run (Figure 13a). This is due to theabsence of aerosol-induced increases in freezing-related latent heating and the associated invigoration ofconvection over the simulation period. This demonstrates that aerosol-induced rising freezing rates, theimpacts on latent heating and associated invigoration, play an important role in the higher precipitationrates in the control-no-rad run than in the low-aerosol-no-rad run. The invigoration here involves enhance-ment of the hydrometeor mass and loading. However, the effect of latent heating on invigorationdominates over that of the loading, resulting in stronger updrafts and higher precipitation rates in thecontrol-no-rad run.
Due to aerosol radiative effects and associated larger stability, before 15:00 BJT, precipitation rates are lowerin the control-no-freez run and the low-aerosol-no-freez run (with the effect of aerosol on radiation) than inthe control-no-rad-freez run and the low-aerosol-no-rad-freez run (with no effect of aerosol on radiation)(Figure 13a). Due to the larger concentration of aerosol and greater stability, precipitation rates are lowerin the control-no-freez run than in the low-aerosol-no-freez run before 15:00 BJT (Figure 13a).
After 15:00 BJT, precipitation becomes larger in the control-no-freez run and the low-aerosol-no-freez runthan in the control-no-rad-freez run and the low-aerosol-no-rad-freez run due to more available convectiveenergy. This is also simulated in the standard runs and explained in sections 4.2 and 4.3. However, becausethere is no effect of greater freezing on latent heating, after 15:00 BJT, there are negligible differences inprecipitation between the control-no-freez run and the low-aerosol-no-freez run. This demonstrates that itis aerosol-induced enhancement in freezing-related latent heating that induces the higher precipitation ratesand the occurrence of peak in precipitation rates after 15:00 BJT in the control run compared to the rates andthe absence of peak in the low-aerosol run.
Figures 13b and 13c show the vertical profiles of condensation rates before and after 15:00 BJT. Due to theabsence of increases in freezing-related latent heating and associated invigoration in the control-no-rad-freez run, condensation is less in the control-no-rad-freez run than in the low-aerosol-no-rad-freez run overthe simulation period. This leads to the lower precipitation rates in the control-no-rad-freez run than in thelow-aerosol-no-rad-freez run, which is in contrast to the higher condensation rates, leading to more precipi-tation in the control-no-rad run than in the low-aerosol-no-rad run (Figures 4a, 7, 10, and 13).
After 15:00 BJT, there are no increases in freezing-related latent heating and no associated invigoration in thecontrol-no-freez run. Due to this, condensation is slightly less in the control-no-freez run than in the low-aero-sol-no-freez run, in contrast to the situation between the control run and the low-aerosol run (Figure 13c).This indicates that the changes in condensation (or diffusional growth of droplets) are a by-product of theresponse of freezing-related latent heating to aerosol but not the primary factor that drives the differencesin precipitation or associated invigoration between the simulations as discussed by Lee [2011].
Journal of Geophysical Research: Atmospheres 10.1002/2015JD024362
LEE ET AL. AEROSOL DELAYS DIURNAL CYCLE IN RAINFALL 11,755
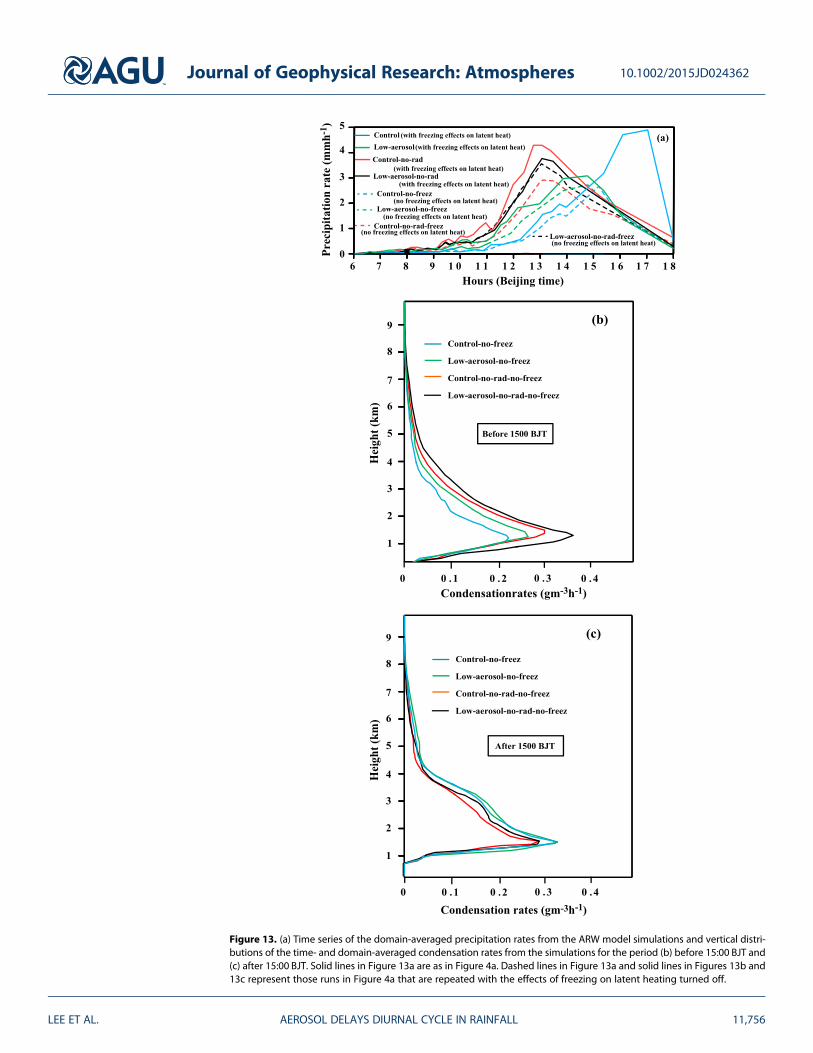
Figure 13. (a) Time series of the domain-averaged precipitation rates from the ARW model simulations and vertical distri-butions of the time- and domain-averaged condensation rates from the simulations for the period (b) before 15:00 BJT and(c) after 15:00 BJT. Solid lines in Figure 13a are as in Figure 4a. Dashed lines in Figure 13a and solid lines in Figures 13b and13c represent those runs in Figure 4a that are repeated with the effects of freezing on latent heating turned off.
Journal of Geophysical Research: Atmospheres 10.1002/2015JD024362
LEE ET AL. AEROSOL DELAYS DIURNAL CYCLE IN RAINFALL 11,756
As shown by Lee [2011], the variation in latent heating by freezing with varying aerosol concentration is atleast 1 order of magnitude smaller than the variation by condensation (Table 2 and Figures 7, 8, and 10).The time- and domain-averaged variation in condensation (freezing) rate is 3.00 × 10�2 (3.60 × 10�4)gm�3 h�1 between the control-no-rad run and the low-aerosol-no-rad run over the simulation period.After 15:00 BJT, the time- and domain-averaged variation in condensation (freezing) rate is 4.00 × 10�2
(1.01 × 10�3) gm�3 h�1 between the control run and low-aerosol run. However, as shown by Lee [2011],despite the much smaller variation in freezing, aerosol-induced changes in freezing trigger those in conden-sation. Aerosol-induced enhancement in freezing-related latent heating first strengthens updrafts, and this inturn induces more deposition above the freezing level. Increases in deposition are roughly ~1 order ofmagnitude greater than those in freezing and thus further strengthen updrafts above the freezing level. Tosatisfy mass conservation, these stronger updrafts above the freezing level induce more intense cloud-bottom convergence, which accompanies stronger updrafts below the freezing level where most ofcondensation occurs and thus greater condensation. Greater condensation and stronger updrafts establishfeedbacks between them, which result in a much larger aerosol-induced variation in condensation than thatin freezing.
4.9. Discussion of the Sensitivity of Results to Microphysics Parameterization
Fan et al. [2012] have pointed out that the use of a fixed CDNC, a saturation adjustment, and constant collec-tion efficiencies in double-moment schemes is the main cause of discrepancies in aerosol effects on cloudsand precipitation between bin schemes and double-moment schemes. However, the double-momentscheme adopted in this study uses predicted CDNCs, predicted supersaturation levels, and varying collectionefficiencies with varying hydrometeor sizes. So we believe that the results here are less affected by the short-comings of double-moment schemes discussed by Fan et al. [2012]. This belief is further supported by Khainet al. [2015] who concluded that the use of bin schemes or the type of the bulk scheme used in this study isdesirable for reasonable simulations of aerosol-cloud interactions. However, it should be noted that the bulkscheme used here assumes a gamma size distribution with fixed breadth for hydrometeors. As pointed out byKhain et al. [2015], this assumption can lead to errors in the representation of microphysics and its interac-tions with aerosol. Further studies are required to better understand the impacts of the assumption on cloudsand their interactions with aerosol. However, the repetition of standard simulations done in this study usingdifferent types of size distribution (i.e., exponential and lognormal distributions) shows that results here donot depend on the specific choice of size distribution.
In addition to the representation of CDNC, saturation, and collection processes, the representation of hail canbe another cause of discrepancies in aerosol effects on clouds and precipitation between bin schemes anddouble-moment schemes [Loftus and Cotton, 2014]. Note that the representation of hail (e.g., hail size) in thisstudy is more simplified than that in the bin- and three-moment schemes discussed by Loftus and Cotton[2014]. However, comparisons of precipitation properties (e.g., precipitation rates and amount) betweenobservations and the control run show a good agreement in this study (Figure 4a). Hence, we think thatprecipitation processes including those related to hail are simulated reasonably well despite the simplifiedrepresentation of hail in this study. Moreover, we repeated the control run by excluding hail from hydrome-teors and found that the precipitation properties from this repeated simulation agree well with observations.This indicates that for the cloud system adopted in this study, hail or its representation in the model does notplay an important role in the reasonable simulation of precipitation.
5. Summary and Conclusions
Severe convective weather systems that produce thunderstorms and heavy rainfall generally exhibit diurnalcycles over land. In Part 1 of our companion studies, Guo et al. [2016] have found a systematic difference inthe peak of the occurrence of such events under polluted and clean conditions, postulating that aerosolshave a discernible impact on the diurnal cycle of severe weather events. To test the hypothesis and to gainfurther insight into the causes of the observed different diurnal cycle patterns between clean and pollutedconditions reported by Guo et al. [2016], numerical simulations are performed using a full-fledged CSRM thataccounts for aerosol microphysical and radiative effects.
Results show that between 06:00 BJT and 15:00 BJT, the aerosol radiative effect leads to suppressed convec-tion and lowered precipitation rates in the control run (corresponding to polluted conditions) compared to
Journal of Geophysical Research: Atmospheres 10.1002/2015JD024362
LEE ET AL. AEROSOL DELAYS DIURNAL CYCLE IN RAINFALL 11,757

those in the low-aerosol run (corresponding to clean conditions). This is despite the reduction in autoconver-sion and associated enhancement in cloud-liquid mass in the control run. This enhancement in cloud-liquidmass is supposed to increase cloud-liquid freezing, which would invigorate convection and increase precipi-tation. However, the higher concentration of aerosol that acts as a radiation absorber induces greater stabilityand generates less intense updrafts in the control run than in the low-aerosol run. This outweighs theinvigoration effects or aerosol microphysical effects, leading to suppressed convection and precipitation inthe control run.
Due to the large stability induced by aerosol radiative effects, potential energy is used slower, which leads tothe extended buildup of potential energy before 15:00 BJT. After 15:00 BJT, this generates instability andpotential energy that are large enough to help the aerosol invigoration effect to produce higher precipitationrates in the control run than in the low-aerosol run. Due to the larger stability before 15:00 BJT and the greateramount of time required for updrafts to overcome this stability, peak in precipitation rate occurs 2 h and15min later in the control run than in the low-aerosol run. This corroborates the delay of precipitationobserved under polluted conditions in the Pearl River Delta region of southern China as described in Part 1.
Results from the control run and the low-aerosol run are robust to the altitudes of themain aerosol layer. Also,the occurrence of a peak in precipitation in the control run depends on the level of aerosol concentration.When the level is below a critical value, the peak does not appear. This demonstrates that a minimum levelof aerosol concentration is needed for a peak to appear. The estimated minimum level for the case simulatedin this study is 2350 cm�3. Once aerosol concentration reaches this minimum level, a large enough reductionin autoconversion and a large enough increase in cloud-liquid mass induce the invigoration of convectionthat in turn is strong enough to generate a peak.
This study demonstrates that aerosol effects on clouds alter the diurnal variation in clouds and precipitationand identifies associated preliminary mechanisms. We believe that these mechanisms are a valuable step-ping stone toward a better understanding of the diurnal variation in the context of aerosol-cloud-radiationinteractions, considering that the level of understanding of aerosol effects on the diurnal variation has beenlow thus far. These mechanisms demonstrate that to get a better picture of aerosol effects on the diurnalvariation, we have to delve into interactions or competition between aerosol radiative effects and aerosolmicrophysical effects.
ReferencesAckerman, A. S., O. B. Toon, D. E. Stevens, A. J. Heymsfield, V. Ramanathan, and E. J. Welton (2000), Reduction of tropical cloudiness by soot,
Science, 288, 1042–1047.Chen, F., and J. Dudhia (2001), Coupling an advanced land surface-hydrology model with the Penn State-NCARMM5modeling system. Part I:
Model implementation and sensitivity, Mon. Weather Rev., 129(4), 569–585.Davidi, A., I. Koren, and L. Remer (2009), Direct measurements of the effect of biomass burning over the Amazon on the atmospheric
temperature profile, Atmos. Chem. Phys., 9, 8211–8221.Donner, L. J., C. J. Seman, and R. S. Hemler (1999), Three-dimensional cloud-system modeling of GATE convection, J. Atmos. Sci., 56(12),
1885–1912.Fan, J., L. R. Leung, Z. Li, H. Morrison, H. Chen, Y. Zhou, Y. Qian, and Y. Wang (2012), Aerosol impacts on clouds and precipitation in eastern
China: Results from bin and bulk microphysics, J. Geophys. Res., 117, D00K36, doi:10.1029/2011JD016537.Fan, J., L. R. Leung, D. Rosenfeld, Q. Chen, Z. Li, J. Zhang, and H. Yan (2013), Microphysical effects determine macrophysical response for
aerosol impact on deep convective clouds, Proc. Natl. Acad. Sci. U.S.A., 110, doi:10.1073/pnas.1316830110.Feingold, G., and S. M. Kreidenweis (2002), Cloud processing of aerosol as modeled by a large eddy simulation with coupled microphysics
and aqueous chemistry, J. Geophys. Res., 107(D23), 4687, doi:10.1029/2002JD002054.Feingold, G., H. Jiang, and J. Y. Harrington (2005), On smoke suppression of clouds in Amazonia, Geophys. Res. Lett., 32, L02804, doi:10.1029/
2004GL021369.Fouquart, Y., and B. Bonnel (1980), Computation of solar heating of the Earth’s atmosphere: A new parameterization, Beitr. Phys. Atmos., 53,
35–62.Fridlind, A. M., et al. (2012), A comparison of TWP-ICE observational data with cloud-resolving model results, J. Geophys. Res., 117, D05204,
doi:10.1029/2011JD016595.Fridlind, A., A. Ackerman, J. Petch, P. Field, A. Hill, G. McFarquhar, S. Xie, and M. Zhang (2010), ARM/GCSS/SPARC TWP-ICE CRM
intercomparison study. [Available at http://pubs.giss.nasa.gov/abs/fr08100v.html.]Grabowski, W. W. (2006), Indirect impact of atmospheric aerosols in idealized simulations of convective–radiative quasi equilibrium, J. Clim.,
19, 4664–4682.Guo, J. P., X. Y. Zhang, Y. R. Wu, H. Z. Che, B. La, and X. Li (2011), Spatio-temporal variation trends of satellite-based aerosol optical depth in
China during 1980–2008, Atmos. Environ., 45(37), 6802–6811, doi:10.1016/j.atmosenv.2011.03.068.Guo, J., M. Deng, J. Fan, Z. Li, Q. Chen, P. Zhai, Z. Dai, and X. Li (2014), Precipitation and air pollution at mountain and plain stations in northern
China: Insights gained from observations and modeling, J. Geophys. Res. Atmos., 119, 4793–4807, doi:10.1002/2013JD021161.Guo, J., M. Deng, S. S. Lee, F. Wang, Z. Li, P. Zhai, H. Liu, W. Lv, W. Yao, and X. Li (2016), Delaying precipitation and lightning by air pollution
over the Pearl River Delta: 1. Observational analyses, J. Geophy. Res. Atmos., 121, 6472–6488, doi:10.1002/2015JD023257.
Journal of Geophysical Research: Atmospheres 10.1002/2015JD024362
LEE ET AL. AEROSOL DELAYS DIURNAL CYCLE IN RAINFALL 11,758
AcknowledgmentsThis work was carried out under theauspices of the Ministry of Scienceand Technology of China (grants2014BAC16B01 and 2013CB955804),the Natural Science Foundation (NSF)(grants AGS1118325 and AGS1534670),the NSF of China (grants 91544217,41471301, and 41171294), and theChinese Academy of MeteorologicalSciences (grant 2014R18). The computercodes and data needed to reproducethe results presented in this paper areavailable upon request by [email protected] (J. Guo). Last,but not least, special thanks go to threeanonymous reviewers for their valuablecomments and suggestions that helpedimprove the quality of our manuscript.
Hansen, J. E., M. Sato, and R. Ruedy (1997), Radiative forcing and climate response, J. Geophys. Res., 102, 6381–6864, doi:10.1029/96JD03436.Hill, A. A., and S. Dobbie (2008), The impact of aerosols on non-precipitating marine stratocumulus. II: The semi-direct effect, Q. J. R. Meteorol.
Soc., 134, 1155–1165.Jacobson, M. Z. (2006), Effects of externally-through-internally-mixed soot inclusions within clouds and precipitation on global climate,
J. Phys. Chem. A, 110, 6860–6873.Jacobson, M. Z. (2012), Investigating cloud absorption effects: Global absorption properties of black carbon, tar balls, and soil dust in clouds
and aerosols, J. Geophys. Res., 117, D06205, doi:10.1029/2011JD017218.Kessler, E. (1969), On the distribution and continuity of water substance on atmospheric circulation, Meteorol. Monogr., 10(32), 84.Khain, A., and B. Lynn (2009), Simulation of a supercell storm in clean and dirty atmosphere using weather research and forecast model with
spectral bin microphysics, J. Geophys. Res., 114, D19209, doi:10.1029/2009JD011827.Khain, A., D. Rosenfeld, and A. Pokrovsky (2005), Aerosol impact on the dynamics and microphysics of deep convective clouds, Q. J. R.
Meteorol. Soc., 131, 2639–2663.Khain, A., N. BenMoshe, and A. Pokrovsky (2008), Factors determining the impact of aerosols on surface precipitation from clouds: Attempt of
classification, J. Atmos. Sci., 65, 1721–1748.Khain, A. P., et al. (2015), Representation of microphysical processes in cloud resolving models: Spectral (bin) microphysics versus bulk
parameterization, Rev. Geophys., 53, 247–322, doi:10.1002/2014RG000468.Koch, D., and A. D. Del Genio (2010), Black carbon semi-direct effects on cloud cover: Review and synthesis, Atmos. Chem. Phys., 10,
7685–7696, doi:10.5194/acp-10-7685-2010.Koren, I., Y. J. Kaufman, L. A. Remer, and J. V. Martins (2004), Measurement of the effect of Amazon smoke on inhibition of cloud formation,
Science, 303(5662), 1342–1345, doi:10.1126/science.1089424.Koren, I., J. V. Martins, L. A. Remer, and H. Afargan (2008), Smoke invigoration versus inhibition of clouds over the Amazon, Science, 321(5891),
946–949, doi:10.1126/science.1159185.Lee, S. S. (2011), Dependence of aerosol-precipitation interactions on humidity in a multiple-cloud system, Atmos. Chem. Phys., 11(5),
2179–2196.Lee, S. S. (2012), Effect of aerosol on circulations and precipitation in deep convective clouds, J. Atmos. Sci., 69, 1957–1974.Lee, S. S., and G. Feingold (2010), Precipitating cloud-system response to aerosol perturbations, Geophys. Res. Lett., 37, L23806, doi:10.1029/
2010GL045596.Lee, S. S., L. J. Donner, V. T. J. Phillips, and Y. Ming (2008a), The dependence of aerosol effects on clouds and precipitation on cloud-system
organization, shear and stability, J. Geophys. Res., 113, D16202, doi:10.1029/2007JD00922.Lee, S. S., L. J. Donner, V. T. J. Phillips, and Y. Ming (2008b), Examination of aerosol effects on precipitation in deep convective clouds during
the 1997 ARM summer experiment, Q. J. R. Meteorol. Soc., 134(634), 1201–1220, doi:10.1002/qj.287.Lee, S. S., L. J. Donner, and J. E. Penner (2010), Thunderstorm and stratocumulus: How does their contrasting morphology affect their
interactions with aerosols? Atmos. Chem. Phys., 10, 6819–6837, doi:10.5194/acp-10-6819-2010.Lee, S. S., G. Feingold, and P. Y. Chuang (2012), Effect of aerosol on cloud-environment interactions in trade cumulus, J. Atmos. Sci., 69(12),
3607–3632, doi:10.1175/JAS-D-12-026.1.Lee, S. S., G. Feingold, I. Koren, H. Yu, T. Yamaguchi, and A. McComiskey (2014), Effect of gradients in biomass burning aerosol on circulations
and clouds, J. Geophys. Res. Atmos., 119, 9948–9964, doi:10.1002/2014JD021819.Li, Z. (1998), Influence of absorbing aerosols on the inference of solar surface radiation budget and cloud absorption, J. Clim., 11, 5–17.Li, Z., K.-H. Lee, J. Xin, Y. Wang, and W.-M. Hao (2010), First observation-based estimates of aerosol radiative forcing at the top, bottom and
inside of the atmosphere, J. Geophys. Res., 115, D00K18, doi:10.1029/2009JD013306.Li, Z., F. Niu, J. Fan, Y. Liu, D. Rosenfeld, and Y. Ding (2011), Long-term impacts of aerosols on the vertical development of clouds and
precipitation, Nat. Geosci., 4, 888–894.Loftus, A. M., and W. R. Cotton (2014), A triple-moment hail bulk microphysics scheme. Part II: Verification and comparison with two-moment
bulk microphysics, Atmos. Res., 150, 97–128.McGee, C. J., and S. C. van den Heever (2014), Latent heating and mixing due to entrainment in tropical deep convection, J. Atmos. Sci., 71,
816–832, doi:10.1175/JAS-D-13-0140.1.Mlawer, E. J., S. J. Taubman, P. D. Brown, M. J. Iacono, and S. A. Clough (1997), RRTM, a validated correlated-k model for the longwave,
J. Geophys. Res., 102, 16,663–16,682, doi:10.1029/97JD00237.Morrison, H., and W. W. Grabowski (2011), Cloud-system resolving model simulations of aerosol indirect effects on tropical deep convection
and its thermodynamic environment, Atmos. Chem. Phys., 11, 10,503–10,523.Pan, H.-L., and L. Mahrt (1987), Interaction between soil hydrology and boundary-layer development, Bound.-Layer Meteorol., 38,
185–202.Peng, J. F., et al. (2014), Submicron aerosols at thirteen diversified sites in China: Size distribution, new particle formation and corresponding
contribution to cloud condensation nuclei production, Atmos. Chem. Phys., 14(18), 10,249–10,265, doi:10.5194/acp-14-10249-2014.Phillips, V. T. J., and L. J. Donner (2007), Cloud microphysics, radiation, and vertical velocities in two- and three-dimensional simulations of
deep convection, Q. J. R. Meteorol. Soc., 133, 3011–3033.Rosenfeld, D., U. Lohmann, G. B. Raga, C. D. O’Dowd, M. Kulmala, S. Fuzzi, A. Reissell, and M. O. Andreae (2008), Flood or drought: How do
aerosols affect precipitation? Science, 321(5894), 1309–1313.Saleeby, S. M., and W. R. Cotton (2004), A large-droplet mode and prognostic number concentration of cloud droplets in the Colorado State
University Regional Atmospheric Modeling System (RAMS). Part I: Module descriptions and supercell test simulations, J. Appl. Meteorol., 43,182–195, doi:10.1175/JAM2312.1.
Segal, M., J. Weaver, and J. F. W. Purdom (1989), Some effects of the Yellowstone fire smoke plume on northeast Colorado at the end ofsummer 1988, Mon. Weather Rev., 117, 2278–2283.
Seifert, A., and K. D. Beheng (2006), A two-moment cloud microphysics parameterization for mixed-phase clouds. Part 2: Maritime vs.continental deep convective storms, Meteorol. Atmos. Phys., 92, 67–82.
Skamarock, W. C., J. B. Klemp, J. Dudhia, D. O. Gill, D. M. Barker, W. Wang, and J. G. Powers (2008), A description of the Advanced ResearchWRF, version 3. NCAR Tech. Note NCAR/TN-4751STR, 113 pp.
Storer, R. L., S. C. van den Heever, and G. L. Stephens (2010), Modeling aerosol impacts on convection under differing storm environments,J. Atmos. Sci., 67, 3904–3915.
Tao, W. K., J. P. Chen, Z. Li, C. Wang, and C. D. Zhang (2012), Impact of aerosols on convective clouds and precipitation, Rev. Geophys., 50,RG2001, doi:10.1029/2011RG000369.
Tao, W.-K. (2007), Cloud resolving modeling, J. Meteorol. Soc. Jpn., 85, 305–330.
Journal of Geophysical Research: Atmospheres 10.1002/2015JD024362
LEE ET AL. AEROSOL DELAYS DIURNAL CYCLE IN RAINFALL 11,759
Tao, W.-K., X. Li, A. Khain, T. Matsui, S. Lang, and J. Simpson (2007), Role of atmospheric aerosol concentration on deep convectiveprecipitation: Cloud-resolving model simulations, J. Geophys. Res., 112, D24S18, doi:10.1029/2007JD008728.
Ten Hoeve, J. E., M. Z. Jacobson, and L. A. Remer (2012), Comparing results from a physical model with satellite and in situ observations todetermine whether biomass burning aerosols over the Amazon brighten or burn off clouds, J. Geophys. Res., 117, D08203, doi:10.1029/2011JD016856.
van den Heever, S. C., G. G. Carrio, W. R. Cotton, P. J. DeMott, and A. J. Prenni (2006), Impacts of nucleating aerosol on Florida storms. Part I:Mesoscale simulations, J. Atmos. Sci., 63, 1752–1775.
van den Heever, S. C., and W. R. Cotton (2007), Urban aerosol impacts on downwind convective storms, J. Appl. Meteorol. Climatol., 46,828–850.
van den Heever, S. C., G. L. Stephens, and N. B. Wood (2011), Aerosol indirect effects on tropical convection characteristics under conditionsof radiative–convective equilibrium, J. Atmos. Sci., 68, 699–718.
van Zanten, M. C., et al. (2011), Controls on precipitation and cloudiness in simulations of trade-wind cumulus as observed during RICO,J. Adv. Model. Earth Syst., 3, M06001, doi:10.1029/2011MS000056.
Varble, A. C., A. Fridlind, E. Zipser, A. Ackerman, J.-P. Chaboureau, J. Fan, A. Hill, S. A. McFarlane, J.-P. Pinty, and B. Shipway (2011), Evaluation ofcloud-resolving model intercomparison simulations using TWP-ICE observations: Precipitation and cloud structure, J. Geophys. Res., 116,D12206, doi:10.1029/2010JD015180.
Wang, Y., A. Khalizov, M. Levy, and R. Zhang (2013), New directions: Light absorbing aerosols and their atmospheric impacts, Atmos. Environ.,81, 713–715, doi:10.1016/j.atmosenv.2013.09.034.
Xu, K.-M., et al. (2002), An intercomparison of cloud-resolving models with the atmospheric radiation measurement summer 1997 intensiveobservation period data, Q. J. R. Meteorol. Soc., 128(580), 593–624, doi:10.1256/003590002321042117.
Zhang, X. Y., Y. Q. Wang, T. Niu, X. C. Zhang, S. L. Gong, Y. M. Zhang, and J. Y. Sun (2012), Atmospheric aerosol compositions in China:Spatial/temporal variability, chemical signature, regional haze distribution and comparisons with global aerosols, Atmos. Chem. Phys.,12(2), 779–799, doi:10.5194/acp-12-779-2012.
Journal of Geophysical Research: Atmospheres 10.1002/2015JD024362
LEE ET AL. AEROSOL DELAYS DIURNAL CYCLE IN RAINFALL 11,760