degradation of 2-methyl-4chlorphenoxyacetic acid … · degradation of 2-methyl-4chlorphenoxyacetic...
TRANSCRIPT

MCPA and tfdA genes; Warwick, March 2006
Degradation of 2-methyl-4chlorphenoxyacetic acid (MCPA) in top- and subsoil is quantitatively linked to the class III
tfdA gene
Carsten Suhr Jacobsen1, 2 & 3 * Jacob Bælum1 & 2; Trine Henriksen1, & Hans Christian Bruun Hansen2
1) Geological Survey of Denmark and Greenland (GEUS), Department of Geochemistry 2) Royal Veterinary and Agricultural University (KVL), Department of Chemistry3) Royal Veterinary and Agricultural University (KVL), Department of Ecology
MCPA d fdA W i k M h 2006
Groundwater as source of
drinking water in Europe
(red)
MCPA and tfdA genes; Warwick, March 2006
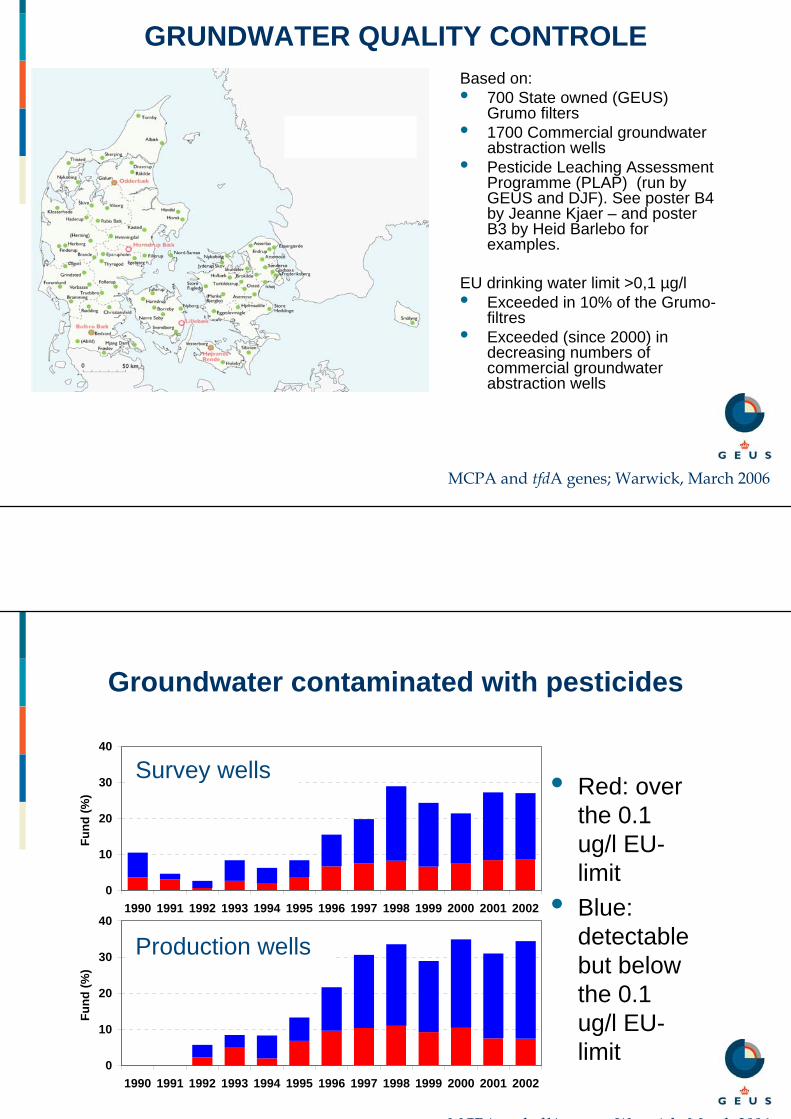
GRUNDWATER QUALITY CONTROLEBased on: • 700 State owned (GEUS)
Grumo filters• 1700 Commercial groundwater
abstraction wells• Pesticide Leaching Assessment
Programme (PLAP) (run by GEUS and DJF). See poster B4 by Jeanne Kjaer – and poster B3 by Heid Barlebo for examples.
EU drinking water limit >0,1 µg/l• Exceeded in 10% of the Grumo-
filtres• Exceeded (since 2000) in
decreasing numbers of commercial groundwater abstraction wells
MCPA d fdA W i k M h 2006
Groundwater contaminated with pesticides
• Red: over the 0.1 ug/l EU-limit
• Blue: detectable but below the 0.1 ug/l EU-limit
GRUMO boringer
0
10
20
30
40
1990 1991 1992 1993 1994 1995 1996 1997 1998 1999 2000 2001 2002
Fund
(%)
Fund >=0,1 µg/l Fund <0,1 µg/l
Vandværksboringer
0
10
20
30
40
1990 1991 1992 1993 1994 1995 1996 1997 1998 1999 2000 2001 2002
Fund
(%)
Survey wells
Production wells
MCPA and tfdA genes; Warwick, March 2006
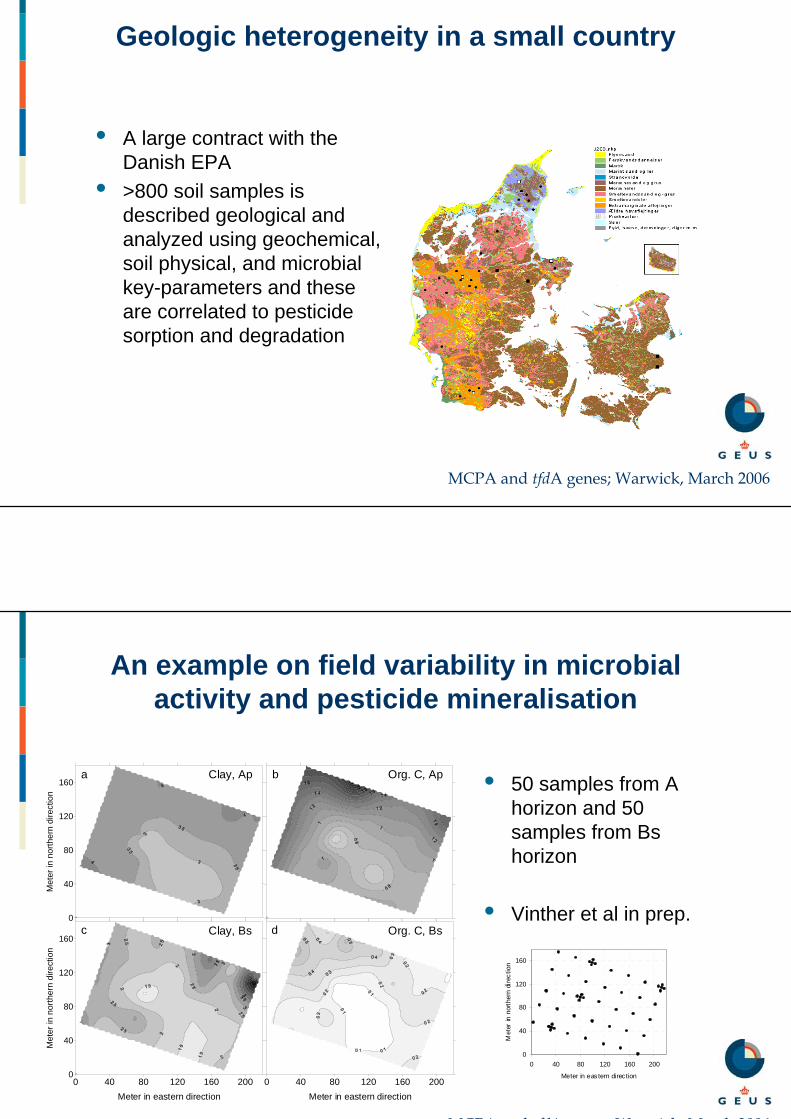
Geologic heterogeneity in a small country
• A large contract with the Danish EPA
• >800 soil samples is described geological and analyzed using geochemical, soil physical, and microbial key-parameters and these are correlated to pesticide sorption and degradation
MCPA d fdA W i k M h 2006
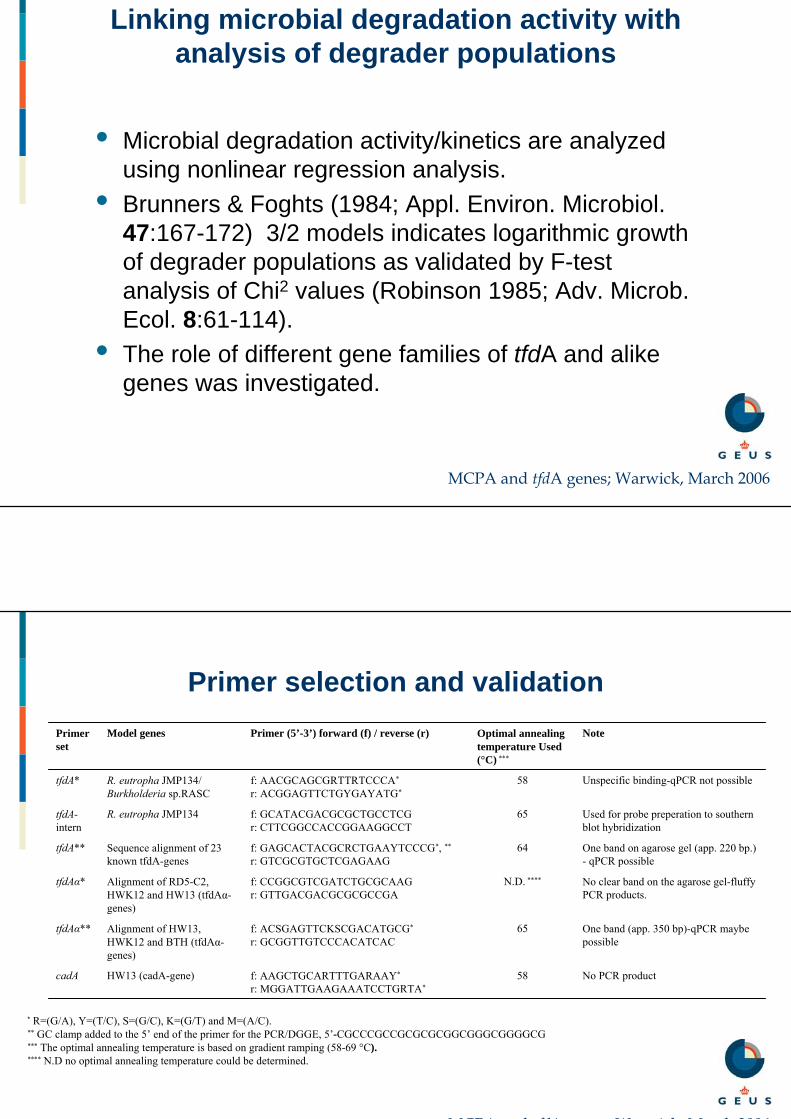
An example on field variability in microbial activity and pesticide mineralisation
• 50 samples from A horizon and 50 samples from Bs horizon
• Vinther et al in prep.
0 40 80 120 160 200Meter in eastern direction
0 40 80 120 160 200Meter in eastern direction
0
40
80
120
160
Met
er in
nor
ther
n di
rect
ion
0
40
80
120
160
Met
er in
nor
ther
n di
rect
ion
a Clay, Ap
c
b
dClay, Bs
Org. C, Ap
Org. C, Bs
0
40
80
120
160
0 40 80 120 160 200
Meter in eas tern direction
Met
er in
nor
ther
n di
rect
ion

MCPA and tfdA genes; Warwick, March 2006
A-horizon samples Vinther et al in prepFredslund et al in prep
• Metribuzine and triazineamine low mineralisation in all samples (higest 3.1% in 90 days)
• Glyphosate mineralisation was found to correlate with microbial activity (SIR and ASA ArylSulfatase Activity) (and with total C).
• MCPA mineralized brilliantly in all A horizon soils with absolutely no correlation to soil parametres of any kind
0 40 80 120 160 200Meter in eastern direction
0 40 80 120 160 200Meter in eastern direction
0
40
80
120
160
Met
er in
nor
ther
n di
rect
ion
0
40
80
120
160
Met
er in
nor
ther
n di
rect
ion
0
40
80
120
160
Met
er in
nor
ther
n di
rect
ion
c ASA d FDA
e Total CFU f Pseudomonas sp.0 40 80 120 160 200
Meter in eastern direction0 40 80 120 160 200
Meter in eastern direction
0
40
80
120
160
Met
er in
nor
ther
n di
rect
ion
0
40
80
120
160
Met
er in
nor
ther
n di
rect
ion
b metribuzin e triazinamin
MCPA d fdA W i k M h 2006
MCPA (a pet herbicide for microbial ecologist)
• Phenoxyacetic acid herbicide (MCPA, 2,4-D og 2,4,5-T)
• Banned (restricted) in Denmark in 1995 but now used in several mixtures against weeds in grasses
Annual sale of MCPA in Denmark
0
200000
400000
600000
800000
1000000
1960 1970 1980 1990 2000 2010
Act
ive
com
poun
d (k
g/ye
a
OCOOH
CH3
Cl
• 4-chloro-2-methylphenoxyaceticacid
• C9H9ClO3
• Mol. weight: 200,6 g/mol• Log KOW: 2,75 (pH 1)
0,46 (pH 5)• pKa: 3,07

MCPA and tfdA genes; Warwick, March 2006
Lessons learned from >800 soils in the Danish EPA supported pesticide area zonation project
• Higher maximum mineralization of MCPAin subsoils compared to surface soil.
• Metabolite formation in surface soil but not in subsoils ?
• Formation of less bioavailable metabolites?• Variation in subsoils (does numbers matter ?).
(KUPA)
MCPA Mineralization day 62, 5-20 cm depth
0
25
50
75
100
125
150
175
200
0 25 50 75 100 125 150 175 200 225 250
meter east
met
er n
orth
MCPA Mineralization day 63, 50 cm depth
0255075
100125150175200
0 25 50 75 100 125 150 175 200 225 250meter east
met
er n
orth
(KUPA)
OCOOH
CH3
Cl
MCPA d fdA W i k M h 2006
Degradation pathway for MCPA
• The phenol compound MCP is a likely degradation product from MCPA
• Simultaneous and quantitative extraction and detection of MCP and MCPA from soils needed new methods
O
CH2COOH
CH3
Cl
OH
CH3
Cl
CH2COOH
OH
OH
CH3
Cl
COOHCOOH
CH3Cl
Cl-
COOH
CH3
O
O
COOH
CH3
O
O
COOH
CH3
O
O
TCA-cycle
MCP
tfdA tfdB tfdC tfdD tfdE tfdF
MCPA
tfdAαcadA ?
Extraction and quantification of MCPA and MCP in soil:Extraction with ”Accelerated solvent extraction” (ASE) (MeOH:H2O 50:50, temp. 50 oC, at 1200 psi) quantification using LC-MS/MS (100×2.1 mm RP18)

MCPA and tfdA genes; Warwick, March 2006
Time (days)0 20 40 60 80 100 120
MC
PA (%
) of i
nitia
l con
c.
0
20
40
60
80
100
MC
P (%
) of i
nitia
l M
CPA
con
c.
0
5
10
15
20Top2.3
Top20
Sub2.3
MCP in Top2.3
MCP in Top20
Dissipation of MCPA and formation and dissipation of MPC
- Semi-quantitative- Not corrected for
extraction efficiency- Low extraction efficiency
MCPA d fdA W i k M h 2006
Mineralization of MCPA Mineralization
Time (days)0 20 40 60 80 100 120 140 160
% o
f ini
tial 1
4 C m
iner
aliz
ed
0
20
40
60
80
100
0 20 40 60 80 100 120 140 160
% o
f ini
tial 14
C m
iner
aliz
ed
0
20
40
60
80
100Single plots of 2,3 mg/kg in subsoilfrom panel A
MCPA Mineralisering dag 63, 50 cm dybde
0255075
100125
150175200
0 25 50 75 100 125 150 175 200 225 250meter i østlig retning
met
er i
nord
lig r
etni
ng
2.3 mg/kg MCPA in the topsoil20 mg/kg MCPA in the topsoil200 mg/kg MCPA in the topsoil2.3 mg/kg MCPA in the subsoil200 mg/kg MCPA in the subsoil
x
MCPA and tfdA genes; Warwick, March 2006
Linking microbial degradation activity with analysis of degrader populations
• Microbial degradation activity/kinetics are analyzed using nonlinear regression analysis.
• Brunners & Foghts (1984; Appl. Environ. Microbiol.47:167-172) 3/2 models indicates logarithmic growth of degrader populations as validated by F-test analysis of Chi2 values (Robinson 1985; Adv. Microb. Ecol. 8:61-114).
• The role of different gene families of tfdA and alike genes was investigated.
MCPA d fdA W i k M h 2006
Primer selection and validation
No PCR product58f: AAGCTGCARTTTGARAAY*
r: MGGATTGAAGAAATCCTGRTA*HW13 (cadA-gene)cadA
One band (app. 350 bp)-qPCR maybe possible
65f: ACSGAGTTCKSCGACATGCG*
r: GCGGTTGTCCCACATCACAlignment of HW13, HWK12 and BTH (tfdAα-genes)
tfdAα**
No clear band on the agarose gel-fluffy PCR products.
N.D. ****f: CCGGCGTCGATCTGCGCAAGr: GTTGACGACGCGCGCCGA
Alignment of RD5-C2, HWK12 and HW13 (tfdAα-genes)
tfdAα*
One band on agarose gel (app. 220 bp.) - qPCR possible
64f: GAGCACTACGCRCTGAAYTCCCG*, **
r: GTCGCGTGCTCGAGAAGSequence alignment of 23 known tfdA-genes
tfdA**
Used for probe preperation to southern blot hybridization
65f: GCATACGACGCGCTGCCTCGr: CTTCGGCCACCGGAAGGCCT
R. eutropha JMP134tfdA-intern
Unspecific binding-qPCR not possible 58f: AACGCAGCGRTTRTCCCA*
r: ACGGAGTTCTGYGAYATG*R. eutropha JMP134/ Burkholderia sp.RASC
tfdA*
NoteOptimal annealing temperature Used (°C) ***
Primer (5’-3’) forward (f) / reverse (r) Model genesPrimer set
* R=(G/A), Y=(T/C), S=(G/C), K=(G/T) and M=(A/C).** GC clamp added to the 5’ end of the primer for the PCR/DGGE, 5’-CGCCCGCCGCGCGCGGCGGGCGGGGCG *** The optimal annealing temperature is based on gradient ramping (58-69 °C).**** N.D no optimal annealing temperature could be determined.
MCPA and tfdA genes; Warwick, March 2006
Primer selection and validation
• Soil DNA from days 0, 6, 12, 33, 50, 68 and 115 of topsoil amended with 20 ppm MCPA were used as template (panel A left)
• R. eutropha JMP 134 inoculated into the soil in concentrations of 8×10⁶, 8×10⁵ and 8×10⁴ cells/g soil (panel A right)
• Panel B shows Southern hybridization analysis of the agarose gel shown in panel A) using a tfdA probe. Similarity can be detected for band no. 2 and 3.
• Results from the use of Vallaeys, T. et al. 1996. FEMS Microbiol. Ecol. 20:163-172. primers against tfdA genes
MCPA d fdA W i k M h 2006
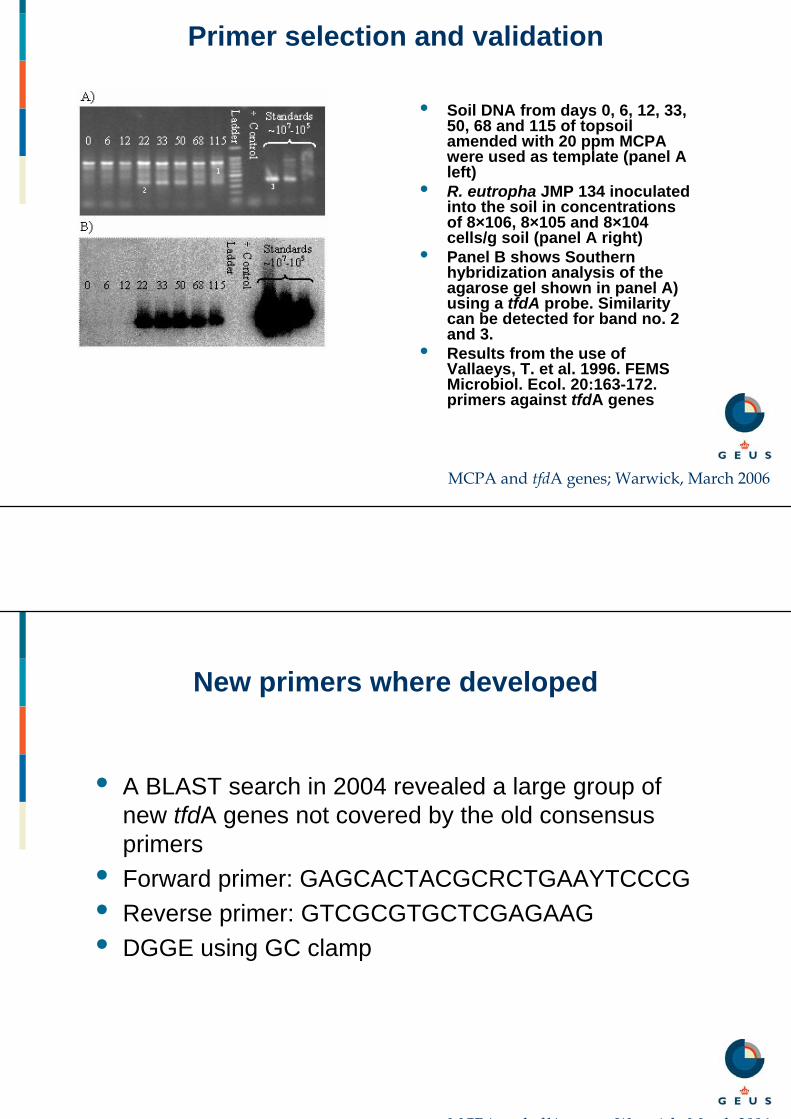
New primers where developed
• A BLAST search in 2004 revealed a large group of new tfdA genes not covered by the old consensus primers
• Forward primer: GAGCACTACGCRCTGAAYTCCCG• Reverse primer: GTCGCGTGCTCGAGAAG• DGGE using GC clamp

MCPA and tfdA genes; Warwick, March 2006
DGGE on tfdA genes
• ”Denaturing gradient gel electrophoresis” (DGGE) on the tfdA gene
• Clear shift in populations in soils with MCPA
• Different populations (if DGGE are trusted) are involved in degradation.
MCPA d fdA W i k M h 2006
• Fylogenetisk træ over tfdA-og tfdA lignende gener
• De fremvoksede gener tilhører klasse III tfdA gener
• Baggrunds indholdet af tfdA,Tilhører klasse I tfdA gener
tfdA containingorganisms
Organisms containingtfdA-like genes

MCPA and tfdA genes; Warwick, March 2006
Melting profiles used in analysis of changes in functional diversity of tfdA genes
• Days 0, 12 and 22 in topsoil amended with 20 ppm MCPA using the tfdA-II primer set.
• Compare to dotted line R. eutrophusJMP 134 (pJP4).
Temperature, oC
65 70 75 80 85 90 95
- d(R
FU)/d
T
0
200
400
600
800
1000
1200R. eutropha JMP134Day 0Day 12Day 22
MCPA d fdA W i k M h 2006
Quantitative PCR on tfdA genes in soil

MCPA and tfdA genes; Warwick, March 2006
Linking function and tfdA gene quantification in top soils
2.3 mg/kg in topsoil
Time (days)0 20 40 60 80 100 120 140
MC
PA re
mai
ning
(%) /
(%
) of i
nitia
l 14 C
min
eral
ized
0
20
40
60
80
100
Log
(tfdA
gen
es/g
soil)
2
3
4
5
6
7
20 mg/kg in topsoil
Time (days)0 20 40 60 80 100 120 140
MC
PA re
mai
ning
(%) /
%
of i
nitia
l 14 C
min
eral
ized
0
20
40
60
80
100
Log
(tfdA
gen
es/g
soil)
2
3
4
5
6
7
Mineralization curveDegradation curveNo. of tfdA genes
MCPA d fdA W i k M h 2006
Linking function and tfdA gene quantification in B horizon soils
2.3 mg/kg in subsoil
Time (days)0 20 40 60 80 100 120 140 160
MC
PA re
mai
ning
(%) /
% in
itial
14C
min
eral
ized
0
20
40
60
80
100
Log
(tfdA
gen
es/g
soil)
1
2
3
4
5
6
7
2.3 mg/kg in subsoil
Time (days)0 20 40 60 80 100 120 140
MC
PA re
mai
ning
(%) /
% in
itial
14C
min
eral
ized
0
20
40
60
80
100
Log
(tfdA
gen
es/g
soil)
1
2
3
4
5
6
7
Mineralization curveDegradation curveNo. of tfdA genes

MCPA and tfdA genes; Warwick, March 2006
tfdA gene analysis of 50 field variation samples plotted against MCPA
mineralisation
• High tfdA gene copy number (low Ct) is coupled to fast onset of MCPAmineralisation.
• But after 2 weeks the picture disappear.
35 40 450
5
10
15
208 days
ct
min
eral
isat
ion
35 40 4530
40
50
60
7015 days
ct
min
eral
isat
ion
35 40 4530
40
50
60
7022 days
ct
Min
eral
isat
ion
35 40 4530
40
50
60
7029 days
ct
min
eral
isat
ion
35 40 4530
40
50
60
7039 days
ct
min
eral
isat
ion
35 40 4530
40
50
60
7067 days
ct
min
eral
isat
ion
Fredslund et al in prep.
MCPA d fdA W i k M h 2006
Bs horizon samples
• Fever soils produced Ct values
• High gene number is associated with faster onset for mineralization.
• But some microbes never wake up ☺
25 30 35 400
0.5
1
1.5
28 days
ct
min
eral
isat
ion
25 30 35 400
0.5
1
1.5
215 days
ct
min
eral
isat
ion
25 30 35 400
2
4
622 days
ct
min
eral
isat
ion
25 30 35 400
10
20
3029 days
ct
min
eral
isat
ion
25 30 35 400
20
40
6039 days
ct
min
eral
isat
ion
25 30 35 400
20
40
60
8067 days
ct
min
eral
isat
ion
MCPA and tfdA genes; Warwick, March 2006
Conclusions
• Fieldvariation of some pesticides can not be explained by soil microbial activity.
• Analysis of MCPA mineralization kinetics revealed growth dependent microbial mineralization in top-soil as well as B-horizon soil.
• New PCR-primers shows sensitive and highly reproducible quantitative results linked to degradation.
• Functional diversity analysis of tfdA genes shows population shifts during degradation. The detected tfdA-I populations present in the top-soil from the beginning of the experiment where not associated with growing microbial populations. The growing populations where associated with tfdA-III class genes.
• LC- MS/MS analysis revealed formation of MCP in top-soil but not in B-horizon soil. MCP formations is likely associated with tfdA-I class genes.
• tfdA gene quantification can predict the speed of degradation but the growth kinetics of MCPA is really fast
MCPA d fdA W i k M h 2006
Acknowledgments
• Mette Andersen for skilled technical support on Real Time PCR.• Line Fredslund Nielsen for work with the tfdA gene in relation to
fieldvalidation.• Finn Vinther, Lars Elsgaard and Ulla Brinch for analysis of soil
microbial activity and pesticide mineralization.• Kaare Johnsen and Mette Nicolaisen for help with phylogeny of
tfdA sequences data. • René Juhler for discussions on MCP and MCPA quantification.• The Danish research Council (STVF) for financial support
through the “SOUND” research center.• The Danish EPA for founding the Danish pesticide zonation
project.
MCPA and tfdA genes; Warwick, March 2006
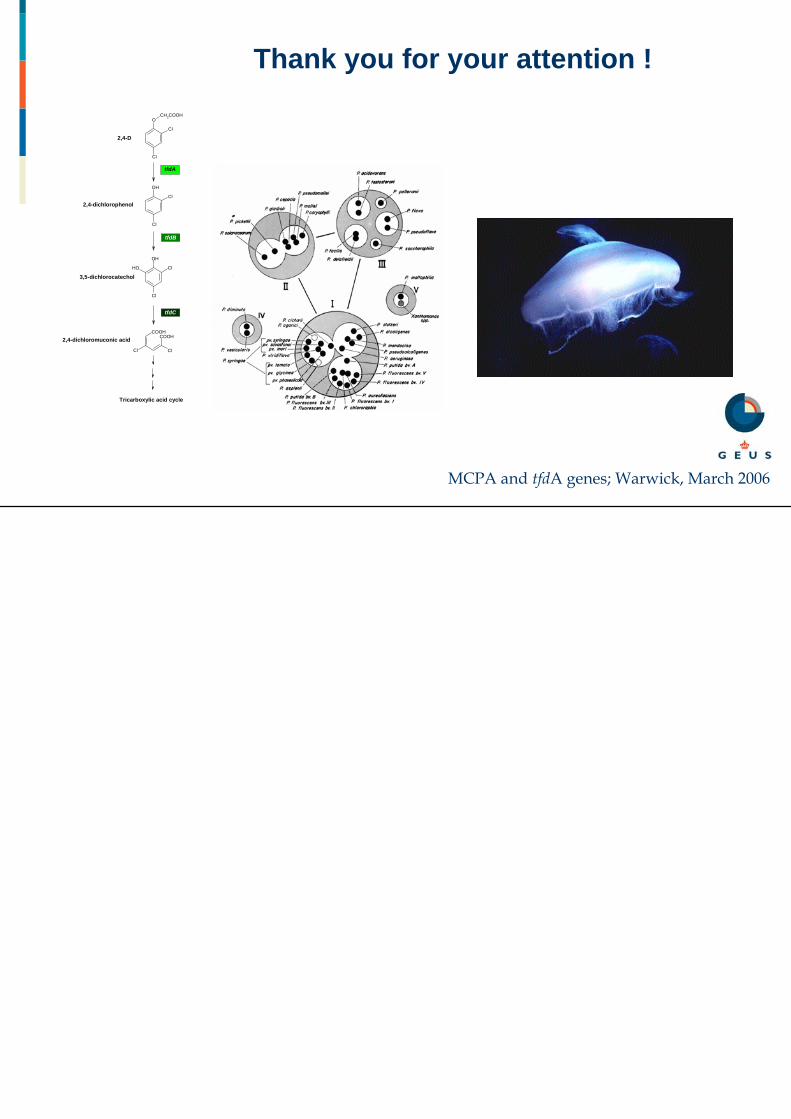
Thank you for your attention !
2,4-D
OCH2COOH
Cl
Cl
Cl
Cl
OH
Cl
Cl
OH
OH
COOHCOOH
ClCl
3,5-dichlorocatechol
2,4-dichloromuconic acid
2,4-dichlorophenol
tfdA
tfdB
tfdC
Tricarboxylic acid cycle